 Jinfeng Zhu
 Hong Teng
 Xiaojian Zhu
 Jingxuan Yuan1,2,3
94% of researchers rate our articles as excellent or good
Learn more about the work of our research integrity team to safeguard the quality of each article we publish.
Find out more
ORIGINAL RESEARCH article
Front. Immunol., 03 August 2023
Sec. Cancer Immunity and Immunotherapy
Volume 14 - 2023 | https://doi.org/10.3389/fimmu.2023.1167018
This article is part of the Research TopicApplication of Advances in Molecular and Genetic Researches to Tackle Pancreatic Cancer: Screening, Diagnosis, Prognostication and Drug Response Prediction.View all 5 articles
Background: Krüppel-like factor 3 (KLF3) is a key transcriptional repressor, which is involved in various biological functions such as lipogenesis, erythropoiesis, and B cell development, and has become one of the current research hotspots. However, the role of KLF3 in the pan-cancer and tumor microenvironment remains unclear.
Methods: TCGA and GTEx databases were used to evaluate the expression difference of KLF3 in pan-cancer and normal tissues. The cBioPortal database and the GSCALite platform analyzed the genetic variation and methylation modification of KLF3. The prognostic role of KLF3 in pan-cancer was identified using Cox regression and Kaplan-Meier analysis. Correlation analysis was used to explore the relationship between KLF3 expression and tumor mutation burden, microsatellite instability, and immune-related genes. The relationship between KLF3 expression and tumor immune microenvironment was calculated by ESTIMATE, EPIC, and MCPCOUNTER algorithms. TISCH and CancerSEA databases analyzed the expression distribution and function of KLF3 in the tumor microenvironment. TIDE, GDSC, and CTRP databases evaluated KLF3-predicted immunotherapy response and sensitivity to small molecule drugs. Finally, we analyzed the role of KLF3 in pancreatic cancer by in vivo and in vitro experiments.
Results: KLF3 was abnormally expressed in a variety of tumors, which could effectively predict the prognosis of patients, and it was most obvious in pancreatic cancer. Further experiments verified that silencing KLF3 expression inhibited pancreatic cancer progression. Functional analysis and gene set enrichment analysis found that KLF3 was involved in various immune-related pathways and tumor progression-related pathways. In addition, based on single-cell sequencing analysis, it was found that KLF3 was mainly expressed in CD4Tconv, CD8T, monocytes/macrophages, endothelial cells, and malignant cells in most of the tumor microenvironment. Finally, we assessed the value of KLF3 in predicting response to immunotherapy and predicted a series of sensitive drugs targeting KLF3.
Conclusion: The role of KLF3 in the tumor microenvironment of various types of tumors cannot be underestimated, and it has significant potential as a biomarker for predicting the response to immunotherapy. In particular, it plays an important role in the progression of pancreatic cancer.
In the world, cancer is the second most common cause of death, accounting for one in six deaths (1). In 2022, there were 1,918,030 new cancer cases, and 609,360 cancer-related deaths in the USA, according to the report on cancer statistics (2). Despite years of sustained effort, the long-term results of treatments using traditional strategies remain dismal. A major obstacle limiting the effectiveness of conventional cancer therapies was their tumor specificity (3). In recent years, tumor immunotherapy has received increasing attention, including immune checkpoint blockade therapy, immune cell therapy, and tumor vaccine therapy (4, 5). The specificity of immunotherapy depends largely on the specific tumor antigen (6). However, immunotherapy-related biomarker matching trials were still limited in most cancers (7). Therefore, further exploration of effective immunotherapy-related tumor prognostic biomarkers is urgently needed.
Krüppel-like factor (KLF) 3 is a member of the KLF transcription factor family, which is involved in various physiological processes such as adipogenesis, erythrocyte maturation, B cell differentiation, and cardiovascular development (8). KLF3 also has a special zinc finger structure, which can bind to related CACCC elements to regulate the expression of target genes, thereby regulating cell proliferation, migration, and apoptosis, and it is also critical to early embryonic development (9). In recent years, studies have found that KLF3, as a transcriptional repressor, is abnormally expressed in a variety of tumors, including colon cancer (10), breast cancer (11), lung cancer (12), pancreatic cancer (13), etc. KLF3 plays an important role in different tumor types. For example, studies have shown that KLF3 becomes a key regulator of metastasis by controlling the expression of STAT3 in lung cancer, and silencing KLF3 promote lung cancer EMT and enhances lung cancer metastasis (14); Another study showed that miR-365a-3p targets KLF3 to inhibit colorectal cancer cell migration, invasion and chemotherapy resistance (15). Tian et al. reported that miR-660-5p-loaded M2 macrophage-derived exosomes promoted the development of hepatocellular carcinoma by regulating KLF3 (16). In addition, Zhang et al. also found that aberrant expression of KLF3 was associated with acquired resistance to fluorouracil in colon cancer cells (17). However, the expression levels and clinical significance of KLF3 in most cancer types remain to be elucidated.
In this study, a comprehensive bioinformatics analysis of KLF3 was conducted through multiple databases to clarify the expression, abnormal variation, and clinical significance of KLF3 in pan-cancer. The role of KLF3 in the tumor immune microenvironment was further analyzed, and the relationship between KLF3 and immunotherapy response and related sensitive drugs was evaluated. We also focused on analyzing the relationship between KLF3 abnormal expression and pancreatic cancer progression using in vitro and in vivo experiments, and identified KLF3 as an independent prognostic risk factor for pancreatic cancer.
We organize the pan-cancer data through the TCGA database and standardize the data to log2 (TPM + 1), which is used for the differential analysis of KLF3 gene expression between paired normal tissues and cancer tissues, draw Kaplan-Meier curves for survival analysis and independent prognostic analysis, etc. In addition, the normalized pan-cancer dataset from TCGA TARGET GTEx (PANCAN, N=19131, G=60499) was downloaded from the UCSC (https://xenabrowser.net/) database. KLF3 gene differential expression analysis of unpaired normal and cancer tissues, clinical feature correlation analysis, Cox prognosis analysis, and immune feature correlation analysis were performed by SangerBox (18), and the parameter selection sequencing data were normalized to log2 (x + 1). In Table 1, we report the abbreviation for each tumor type.
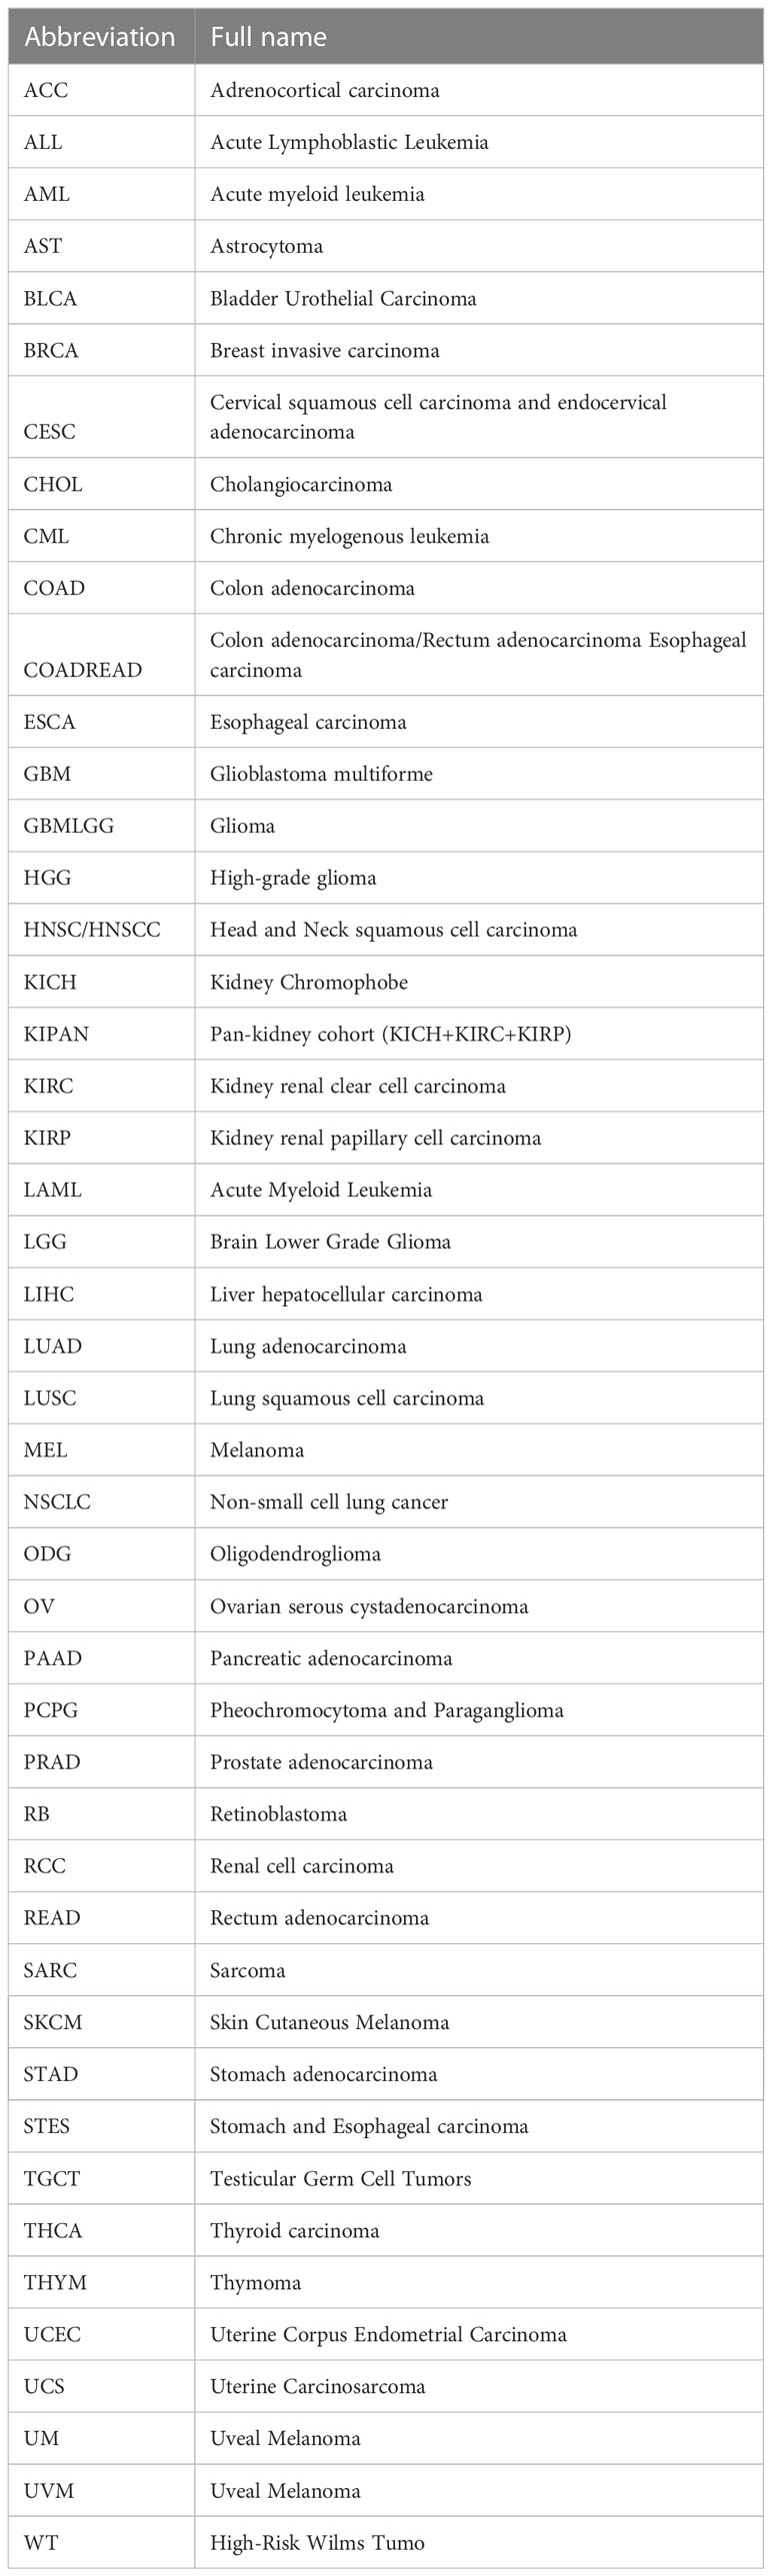
Table 1 Tumor types and abbreviations.
To clarify the effect of KLF3 on the prognosis of tumor patients, Cox proportional hazards regression mode (19) was established to analyze the correlation between KLF3 expression and the overall survival (OS), disease-specific survival (DSS), disease-free interval (DFI) and progression-free interval (PFI) of each cancer type. The “surv_cutpoint” function in the “survminer” package was utilized to perform an optimal cut-off selection for distinguishing between high and low expression groups. Followed by a Log-rank test for analyzing the survival differences, and the results were visualized using both “survminer” and “ggplot2” packages.
We obtained the protein expression difference of the KLF3 between pancreatic cancer and normal pancreatic tissue by querying the UALCAN (20) database. Additionally, the subcellular localization of the KLF3 gene was determined using the human gene database Genecards (https://www.genecards.org/).
Access the cBioPortal database online (http://www.cbioportal.org/), and select the “TCGA PanCancer Atlas Studies”, “KLF3” and “Cancer Types Summary” modules to obtain information on the genomic alteration types and frequencies of KLF3 in pan-cancer. Online access to Gene Set Cancer Analysis (GSCA, http://bioinfo.life.hust.edu.cn/GSCA/#/), based on Spearman correlation analysis KLF3 expression of gene copy number variation (CNV) and methylation. The DNA methylation levels of the KLF3 gene promoter were from the UALCAN database (http://ualcan.path.uab.edu). Finally, the correlation of KLF3 with 3 types of RNA modifications (m1A (10), m5C (13), and m6A (21)) was analyzed using Spearman’s correlation analysis, and the results were visualized using SangerBox tools.
To identify differentially expressed genes between low and high KLF3 subgroups in each cancer type, patients were ranked based on their KLF3 expression levels. The top 30% of patients were classified as the high KLF3 subgroup, while the bottom 30% were classified as the low KLF3 subgroup. The “limma” R package was employed for analyzing KLF3-related differentially expressed genes in each cancer type, considering an adjusted p-value threshold of <0.05. Gene set enrichment analysis was performed using the R packages “clusterProfiler” (21) and “GSVA” (22). The annotated gene set (h.all.v7.2.symbols.gmt) was selected as the reference gene set for enrichment analysis. The pan-cancer Normalized Enrichment Score (NES) and False Discovery Rate (FDR) were calculated for each biological process. The results were visualized using the “ggplot2” R package in the form of a bubble plot.
Moreover, we accessed the Cancer Single-cell State Atlas (CancerSEA, biocc.hrbmu.edu.cn/CancerSEA/home.jsp) database and conducted an analysis of the single-cell RNA sequencing data by specifically examining the gene “KLF3”. This analysis allowed us to uncover the intricate relationship between KLF3 gene expression and the diverse repertoire of 14 distinct states observed within cancer.
To conduct a reliable immune correlation assessment, we used the MCP-counter (23) and EPIC (24) algorithms to calculate the Spearman’s correlation coefficient between the KLF3 gene and immune cell infiltration in each tumor and presented the results in the form of a heat map.
Online access to Tumor Immune Single-cell Hub 2 (TISCH2, http://tisch.comp-genomics.org/home/), select datasets: ALL-GSE132509, BLCA-GSE130001, BRCA-GSE138536, CHOL-GSE125449, CRC-GSE139555, Glioma-GSE103224, HNSC-GSE103322, KIRC-GSE111360, LIHC-GSE140228, NSCLC-EMTAB6149, OV-GSE118828, PAAD-CRA001160, SKCM-GSE123139, STAD-GSE134520, UCEC-GSE139555 and UVM-GSE139829. The gene “KLF3” was further input for single-cell sequence data analysis to clarify the expression level of KLF3 in each cell type.
To evaluate the relationship between KLF3 expression and TME, the stromal, immune, and ESTIMATE scores of each patient in each tumor were calculated according to the KLF3 gene expression using the R package ESTIMATE (25). Further, Spearman’s correlation coefficient of KLF3 expression and immune infiltration score in each tumor was calculated using the corr.test function of the R package psych (version 2.1.6).
Further, extract the expression data of 60 immune checkpoint pathway genes (26) (including Inhibitory (24) and Stimulatory (36)) in each sample, analyze the expression relationship between KLF3 and immune checkpoint genes based on Spearman correlation, and use Heatmap for visualization. The TIMER2.0 database (http://timer.comp-genomics.org/) was used to analyze the correlation of target genes with marker genes related to T-cell exhaustion (27–29), M2 macrophages (30) and cancer-associated fibroblasts (CAFs) (31).
As in previous studies (32), we calculated the Tumor mutation burden(TMB) of each tumor using the TMB function of the R package maftools (version 2.8.05) and obtained pan-cancer Microsatellite instability(MSI)data (33). The correlation between KLF3 expression and TMB/MSI of each cancer type was calculated by the Spearman method, and visualized by radar map. Immunotherapy response prediction and biomarker assessment of KLF3 were predicted from the TIDE website (http://tide.dfci.harvard.edu). Based on the GDSC and CTRP databases, the GSCA online website (http://bioinfo.life.hust.edu.cn/GSCA/#/drug) was used to predict the KLF3 targeted sensitive drugs, and the bubble chart displays the relationship between the drug’s half-inhibitory concentration (IC50) and KLF3 expression.
Cell culture, plasmid transfection, RNA extraction, quantitative real-time PCR, and immunoblotting were in agreement with previous studies (34). PANC-1 and SW1990 were purchased from the National Cell Identification and Collection Center of the Chinese Academy of Sciences. BxPC-3 (CL-0042) was purchased from Procell (Wuhan, China). The HPDE6-C7 cell line has been preserved by our laboratory. All cell lines in this experiment were identified and verified by short tandem repeat sequences. Cell culture dishes and 6-well plates were obtained from NEST Biotechnology (Wuxi, China). RNA duplexes were designed and synthesized by the Genepharma Company (Shanghai, China). Table S1 lists the sequences of the shRNA and PCR primers used in this study. Primary antibodies were as follows: KLF3 (Abcam, 1:500) and β-Tubulin (proteintech, 1:1000). Cell counting kit-8 (CCK-8), 5-Ethynyl-2’-Deoxyuridine (EdU), wound healing assay and transwell assay experimental details were consistent with previous studies (35). Immunocytochemistry and immunofluorescence (ICC/IF) were conducted as previously described (34). The corresponding antibodies are: KLF3 Rabbit pAb(1:100, A7195, ABclonal) and Goat anti-Rabbit IgG (H+L) Cross-Adsorbed Secondary Antibody, Alexa Fluor™ 546 (1:1000, A-11080, Thermo Fisher).
Female nude (BALB/c) mice (4 weeks old) were obtained from Hangzhou Ziyuan Experimental Animal Science and Technology Co., Ltd. After acclimatizing the BALB/c nude mice to the housing conditions for one week, they were randomly allocated into two groups: sh-NC and sh-KLF3#1. PANC-1 cells in the logarithmic growth phase, stably transfected with sh-NC and sh-KLF3#1, were harvested and suspended in PBS to achieve a cell density of 2×10⁷ cells/mL. The lower dorsal region of each nude mouse was disinfected, followed by the subcutaneous injection of 100 μL of cell suspension. Tumor volume was assessed every 5 days by the following formula: volume = length × width2 × 0.5. Mice were euthanized on day 35 after inoculation, and the tumors were removed and weighed. Animal experiments were approved by the Animal Experimental Ethical Inspection of Nanchang Royo Biotech Co. Ltd. (RYE2022092401).
All data were analyzed using GraphPad Prism 8.0 (GraphPad, San Diego, USA). The bioinformatics analysis in this study was partially supported by Sangerbox (http://vip.sangerbox.com/). To assess the significance of differences between the two groups, a Student’s t-test was conducted. Furthermore, paired t-tests were performed to compare the expression levels of KLF3 in tumor tissues with those in their paired normal tissues. The Spearman correlation coefficient was used to evaluate associations between variables. The Log-rank test was used in survival analysis. For all statistical comparisons, significance levels were set at p < 0.05.
In order to investigate the expression differences of KLF3 in tumor and normal tissues in pan-cancer, we conducted the following analysis. By integrating the TGCA and GTEx databases, we found that KLF3 mRNA was significantly upregulated in 14 types of tumors (ALL, CHOL, COAD, COADREAD, ESCA, GBM, GBMLGG, LAML, LGG, LIHC, PAAD, STAD, STES, and WT; all p<0.01), while it was significantly downregulated in 13 types of tumors (BLCA, BRCA, KICH, KIPAN, KIRC, KIRP, LUAD, OV, READ, SKCM, THCA, UCEC, and UCS; all p < 0.01), compared with normal tissues (Figure 1A). Furthermore, through analysis of paired cancer and normal tissues in the TCGA database, we found that KLF3 mRNA was upregulated in CHOL (p < 0.01) and PAAD (p < 0.001), but significantly downregulated in BRCA (p < 0.001), COAD (p < 0.001), KICH (p < 0.001), THCA (p < 0.001), and UCEC (p < 0.001) compared with paired normal tissues (Figure 1B). These results demonstrate a consistent trend between paired and unpaired sample analyses, except for COAD. Further analysis through the Human Protein Atlas (HPA) database revealed that the expression frequency of KLF3 protein was 100% in tumor types such as glioma (11/11), thyroid cancer (3/3), lung cancer (10/10), colorectal cancer (10/10), head and neck cancer (4/4), stomach cancer (12/12), urothelial cancer (12/12), cervical cancer (11/11), and pancreatic cancer (11/11), while the lowest expression frequency was observed in tumor types such as carcinoid (2/4), melanoma (6/11), and renal cancer (7/12) (Figure 1C). Moreover, utilizing the Genecards database, we observed that KLF3 was mainly localized in the nucleus (Figure 1D).
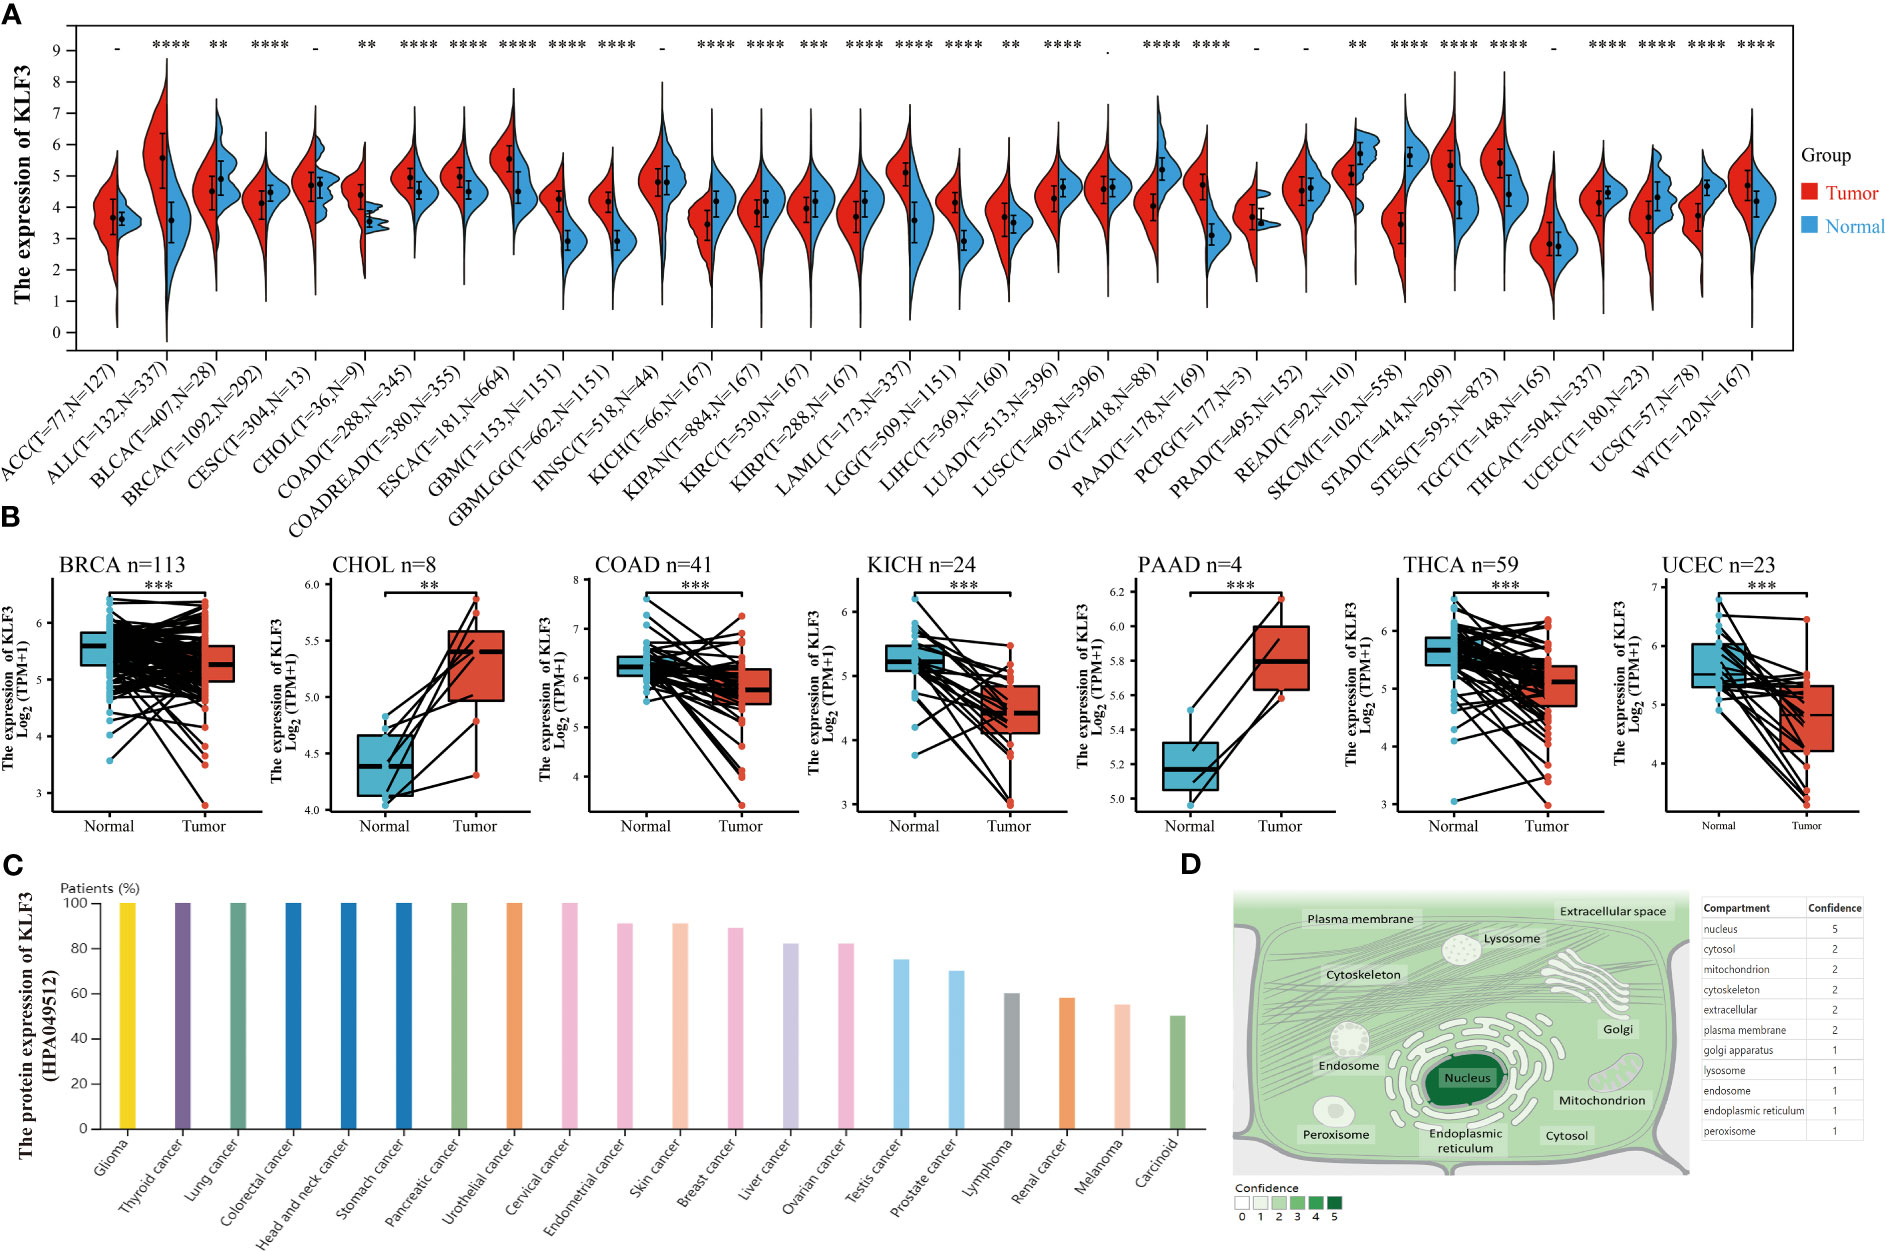
Figure 1 Differences in expression and localization of KLF3 in pan-cancer. (A) KLF3 mRNA expression levels in pan-cancer and normal tissues based on TCGA and GTEx databases. (B) Differential expression of KLF3 in cancers and paired normal tissues were obtained through the TCGA database. (C) KLF3 protein expression levels were obtained from the HPA database. (D) KLF3 expression mapping was obtained from the Genecards database. **p < 0.01, ***p < 0.001, ****p < 0.0001.
Since differential expression of KLF3 was observed in tumors, we analyzed its genetic alterations and epigenetic regulatory modifications using the online resources cBioPortal and GSCALite. As shown in Figure 2A, the main genetic alterations type of KLF3 was “mutation”, among which STAD (5.68%), UCEC (5.29%), SKCM (2.25%), COAD (1.85%) and ESCA (1.1%) were the most typical. “Amplification” was mainly seen in ACC (2.2%), LUAD (0.88%), SARC (0.78%), BLAC (0.73%), and PAAD (0.54%). In pan-cancer, the frequency of KLF3 gene mutations in “deep deletion”, “structural variation” and “multiple Alterations” was generally less than 0.5%. CNVs are important aberrations that result in alterations in gene expression in tumorigenesis and tumor growth (36). Spearman correlation analysis showed that the mRNA expression of KLF3 was significantly positively correlated with the CNV of the KLF3 gene in SKCM, ESCA, READ, LGG, LUSC, UCS, HNSC, STAD, COAD, KIRC, LUAD, CESC, BLCA, UCEC, LIHC, SARC, BRCA, and OV (Figure 2B and Table 2). Dysregulation of DNA methylation is strongly associated with the onset of various diseases including cancer (37). The GSCA database provided the methylation sites most negatively correlated with KLF3 gene expression in each tumor type (Figure 2C and Table 3). Further through the UALCAN database, we found that the methylation level of the KLF3 gene promoter in BLCA, BRCA, CESC, ESCA, HNSC, KIRC, LUAD, LUSC, PRAD, TGCT, and UCEC was significantly higher than that in corresponding normal tissues; The opposite phenomenon occurs in STAD and THCA (Figures S2A–W). Accumulating evidence suggests that RNA modification pathways were misregulated in human cancers and may be ideal targets for cancer therapy (38). The association between KLF3 expression and RNA modification-related genes was shown in Figure 2D. We found that KLF3 expression was generally positively correlated with m1A, m5C, and m6A-related gene expression in pan-cancer, especially in YTHDF1, NSUN3, TET2, METTL14, YTHDC2, and FMR1. The above results indicate that the abnormal expression of KLF3 in different tumors may be closely related to its gene variation and participation in epigenetic modification.
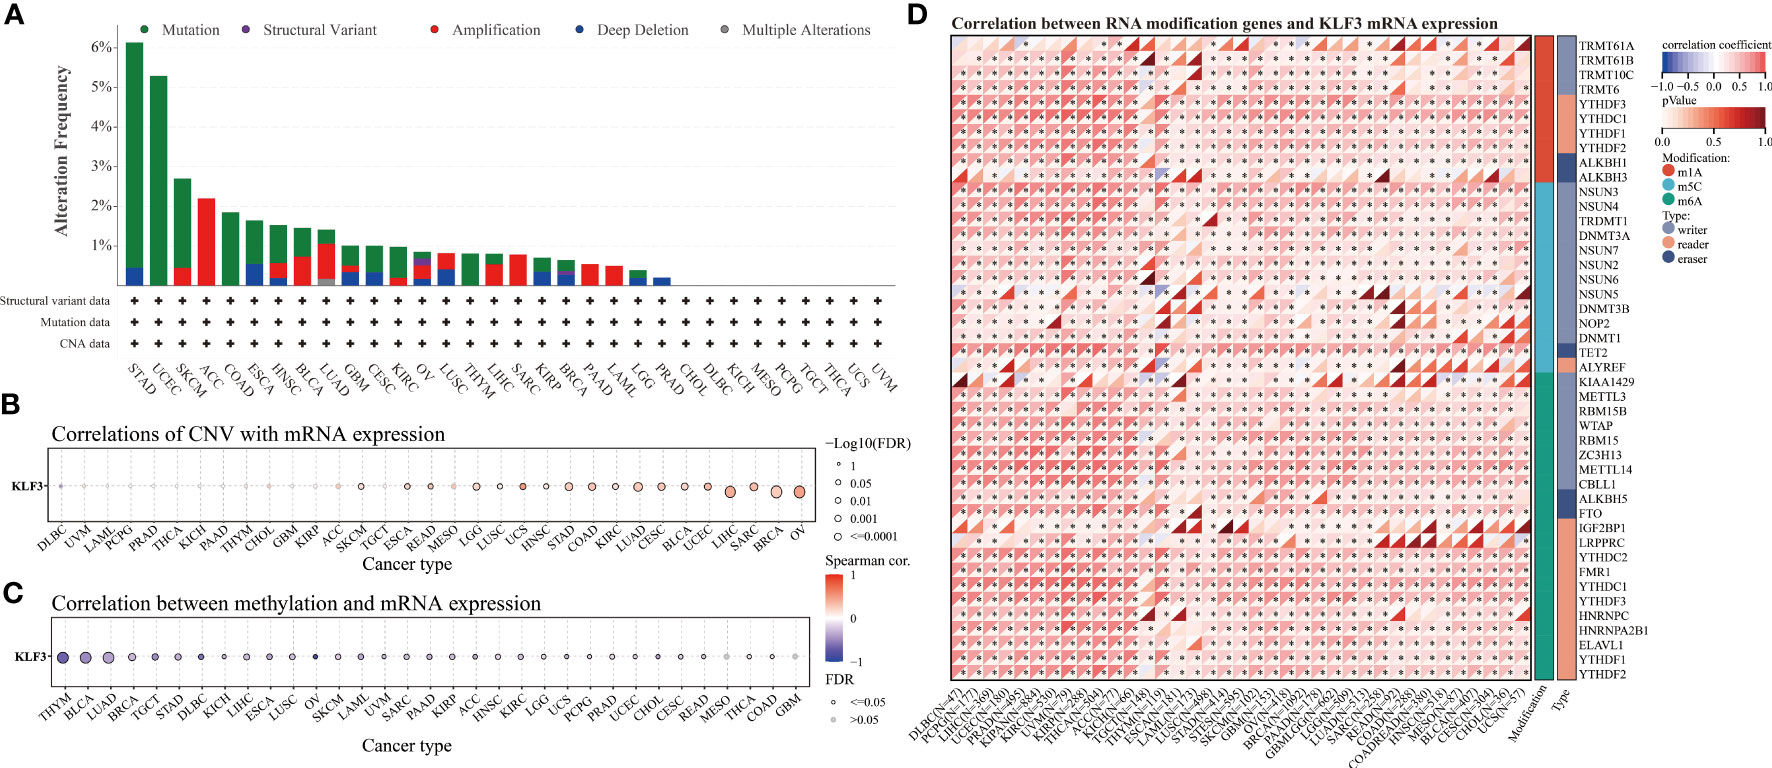
Figure 2 Genetic alteration and epigenetic modification of KLF3. (A) From the cBioPortal website, Mutation types and frequencies of KLF3 in pan-cancer were identified. (B, C) In pan-cancer, the relationship between KLF3 expression and gene copy number variation(CNV) and methylation. (D) Spearman correlation of KLF3 expression with RNA-associated modification (m1A, m5C, m6A) gene expression. Blue to red within the triangle on the left side of the heatmap indicates a low to high correlation. In the bar graph on the right, red represents m1A-related genes, blue represents m5C-related genes, and green represents m6A-related genes. *p < 0.05.
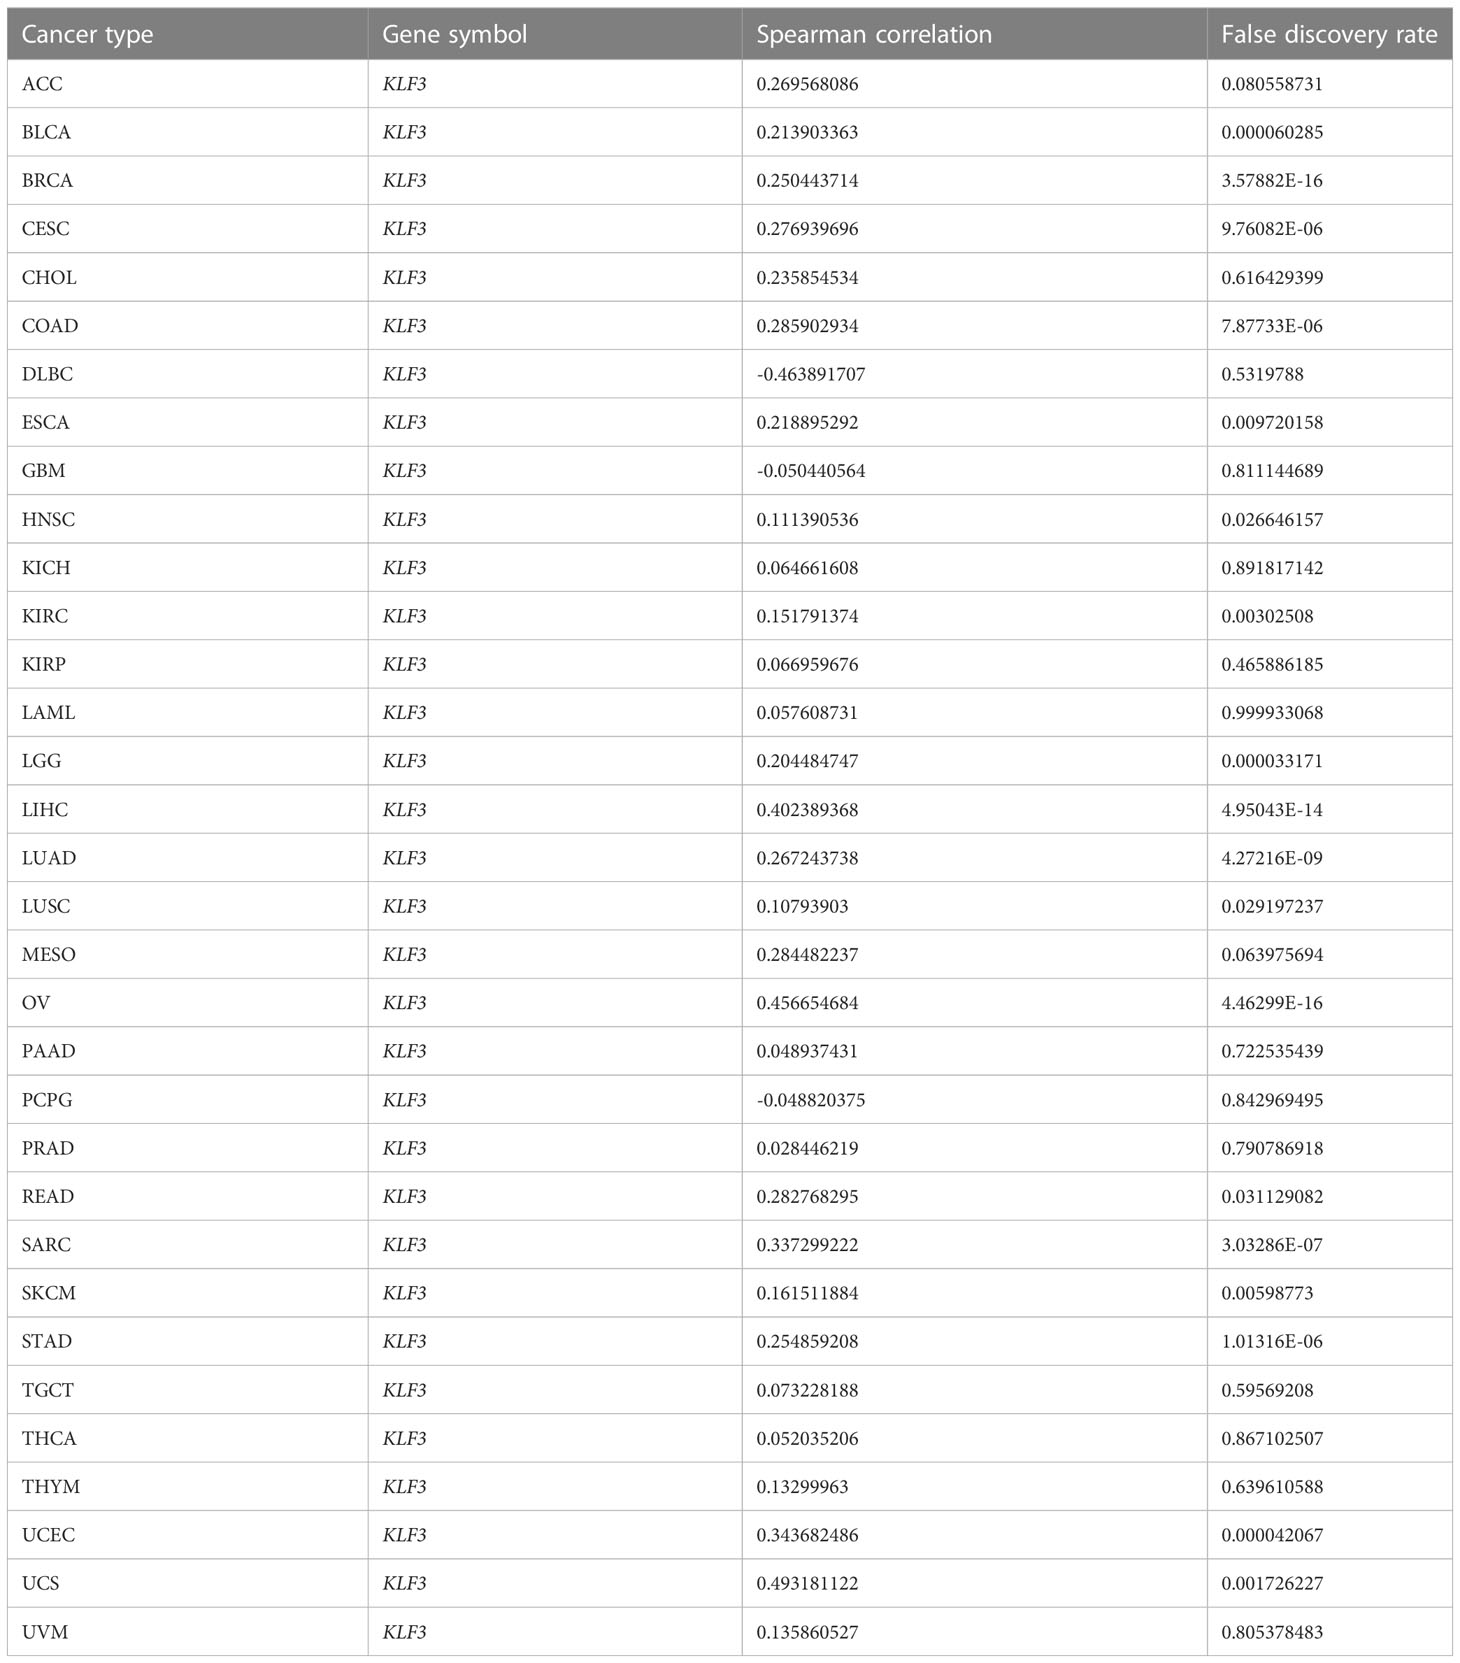
Table 2 Summary of correlations between KLF3 mRNA expression and gene copy number variation (CNV) across tumor types.
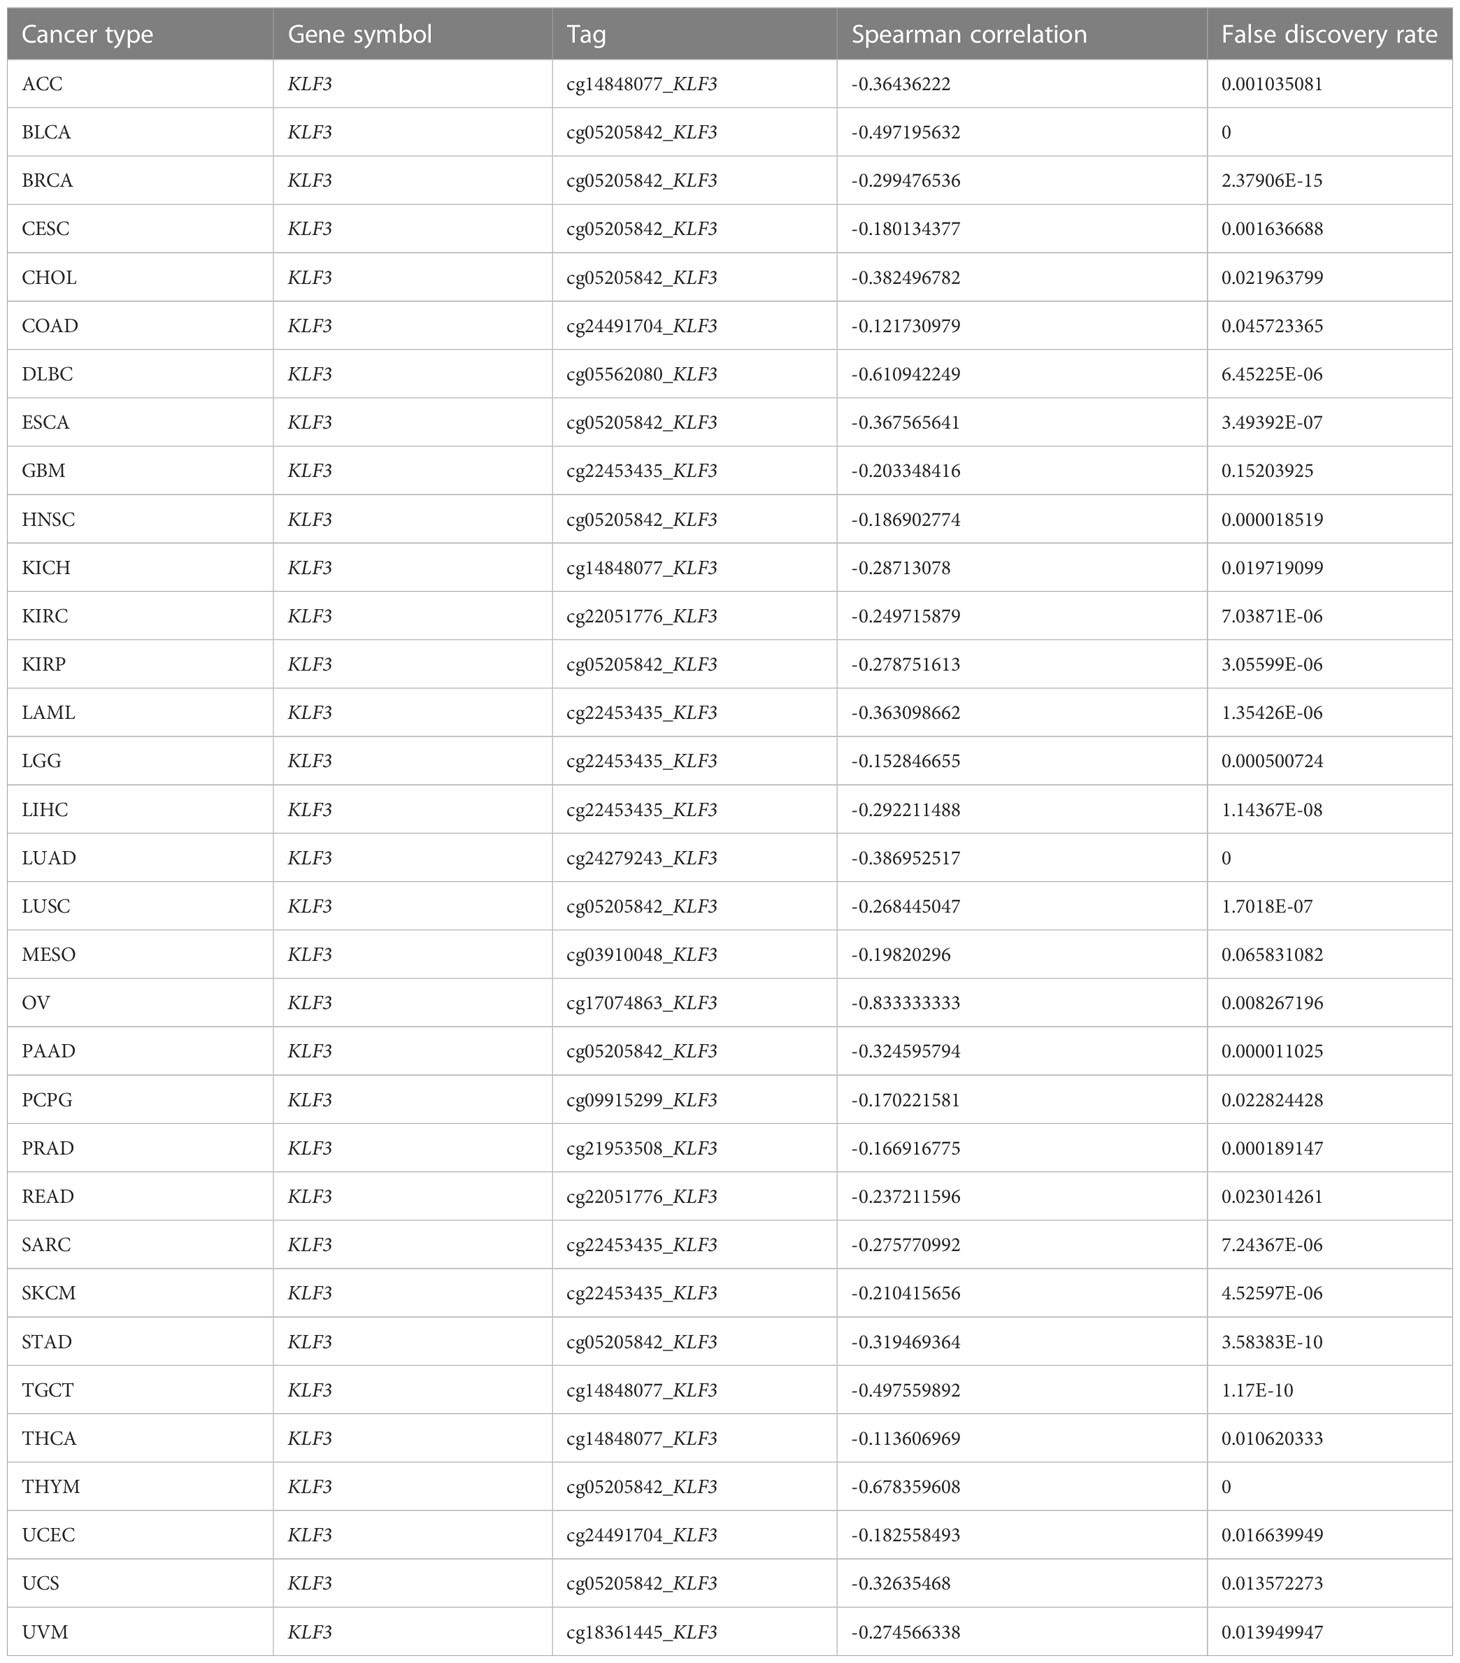
Table 3 Summary of methylation sites most negatively associated with KLF3 gene expression by tumor type.
The above results indicate that KLF3 was abnormally expressed in a variety of tumors, but whether its expression is related to tumor progression needs further exploration. According to the results shown in Figure 3A, it was observed that as the histological grades increased in patients with CESC, ESCA, KIPAN, KIRC, and STES, there was a decreasing trend in KLF3 expression. Conversely, the opposite trend was observed in patients with PAAD, HNSC, GBMLGG, and LGG (all p<0.05). Furthermore, it was also observed that as the clinical stages progressed in patients with COAD, COADREAD, ESCA, KIPAN, KIRC, THCA, and OV, there was a decreasing trend in KLF3 expression, except for PAAD patients where the opposite trend was observed (Figure 3B, all p<0.05). Next, by drawing the Kaplan-Meier survival curve, we found that compared with patients in the KLF3 low expression group, high KLF3 expression was closely related to shorter overall survival in patients with ACC, GBMLGG, LGG, PAAD, and SARC (all p<0.05, Figure 3C). In contrast, high expression of KLF3 was closely associated with good prognosis in patients with BLCA, COADREAD, COAD, and KIRC (all p<0.05, Figure 3D). Further, we established a COX proportional regression model on the pan-cancer patient survival data and KLF3 expression to analyze the relationship between KLF3 gene expression and prognosis in each tumor. The results showed that higher KLF3 expression was associated with poorer OS in LGG, GBMLGG, ACC, and PAAD, whereas the opposite results were observed in patients with KIRC, COADREAD, COAD, and KIPAN (Figure S2A). DSS results showed that higher KLF3 expression was associated with poorer DSS in LGG, GBMLGG, PAAD, and ACC, whereas the opposite results were observed in patients with KIRC and KIPAN (Figure S2B). Figure S2C shows that high KLF3 expression was associated with poorer PFI in ACC, LGG, GBMLGG, UVM, and PAAD, whereas better in KIRC, KIPAN, and HNSC. Furthermore, the expression level of KLF3 was positively correlated with poorer DFI in PAAD and ACC (Figure S2D). Taken together, the results suggest that KLF3 can effectively predict the prognosis of multiple cancers, most notably in PAAD.
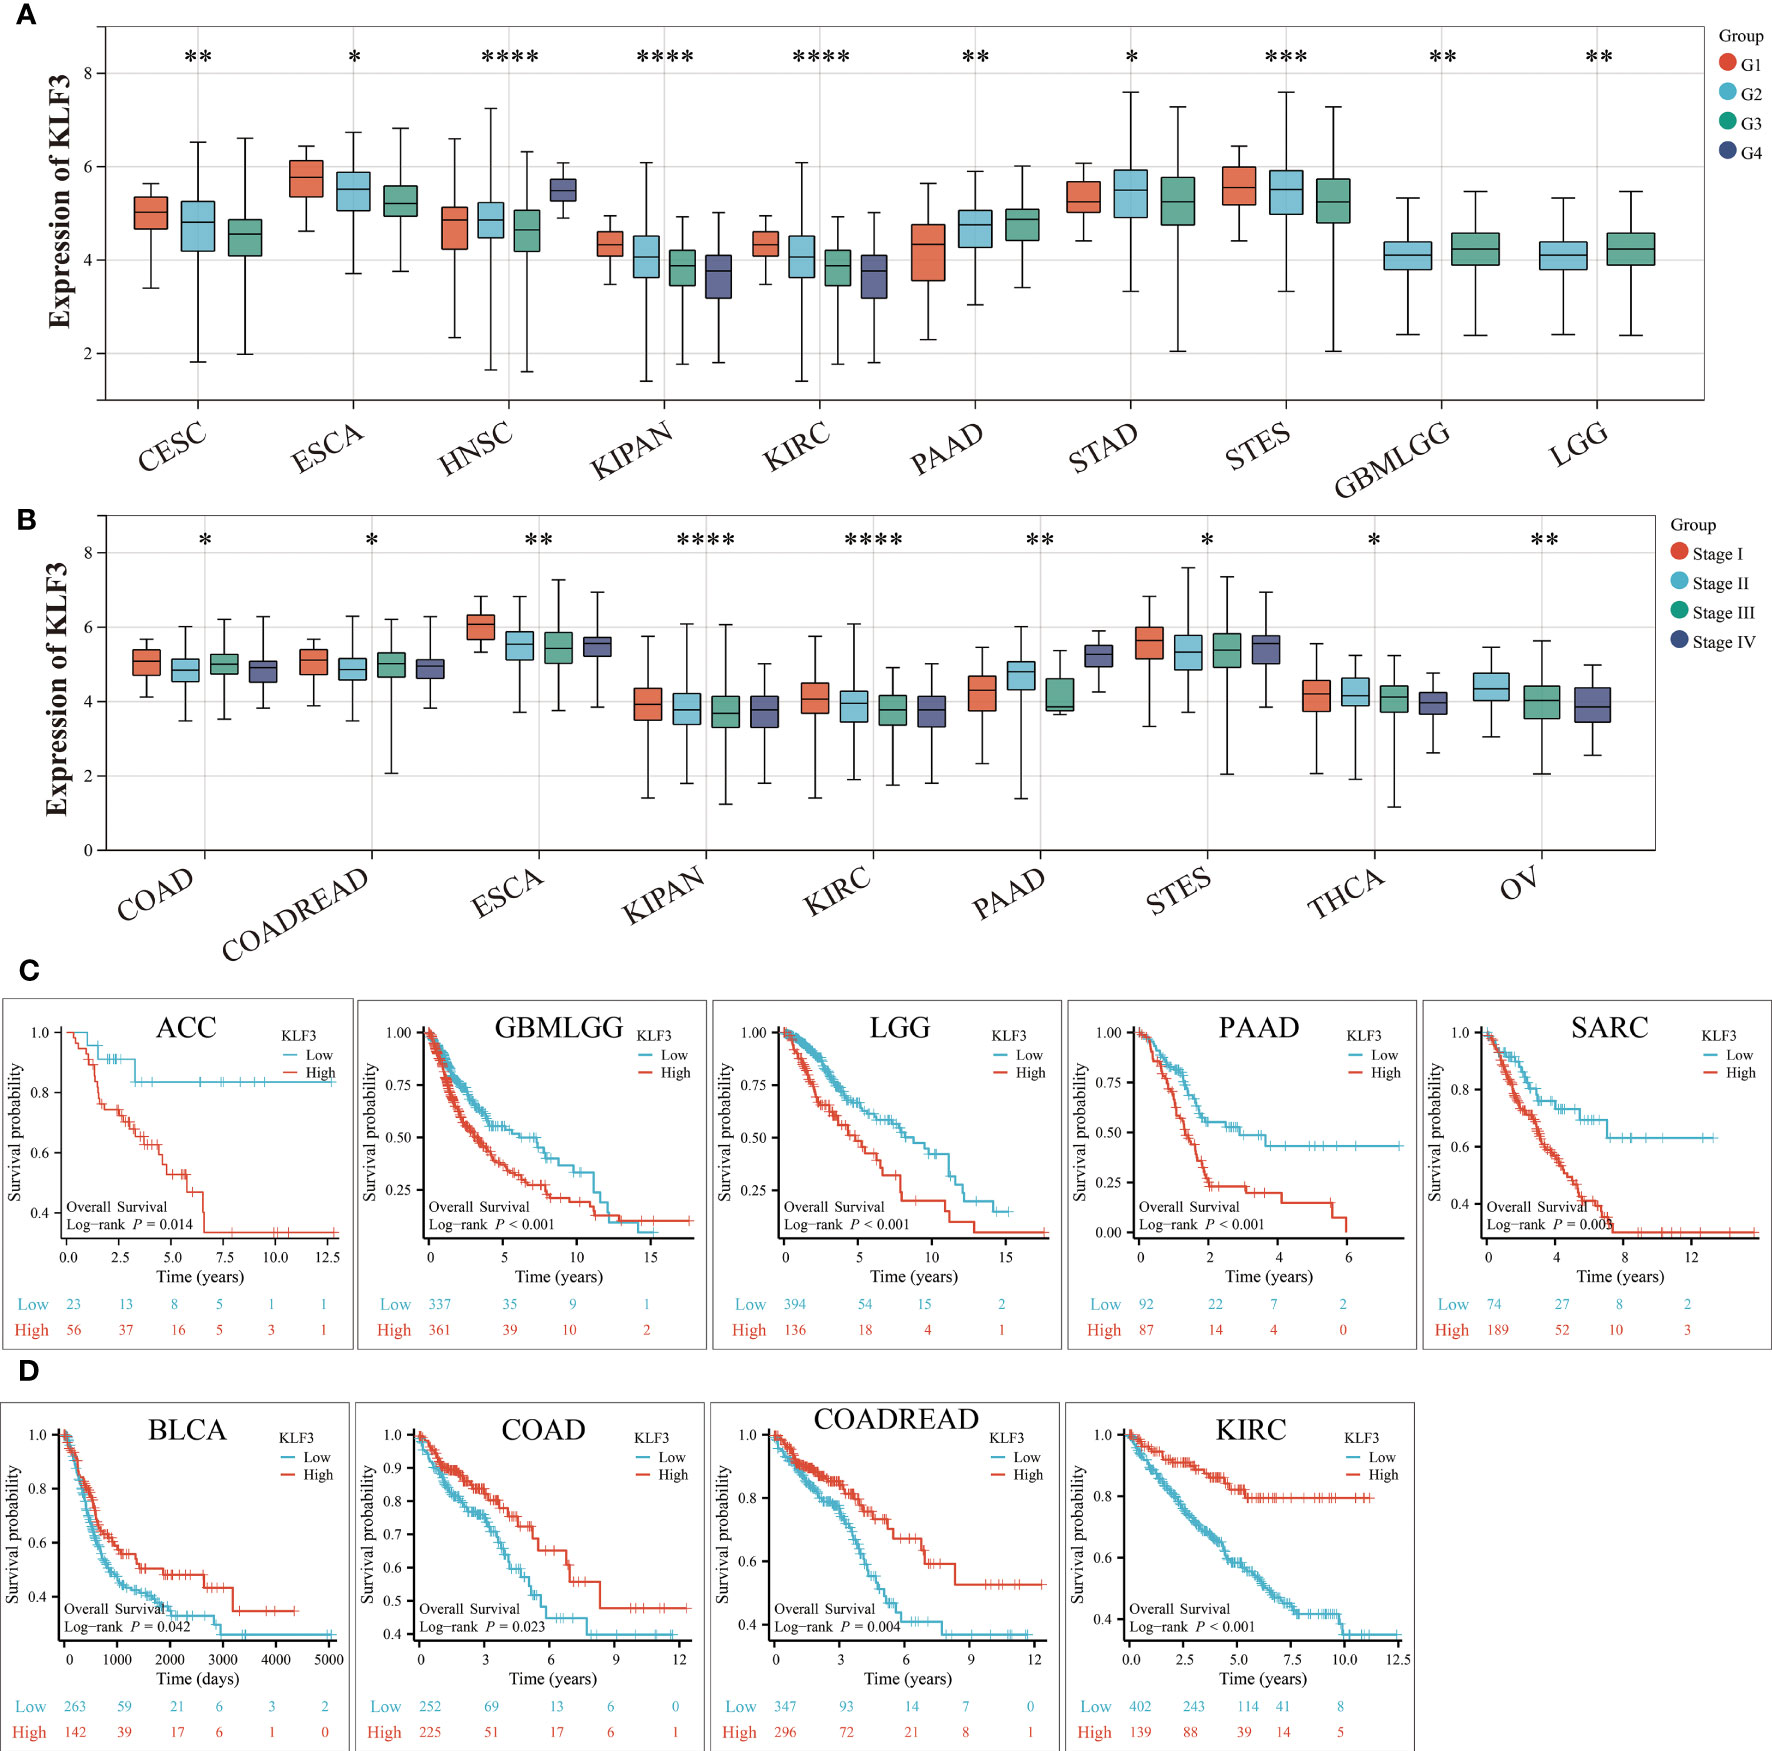
Figure 3 Relationship between KLF3 expression and clinical characteristics and prognosis. (A) Relationship of KLF3 expression to tumor histological grading. (B) Relationship between KLF3 expression and tumor clinical staging. (C) Survival differences of KLF3 high and low expression groups in ACC, GBMLGG, LGG, PAAD, and SARC. (D) Survival differences of KLF3 high and low expression groups in BLCA, COAD, COADREAD, and KIRC. The Log-rank method was used to compare the difference in survival between the high-expression group and the low-expression group. Only cancer species with statistically significant differences were shown. *p < 0.05, **p < 0.01, ***p < 0.001, ****p < 0.0001.
To clarify how KLF3 affects prognosis, we analyzed the correlation between KLF3 and 14 functional states using single-cell sequence data from CancerSEA. As shown in Figure S3, KLF3 expression was negatively correlated with the cell cycle, DNA damage cancer injury, DNA repair, and invasive ability of most tumors, while positively correlated with tumor differentiation, EMT, hypoxia, inflammation, metastasis, proliferation, quiescence, and stemness. In addition, through GSEA, we explored the possible signaling pathways through which the abnormal expression of KLF3 affects the above functions (Figure 4). We found significant enrichment of immune-related signaling pathways in most tumor types, including TNFA-signaling-via-NFκB, IFN- γ response, IFN- α response, inflammatory response, IL6-JAK-STAT3, IL2-STAT5, and allograft-rejection. The results also showed that various tumor types were enriched in TGF-β, protein slicing, oxidative phosphorylation, mTORC1, KRAS, epithelial-mesenchymal transition, and DNA repair signals. The above results indicate that KLF3 is closely related to tumor progression and immune response.
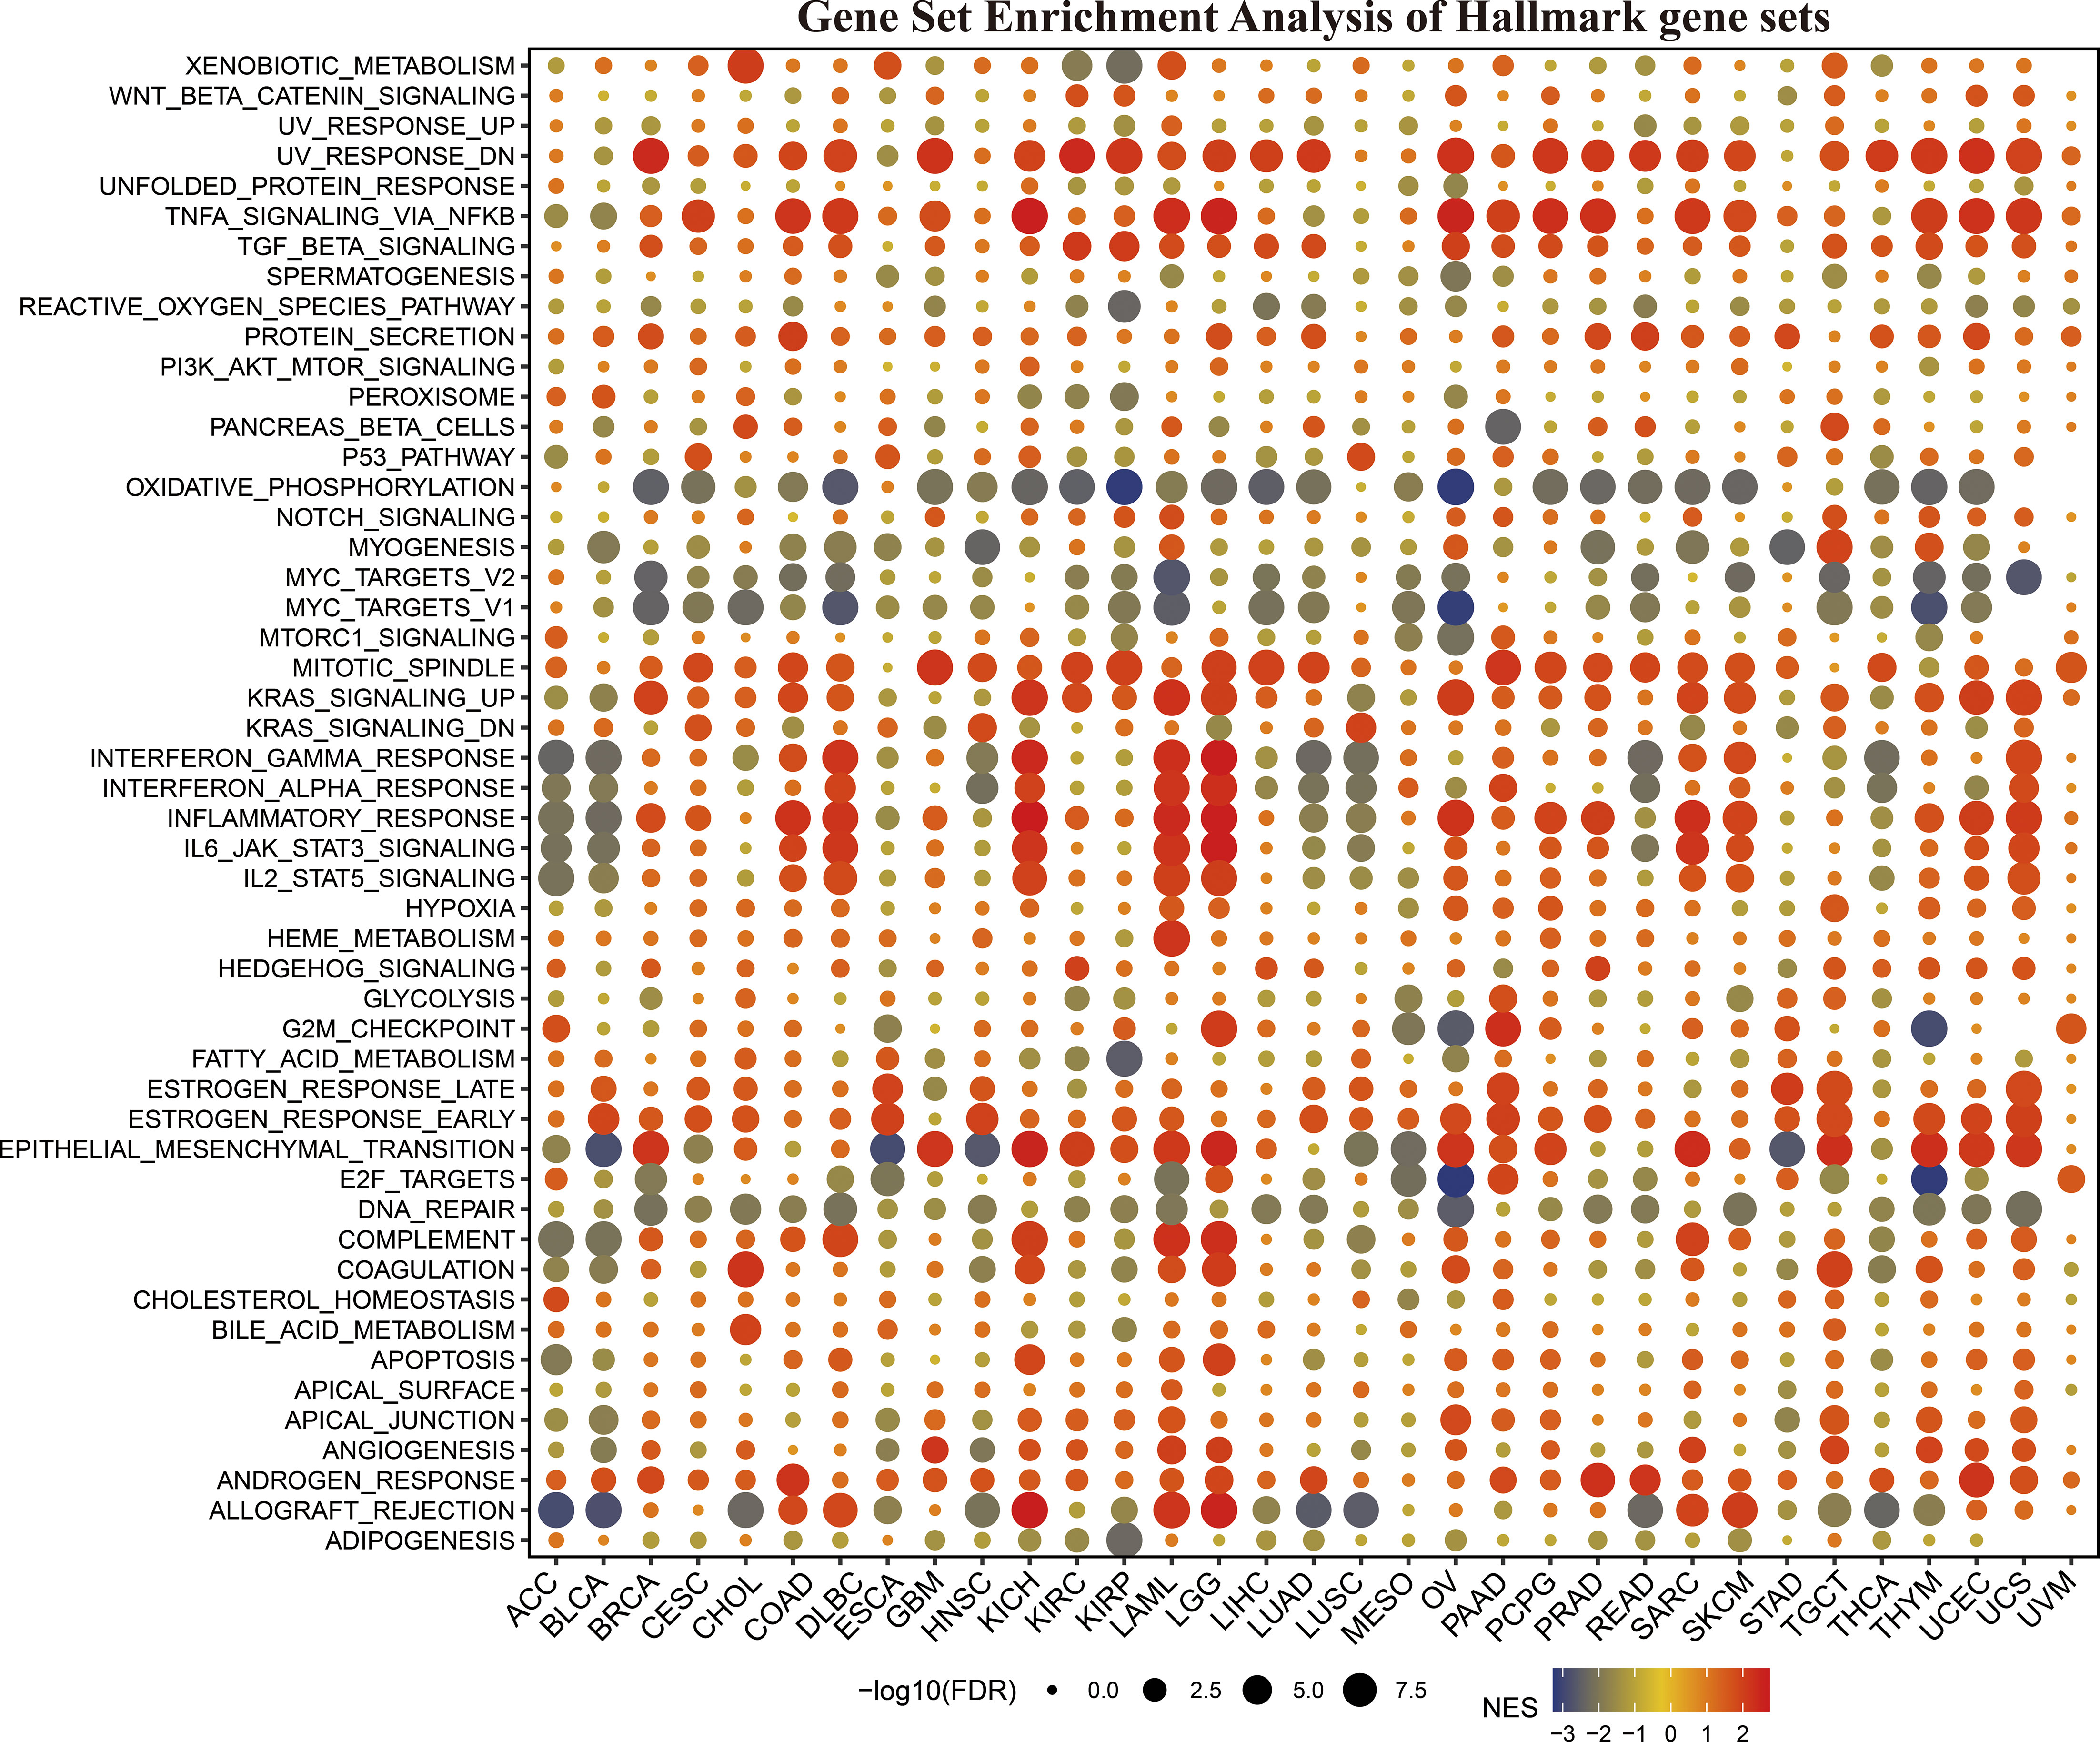
Figure 4 The hallmarks gene set enrichment analysis (GSEA) of KLF3 in various types of cancer. FDR, Error discovery rate. NES, Standardized enrichment fraction.
To clarify the relationship between KLF3 and immune cell infiltration, we analyzed it by EPIC and MCPCOUNTER algorithms. The results showed that the expression of KLF3 was closely related to the infiltration of CD4+ T cells, CD8+ T cells, neutrophils, myeloid dendritic cells, monocytes/macrophages, and endothelial cells in most of the TME (Figures 5A, B). We further verified the above findings by analyzing single-cell sequencing data. As shown in Figure 5C, KLF3 was expressed in higher proportions in CD4Tconv, CD8T, monocytes/macrophages, endothelial cells, and malignant cells of the TME. Then we analyzed the relationship between KLF3 expression and TME in pan-cancer. KLF3 expression was negatively correlated with the immune scores of ACC, THYM, TGCT, LUSC, THCA, UCEC, BLCA, LUAD, ESCA, STES, KIRP, CESC, CHOL, HNSC, GBM, STAD, LIHC, and PAAD; and positively correlated with the immune scores of COAD, LGG, LAML, and DLBC (Figure 6A). KLF3 expression was negatively correlated with stromal scores for ACC, ESCA, BLCA, LUSC, STES, STAD, HNSC, CESC, THCA, GBM, UCEC, and LUAD, and positively correlated with LGG, KICH, BRCA, SARC, THYM, UCS, KIRC, TGCT, LAML and DLBC (Figure 6B). KLF3 expression was negatively correlated with estimated scores for ACC, LUSC, BLCA, ESCA, STES, THCA, HNSC, STAD, UCEC, CESC, LUAD, THYM, GBM, CHOL, KIRP, TGCT, LIHC, and PAAD, and positively correlated with the estimated scores of KIRC, COAD, READ, LGG, KICH, USC, LAML, DLBC, OV, and BRCA (Figure 6C). Spearman’s correlation analysis also showed that KLF3 expression was significantly correlated with immune-related genes (Figure 6D). From a pan-cancer perspective, it was found that: immune-related genes VEGFA, C10orf54, CD276, EDNRB, ARG1, HMGB1, ENTPD1, BTN3A1, TLR4, BTN3A2 were significantly positively correlated with KLF3 expression, whereas VEGFB expression was negatively correlated with KLF3 expression. Furthermore, we found that KLF3 expression in BLCA was inversely correlated with the expression of related markers of T-cell exhaustion, M2 macrophages, and CAFs (Figure S4). Interestingly, we observed the opposite result in DLBC. From a pan-cancer perspective, KLF3 was generally positively correlated with the expression of markers associated with M2 macrophages and CAFs. In addition, KLF3 was mostly positively correlated with the expression levels of TIGIT among T-cell exhaustion genes(Figure S4). In short, the contribution of abnormal KLF3 expression to TME is not negligible.
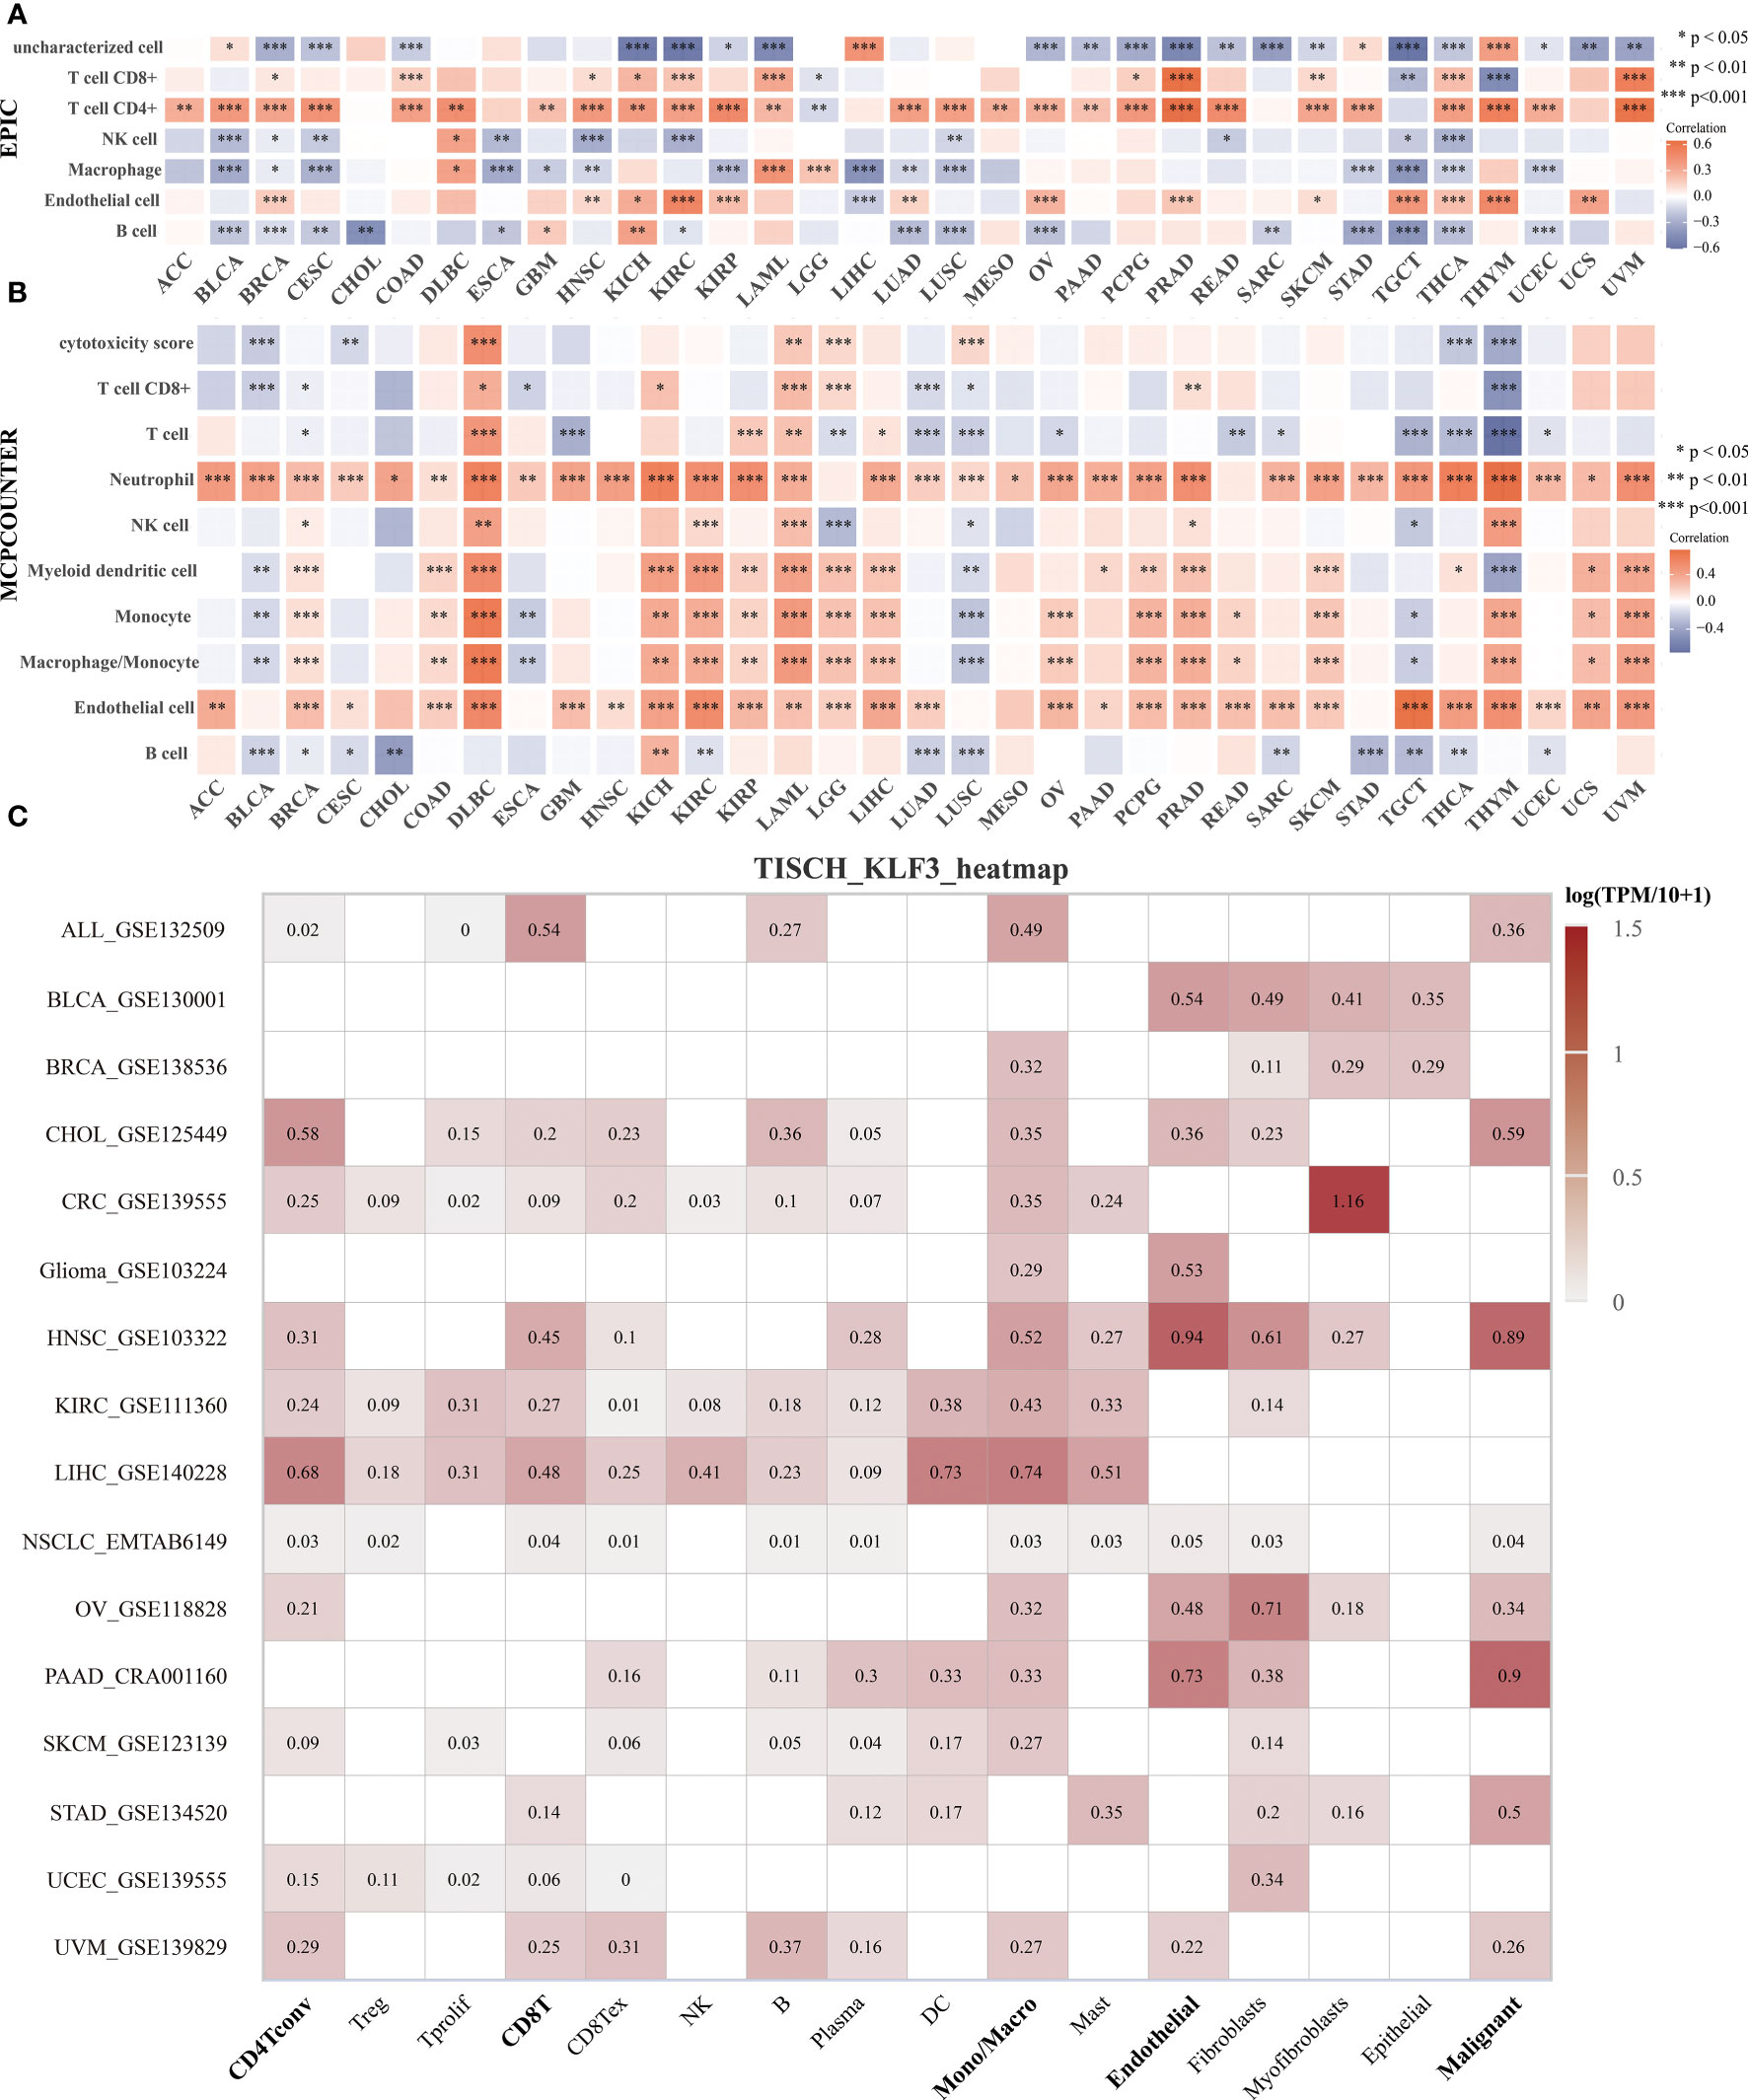
Figure 5 Expression and distribution of KLF3 in the TME. (A, B) Analysis of immune cell infiltration status by EPIC (A) and MCP-counter (B) algorithm. (C) The expression of KLF3 in different cell types was analyzed by the TISCH2 website. *p < 0.05, **p < 0.01, ***p < 0.001.
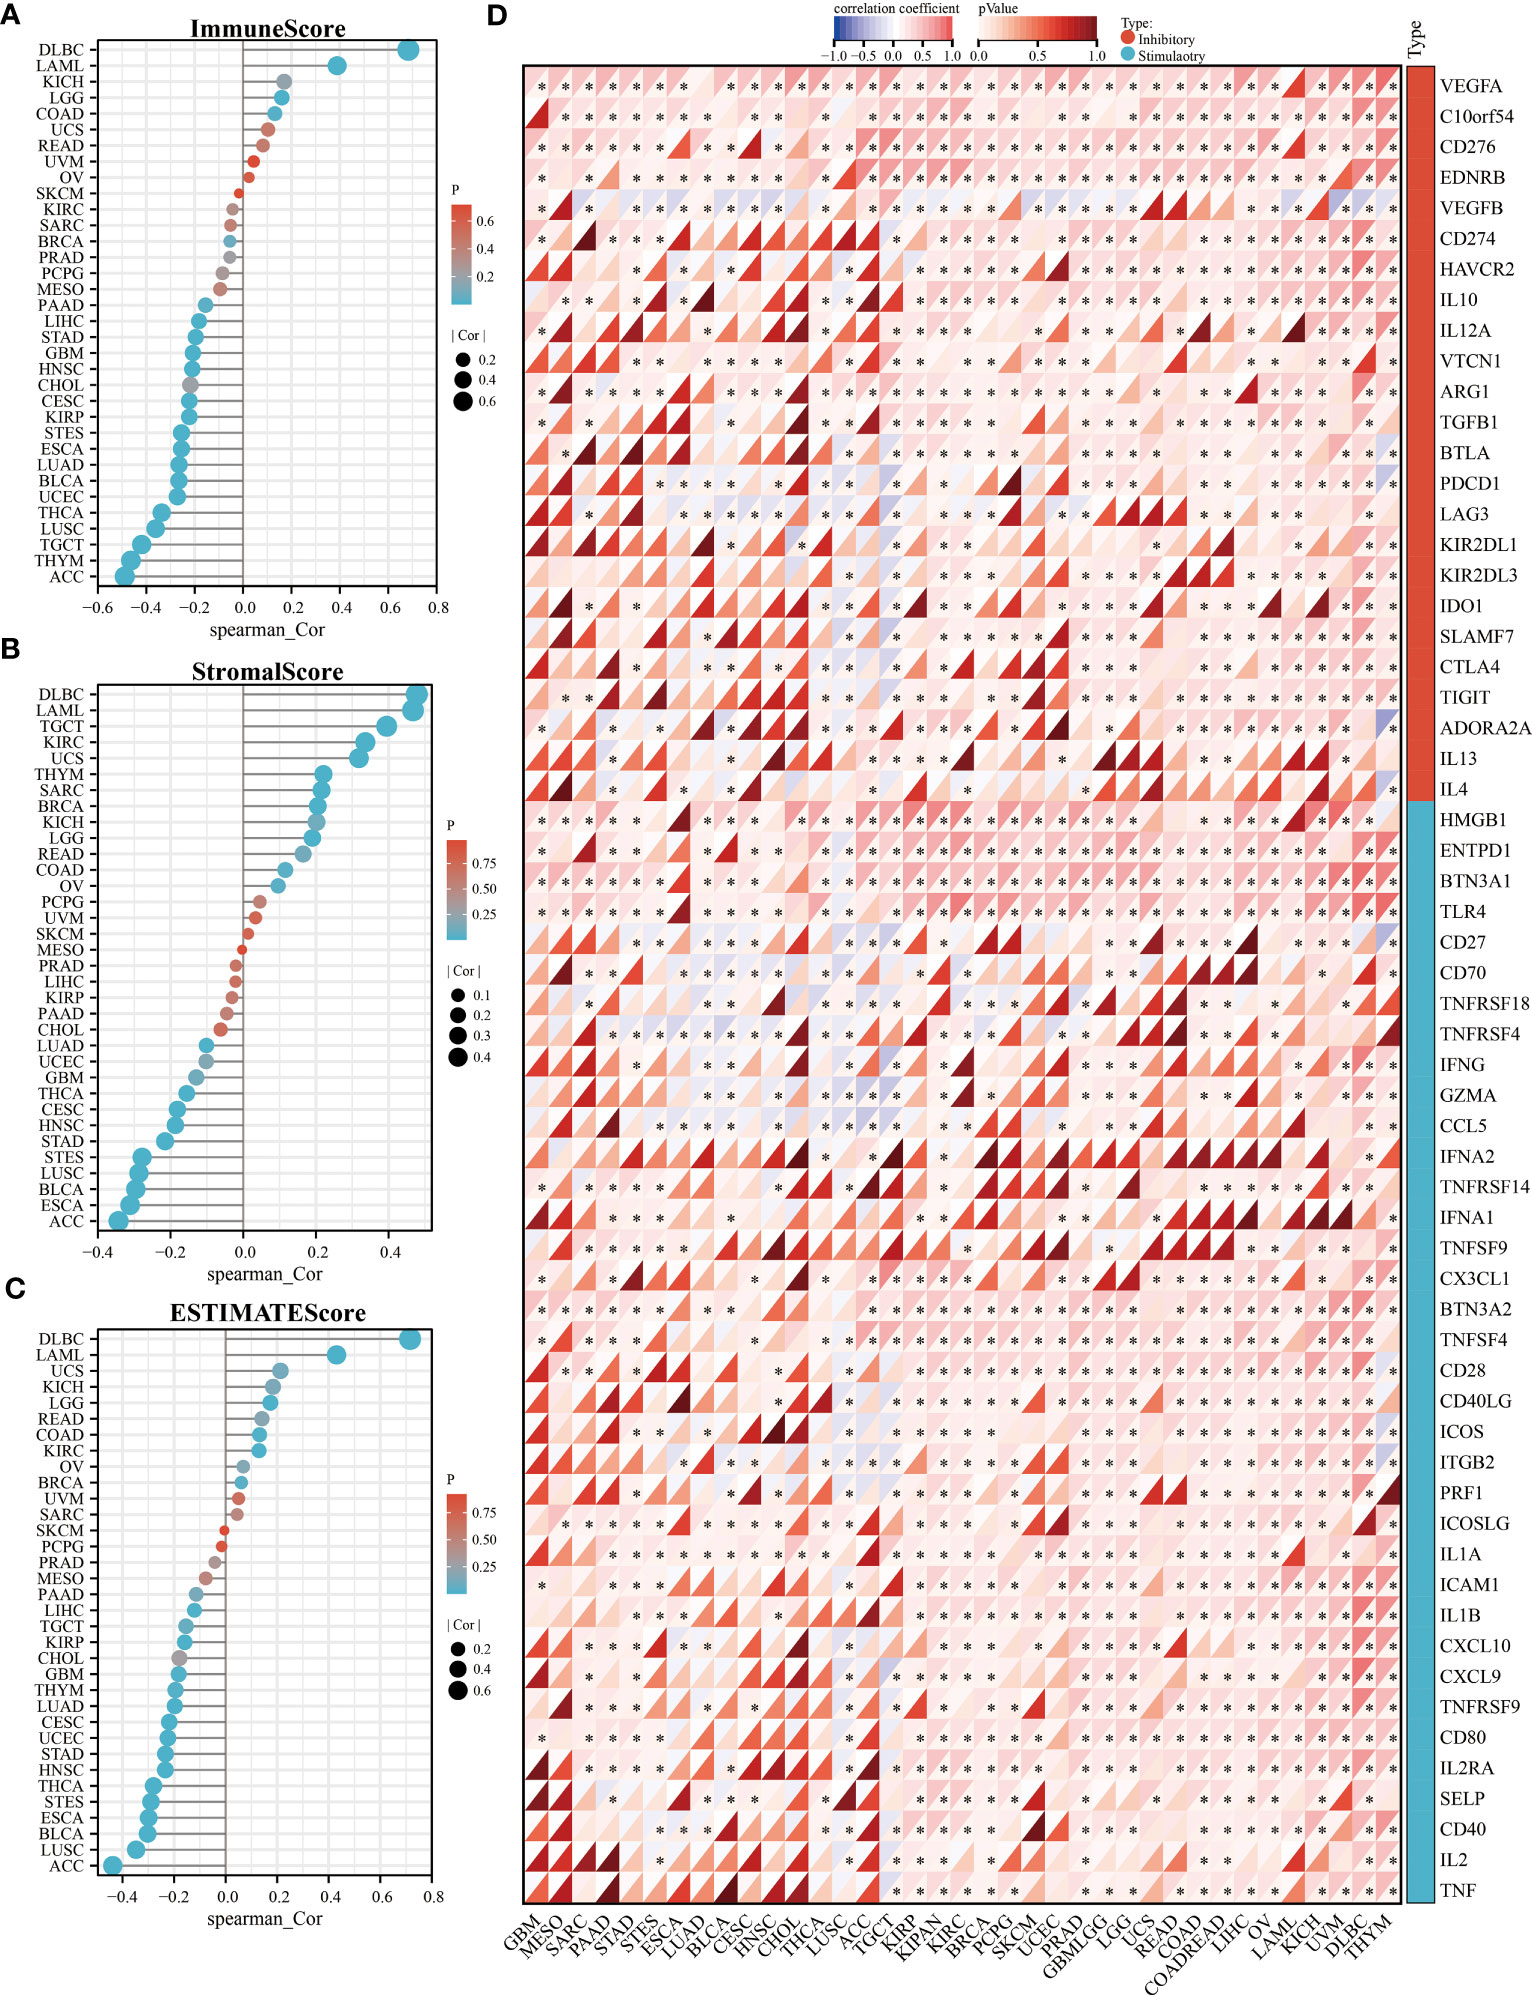
Figure 6 Relationship of KLF3 expression with TME in pan-cancer. (A-C) Correlation of KLF3 expression with immune score (A), stromal score (B), and estimated score (C) in pan-cancer. (D) Analysis of expression correlation of KLF3 expression with immune inhibitory and stimulatory genes. *p < 0.05.
TMB and MSI are predictors of immunotherapy (39). Therefore, we evaluated the relationship between KLF3 expression and TMB and MSI. Spearman’s correlation analysis showed that KLF3 expression in DLBC(p<0.05), ESCA(p<0.05), HNSC(p<0.05), LAML(p<0.05), LGG(p<0.05), PAAD(p<0.001), SARC(p<0.001), STAD(p<0.001), and THYM(p<0.001) was positively correlated with their TMB, while it was negatively correlated with TMB values in BRCA(p<0.001), KIRC(p<0.05), THCA(p<0.01) (Figure 7A). In addition, KLF3 expression levels were positively correlated with MSI in COAD(p<0.01), DLBC(p<0.001), READ(p<0.05), and STAD(p<0.001). In contrast, it was negatively correlated with MSI in BLCA(p<0.05), BRCA(p<0.05), HNSC(p<0.01), KIRP(p<0.05), PRAD(p<0.01), SKCM(p<0.01), THCA(p<0.01), and UCS(p<0.05) (Figure 7B). Further, we predicted the response and sensitivity of tumor patients to immunotherapy drugs based on KLF3 expression. As shown in Figure S5, there were five mouse immunotherapy cohorts for which immunotherapy response could be predicted by KLF3. Notably, when comparing KLF3 with common standard biomarkers of immunotherapy response, we found that an AUC greater than 0.5 was observed in 10 immunotherapy cohorts when KLF3 alone was used as a predictive marker, indicating that KLF3 outperformed TMB, T. Clonality, and B. Clonality in prediction (Figure S6). Subsequently, drug IC50 analysis of KLF3 by the GDSC dataset revealed that trametinib (reversible inhibitor of mitogen-activated extracellular signal-regulated kinase 1 (MEK 1/2)), PD-0325901 (selective MEK inhibitor) and 17-AAG (HSP90 inhibitor) were the top three drugs negatively associated with KLF3 expression; whereas PI-103 (multi-target PI3K inhibitor), JW-7-24-1 (small molecule kinase inhibitor) and PIK-93 (PI4KIIIβ inhibitor) were the top three drugs positively correlated with KLF3 expression (Figure 7C and Table S2). Correlation of KLF3 expression with drug IC50 based on the CTRP database showed that abiraterone (a CYP17 inhibitor), erlotinib (a tyrosine kinase inhibitor), and PD318088 (a non-ATP-competitive, MEK1/2-mutagenesis inhibitor) were the top three drugs negatively correlated with KLF3 expression; manumycin A (a selective, competitive farnesyltransferase (FTase) inhibitor), CCT036477 (Wnt Pathway Inhibitor XI) and CIL70 were the top three drugs positively associated with KLF3 expression (Figure 7D and Table S3). These results suggest a role for KLF3 in predicting immunotherapeutic response in pan-cancer and predicting effective small molecule drugs targeting KLF3, which may provide strong evidence for future pan-cancer therapeutic studies.
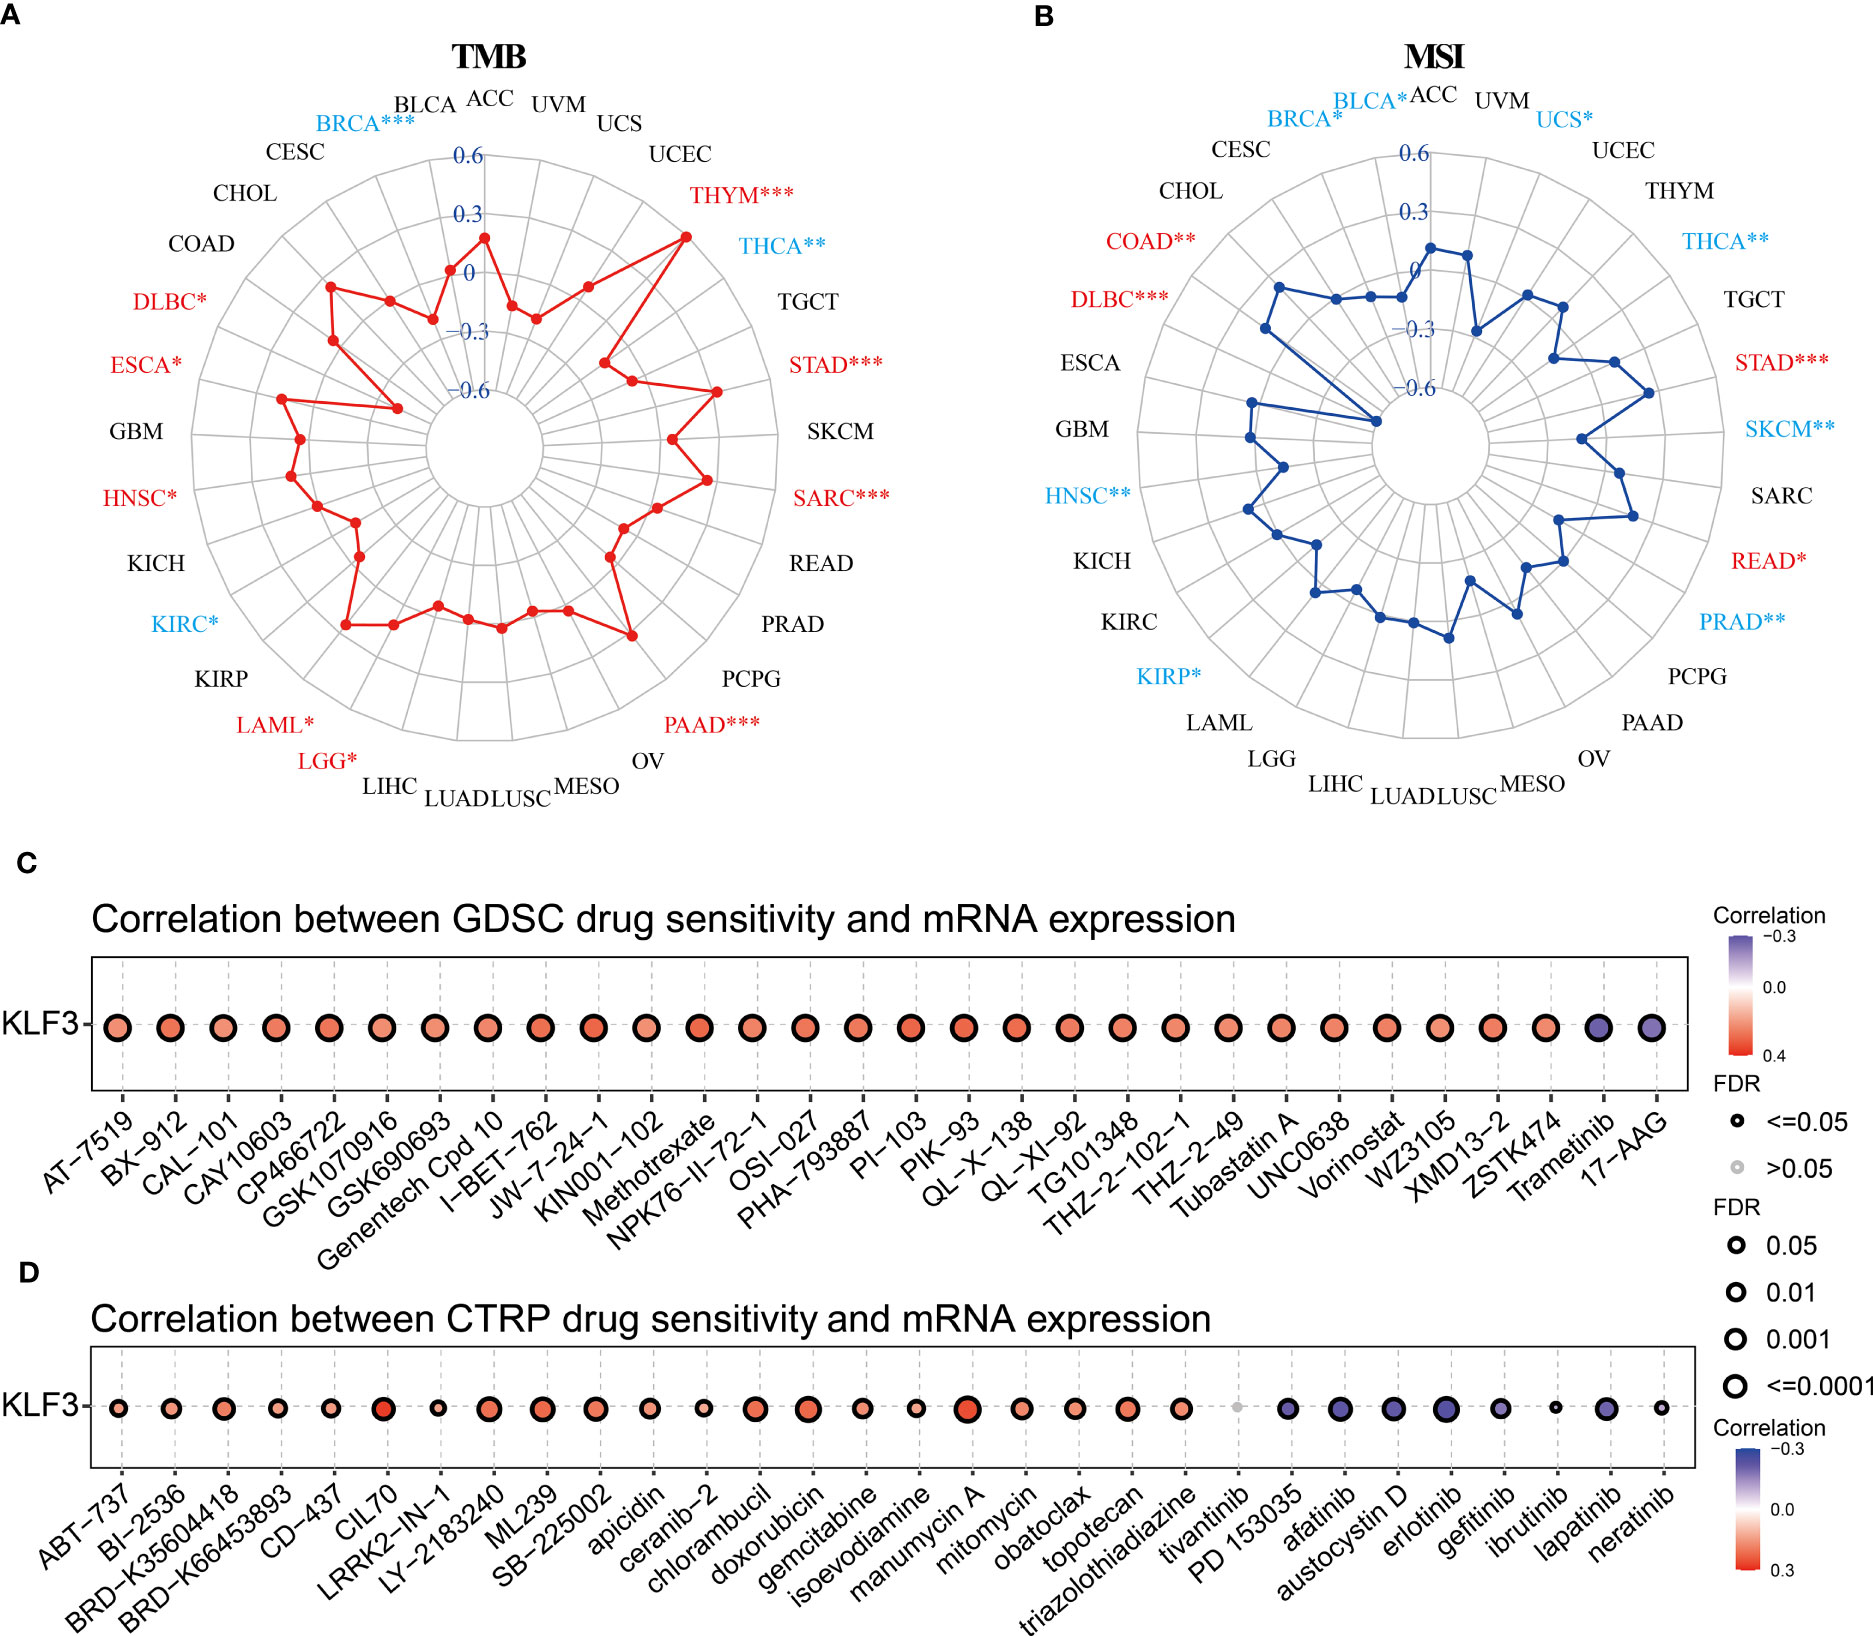
Figure 7 Immunotherapy response, biomarker correlation, and drug-sensitive prediction of KLF3 in pan-cancer. (A) Radar chart showing the relationship between KLF3 expression and TMB. (B) Radar chart showing the relationship between KLF3 expression and MSI. GDSC (C) and CTRP (D) databases were used to predict the related drugs targeting KLF3. *p < 0.05, **p < 0.01, ***p < 0.001.
Through our analysis of KLF3 in pan-cancer, we found that KLF3 is significantly upregulated in PAAD (Figures 1A–C) and its expression positively correlates with patient clinical stage and histological grade (Figures 3A, B). It is also significantly associated with poor OS, DSS, PFI, and DFI of patients with PAAD (Figure 3C and Figure S2). Therefore, our study focused on investigating the oncogenic effect of KLF3 in PAAD. First, we analyzed the clinical significance of KLF3 in PAAD and its protein expression. The combined univariate and multifactorial COX regression analysis suggested that KLF3 was an independent prognostic risk factor for PAAD (Figure 8A, all p<0.05). Subsequently, we characterized the protein expression of KLF3 to clarify whether its mRNA expression was consistent with protein expression. The HPA database (40) showed that the intensity of immunohistochemical staining for KLF3 was significantly higher in PAAD tissues than in normal pancreatic tissues (Figure 8B). This was validated by protein expression assay data from the CPTAC database (Figure 8C, p=0.01834020). The mRNA and protein basal expression levels of KLF3 in normal pancreatic ductal epithelial cells and PAAD cell lines were detected using qPCR and western bot, respectively. As shown in Figures 8D, E, both mRNA and protein levels of KLF3 were higher in PAAD cells than in normal pancreatic ductal epithelial cells HPDE6-C7(all p<0.05). The basal expression levels of KLF3 were significantly higher in pancreatic cancer cell lines PANC-1 and BxPC-3 cells, which will serve as a tool cell for silencing KLF3 expression. Based on ICC/IF analysis, it was found that KLF3 expression was predominantly localized in the nucleus of PAAD cells (Figure 8F), which is in agreement with the information retrieved from the HPA (Figure 8B) and Genecards (Figure 1D) databases.
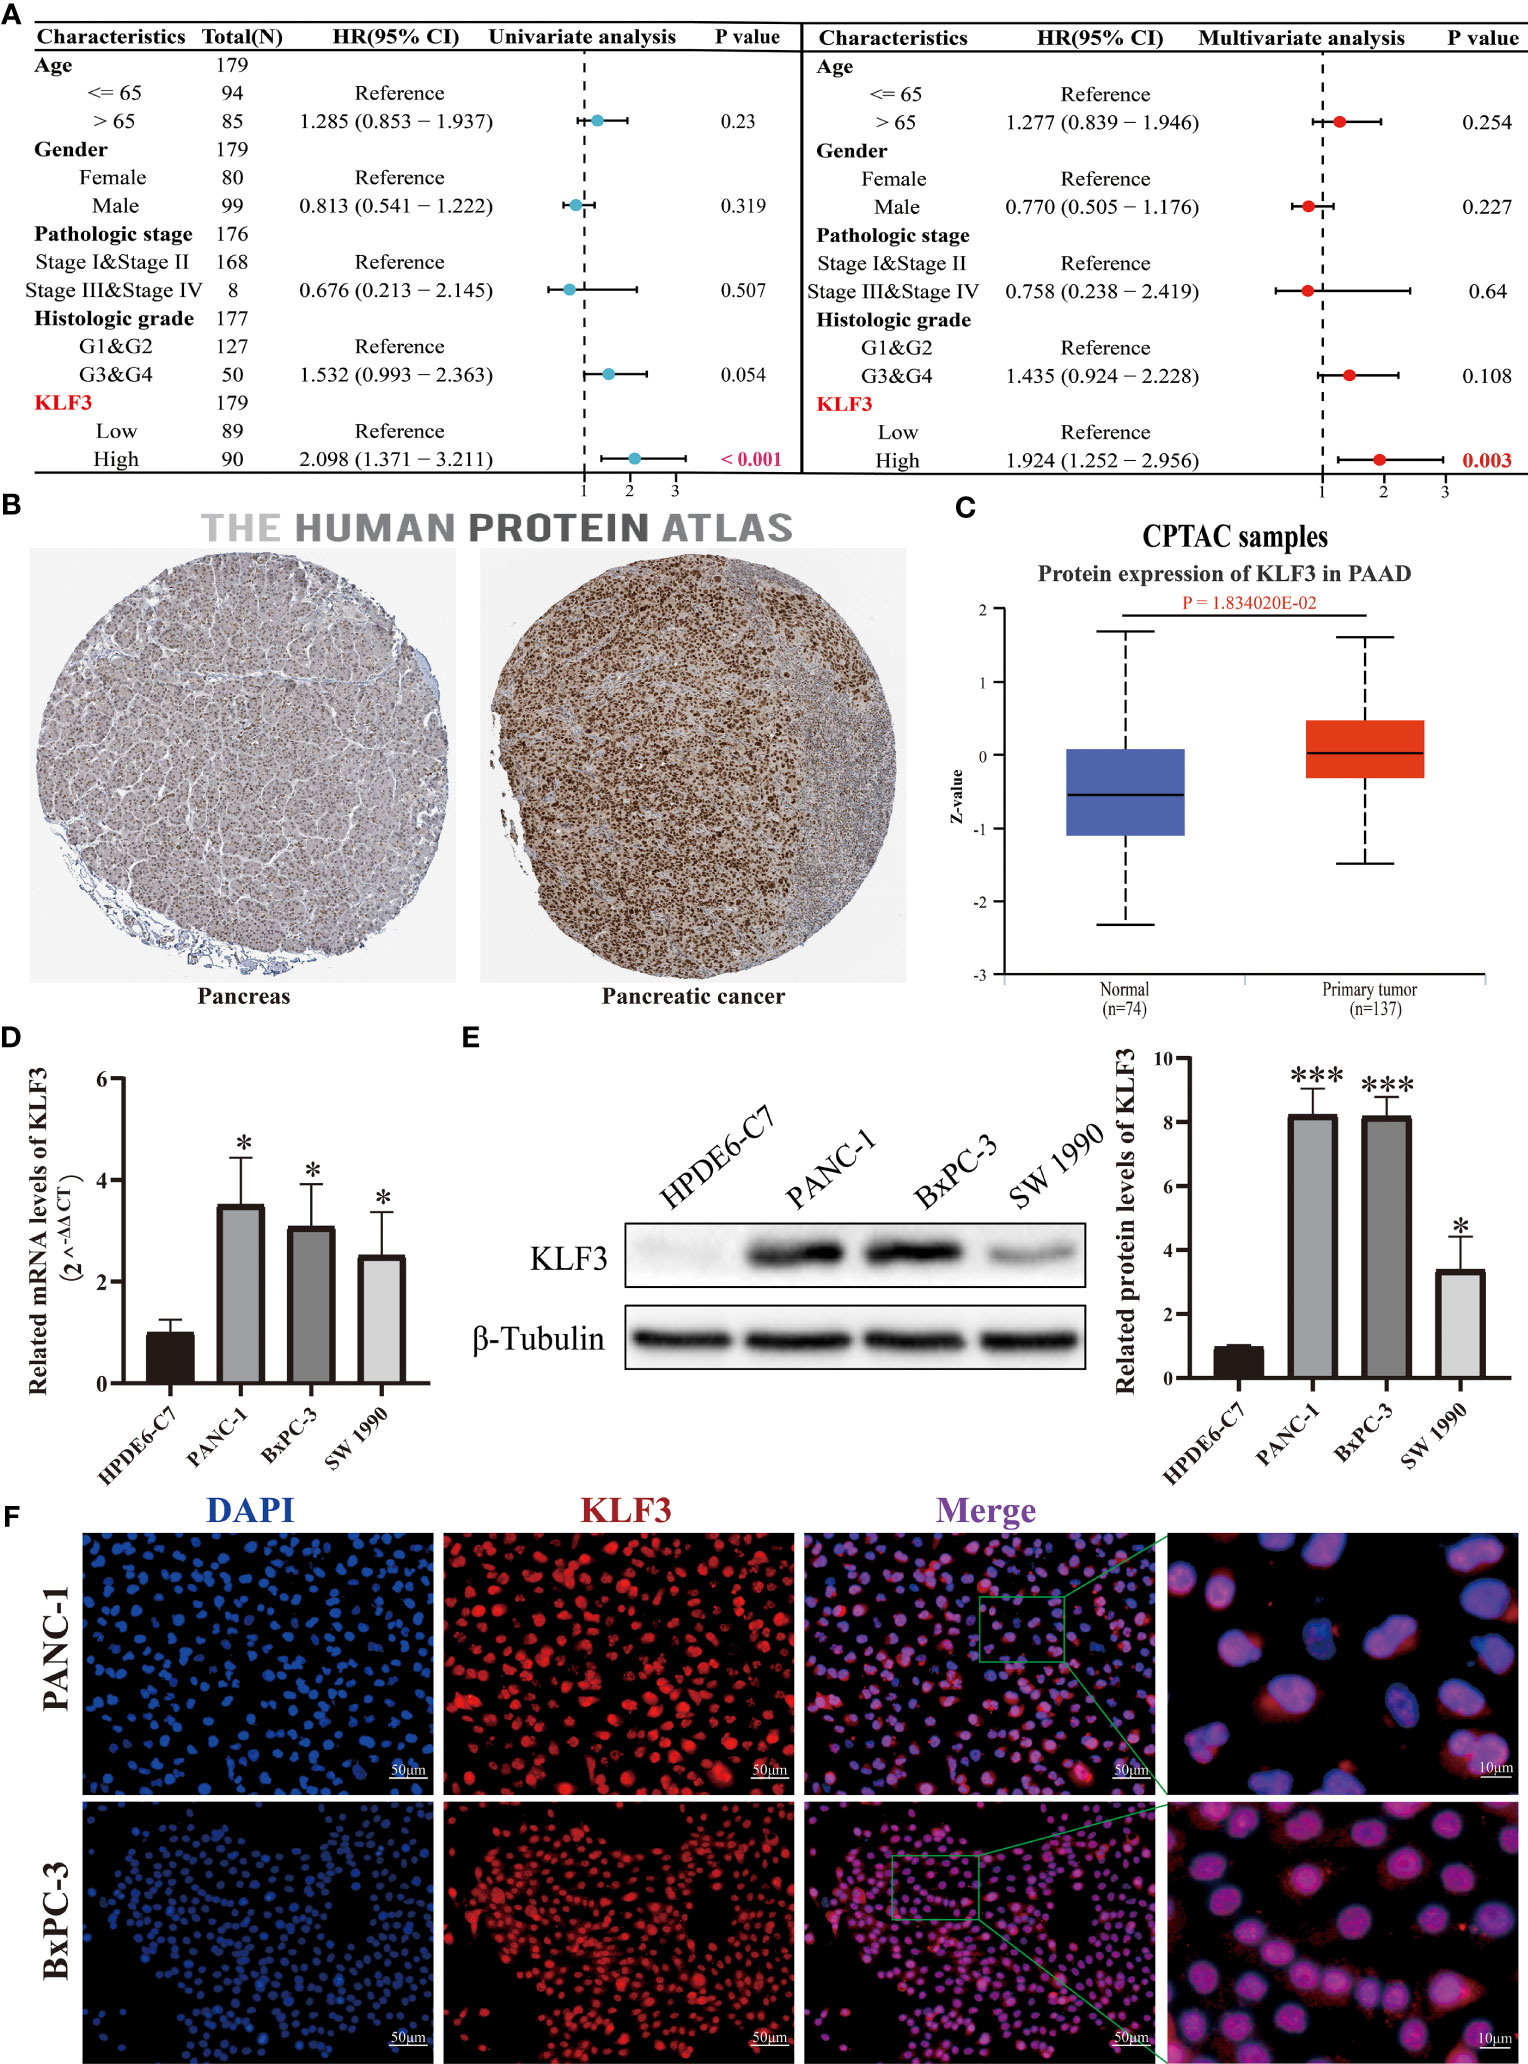
Figure 8 KLF3 high expression was associated with a poor prognosis of PAAD. (A) The role of KLF3 in PAAD was analyzed by univariate and multivariate Cox regression analysis. The data comes from the TCGA database. (B) Immunohistochemical staining was used to identify the expression of KLF3 in PAAD and pancreatic tissues. (C) The CPTAC database was used to analyze the protein expression level of KLF3 in PAAD and normal pancreas tissues. (D, E) The qPCR and Western blot were used to evaluate the basal expression levels of KLF3 mRNA and protein in HDPE6-C7, PANC-1, BxPC-3, and SW 1990 cells. (F) ICC/IF was used to identify KLF3 expression localization in PANC-1 and BxPC-3 cells. *p < 0.05, ***p < 0.001.
We effectively inhibited the expression of KLF3 using RNAi technology (Figures 9A, B, S7A, B, all p<0.05). By CCK-8 assay we found that interfering with KLF3 expression would inhibit cell viability of PANC-1 and BxPC-3 cells (Figures 9C, S7C, all p<0.05). Similarly, we used EdU cell proliferation assays to find that the knockdown of KLF3 expression would inhibit the proliferative capacity of PAAD cell lines (Figures 9D, S7D, all p<0.05). Subsequently, Transwell and wound healing assays were used to examine the potential role of KLF3 in the migration of PAAD and BxPC-3 cells. As shown in Figures 9E, F, S7E, F, the cell migration ability of PANC-1 and BxPC-3 cells with disrupted KLF3 expression were significantly inhibited(all p<0.05). Further, in vivo experiments revealed that tumor growth was significantly slower in PANC-1 cells with stably silenced KLF3 expression compared to the control group (Figure 9G, p<0.01). The weight of tumors in the sh-KLF3#1 group was also significantly reduced at the termination of the experiment (Figure 9H, p<0.01). Both in vitro and in vivo experiments indicated that KLF3 is a risk factor for PAAD and that silencing KLF3 expression would inhibit the progression of PAAD.
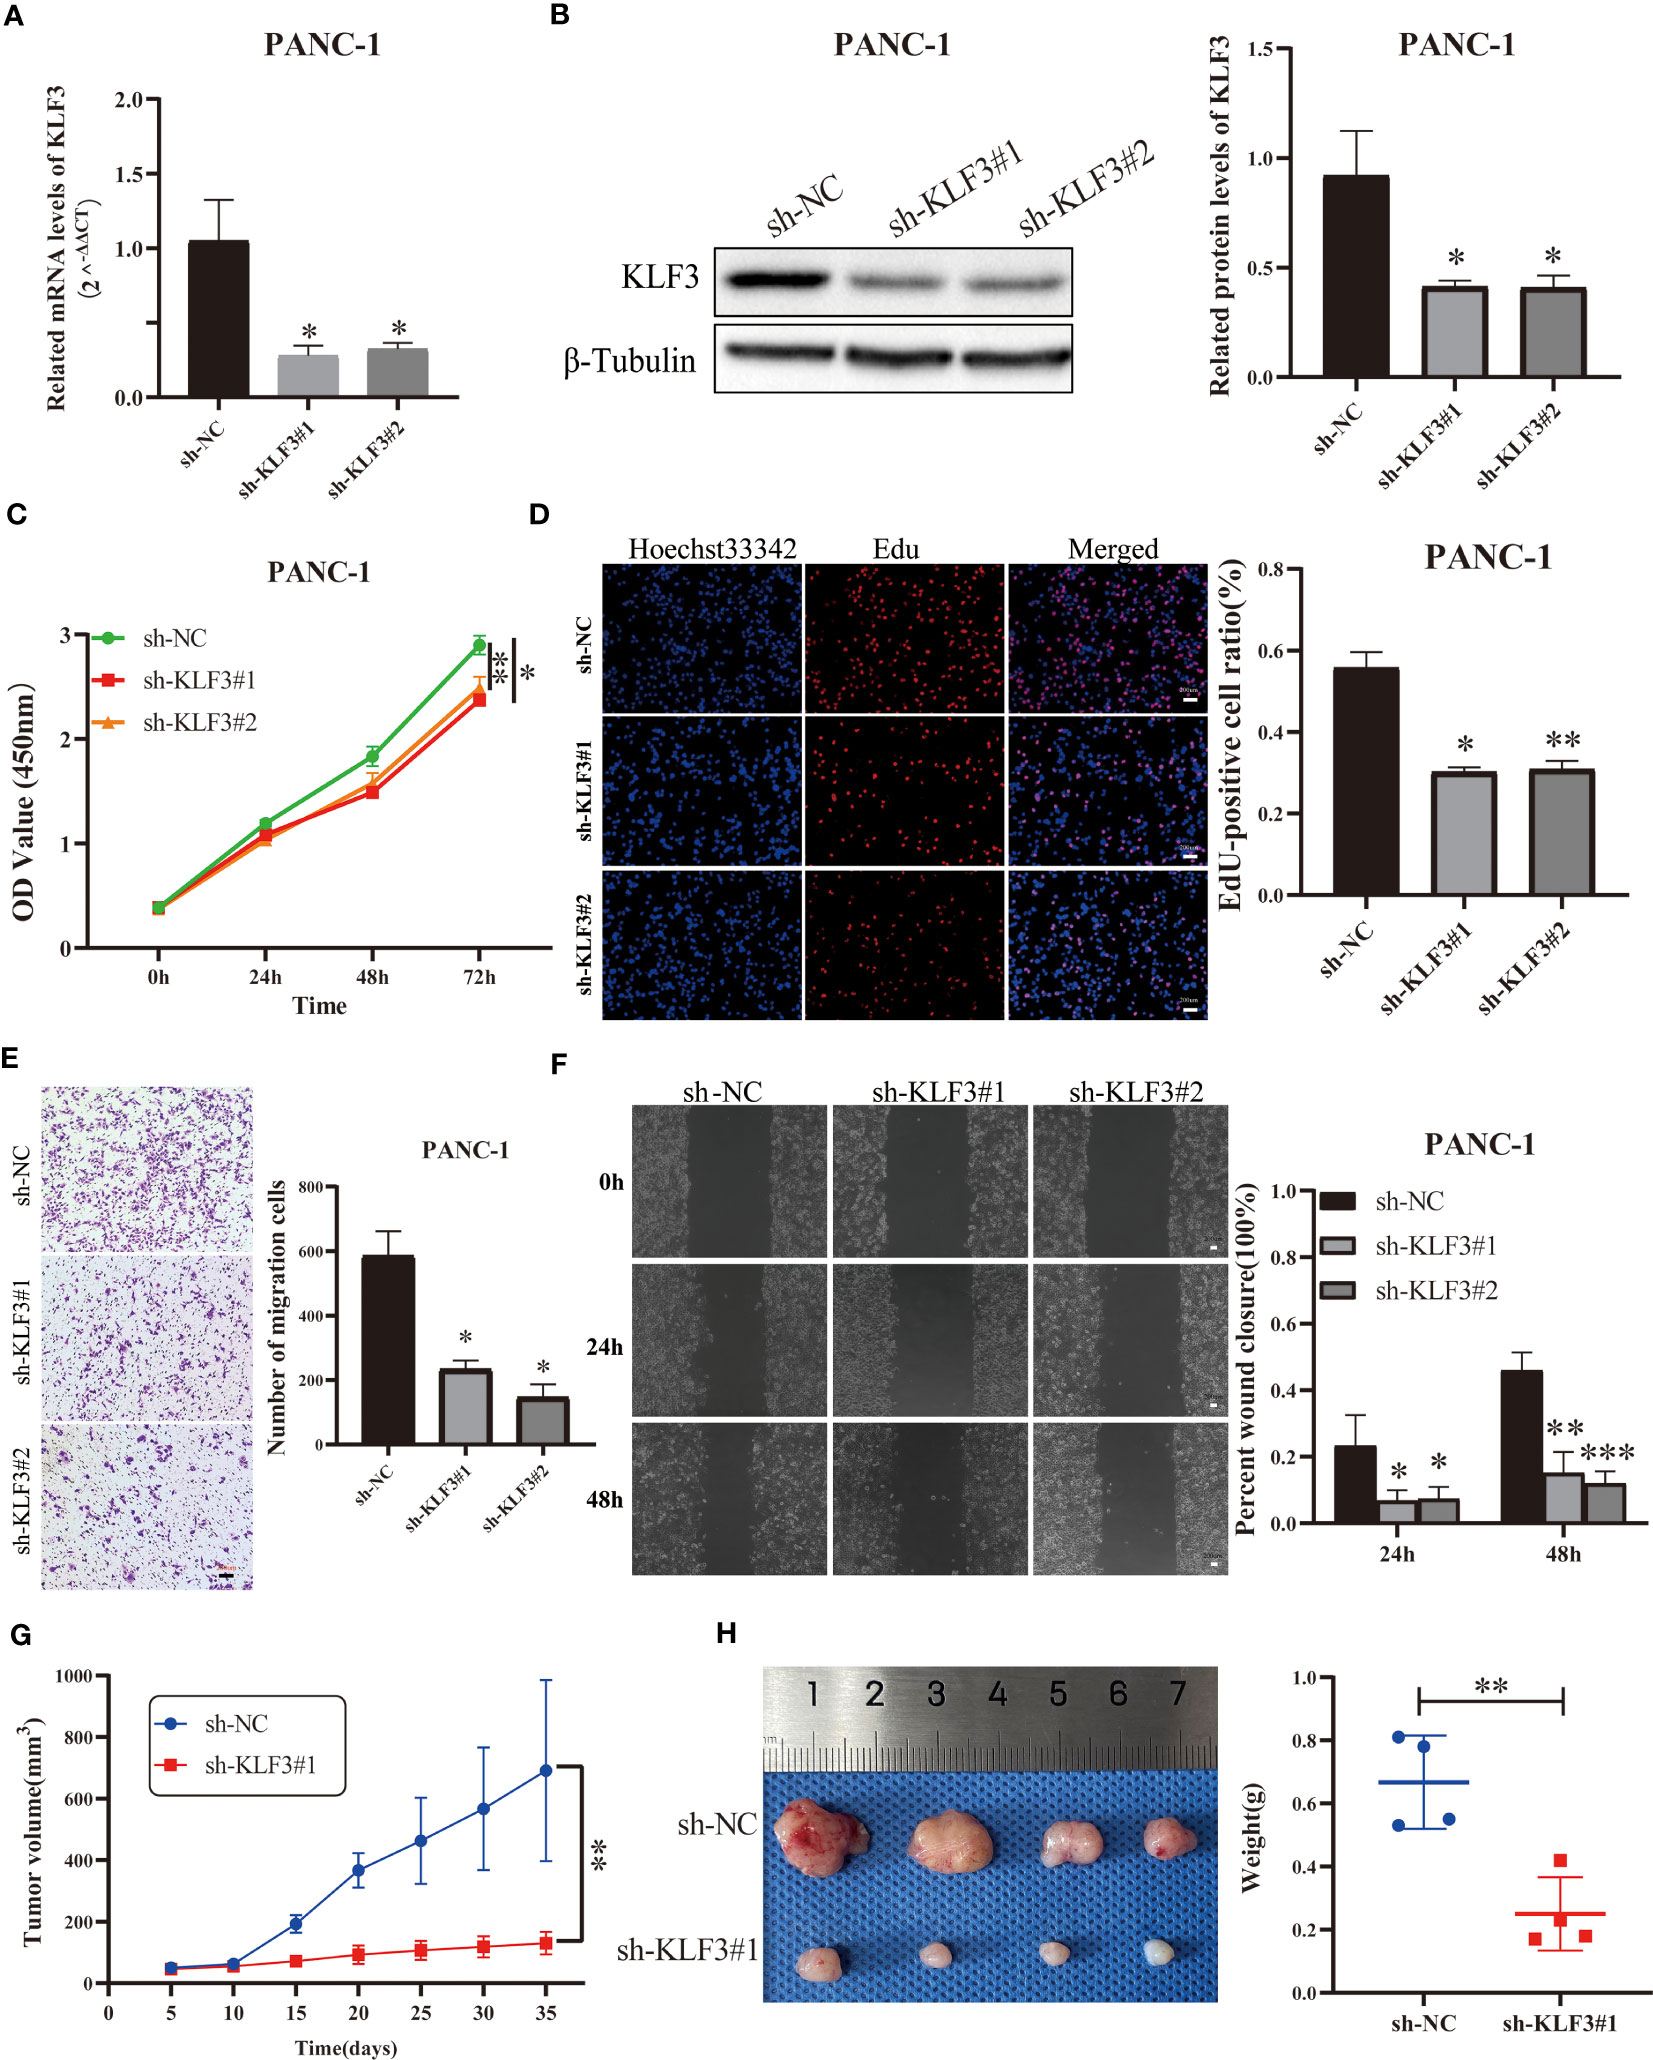
Figure 9 Silencing KLF3 expression inhibits the progression of PAAD in vivo and in vitro. (A, B) qPCR and Western blot were used to detect the changes of KLF3 mRNA and protein expression in PANC-1 cells transfected with sh-KLF3 plasmid. (C) CCK-8 method was used to detect the changes in the viability of PANC-1 cells after transfection of sh-NC, sh-KLF3#1, and sh-KLF3#2 plasmids. (D) EdU staining was used to evaluate the changes in the proliferation ability of PANC-1 cells in sh-NC, sh-KLF3#1, and sh-KLF3#2 groups. Transwell assay (E) and wound healing assay (F) were used to evaluate the changes in the cell migration ability of PANC-1 cells in sh-NC, sh-KLF3#1, and sh-KLF3#2 groups. (G, H) The effect of KLF3 silencing on the growth of subcutaneous xenograft tumors(n=4), presented as tumor growth volume curves (G), dissected tumor representative graphs, and weight graphs (H), respectively. *p < 0.05, **p < 0.01, ***p < 0.001.
Krüppel-like factors (KLF) are a family of eukaryotic DNA-binding transcriptional regulators involved in a variety of essential cellular functions, including proliferation, differentiation, migration, inflammation, and pluripotency (41). The common feature of most of its members is that their binding sites are not the same in different cells and environments: they may also bind different sites in the same cell and control different genomes in response to different microenvironments (41). KLF3, a member of the KLF, binds cofactor C-terminal binding proteins, which in turn recruit a large repressor complex to mediate transcriptional silencing (8). In recent years, studies on KLF3 have focused on the regulation of the production of erythroid (42), B-cell (43), lymphocyte (44), and adipose (45) substances, while few reports have explored its role in tumors. In this study, a systematic analysis of KLF3 expression profile, genetic alteration, DNA methylation, RNA modification, clinical significance, and prognostic value in pan-cancer was performed. Further correlations between KLF3 expression and TME, immune cell infiltration, immune checkpoints, immunotherapeutic response, and small molecule drug prediction were analyzed. This study also clarified the oncogenic role of KLF3 in PAAD through functional experiments.
It has been shown that KLF3 was aberrantly expressed in tumors and correlates with prognosis. For example, Huang et al. reported that KLF3 was lowly expressed in colorectal cancer and associated with poor prognosis (10). Shan et al. demonstrated that KLF3 was highly expressed in osteosarcoma and associated with poor prognosis (46). Wei et al. demonstrated that KLF3 was lowly expressed in lung cancer and associated with poor prognosis (14). In contrast, Meng et al. showed that KLF3 was lowly expressed in prostate cancer and was associated with favorable recurrence-free survival time (47). Our study also found that KLF3 mRNA was significantly upregulated in 14 tumor types and significantly downregulated in 13 tumor types compared to normal tissue. In this study, we found that the abnormal expression of KLF3 is affected by many factors, and its abnormal expression cannot be directly explained by genetic alteration, CNV, and methylation modification. Its abnormal expression is also regulated by other mechanisms, which requires more precise exploration in the future. In addition, increased KLF3 expression was negatively associated with histological grade in CESC, ESCA, KIPAN, KIRC, and STES and positively associated with histological grade in PAAD, HNSC, GBMLGG, and LGG. KLF3 expression was also negatively associated with clinical stage progression in COAD, COADREAD, ESCA, KIPAN, KIRC, THCA, and OV and positively associated with a clinical stage in PAAD. Further survival analysis revealed that high KLF3 expression was strongly associated with poor prognosis in patients with ACC, GBMLGG, LGG, PAAD, and SARC. In contrast, it was associated with a good prognosis in patients with BLCA, COADREAD, COAD, and KIRC, which is consistent with previous findings in colorectal cancer (10, 48). Our results also further validate that KLFs family genes were differentially expressed in different tumors or settings (41). Through the above analysis, we found a prominent role for KLF3 in PAAD. Previous studies have shown that miR-324-5p promotes pancreatic cancer cell proliferation and apoptosis by targeting KLF3 (13). However, in this study, KLF3 was found to be highly expressed in PAAD at both mRNA and protein levels. Increased KLF3 expression was strongly associated with histological grade, clinical stage, and poor prognosis (OS/DSS/PFI/DFI) of PAAD. Univariate and multifactorial Cox regression analyses identified KLF3 as an independent prognostic risk factor for PAAD. In vitro and in vivo experiments also found that inhibition of KLF3 expression would inhibit the proliferation and migratory capacity of PAAD cells. Further, single-cell sequencing data also revealed that KLF3 expression was positively correlated with EMT, hypoxia, inflammation, metastasis, and proliferation in most tumors, which was further validation of our functional assay results. Regarding the specific mechanism of KLF3 abnormal expression in promoting or inhibiting tumors, we found that it is mainly enriched in TGF-β, oxidative phosphorylation, mTORC1, KRAS, and EMT signaling pathways through GSEA. Previous studies have also found that downregulation of KLF3 expression inhibits the progression of lung cancer by inhibiting the JAK2/STAT3 and PI3K/AKT signaling pathways (49); KLF3 silencing promotes lung cancer EMT and enhances lung cancer metastasis through the STAT3 signaling pathway (14); KLF3 activates WNT through WNT1/β-catenin signaling pathway to promote the growth and metastasis of gastric cancer (50); of course, the specific mechanism of KLF3 regulating tumors is not comprehensive enough, and more in-depth mechanism exploration is needed in the future. In summary, KLF3 can effectively predict the prognosis of many cancers and is most evident in PAAD.
There is growing interest in the significance of TME in tumor progression, prognosis, and therapeutic responsiveness. Immune cells within the TME can promote or suppress tumor growth (51). Previous studies suggested that KLF3 may interact with KLF2 in controlling the differentiation/homeostasis of certain B-cell subpopulations (52). For example, B-cell development was impaired in the absence of KLF3 (43), while KLF3 overexpression resulted in a significant increase in the number of B-cells in the marginal zone of the spleen (53). In addition, KLF3 directly inhibited transcription of the inflammatory regulator Galectin-3; KLF3 suppressed NF-κB-driven inflammation in mice (54); and eosinophil function was also regulated in adipose tissue (55). However, the relationship between KLF3 and pan-cancer TME and tumor immune cell infiltration remains largely unknown. In this study, we found that KLF3 expression was negatively associated with immune scores in the TME of most tumors. EPIC and MCPCOUNTER algorithm analysis revealed that KLF3 expression was strongly associated with CD4+ T cells, CD8+ T cells, neutrophils, myeloid dendritic cells, monocytes/macrophages, and endothelial cell infiltration in TME. We also validated this result by analysis of single-cell sequencing data. This study found that the expression of KLF3 was roughly positively correlated with the expression of genes related to M2 macrophages and CAFs, which may suggest that the high expression of KLF3 can promote the formation of a microenvironment suitable for tumor cell growth. Previous studies have also suggested that KLF4, also a member of the KLF family, can regulate the polarization of M1/M2 macrophages in alcoholic liver disease (31). In conclusion, KLF3 expression is closely associated with the composition of TME.
In advanced cancers, immunotherapy is effective in multiple clinical trials (56), but only a small number of patients can benefit from it (57). Therefore, the development of biomarkers that effectively predict response to immunotherapy is essential to screen potential populations that may benefit from immunotherapy. PD-L1 expression and genomic features (e.g. oncogenic driver mutations, TMB and MSI) have been proposed as biomarkers of response to immunotherapy (58). In this study, KLF3 expression was correlated with pan-cancer TMB, MSI, immune activation/inhibition-related genes, T-cell exhaustion, M2 macrophages and CAFs-related genes, and TME. To validate the value of KLF3 in predicting response to immunotherapy, we also calculated its ROC value as a biomarker in the immunotherapy cohort. Interestingly, the immunotherapeutic response was predicted by KLF3 in five mouse immunotherapy cohorts; and KLF3 outperformed TMB, T. Clonality, and B. Clonality when used alone as a predictive marker. However, there is no evidence to support whether KLF3 can be used as a tumor cell signaling protein for CAR-T therapy, which requires further exploration in the future. Finally, we also predicted a series of small molecules targeting KLF3 through the GDSC and CTRP databases, which will provide a basis for the future development of immunotherapeutic and targeted therapeutic agents.
In this study, KLF3 was aberrantly expressed in a variety of tumor types and was strongly correlated with clinical progression and prognosis; KLF3 could be a potential prognostic marker, especially in PAAD. In addition, the contribution of KLF3 to TME and the abundance of immune cell infiltration is not negligible. It may be a biomarker for predicting response to immunotherapy and has the potential to guide individualized immunotherapy for cancer.
Publicly available datasets were analyzed in this study. This data can be found here: the TCGA and GTEx databases were downloaded from the UCSC (https://xenabrowser.net/) database; the Human Protein Atlas (HPA, https://www.proteinatlas.org/); TISCH2, http://tisch.comp-genomics.org/home/, select datasets: ALL-GSE132509, BLCA-GSE130001, BRCA-GSE138536, CHOL-GSE125449, CRC-GSE139555, Glioma-GSE103224, HNSC-GSE103322, KIRC-GSE111360, LIHC-GSE140228, NSCLC-EMTAB6149, OV-GSE118828, PAAD-CRA001160, SKCM-GSE123139, STAD-GSE134520, UCEC-GSE139555 and UVM-GSE139829.
The animal study was reviewed and approved by Animal Experimental Ethical Inspection of Nanchang Royo Biotech Co. Ltd. (RYE2022092401).
JZ and HT conducted the formal analysis and wrote the original draft; YZ performed the project administration; HT conducted the experiments. JZ, XZ, JY, and QZ participated in software analysis; JZ, XZ, HT, and JY conducted data curation; JZ and YZ contributed to writing, reviewing, and editing the article; YZ provided funding acquisition. All authors contributed to the article and approved the submitted version.
The study was supported by the National Natural Science Foundation of China (Nos.81860530) and the Natural Science Foundation of Jiangxi Province, China (Nos.20224ACB206037).
The authors declare that the research was conducted in the absence of any commercial or financial relationships that could be construed as a potential conflict of interest.
All claims expressed in this article are solely those of the authors and do not necessarily represent those of their affiliated organizations, or those of the publisher, the editors and the reviewers. Any product that may be evaluated in this article, or claim that may be made by its manufacturer, is not guaranteed or endorsed by the publisher.
The Supplementary Material for this article can be found online at: https://www.frontiersin.org/articles/10.3389/fimmu.2023.1167018/full#supplementary-material
1. Siegel RL, Miller KD, Jemal A. Cancer statistics, 2018. CA Cancer J Clin (2018) 68(1):7–30. doi: 10.3322/caac.21442
2. Siegel RL, Miller KD, Fuchs HE, Jemal A. Cancer statistics, 2022. CA Cancer J Clin (2022) 72(1):7–33. doi: 10.3322/caac.21708
3. Yang ZS, Tang XJ, Guo XR, Zou DD, Sun XY, Feng JB, et al. Cancer cell-oriented migration of mesenchymal stem cells engineered with an anticancer gene (Pten): An imaging demonstration. Onco Targets Ther (2014) 7:441–6. doi: 10.2147/OTT.S59227
4. Pardoll DM. The blockade of immune checkpoints in cancer immunotherapy. Nat Rev Cancer (2012) 12(4):252–64. doi: 10.1038/nrc3239
5. Romero P, Banchereau J, Bhardwaj N, Cockett M, Disis ML, Dranoff G, et al. The human vaccines project: A roadmap for cancer vaccine development. Sci Transl Med (2016) 8(334):334ps9. doi: 10.1126/scitranslmed.aaf0685
6. Li Q, Ding ZY. The ways of isolating neoantigen-specific T cells. Front Oncol (2020) 10:1347. doi: 10.3389/fonc.2020.01347
7. Khemlina G, Ikeda S, Kurzrock R. The biology of hepatocellular carcinoma: implications for genomic and immune therapies. Mol Cancer (2017) 16(1):149. doi: 10.1186/s12943-017-0712-x
8. Pearson RC, Funnell AP, Crossley M. The mammalian zinc finger transcription factor kruppel-like factor 3 (KLF3/bklf). IUBMB Life (2011) 63(2):86–93. doi: 10.1002/iub.422
9. Pearson R, Fleetwood J, Eaton S, Crossley M, Bao S. Kruppel-like transcription factors: A functional family. Int J Biochem Cell Biol (2008) 40(10):1996–2001. doi: 10.1016/j.biocel.2007.07.018
10. Huang Z, He H, Qiu F, Qian H. Expression and prognosis value of the klf family members in colorectal cancer. J Oncol (2022) 2022:6571272. doi: 10.1155/2022/6571272
11. Khan K, Safi S, Abbas A, Badshah Y, Dilshad E, Rafiq M, et al. Unravelling structure, localization, and genetic crosstalk of KLF3 in human breast cancer. BioMed Res Int (2020) 2020:1354381. doi: 10.1155/2020/1354381
12. Yu PF, Wang Y, Lv W, Kou D, Hu HL, Guo SS, et al. Lncrna neat1/mir-1224/KLF3 contributes to cell proliferation, apoptosis and invasion in lung cancer. Eur Rev Med Pharmacol Sci (2019) 23(19):8403–10. doi: 10.26355/eurrev_201910_19151
13. Wan Y, Luo H, Yang M, Tian X, Peng B, Zhan T, et al. Mir-324-5p contributes to cell proliferation and apoptosis in pancreatic cancer by targeting. KLF3. Mol Ther Oncolytics (2020) 18:432–42. doi: 10.1016/j.omto.2020.07.011
14. Sun W, Hu S, Zu Y, Deng Y. KLF3 is a crucial regulator of metastasis by controlling stat3 expression in lung cancer. Mol Carcinog (2019) 58(11):1933–45. doi: 10.1002/mc.23072
15. Li J, Mo R, Zheng L. Inhibition of the cell migration, invasion and chemoresistance of colorectal cancer cells through targeting KLF3 by mir-365a-3p. J Cancer (2021) 12(20):6155–64. doi: 10.7150/jca.61967
16. Tian B, Zhou L, Wang J, Yang P. Mir-660-5p-loaded M2 macrophages-derived exosomes augment hepatocellular carcinoma development through regulating KLF3. Int Immunopharmacol (2021) 101(Pt B):108157. doi: 10.1016/j.intimp.2021.108157
17. Zhang B, Lin J, Zhang J, Wang X, Deng X. Integrated chromatin accessibility and transcriptome landscapes of 5-fluorouracil-resistant colon cancer cells. Front Cell Dev Biol (2022) 10:838332. doi: 10.3389/fcell.2022.838332
18. Shen W, Song Z, Zhong X, Huang M, Shen D, Gao P, et al. Sangerbox: A comprehensive, interaction-friendly clinical bioinformatics analysis platform. iMeta (2022) 1(3):e36. doi: 10.1002/imt2.36
19. Andersen PK, Gill RD. Cox's regression model for counting processes: A large sample study. Ann Stat (1982), 10(4):1100–20. doi: 10.1214/aos/1176345976
20. Chandrashekar DS, Karthikeyan SK, Korla PK, Patel H, Shovon AR, Athar M, et al. Ualcan: an update to the integrated cancer data analysis platform. Neoplasia (2022) 25:18–27. doi: 10.1016/j.neo.2022.01.001
21. Yu G, Wang LG, Han Y, He QY. Clusterprofiler: an R package for comparing biological themes among gene clusters. OMICS (2012) 16(5):284–7. doi: 10.1089/omi.2011.0118
22. Hanzelmann S, Castelo R, Guinney J. Gsva: gene set variation analysis for microarray and rna-seq data. BMC Bioinf (2013) 14:7. doi: 10.1186/1471-2105-14-7
23. Becht E, Giraldo NA, Lacroix L, Buttard B, Elarouci N, Petitprez F, et al. Estimating the population abundance of tissue-infiltrating immune and stromal cell populations using gene expression. Genome Biol (2016) 17(1):218. doi: 10.1186/s13059-016-1070-5
24. Racle J, de Jonge K, Baumgaertner P, Speiser DE, Gfeller D. Simultaneous enumeration of cancer and immune cell types from bulk tumor gene expression data. Elife (2017) 6:e26476. doi: 10.7554/eLife.26476
25. Yoshihara K, Shahmoradgoli M, Martinez E, Vegesna R, Kim H, Torres-Garcia W, et al. Inferring tumour purity and stromal and immune cell admixture from expression data. Nat Commun (2013) 4:2612. doi: 10.1038/ncomms3612
26. Thorsson V, Gibbs DL, Brown SD, Wolf D, Bortone DS, Ou Yang TH, et al. The immune landscape of cancer. Immunity (2018) 48(4):812–30 e14. doi: 10.1016/j.immuni.2018.03.023
27. Jantz-Naeem N, Bottcher-Loschinski R, Borucki K, Mitchell-Flack M, Bottcher M, Schraven B, et al. Tigit signaling and its influence on T cell metabolism and immune cell function in the tumor microenvironment. Front Oncol (2023) 13:1060112. doi: 10.3389/fonc.2023.1060112
28. Ostroumov D, Duong S, Wingerath J, Woller N, Manns MP, Timrott K, et al. Transcriptome profiling identifies tigit as a marker of T-cell exhaustion in liver cancer. Hepatology (2021) 73(4):1399–418. doi: 10.1002/hep.31466
29. Zeng Z, Wei F, Ren X. Exhausted T cells and epigenetic status. Cancer Biol Med (2020) 17(4):923–36. doi: 10.20892/j.issn.2095-3941.2020.0338
30. Saha B, Bala S, Hosseini N, Kodys K, Szabo G. Kruppel-like factor 4 is a transcriptional regulator of M1/M2 macrophage polarization in alcoholic liver disease. J Leukoc Biol (2015) 97(5):963–73. doi: 10.1189/jlb.4A1014-485R
31. Kanzaki R, Pietras K. Heterogeneity of cancer-associated fibroblasts: opportunities for precision medicine. Cancer Sci (2020) 111(8):2708–17. doi: 10.1111/cas.14537
32. Huang S, Dong C, Li D, Xu Y, Wu J. Arpc2: A pan-cancer prognostic and immunological biomarker that promotes hepatocellular carcinoma cell proliferation and invasion. Front Cell Dev Biol (2022) 10:896080. doi: 10.3389/fcell.2022.896080
33. Bonneville R, Krook MA, Kautto EA, Miya J, Wing MR, Chen HZ, et al. Landscape of microsatellite instability across 39 cancer types. JCO Precis Oncol (2017) (2017): PO.17.00073. doi: 10.1200/PO.17.00073
34. Zhu J, Zhao J, Luo C, Zhu Z, Peng X, Zhu X, et al. Fat10 promotes chemotherapeutic resistance in pancreatic cancer by inducing epithelial-mesenchymal transition via stabilization of foxm1 expression. Cell Death Dis (2022) 13(5):497. doi: 10.1038/s41419-022-04960-0
35. Zhu J, Huang Q, Peng X, Luo C, Liu S, Liu Z, et al. Identification of lncrna prognostic signature associated with genomic instability in pancreatic adenocarcinoma. Front Oncol (2022) 12:799475. doi: 10.3389/fonc.2022.799475
36. Chen RX, Chen X, Xia LP, Zhang JX, Pan ZZ, Ma XD, et al. N(6)-methyladenosine modification of circnsun2 facilitates cytoplasmic export and stabilizes hmga2 to promote colorectal liver metastasis. Nat Commun (2019) 10(1):4695. doi: 10.1038/s41467-019-12651-2
37. Martisova A, Holcakova J, Izadi N, Sebuyoya R, Hrstka R, Bartosik M. DNA methylation in solid tumors: functions and methods of detection. Int J Mol Sci (2021) 22(8):4247. doi: 10.3390/ijms22084247
38. Barbieri I, Kouzarides T. Role of rna modifications in cancer. Nat Rev Cancer (2020) 20(6):303–22. doi: 10.1038/s41568-020-0253-2
39. Duffy MJ, Crown J. Biomarkers for predicting response to immunotherapy with immune checkpoint inhibitors in cancer patients. Clin Chem (2019) 65(10):1228–38. doi: 10.1373/clinchem.2019.303644
40. Uhlen M, Zhang C, Lee S, Sjostedt E, Fagerberg L, Bidkhori G, et al. A pathology atlas of the human cancer transcriptome. Science (2017) 357(6352):eaan2507. doi: 10.1126/science.aan2507
41. Tetreault MP, Yang Y, Katz JP. Kruppel-like factors in cancer. Nat Rev Cancer (2013) 13(10):701–13. doi: 10.1038/nrc3582
42. Funnell AP, Norton LJ, Mak KS, Burdach J, Artuz CM, Twine NA, et al. The caccc-binding protein KLF3/bklf represses a subset of klf1/eklf target genes and is required for proper erythroid maturation in vivo. Mol Cell Biol (2012) 32(16):3281–92. doi: 10.1128/MCB.00173-12
43. Vu TT, Gatto D, Turner V, Funnell AP, Mak KS, Norton LJ, et al. Impaired B cell development in the absence of kruppel-like factor 3. J Immunol (2011) 187(10):5032–42. doi: 10.4049/jimmunol.1101450
44. Alles M, Turchinovich G, Zhang P, Schuh W, Agenes F, Kirberg J. Leukocyte beta7 integrin targeted by kruppel-like factors. J Immunol (2014) 193(4):1737–46. doi: 10.4049/jimmunol.1302613
45. He C, Wang Y, Xu Q, Xiong Y, Zhu J, Lin Y. Overexpression of krueppel like factor 3 promotes subcutaneous adipocytes differentiation in goat capra hircus. Anim Sci J (2021) 92(1):e13514. doi: 10.1111/asj.13514
46. Shan HJ, Gu WX, Duan G, Chen HL. Fat mass and obesity associated (Fto)-mediated N6-methyladenosine modification of kruppel-like factor 3 (KLF3) promotes osteosarcoma progression. Bioengineered (2022) 13(4):8038–50. doi: 10.1080/21655979.2022.2051785
47. Meng J, Lu X, Zhou Y, Zhang M, Gao L, Gao S, et al. Characterization of the prognostic values and response to immunotherapy/chemotherapy of kruppel-like factors in prostate cancer. J Cell Mol Med (2020) 24(10):5797–810. doi: 10.1111/jcmm.15242
48. Wang X, Jiang Z, Zhang Y, Wang X, Liu L, Fan Z. Rna sequencing analysis reveals protective role of kruppel-like factor 3 in colorectal cancer. Oncotarget (2017) 8(13):21984–93. doi: 10.18632/oncotarget.15766
49. Wang R, Xu J, Xu J, Zhu W, Qiu T, Li J, et al. Mir-326/sp1/KLF3: A novel regulatory axis in lung cancer progression. Cell Prolif (2019) 52(2):e12551. doi: 10.1111/cpr.12551
50. Li Y, Wang Y, Zou Q, Li S, Zhang F. KLF3 transcription activates wnt1 and promotes the growth and metastasis of gastric cancer via activation of the wnt/beta-catenin signaling pathway. Lab Invest (2023) 103(6):100078. doi: 10.1016/j.labinv.2023.100078
51. Papait A, Stefani FR, Cargnoni A, Magatti M, Parolini O, Silini AR. The multifaceted roles of mscs in the tumor microenvironment: interactions with immune cells and exploitation for therapy. Front Cell Dev Biol (2020) 8:447. doi: 10.3389/fcell.2020.00447
52. Hart GT, Hogquist KA, Jameson SC. Kruppel-like factors in lymphocyte biology. J Immunol (2012) 188(2):521–6. doi: 10.4049/jimmunol.1101530
53. Turchinovich G, Vu TT, Frommer F, Kranich J, Schmid S, Alles M, et al. Programming of marginal zone B-cell fate by basic kruppel-like factor (Bklf/KLF3). Blood (2011) 117(14):3780–92. doi: 10.1182/blood-2010-09-308742
54. Knights AJ, Yang L, Shah M, Norton LJ, Green GS, Stout ES, et al. Kruppel-like factor 3 (KLF3) suppresses nf-kappab-driven inflammation in mice. J Biol Chem (2020) 295(18):6080–91. doi: 10.1074/jbc.RA120.013114
55. Knights AJ, Vohralik EJ, Houweling PJ, Stout ES, Norton LJ, Alexopoulos SJ, et al. Eosinophil function in adipose tissue is regulated by kruppel-like factor 3 (KLF3). Nat Commun (2020) 11(1):2922. doi: 10.1038/s41467-020-16758-9
56. Le QV, Yang G, Wu Y, Jang HW, Shokouhimehr M, Oh YK. Nanomaterials for modulating innate immune cells in cancer immunotherapy. Asian J Pharm Sci (2019) 14(1):16–29. doi: 10.1016/j.ajps.2018.07.003
57. Esfahani K, Roudaia L, Buhlaiga N, Del Rincon SV, Papneja N, Miller WH Jr. A review of cancer immunotherapy: from the past, to the present, to the future. Curr Oncol (2020) 27(Suppl 2):S87–97. doi: 10.3747/co.27.5223
Keywords: KLF3, pan-cancer, prognosis, immunotherapy, tumor microenvironment, pancreatic cancer
Citation: Zhu J, Teng H, Zhu X, Yuan J, Zhang Q and Zou Y (2023) Pan-cancer analysis of Krüppel-like factor 3 and its carcinogenesis in pancreatic cancer. Front. Immunol. 14:1167018. doi: 10.3389/fimmu.2023.1167018
Received: 15 February 2023; Accepted: 10 July 2023;
Published: 03 August 2023.
Edited by:
Saleh AlGhamdi, King Fahad Medical City, Saudi ArabiaReviewed by:
Ghanbar Mahmoodi Chalbatani, Tehran University of Medical Sciences, IranCopyright © 2023 Zhu, Teng, Zhu, Yuan, Zhang and Zou. This is an open-access article distributed under the terms of the Creative Commons Attribution License (CC BY). The use, distribution or reproduction in other forums is permitted, provided the original author(s) and the copyright owner(s) are credited and that the original publication in this journal is cited, in accordance with accepted academic practice. No use, distribution or reproduction is permitted which does not comply with these terms.
*Correspondence: Yeqing Zou, em91eWVxaW5nMzM2NkAxNjMuY29t
†These authors have contributed equally to this work
Disclaimer: All claims expressed in this article are solely those of the authors and do not necessarily represent those of their affiliated organizations, or those of the publisher, the editors and the reviewers. Any product that may be evaluated in this article or claim that may be made by its manufacturer is not guaranteed or endorsed by the publisher.
Research integrity at Frontiers
Learn more about the work of our research integrity team to safeguard the quality of each article we publish.