 Reut Levi
 Shirit Dvorkin
 Yoram Louzoun
- Department of Mathematics, Bar Ilan University, Ramat Gan, Israel
Introduction: H chain rearrangement in B cells is a two-step process where first DH binds JH, and only then VH is joined to the complex. As such, there is no direct rearrangement between VH and JH.
Results: Nevertheless, we here show that the VHJH combinations frequency in humans deviates from the one expected based on each gene usage frequency. This bias is observed mainly in functional rearrangements, and much less in out-of-frame rearrangements. The bias cannot be explained by preferred binding for DH genes or a preferred reading frame. Preferred VH JH combinations are shared between donors.
Discussion: These results suggest a common structural mechanism for these biases. Through development, thepreferred VH JH combinations evolve during peripheral selection to become stronger, but less shared. We propose that peripheral Heavy chain VH JH usage is initially shaped by a structural selection before the naive B cellstate, followed by pathogen-induced selection for host specific VH-JH pairs.
1 Introduction
The humoral adaptive immune system is composed of B cell clones carrying different B cell receptors (BCR) (1). Within each clone, specific B cells can further differ through somatic hypermutations (SHM) (2) and affinity maturation. These diverse BCR are often denoted the B cell repertoire and the sequencing of such repertoire is often denoted rep-seq (3). A wider repertoire is argued to be helpful to recognize more antigens, and as such protect the body more efficiently against pathogens (4). Thus, the variety and diversity of this repertoire may be crucial for host health (5). Each BCR is composed of heavy (H) and light (L) chains, with the H representing most of the diversity (6). This diversity is obtained initially by the combination of VH (variable), DH (diversity), and JH (joining) gene segments out of many candidates available. The diversity ofthe L chain is the result of only V-J pairing and junctional diversity (7–9).
The diversity of the H chain is also affected by the choice among multiple possible DH genes. In contrast with T cells, DH genes have a large germline diversity contributing to the total repertoire diversity (10), together with the junctional diversity in the VH-DH and DH-JH junctions. This initial repertoire is modified through multiple selection stages either within the bone marrow or in the peripheral blood and lymph nodes to produce the observed mature naive, memory, and plasmablasts repertoires (11).
The Pre- and Pro-B cell repertoires resulting from V(D)J rearrangement are far from being random, and they differ from both the out-of-frame (OF) and naive repertoires, which in turn differ from the memory repertoire (12). The difference between naive and memory repertoires may be the result of peripheral selection mechanisms, including affinity maturation and SHM (13). However, the mechanisms shaping the repertoire between the pro and pre-B cells and the naive B cells are still not well characterized.
We here focus on a specific aspect of the repertoire – the pairing between VH and JH gene usage in the H chain. Restricted V(D)J usages are associated with different important diseases. Among many others, South Indian patients with precursor B-cell acute lymphoblastic leukemia frequently use specific VH-DH-JH rearrangements (14). VH1-69 and VH4-59 genes are over-expressed in hepatitis C virus (HCV) related B cell disorders and there is a disease-associated VHDHJH usage in HCV patients without clinically detectable lymphoproliferation (15). B lymphocytes (PBL) cells of HIV-infected patients indicate a decrease of the VH3 gene subfamily expression (16).
We have previously shown such a strong bias in VB and JB pairing in T cells (17), based on structural selection in the β chain. We hypothesize a similar bias in B cells towards specific VH-JH combinations that are more frequent than expected from the VH and JH probabilities. Such a pairing has been previously described in the L chain. The L chain lacks a D segment, it can go through multiple V-J rearrangements producing an expected pairing between V and J (18, 19). However, the BCR heavy chain is composed of multiple ordered VH, DH and JH gene segments. The first recombination event in the heavy chain is DH-JH recombination, followed by the joining of VH segment. Therefore, there is no direct link between the VH and JH segments (20). The rearrangement of DH and JH may depend on their rearrangement signal, since different heptamer or nonamer combinations may have distinct rearrangement probabilities. The same holds true for DH and VH. However, in the H chain, there is no direct rearrangement between VH and JH. As such, unless mediated by the DH, one would not expect VH to have a preferential bias to specific JH genes. Moreover, following the rearrangement, the entire DH locus is erased (except for the rearranged DH gene). As such, in contrast with the L chain, there is a single rearrangement step, and not consecutive rearrangements that may induce a preference for distal to distal VH to JH binding (19, 21). Furthermore, following the deletion of the DH genes during rearrangement, a single rearrangement step can occur. Thus, one could expect VH and JH usage to be independent in the H chain. We show here that this is not the case. Instead, specific VH genes are consistently associated in different donors with the different JH genes.
A simple pairing mechanism between VH and JH could emerge from the DH germline diversity. Assume that a specific JH binds preferentially a specific DH and similarly a specific VH would bind preferentially the same DH, the VH and JH would then appear to preferentially pair one with the other. We here show that such a mechanism does not explain the strong pairing among functional rearrangement. Similarly, antigen-induced selection cannot explain the observed bias in early developmental stages. We suggest that as in the case of T cells, this selection is induced by a preference for specific structures, and show an association between the length and polarity of VH - JH pairs and their selection (Figure 1).
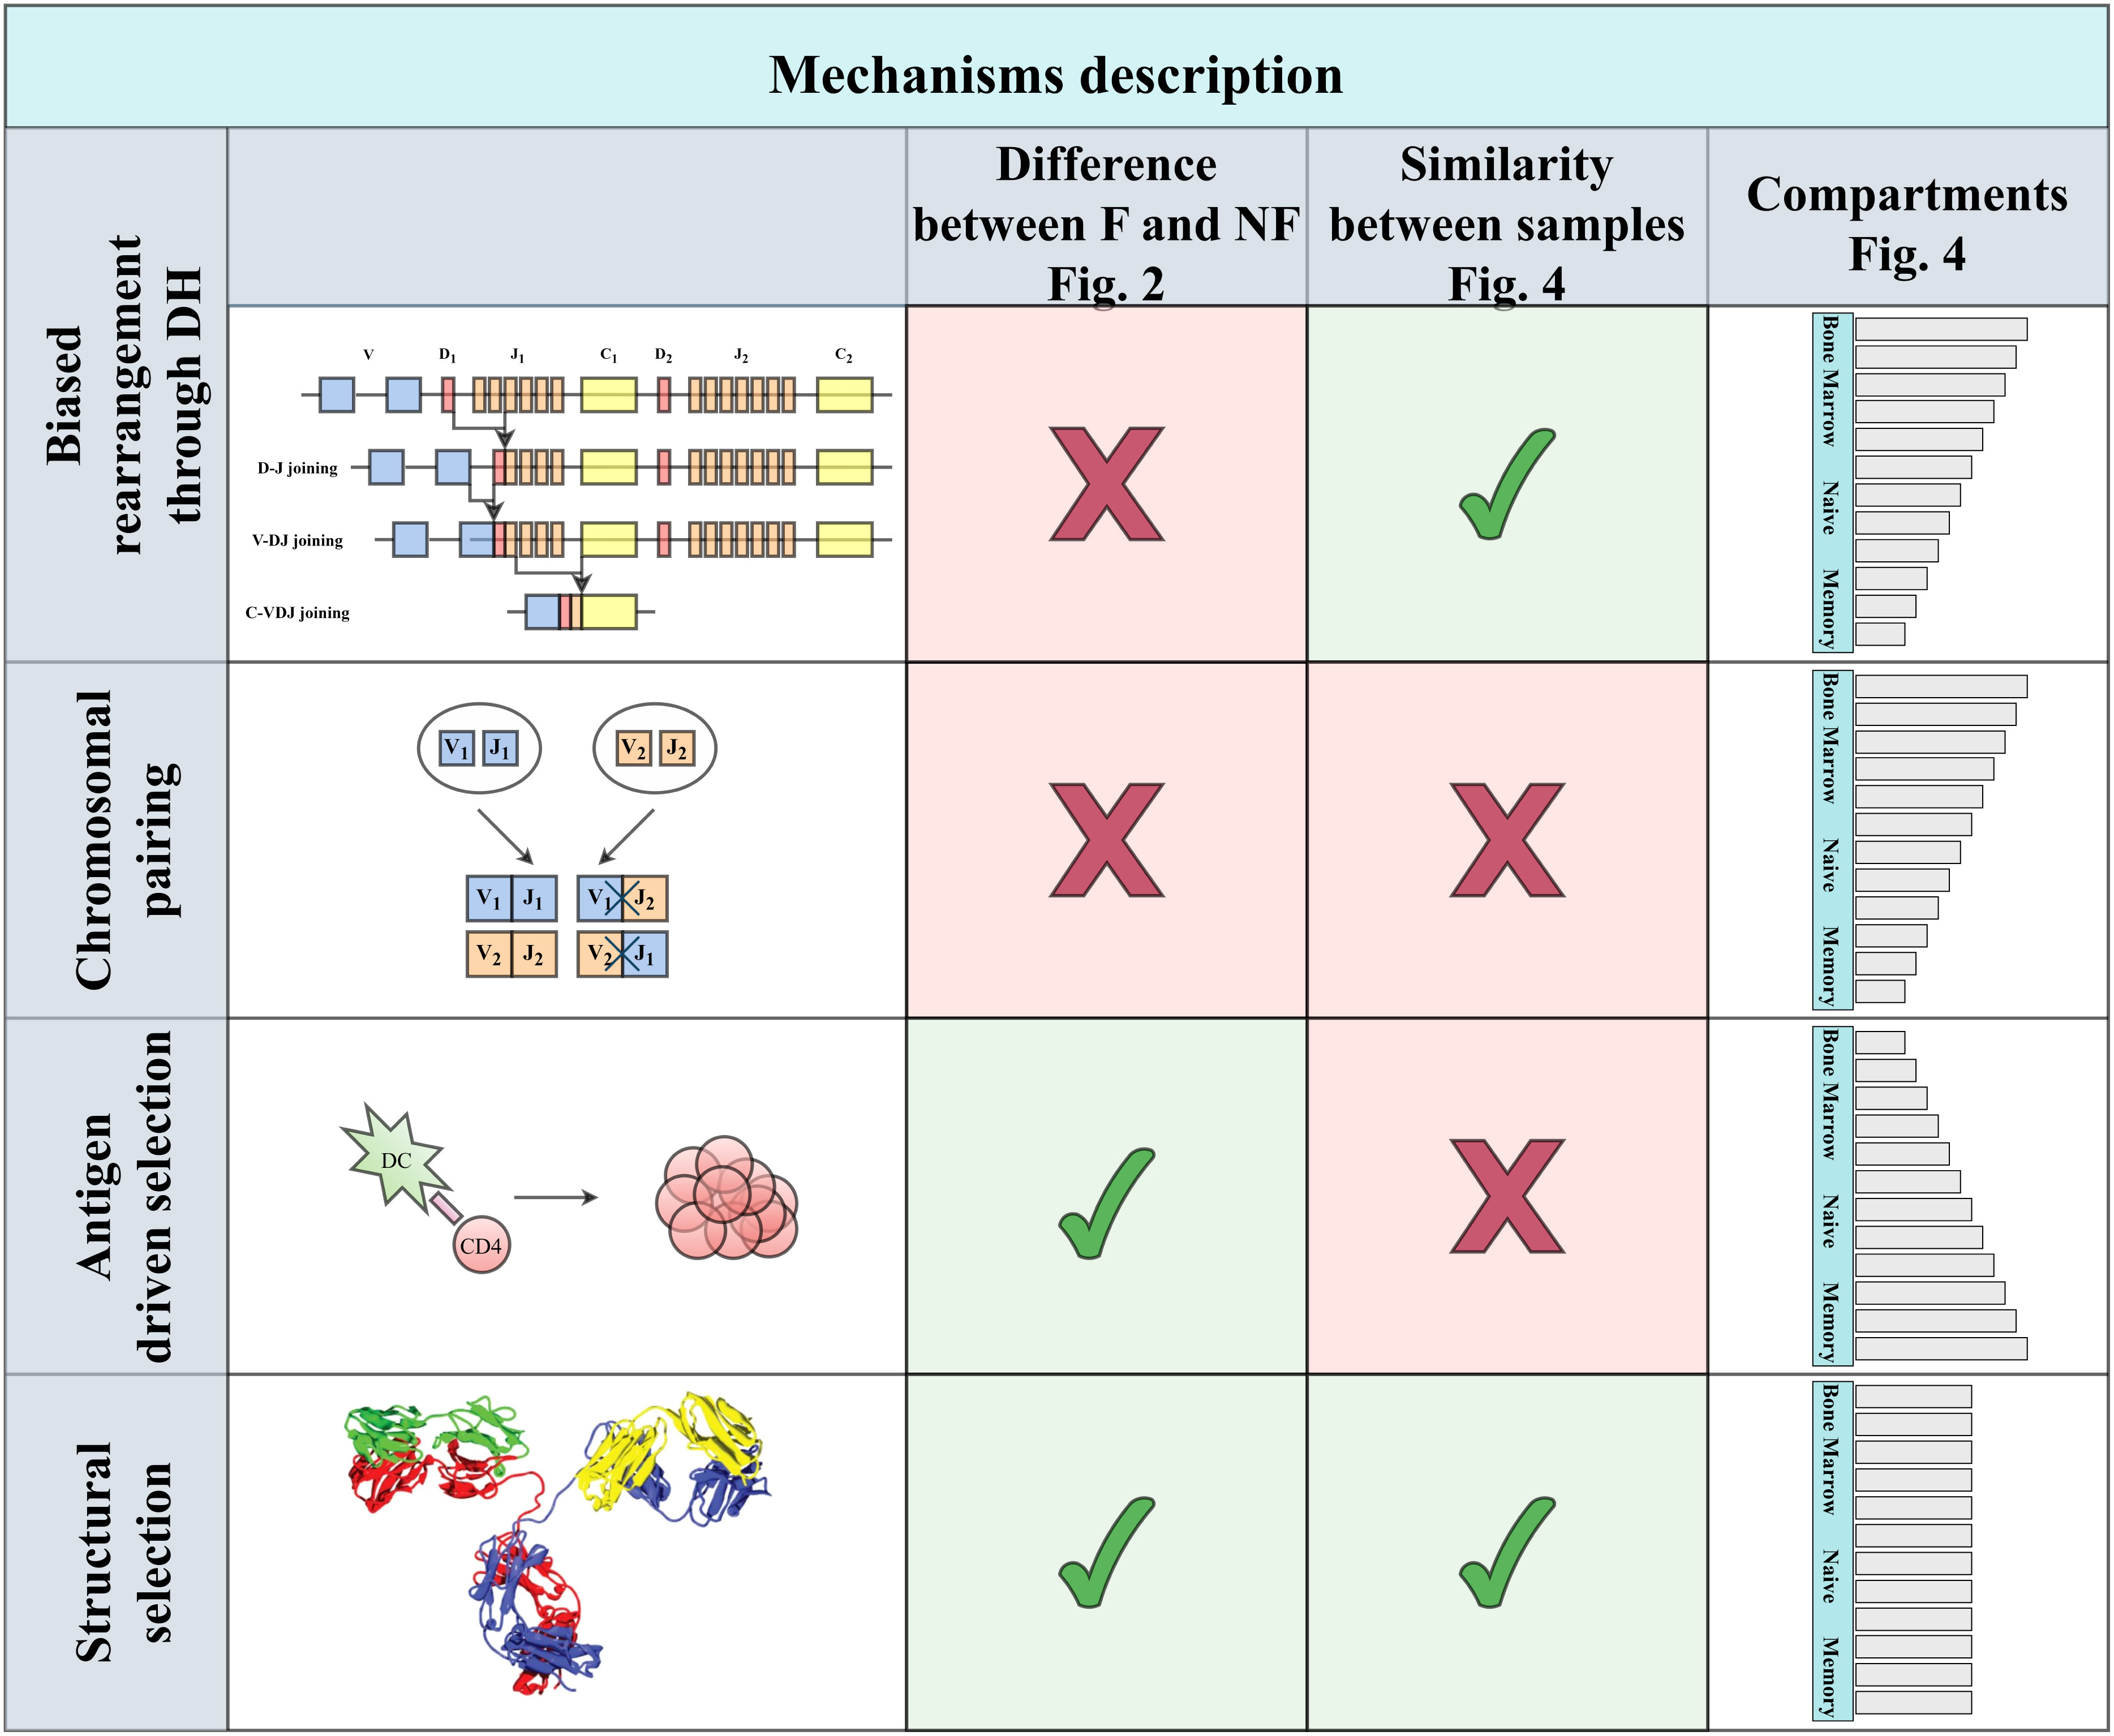
Figure 1 Four main types of explanations can be proposed. The first two are genetic: Either some bias in rearrangement or difference in haplotypes in the two chromosomes, leading to biases following the pairing only within a chromosome. These two mechanisms are expected to affect functional and non-functional clones similarly. While the first is expected to lead to similar biases among patients, the second is expected to differ, based on the chromosomal composition. An alternative mechanism may be antigen-driven selection that will be limited to functional rearrangement, and mainly in the memory compartment, in contrast with the first two that will be mainly in the naive repertoire. Finally, structural selection on the properties of the resulting H chain will lead to similar patterns among patients that will be mainly in the functional compartment, as indeed occurs.
2 Methods
2.1 Notation
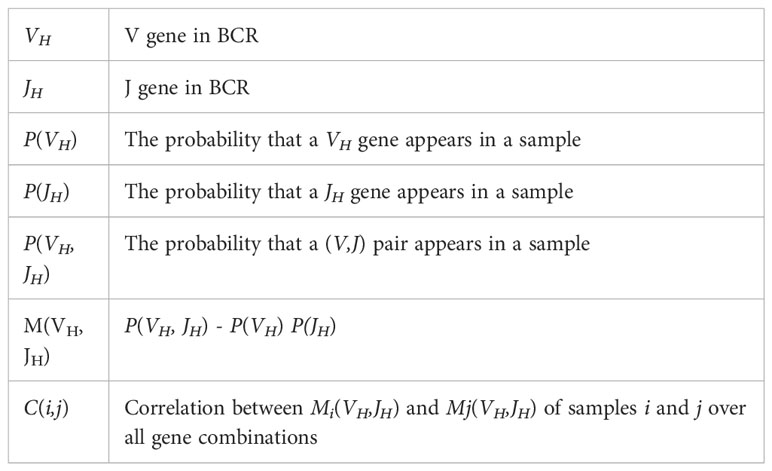
We used the following notation throughout the analysis.
2 Samples studied
We used one published sample Peripheral Repertoire (PREP) (22) and one partially published sample Human Pancreas Analysis Program (HPAP) (23) from organ donors that do not require an IRB in the US, where the experiment was performed.
2.2.1 HPAP samples
DNA was extracted from cryopreserved single-cell suspensions from HPAP donor (24) spleen samples using a Gentra Puregene kit (Qiagen, catalog no. 158767) following the manufacturer’s instructions. Immunoglobulin heavy chain amplifications were performed on gDNA using primers situated in FR1 and JH as described previously (25, 26) Sequencing was performed using an Illumina 2× 300-bp paired-end kit (Illumina MiSeq Reagent Kit v3, 600-cycle, Illumina MS-102-3003). Additional data on HPAP samples can be found on PANC-DB (https://hpap.pmacs.upenn.edu).
Reads were filtered, annotated, and grouped into clones according to the AIRR protocol (see full AIRR Protocol (26). Briefly, paired-end reads were aligned using pRESTO v0.6.0 (27). Short and low-quality reads were removed, and low-quality bases were masked (a quality score threshold of 20). IgBLAST v1.17.0 was used to align and annotate the resulting high-quality sequences (28), using the IMGT (Jan 2019) as a reference (29). ImmuneDB v0.29.10 (30) was used for clonal inference and downstream analysis. Clones were defined as sequences with similar VH gene, JH gene, and CDR3 length from each donor that were clustered using hierarchical clustering and had85% or higher similarity in their CDR3 amino-acid sequence. Clones with one sequence copy at the subject level were removed.
2.2.2 PREP
Following Rubelt et al. (22), we analyzed the data in (31). Briefly, participants signed an informed consent under ethical approval (KEK-ZH 2015-0555 and EKNZ 2015-187). Blood samples (5-9 mL) were collected from 53 healthy participants at a single time point. The patients were aged 6 months to 50 years. Sequencing and preprocessing of the data were performed as in (31). In short-RNA was amplified using VH FR1 and P5 primers, and sequences on an Illumina platform. All details are available in (31).
2.3 Association measure between VH and JH
For each sample, the observed relative frequency of all (VH,JH) pairs P (VH,JH) and the expected frequency assuming random pairing were compared. The latter was calculated as the product of the relative frequencies of VH and JH, P(VH)P(JH). We computed for each sample:
The probabilities were defined per sample and at the clone level (i.e., using only clones in this sample, where P(VH) is defined to be the number of clones with this specific VH divided by the total number of clones in the sample); and irrespective of the clone size, each clone was counted once. In our analysis of the M(VH,JH) distribution, we converted all the values to percentages by multiplying them by 100. Only VH and JH genes appearing in the sample were considered (i.e., if a gene was completely absent from a sample, it was ignored).
For example, assume a sample with 10 clones, 2 genes of VH (V1, V2), and 2 genes of JH (J1, J2), where we have 6 clones with V1, 4 clones with V2, 7 clones with J1 and 3 clones with J2. At the pair level, there are 4 (V1, J1), 2 (V1, J2), 3 (V2, J1)and one (V2, J2) clones. In order to calculate M(V1,J2), we first calculate P(V1,J2), P(V1) and P(V2). In our case, P(V1,J2) = 0.2 - 2 clones divided by the total of 10 clones in the sample. Similarly, P(V1) = 0.6 and P(J2) = 0.3. Therefore, .
2.4 Correlation between samples
To measure the similarity in the deviation from a random pairing between different samples, we calculated the Spearman correlation coefficient for all possible pairs of samples based on the M(VH,JH) values.
Given two samples, i and j, where each contains a subset of the VH and JH genes VHik, JHiK, VHjk, JHjk. For each pair of samples, the common (VH,JH) pairs were taken s.t.
We first computed the Mi(VH,JH) and Mj(VH,JH) for all pairs in the set S. Then, we calculated the Spearman correlation for these pairs:
For example, suppose we have 2 samples (i.j) with two genes of VH and JH each (V1, V2, J1, J2), where all the pairs (V1, J1), (V1, J2), (V2, J1), (V2, J2) exist in both files. We further assume that we obtained that M(VH,JH) is 0.2, 0.4, 0.1,0.6 for the pairs above in the first sample and 0.1, 0.5, 0.2, 0.8 in the second sample. We determine how similar the deviation from random pairing is between the two samples by calculating the correlation between their respective vectors. i.e.,…
2.5 Detection of specific VH-JH pairs that deviate from random pairing
We calculated the probabilities P(VH,JH) and P(VH)P(JH) for each (VH,JH) pair across all samples to identify any specific pairs that deviated from the null model of random pairing. Next, over all samples, a paired T-test on P(VH,JH) and P(VH)P(JH) was performed for each pair separately. Finally, we used the Benjamini-Hochberg correction benjamini1995controlling to adjust the obtained p-values. We considered pairs with a corrected p-value less than 0.01 as significant.
2.6 Null models
To generate a null model for our analysis, we scrambled the VH and JH segments within the VHJH pairs. This involved randomly reassigning the VH genes of the different clones in each sample. Specifically, we listed all clones and performed a permutation on the JH gene associated with each VH gene within a given sample. Scrambling was performed at the clone level, and not at the read level (i.e. we did not scramble reads within a clone). We ignored the clone size in current the analysis.
2.7 Biochemical features
We used only the functional (F) clones for the HPAP dataset, and each isotype separately (IGHA, IGHD, IGHG and IGHM) for the PREP dataset. For each possible pair in a given file, we calculated the combined lengths of VH and JH. Furthermore, we calculated the total Kyte Doolittle (KD), Molecular Weight (MW), and Isoelectric Point (IP) values for every CDR3 amino acid in each pair and averaged the results. This was done for each file and pair. Next, we determined the M(VH,JH) values for each VH,JH pair within a given file and computed the average for all pairs in the dataset. A Spearman correlation coefficient was then computed between the mean M(VH,JH) and the sum of all gene lengths, KD, MW, and IP values.
2.8 Statistical analysis
● In order to evaluate the correlation between different samples, only the pairs that were present in both samples were considered. For each pair (VH,JH), we computed both M(VH,JH) and M1(VH,JH). Here, M1 is the metric used for themixed data in both the real data and the null model. Next, we computed the Spearman correlation coefficient for these two sets of data.
● The two-sided Kolmogorov-Smirnov statistic on two samples (32) was used to test whether the distribution of M(VH,JH) on the real data differs from that in the null model.
● To examine whether the standard deviation of M(VH,JH) on the real data is different from the standard deviation of M(VH,JH) on the null model, we used a two-sided T-test on two related samples of scores. Using this test, we werealso able to determine which pairs have a signal. P(VH,JH) and P(VH)P(JH) were calculated and the above test was performed separately for each pair (VH,JH) and P(VH)P(JH). We applied the Benjamini-Hochberg correction for multipletests (33).
● To evaluate whether the distribution of correlations in the functional (F) clones, non-functional (NF) clones, and null model significantly differed, we performed a one-way ANOVA test on the correlation values. In addition, to test whether the correlations within a patient are distinct from the correlations across different patients, we applied the two-sided T-test for the means of two independent samples of scores.
● We used a one-way Chi-square test in order to check whether the (VH,JH) pairs with the most significant deviation from random pairing (p<0.01) over and under-represented are consistent across datasets.
● To test the correlations between M(VH,JH) and the biochemical features, we divided the data into 20 bins based on the chemical values distribution (KD, MW, IP, and sum of genes lengths) and used a Wilcoxon signed-rank test, for M(VH,JH) for each bin.
2.9 Mutual Information
The Mutual Information between two random variables X and Y, denoted as MI(X;Y), is defined as the reduction in uncertainty about one variable (e.g., X) given the knowledge of the other variable (e.g.,Y). In other words, it measures how much knowing the value of one variable helps us in predicting the value of the other variable. It is defined as:
where p(x,y) is the joint probability function of X and Y, and p(x) and p(y) are the marginal probability mass functions of X and Y, respectively.
A key property of Mutual Information is that it is non-negative – MI(X;Y) ≥ 0. MI(X;Y) = 0 indicates that X and Y are statistically independent.
● High Mutual Information: MI(X;Y) is close to the maximum value (the minimum between the entropy x and of y) with a strong dependency between the variables. In this case, knowledge of one variable provides significant information about theother.
● Low or Zero Mutual Information: MI(X;Y) values close to zero indicate that the variables are independent of each other. Knowing the value of one variable does not offer any useful information about the other.
3 Results
3.1 VH,JH usage is biased in the H chain
To study whether VH-JH pairing deviates from the random pairing, we used 2 sample sets, denoted HPAP and PREP datasets. Each dataset contains several patients (see Methods). The HPAP sample contains functional and non-functional clones. The PREP dataset contains only functional clones. The dataset underwent a filtering step, where all samples with less than 1,000 clones were removed. To avoid biases introduced by differential amplification, the frequency of each clone in each donor was ignored during the analysis (the results at the single sequence level, and not at the clone level are similar and presented in Supplementary Material Figure S1). Using two fields gene notation (e.g., V01-02 and J01-02), VH gene and JH gene representations were grouped, and allelic differences were ignored (V01-02:01 → V01-02). We will further show that the deviation from random pairing is not the effect of allele differences (Figure 2). The second dataset is a set of peripheral repertoire divided into memory and naive clones and further divided by isotypes, denoted here as PREP.
We compared the VH,JH frequency distribution of functional (F) clones in each sample in the HPAP dataset and for each isotype separately (IGHA, IGHD, IGHG and IGHM) in the PREP dataset with the one expected under the null hypothesis of independent pairing. Specifically, we computed the marginal probability of each JH and VH gene (i.e., the probability that a randomly chosen clone would have a given JH - x-axis in Figure 2A or VH gene - y-axis), and multiplied them to obtain the expected value of the pair assuming independence P(VH)P(JH) (shown as the area of the rectangle in Figure 2A). As a schematic example, for the pair (V4,J2) in Figure 2A, the observed P(V4,J2) is larger (i.e., has more clones) than expected by P(V4)P(J2) (i.e., it is above the diagonal line in the observed vs. expected plot).
To systematically quantify this deviation, we computed for each (VH,JH) pair in a given sample:
M(VH,JH) is expected to be zero for random pairing. There can be deviations from zero due to finite-size effects. To test for such deviations, we compared the distribution of M(VH,JH) for the real clones to the distribution obtained from the null model, in which the VH and JH genes of the clones were randomly reassigned. This random scrambling was performed separately for each sample (see Methods). We observed that the distribution of M(VH,JH) for the real clones is consistently wider than the distribution obtained from the null model in all F HPAP and PREP repertoires (Figures 2B, D–G).
To quantify the difference between the real and null models of M(VH,JH) distributions, we calculated the standard deviation (std) and applied a paired T-test on the standard deviations of the real and null models across all samples in each dataset. The standard deviation of the functional (F) clones is consistently larger than the null model in all samples (Figures 2B, D–G for the HPAP and the PREP datasets, p-value 1e-10 for both datasets). To confirm the significant difference, a Kolmogorov-Smirnov test (32) on the distributions in the real data and the null model for all samples together was performed, which also yielded a very significant difference (p-value<1e-10 for both datasets).
In order to validate that the bias of VH,JH usage is not a result of genetic factors of different alleles on different chromosomes, we tested whether the bias in usage also exists in the non-functional (NF) clones. We computed the M(VH,JH) in the non-functional HPAP dataset, and found that while the distribution of M(VH,JH) for the F clones is much wider than for the null model, the results on the NF clones show no such difference. The distribution of M(VH,JH) for both the NF clones and for the null model is similar with no significant difference between the standard deviation of the NF clones and the null model (Figure 2C for the HPAP dataset, p-value 0.08). Furthermore, there is no significant difference between the distributionsas measured by the Kolmogorov-Smirnov test (p-value 0.94). Four simple mechanisms could be argued to explain the bias (Figure 1):
● Genetic mechanisms (any mechanism that is purely genetic), such as joint preference for DH genes by VH and JH. Genetic mechanisms would induce such pairing also in NF clones. Also, in such a case, we would expect the conditional distribution of VH, JH given DH to be independent. We will show that this is not the case.
● Pairing between alleles. Specific VH and JH alleles are on one chromosome and have a high expression level. When averaging over both chromosomes, this would look like a bias for them. Again, such a mechanism would affect F and NF clones similarly. In such a case, we would also expect the pairing to differ among individuals. We will further show that this is not the case.
● Antigen-driven selection. We would expect the bias to be limited to memory or activated cells. We further show that such a bias exists and is already large at the naive stage.
● Structural selection for the stability of BCR or basal binding to antigens expressed in the bone marrow.
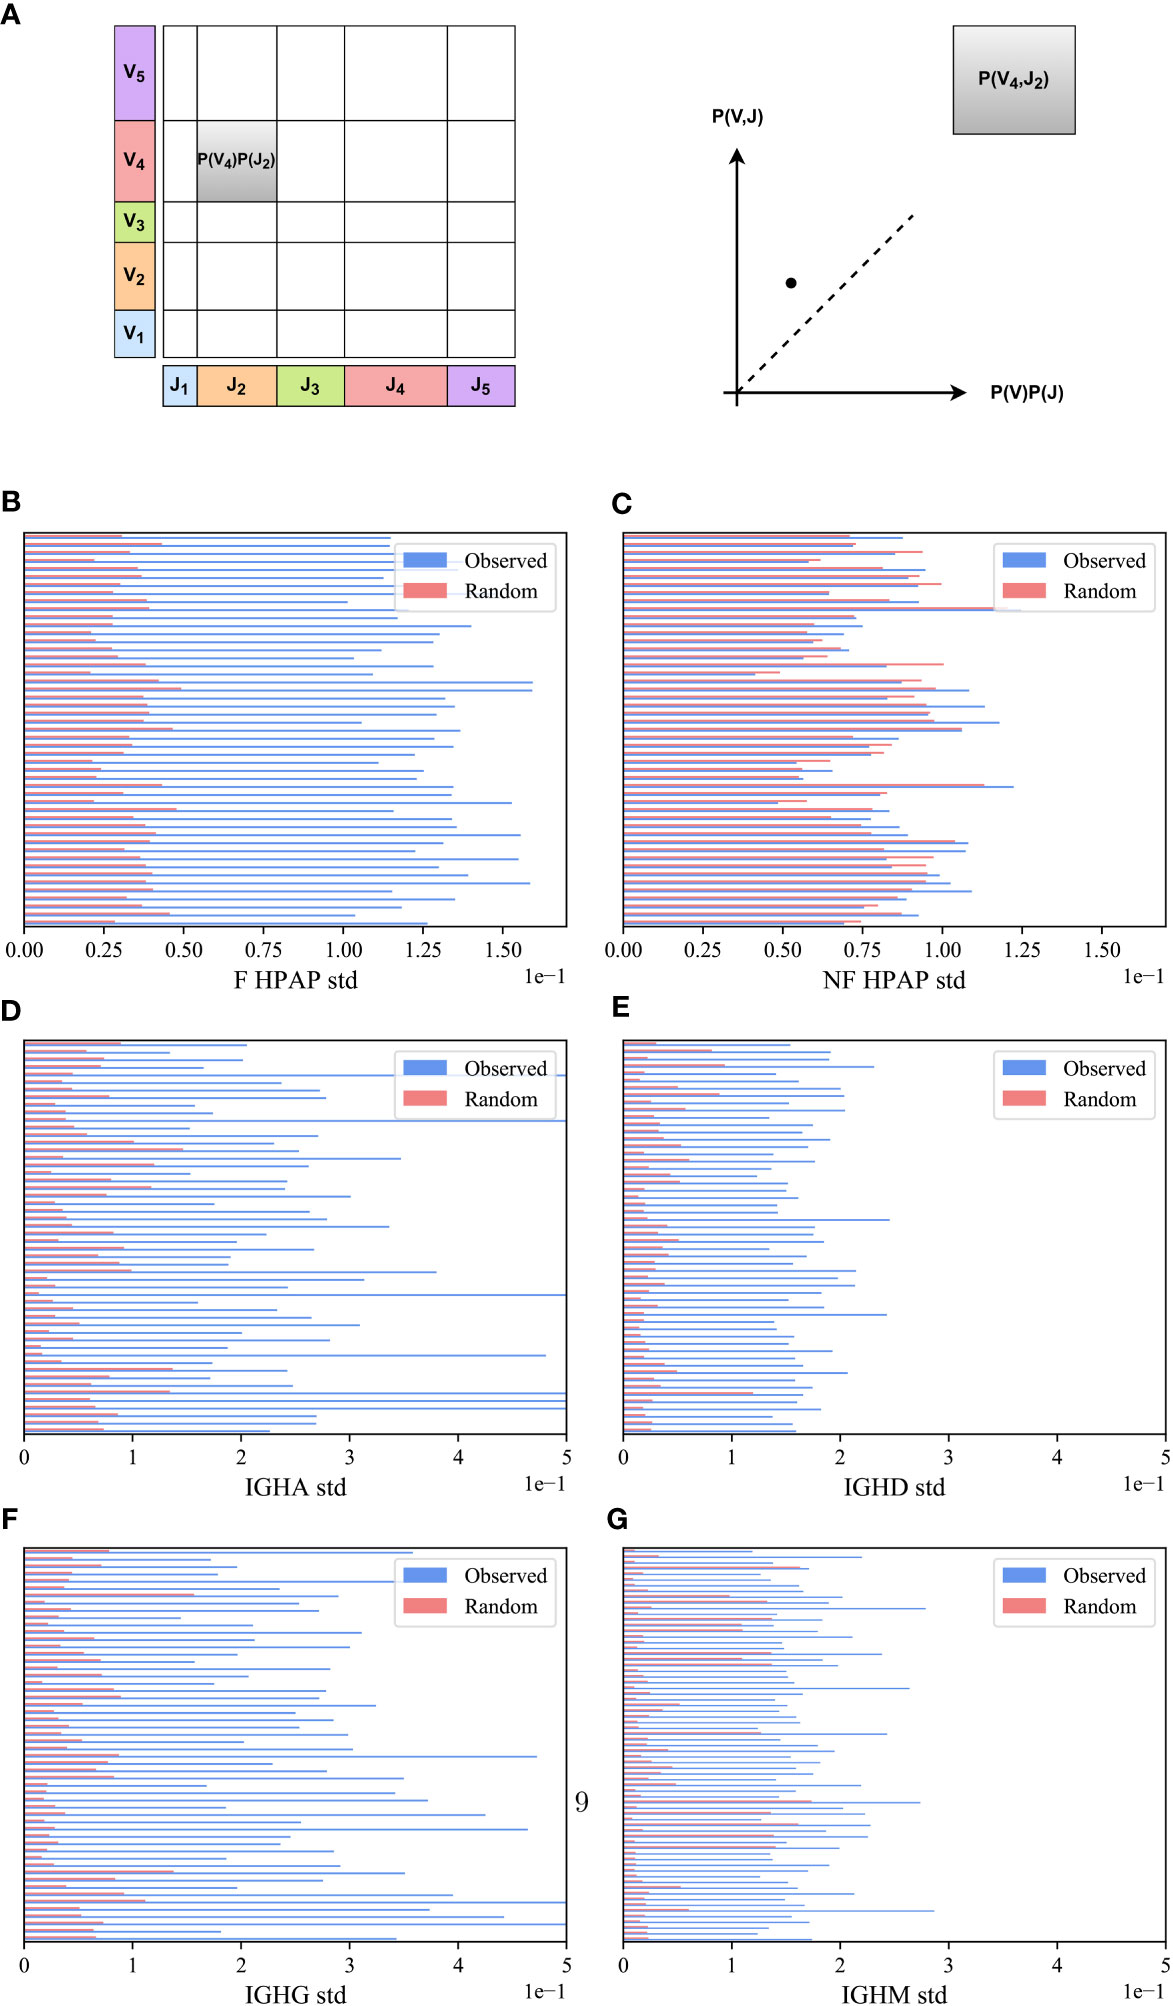
Figure 2 M(VH,JH) bias. (A) Schematic explanation M(VH,JH) measure. We calculated the proportion of clones using a particular JH and VH gene in a sample and represented it as a point on a graph, where the JH gene proportion is on the x-axis and the VH gene proportion is on the y-axis. We multiplied these proportions (i.e., the size of rectangles) and compared them with the actual number of clones that used a specific VH,JH gene pair. (B–G) The standard deviation (std) of VH,JH values for the HPAP dataset (B, C) and the PREP dataset for each isotype separately (D–G). The blue bars describe the real F clone values (B, D–G) and the real NF clone values (C) while the pink bars represent the null model. Each row represents a sample in the HPAP dataset.
3.2 VH,JH pairing through DH
To further disqualify genetic mechanisms, we tested the possibility that the bias is induced by preferred DH pairing. For example, if a given DH binds only a given JH and only a given VH, then this VH-JH pair will be over-expressed.
To determine if the correlation with DH genes is indeed the cause of the VH,JH pairing, we compared P(VH,JH) vs. two scenarios:
● Random pairing: The probabilities of a VH,JH pair is the product of their marginal probabilities: P(VH,JH) ~ P(VH)P(JH).
● Pairing through DH genes: Suppose that JH and DH are paired with certain preferences, and in addition, DH and VH are paired with other preferences. One can thus compute: .
To test for the effect of D-based pairing, we used the PREP dataset. We computed the standard deviation of , where P(VH,JH) was either the observed one, or computed according to one of the two models above, and P(VH)P(JH) is the same for all models. The standard deviation of the observed data is the highest for the real clones (Figure 3A), followed by the model based on DH pairing, followed by the null model (ANOVA test p<1e-10 for each isotype separately, paired T-test between real clones and the model based on DH pairing p<1e-10).
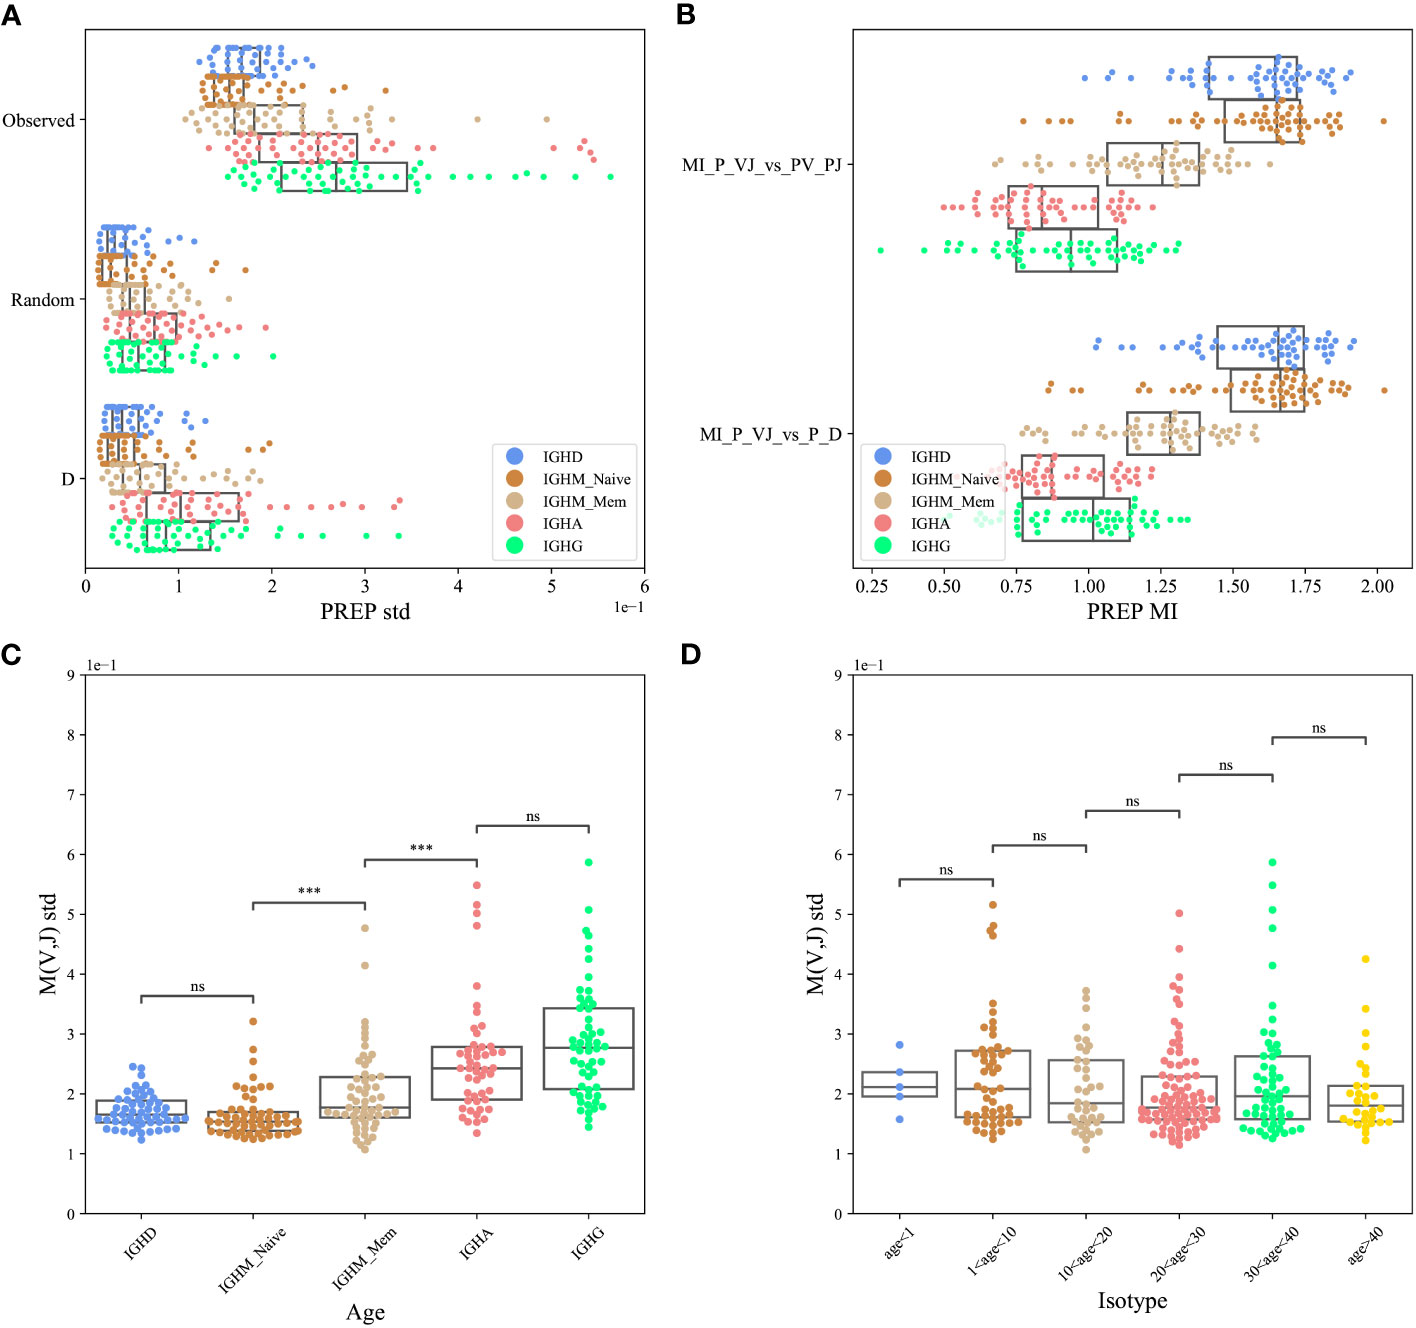
Figure 3 VH, JH pairing through D (PREP dataset). (A) The standard deviation (std) of the M(VH,JH) values for the F clones, where P(VH,JH) was either the observed one or computed according to one of the two models described above (random pairing and pairing through DH genes). The result is shown for each isotype separately. (B) The Mutual Information (MI) between the log of the observed and expected P(VH,JH) relative frequencies in those three cases for the F clones for each isotype separately. (C, D) The standard deviation of M(VH,JH) values for eachisotype separately (C) and for different age groups (D), where ‘***’: p-value<0.001 and ‘ns’: p-value ≥0.05.
A caveat of the M(VH,JH) value is that it is mostly affected by the large clones. To address that, we computed the Mutual Information (MI) between the log of the observed and expected P(VH,JH) relative frequencies in the models above for each isotype separately. The real data is similar to the two models above (Figure 3B, T-test, p > 0.05 for all isotypes - showing that there is no difference between the models)
These results combined with the absence of bias between VH and JH in the NF clones suggest that any bias in the F clones is not due to rearrangement or to any purely genetic mechanism.
3.3 Development of bias
Any kind of selection affecting the VH and JH gene usage is expected to induce deviation from random pairing. As such, even if there is a strong deviation in the naive repertoire, we expect the deviation to grow following antigen-induced peripheral selection. To test that, we compared the standard error of M(VH,JH) for isotype-switched cells and for naive and memory IgM repertoires. One can clearly see a consistent development of the bias through development (Figure 3C, T-test between following compartments p<0.001, between the naive and memory and between the memory and isotype switched cells, but no difference between IGHD and naive IGHM, and no significant difference between IGHG and IGHA). We further tested if the bias is accumulating or decreasing over the age. We found a slight yet non-significant decrease (Figure 3D, T-test between following compartment - non-significant).
3.4 Correlation of VH,JH bias between and within patients and isotypes
If, indeed, the VH,JH bias is induced by a structural selection, it should be similar across hosts. Alternatively, if the pairing is antigen-driven, or by allele preference, one would expect it to be uncorrelated between hosts. We computed the Spearman correlation coefficient between M(VH,JH) values for all sample pairs from different hosts in the HPAP dataset, and computed the distribution of the correlations (Figure 4A) for the F clones (blue bars), the NF clones (beige bars) and the null model (pink bars). Only the shared (VH,JH) pairs were taken into account when computing the correlations, for each pair of samples. As expected, the NF and the null model had distribution distributed around 0. In contrast, the correlation histogram of the F clones is centered around 0.5 for the HPAP (ANOVA test p<1e-10 for all groups).
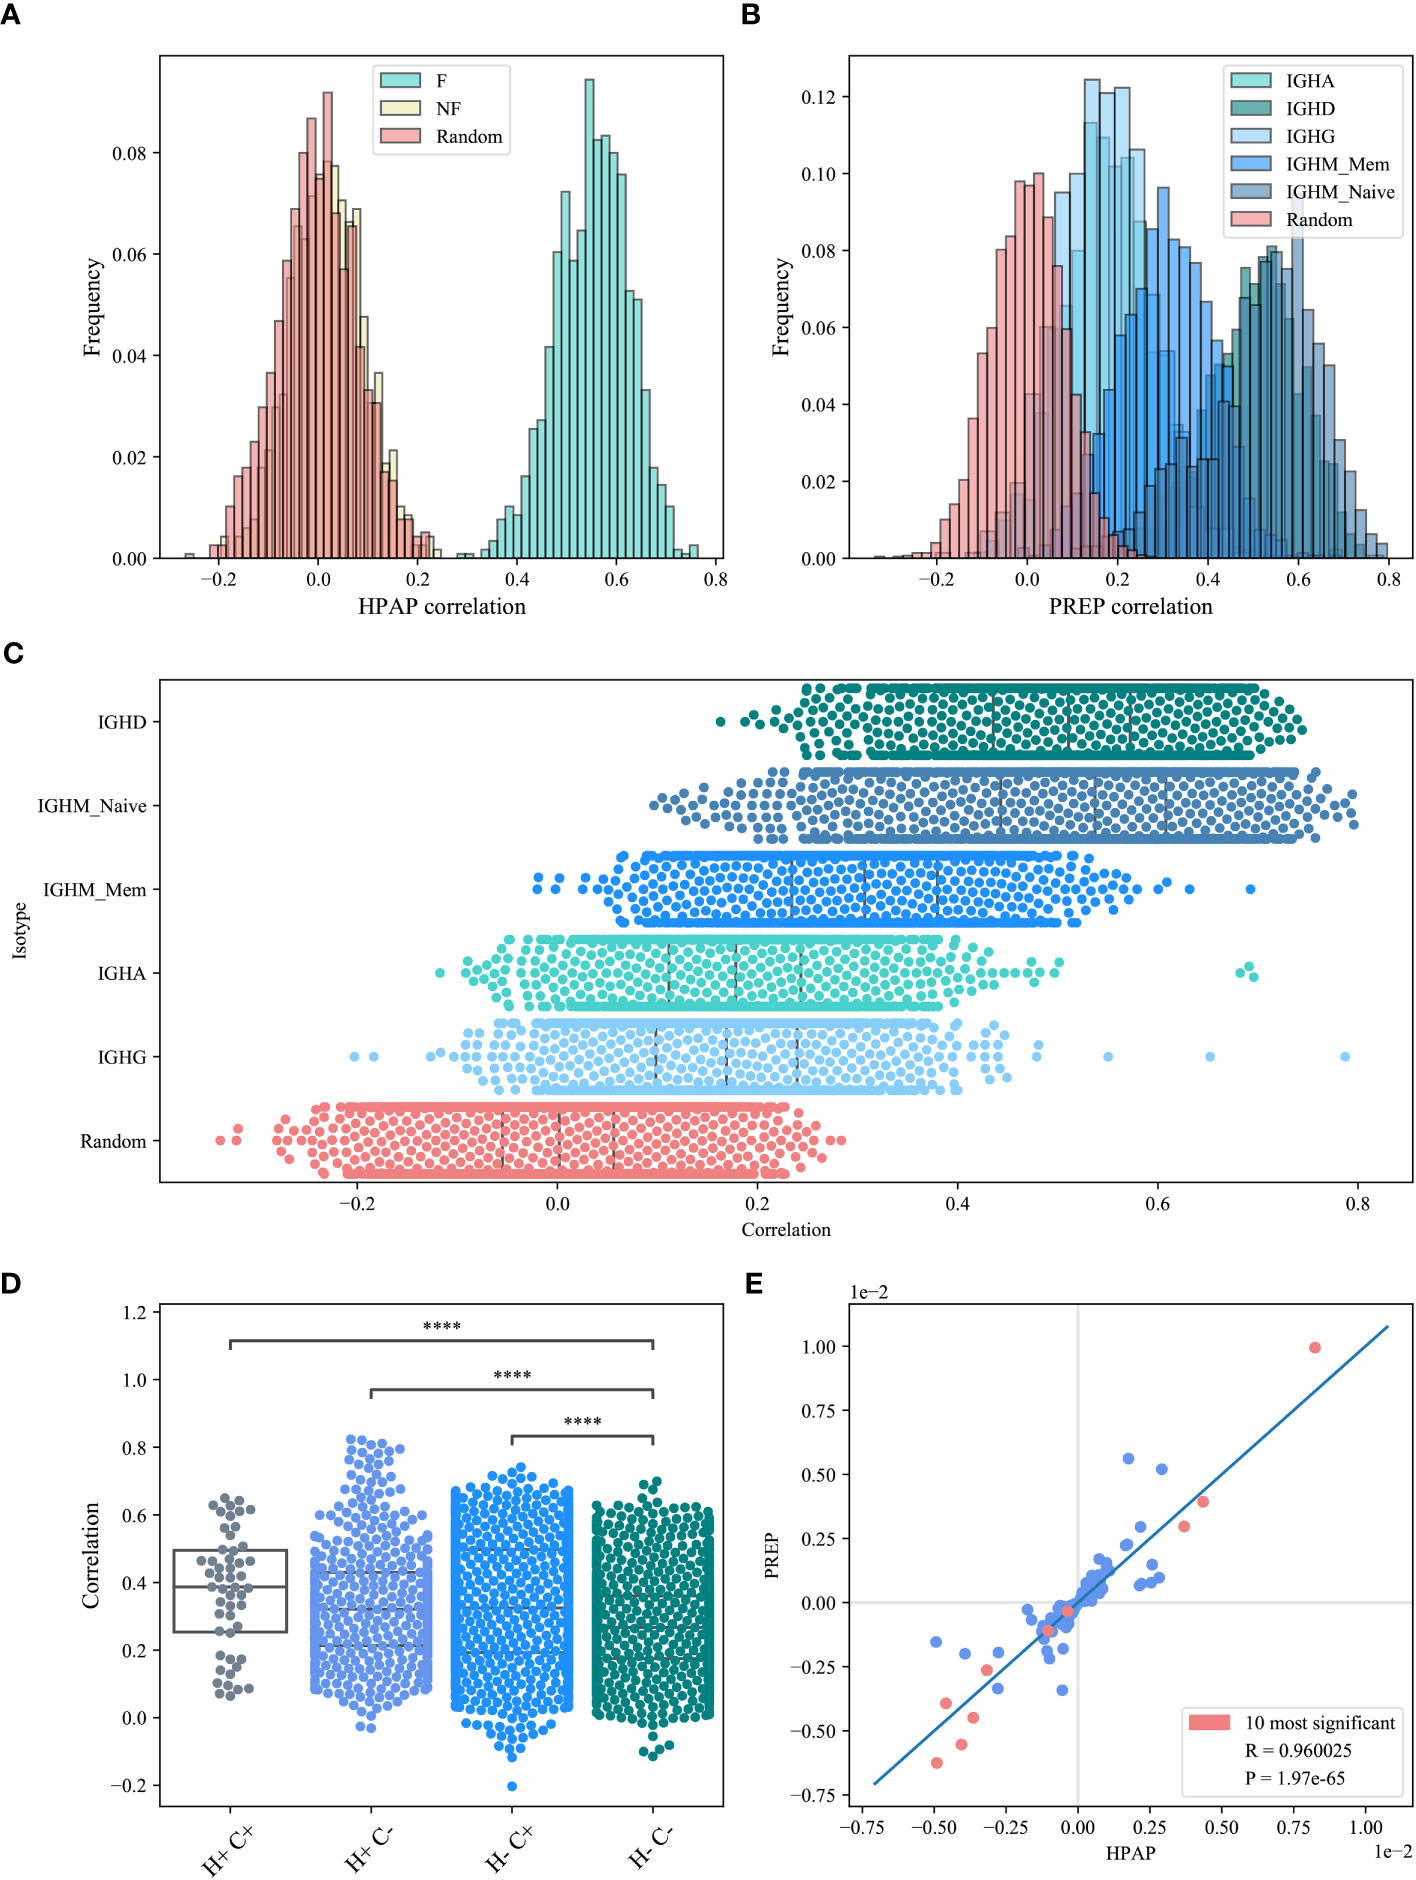
Figure 4 M(VH,JH) correlation. (A, B) The correlations histogram of the M(VH,JH) values for the HPAP dataset (A) and the PREP dataset (B). The blue shade histograms represent the F clones, the beige histogram is the NF clones and the pink histogram represents the null model. (C) Correlations of M(VH, JH) values for the PREP dataset for each isotype separately. (D) Correlations of M(VH, JH) values for the PREP dataset within and between hosts and compartments, where H+ represents within host, H- represents between hosts, C+ represents within compartment, C- represents between compartments. Star symbols follow the previous plot. (E) M(VH, JH) values between HPAP and PREP functional datasets. The pink points represent the common pairs of the 10 most significant pairs between these two datasets.
We repeated the analysis for the PREP samples for each isotype (Figure 4B, colored in blue shades). We also split the IGHM isotype into memory and naive and calculated the correlation for each of them separately (Figure 4C). The similarity starts high and then decreases through development, suggesting a shared structural selection followed by host-specific antigen-induced selection that increases the deviation from random pairing, but decreases the similarity between repertoires.
We further explored the correlations between the values of M(VH,JH) among hosts and isotypes (further denoted as compartment - all isotypes and naive and memory IgM separately) and compared the M(VH,JH) correlations within and between compartments and within and between hosts. The highest correlations are indeed within a donor and a compartment (T-test p<le-10 vs H-C-), followed by correlations within compartments (H-C+) and the correlations within hosts (H+C-) that were both higher than the one between compartments (H-C-) (0.337 and 0.334 vs 0.27 on average, T-test p<le-10 - Figure 4D).
If the selection is indeed structural, we expect the over and under-represented pairs to be similar between datasets. We analyzed all the (VH,JH) pairs with the most significant deviation from the null model (p<0.01). Indeed, the most significant pairs overlap in the two datasets studied here (117 overlapping pairs vs 63.23 expected randomly, chi-square p<1.36e-11). In addition, all significant pairs that overlap between the two data sets have the same deviation sign (Figure 4E).
We further analyzed the common significant pairs (corrected p-value<0.01) between the two datasets, and compared M(VH,JH) values among datasets. M(VH,JH) is highly consistent among the datasets (Spearman Correlation Coefficient 0.96, p<le-10, Figure 4E. The pink points represent the common pairs of the 10 most significant pairs between each of the datasets).
3.5 VH,JH pairing is associated with biochemical properties of receptors
If selection is structural, we expect associations between the VH,JH pairing (as measured by the M(VH,JH) values) and the structural properties of the receptors. We computed for the receptor within each (VH,JH) pair in each sample the molecular weight (MW), the average length (defined to be the sum of VH and JH genes length in amino acids), the charge (as measured by the iso-electric point - IP), and the hydrophobicity (defined through the kyte doolittle - KD score). The measures were implemented using the contribution of each amino acid (AA) to the score, as defined by the Biopython package (34). We analyzed the full CDR3 sequence, and not only the VH, JH or DH genes, since those are not clearly defined, and the DH gene is often ambiguous.
We computed a two-dimensional histogram for each measure for each isotype separately on the PREP dataset and (Figure 5). High M(VH,JH) values are associated with intermediate to low isoelectric points, molecular weights, and length, and a more complex picture for the KD. Specifically, VH and JH genes pair favor intermediate polarity and weight, but also some specific polarity of the resulting receptor. The correlations are strong in naive IgM and disappear for the switched B cells, supporting structural selection before the naive stage followed by antigen-specific selection (see Methods for statistical test).
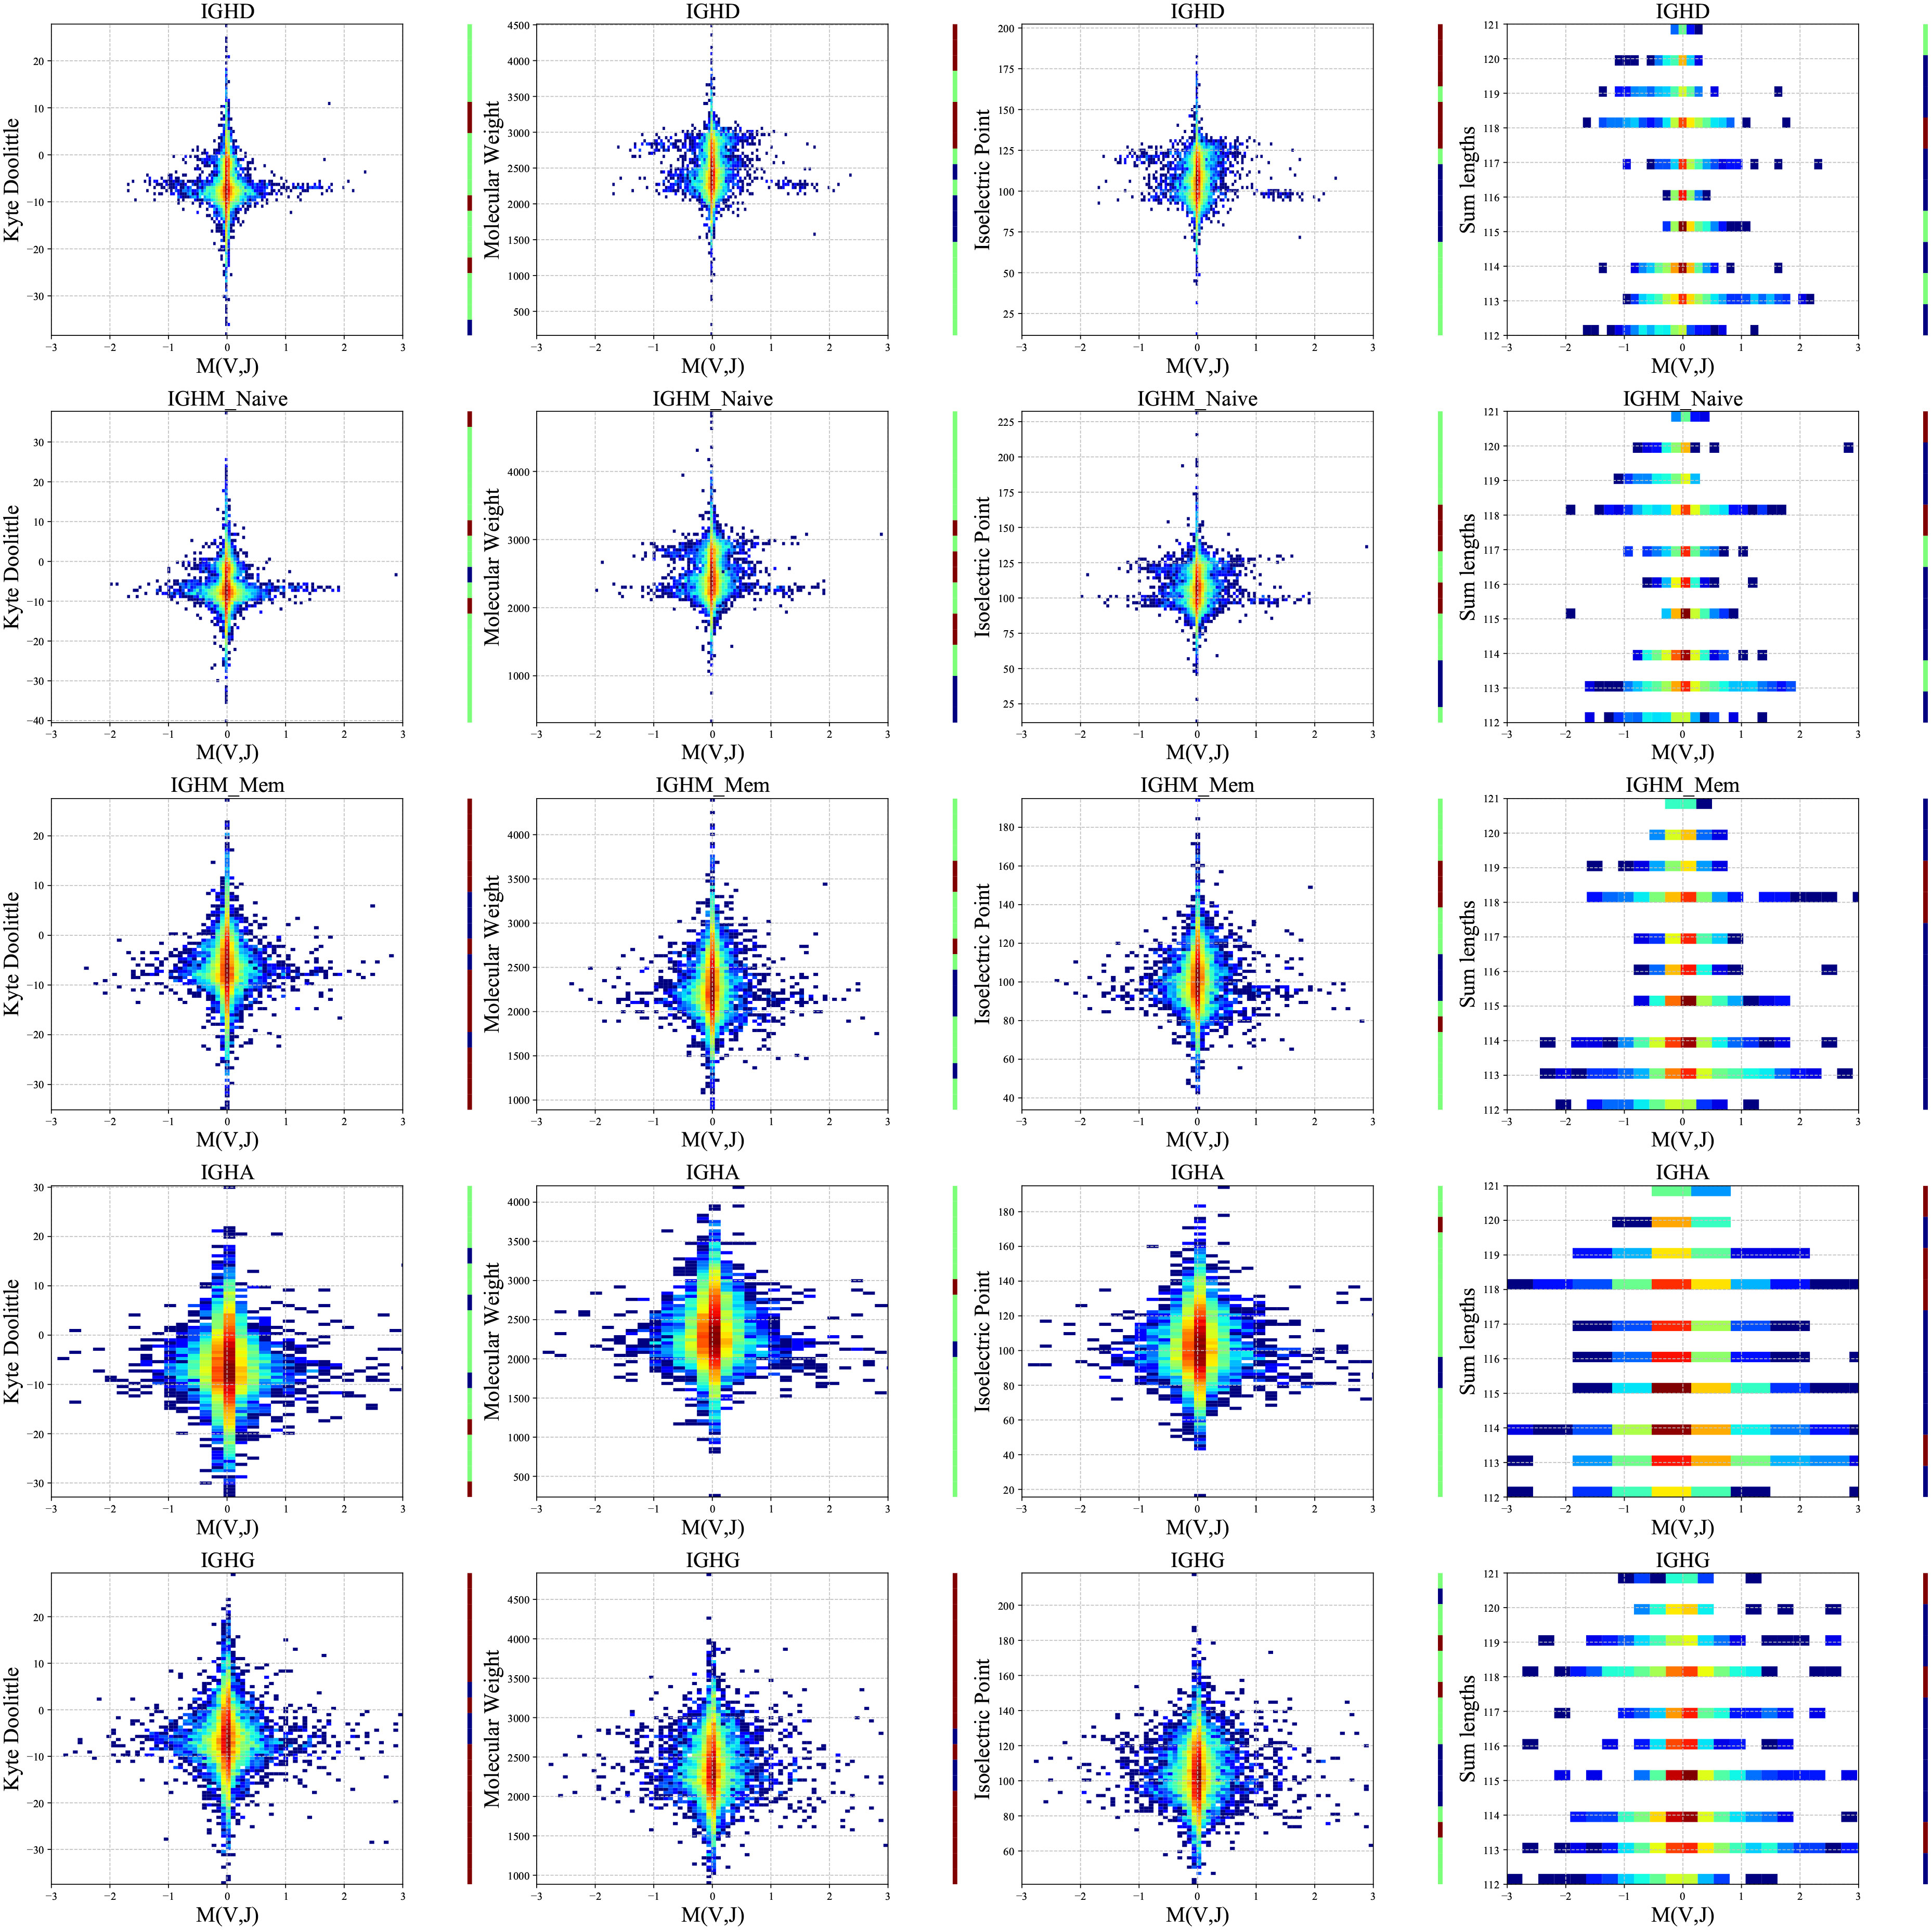
Figure 5 Two-dimensional histogram (PREP dataset). 2D histogram where the x-axis represents the M(VH,JH) values for each group separately (isotypes and naive and memory IgM - arranged in rows), and the y-axis represents the Kyte-Doolittle values (the first column), Molecular Weight values (second column), Isoelectric Point values (third column) and the sum of the VH and JH gene lengths values (fourth column). The colors represent the fraction of clones with such a value. Blue colors are low frequencies, while red colors are high. The color bars near each plot represent significant and positive (red) or negative (blue) correlations between M(VH,JH) and the observed features. Green represents no significant correlations. The data were divided into 20 bins based on the chemical values distribution.
4 Discussion
The human BCR repertoire is highly non-uniform, with preferred CDR3 length (35) and amino acid composition. Such preferences can be the result of the rearrangement process (36), antigen selection, or structural selection (9). Beyond CDR3 length distribution and composition, some VH, JH and JH segments are more frequent than others, VH, DH, JH usage is different among patients and conditions (37). Moreover, there is strong evidence that the DH-JH rearrangement is biased and some pairs are preferred (38), since DH and JH segments are located closely and joined together. However, VH and JH segments are physically separated and there is no direct event pairing the VH segment with JH. In fact, there is no reason to expect a correlation between them, unless mediated by joint preference for DH genes. We have shown a clear VHJH pairing, and found a large bias in the F clones but not in the NF clones. Moreover, the rearrangement-induced VH, JH pairing is not induced by their pairing to DH usage. We analyzed the evolution of deviation from random pairing in different peripheral compartments and found that the deviation from random pairing is most consistent in the naive IgM repertoire among samples, and then grows and diversifies in the memory and switched compartments. In parallel, the deviation from random pairing is strongly associated with multiple molecular properties of the receptors, including length (in AA), MW and polarity in the naive repertoire. The correlations decrease as the repertoire evolves to the switched memory compartments.
Our results suggest both positive and negative structural selection for pairing between VH and JH. This would be parallel to Linkage Disequilibrium (LD) in alleles. This deviation obviously does not imply that the P(VH)P(JH) is not a good predictor of P(VH,JH). Indeed, for most gene pairs, there is no significant deviation from random pairing. The most natural stage such a selection can occur is during positive and negative selection in the bone marrow. This is suggested by the bias in thenaive repertoire. BCRs that cannot bind at least weakly antigens or BCRS binding too strongly antigens in the bone marrow, for example, following excessive charge in the CDR3 may be selected against. Similarly, B cells carrying BCRs that can bind weakly many targets may be positively selected. This is consistent with the reported biased paratope usage in the naive repertoire (39).
Malfunctions of BCR repertoire development are associated with the pathogenesis of multiple immune-mediated diseases. Long CDR3 sequences in the BCR are associated with antibody polyreactivity and autoimmunity (40). Association between the length of CDR3 and the use of VH genes were found in healthy individuals (41, 42). Increased CDR3 length was found in SLE (IgG and IgA) and Crohn’s disease (unswitched B cells) (42). Furthermore, they showed that some individual genes and VH subgroups preferentially bind microbial antigens and/or have been associated with autoimmunity. The presented results show another aspect of the repertoire bias.
The current analysis was performed on healthy repertoires. We found no evidence that these pairs are directly associated with malfunctions. However, the reported shared patterns of VH-JH pairing can serve to detect deviations from this normal pattern that can be associated with malfunctions.
The evidence proposed here is indirect. We observe biases in the naive repertoire and propose a selection mechanism most consistent with the observations. Such a structural mechanism may be a crucial step in shaping the naive repertoire but is also important for the design of antibody libraries. While we have shown here one possible mechanism. Other selection mechanisms may exist that may be crucial for the design of such libraries.
Data availability statement
The original contributions presented in the study are included in the article/Supplementary Material. Further inquiries can be directed to the corresponding author.
Ethics statement
Ethical approval was not required for the study involving humans in accordance with the local legislation and institutional requirements. Written informed consent to participate in this study was not required from the participants or the participants’ legal guardians/next of kin in accordance with the national legislation and the institutional requirements.
Author contributions
RL wrote the paper and performed all the analysis. YL supervised the analysis and wrote part of the paper. SD performed part of the analysis. All authors contributed to the article and approved the submitted version.
Funding
The work of YL and RL was funded by grants ISF 870/20 as well as by an Israel MOH grant on preventive medicine and a Vatat DSI grant.
Acknowledgments
The authors thank Wenzhao Meng, Aaron M. Rosenfeld and Eline T. Luning Prak for sharing processed data from spleen samples of human organ donors that were generated under the auspices of the NIH-funded Human Pancreas Analysis Program (HPAP, (24), NIH grant number U01 DK112217). IgH sequencing on HPAP samples was performed in the Human Immunology Core at the University of Pennsylvania, which is supported in part by NIH P30 AI045008 and P30 CA016520. We also wish to thank Miriam Beller for the English editing.
Conflict of interest
The authors declare that the research was conducted in the absence of any commercial or financial relationships that could be construed as a potential conflict of interest.
Publisher’s note
All claims expressed in this article are solely those of the authors and do not necessarily represent those of their affiliated organizations, or those of the publisher, the editors and the reviewers. Any product that may be evaluated in this article, or claim that may be made by its manufacturer, is not guaranteed or endorsed by the publisher.
Supplementary material
The Supplementary Material for this article can be found online at: https://www.frontiersin.org/articles/10.3389/fimmu.2023.1166116/full#supplementary-material.
References
1. Cooper MD, Alder MN. The evolution of adaptive immune systems. Cell (2006) 124(4):815–22. doi: 10.1016/j.cell.2006.02.001
2. Wu X, Feng J, Komori A, Kim EC, Zan H, Casali P. Immunoglobulin somatic hypermutation: Double-strand DNA breaks, AID and error-prone DNA repair. J Clin Immunol (2003) 23(4):235–46. doi: 10.1023/A:1024571714867
3. Benichou J, Ben-Hamo R, Louzoun Y, Efroni S. Rep-Seq: Uncovering the immunological repertoire through next-generation sequencing. Immunology (2012) 135(3):183–91. doi: 10.1111/j.1365-2567.2011.03527.x
4. Robins H. Immunosequencing: Applications of immune repertoire deep sequencing. Curr Opin Immunol (2013) 25(5):646–52. doi: 10.1016/j.coi.2013.09.017
5. Greiff V, Bhat P, Cook SC, Menzel U, Kang W, Reddy ST. A bioinformatics framework for immune repertoire diversity profiling enables detection of immunological status. Genome Med (2015) 7(1):1–15. doi: 10.1186/s13073-015-0169-8
6. Elhanati Y, Sethna Z, Marcou Q, Callan CG Jr., Mora T, Walczak AM. Inferring processes underlying B-cell repertoire diversity. Philos Trans R Soc B: Biol Sci (2015) 370(1676):20140243. doi: 10.1098/rstb.2014.0243
7. Ehlich A, Schaal S, Gu H, Kitamura D, Müller W, Rajewsky K. Immunoglobulin heavy and light chain genes rearrange independently at early stages of B cell development. Cell (1993) 72(5):695–704. doi: 10.1016/0092-8674(93)90398-A
8. De Wildt RM, Hoet RM, van Venrooij WJ, Tomlinson IM, Winter G. Analysis of heavy and light chain pairings indicates that receptor editing shapes the human antibody repertoire. J Mol Biol (1999) 285(3):895–901. doi: 10.1006/jmbi.1998.2396
9. Toledano A, Elhanati Y, Benichou JI, Walczak AM, Mora T, Louzoun Y. Evidence for shaping of light chain repertoire by structural selection. Front Immunol (2018) 9:1307. doi: 10.3389/fimmu.2018.01307
10. Benichou JI, van Heijst JW, Glanville J, Louzoun Y. Converging evolution leads to near maximal junction diversity through parallel mechanisms in B and T cell receptors. Phys Biol (2017) 14(4):045003. doi: 10.1088/1478-3975/aa7366
11. Pelanda R, Torres RM. Central B-cell tolerance: Where selection begins. Cold Spring Harbor Perspect Biol (2012) 4(4):a007146. doi: 10.1101/cshperspect.a007146
12. Melchers F, et al. Checkpoints that control B cell development. J Clin Invest (2015) 125(6):2203–10. doi: 10.1172/JCI78083
13. Yaari G, Benichou JI, Vander Heiden JA, Kleinstein SH, Louzoun Y. The mutation patterns in B-cell immunoglobulin receptors reflect the influence of selection acting at multiple time-scales. Philos Trans R Soc B: Biol Sci (2015) 370(1676):20140242. doi: 10.1098/rstb.2014.0242
14. Sudhakar N, Rajkumar T, Rajalekshmy KR, Nancy NK. Characterization of clonal immunoglobulin heavy (IGH) VDJ gene rearrangements and the complementaritydetermining region in south Indian patients with precursor B-cell acute lymphoblastic leukemia. Blood Res (2017) 52(1):55. doi: 10.5045/br.2017.52.1.55
15. Tucci FA, Kitanovski S, Johansson P, Klein-Hitpass L, Kahraman A, Dürig J, et al. Biased IGH VDJ gene repertoire and clonal expansions in B cells of chronically hepatitis C virus–infected individuals. Blood J Am Soc Hematol (2018) 131(5):546–57. doi: 10.1182/blood-2017-09-805762
16. David D, Demaison C, Bani L, Theze J. Progressive decrease in VH3 gene family expression in plasma cells of HIV-infected patients. Int Immunol (1996) 8(8):1329–33. doi: 10.1093/intimm/8.8.1329
17. Levi R, Louzoun Y. Two step selection for bias in β chain VJ pairing. Front Immunol (2022) 13:3372. doi: 10.3389/fimmu.2022.906217
18. Prak EL, Trounstine M, Huszar D, Weigert M. Light chain editing in kappadeficient animals: A potential mechanism of B cell tolerance. J Exp Med (1994) 180(5):1805–15. doi: 10.1084/jem.180.5.1805
19. Louzoun Y, Friedman T, Prak EL, Litwin S, Weigert M. Analysis of B cell receptor production and rearrangement: Part i. light chain rearrangement. Semin Immunol (2002) 14(3):169–90. doi: 10.1016/S1044-5323(02)00041-6
20. Alt FW, Yancopoulos GD, Blackwell TK, Wood C, Thomas E, Boss M, et al. Ordered rearrangement of immunoglobulin heavy chain variable region segments. EMBO J (1984) 3(6):1209–1219. doi: 10.1002/j.1460-2075.1984.tb01955.x
21. Louzoun Y, Litwin S, Weigert M. D is for different-differences between H and L chain rearrangement. Semin Immunol (2002) 14(3):239–41. doi: 10.1016/S1044-5323(02)00052-0
22. Rubelt F, Busse CE, Bukhari SAC, Bürckert J-P, Mariotti-Ferrandiz E, Cowell LG, et al. Adaptive immune receptor repertoire community recommendations for sharing immune-repertoire sequencing data. Nat Immunol (2017) 18(12):1274–8. doi: 10.1038/ni.3873
23. Japp AS, Meng W, Rosenfeld AM, Perry DJ, Thirawatananond P, Bacher RL, et al. TCR+/BCR+ dual-expressing cells and their associated public bcr clonotype are not enriched in type 1 diabetes. Cell (2021) 184(3):827–39. doi: 10.1016/j.cell.2020.11.035
24. Kaestner KH, Powers AC, Naji A, Consortium H, Atkinson MA. NIH initiative to improve understanding of the pancreas, islet, and autoimmunity in type 1 diabetes: The human pancreas analysis program(HPAP). Diabetes (2019) 68(7):1394–402. doi: 10.2337/db19-0058
25. Meng W, Zhang B, Schwartz GW, Rosenfeld AM, Ren D, Thome JJ, et al. An atlas of B-cell clonal distribution in the human body. Nat Biotechnol (2017) 35(9):879–84. doi: 10.1038/nbt.3942
26. Rosenfeld AM, Meng W, Horne KI, Chen EC, Bagnara D, Stervbo U, et al. Bulk gDNA sequencing of antibody heavy-chain gene rearrangements for detection and analysis of B-cell clone distribution: A method by the AIRR community. Immunogenetics: Methods Protoc (2022), 317–343). Springer US New York, NY. doi: 10.1007/978-1-0716-2115-8_18
27. Chen Z, Cheng K, Walton Z, Wang Y, Ebi H, Shimamura T, et al. A murine lung cancer co-clinical trial identifies genetic modifiers of therapeutic response. Nature (2012) 483(7391):613–7. doi: 10.1038/nature10937
28. Ye J, Ma N, Madden TL, Ostell JM. IgBLAST: An immunoglobulin variable domain sequence analysis tool. Nucleic Acids Res (2013) 41(W1):W34–40. doi: 10.1093/nar/gkt382
29. Giudicelli V, Chaume D, Lefranc M-P. Imgt/gene-db: A comprehensive database for human and mouse immunoglobulin and t cell receptor genes. Nucleic Acids Res (2005) 33(suppl 1):D256–61. doi: 10.1093/nar/gki010
30. Rosenfeld AM, Meng W, Luning Prak ET, Hershberg U. ImmuneDB, a novel tool for the analysis, storage, and dissemination of immune repertoire sequencing data. Front Immunol (2018) 9:2107. doi: 10.3389/fimmu.2018.02107
31. Ghraichy M, Galson JD, Kovaltsuk A, Niederh¨ausern V, Pachlopnik Schmid J, Recher M, et al. Maturation of the human immunoglobulin heavy chain repertoire with age. Front Immunol (2020) 11:1734. doi: 10.3389/fimmu.2020.01734
32. Kolmogorov A. Sulla determinazione empirica di una lgge di distribuzione. Inst Ital. Attuari Giorn. (1933) 4:83–91.
33. Benjamini Y, Hochberg Y. Controlling the false discovery rate: A practical and powerful approach to multiple testing. J R Stat Society: Ser B (Methodological) (1995) 57(1):289–300. doi: 10.1111/j.2517-6161.1995.tb02031.x
34. Cock PJ, Antao T, Chang JT, Chapman BA, Cox CJ, Dalke A, et al. Biopython: Freely available Python tools for computational molecular biology and bioinformatics. Bioinformatics (2009) 25(11):1422. doi: 10.1093/bioinformatics/btp163
35. Pickman Y, Dunn-Walters D, Mehr R. BCR CDR3 length distributions differ between blood and spleen and between old and young patients, and TCR distributions can be used to detect myelodysplastic syndrome. Phys Biol (2013) 10(5):056001. doi: 10.1088/1478-3975/10/5/056001
36. Isacchini G, Walczak AM, Mora T, Nourmohammad A. Deep generative selection models of T and B cell receptor repertoires with soNNia. Proc Natl Acad Sci (2021) 118(14):e2023141118. doi: 10.1073/pnas.2023141118
37. Glanville J, Zhai W, Berka J, Telman D, Huerta G, Mehta GR, et al. Precise determination of the diversity of a combinatorial antibody library gives insight into the human immunoglobulin repertoire. Proc Natl Acad Sci (2009) 106(48):20216–21. doi: 10.1073/pnas.0909775106
38. Volpe JM, Kepler TB. Large-scale analysis of human heavy chain V (D) J recombination patterns. Immunome Res (2008) 4(1):1–10. doi: 10.1186/1745-7580-4-3
39. Kovaltsuk A, Raybould MI, Wong WK, Marks C, Kelm S, Snowden J, et al. Structural diversity of B-cell receptor repertoires along the B-cell differentiation axis in humans and mice. PloS Comput Biol (2020) 16(2):e1007636. doi: 10.1371/journal.pcbi.1007636
40. Meffre E, Milili M, Blanco-Betancourt C, Antunes H, Nussenzweig MC, Schiff C, et al. Immunoglobulin heavy chain expression shapes the B cell receptor repertoire in human B cell development. J Clin Invest (2001) 108(6):879–86. doi: 10.1172/JCI13051
41. Petrova VN, Muir L, McKay PF, Vassiliou GS, Smith KG, Lyons PA, et al. Combined influence of B-cell receptor rearrangement and somatic hypermutation on b-cell class-switch fate in health and in chronic lymphocytic leukemia. Front Immunol (2018) 9:1784. doi: 10.3389/fimmu.2018.01784
Keywords: B cells, rearragement, V genes, selection, J genes, structural
Citation: Levi R, Dvorkin S and Louzoun Y (2023) Shared bias in H chain V-J pairing in naive and memory B cells. Front. Immunol. 14:1166116. doi: 10.3389/fimmu.2023.1166116
Received: 14 February 2023; Accepted: 23 August 2023;
Published: 18 September 2023.
Edited by:
Amy L. Kenter, University of Illinois Chicago, United StatesReviewed by:
Laurence Menard, Bristol Myers Squibb, United StatesCorey T. Watson, University of Louisville, United States
Copyright © 2023 Levi, Dvorkin and Louzoun. This is an open-access article distributed under the terms of the Creative Commons Attribution License (CC BY). The use, distribution or reproduction in other forums is permitted, provided the original author(s) and the copyright owner(s) are credited and that the original publication in this journal is cited, in accordance with accepted academic practice. No use, distribution or reproduction is permitted which does not comply with these terms.
*Correspondence: Yoram Louzoun, bG91em91eUBtYXRoLmJpdS5hYy5pbA==