
94% of researchers rate our articles as excellent or good
Learn more about the work of our research integrity team to safeguard the quality of each article we publish.
Find out more
ORIGINAL RESEARCH article
Front. Immunol., 03 April 2023
Sec. Cancer Immunity and Immunotherapy
Volume 14 - 2023 | https://doi.org/10.3389/fimmu.2023.1166052
This article is part of the Research TopicCommunity Series in Novel Biomarkers for Predicting Response to Cancer Immunotherapy, volume IIView all 19 articles
 Jihang Shi1,2,3†
 Guangya Li4,5†Lulu Liu4,5†Xiandun Yuan6
 Yafei Wang1,2,3Ming Gong1,2,3
 Chonghui Li2,3Xinlan Ge2,3
 Shichun Lu2,3*
Objectives: The exhausted CD8+T (Tex) cells are a unique cell population of activated T cells that emerges in response to persistent viral infection or tumor antigens. Tex cells showed the characteristics of aging cells, including weakened self-renewal ability, effector function inhibition, sustained high expression of inhibitory receptors including PD-1, TIGIT, TIM-3, and LAG-3, and always accompanied by metabolic and epigenetic reprogramming. Tex cells are getting more and more attention in researching immune-related diseases and tumor immunotherapy. However, studies on Tex-related models for tumor prognosis are still lacking. We hope to establish a risk model based on Tex-related genes for HCC prognosis.
Methods: Tex-related GEO datasets from different pathologic factors (chronic HBV, chronic HCV, and telomere shortening) were analyzed respectively to acquire differentially expressed genes (DEGs) by the ‘limma’ package of R. Genes with at least one intersection were incorporated into Tex-related gene set. GO, KEGG, and GSEA enrichment analyses were produced. Hub genes and the PPI network were established and visualized by the STRING website and Cytoscape software. Transcription factors and targeting small molecules were predicted by the TRUST and CLUE websites. The Tex-related HCC prognostic model was built by Cox regression and verified based on different datasets. Tumor immune dysfunction and exclusion (TIDE) and SubMap algorithms tested immunotherapy sensitivity. Finally, qRT-PCR and Flow Cytometry was used to confirm the bioinformatic results.
Results: Hub genes such as AKT1, CDC6, TNF and their upstream transcription factor ILF3, Regulatory factor X-associated protein, STAT3, JUN, and RELA/NFKB1 were identified as potential motivators for Tex. Tex-related genes SLC16A11, CACYBP, HSF2, and ATG10 built the HCC prognostic model and helped with Immunotherapy sensitivity prediction.
Conclusion: Our study demonstrated that Tex-related genes might provide accurate prediction for HCC patients in clinical decision-making, prognostic assessment, and immunotherapy. In addition, targeting the hub genes or transcription factors may help to reverse T cell function and enhance the effect of tumor immunotherapy.
Hepatocellular carcinoma (HCC), accounting for more than 90% of primary liver tumors, is now the world’s fifth most common cause of cancer. The five-year survival rate for liver cancer was 18% and second only to that for pancreatic cancer (1). Important risk factors for hepatocellular carcinoma include hepatitis liver disease (hepatitis B and C), alcoholic liver disease, and nonalcoholic fatty liver disease (2). Due to its insidious progression, most patients were diagnosed at advanced stages. RFA, TACE, TKI, and immunotherapy are widely used in advanced liver cancer (3). Advanced therapies, including gene therapy and immunotherapy, have shown incredible effects, and more and more combination therapies are also being carried out in clinical studies, offering hope for the treatment of patients with advanced liver cancer (4–6).
Nevertheless, the role of immune cells, especially exhausted T cells, in developing and progressing HCC at different stages and whether exhaustion features can be utilized as a diagnostic and prognostic marker for HCC remains unclear. T cell exhaustion, usually called exhausted CD8+T (Tex) cells, is a hypofunctional state of T lymphocytes, endowing them to lose their ability to eliminate cancer cells effectively (7, 8). Prolonged antigen exposure and persistent inflammatory stimuli are thought to be potential mechanisms that drive T cells to an exhaustion state (9, 10). Advanced HCC is often accompanied by an immune exhaustion station, characterized by the accumulation of PD-1hi CD8+T cells and exhaustion of tumor-antigen-specific CD8+T cells (11). T-cell exhaustion was associated with overall survival in HCC patients of different ethnicities and etiologies (12, 13). In HCC, the T cell exhaustion factor is particularly important for several reasons. On the one hand, due to its unique physiological structure, the liver plays an important role in promoting immune tolerance (14). And the immune tolerance microenvironment contributes to the latent growth of malignant hepatocytes. Research demonstrates that the numbers of Tregs, MDSCs, and exhausted T cells were increased in patients with advanced liver cancer compared with normal controls (15, 16). On the other hand, chronic HBV and HCV infection are important etiologies of HCC, leading to liver fibrosis and chronic inflammatory reaction (17). All these factors aggravate the development of Tex.
In conclusion, Tex, a reliable immunophenotype of HCC, may be related to the efficacy of immunotherapy and prognosis (18). However, there is no Tex-based prognostic model to systematically evaluate Tex-related genes and predict the overall prognosis of HCC patients. Therefore, establishing a Tex-based prognostic model for diagnosing and treating HCC has important clinical significance.
In the first step of this study, we analyzed data sets of exhausted CD8+T (Tex) cells from different etiologies (HBV, HCV, TOLER) to find Tex-related co-differentially expressed genes and analyzed the hub gene networks and associated signaling pathways. Then we constructed a Tex-related prognostic model based on the TCGA database and validated it in an independent ICGC(International Cancer Genome Consortium) database. The results demonstrated that the Tex-related genes are related to HCC prognosis, and the Tex-related prognostic model would be effective in clinical decision-making, prognostic assessment, and immunotherapy for HCC treatment.
This article’s related datasets included HBV, HCV, and Telomere shortening data of exhausted CD8+ T cells from the Gene Expression Omnibus (GEO) database. The HBV dataset (GSE67801) contains four HBV-induced Tex samples and five control samples. The HCV dataset (GSE111449) contains seven HCV-infected Tex samples and five healthy samples, and the telomere-shortening dataset (GSE77525) has four telomere-shortening CD8+T cell samples and four healthy samples. TCGA-LIHC cohort containing RNA sequencing and corresponding clinical information of 369 HCC samples were downloaded from the TCGA website until January 1, 2023. ICGC (LIRI-JP) cohort comprises 231 HCC samples from the ICGC portal.
DEGs of three GEO, TCGA, and ICGC datasets were analyzed with standard | Log2Fold Change | > 1 and | adj. P value | < 0.05. The ‘limma’ package in RStudio software (version 4.2.2) was used. Common DEGs were produced at least one intersection by the ‘Venn’ website (http://bioinformatics.psb.ugent.be/webtools/Venn/) for Tex gene list construction.
The ‘clusterProfiler’ package was used to process GO and KEGG enrichment analysis in R software (version 4.2.2). Other packages, including ‘dplyr,’ ‘org.Hs.eg.db,’ ‘circlize,’ ‘RColorBrewer,’ ‘ggplot2,’ ‘enrichplot,’ ‘ggpubr,’ and ‘ComplexHeatmap’ were used for data Annotation and Visualization. P-value < 0.05 was set as the cutoff criterion for common DEGs.
PPI networks were established by Search Tool for the Retrieval of Interacting Genes Database (STRING) based on the combined score > 0.9 and visualized by Cytoscape 3.9.1 (version 4.2.2) to reveal the interactions among proteins of common DEGs.
During the model construction, cases with OS time less than 90 days in TCGA and ICGC datasets were excluded. The TCGA data were first randomly divided into the training and testing sets utilizing package “caret” in R. Univariate Cox proportional hazard regression analysis by R package “survival” was used to screen prognostic-related Tex DEGs in the training group (p < 0.05). The R package “glmnet” was utilized for Lasso regression. Then, the multivariable Cox proportional risk regression analysis was carried out to establish the prognosis model of HCC based on Tex-related genes in TCGA. The risk score formula is as follows: , where coef means regression coefficient. The HCC patients in the training, testing, and ICGC validation sets were separated into high- and low-risk groups based on the median risk score. The survival analysis and the receiver operator characteristic (ROC) curves between the two risk groups were carried out using the “survminer,” “survival,” and “timeROC” R packages.
Tex-related HCC risk score was used to predict the patients’ responsiveness to immune checkpoint blocks (ICB). IMvigor210 cohort (http://research-pub.gene.com/IMvigor210CoreBiologies/) containing transcriptomic and corresponding clinical data of HCC patients receiving anti-PD-L1 agent (atezolizumab) treatment. The GSE78220 cohort comprises transcriptomic data from melanomas patients receiving anti-PD-1 checkpoint inhibition therapy.
Univariate Cox and multivariate Cox regression analyses were utilized to evaluate if the risk score and other clinical characteristics were independent variable factors for HCC.
The blood samples were collected from healthy donors (Chinese PLA General Hospital, 2017YFA003003). Then the peripheral blood mononuclear cells (PBMCs) were isolated using Ficoll density gradient centrifugation. The isolated human PBMCs were cultured in complete culture media, including advanced RPMI 1640 media (Gibco, 12633012), supplemented with 10% human serum (Sigma, NIST909C), 200U/ml IL2 (MCE, HY-P7039) and 1% penicillin/streptomycin (Pen/Strep, 15140163), at 37°C and 5% CO2 concentration. MagniSort Human T cell Enrichment Kit (Invitrogen, 8804-6810-74) was used to obtain CD3+ cells. The complete culture media were mixed with magnetic beads coated with anti-CD3/CD28 mAbs (Invitrogen, 11141D) to stimulate and expand the CD3+ T cells. T cells were mixed with magnetic beads at a ratio of 1:1 beads-to-cells. During each induction cycle, 2.5 × 10⁶ cells in a 5 mL/well volume were plated in a 6−well culture plate at 37°C/5% CO2 for four days. Then magnetic beads were washed away, and cells were cultured in a culture medium for two days. Flow analysis of the T cell exhaustion state was performed after each cycle.
After removing beads from the CD3+ T cells by magnet or grinding liver tissue, total RNA was isolated using the Direct-zol RNA Kits (ZYMO Research, R2052). Then RNA was converted to cDNA using the TransScript First-Strand cDNA Synthesis SuperMix (TransGen Biotech, AT311). qRT-PCR analysis was performed using the KAPA SYBR® FAST qPCR Kit (KAPA Biosystems, KK4601) on a Bio-Rad CFX384TM Real-time System. The quantified values were normalized by housekeeping genes (β-ACTIN or RRN18S). The qRT-PCR primer sequences were provided in Table 1, and the data were analyzed using the ΔΔCt method.
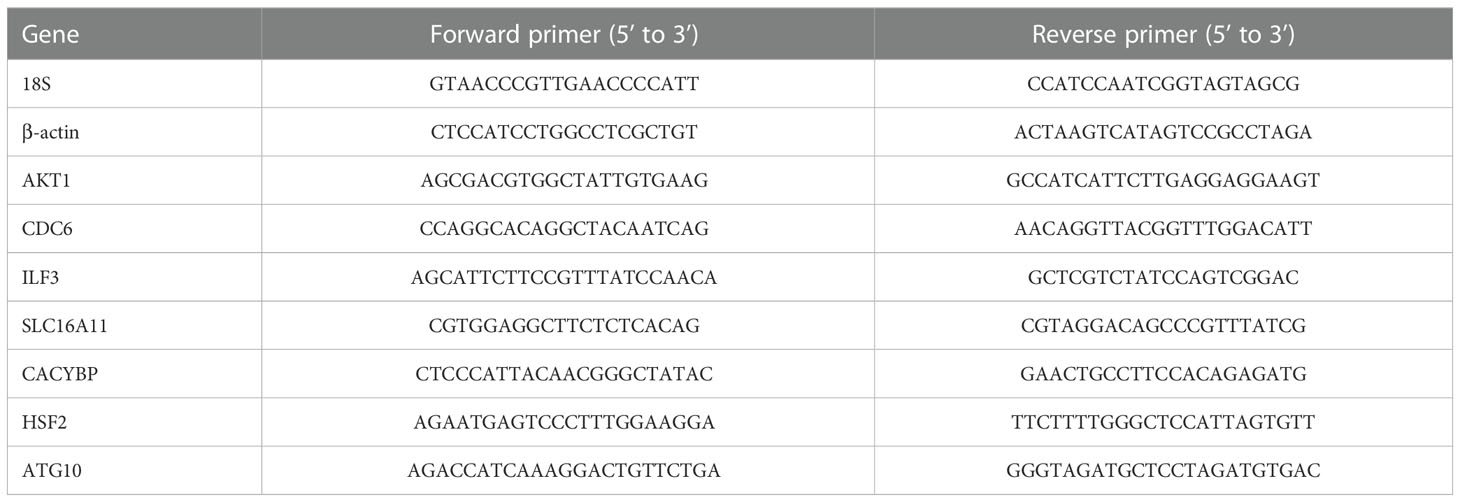
Table 1 Primer sequences for real-time PCR in the study.
After 1×10⁶ cells were fixated and permeabilizated, resuspended with 200 µl 1×Perm/Wash Buffer and stained with antibodies APC anti-PD1 (Biolegend, 329908), FITC Anti-Tim3 (Biolegend, 345022), and then detected on the Flow Cytometer.
GeneMANIA (http://www.genemania.org) was used to find genes related to Tex hub genes. The tool was used to visualize the gene networks, construct the protein-protein interaction (PPI) network, and generate hypotheses about gene function. Transcription regulators upstream of hub genes were searched in the TRRUST database (https://www.grnpedia.org/trrust/) with the FDR < 0.05. Small molecules reported to target these transcription factors were obtained by the Clue website (https://clue.io/). All bioinformatics statistical analyses were performed by R (version 4.2.2) and RStudio. p <0 .05 was considered statistically significant. Statistical flow cytometry and qRT-PCR data tests were performed using GraphPad Prism software. Student t-test (two-tailed) was used for comparisons between two independent conditions. p <0 .05 was considered statistically significant.
GEO datasets (GSE67801, GSE111449, and GSE77525) containing three etiologies (chronic HBV, HCV infection, and telomere shortening) induced exhausted CD8+T (Tex) cells and their normal control data were selected to screen for Tex genes (Figure 1A). Up-regulated DEGs and down-regulated-DEGs were analyzed with standard | Log2Fold Change | > 1 and | adj. P value | < 0.05 followed by intersection operation. The VENN diagram demonstrated that 561 co-upregulated genes and 834 co-downregulated genes constituted 1435 Tex-related gene lists (Figure 1B, Supplementary 1).
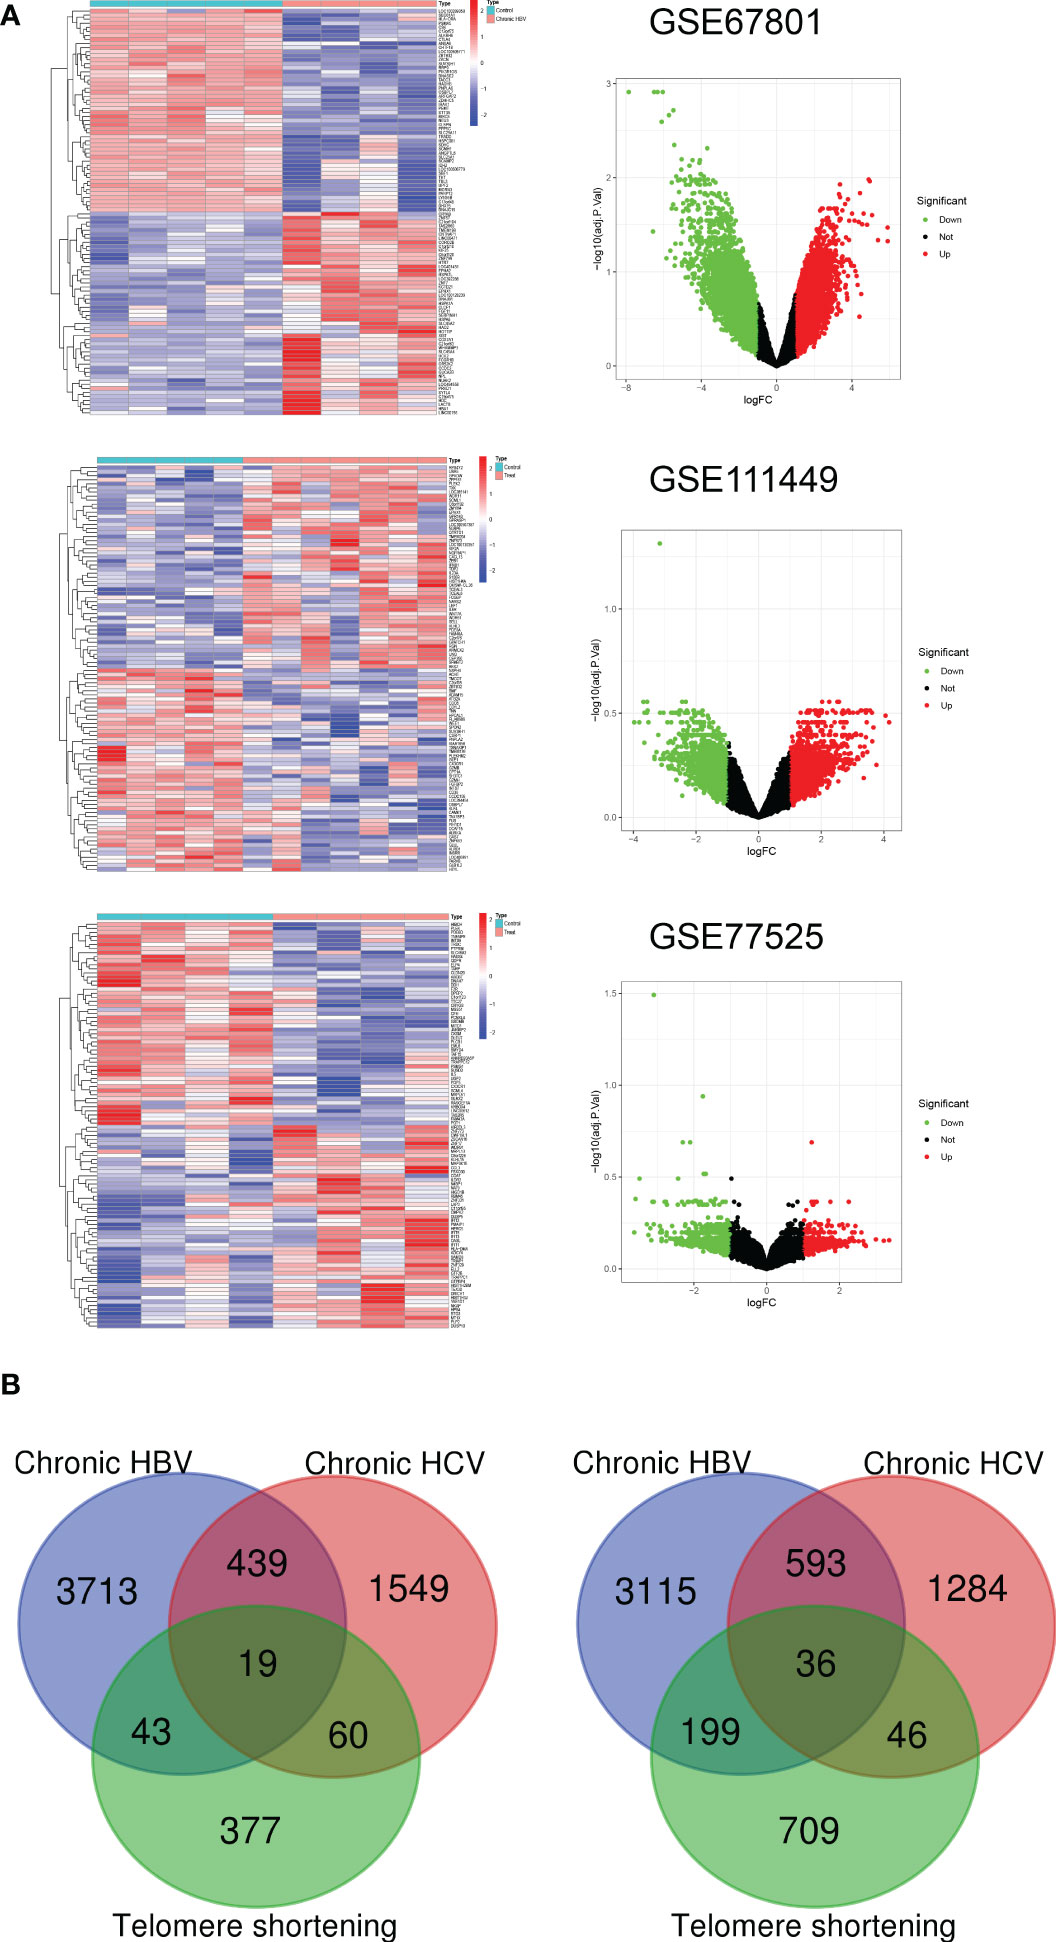
Figure 1 Construction of Tex-related gene list. (A) Heatmap and Volcano plot of the DEGs between Tex cells and CD8 T control cells from three GEO datasets. Green represents downregulated DEGs, red represents upregulated DEGs, and black represents no difference. (B) Venn diagram demonstrates the co-upregulated and co-downregulated DEGs for the Tex-related gene list.
By using the STRING database, we built a PPI network containing 1021 edges and 526 nodes to explore further the correlation between genes in the Tex gene list (Figure 2A). Then, CytoHubba in Cytoscape was used to identify the 15 hub genes based on degree method scores in the PPI network, including TNF, AKT1, RPS29, RPS27A, PTPN6, RUNX2, CD4, LYN, HLA-DRB1, IKBKG, CDC6, HLA-DRA, SNRPG, RPS12, and PIK3CA (Figure 2B). Hub genes were analyzed further by GeneMANIA to explore their interacting genes and predict their correlations such as colocalization, coexpression, and shared protein domains. The hub genes are on the left side, while the interacting genes are on the right. Function analysis showed that these genes were enriched in the MHC protein complex, positive regulation of myeloid leukocyte differentiation, PI3K, and NF-κB signaling (Figure 2C).
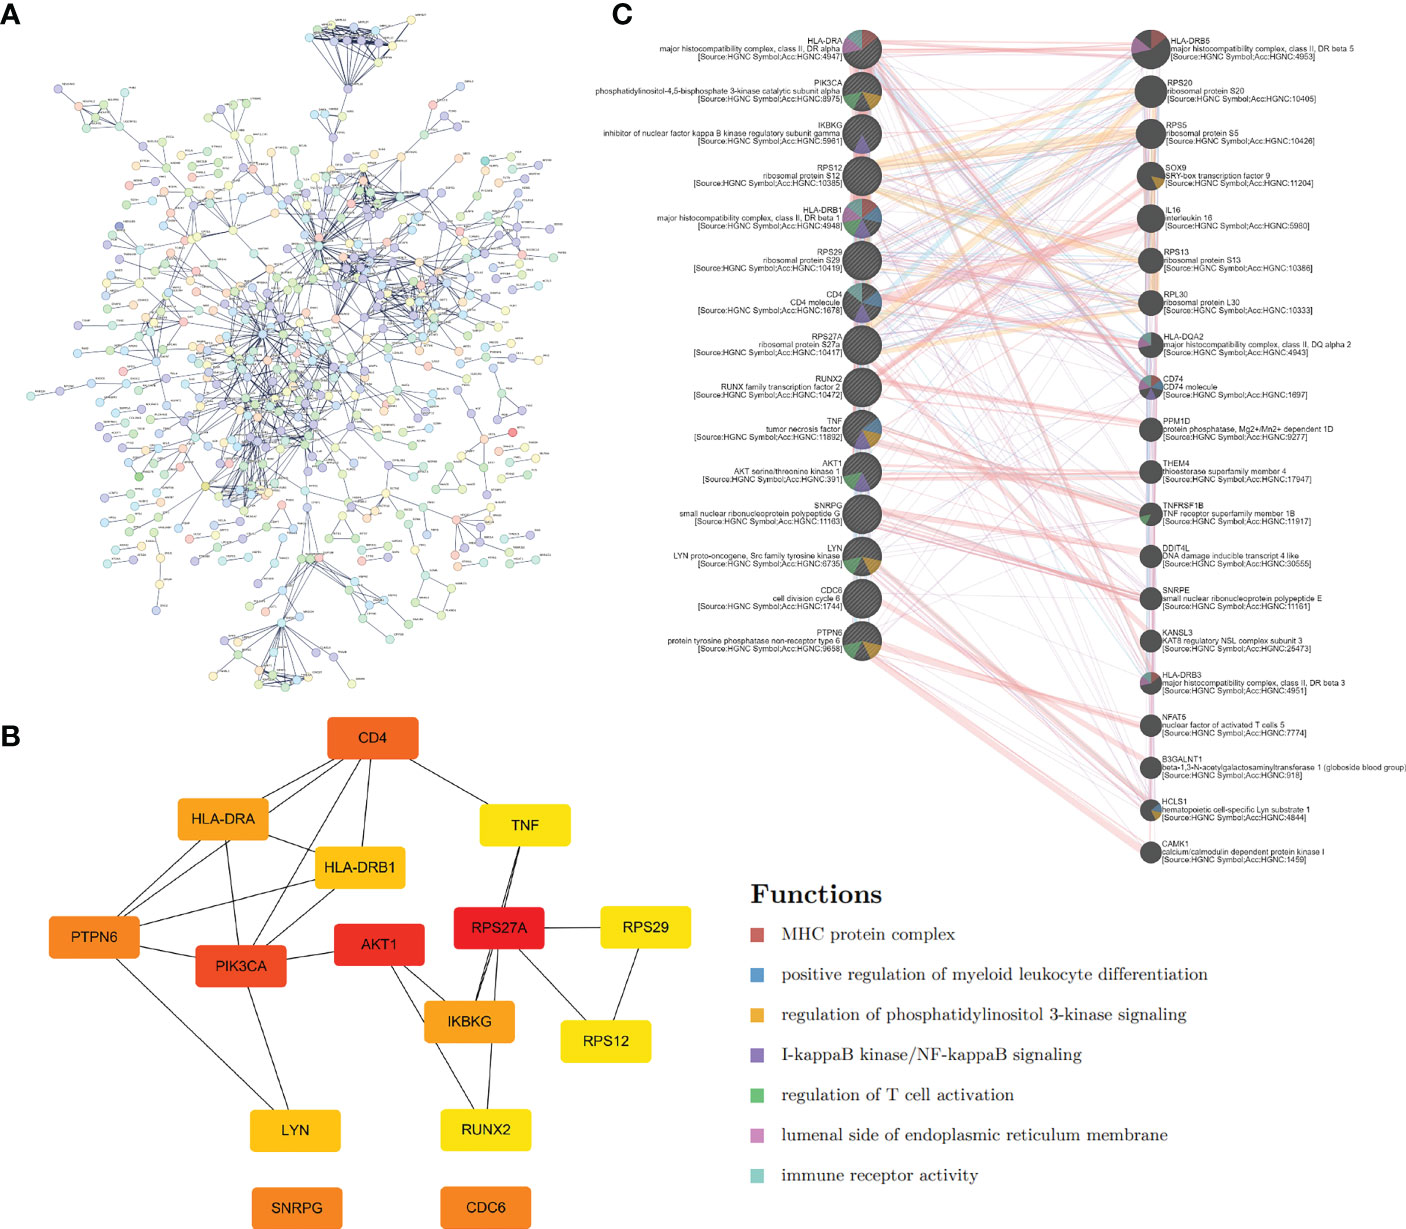
Figure 2 Hub genes extraction and PPI network construction. (A) PPI network of Tex-related genes constructed by STRING. (B) The top 15 hub genes and their relationship were calculated and visualized by Cytoscape. (C) GeneMANIA database helps predict the hub gene interaction network based on gene correlations such as colocalization, coexpression, and shared protein domains. The 15 hub genes were listed on the left side, and the top 20 mostly related neighboring genes are shown on the right side.
We used a ‘cluster profiler’ package in R software to analyze these Tex-related hub genes’ biological role and function to perform GO and KEGG enrichment analyses. GO enrichment analysis included three categories: biological process (BP), cell composition (CC), and molecular function (MF). Regarding BP, Tex-related hub genes were mainly enriched in regulating leukocyte cell-cell adhesion and T-cell activation (Figure 3A). The top GO terms in the CC module were endocytic vesicle membrane, endocytic vesicle, and cytosolic small ribosomal subunit, and regarding MF, Tex-related hub genes were mainly enriched in MHC protein complex binding (Figure 3A). KEGG enrichment analysis containing T cell receptor signaling pathway, virus infection, and PD-L1 expression and PD-1 checkpoint pathway in cancer (Figure 3B). These results showed that the Tex-related gene list we found was efficient and reliable.
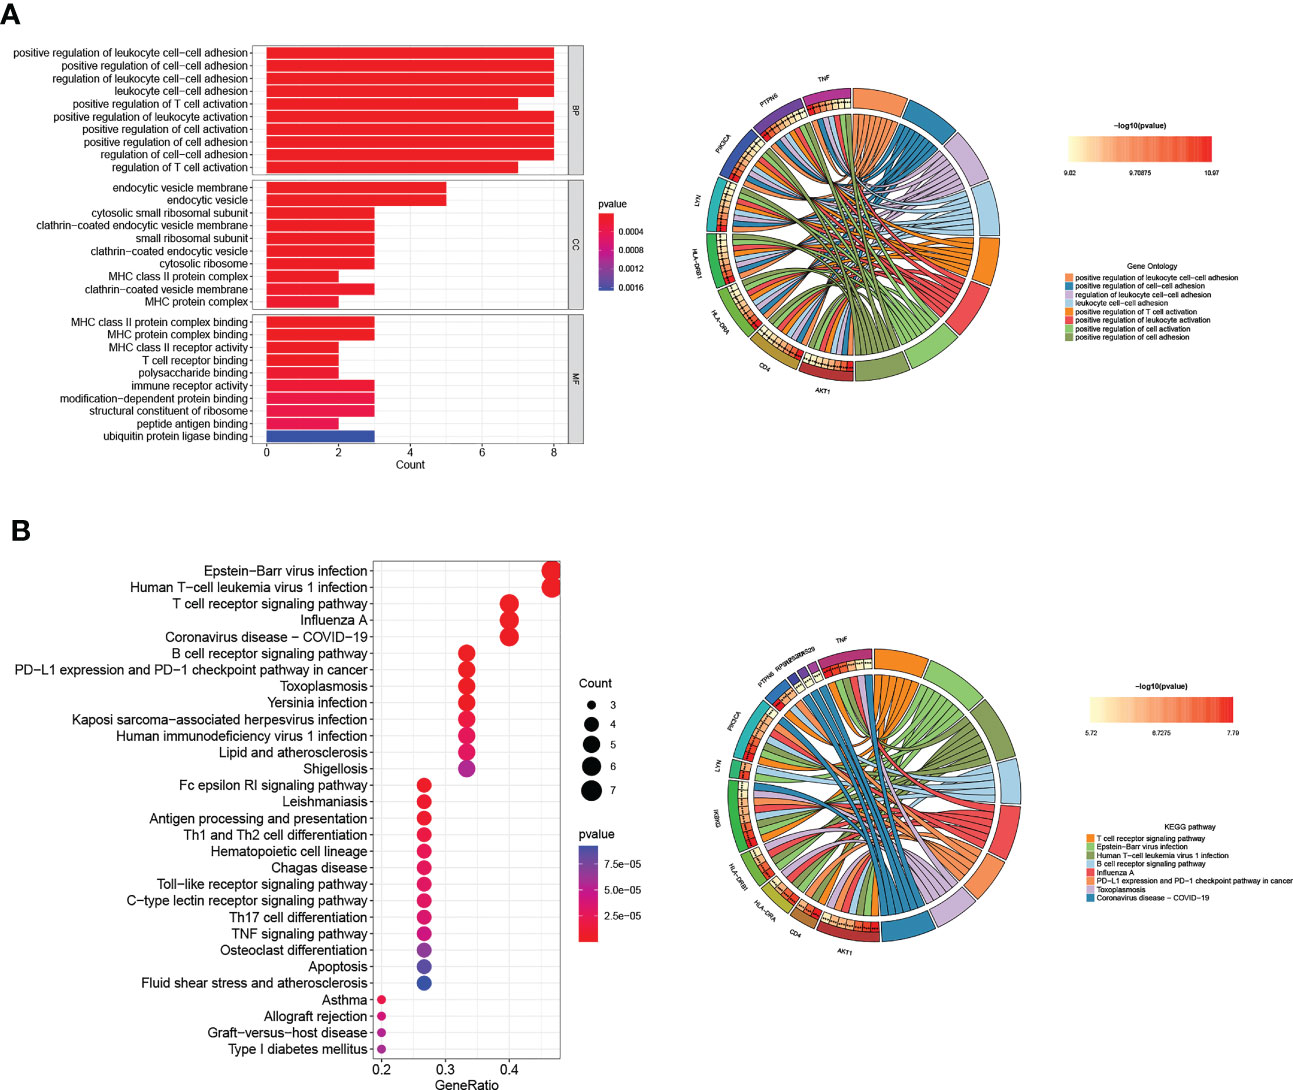
Figure 3 GO and KEGG pathway analyses of Hub genes. (A) The top ten GO functional enrichment analyses of the hub genes in biological process (BP), cellular component (CC), and molecular function (MF) groups, respectively. (B) The top 30 significant KEGG signal pathways of the hub genes.
To further explore the regulatory relationship of transcription factors upstream of Tex-related hub genes, which may contribute to T cell exhaustion, we used the TRUST website for further analysis. The results showed that the transcription factors such as ILF3, regulatory factor X-associated protein, STAT3, JUN, and RELA/NFKB1 regulated the hub genes’ expression, playing an important role in CD8+T exhaustion (Table 2). The hub genes and their predicted transcription factors were further validated in the data sets (Figures 4A, B). Targeting these transcription factors may help reverse T cells’ exhaustion state, restoring T cell function and increasing treatment effector for infections and tumors. We further identified potential small molecules reported to inhibit such TFs by the CLUE website (Table 3). In this section, we identified transcription factors critical for the induction of T cell exhaustion, providing potential targets for T exhaustion-reverse therapy.
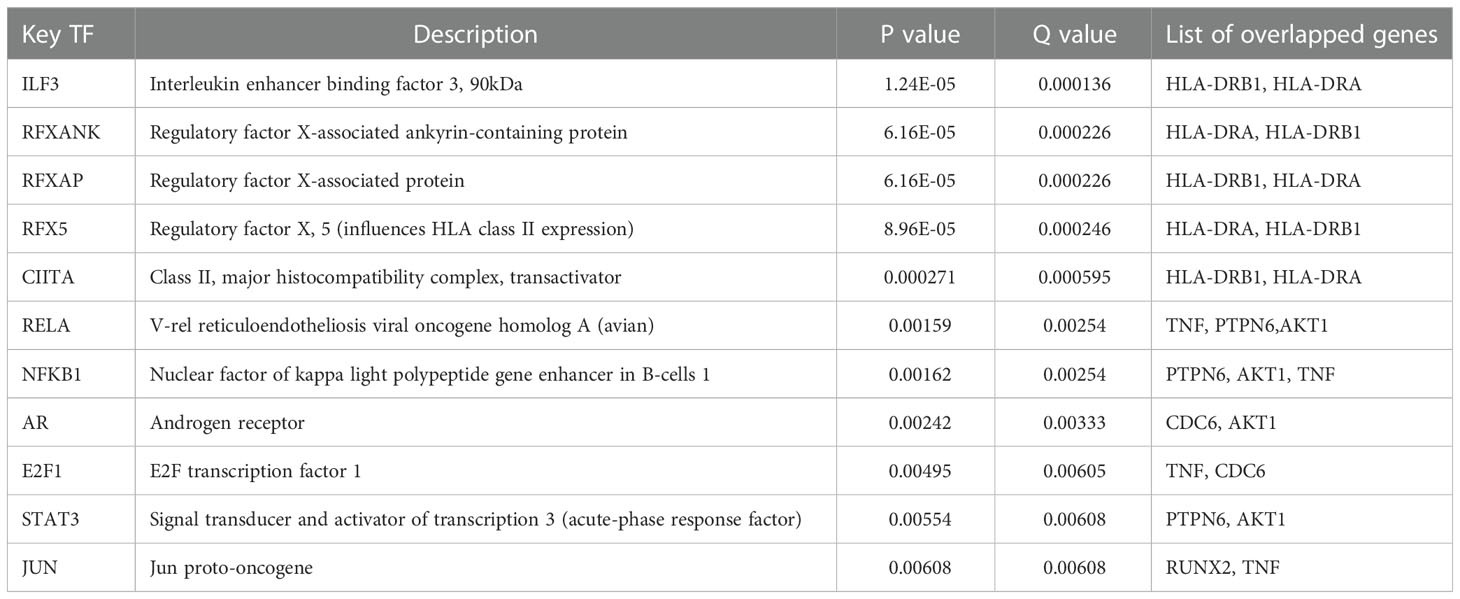
Table 2 Transcription factors upstream of Tex-related hub genes.

Figure 4 Validation of Tex-related transcription factors. (A, B) The Tex-related hub genes (A) and upstream transcription factors (B) predicted by the TRUST website were verified in the Tex GEO dataset GSE67801, GSE111449, and GSE77525.
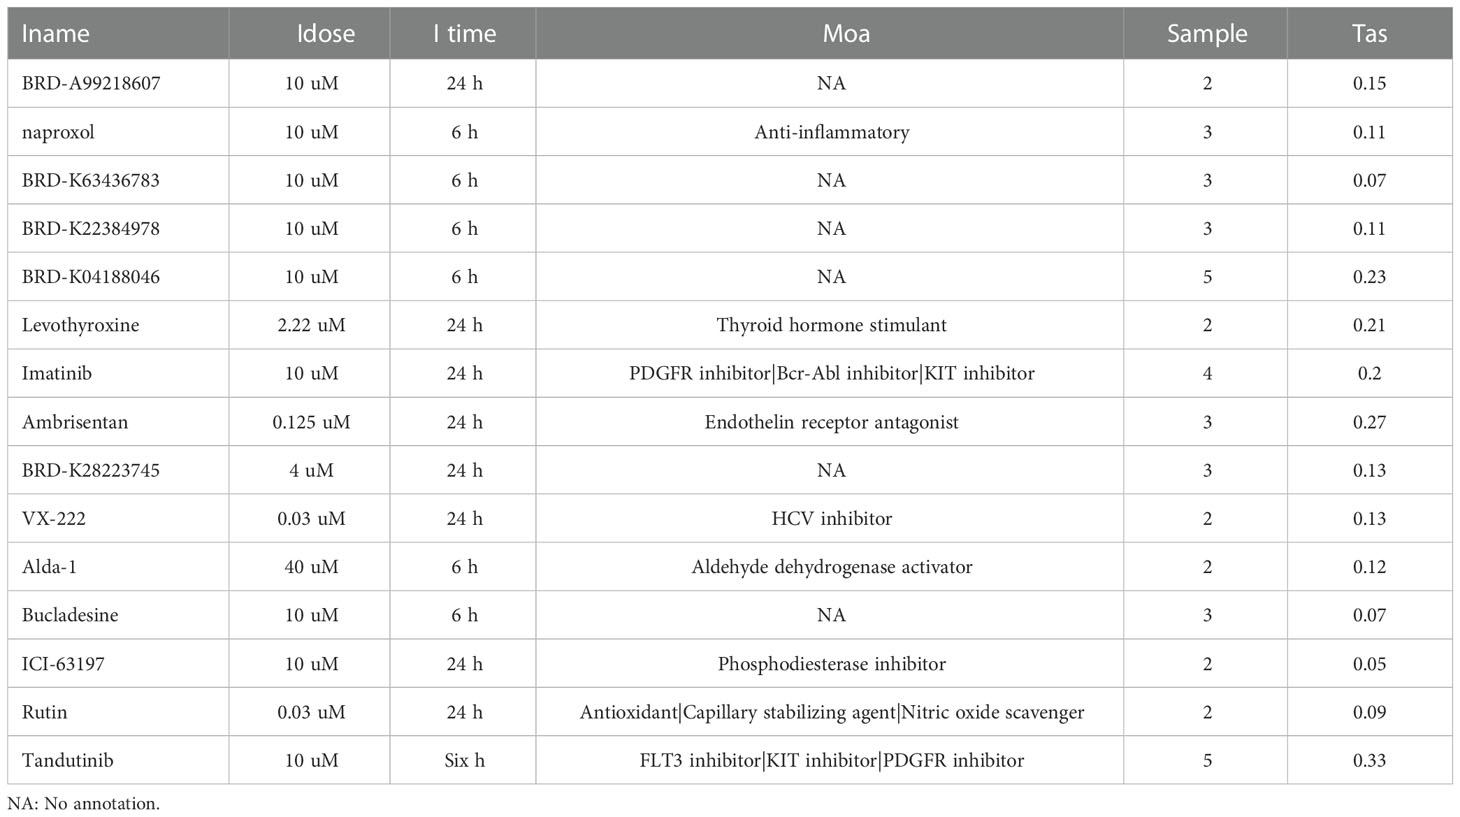
Table 3 Small molecules reported to inhibit Transcription factors in Table 2.
Next, we wanted to know whether Tex-related genes have predictive value for diagnosing and treating HCC. We collected 369 HCC samples and 50 cancer-adjacent control samples from the TCGA database. The DEGs in HCC were analyzed, and Tex-related DEGS were extracted for further analysis with | Log2Fold Change | > 1 and | adj. P value | < 0.05. Tex-related prognostic DEGs were identified by univariate cox regression (Figure 5A). Then least absolute shrinkage and selection operator (LASSO) was used to avoid overfitting (Figure 5B). Finally, four genes (SLC16A11, CACYBP, HSF2, and ATG10) were selected to construct the Tex-related prognostic model by multivariate Cox regression (Figure 5C, Table 4). We calculated risk score with the formula: risk score= SLC16A11 × (-0.0.3755) + CACYBP × (0.038092) + HSF2 × (0.173432) + ATG10 × (0.504545). In the TCGA cohort, low- and high-risk groups showed a significant difference in prognosis in the training and testing sets. The Kaplan-Meier curves showed that the OS of the high-risk group was significantly worse than that of the low-risk group. Time-dependent ROC curves were used to evaluate the sensitivity and specificity of the prognostic model by calculating the area under the ROC curve (AUC). In the training set, the 1-year, 3-year, and 5-year AUCs were 0.86, 0.72, and 0.78, and corresponding AUCs in the testing set were 0.80, 0.63, and 0.61 (Figures 6A, B). In addition, the independent data set based on ICGC further verified the accuracy and reliability of the model (Figures 7A, B). The clinical characteristics of the TCGA and ICGC databases are listed in Table 5. The above results indicated that the Tex-related prognostic model could accurately predict the prognosis of HCC. High-risk patients, based on risk scores, usually have a worse prognosis.
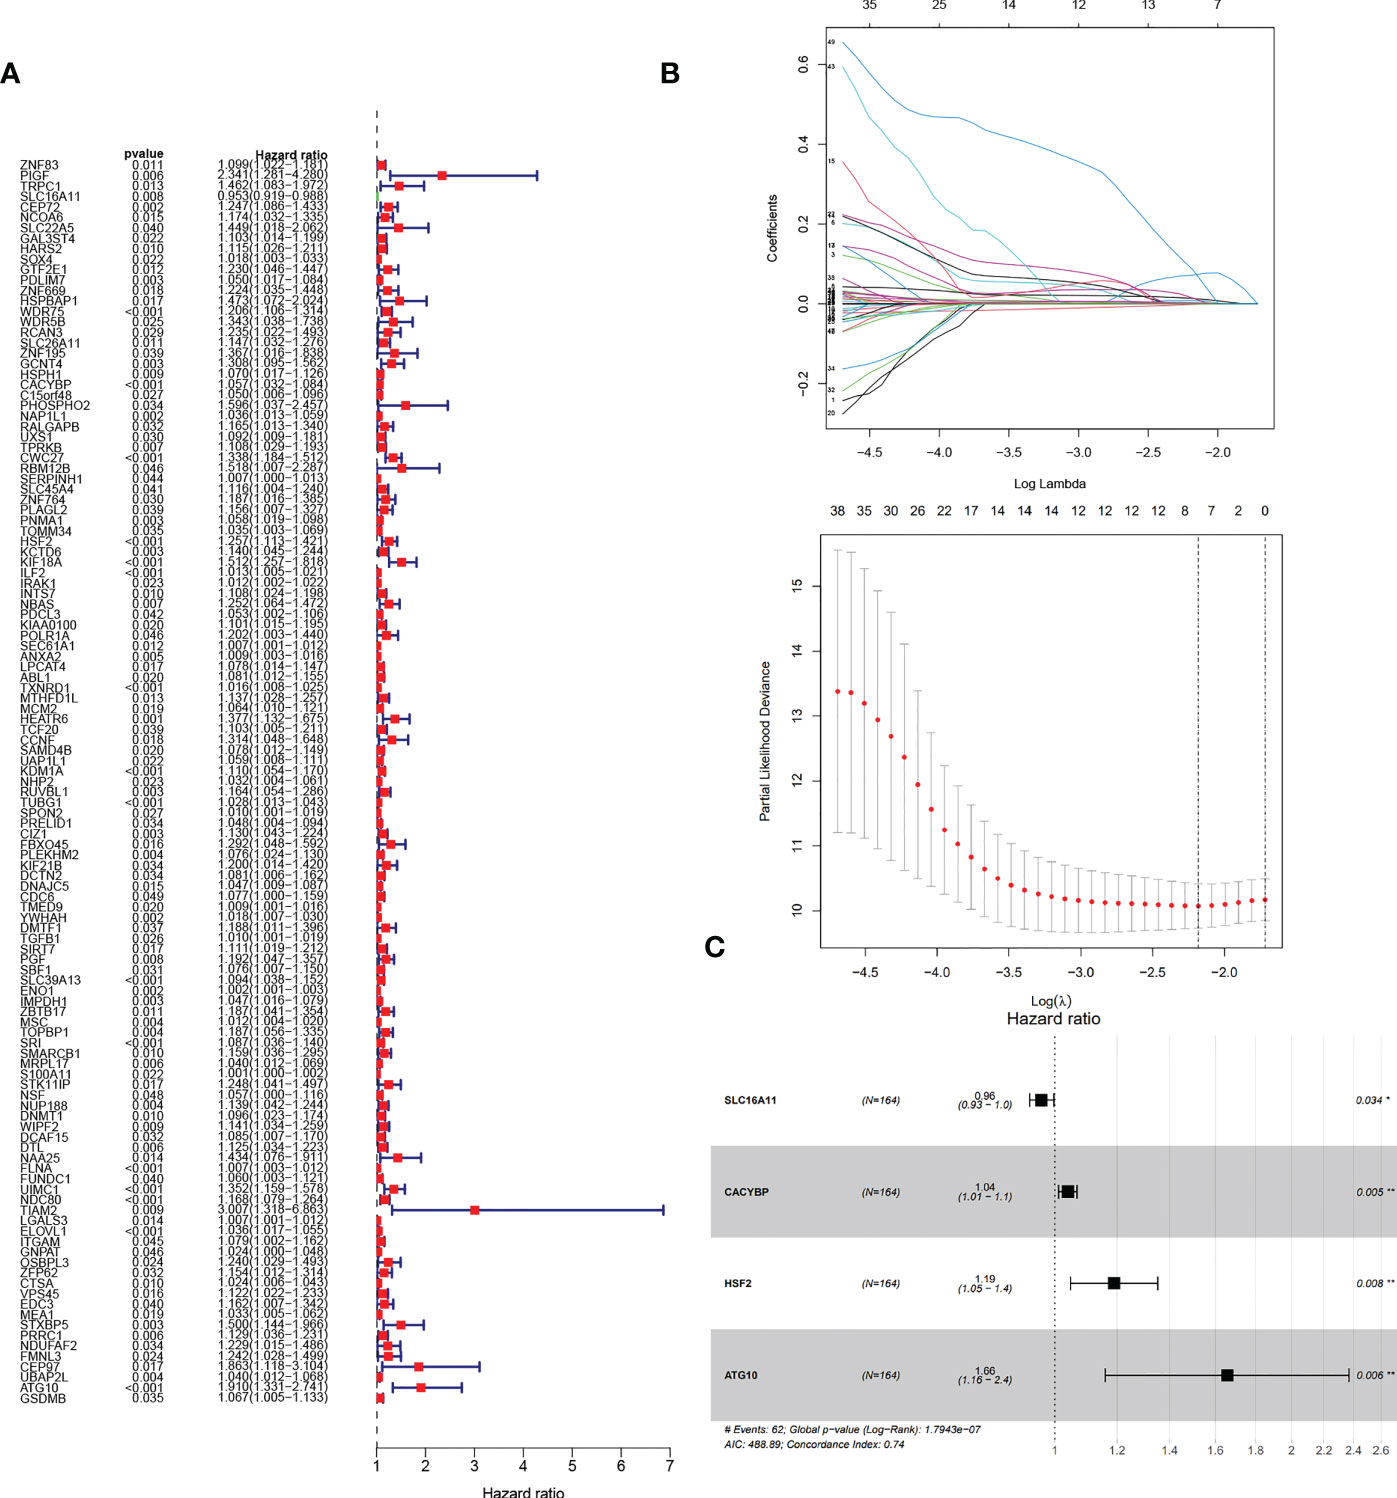
Figure 5 Construction of Tex-related HCC prognostic model. (A) The prognostic Tex-related genes extracted by univariate Cox regression analysis. (B) LASSO regression analysis and coefficients of Tex-related HCC prognostic model-constructed genes obtained by LASSO. (C) Multivariate analyses of model genes obtained from lasso regression analysis in the TCGA cohort. Hazard ratios are adjusted by the variables shown in this figure.
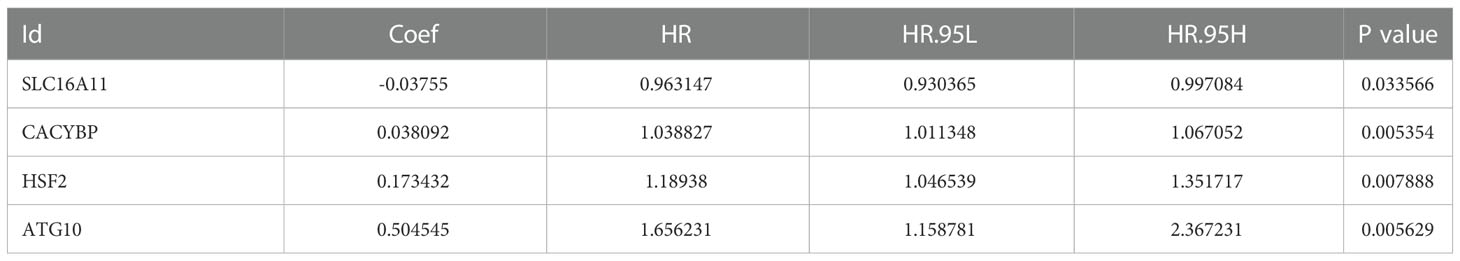
Table 4 Tex-related prognostic model by multivariate Cox regression.

Figure 6 Evaluation and verification of Tex-related HCC prognostic model in TCGA training and testing sets. (A) Kaplan-Meier curve; ROC curves; Scatter plot of the risk score, overall survival, and corresponding heatmap in TCGA training set. (B) Kaplan-Meier curve; ROC curves; Scatter plot of the risk score, overall survival, and corresponding heatmap in TCGA testing set.
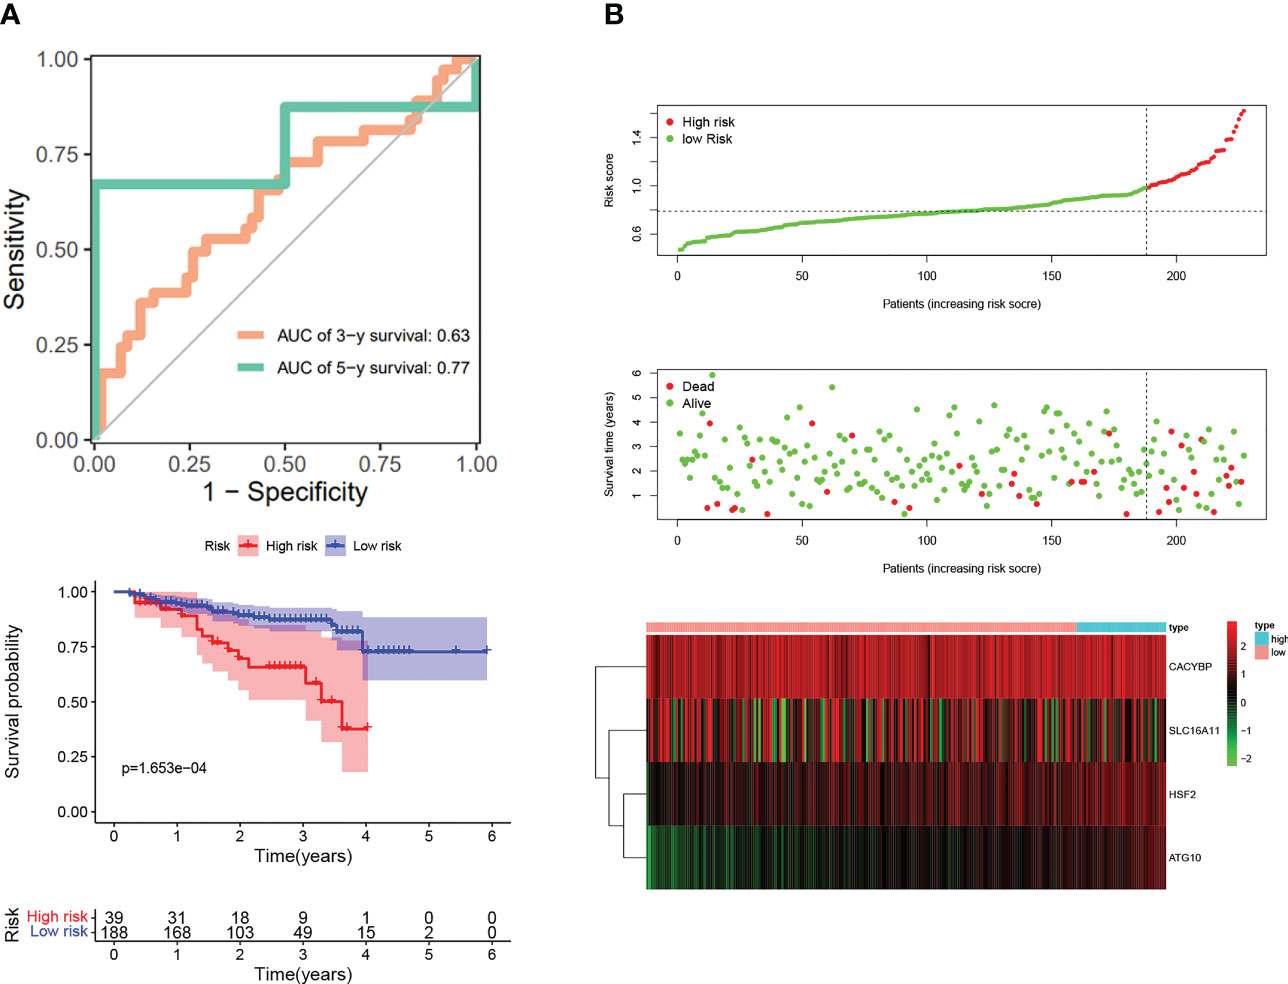
Figure 7 Validation of Tex-related HCC prognostic model in independent ICGC cohort. (A) Kaplan-Meier curve; ROC curves. (B) Scatter plot of the risk score, overall survival, and corresponding heatmap in ICGC verification set.

Table 5 The clinical characteristics of two cohort.
We performed independent prognostic analyses to explore further the relationship between the risk model and clinical features, analyzing whether Tex signature can be used as an independent prognostic feature of HCC. In univariate Cox regression, the hazard ratio (HR) of the risk score was 1.301, and the 95% confidence interval (CI) was 1.121–1.518 (p < 0.001), while in multivariate Cox regression, they were 1.197 and 1.017-1.410 (p < 0.05). In addition, we identified that Grade was another independent prognostic parameter with HR 1.868 and 95%CI 1.012 - 3.450 (p < 0.05) (Figure 8A). Interestingly, it was observed that risk signatures could accurately reflect tumor grade characteristics and the expression level of CACYBP is also correlated with grade (p < 0.05) (Figure 8B). These results indicate that the HCC prognostic model constructed based on the four Tex-related genes can accurately reflect the degree of tumor progression, providing a basis for prognostic prediction and clinical decision-making.
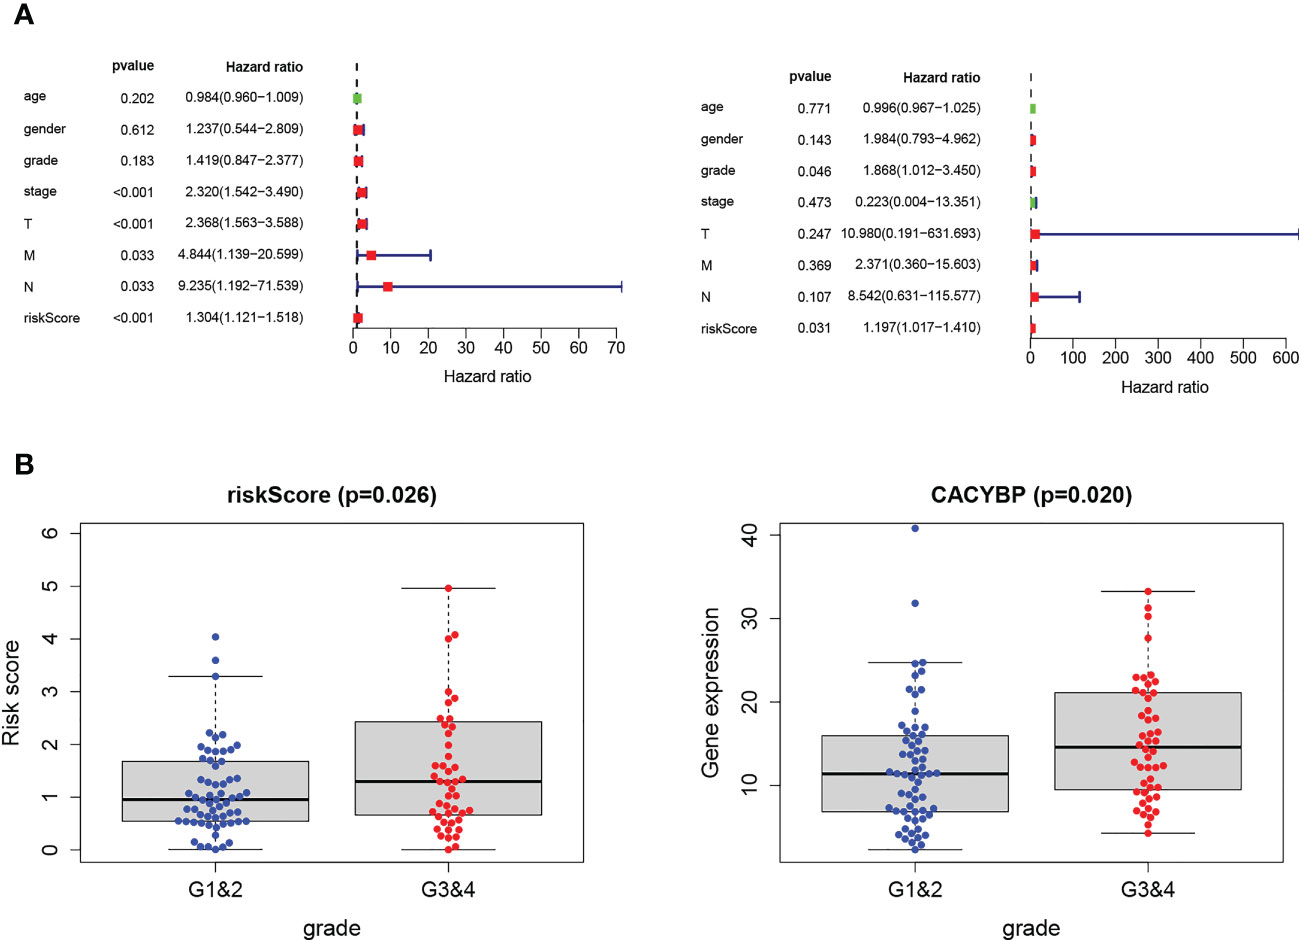
Figure 8 Validation of Tex-related HCC prognostic model in independent ICGC cohort. (A) Univariate and multivariate analyses indicated that the Grade and the risk score were independent prognostic factors of HCC patients. (B) The risk score and CACYBP had a significant correlation with Grade classification. *** indicates significant difference at p < 0.001.
We have established a Tex-related HCC prognostic model, and we wonder if this will help to guide clinical immunotherapy. Through the TIDE algorithm, we found that the high-risk group showed a promising response to immunotherapy (Figure 9A). Therefore, the Tex-related risk signature prognostic value was further tested based on IMvigor210 and GSE78220 cohorts ICB therapy. In the IMvigor210 cohort, patients’ respondence to anti-PD-L1 receptor blockers were classified into complete response (CR), partial response (PR), stable disease (SD), and progressive disease (PD) four outcomings. SD/PD patients acquired higher risk scores than CR/PR patients (Figure 9B). In the high-risk group, the percentage of SD/PD was higher than that in the low-risk group (Figure 9C). We observed that risk score demonstrated valuable prediction capacity and patients in the high-risk group showed significant clinical benefits than that of those in the low-risk group in the IMvigor210 cohort (p = 0.0011) (Figure 9D). Specifically, in the Stage I+II subgroup analysis, there were significant survival differences between the two risk groups (p = 0.0078) (Figure 9E). But not significantly different in Stage III+IV subgroup (p = 0.07) (Figure 9F). However, in the GSE78220 cohort, the patients between two groups didn’t demonstrate survival differences, which may because they were derived from melanomas data (Figure 9G). In conclusion, the results proofed that the Tex-related risk model makes sense in immunotherapy prediction.
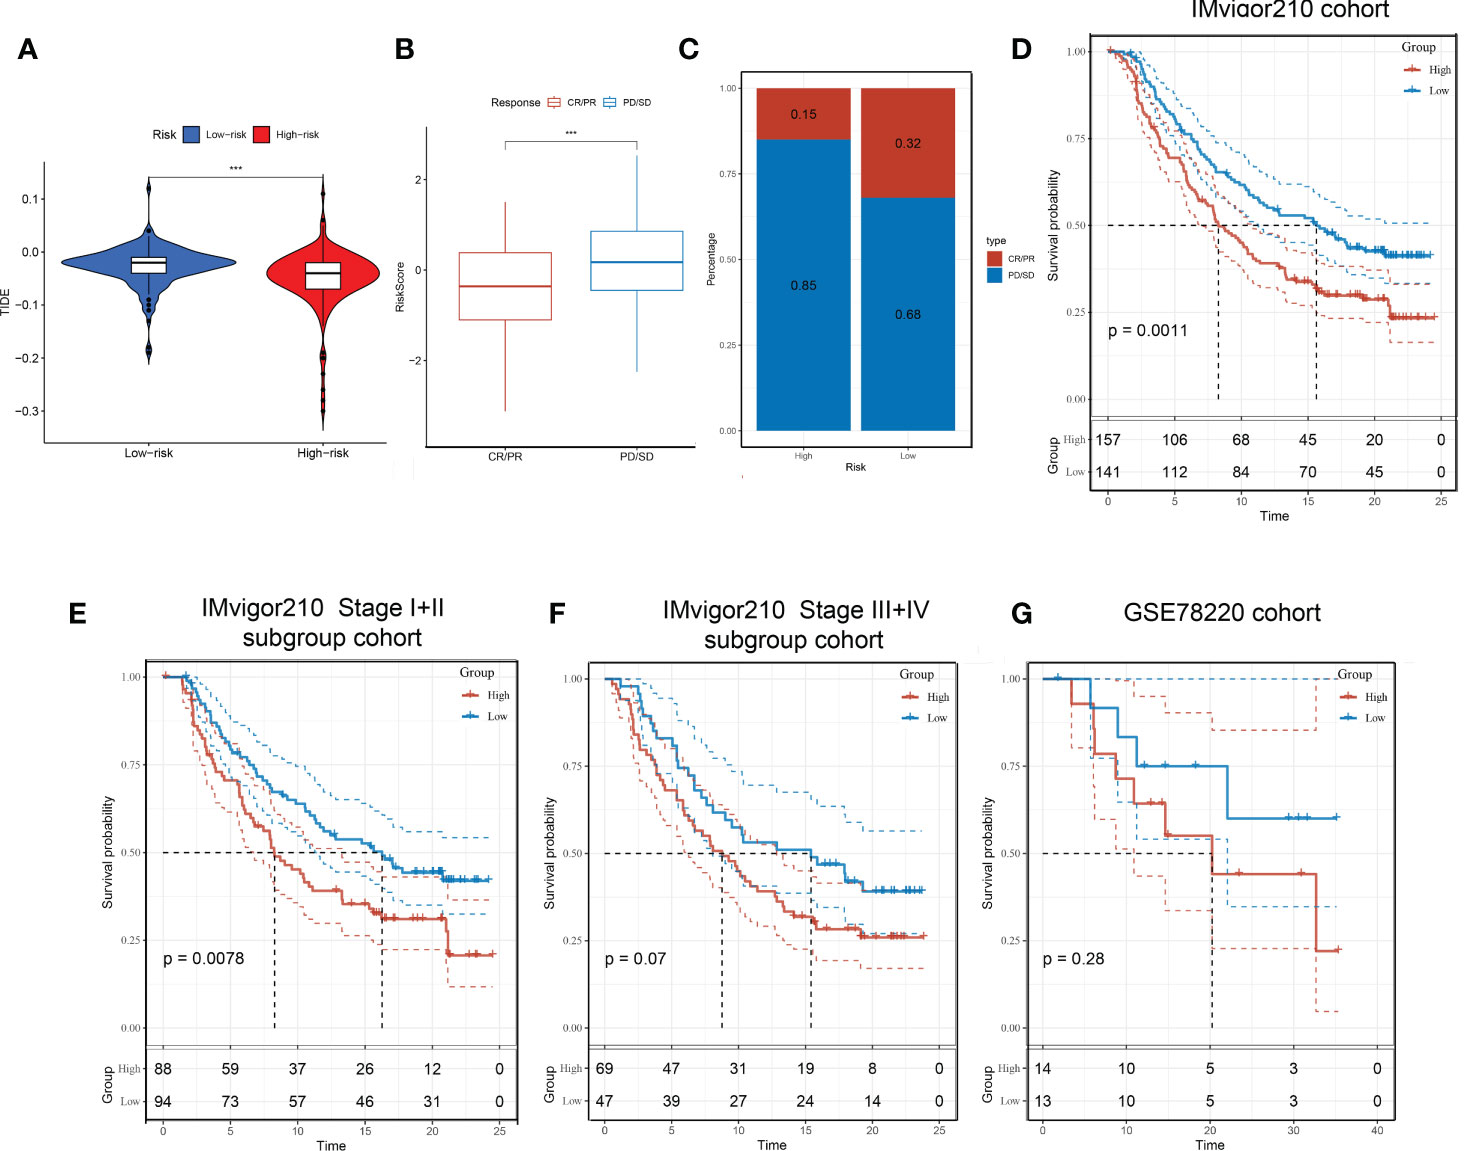
Figure 9 Immunotherapeutic responses in high- and low-risk groups with HCC. (A) Correlation between risk score and immunotherapy response. (B) In the IMvigor210 cohort, patients’ prognostic was related to Tex-related risk score. (C) Distribution of immunotherapy responses among high- and low-risk groups in the IMvigor210 cohort. (D-F) Prognostic differences among risk score groups in the IMvigor210 cohort (D), Stage I+II subgroup (E), and Stage III+IV subgroup (F). (G) prognostic differences between high- and low-risk groups in the GSE78220 cohort.
Four genes composing the prognostic model were analyzed based on GSE67801(Figure 10A) and GSE111449 (Figure 10B) databases to further investigate the role of Tex-related prognostic genes. Analysis was performed using immunologic signatures (GSEA C7) gene sets, and Top5 relevant data sets were displayed. The results showed that these four genes were strongly correlated with immune activation and CD8+T exhaustion, which proved the reliability of our model.
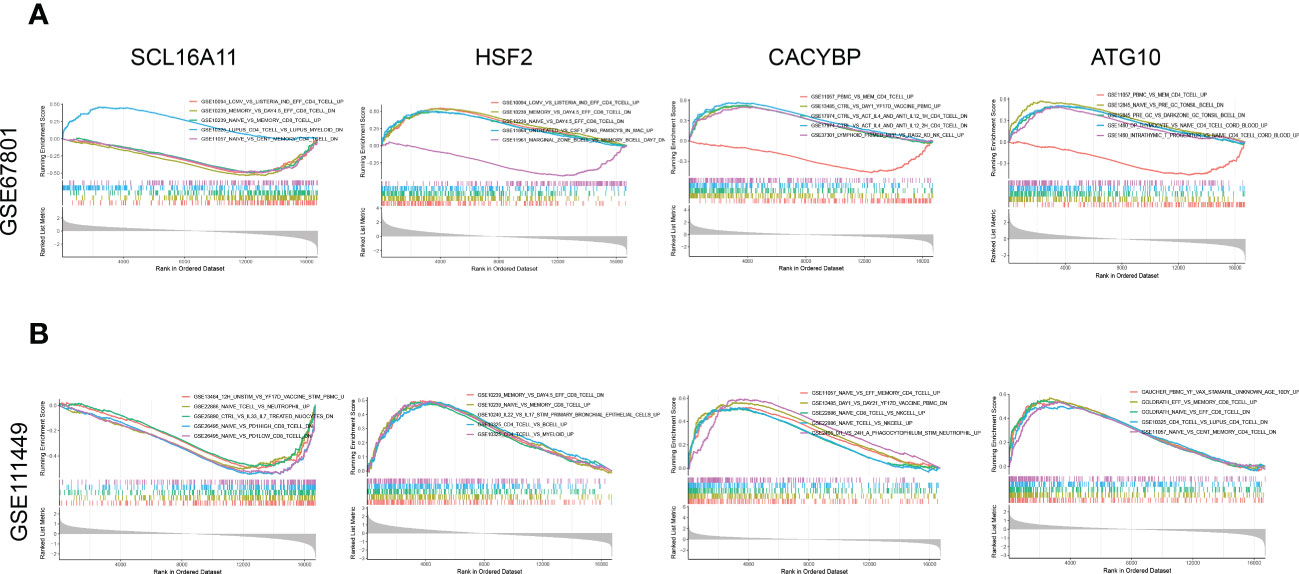
Figure 10 GSEA enrichment analysis for Tex-related HCC prognostic genes. (A) Enrichment analysis of immune-related data sets for SLC16A11, CACYBP, HSF2, and ATG10 based on the GSE67801 profile. (B) Enrichment analysis of immune-related data sets for SLC16A11, CACYBP, HSF2, and ATG10 based on the GSE111449 profile.
The CD3+T cells were activated and amplified by CD3/CD28 magnetic beads to induce exhaustion. The T cell exhaustion state was compared between the fourth cycle stimulated T cells with those NC. The expressions of inhibitory receptors PD-1 and Tim-3 were detected by flow cytometry (Figure 11A), and qRT-PCR identified the expression of exhaustion-related hub genes and transcription factors (Figure 11B). Four Tex-related prognostic genes were compared between HCC tissues and normal tissues (Figure 11C). The results demonstrate the predictive value of Tex-related genes in the HCC prognosis model.
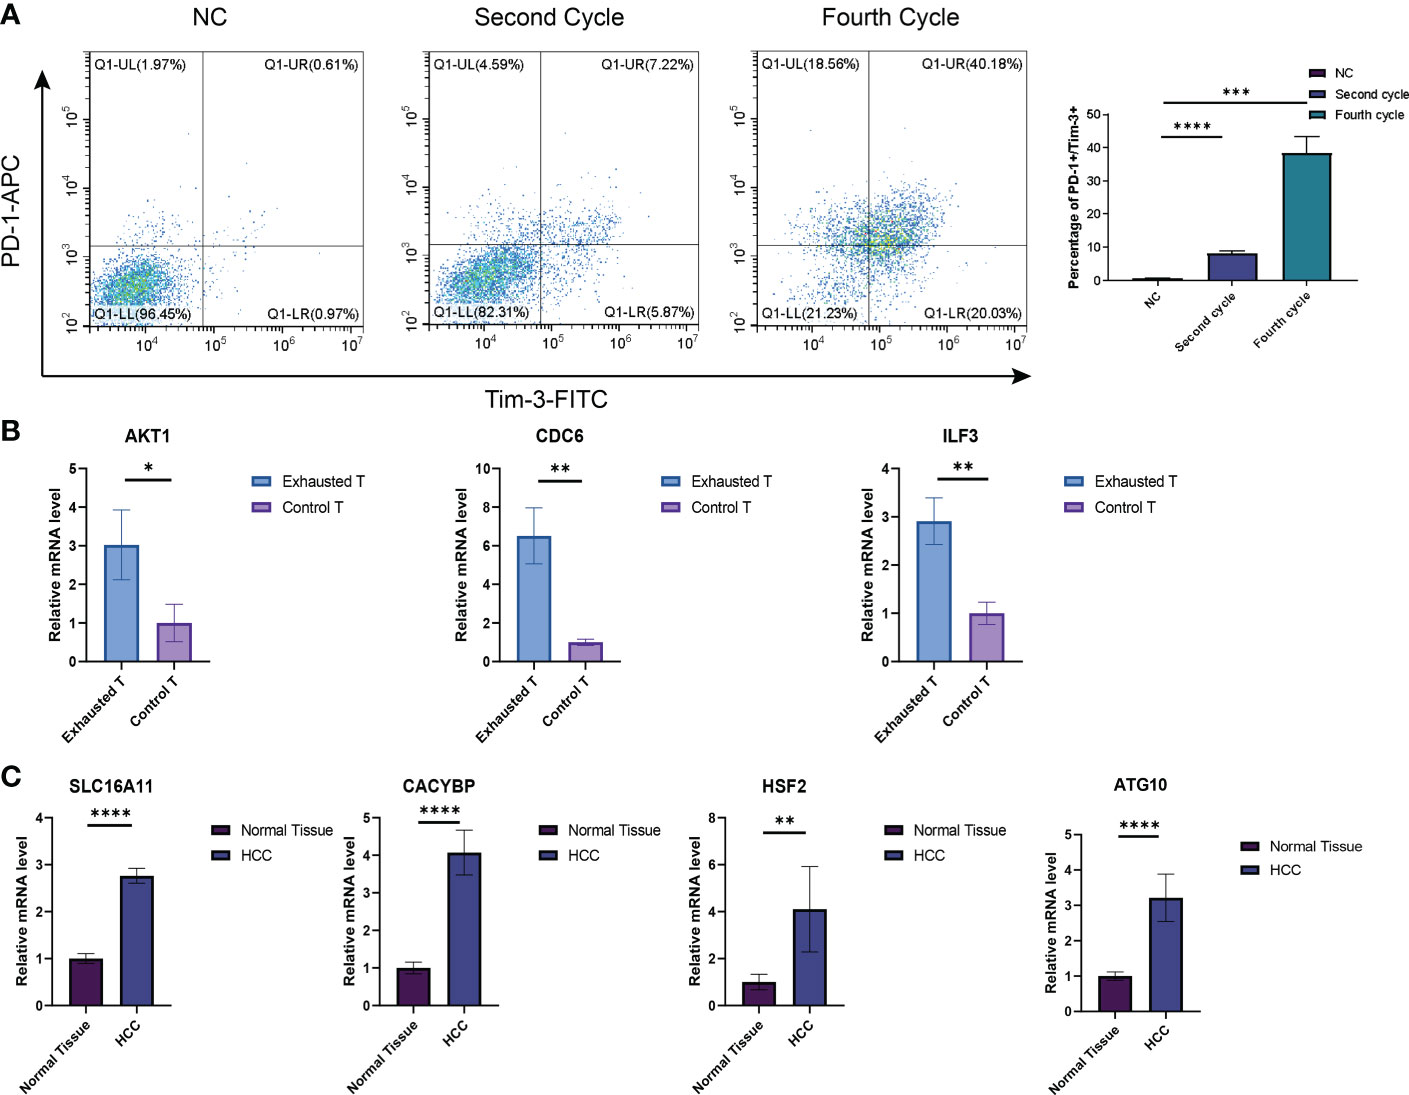
Figure 11 Verification of Tex signature by in vitro experiments. (A) Detection of the inhibitory receptor PD-1 and Tim-3 in T cells with different cycles of expansion. N=3 (B) qRT-PCR was used to detect exhaustion gene expression between the fourth cycle expanded T cells and NC cells. N = 3 (C) The expression of SLC16A11, CACYBP, HSF2, and ATG10 in HCC tissues and control tissues was detected by PCR. N = 5. *indicates significant difference at p < 0.05, ** indicates significant difference at p < 0.01, *** indicates significant difference at p < 0.001, **** indicates significant difference at P <0.0001.
With the popularization of immunotherapy and gene therapy, the prognosis of patients with HCC, especially those with advanced HCC, has been significantly improved. However, due to chronic viral infection, heterogeneity of tumors, and the special physiological structure of the liver, the immune microenvironment, the immune inhibition state of HCC, and the level of immune exhaustion have become important factors affecting the efficacy of immunotherapy (19). There is still a lack of effective biomarkers and prognostic models for HCC (20, 21). Therefore, a reliable and effective predictive model is critical for HCC treatment. This study established a prognostic model based on Tex-related genes and validated it in different databases. The results showed that the risk model could accurately reflect the prognosis of patients with HCC.
After acute infection and vaccination, naive T cells, activated by antigen, co-stimulation, and inflammation, proliferate exponentially to differentiate into effector T cells and memory T cells (22, 23). In patients with chronic infections and cancer, long-term exposure to persistent antigens and inflammation causes persistent stimulation of T cells, during which exhausted T cells gradually become unfunctional. Tex cells possess properties of progressive loss-of-effector function, poor memory recall, high and sustained inhibitory receptor expression, and metabolic and epigenetic reprogramming, distinguishing Tex from effector T cells and memory T cells (24–27). Studies on various tumor immune microenvironments, including liver cancer, melanoma, and lung cancer, have found that tumor-infiltrating T cells are usually exhausted, and the degree of exhaustion correlated with prognosis (28–30). Some key genes and transcription factors that induce Tex are gradually discovered. For example, NR4A and Tox family transcription factors were identified as key mediators of T cell exhaustion’s epigenetic and transcriptional programs (31, 32). The hypoxic microenvironment leads to cellular mitochondrial dysfunction, triggering the expression of transcriptional repressor BLIMP1 and producing Tex (33). Several approaches to partially reverse the T cell exhaustion phenotype through gene editing or small molecules and enhance the efficacy of immunotherapy have also been found. The classic example is immune checkpoint inhibitors help to suppress the expression of inhibitory receptors, reverse the exhausted T cell state, and restore tumor-infiltrating T cell (TIL) function (34). It has been proven to have a powerful anti-tumor effect. However, the mechanism of Tex induction is still not fully understood. The relationship between Tex and tumor and how to use Tex to guide tumor clinical treatment practice and predict patients’ prognosis still lacks effective models. In addition, like other immune cells, Tex T cells are heterogeneous, including progenitors and terminal subsets with unique characteristics. In conclusion, exploring the mechanism of Tex and constructing effective prognostic models may be of great significance for tumor therapy.
This study analyzed the Tex signature and its potential in HCC prediction. First, we constructed a Tex-related gene set based on GEO datasets and identified the hub genes through bioinformatic analysis. GO, KEGG, and GSEA enrichment analysis confirmed the promoting effect of these hub genes on Tex. Through prediction, we constructed transcription factor regulatory networks for hub genes. These transcription factors include: ILF3, RFXANK, RFXAP, RFX5, CIITA, RELA, NFKB1, AR, E2F1, STAT3 and JUN. Consistent with the conclusions of other studies, NFKB1/RelA heterodimers participated in NF-κB signaling pathway activation, which is an important factor for Tex production (35–37). Transcription factors CIITA, RFX5, RFXAP, and RFXANK mutations have been associated with Major histocompatibility complex (MHC) II deficiency, so they’re also associated with immune exhaustion. Tumor-derived cytokines such as IL-6 and IL-27 have promoted PD-L1+CD8+ T cells development through STAT1/STAT3 signaling (38, 39). ILF3 promotes the production of several tumors and is closely related to cellular senescence (40, 41). We also explored small molecules to target these transcription factors. Rutin, for example, a quercetin glycoside, possesses antioxidant and anti-aging properties. In conclusion, these results indicate that the Tex-related targets we have found are relatively accurate, and they may help to find ways for Tex state reversion and rejuvenate the immune system.
Further, Tex-related genes SLC16A11, CACYBP, HSF2, and ATG10 were selected to build a prognostic model for HCC, and excellent predictive capacity was demonstrated in the independent training, testing, and validation sets. SLC16A11, a protein in the endoplasmic reticulum and plasma membrane, is involved in pyruvate transport and lipid metabolism. Its abnormal expression or mutation is associated with various metabolic diseases such as type 2 diabetes, fatty liver, and obesity, all of which are risk factors for aging and cancer (42, 43). Therefore, the SLC16A11 gene may be an important target for regulating cellular senescence, immune cell exhaustion, and tumorigenesis. CACYBP is a calcyclin-binding protein. CACYBP has been reported as an independent prognostic factor in multiple cancers such as HCC and gastric cancer (44, 45). Moreover, it has also been identified as an immune-related biomarker with guiding value for the prognosis and immunotherapy effect in HCC, esophageal cancer, bladder cancer, and other tumors (45–47). A study based on single-cell sequencing has found that CACYBP can be used as an effective indicator to evaluate the efficacy of anti-PD-1 therapy and significantly up-regulated in exhausted CD8+T cells (48). HSF2 belongs to the HSF family of transcription factors. As a Heat shock protein, it has been reported to be associated with cellular stress and aging in diverse cells, including mesenchymal stem cells, skeletal muscle, and T cells (49–51). Through various bioinformatics, it has been related to immune cell infiltration and tumor immune microenvironment across different cancer types (52). Finally, the autophagy-related gene ATG10 regulated the formation of autophagosomes and participated in the anti-virus immune response (53). It has been identified as a downstream target of the PI3K/AKT/mTOR signaling pathway, is involved in various biological processes, and is closely related to aging (54). In conclusion, these Tex-related genes play an important role in immune exhaustion, cellular senescence, and tumorigenesis to provide a basis for the rationality of this prognostic model.
Although the study was based primarily on bioinformatics analysis, it has many implications. On the one hand, the study found the Tex gene set based on three etiologies-induced Tex cells data sets and explored its hub genes and transcription factors, which helps to reverse the characteristics of T cell exhaustion and to improve the effect of tumor immunotherapy. On the other hand, the prognostic model of HCC constructed by Tex-related genes has a good predictive function in both TCGA and ICGA data sets and can guide the clinical treatment of HCC. However, the study also has some limitations. First, we identified the Tex-related transcription factor regulating network and their targeting of small molecules, but the reversion effect lacked experimental verification. Second, Due to sequencing depth issues, some tumor-infiltrating T cells’ genes may be biased, and the role of some Tex genes may be neglected. Third, in HCC model construction and verification, separating CD8+T cells in HCC tissue is better for measuring the expression of hub genes or transcription factors. These shortcomings will be gradually overcome in the following research.
Our study demonstrated that Tex-related genes might provide accurate prediction for HCC patients in clinical decision-making, prognostic assessment, and immunotherapy. In addition, targeting the hub genes or transcription factors may help to reverse T cell function and enhance the effect of tumor immunotherapy.
The original contributions presented in the study are included in the article/Supplementary Material. Further inquiries can be directed to the corresponding author.
The samples acquired in this study and all of the experiments were approved by the Ethics Committee of Chinese PLA General Hospital (Beijing). The patients/participants provided their written informed consent to participate in this study.
JS, GL, and LL conceptualized and designed the study. JS, GL, XY, YW, and MG performed the experiments and analyzed the data. XY, CL, and XG contributed significantly to the interpretation of the data. JS, GL, and LL wrote the manuscript. SL designed, supervised the research, and wrote the manuscript. All authors contributed to the article and approved the submitted version.
The authors declare that the research was conducted without any commercial or financial relationships that could be construed as a potential conflict of interest.
All claims expressed in this article are solely those of the authors and do not necessarily represent those of their affiliated organizations, or those of the publisher, the editors and the reviewers. Any product that may be evaluated in this article, or claim that may be made by its manufacturer, is not guaranteed or endorsed by the publisher.
The Supplementary Material for this article can be found online at: https://www.frontiersin.org/articles/10.3389/fimmu.2023.1166052/full#supplementary-material
1. Couri T, Pillai A. Goals and targets for personalized therapy for HCC. Hepatol Int (2019) 13(2):125–37. doi: 10.1007/s12072-018-9919-1
2. Levrero M, Zucman-Rossi J. Mechanisms of HBV-induced hepatocellular carcinoma. J Hepatol (2016) 64(1 Suppl):S84–S101. doi: 10.1016/j.jhep.2016.02.021
3. Chakraborty E, Sarkar D. Emerging therapies for hepatocellular carcinoma (HCC). Cancers (Basel). (2022) 14(11):2798. doi: 10.3390/cancers14112798
4. Donisi C, Puzzoni M, Ziranu P, Lai E, Mariani S, Saba G, et al. Immune checkpoint inhibitors in the treatment of HCC. Front Oncol (2020) 10:601240. doi: 10.3389/fonc.2020.601240
5. Giraud J, Chalopin D, Blanc J-F, Saleh M. Hepatocellular carcinoma immune landscape and the potential of immunotherapies. Front Immunol (2021) 12:655697. doi: 10.3389/fimmu.2021.655697
6. Wang K, Wang C, Jiang H, Zhang Y, Lin W, Mo J, et al. Combination of ablation and immunotherapy for hepatocellular carcinoma: Where we are and where to go. Front Immunol (2021) 12:792781. doi: 10.3389/fimmu.2021.792781
7. Franco F, Jaccard A, Romero P, Yu Y-R, Ho P-C. Metabolic and epigenetic regulation of T-cell exhaustion. Nat Metab (2020) 2(10):1001–12. doi: 10.1038/s42255-020-00280-9
8. Belk JA, Daniel B, Satpathy AT. Epigenetic regulation of T cell exhaustion. Nat Immunol (2022) 23(6):848–60. doi: 10.1038/s41590-022-01224-z
9. Kallies A, Zehn D, Utzschneider DT. Precursor exhausted T cells: key to successful immunotherapy? Nat Rev Immunol (2020) 20(2):128–36. doi: 10.1038/s41577-019-0223-7
11. Ma J, Zheng B, Goswami S, Meng L, Zhang D, Cao C, et al. PD1Hi CD8+ T cells correlate with exhausted signature and poor clinical outcome in hepatocellular carcinoma. J Immunother Cancer. (2019) 7(1):331. doi: 10.1186/s40425-019-0814-7
12. Hsu C-L, Ou D-L, Bai L-Y, Chen C-W, Lin L, Huang S-F, et al. Exploring markers of exhausted CD8 T cells to predict response to immune checkpoint inhibitor therapy for hepatocellular carcinoma. Liver Cancer. (2021) 10(4):346–59. doi: 10.1159/000515305
13. Jiang W, He Y, He W, Wu G, Zhou X, Sheng Q, et al. Exhausted CD8+T cells in the tumor immune microenvironment: New pathways to therapy. Front Immunol (2020) 11:622509. doi: 10.3389/fimmu.2020.622509
14. Racanelli V, Rehermann B. The liver as an immunological organ. Hepatology (2006) 43(2 Suppl 1):S54–62. doi: 10.1002/hep.21060
15. Bai J, Liang P, Li Q, Feng R, Liu J. Cancer immunotherapy - immune checkpoint inhibitors in hepatocellular carcinoma. Recent Pat Anticancer Drug Discovery (2021) 16(2):239–48. doi: 10.2174/1574892816666210212145107
16. Hossain MA, Liu G, Dai B, Si Y, Yang Q, Wazir J, et al. Reinvigorating exhausted CD8+ cytotoxic T lymphocytes in the tumor microenvironment and current strategies in cancer immunotherapy. Med Res Rev (2021) 41(1):156–201. doi: 10.1002/med.21727
17. Shoukry NH, Walker CM. T Cell responses during HBV and HCV infections: similar but not quite the same? Curr Opin Virol (2021) 51:80–6. doi: 10.1016/j.coviro.2021.08.011
18. Farhood B, Najafi M, Mortezaee K. CD8+ cytotoxic T lymphocytes in cancer immunotherapy: A review. J Cell Physiol (2019) 234(6):8509–21. doi: 10.1002/jcp.27782
19. Sangro B, Sarobe P, Hervás-Stubbs S, Melero I. Advances in immunotherapy for hepatocellular carcinoma. Nat Rev Gastroenterol Hepatol (2021) 18(8):525–43. doi: 10.1038/s41575-021-00438-0
20. Piñero F, Dirchwolf M, Pessôa MG. Biomarkers in hepatocellular carcinoma: Diagnosis, prognosis and treatment response assessment. Cells (2020) 9(6):1370. doi: 10.3390/cells9061370
21. De Stefano F, Chacon E, Turcios L, Marti F, Gedaly R. Novel biomarkers in hepatocellular carcinoma. Dig Liver Dis (2018) 50(11):1115–23. doi: 10.1016/j.dld.2018.08.019
22. Zhu J. T Helper cell differentiation, heterogeneity, and plasticity. Cold Spring Harb Perspect Biol (2018) 10(10):a030338. doi: 10.1101/cshperspect.a030338
23. Henning AN, Roychoudhuri R, Restifo NP. Epigenetic control of CD8+ T cell differentiation. Nat Rev Immunol (2018) 18(5):340–56. doi: 10.1038/nri.2017.146
24. Minato N, Hattori M, Hamazaki Y. Physiology and pathology of T-cell aging. Int Immunol (2020) 32(4):223–31. doi: 10.1093/intimm/dxaa006
25. Lewis DA, Ly T. Cell cycle entry control in naïve and memory CD8+ T cells. Front Cell Dev Biol (2021) 9:727441. doi: 10.3389/fcell.2021.727441
26. Scharping NE, Rivadeneira DB, Menk AV, Vignali PDA, Ford BR, Rittenhouse NL, et al. Mitochondrial stress induced by continuous stimulation under hypoxia rapidly drives T cell exhaustion. Nat Immunol (2021) 22(2):205–15. doi: 10.1038/s41590-020-00834-9
27. Ma X, Bi E, Lu Y, Su P, Huang C, Liu L, et al. Cholesterol induces CD8+ T cell exhaustion in the tumor microenvironment. Cell Metab (2019) 30(1):143–156.e5. doi: 10.1016/j.cmet.2019.04.002
28. Zheng C, Zheng L, Yoo J-K, Guo H, Zhang Y, Guo X, et al. Landscape of infiltrating T cells in liver cancer revealed by single-cell sequencing. Cell (2017) 169(7):1342–1356.e16. doi: 10.1016/j.cell.2017.05.035
29. Liu Y, Zhou N, Zhou L, Wang J, Zhou Y, Zhang T, et al. IL-2 regulates tumor-reactive CD8+ T cell exhaustion by activating the aryl hydrocarbon receptor. Nat Immunol (2021) 22(3):358–69. doi: 10.1038/s41590-020-00850-9
30. Guo X, Zhang Y, Zheng L, Zheng C, Song J, Zhang Q, et al. Global characterization of T cells in non-small-cell lung cancer by single-cell sequencing. Nat Med (2018) 24(7):978–85. doi: 10.1038/s41591-018-0045-3
31. Khan O, Giles JR, McDonald S, Manne S, Ngiow SF, Patel KP, et al. TOX transcriptionally and epigenetically programs CD8+ T cell exhaustion. Nature (2019) 571(7764):211–8. doi: 10.1038/s41586-019-1325-x
32. Seo H, Chen J, González-Avalos E, Samaniego-Castruita D, Das A, Wang YH, et al. TOX and TOX2 transcription factors cooperate with NR4A transcription factors to impose CD8+ T cell exhaustion. Proc Natl Acad Sci U S A. (2019) 116(25):12410–5. doi: 10.1073/pnas.1905675116
33. Jung I-Y, Narayan V, McDonald S, Rech AJ, Bartoszek R, Hong G, et al. BLIMP1 and NR4A3 transcription factors reciprocally regulate antitumor CAR T cell stemness and exhaustion. Sci Transl Med (2022) 14(670):eabn7336. doi: 10.1126/scitranslmed.abn7336
34. Budimir N, Thomas GD, Dolina JS, Salek-Ardakani S. Reversing T-cell exhaustion in cancer: Lessons learned from PD-1/PD-L1 immune checkpoint blockade. Cancer Immunol Res (2022) 10(2):146–53. doi: 10.1158/2326-6066.CIR-21-0515
35. Rong D, Sun G, Zheng Z, Liu L, Chen X, Wu F, et al. MGP promotes CD8+ T cell exhaustion by activating the NF-κB pathway leading to liver metastasis of colorectal cancer. Int J Biol Sci (2022) 18(6):2345–61. doi: 10.7150/ijbs.70137
36. Liu L, Wang A, Liu X, Han S, Sun Y, Zhang J, et al. Blocking TIGIT/CD155 signalling reverses CD8+ T cell exhaustion and enhances the antitumor activity in cervical cancer. J Transl Med (2022) 20(1):280. doi: 10.1186/s12967-022-03480-x
37. Legut M, Gajic Z, Guarino M, Daniloski Z, Rahman JA, Xue X, et al. A genome-scale screen for synthetic drivers of T cell proliferation. Nature (2022) 603(7902):728–35. doi: 10.1038/s41586-022-04494-7
38. Zheng Y, Han L, Chen Z, Li Y, Zhou B, Hu R, et al. PD-L1+CD8+ T cells enrichment in lung cancer exerted regulatory function and tumor-promoting tolerance. iScience (2022) 25(2):103785. doi: 10.1016/j.isci.2022.103785
39. Zhang G-Q, Jiao Q, Shen C-T, Song H-J, Zhang H-Z, Qiu Z-L, et al. Interleukin 6 regulates the expression of programmed cell death ligand 1 in thyroid cancer. Cancer Sci (2021) 112(3):997–1010. doi: 10.1111/cas.14752
40. Li K, Wu J-L, Qin B, Fan Z, Tang Q, Lu W, et al. ILF3 is a substrate of SPOP for regulating serine biosynthesis in colorectal cancer. Cell Res (2020) 30(2):163–78. doi: 10.1038/s41422-019-0257-1
41. Sun D, Zhang M, Wei M, Wang Z, Qiao W, Liu P, et al. Ox-LDL-mediated ILF3 overexpression in gastric cancer progression by activating the PI3K/AKT/mTOR signaling pathway. Aging (Albany NY). (2022) 14(9):3887–909. doi: 10.18632/aging.204051
42. Almeda-Valdes P, Gómez Velasco DV, Arellano Campos O, Bello-Chavolla OY, Del Rocío Sevilla-González M, Viveros Ruiz T, et al. The SLC16A11 risk haplotype is associated with decreased insulin action, higher transaminases and large-size adipocytes. Eur J Endocrinol (2019) 180(2):99–107. doi: 10.1530/EJE-18-0677
43. Sevilla-Domingo M, Olivo-Ramirez CG, Huerta-Padilla VM, Gómez-Díaz RA, González-Carranza E, Acevedo-Rodriguez GE, et al. Downregulation of SLC16A11 is present in offspring of mothers with gestational diabetes. Arch Med Res (2022) 53(5):516–23. doi: 10.1016/j.arcmed.2022.07.002
44. Zhai H-H, Meng J, Wang J-B, Liu Z-X, Li Y-F, Feng S-S. CacyBP/SIP nuclear translocation induced by gastrin promotes gastric cancer cell proliferation. World J Gastroenterol (2014) 20(29):10062–70. doi: 10.3748/wjg.v20.i29.10062
45. Peng Y, Liu C, Li M, Li W, Zhang M, Jiang X, et al. Identification of a prognostic and therapeutic immune signature associated with hepatocellular carcinoma. Cancer Cell Int (2021) 21(1):98. doi: 10.1186/s12935-021-01792-4
46. Zhang Z, Chen C, Fang Y, Li S, Wang X, Sun L, et al. Development of a prognostic signature for esophageal cancer based on nine immune related genes. BMC Cancer. (2021) 21(1):113. doi: 10.1186/s12885-021-07813-9
47. Guo X, Wang Y, Zhang H, Qin C, Cheng A, Liu J, et al. Identification of the prognostic value of immune-related genes in esophageal cancer. Front Genet (2020) 11:989. doi: 10.3389/fgene.2020.00989
48. Jiang Y-Q, Wang Z-X, Zhong M, Shen L-J, Han X, Zou X, et al. Investigating mechanisms of response or resistance to immune checkpoint inhibitors by analyzing cell-cell communications in tumors before and after programmed cell death-1 (PD-1) targeted therapy: An integrative analysis using single-cell RNA and bulk-RNA sequencing data. Oncoimmunology (2021) 10(1):1908010. doi: 10.1080/2162402X.2021.1908010
49. Wu Y, Yang J, Ai Z, Yu M, Li J, Li S. Identification of key genes and transcription factors in aging mesenchymal stem cells by DNA microarray data. Gene (2019) 692:79–87. doi: 10.1016/j.gene.2018.12.063
50. Xiao X, Huang M, Fan C, Zuo F. DUOX2 participates in skin aging induced by UVB in HSF2 cells by activating NF-κB signaling. Exp Ther Med (2021) 21(2):157. doi: 10.3892/etm.2020.9588
51. Jurivich DA, Choo M, Welk J, Qiu L, Han K, Zhou X. Human aging alters the first phase of the molecular response to stress in T-cells. Exp Gerontol. (2005) 40(12):948–58. doi: 10.1016/j.exger.2005.08.003
52. Chen F, Fan Y, Liu X, Zhang J, Shang Y, Zhang B, et al. Pan-cancer integrated analysis of HSF2 expression, prognostic value and potential implications for cancer immunity. Front Mol Biosci (2021) 8:789703. doi: 10.3389/fmolb.2021.789703
53. Han Z, Wang W, Lv X, Zong Y, Liu S, Liu Z, et al. ATG10 (autophagy-related 10) regulates the formation of autophagosome in the anti-virus immune response of pacific oyster (Crassostrea gigas). Fish Shellfish Immunol (2019) 91:325–32. doi: 10.1016/j.fsi.2019.05.027
Keywords: CD8+ T, T cell exhaustion, hepatocellular carcinoma, prognostic model, survival analysis
Citation: Shi J, Li G, Liu L, Yuan X, Wang Y, Gong M, Li C, Ge X and Lu S (2023) Establishment and validation of exhausted CD8+ T cell feature as a prognostic model of HCC. Front. Immunol. 14:1166052. doi: 10.3389/fimmu.2023.1166052
Received: 14 February 2023; Accepted: 20 March 2023;
Published: 03 April 2023.
Edited by:
Jinghua Pan, Jinan University, ChinaReviewed by:
Shujun Li, Second Hospital of Hebei Medical University, ChinaCopyright © 2023 Shi, Li, Liu, Yuan, Wang, Gong, Li, Ge and Lu. This is an open-access article distributed under the terms of the Creative Commons Attribution License (CC BY). The use, distribution or reproduction in other forums is permitted, provided the original author(s) and the copyright owner(s) are credited and that the original publication in this journal is cited, in accordance with accepted academic practice. No use, distribution or reproduction is permitted which does not comply with these terms.
*Correspondence: Shichun Lu, bHVzY18zMDFAMTYzLmNvbQ==
†These authors have contributed equally to this work
Disclaimer: All claims expressed in this article are solely those of the authors and do not necessarily represent those of their affiliated organizations, or those of the publisher, the editors and the reviewers. Any product that may be evaluated in this article or claim that may be made by its manufacturer is not guaranteed or endorsed by the publisher.
Research integrity at Frontiers
Learn more about the work of our research integrity team to safeguard the quality of each article we publish.