 Alexandre Xavier1
 Maria Pia Campagna2
 Vicki E. Maltby3,4,5
 Trevor Kilpatrick6
 Bruce V. Taylor7Helmut Butzkueven2,8Anne-Louise Ponsonby6
 Rodney J. Scott1,9
 Vilija G. Jokubaitis2Rodney A. Lea1,10†Jeannette Lechner-Scott3,4,5*† on behalf of The Ausimmune Investigator Group
- 1School of Biomedical Science and Pharmacy, University of Newcastle, Newcastle, NSW, Australia
- 2Department of Neuroscience, Central Clinical School, Monash University, Melbourne, VIC, Australia
- 3Hunter Medical Research Institute, Immune Health research program, Newcastle, NSW, Australia
- 4Department of Neurology, John Hunter Hospital, Newcastle, NSW, Australia
- 5School of Medicine and Public Health, University of Newcastle, Newcastle, NSW, Australia
- 6Florey Institute of Neuroscience and Mental Health, The University of Melbourne, Parkville, VIC, Australia
- 7Menzies Institute for Medical Research, University of Tasmania, Hobart, TAS, Australia
- 8Neuro-Immunology Registry, MSBase Foundation, Melbourne, VIC, Australia
- 9New South Wales (NSW) Health Pathology, John Hunter Hospital, Newcastle, NSW, Australia
- 10Centre of Genomics and Personalised Health, School of Biomedical Sciences, Queensland University of Technology, Kelvin Grove, QLD, Australia
Introduction: Multiple Sclerosis (MS) has a complex pathophysiology that involves genetic and environmental factors. DNA methylation (DNAm) is one epigenetic mechanism that can reversibly modulate gene expression. Cell specific DNAm changes have been associated with MS, and some MS therapies such as dimethyl fumarate can influence DNAm. Interferon Beta (IFNβ), was one of the first disease modifying therapies in multiple sclerosis (MS). However, how IFNβ reduces disease burden in MS is not fully understood and little is known about the precise effect of IFNβ treatment on methylation.
Methods: The objective of this study was to determine the changes in DNAm associated with INFβ use, using methylation arrays and statistical deconvolutions on two separate datasets (total ntreated = 64, nuntreated = 285).
Results: We show that IFNβ treatment in people with MS modifies the methylation profile of interferon response genes in a strong, targeted, and reproducible manner. Using these identified methylation differences, we constructed a methylation treatment score (MTS) that is an accurate discriminator between untreated and treated patients (Area under the curve = 0.83). This MTS is time-sensitive and in consistent with previously identified IFNβ treatment therapeutic lag. This suggests that methylation changes are required for treatment efficacy. Overrepresentation analysis found that IFNβ treatment recruits the endogenous anti-viral molecular machinery. Finally, statistical deconvolution revealed that dendritic cells and regulatory CD4+ T cells were most affected by IFNβ induced methylation changes.
Discussion: In conclusion, our study shows that IFNβ treatment is a potent and targeted epigenetic modifier in multiple sclerosis.
Introduction
Interferon beta (IFNβ) was the first disease-modifying therapy (DMT) approved for use in multiple sclerosis (MS). Although it has been superseded by higher efficacy treatments in the last decade, it remains as a first-line treatment for MS in many countries. Despite its widespread use since 1995, the full biological mechanism of IFNβ treatment remains unclear as not all molecular targets have been identified. In short, IFNβ binds to the ubiquitously expressed interferon alpha/beta receptor (1), ultimately leading to suppressed inflammation (2) through various downstream events such as prevention of the blood–brain barrier migration (3), reduction in T cell activation, or promotion of oligodendrocyte differentiation [Hojati et al. (4)].
DNA methylation (DNAm) is a reversible epigenetic mechanism where a methyl group is added to a cytosine located next to a guanine, also known as a CpG. DNAm has been linked to gene expression modulation and is affected by both genetics and environment (5, 6). Epigenome-wide association studies (EWASs) of blood cell DNA have revealed that epigenetic signatures can change with various disease pharmacotherapies such as dimethyl fumarate (7), corticosteroids (8), or chemotherapies (9). IFNβ treatment has been shown to modulate global methylation in small studies using DNA from whole blood (10) and monocytes (11) in people with MS (pwMS). However, no specific description of those changes has been reported at the gene level. Analysis of DNAm may provide insight into precise mechanism of action of IFNβ by identifying new potential downstream target genes.
Methods
This study used two different existing datasets (see Table 1 for details): a discovery set (12) and a replication set (13). Each dataset was composed of pwMS, either untreated or treated with only IFNβ at the time of blood collection. DNA was extracted from whole blood and bisulfite-converted before being used on methylation arrays.
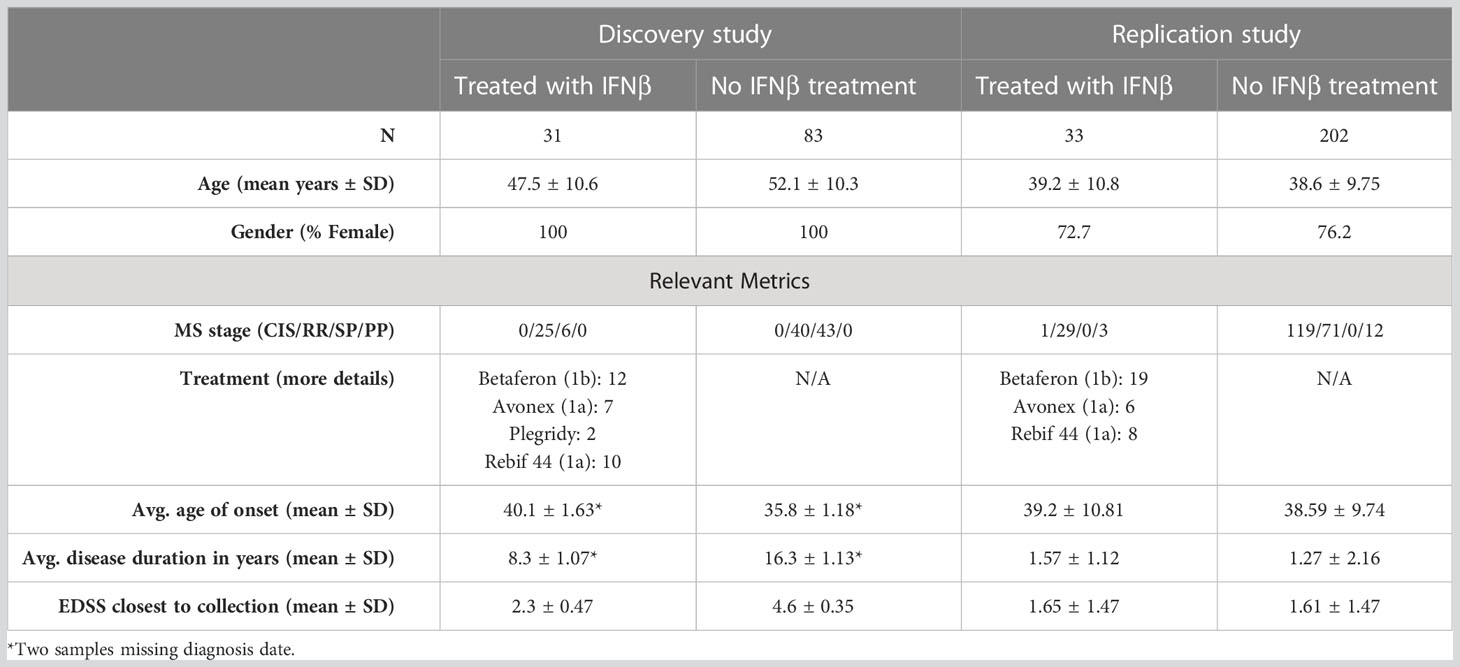
Table 1 Participant demographics.
Patient recruitment and blood collection
The discovery dataset consisted of samples from Australians attending outpatient clinics at the Royal Melbourne Hospital (VIC), Alfred Health (VIC), John Hunter Hospital (NSW), and Flinders Medical Centre (SA), who were participating in the MSBase Registry (14) and were recruited as part of the severity genome-wide association study (GWAS) (15). This dataset was composed of 114 female patients with MS, 31 of whom were treated with IFNβ and 83 of whom were untreated. There was a mix of relapsing and progressive phenotypes.
The replication dataset was derived from the Ausimmune study (12), a multi-center Australian study. The replication dataset consisted of 33 IFNβ-treated pwMS (24 female and nine male patients) and 202 untreated pwMS (154 female and 48 male patients). All participants in the Ausimmune study were recruited after their first clinical evidence of demyelination. Demographic details for both groups are listed in Table 1.
DNA extraction
DNA was extracted from whole blood using the QIAamp DNA Blood Mini Kit ™, The Netherlands. Extracted DNA was quantified using the Qbit (Invitrogen™, USA), and integrity was assessed using the genomic DNA tapes on a TapeStation (Agilent™, USA) using the DNA integrity number (DIN) as a metric. All samples had a DIN ≥ 7, with minimal genomic DNA degradation.
Methylation arrays
Genomic DNA (500 ng) was bisulfite-converted using the EZ- DNA Methylation™ Kit (Zymo) according to manufacturer’s converted DNA was hybridized to the Illumina Infinium Methylation 850K EPIC BeadChip arrays (hereafter referred to as EPIC arrays). To avoid batch effects, samples were randomized on the EPIC arrays using the OSAT R package (16). Arrays were read using the iScan (Illumina™) to produce raw Idat files.{Campagna, 2022 #259}
Genotyping arrays
We hybridized 200 ng of genomic DNA to the Illumina Global Screening Array (hereafter referred as GSA) and processed according to manufacturer’s protocol. To avoid batch effects, samples were randomized on the GSA chips using the OSAT R package (16). Arrays were read using the iScan (Illumina™) to produce raw Idat files.
Statistical analysis
Analysis of EWAS data was performed using the ChAMP R package (17, 18). To summarize, Idat files were loaded and filtered to remove low-performing probes, probes mapping to multiple loci, and low-performing samples. Probes next to known polymorphisms and on XY chromosome were retained. Beta values were normalized using the Beta-Mixture Quantile (BMIQ) method (19). Batch effects on both array and chip levels were corrected using the ComBat algorithm (20).
The final model used to identify differentially methylation positions (DMPs) was constructed using logistic regression, whereby phenotype (IFNβ treated or untreated) was considered the outcome variable, and each CpG beta value and cell-type proportions [for natural killer (NK) cells, monocytes, lymphocytes B, CD8+ T cells, CD4+ T cells, and neutrophils] were considered predictors. For CpG i,
The mean difference in methylation between IFNβ-treated and untreated group was used to assess the effect size [i.e., delta beta (Δβ)]. When combining both studies, we used the following model:
where represents the study of origin (replication or discovery).
When possible, we used a single CpG or index CpG to represent a cluster of CpGs that had a Δβ in the same direction and that mapped to a single gene. Methylation treatment score (MTS) was constructed as follows using every significant index DMP identified in the discovery study that was also replicated in the validation study:
where is the MTS for a specific sample, is the beta value at index CpGi used to construct the MTS, and is the weight used (i.e., the average Δβ identified for CpGi between treated and untreated samples in the discovery cohort). We used the calculated MTS to create a linear model evaluating the relationship between MTS and the time since first treatment/injection:
Immune cell proportions were calculated using the methylResolver R package (21). Cell-specific analysis was done using a linear regression model for each cell type (either monocytes, B cells, NK cells, neutrophils, CD4+ T cells, or CD8+ T cells). For each cell, we constructed the following model for every DMP identified in the combined dataset:
where is the CpG of interest; is the cell proportion between 0 and 1; sex, age, and dataset of origin (replication or discovery) were used as covariates. represents the interaction term between cell proportion and treatment status and was the variable of interest. We removed any CpG with unadjusted significance under 9.8 × 10⁻⁸ (genome-wide significance) or with an absolute beta coefficient under two from the constructed linear model.
Overrepresentation analysis
Overrepresentation analysis (ORA) was performed using the R package clusterprofiler (22), with the biological process annotation and a background of all genes present on the EPIC methylation array (n = 26,650). The list of gene symbols used as input is as follows: IFI44L, IFI44, ADAR, RABGAP1L, CMPK2, RSAD2, IFIH1, SP100, PARP9, PARP14, PLSCR1, TNK2, DDX60, TAP1, TNRC18, PDE7A, LY6E, TRIM14, IFIT3, IFIT1, IFITM1, IRF7, TRIM22, PARP11, OAS1, OAS2, OASL, EPSTI1, IRF9, IFI27, B2M, BISPR, PRIC285, MX1, USP18, and ODF3B.
Genome-wide association study
We first identified the individuals within the top and bottom quartiles based on MTS (each group, n = 16; bottom quartile, MTS< −0.461; top quartile, MTS > −0.322). GSA data were used. For each SNP, we performed a Fisher’s exact test to assess the difference in genotype between top and bottom quartile individuals. A genome-wide significance threshold of 7.69 × 10⁻⁸ was used, with a suggestive significance threshold of 10−5.
Sensitivity analysis
To measure how independent the identified MTS was from various clinical measures: age, sex, group of origin, disease duration, age at blood collection, MS subtype, severity [through age-related MS severity score (ARMSS)], and type of interferon treatment, we performed a sensitivity analysis. For continuous variables (age, severity, and disease duration), we performed a Pearson’s correlation test. For categorical variables, we performed a Mann–Whitney’s test.
Results
DNAm differences and methylation treatment score
In total, we identified 22 DMPs that were very strongly associated with treatment in both the discovery and replication groups with Δβ differences ranging from around 5% to around 25% (p< 9.8 × 10⁻⁸ in both cohorts). Using the 11 index DMPs (Table 2) and their associated Δβ, we constructed an MTS for each sample, which is a composite score reflecting methylation at all identified CpGs affected by IFNβ treatment. The MTS was strongly associated with treatment status (meantreated = −0.39 ± 0.099, meanuntreated = −0.52 ± 0.075, p = 1.1 × 10⁻²⁵, Figure 1A; Supplementary Table 1). Using an area under the curve (AUC) analysis, we also demonstrated that the MTS accurately discriminates between treated and untreated samples (AUC = 0.83) (Figure 1B).
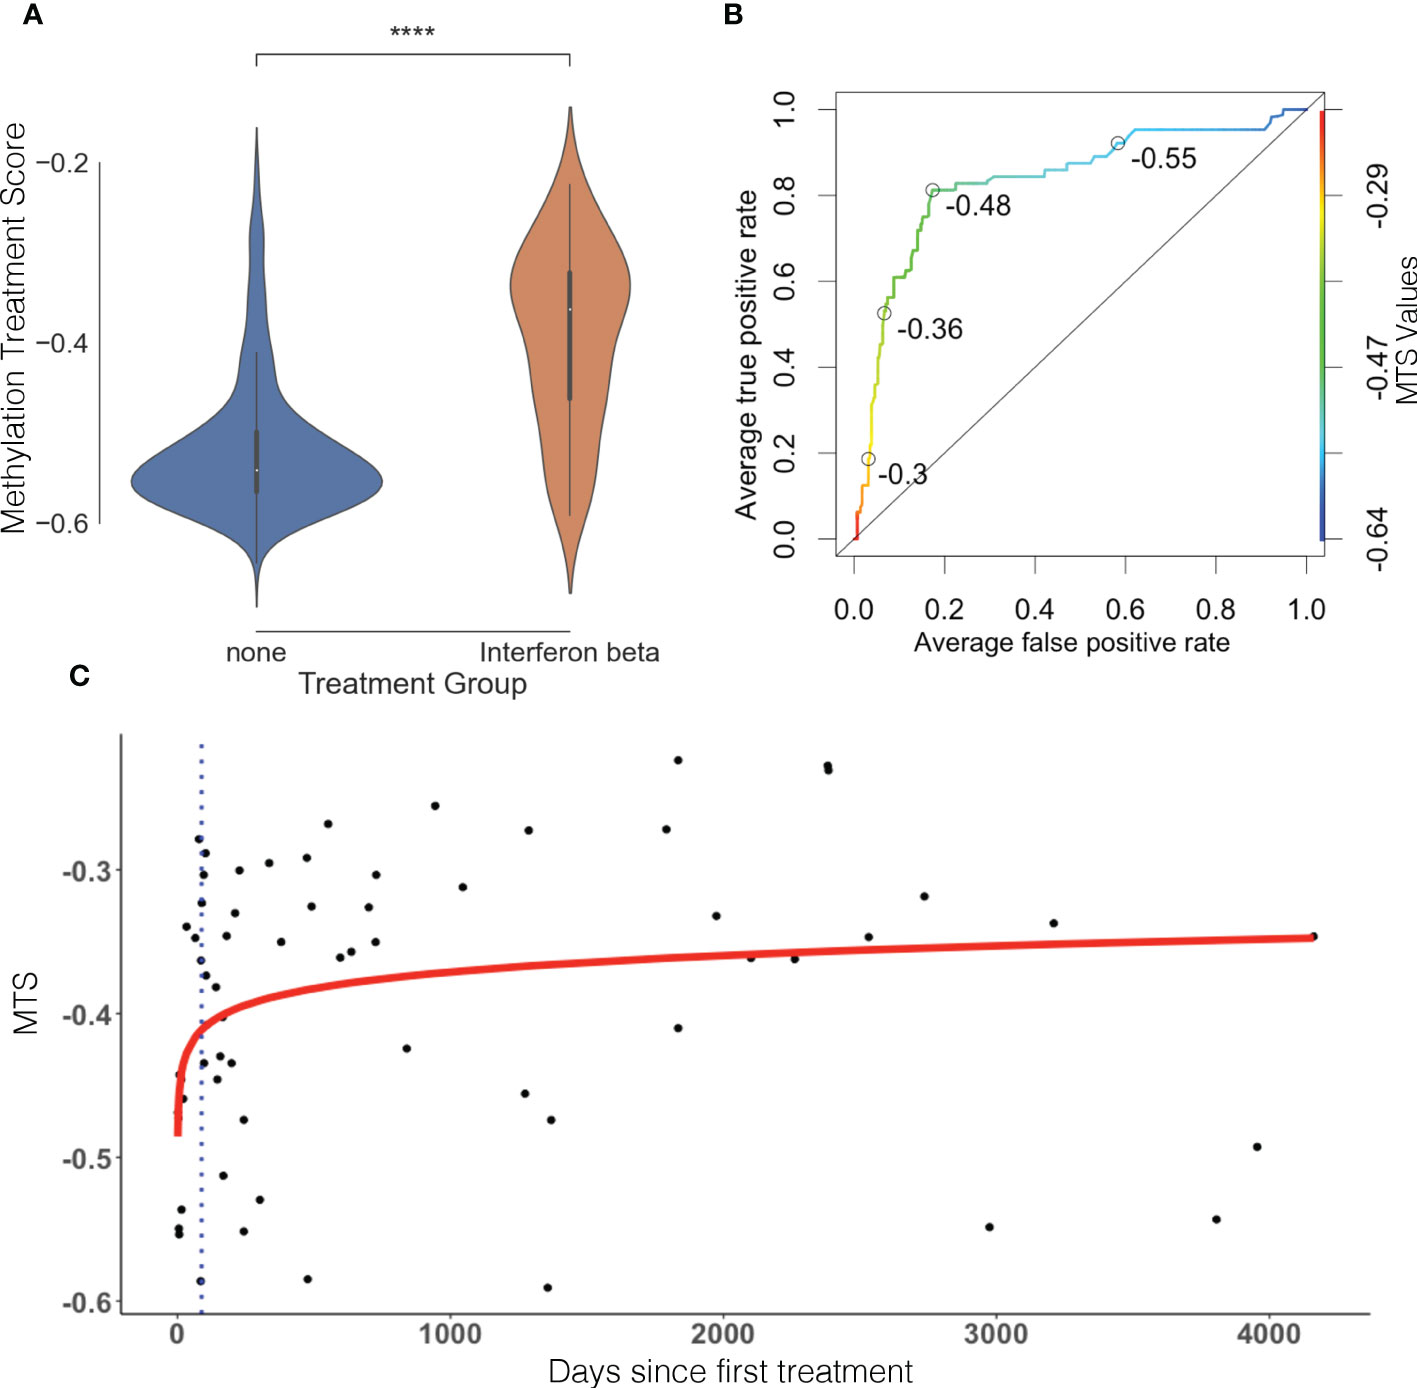
Figure 1 Methylation treatment score can discriminate between treated and untreated samples and is time sensitive. (A) MTS is significantly different between treated and untreated patients. Violin plot represents distribution of the MTS. Blue is untreated, and orange is treated. (B) Receiver operating characteristic (ROC) curve, AUC = 0.83. Open circles represent various MTS thresholds. Color gradient scale represents MTS values. (C) MTS is time-sensitive and reflects therapeutic lag in treated patients. Blue dots represent individual treated samples. Y-axis represents days since first treatment, and X-axis represents MTS. Red line represents line of best fit (p = 9.29 × 10⁻³, R2 = 0.104). Blue dotted line represents average therapeutic lag for IFNβ treatment (88.2 days) as defined by Roos et al. (23).
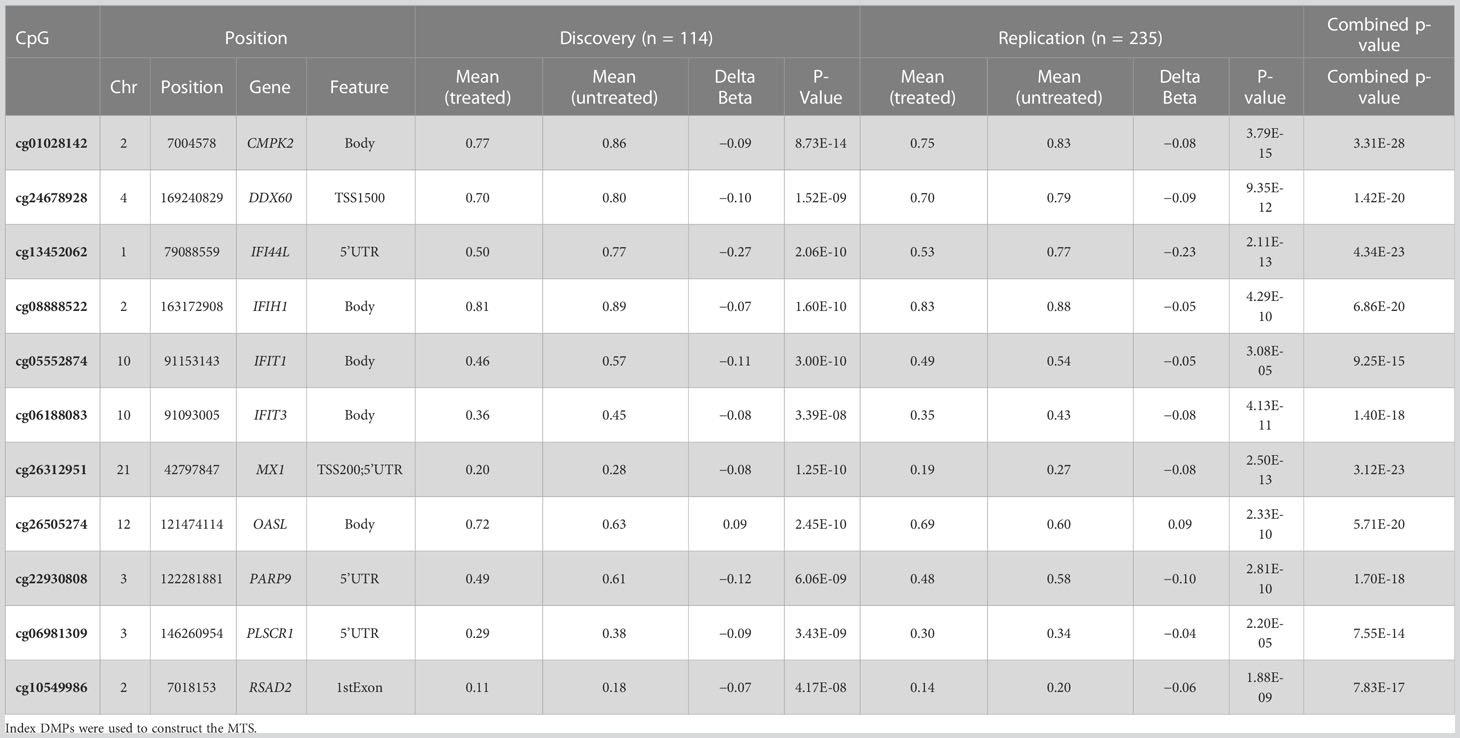
Table 2 Index DMPs identified in the discovery dataset and replicated in the replication group.
The MTS in the treated sample group had a larger distribution (wider spread of the data) than the untreated sample group (Figure 1A). To assess whether this was caused by genetic determinants and followed a pattern of responder vs. non-responder, we performed a GWAS of the MTS between the top and bottom quartiles individuals based on MTS. This revealed no significant or suggestive differences in genotype at tested loci between treated samples in the top quartile vs. bottom quartile (see Supplementary Figure 1), indicating no influence of genotype in response to IFNβ treatment. We therefore explored the relationship between MTS and the day of first treatment. We identified that MTS is associated with the log of days since first treatment (p = 9.29 × 10⁻³, R2 = 0.104; Figure 1C). The line of best fit reaches a plateau after around 100 days after first injection. Limiting our modeling to pwMS tested within 100 days of first injection (n = 16) showed increased R2 (from 0.104 to 0.2371) while remaining significant (p = 0.0321) (see Supplementary Figure 2). This suggests that MTS correlates early with first treatment date when removing pwMS who might be off treatment for long periods of time. Finally, we performed a sensitivity analysis to test between the association of MTS and various covariates. MTS was not associated with age at blood collection, disease severity (measured through ARMSS), disease duration, MS subtype, cohort of origin (discovery vs. replication), or type of treatment (IFNβ 1a vs. IFNβ 1b) (Supplementary Figure 3).
Combined groups overrepresentation analysis
To determine whether increased statistical power would identify smaller effect size DMPs associated with IFNβ treatment, we conducted an EWAS after combining studies (n = 349). We identified 81 DMPs mapping to 36 different genes (Figure 2; Supplementary Table 2). With the increased sample size, we identified 59 novel DMPs at 25 additional genes. Twenty-one of the 36 genes (58.3%) had a DMP identified within either the transcription starting site (within 1,500 bp) or in the 5’untranslated region (5’UTR). These DMPs are very likely to modulate the expression of the gene they are mapped to.
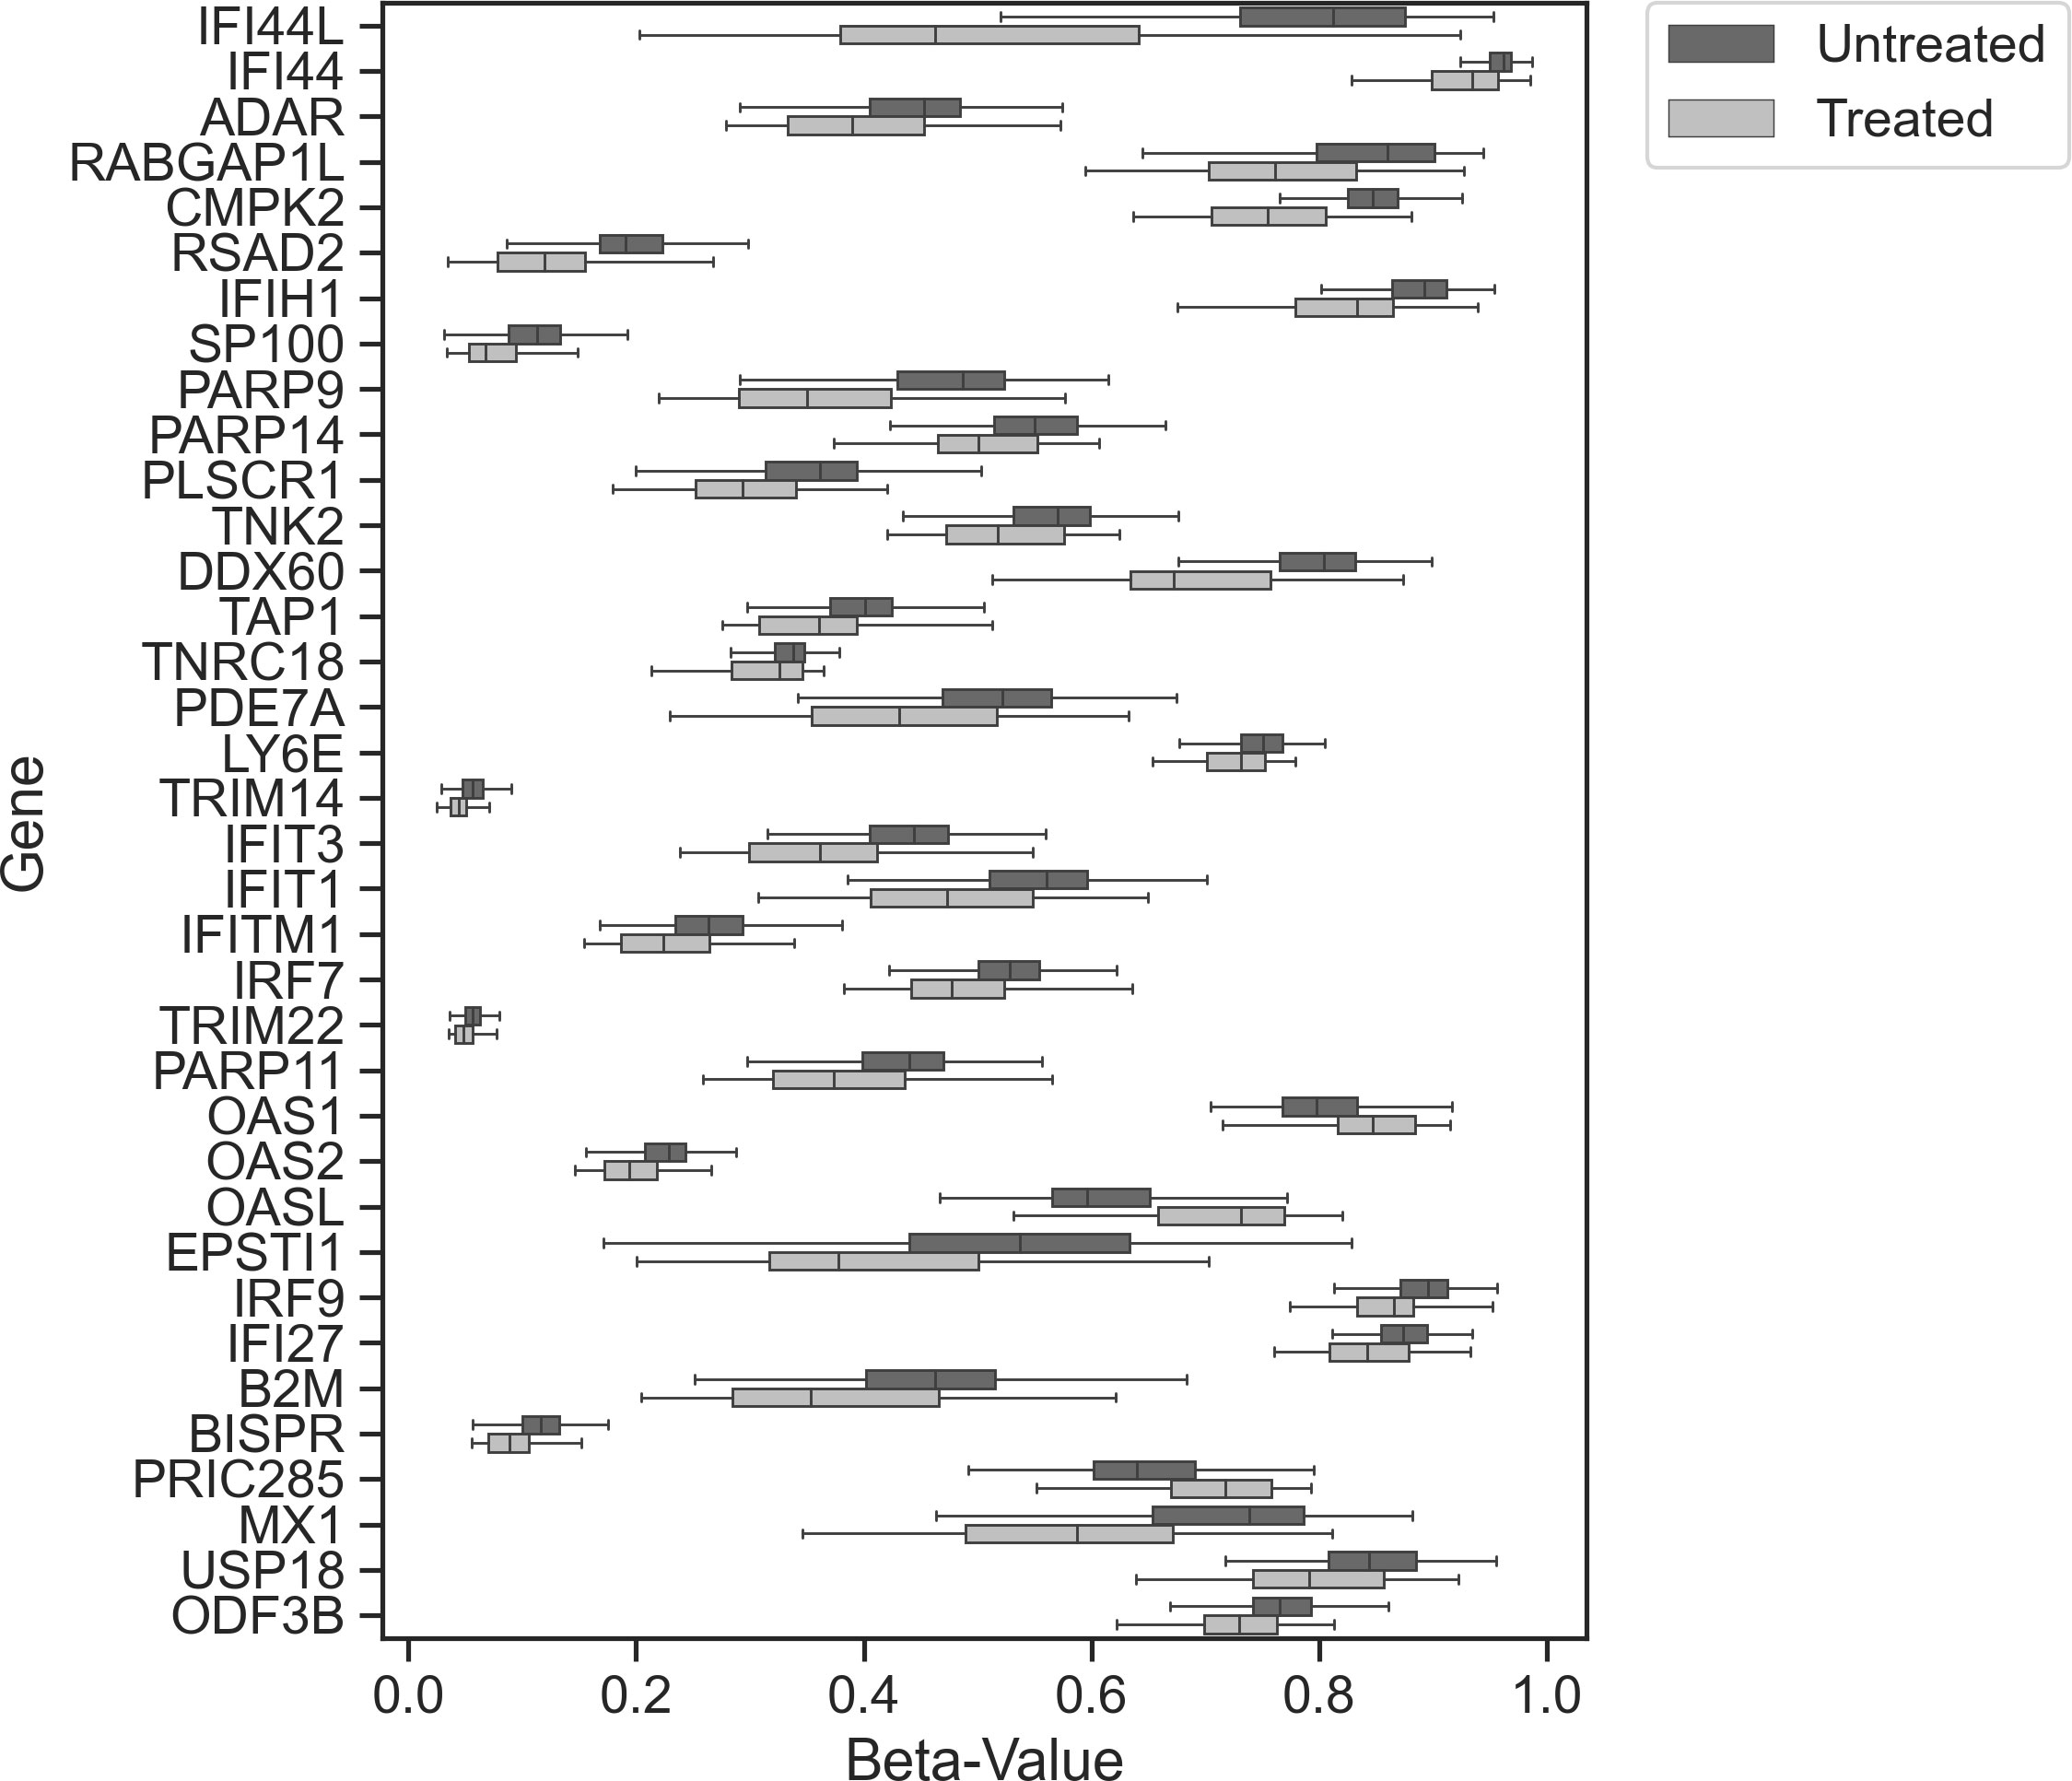
Figure 2 Combined study analysis. Tukey box plot showing the distribution of beta values between treated (light gray) and untreated (dark gray) samples (all test reached p ≤ 9.8 × 10⁻⁸) for each index DMP associated with each gene.
Using the combined gene list as input for ORA (Figures 3A–C) revealed that most of the genes containing DMPs were involved in anti-viral and response to virus infection pathways.
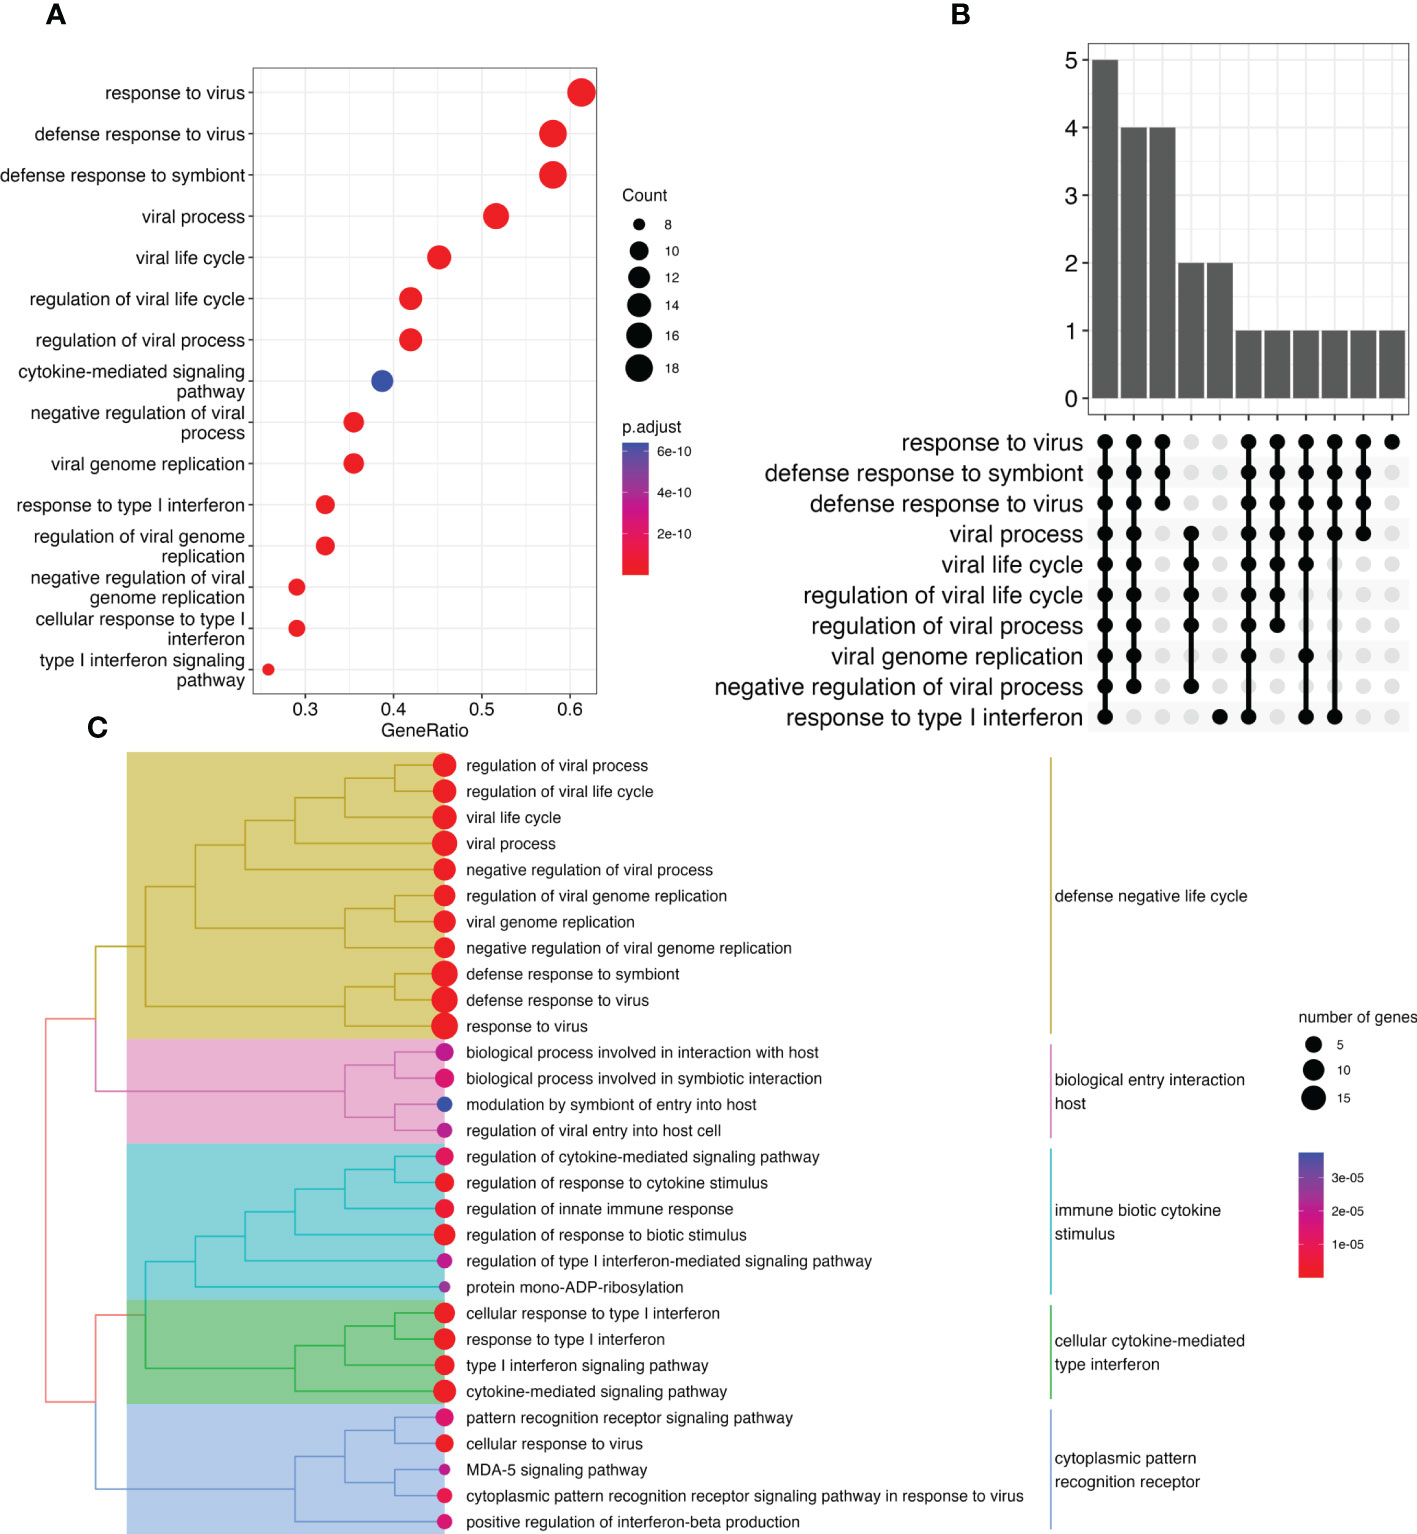
Figure 3 Overrepresentation analysis of genes modulated by IFN treatment reveals virus related response. (A) Dot plot representing pathways disrupted between treated and untreated pwMS Y-axis represents pathways identified. X-axis represents the gene ratio (number of entities in gene list vs. number of entities in the pathway) for a specific pathway. Marker size represents the number of entities. Colors represent significance. (B) UpSet plot showing the number of genes identified in the ORA for each identified function. Each bar represents a group of gene with the Y-axis representing the number of genes. The dots underneath show which pathways are associated with this group of genes. (C) Tree plot representing various differentially methylated pathways grouped by similarity. Dot size represents number of genes, whereas dot colors represent significance. Colors over the hierarchical tree represent pathways sharing similarities.
Cell-specific analysis
One limitation of whole blood EWAS is the bulk analysis of different immune cell types. To overcome this limitation, we performed immune cell deconvolution through a two-step process. First, we estimated the proportion of each of 11 immune cell types (Figure 4A). Second, using multiple linear regression (see Methods), we performed statistical deconvolution to identify methylation differences between treated and untreated patients in each immune cell type (Figure 4B). Cell proportions were not statistically significantly different between in treated and untreated pwMS except for NK cells (meantreated = 0.010, meanuntreated = 0.016, p< 0.01) and CD4+ naïve T cells (meantreated = 0.071, meanuntreated = 0.053, p< 0.05). We identified the largest methylation differences in regulatory CD4+ T cells (Tregs) with 16 cell-specific DMPs and dendritic cells (DCs) with 53 cell-specific DMPs (Figure 4B). Smaller changes can be observed in monocytes, B cells (55 cell-specific DMPs), and other T cell subsets (Figure 4B; Supplementary Table 3). No significant methylation differences were detected in NK cells, neutrophils, or macrophages. The gene with the biggest methylation difference is IFI44L in both Treg and DCs.
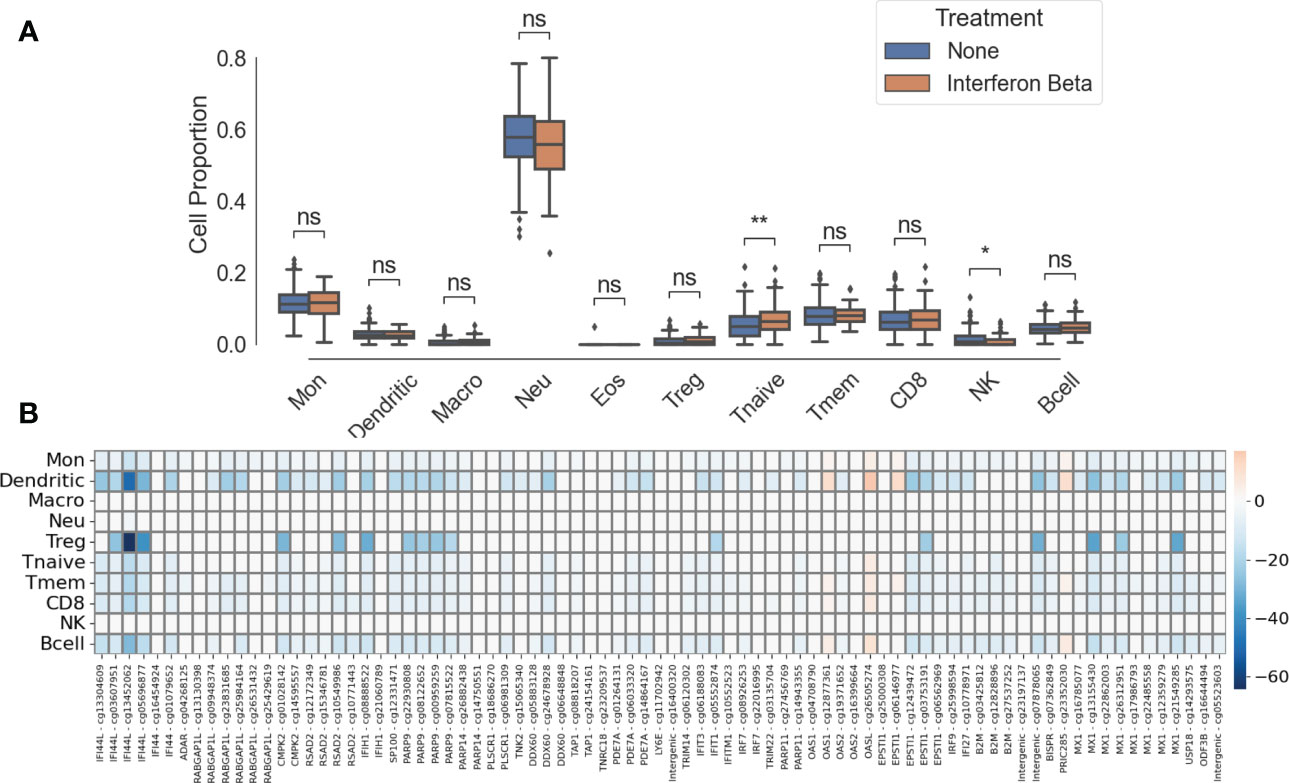
Figure 4 Cell-specific differences between IFNβ-treated patient and untreated patients. (A) Immune cell proportions. ns, not significant; *, p< 0.05; **, p< 0.01. (B) Heatmap of cell-specific methylation differences between IFNβ-treated and untreated groups. Intensity of colors represents effect size, blue represents hypomethylation, and red represents hypermethylation. CpGs labeled “intergenic” are not mapped to a gene.
Discussion
The role of endogenous IFNβ during a viral infection is protective, promoting the activation of antigen-presenting cells and subsequent expansion of T and B cells (24). Here, we have demonstrated that that IFNβ treatment is associated with modification of specific DNAm sites in a time-dependent manner.
We found that DNAm changes after treatment are specific to interferon genes and are reproducible across samples. Methylation changes after IFNβ can be summarized into an MTS that has strong discriminating power. In addition, this MTS is impervious to many parameters, such as age, disease duration, severity, or MS subtype. Roos and colleagues investigated, in a 2020 MSBase data study the therapeutic lag, the delay between first treatment and reaching treatment efficacy, associated with various MS treatments (IFNβ 1b, IFNβ 1a subcutaneous, IFNβ 1a intramuscular, alemtuzumab, natalizumab, mitoxantrone, fingolimod, dimethyl fumarate, teriflunomide, and glatiramer acetate) (23). They identified a range of delayed efficacy ranging from 12.6 weeks (or 88.2 days) for IFNβ 1b to 27.5 weeks for dimethyl fumarate. Interestingly, the identified lag after commencement of INFβ coincides with the inflexion point of the best fit line between day of first treatment and MTS. Therefore, our MTS is a potential treatment efficacy biomarker. The fact that the previously identified therapeutic lag and methylation changes are strongly associated indicates that methylation modification is reflecting IFNβ treatment efficacy. However, this needs to be experimentally confirmed. We did not have information about the date of the last dose and were therefore unable to investigate the reversibility of the methylation effect from IFNβ treatment. Some samples have a similar MTS to those of untreated samples, potentially indicating that treatment might have stopped. A follow-up analysis, focusing on the reversibility of methylation changes, will be of particular interest for pwMS wishing to switch to other treatment, as methylation changes might affect other treatment’s efficacy.
Genes with modified methylation profiles were all known interferon response genes that are involved in response to viral pathways. This could be because IFNβ recruits endogenous anti-viral machinery and provokes long-lasting changes in those genes through methylation. The gene with the widest gap in beta value between treated and untreated pwMS (both in whole blood and deconvoluted cell analysis) is IFI44L, which is known to modulate virus replication and anti-viral state (25).
We have also provided evidence that there are large effect DNAm changes in both DCs and Treg cells, with smaller effects identified in monocytes, all CD4+ T cells subsets, CD8+ T cells, and B cells. IFNβ treatment plays a significant role in the activation and migration of DCs, modulating the activation of downstream T cell subpopulations (26). Importantly, DCs induce proliferation of regulatory T cells following IFNβ treatment (27). Increase in CD4+ T cell expansion and survival can be observed in acute viral infections when endogenous IFNβ is released (28). This is similar to the increase that we observed in the CD4+ T naïve cell population in IFNβ-treated patients. The absence of methylation changes identified in neutrophils, NK cells, and macrophages suggests that any innate immunity response emerging from IFNβ treatment is not mediated through methylation, as shown by the difference of NK proportion between treated and untreated patients. The IFNβ treatment effect on DNAm identified in this study is unique and different compared to that described after dimethyl fumarate (7) or mixed DMT treatment (29). Because of the historic nature of these whole blood samples, we were unable to validate our findings in isolated cell types. However, the statistical deconvolution analysis methods for whole blood, particularly the reference-based algorithms such as what we have used here, are now excellent at replicating the isolated cell type results. It is a convenient way to investigate cells that are found in low proportions in the peripheral blood and are difficult to obtain enough material from for analysis.
Although IFNβ treatment has widely been superseded by higher efficacy treatment in the management of MS, it remains relevant in 2023. IFNβ treatment activates anti-viral response and specifically depletes memory B cells (30, 31). Memory B cells are the known reservoir of Epstein–Barr virus (EBV) persistence, a virus that has been recently highlighted as the strongest risk factor for MS (32). Depleting this specific B memory population could help reduce the probability of EBV reactivation. In addition, through anti-viral activity, IFNβ treatment was proposed as a protective treatment for SARS-CoV-2 infections compared to other high efficacy treatments (33, 34), but later studies reported limited to no efficacy (35). Finally, there is a wide body of work suggesting that vitamin D has an effect of MS risk. Although vitamin D supplementation alone does not seem to influence MS progression and severity in pwMS (36–39), IFNβ and vitamin D combination could remain relevant as vitamin D enhances IFNβ response (40).
Conclusion
Together, our results suggest that IFNβ treatment has a strong, targeted, and reproducible effect on DNAm in MS patients (Figure 5). The association of our MTS with treatment start suggests that treatment efficacy is at least partially associated with methylation changes and that changes in MTS might reflect response to treatment. An MTS that reflects response to treatment may be of interest for clinicians because a change in MTS could indicate non-response to treatment and the need to change to a different treatment. Our MTS is also a convenient way to assign treatment response for researchers performing methylation studies and needing to correct for the influence of IFNβ treatment. The association between MTS and treatment date suggests that treatment efficacy is at least partially associated with methylation changes.
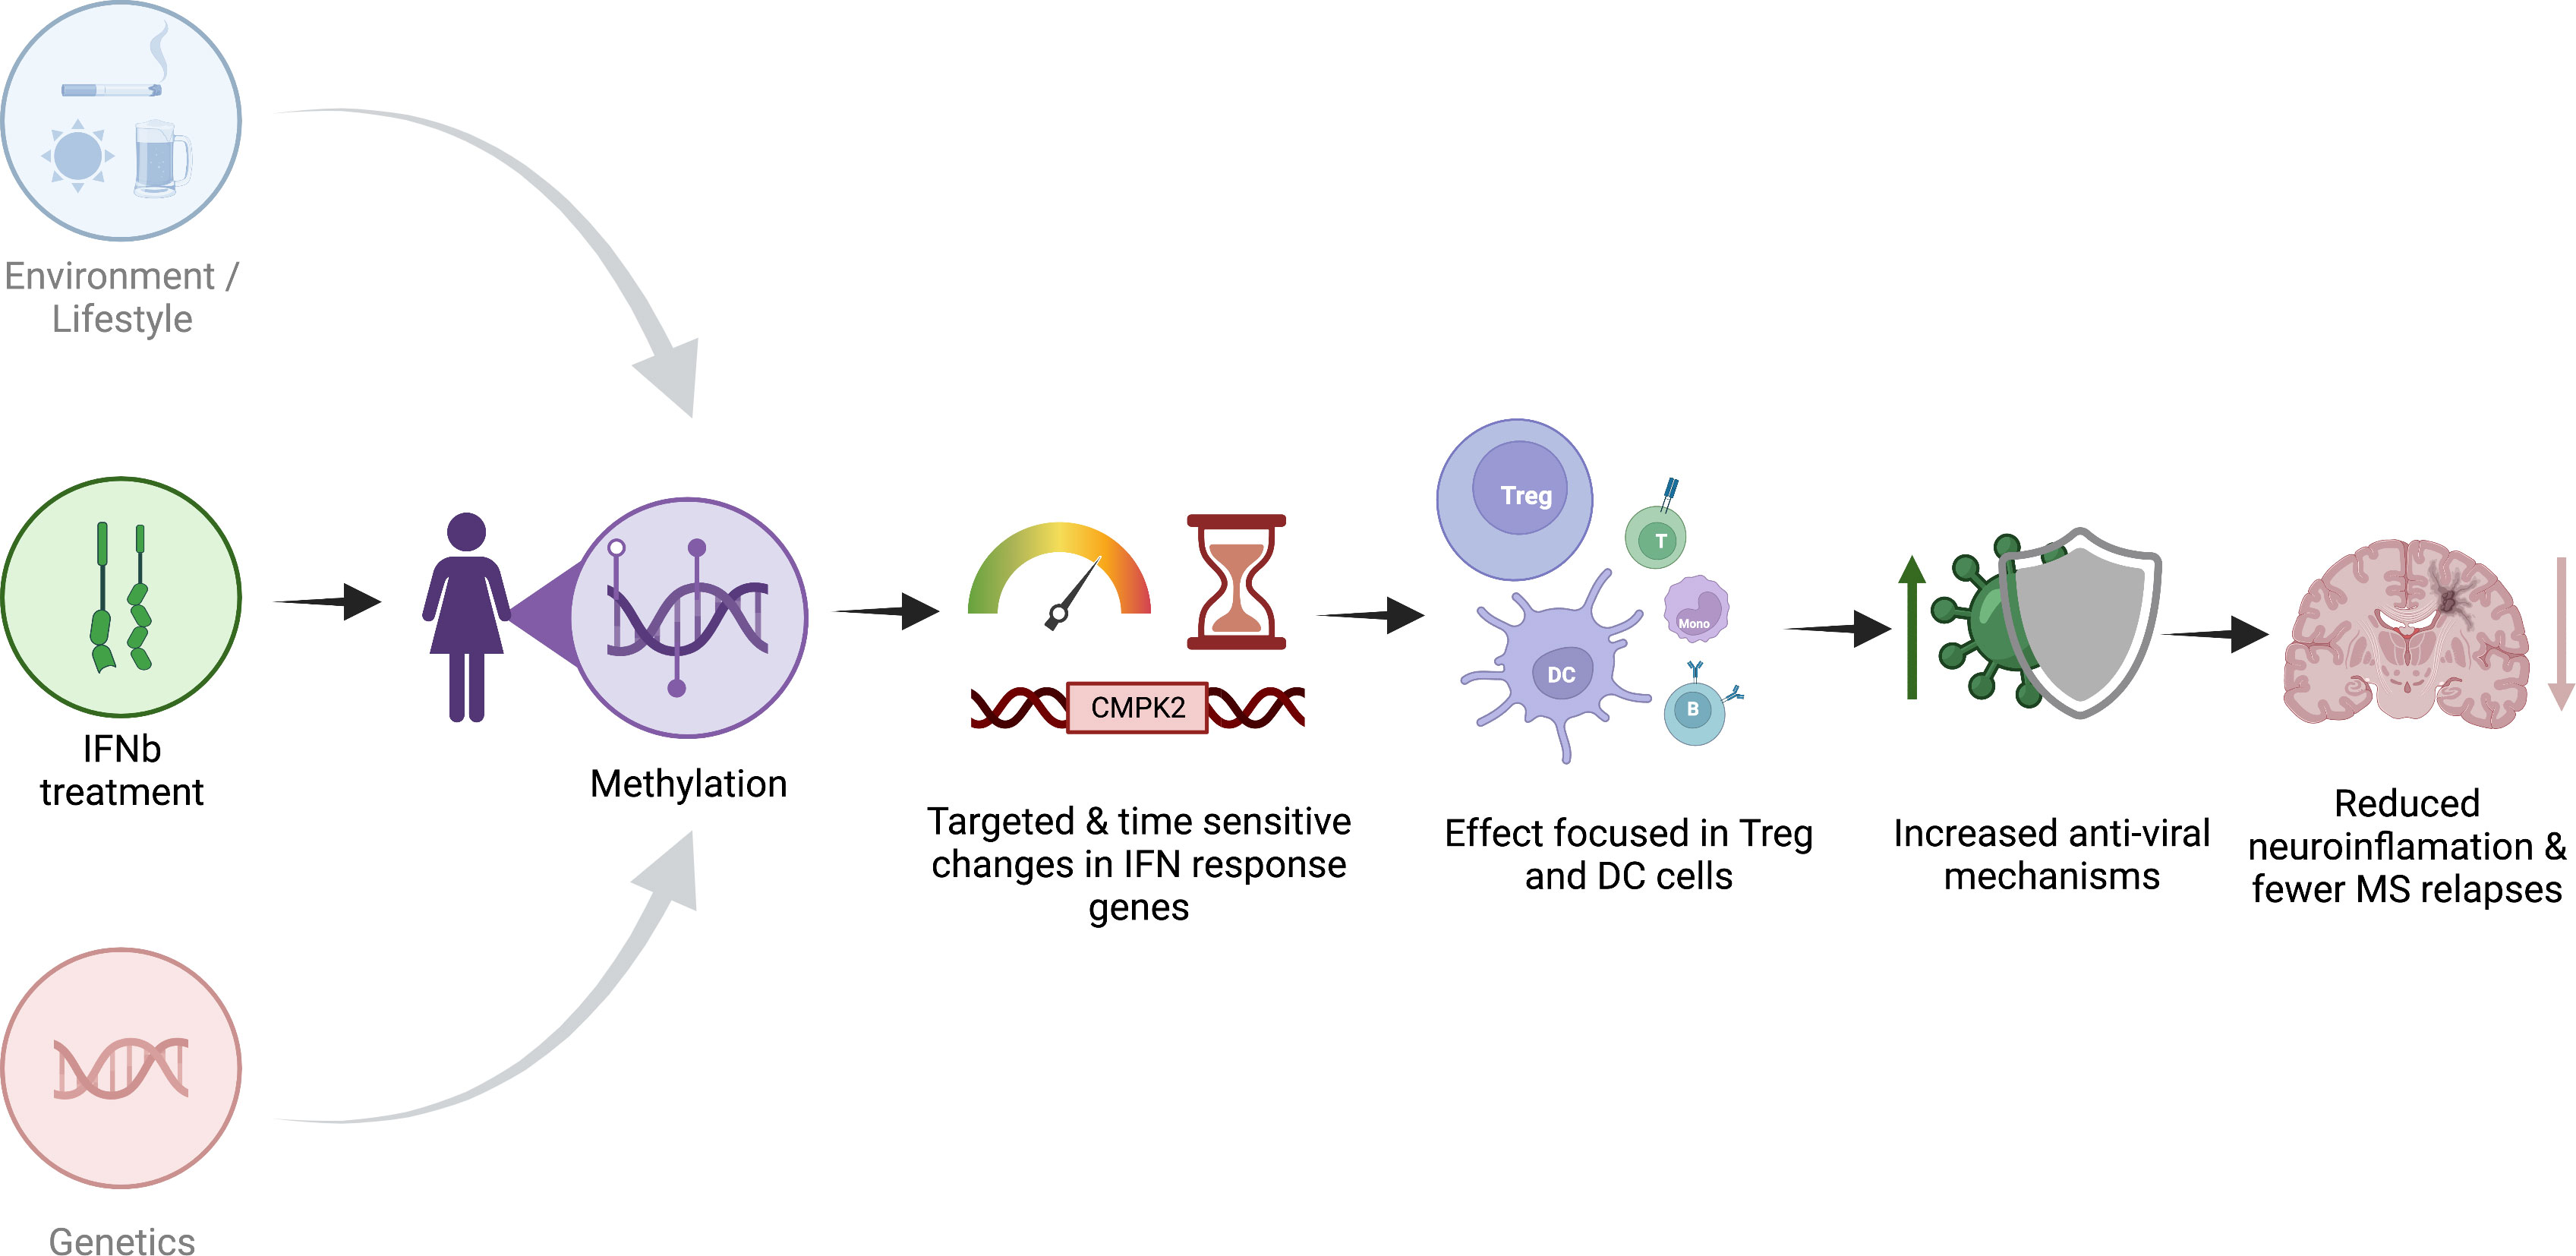
Figure 5 Schematic representation of the proposed effect of IFNβ treatment on methylation. Created with biorender.com.
The pathways that we identified as modulated by IFNβ treatment suggest that IFNβ treatment most likely recruits viral infection response pathways with highly targeted, cell-specific effects to reduce overall inflammation, resulting in reduced relapses and disease activity.
Data availability statement
The datasets presented in this article are not readily available because of the General Data Protection Regulation as well as study-specific ethics and governance terms and conditions. Requests to access the datasets should be directed to JL-S (SmVhbm5ldHRlLkxlY2huZXJTY290dEBoZWFsdGgubnN3Lmdvdi5hdQ==).
Ethics statement
All participants to this study gave their written informed consent. The Ausimmune Study was approved by nine regional Human Research Ethics Committees (study number 09/04/15/5.04 and HREC/09/HNE/139). The patients/participants provided their written informed consent to participate in this study.
Author contributions
RS, JL-S, VGJ, and RL contributed to the conception of the work. RS, JS, VGJ, and RL contributed to the design of the work. AX, MC, TK, BT, A-LP, RS, JL-S, VGJ, and RL contributed to the acquisition of data. AX, MC, VM, and RL contributed to the analysis of data. AX, MC, VM, JL-S, and RL contributed to the interpretation of data. AX, VM, RS, JL-S, and RL contributed to the manuscript drafting. VM, TK, BT, AP, RS, JL-S, VGJ, and RL contributed to the manuscript substantial revision.
Funding
This study was supported by the National MS Society grant (Ausimmune) RG-1803-30499 and MS research Australia (severity study) 18-0424.
Conflict of interest
JL-S received travel compensation from Biogen, Merck, and Novartis and has been involved in clinical trials with Biogen, Merck, Novartis, and Roche; her institution has received honoraria for talks and advisory board service from Biogen, Merck, Novartis, and Roche. VM has accepted honoraria for presentations and research funds from Biogen and Merck.
The remaining authors declare that the research was conducted in the absence of any commercial or financial relationships that could be construed as a potential conflict of interest.
Publisher’s note
All claims expressed in this article are solely those of the authors and do not necessarily represent those of their affiliated organizations, or those of the publisher, the editors and the reviewers. Any product that may be evaluated in this article, or claim that may be made by its manufacturer, is not guaranteed or endorsed by the publisher.
Supplementary material
The Supplementary Material for this article can be found online at: https://www.frontiersin.org/articles/10.3389/fimmu.2023.1162796/full#supplementary-material
Supplementary Figure 1 | Manhattan plot showing genome-wide association between genotype and MTS. Genotype was compared between high-MTS (top quartile) and low-MTS (lowest quartile) pwMS. Each dot represents -log10(p) with a genome-wide significance set at 7 (or -log10(10e-8)). Alternating shades of grey represent chromosomes.
Supplementary Figure 2 | Regression showing association between days of first treatment and MTS, only with pwMS whose blood was collected within the first 100 days of treatment. Each dot represents a sample, and the red line is the line of best fit (MTS = -0.54 + 0.035 * log10(Days since first treatment)). p = 0.032, R2 = 0.237.
Supplementary Figure 3 | Sensitivity analysis of MTS against several covariates. a) MTS vs MS course (CIS = Clinically isolated syndrome, RR = relapse remitting, PP = primary progressive, SP = secondary progressive). No significance between untreated samples from different MS courses. No significance between treated samples from different MS courses b) MTS vs Study group c) MTS vs age d) MTS vs Sex e) MTS vs ARMSSS (Age relates MS Severity Score) f) MTS vs Disease durations g) MTS vs Type of interferon. r = Pearson’s correlation coefficient, p = p-value of pearon’s correlation test, ns = non significant or p > 0.05, * p< 0.05, ** p< 0.01, *** p<0.001, ****p<0.0001
Abbreviations
SARS-CoV-2, severe acute respiratory syndrome coronavirus 2; IFNβ, interferon beta; MS, multiple sclerosis; pwMS, people with MS; MTS, methylation treatment score; ROC, receiver operating characteristic; AUC, area under the curve; DMP, differentially methylated probe/position; ORA, overrepresentation analysis; GWAS, genome-wide association studies.
References
1. de Weerd NA, Nguyen T. The interferons and their receptors-distribution and regulation. Immunol Cell Biol (2012) 90:483–91. doi: 10.1038/icb.2012.9
2. Kasper LH, Reder AT. Immunomodulatory activity of interferon-beta. Ann Clin Transl Neurol (2014) 1:622–31. doi: 10.1002/acn3.84
3. Kraus J, Voigt K, Schuller AM, Scholz M, Kim KS, Schilling M, et al. Interferon-beta stabilizes barrier characteristics of the blood-brain barrier in four different species. vitro. Mult Scler (2008) 14:843–52. doi: 10.1177/1352458508088940
4. Hojati Z, Kay M, Dehghanian F. Chapter 15 - Mechanism of Action of Interferon Beta in Treatment of Multiple Sclerosis. In: Minagar A, editor. Multiple Sclerosis. San Diego: Academic Press (2016). p. 365–92.
5. Smith ZD, Meissner A. DNA Methylation: roles in mammalian development. Nat Rev Genet (2013) 14:204–20. doi: 10.1038/nrg3354
6. Schubeler D. Function and information content of DNA methylation. Nature (2015) 517:321–6. doi: 10.1038/nature14192
7. Maltby VE, Lea RA, Ribbons KA, Sanders KA, Kennedy D, Min M, et al. DNA Methylation changes in CD4(+) T cells isolated from multiple sclerosis patients on dimethyl fumarate. Mult Scler J Exp Transl Clin (2018) 4:2055217318787826. doi: 10.1177/2055217318787826
8. van Nijnatten J, Brandsma CA, Hiemstra P, Timens W, Van den Berge M, Faiz A. Changes in DNA methylation after corticosteroids treatment in COPD patients. Eur Respir J (2020) 56. doi: 10.1183/13993003.congress-2020.4783
9. Pedersen CA, Cao MD, Fleischer T, Rye MB, Knappskog S, Eikesdal HP, et al. DNA Methylation changes in response to neoadjuvant chemotherapy are associated with breast cancer survival. Breast Cancer Res (2022) 24:43. doi: 10.1186/s13058-022-01537-9
10. Pinto-Medel MJ, Oliver-Martos B, Urbaneja-Romero P, Hurtado-Guerrero I, Ortega-Pinazo J, Serrano-Castro P, et al. Global methylation correlates with clinical status in multiple sclerosis patients in the first year of IFNbeta treatment. Sci Rep (2017) 7:8727. doi: 10.1038/s41598-017-09301-2
11. Diniz SN, da Silva CF, de Almeida IT, da Silva Costa FE, de Oliveira EML. INFbeta treatment affects global DNA methylation in monocytes of patients with multiple sclerosis. J Neuroimmunol (2021) 355:577563. doi: 10.1016/j.jneuroim.2021.577563
12. Lucas R, Ponsonby AL, McMichael A, van der Mei I, Chapman C, Coulthard A, et al. Observational analytic studies in multiple sclerosis: controlling bias through study design and conduct. the Australian multicentre study of environment and immune function. Mult Scler (2007) 13:827–39. doi: 10.1177/1352458507077174
13. Campagna MP, Xavier A, Lea RA, Stankovich J, Maltby VE, Butzkueven H, et al. Whole-blood methylation signatures are associated with and accurately classify multiple sclerosis disease severity. Clin Epigenet (2022) 14:194. doi: 10.1186/s13148-022-01397-2
14. Butzkueven H, Chapman J, Cristiano E, Grand'Maison F, Hoffmann M, Izquierdo G, et al. MSBase: an international, online registry and platform for collaborative outcomes research in multiple sclerosis. Mult Scler (2006) 12:769–74. doi: 10.1177/1352458506070775
15. Jokubaitis VG, Campagna MP, Ibrahim O, Stankovich J, Kleinova P, Matesanz F, et al. Not all roads lead to the immune system: the genetic basis of multiple sclerosis severity. Brain (2022). doi: 10.1101/2022.02.04.22270362
16. Yan L, Ma C, Wang D, Hu Q, Qin M, Conroy JM, et al. OSAT: a tool for sample-to-batch allocations in genomics experiments. BMC Genomics (2012) 13:689. doi: 10.1186/1471-2164-13-689
17. Morris TJ, Butcher LM, Feber A, Teschendorff AE, Chakravarthy AR, Wojdacz TK, et al. ChAMP: 450k chip analysis methylation pipeline. Bioinformatics (2014) 30:428–30. doi: 10.1093/bioinformatics/btt684
18. Tian Y, Morris TJ, Webster AP, Yang Z, Beck S, Feber A, et al. ChAMP: updated methylation analysis pipeline for illumina BeadChips. Bioinformatics (2017) 33:3982–4. doi: 10.1093/bioinformatics/btx513
19. Teschendorff AE, Marabita F, Lechner M, Bartlett T, Tegner J, Gomez-Cabrero D, et al. A beta-mixture quantile normalization method for correcting probe design bias in illumina infinium 450 k DNA methylation data. Bioinformatics (2013) 29:189–96. doi: 10.1093/bioinformatics/bts680
20. Johnson WE, Li C, Rabinovic A. Adjusting batch effects in microarray expression data using empirical bayes methods. Biostatistics (2007) 8:118–27. doi: 10.1093/biostatistics/kxj037
21. Arneson D, Yang X, Wang K. MethylResolver-a method for deconvoluting bulk DNA methylation profiles into known and unknown cell contents. Commun Biol (2020) 3:422. doi: 10.1038/s42003-020-01146-2
22. Wu TZ, Hu EQ, Xu SB, Chen MJ, Guo PF, Dai ZH, et al. clusterProfiler 4.0: a universal enrichment tool for interpreting omics data. Innovation-Amsterdam (2021) 2. doi: 10.1016/j.xinn.2021.100141
23. Roos I, Leray E, Frascoli F, Casey R, Brown JWL, Horakova D, et al. Delay from treatment start to full effect of immunotherapies for multiple sclerosis. Brain (2020) 143:2742–56. doi: 10.1093/brain/awaa231
24. Nagarajan U. Induction and function of IFNbeta during viral and bacterial infection. Crit Rev Immunol (2011) 31:459–74. doi: 10.1615/critrevimmunol.v31.i6.20
25. DeDiego ML, Martinez-Sobrido L, Topham DJ. Novel functions of IFI44L as a feedback regulator of host antiviral responses. J Virol (2019) 93. doi: 10.1128/JVI.01159-19
26. Abediankenari S, Shaker D, Abedian F, Mirabi A. The effect of beta interferon on dendritic cells and cytokine synthesis by CD4+ T cells. Iran J Immunol (2009) 6:61–6.
27. Chen M, Chen G, Deng S, Liu X, Hutton GJ, Hong J. IFN-beta induces the proliferation of CD4+CD25+Foxp3+ regulatory T cells through upregulation of GITRL on dendritic cells in the treatment of multiple sclerosis. J Neuroimmunol (2012) 242:39–46. doi: 10.1016/j.jneuroim.2011.10.014
28. Kuka M, De Giovanni M, Iannacone M. The role of type I interferons in CD4(+) T cell differentiation. Immunol Lett (2019) 215:19–23. doi: 10.1016/j.imlet.2019.01.013
29. Brorson IS, Eriksson AM, Hogestol E, Leikfoss IS, Harbo HF, Berge T, et al. Global DNA methylation changes in treated and untreated MS patients measured over time. J Neuroimmunology (2022) 364. doi: 10.1016/j.jneuroim.2022.577808
30. Rizzo F, Giacomini E, Mechelli R, Buscarinu MC, Salvetti M, Severa M, et al. Interferon-beta therapy specifically reduces pathogenic memory b cells in multiple sclerosis patients by inducing a FAS-mediated apoptosis. Immunol Cell Biol (2016) 94:886–94. doi: 10.1038/icb.2016.55
31. Huang H, Ito K, Dangond F, Dhib-Jalbut S. Effect of interferon beta-1a on B7.1 and B7.2 b-cell expression and its impact on T-cell proliferation. J Neuroimmunol (2013) 258:27–31. doi: 10.1016/j.jneuroim.2013.02.010
32. Bjornevik K, Cortese M, Healy BC, Kuhle J, Mina MJ, Leng Y, et al. Longitudinal analysis reveals high prevalence of Epstein-Barr virus associated with multiple sclerosis. Science (2022) 375:296–301. doi: 10.1126/science.abj8222
33. Sodeifian F, Nikfarjam M, Kian N, Mohamed K, Rezaei N. The role of type I interferon in the treatment of COVID-19. J Med Virol (2022) 94:63–81. doi: 10.1002/jmv.27317
34. Alavi Darazam I, Shokouhi S, Pourhoseingholi MA, Naghibi Irvani SS, Mokhtari M, Shabani M, et al. Role of interferon therapy in severe COVID-19: the COVIFERON randomized controlled trial. Sci Rep (2021) 11:8059. doi: 10.1038/s41598-021-86859-y
35. Salto-Alejandre S, Palacios-Baena ZR, Arribas JR, Berenguer J, Carratala J, Jarrin I, et al. Impact of early interferon-beta treatment on the prognosis of patients with COVID-19 in the first wave: a post hoc analysis from a multicenter cohort. BioMed Pharmacother (2022) 146:112572. doi: 10.1016/j.biopha.2021.112572
36. Miclea A, Bagnoud M, Chan A. & hoepner, r. a brief review of the effects of vitamin d on multiple sclerosis. Front Immunol (2020) 11:781. doi: 10.3389/fimmu.2020.00781
37. Sintzel MB, Rametta M, Reder AT. Vitamin d and multiple sclerosis: a comprehensive review. Neurol Ther (2018) 7:59–85. doi: 10.1007/s40120-017-0086-4
38. Boltjes R, Knippenberg S, Gerlach O, Hupperts R, Damoiseaux J. Vitamin d supplementation in multiple sclerosis: an expert opinion based on the review of current evidence. Expert Rev Neurother (2021) 21:715–25. doi: 10.1080/14737175.2021.1935878
Keywords: multiple sclerosis, methylation, interferon beta (IFN beta), disease modifying therapy (DMT), inflammation, epigenetics (DNA methylation)
Citation: Xavier A, Campagna MP, Maltby VE, Kilpatrick T, Taylor BV, Butzkueven H, Ponsonby A-L, Scott RJ, Jokubaitis VG, Lea RA and Lechner-Scott J (2023) Interferon beta treatment is a potent and targeted epigenetic modifier in multiple sclerosis. Front. Immunol. 14:1162796. doi: 10.3389/fimmu.2023.1162796
Received: 10 February 2023; Accepted: 12 May 2023;
Published: 30 May 2023.
Edited by:
Noel G. Carlson, The University of Utah, United StatesReviewed by:
Lorna Galleguillos, Clínica Alemana, ChileEnedina Oliveira, Enedina Maria Lobato de Oliveira, Brazil
Susana Diniz, Universidade Anhanguera de São Paulo, Brazil
Copyright © 2023 Xavier, Campagna, Maltby, Kilpatrick, Taylor, Butzkueven, Ponsonby, Scott, Jokubaitis, Lea and Lechner-Scott. This is an open-access article distributed under the terms of the Creative Commons Attribution License (CC BY). The use, distribution or reproduction in other forums is permitted, provided the original author(s) and the copyright owner(s) are credited and that the original publication in this journal is cited, in accordance with accepted academic practice. No use, distribution or reproduction is permitted which does not comply with these terms.
*Correspondence: Jeannette Lechner-Scott, SmVhbm5ldHRlLkxlY2huZXJTY290dEBoZWFsdGgubnN3Lmdvdi5hdQ==
†These authors have contributed equally to this work and share last authorship