 Yao Wang†
 Zhi-ning Fan
- Digestive Endoscopy Department, Jiangsu Province Hospital, The First Affiliated Hospital with Nanjing Medical University, Nanjing, China
Background: As yet, the genetic abnormalities involved in the exacerbation of Ulcerative colitis (UC) have not been adequately explored based on bioinformatic methods.
Materials and methods: The gene microarray data and clinical information were downloaded from Gene Expression Omnibus (GEO) repository. The scale-free gene co-expression networks were constructed by R package “WGCNA”. Gene enrichment analysis was performed via Metascape database. Differential expression analysis was performed using “Limma” R package. The “randomForest” packages in R was used to construct the random forest model. Unsupervised clustering analysis performed by “ConsensusClusterPlus”R package was utilized to identify different subtypes of UC patients. Heat map was established using the R package “pheatmap”. Diagnostic parameter capability was evaluated by ROC curve. The”XSum”packages in R was used to screen out small-molecule drugs for the exacerbation of UC based on cMap database. Molecular docking was performed with Schrodinger molecular docking software.
Results: Via WGCNA, a total 77 high Mayo score-associated genes specific in UC were identified. Subsequently, the 9 gene signatures of the exacerbation of UC was screened out by random forest algorithm and Limma analysis, including BGN,CHST15,CYYR1,GPR137B,GPR4,ITGA5,LILRB1,SLFN11 and ST3GAL2. The ROC curve suggested good predictive performance of the signatures for exacerbation of UC in both the training set and the validation set. We generated a novel genotyping scheme based on the 9 signatures. The percentage of patients achieved remission after 4 weeks intravenous corticosteroids (CS-IV) treatment was higher in cluster C1 than that in cluster C2 (54% vs. 27%, Chi-square test, p=0.02). Energy metabolism-associated signaling pathways were significantly up-regulated in cluster C1, including the oxidative phosphorylation, pentose and glucuronate interconversions and citrate cycle TCA cycle pathways. The cluster C2 had a significant higher level of CD4+ T cells. The”XSum”algorithm revealed that Exisulind has a therapeutic potential for UC. Exisulind showed a good binding affinity for GPR4, ST3GAL2 and LILRB1 protein with the docking glide scores of –7.400 kcal/mol, –7.191 kcal/mol and –6.721 kcal/mol, respectively.We also provided a comprehensive review of the environmental toxins and drug exposures that potentially impact the progression of UC.
Conclusion: Using WGCNA and random forest algorithm, we identified 9 gene signatures of the exacerbation of UC. A novel genotyping scheme was constructed to predict the severity of UC and screen UC patients suitable for CS-IV treatment. Subsequently, we identified a small molecule drug (Exisulind) with potential therapeutic effects for UC. Thus, our study provided new ideas and materials for the personalized clinical treatment plans for patients with UC.
Introduction
As a chronic relapsing bowel disease, Ulcerative colitis (UC) is characterized by intestinal inflammation, mucosal injury, and fibrosis (1). The most common symptoms of UC are bloody diarrhoea, weight loss and abdominal pain. UC has represented an increasing prevalence worldwide and carried a significant global disease burden in the past few years (2). Aggravating and relieving factors of UC remains undefined, yet multiple genetic and environmental factors have been demonstrated to participate in its severity and progression (3–6). With the rapid development of high-throughput sequencing, bioinformatic analysis of gene expression profiling has been widely applied to investigate molecular mechanisms and identify potential therapeutic targets (7–9). However, few studies have explored the underlying mechanisms and biomarkers of exacerbation and remission for UC based on bioinformatic methods.
In many high-quality studies, the severity of disease was scored using the Mayo score for UC (10–13). The Mayo score ranges from 0 to 12, with higher scores indicating more severe disease (14). The Mayo score consists of four items: stool frequency, rectal bleeding, findings of flexible proctosigmoidoscopy and the clinical assessment (15). Mayo score can also be used to assess the disease activity and efficacy of the therapeutic regimen for UC (13).
In this study, we aim to investigate the key gene alterations affecting the severity of UC based on Mayo score and bioinformatic analysis, contributing to the development of personalized clinical management and treatment regimens for UC. The workflow chart of our study was shown in Supplementary Figure 1.
Materials and methods
Data acquisition
The microarray data and clinical information of UC patients were downloaded from the Gene Expression Omnibus (GEO) (GSE109142, and GSE92415) (16). The GSE109142, and GSE92415 cohorts contained Mayo scores information for all samples. Sample sizes: GSE109142 (Normal, n = 20; UC, n = 206); GSE92415 (Normal, n = 21; UC, n = 162). The microarray data was download at https://www.ncbi.nlm.nih.gov/geo/ on December 1, 2022. The GSE109142 cohort was used as the training set considering its relatively large sample size. The GSE92415 cohort was used as the validation set. Furthermore, another independent validation dataset (GSE73661) was then obtained from GEO database, in which 166 UC patients for whom mayo endoscopic score were available.
Weighted correlation network analysis
R package “WGCNA” was utilized to construct the co-expression networks based on the microarray data (17). As a soft-thresholding power, the primary role of β was to emphasize strong correlations between the genes and penalize weak correlations. The topological overlap matrix (TOM) was transformed from the adjacency after we chosed the β based on the “pickSoftThreshold” algorithm which came with the “WGCNA” R package (18). Pearson’s correlation analysis was conducted to appraise the correlation between module eigengenes (MEs) and Mayo score. Subsequently, gene module with the highest pearson’s coefficient was considered as the module most relevant to the Mayo score (Mayo score-related module) in UC. We set the screening criteria as |MM| > 0.8 and |GS| > 0.1, and then we obtained the distinct hub genes in the Mayo score-related module (9). Specific schematic process of WGCNA can be found in Supplementary Figure 2.
WGCNA was performed separately on GSE109142 and GSE92415 to determine Mayo score-related hub genes, respectively. The intersection of the hub genes form GSE109142 and GSE92415 was included in the next step of analysis and the results was visualized using the “VENNY 2.1” online tool (19) (https://bioinfogp.cnb.csic.es/tools/venny/index.html).
Gene enrichment analysis
The Metascape database was utilized to perform enrichment analyses (20). All other parameters set as default. Terms with a p value < 0.01, minimum count of 3, and an enrichment factor > 1.5 were utilized in the next step of the analysis. Using screening criteria of kappa scores = 4 and similarity > 0.3, Metascape was utilized to perform hierarchical clustering to partition enrichment terms into distinct clusters, and the terms with the minimum p value were selected as the representative terms.
Gene Set Enrichment Analysis (GSEA) software (version 3.0) (http://software.broadinstitute.org/gsea/index.jsp) was used to perform GSEA analysis and identify significantly enriched pathways in different group (21). In the GSEA runs, maximum gene set size was set to 5,000 and minimum gene set size was set to 5. FDR ≤ 0.25 were considered as statistically significant. The KEGG pathways (c2.cp.kegg.v7.4.symbols.gmt) were arranged according to the normalized enrichment scores (NES) (22). Top five significantly enriched KEGG pathways were shown.
Linear models for microarray data (Limma) analysis and random forest
Based on upper and lower quartiles of the set of Mayo scores in training set, UC patients were stratified to low-, moderate-, and high-Mayo score groups. Substantially, Limma analysis and random forest was used to screen the key gene signatures from the intersection of the hub genes (23). Differential gene expression analysis followed the Limma pipeline performed by R package “limma” (version 3.40.6). Differential expression genes (DEGs) were identified according to the filter criteria (|fold change| > 1.5, FDR < 0.05). The random forest algorithms was performed by the “randomForest” packages in R (24). The ‘randomForest’ package in R was used to grow a forest of 500 trees using the default settings. Based on the “randomForest” algorithms, we selected the top 10 genes with the highest importance for downstream analysis. The intersection of the results between Limma and random forest methods was identified as the key gene signatures.
Unsupervised hierarchical clustering
Unsupervised clustering was performed through R package “ConsensusClusterPlus”, using agglomerative pam clustering with a 1-pearson correlation distances and resampling 80% of the samples for 10 repetitions (25). The optimal number of clusters was determined using the empirical cumulative distribution function plot. We divided UC patients into different molecular patterns based on the expression matrix of key gene signatures obtain by Limma and random forest methods.
Identification of immune infiltration characterization of UC
The Immune Cell Abundance Identifier (ImmuCellAI) database was used to estimate the abundance of 24 types of immune cells in GSE109142 by inputting microarray data (26). ImmuCellAI database is a online tool to estimate the abundance of the 24 immune cells, comprising of 18 T-cell subtypes and 6 other immune cells: B cell, NK cell, Monocyte cell, Macrophage cell, Neutrophil cell and DC cell.
Discovery of potential drugs by computational methods
A similarity scoring algorithm called eXtreme Sum (XSum) was performed to screen the candidate small molecule drugs based on the connectivity map (cMap) database (27). The DEGs between different immune infiltration subtypes were used as input file of “XSum” algorithm. Subsequently, a score was calculated for each small molecule drugs of cMap database by “XSum” algorithm. Lower score indicates greater potential to act as a therapeutic drug for reversing the immune infiltration condition.
RCSB Protein Data Bank (PDB) (www.rcsb.org/pdb/home/home.do) was used to obtain the crystal structures of proteins coded by the hub gene (28). Furthermore, the 3D structure of the small molecule drugs was download from PubChem (https://www.ncbi.nlm.nih.gov/pccompound) (29). The molecular docking process involved preparing the proteins and ligands, setting up a grid, and docking the compounds; these were conducted using the Schrodinger software (30). The best pose was choose based on the docking score and the rationality of molecular conformation.
Chemical-gene interaction analysis
To explore the interplay between environmental chemical toxicant exposure and the UC exacerbation, we conducted an analysis utilizing the meticulously curated research studies on the Comparative Toxicogenomic Database (CTD). In our analysis, we scrutinized environmental toxicants and drugs affecting the gene expression of all key genes previously identified. Our analysis is limited to human species only.
Real time quantitative PCR detection of GPR4, ST3GAL2, and LILRBgene expression
TRIzol reagent (Ambion, USA) was utilized for total RNA extraction, followed by reverse transcription of the extracted mRNA into cDNA using PrimeScript™ RT Master Mix (Takara, Japan). RT-qPCR was performed to quantify the transcripts using ChamQ SYBR qPCR Master Mix (Vazyme, China). Through RT-qPCR, gene expression was detected and the relative expression levels of the genes were evaluated using the 2-ΔΔCT method. To serve as an internal reference, GAPDH was used and the experiment was repeated thrice to establish the average. The following primer sequences were utilized for the detection of GPR4, ST3GAL2, and LILRB1 expression levels:
The forward primer of GPR4 was 5’-CATCGTGCTGGTCTGCTT-3’.
The reverse primer of GPR4 was 5’-CACAGTTGAGGCTGGTGAA-3’.
The forward primer of ST3GAL2 was 5’-TTCACCTACTCGCACCACA-3’.
The reverse primer of ST3GAL2 was 5’-CGACAGGCACAGCTCTTG-3’.
The forward primer of LILRB1 was 5’-CCTTGTGGGCACTCCATT-3’.
The reverse primer of LILRB1 was 5’-ACGCATCTCGCATCTGG-3’.
Four patients with UC and four healthy controls who have signed informed consents were recruited from Jiangsu Provincial People’s Hospital. Samples of inflamed intestinal tissue from UC patients and normal tissue were harvested from colonoscopy biopsy specimens of both patients and controls.
Statistical analyses
R software (version 4.0.4) was utilized for all statistical procedures. Continuous variables were compared with the Wilcoxon/Kruskal–Wallis test. Differences in proportion were tested by the chi-square test. A p value less than 0.05 was considered significant. Receiver operating characteristic (ROC) curve was constructed to assess the predictive efficacy (31). Dimensionality reduction was performed using principal component analysis (PCA), uniform Manifold Approximation and Projection (UMAP) t-distributed stochastic neighbor embedding (tSNE) (32–34).
Results
Mayo score-related gene module revealed by WGCNA
In GSE109142 cohort, the soft threshold for network construction was set to 22 (Supplementary Figures 3A, B). In WGCNA analysis, sample clustering was performed based on gene expression patterns to detect outliers (Supplementary Figure 3C). Then, 9 gene modules in GSE109142 cohort were identified (Supplementary Figures 3D, E; Supplementary Table 1). The MEs of modules were utilized to evaluated Pearson’s correlation coefficients between the modules and Mayo score. Then, we identified the salmon module as the most tightly module linked with Mayo score in GSE109142 (Pearson’s correlation r = 0.40, p < 0.0001; Figure 1A). There were 1131 genes included in the salmon module (Supplementary Figure 3E). Subsequently, we screened 398 distinct hub genes in the salmon module based on the criteria of |MM| > 0.8 and |GS| > 0.1 (Supplementary Table 2).
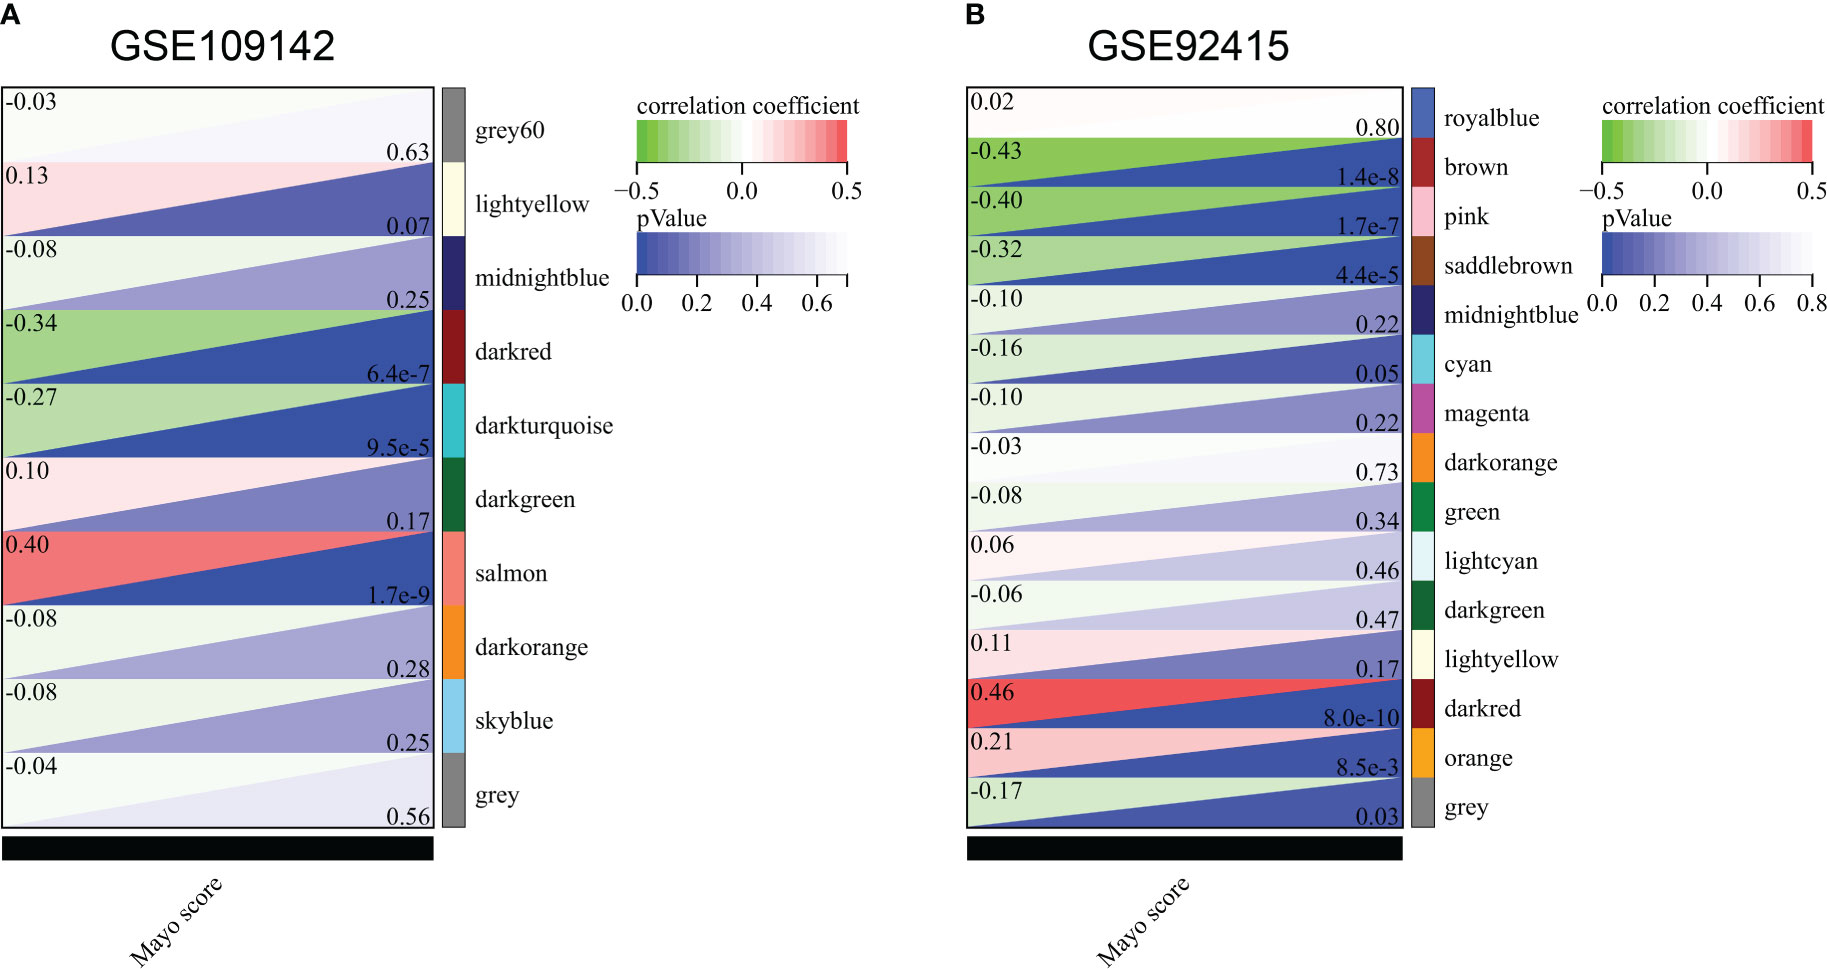
Figure 1 Correlation of gene co-expression modules with Mayo score in GSE109142 cohort (A) and GSE92415 cohort (B).
In GSE92415 cohort, the soft threshold for network construction was set to 12 (Supplementary Figures 4A, B). Sample clustering in GSE92415 was also performed and shown in Supplementary Figure 4C. A total 14 gene modules were identified (Supplementary Figures 4D, E; Supplementary Table 3). The dark red module was the most related module with Mayo score in GSE92415 (Pearson’s correlation r = 0.46, p < 0.0001; Figure 1B). A total 375 hub genes were obtained in the dark red module (Supplementary Table 4).
By taking the intersection of the hub gene set in GSE109142 and GSE92415, a total 77 Mayo score-related genes were identified (Figure 2A). Top 20 enriched pathways of these Mayo score-related genes were revealed by Metascape analysis. These Mayo score-related genes were primarily involved in blood vessel development, immunomodulatory and inflammatory reactions (Figure 2B).
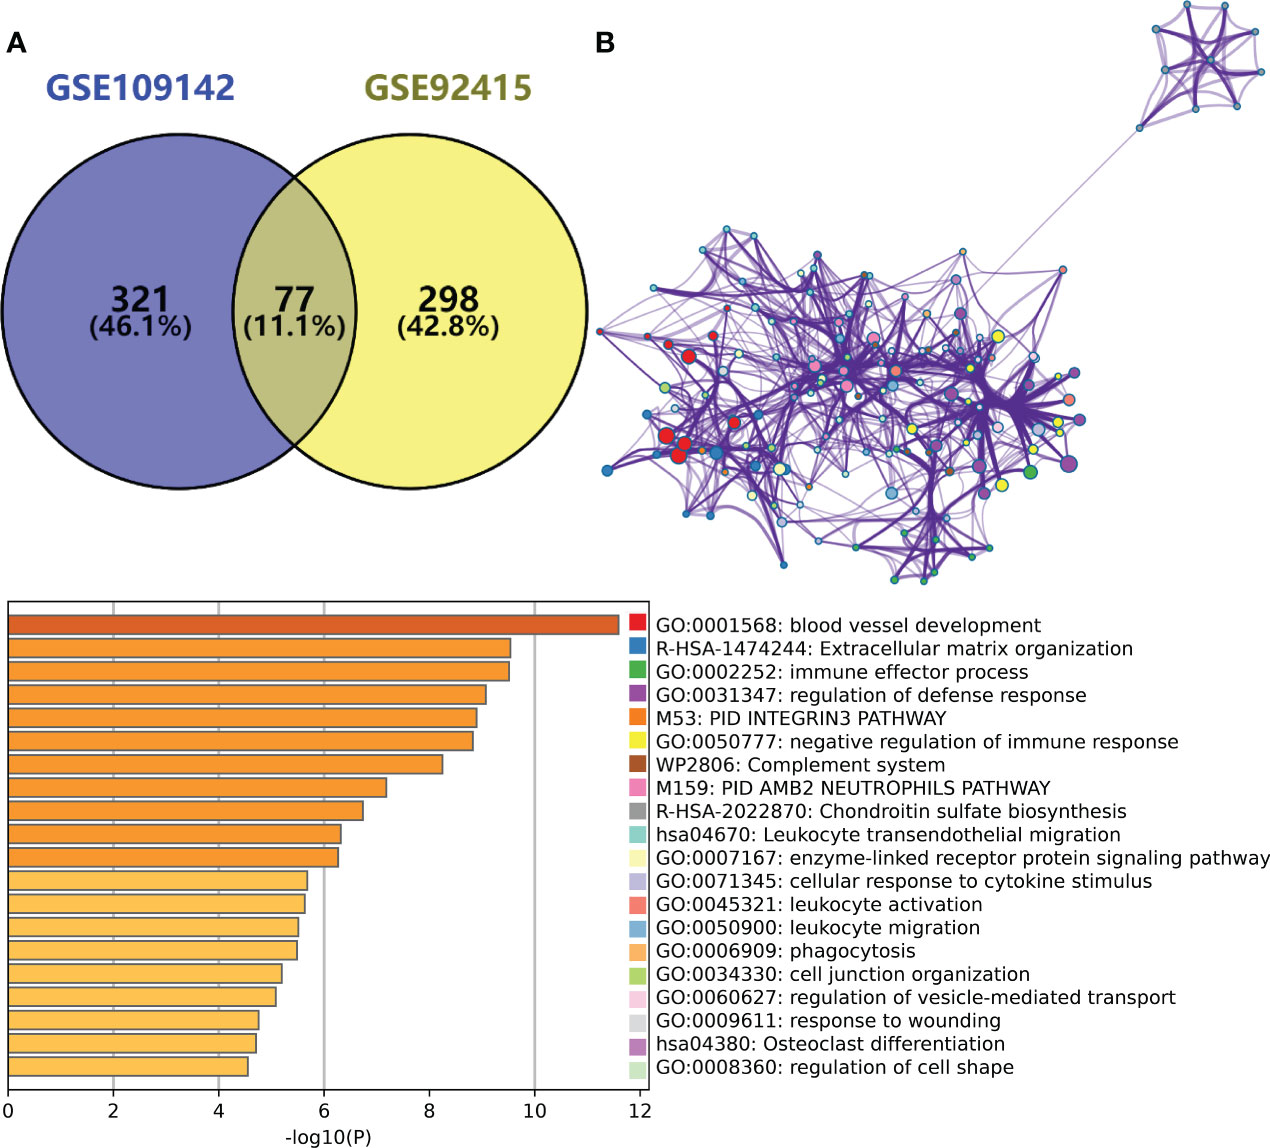
Figure 2 (A) Venn plot showing the intersection between the hub genes of GSE109142 cohort and GSE92415 cohort. (B) Metascape enrichment analysis results of the hub genes common to GSE109142 cohort and GSE92415 cohort (n=77).
Key gene signatures of high-Mayo score patients revealed by Limma and random forest analysis
Limma and random forest analysis was used to identify the high-Mayo score related key gene signatures (HMGSs) form the 77 Mayo score-related genes. A total 64 of 77 Mayo score-related genes were highly expressed in high-Mayo score patients. Besides, ten key genes were identified based random forest algorithm. Venn diagram showed the intersection of results of Limma and random forest analysis. Then, 9 HMGSs were screened out, including BGN,CHST15,CYYR1,GPR137B,GPR4,ITGA5,LILRB1,SLFN11 and ST3GAL2 (Figure 3A).
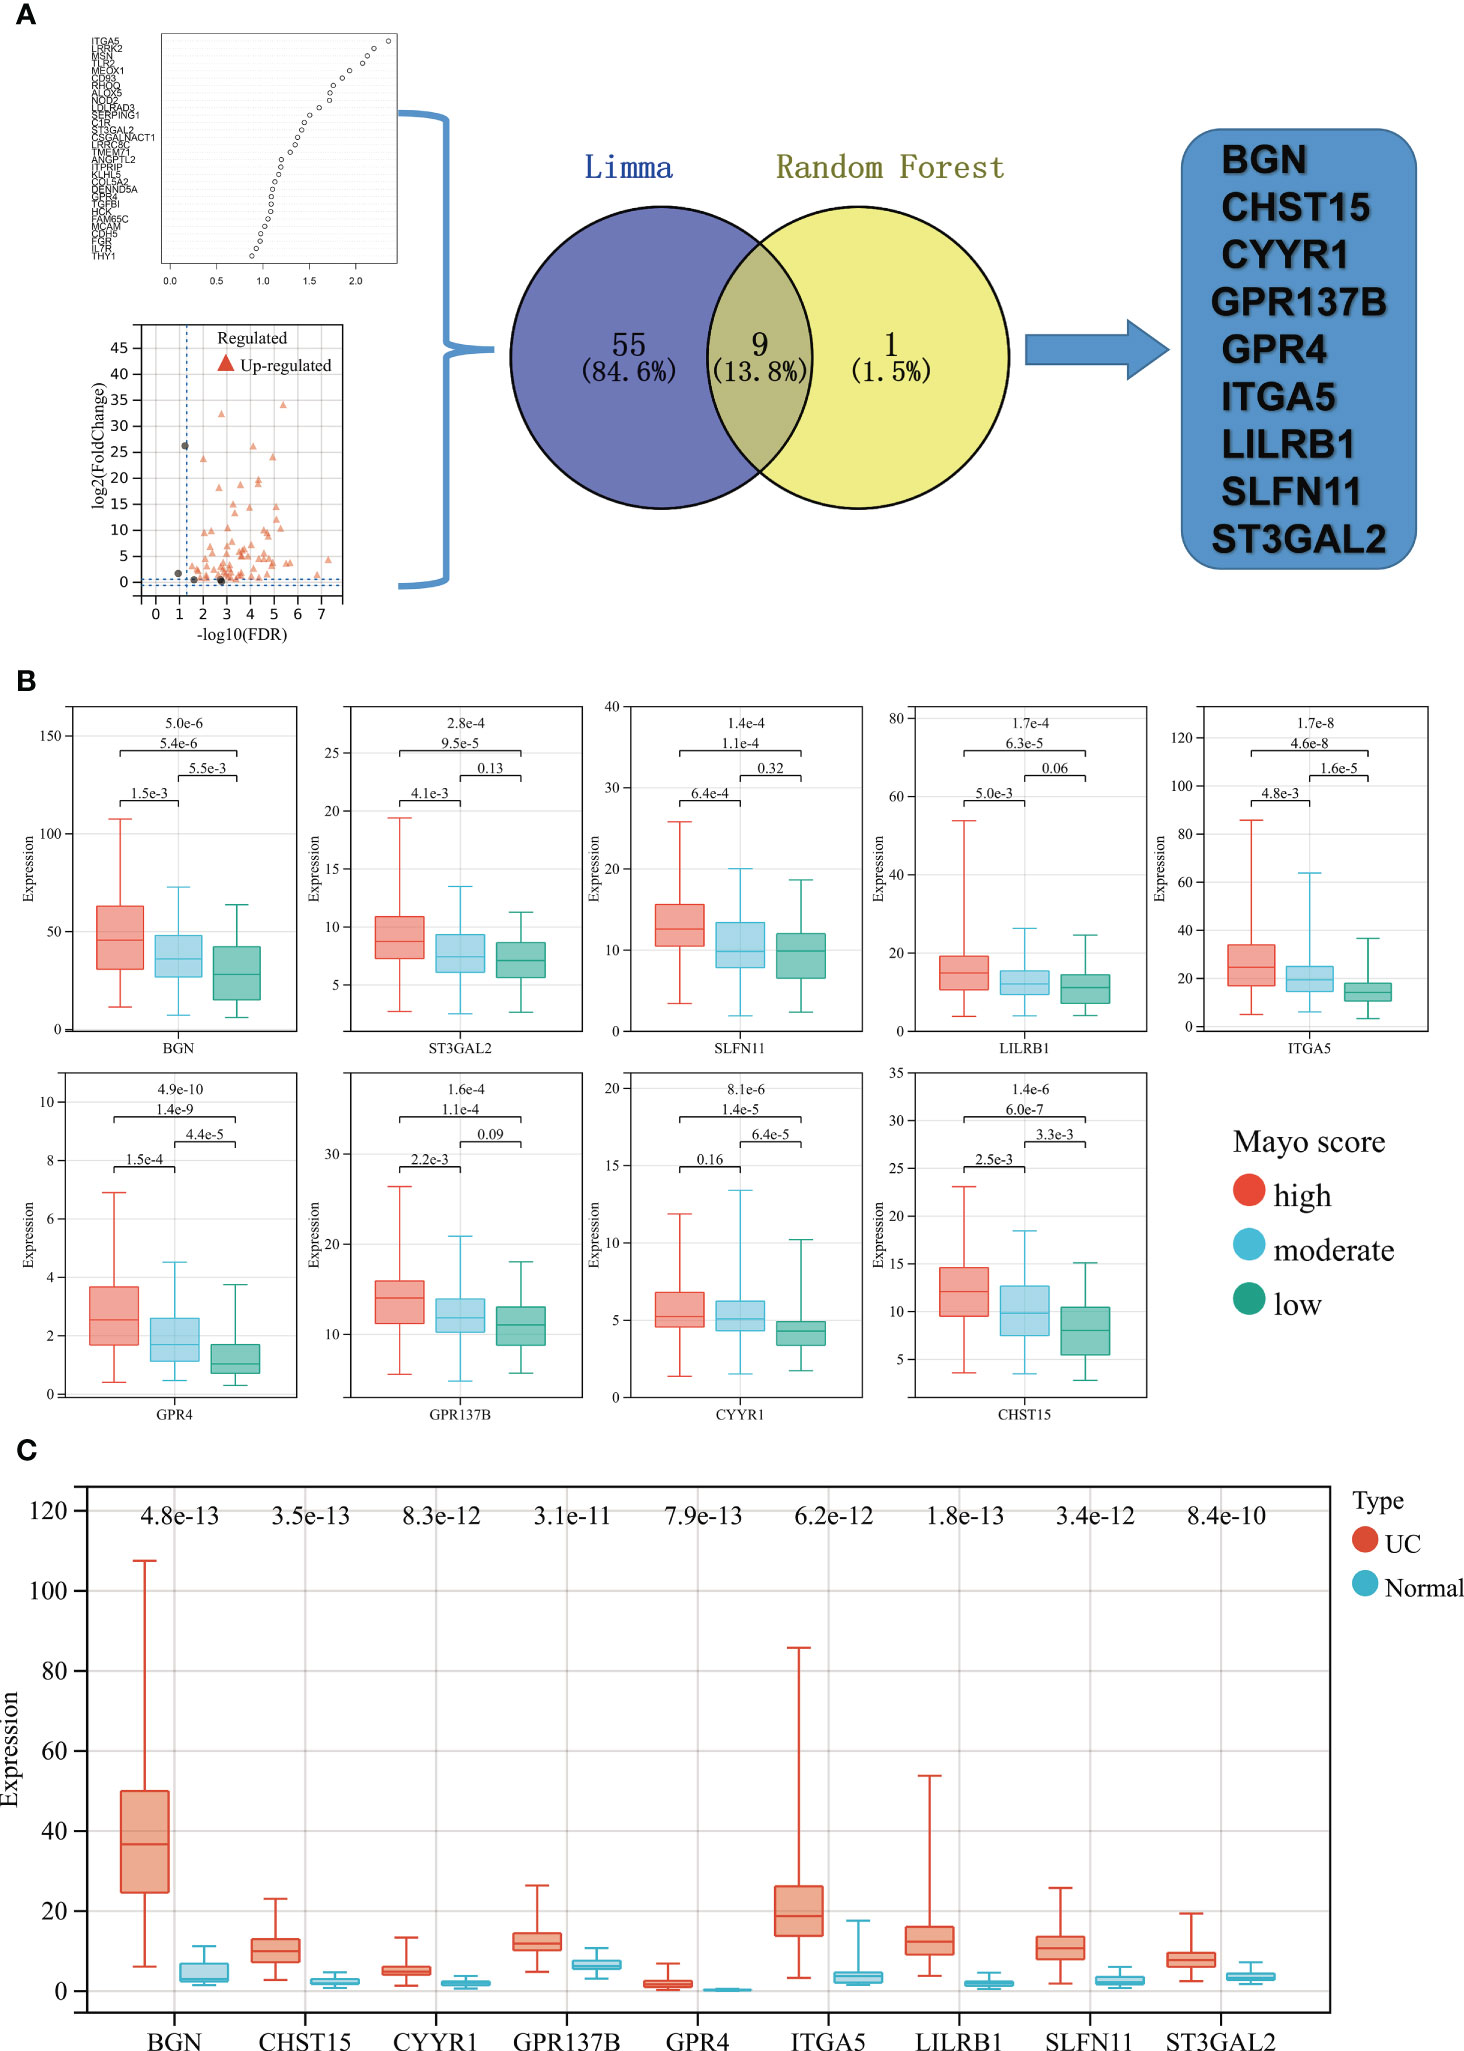
Figure 3 (A) Flowchart of HMGSs screening and selection process. (B) Based on upper and lower quartiles of the set of Mayo scores in GSE109142 cohort, UC patients were stratified to high- (red), moderate- (blue), and low- (green) Mayo score groups. Boxplots showing the expression levels of the 9 HMGSs across different Mayo score group. (C) Boxplots showing the expression levels of the 9 HMGSs in UC intestinal samples (red) and normal intestinal samples (blue).
All the HMGSs were significantly up-regulated in the UC patients with high-Mayo scores and down-regulated in the UC patients with low-Mayo scores (p < 0.001; Figure 3B). In addition, the expression levels of these HMGSs were significantly higher in the UC samples compared to normal colon mucosa tissue (p < 0.0001; Figure 3C). The PCA,UMAP and tSNE analysis grouped UC samples separately from the normal healthy controls suggesting that the HMGSs was distinctive genomic signatures of the colon mucosa in UC. Furthermore, ROC analysis revealed that the overall characteristic portraits of HMGSs can be an excellent predictive indicator in the diagnosis of UC (Supplementary Figure 5).
Validation of HMGSs for UC patients with high Mayo scores
In validation set (GSE92415), Spearman correlation indicated that all the 9 HMGSs were significantly positively correlated with the Mayo score, especially GPR4 (Rho=0.520; p<0.0001; Supplementary Figure 6A). The HMGSs were significantly up-regulated in UC patients with high Mayo scores in GSE92415 (p<0.01; Supplementary Figure 6B). In addition, HMGSs were significantly up-regulated in UC samples compared to normal colon mucosa tissue in GSE92415 (p<0.0001; Supplementary Figure 6C). ROC analysis suggested that HMGSs can be a predictive indicator in the diagnosis of UC patients with high Mayo scores (Supplementary Figure 7).
In another independent validation dataset (GSE73661), the expression levels of HMGSs were significantly higher in UC patients with higher mayo endoscopic scores (Supplementary Figure 8A). Lower expression levels of HMGSs were observed in non-UC tissues compared to UC tissues (Supplementary Figure 8B). ROC analysis suggested a good diagnostic ability of HMGSs for high mayo endoscopic score (2-3; Supplementary Figure 8C).
A novel typing scheme uncover the disease severity and treatment outcomes of UC
Unsupervised clustering was performed in GSE109142 using R Package “ConsensusCluster Plus” based on the 9 HMGSs. The optimal number of clusters was determined using the empirical CDF plot (Figures 4A, B). On the basis of the consensus scores, the CDF curve achieved the best partition efficiency when k = 2 (Figures 4C, D). We therefore divided the UC patients into different molecular subtypes (cluster C1 and cluster C2). The heatmap demonstrated the distinct gene expression patterns of HMGSs between the different clusters (Figure 4E). Expression level of HMGSs in cluster C2 were higher than those in the cluster C1. UC patients in cluster C2 had higher levels of Mayo score, Pucai score and fecal calprotectin, suggesting a higher disease severity (Figures 5A–C). In GSE109142 cohort, 53 patients received 5-aminosalicylic acid (5ASA) treatment, 81 received oral corticosteroids (CS-Oral) treatment, 72 received intravenous corticosteroids (CS-IV) treatment. Symptoms were reassessed after 4 weeks of initial treatment. Chi-square test indicated that the proportion of patients with global symptom relief after initial treatment was higher in cluster C1 then that in cluster C2 (59% vs. 42%, p=0.01; Figure 5D). Additionally, patients of cluster C1 were more likely to derive benefit from CS-IV treatment (54% vs. 27%, p=0.02; Figure 5D). We carried out subsequent analyses to experimentally test whether our molecular typing scheme predicting CS-IV sensitivity is rooted in the variation of disease severity. We initially conducted ROC analysis and identified that disease severity index, Mayo score, lacks significant predictive capability towards CS-IV treatment responsiveness, with AUC=0.44(95% CI: 0.30-0.57). Furthermore, we stratified all patients receiving CS-IV treatment into high-Mayo score and low-Mayo score groups according to the median value of Mayo score (10). Subsequently, chi-square test revealed no significant difference between the proportions of patients responding to CS-IV treatment in the high-Mayo score group and the low-Mayo score group (p=0.4628). Thus, we infer that the predictive ability of our established molecular typing scheme for CS-IV treatment responsiveness is relatively independent of disease severity.
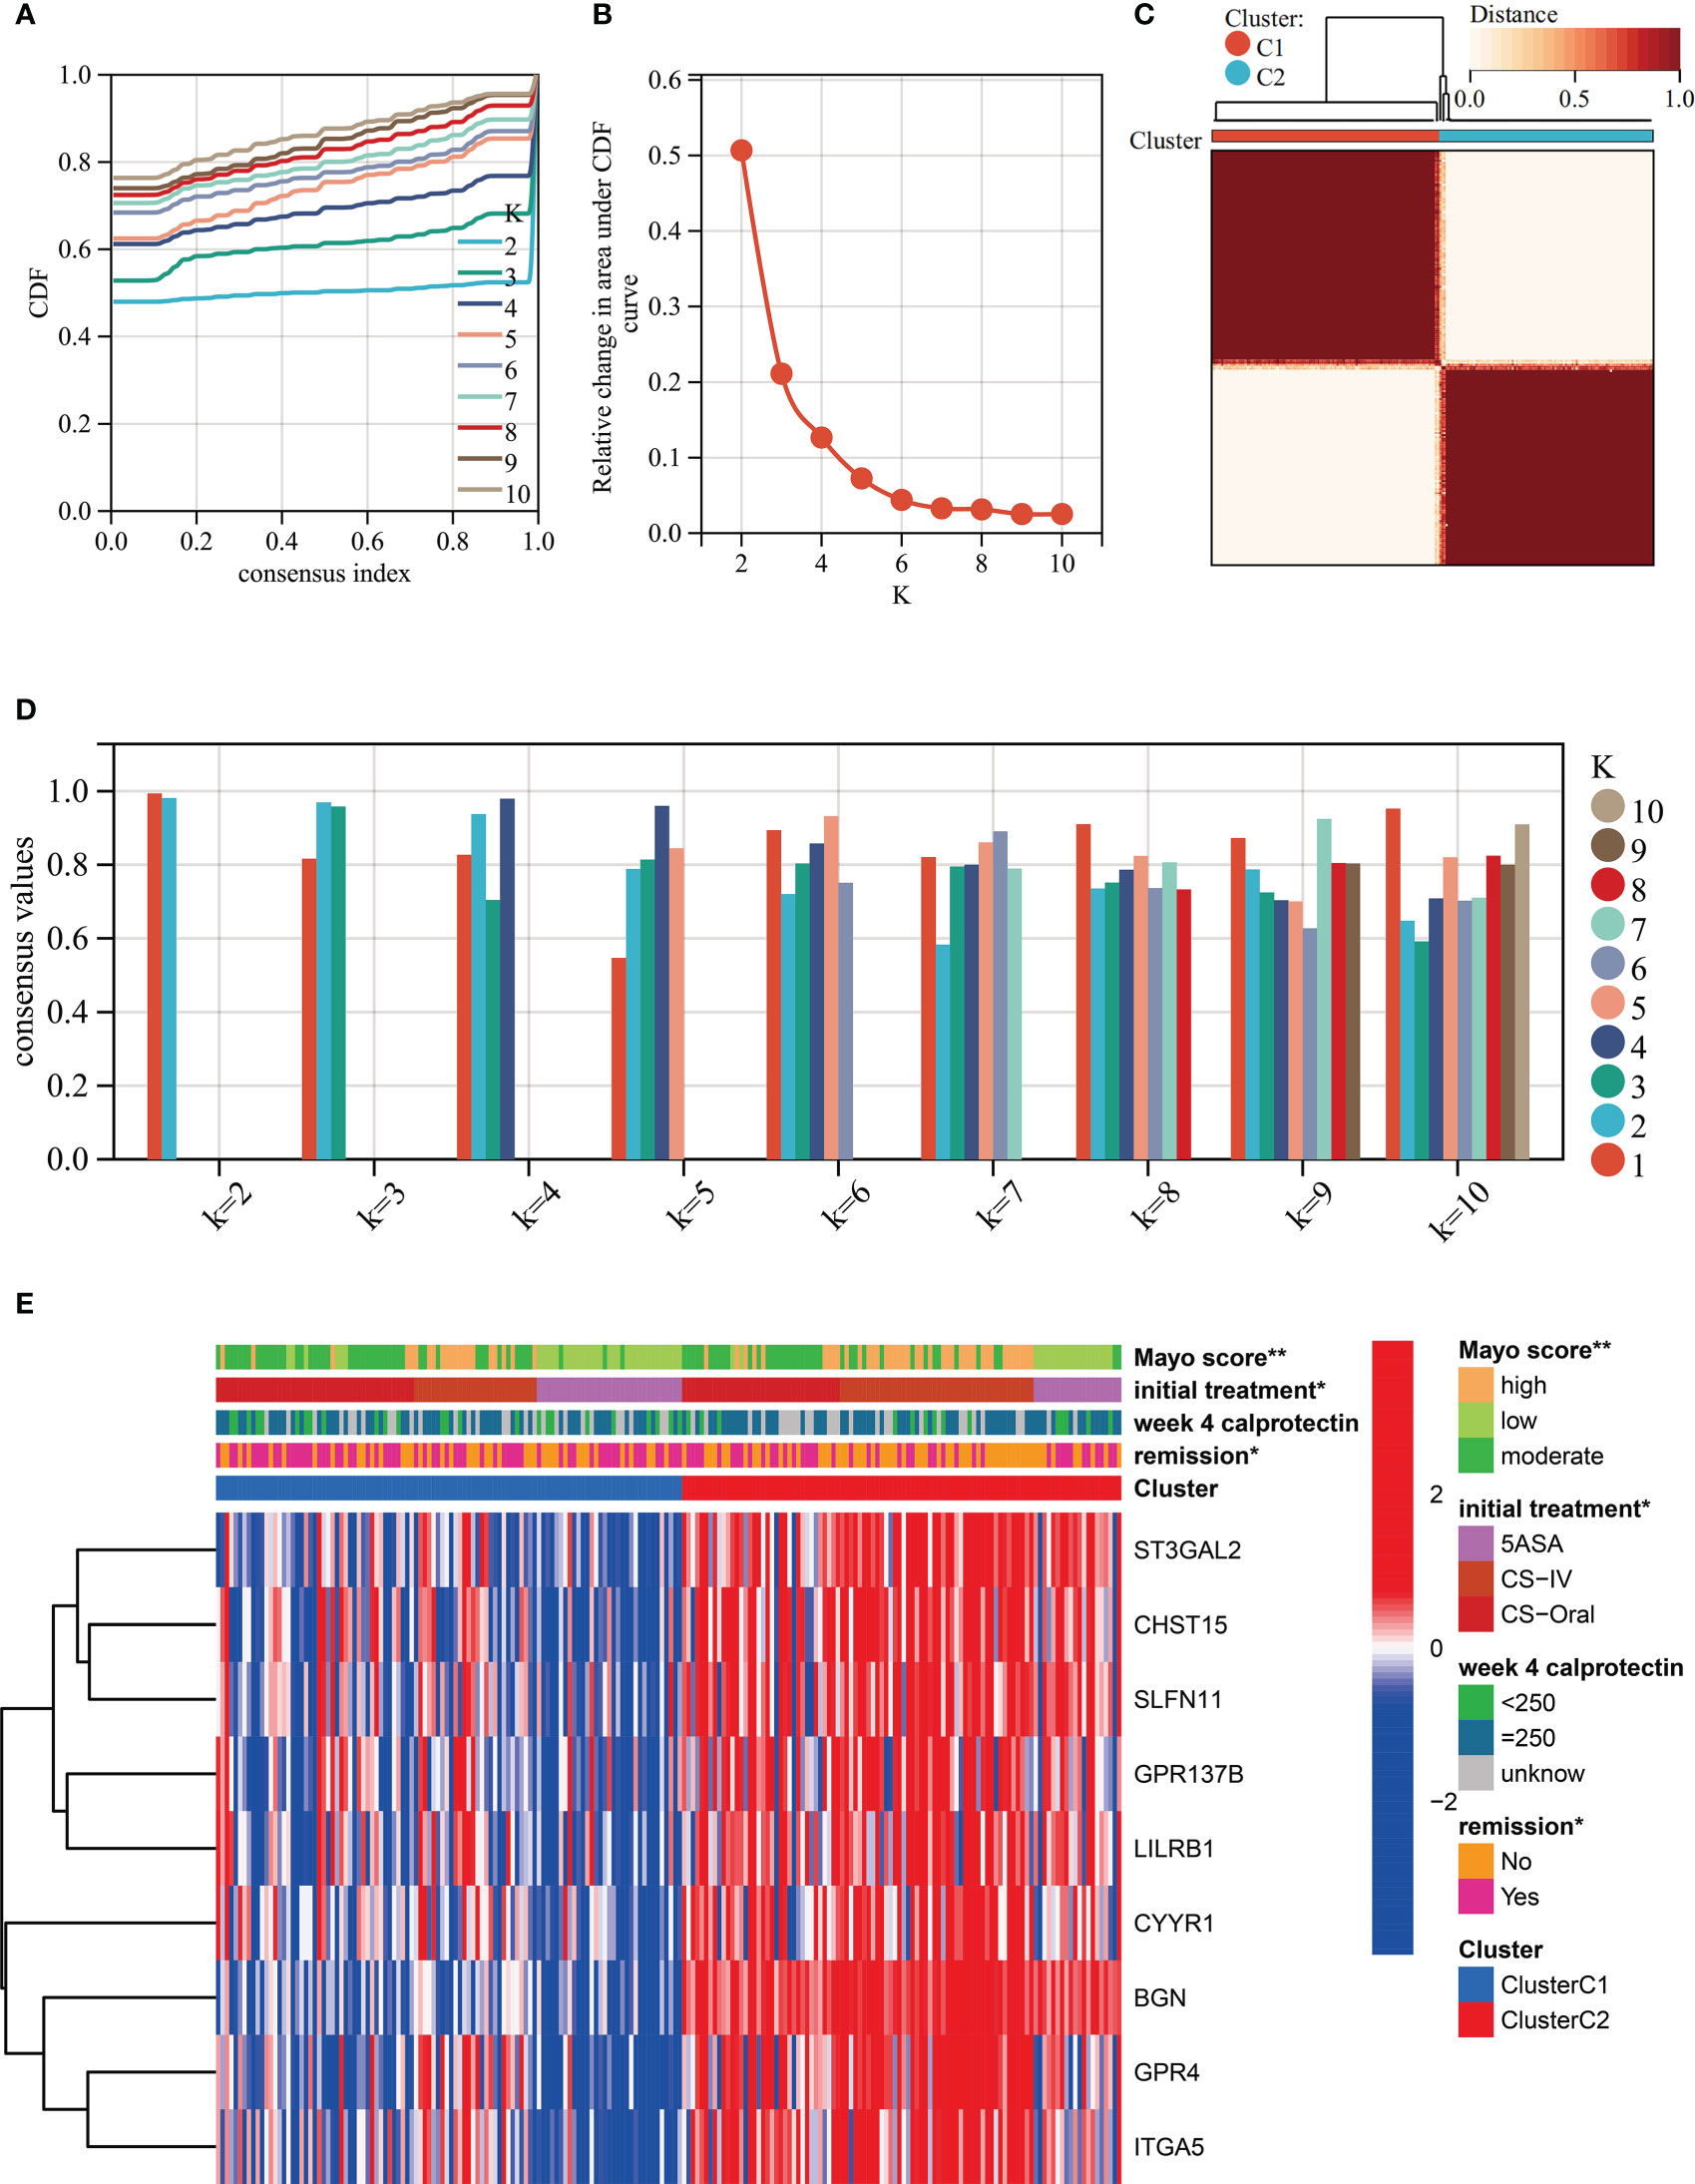
Figure 4 Unsupervised clustering performed in training dataset (GSE109142) based on the 9 HMGSs. (A) Consensus clustering cumulative distribution function (CDF) for k = 2-10. (B) Relative change in the area under the CDF curve (k = 2-10). (C) Consensus clustering matrix for k=2. (D) Cluster consensus values for k = 2-10. (E) Heatmap for the normalized expression of the 9 HMGSs.
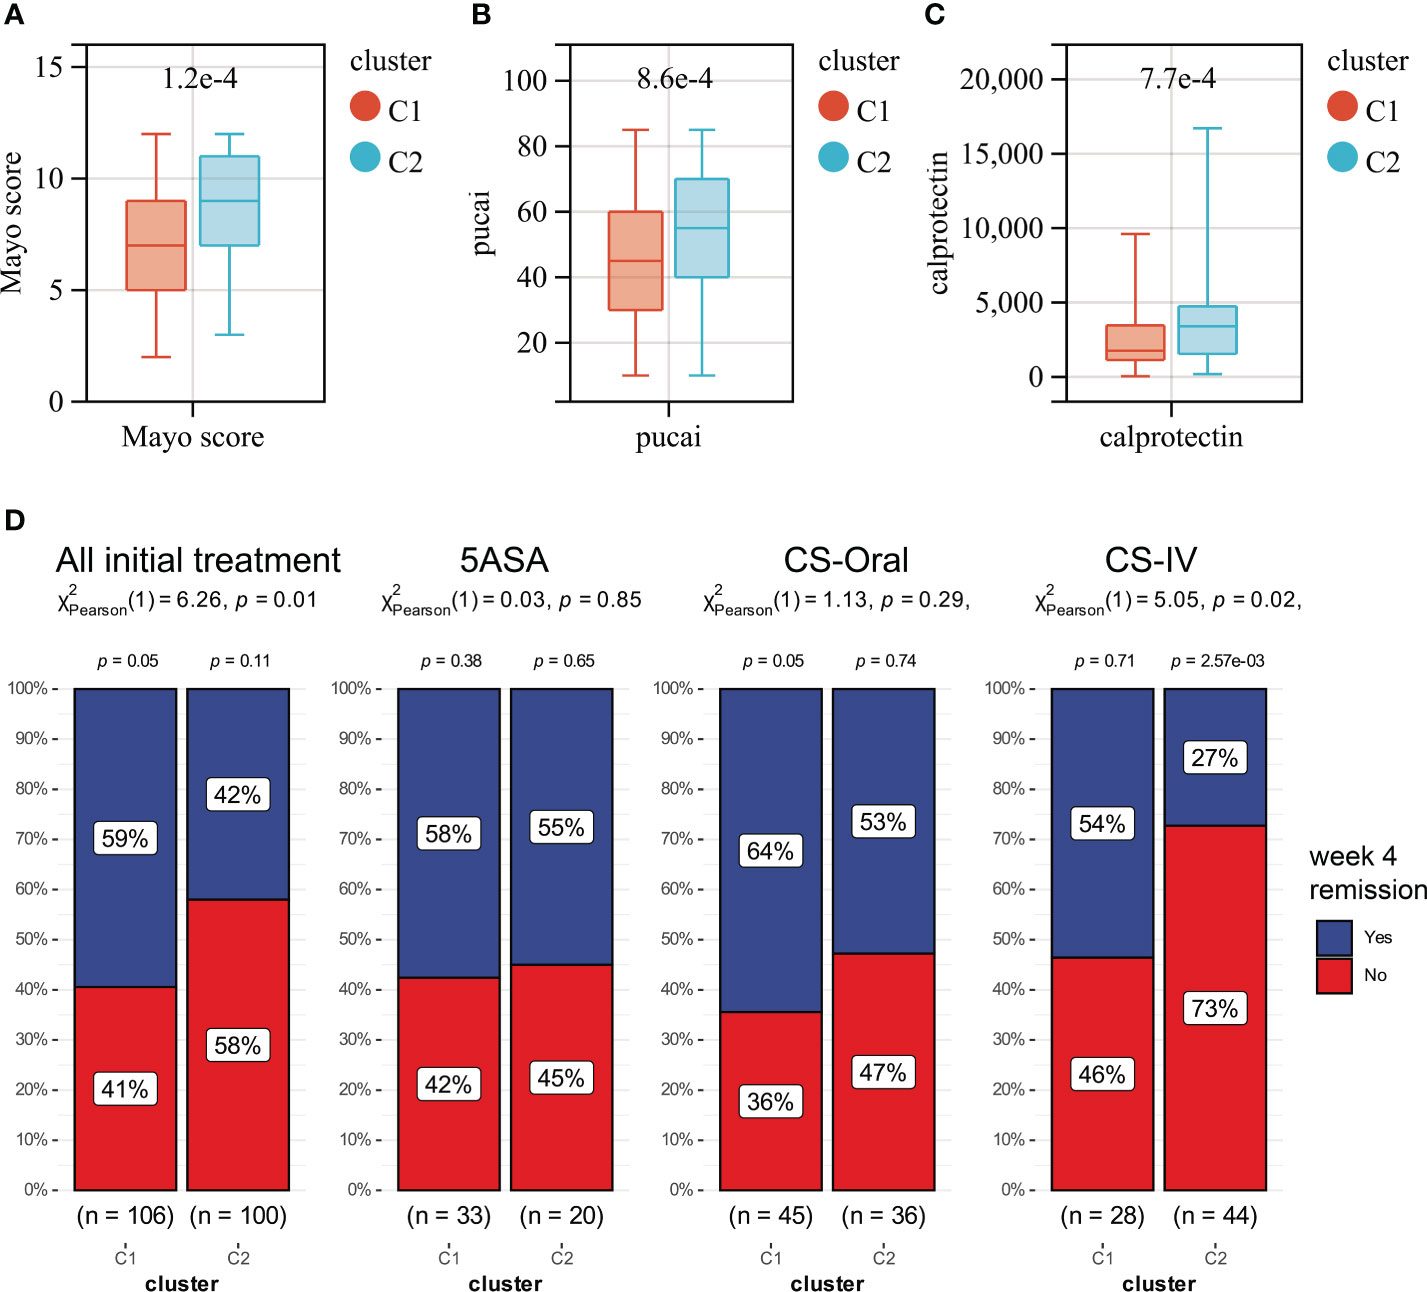
Figure 5 Boxplots showing the levels of Mayo score (A), Pucai score (B) and fecal calprotectin (C) in cluster C1 (red) and cluster C2 (blue). (D) The distribution of patients who responded or did not respond to different treatments in Clusters C1 and C2.
Further GSEA analysis was perform to investigate the reason for the difference of disease severity and treatment outcomes between cluster C1 and cluster C2. Several energy metabolism-associated signaling pathways were significantly up-regulated in cluster C1, including the oxidative phosphorylation, ascorbate and aldarate metabolism, Parkinson’s disease, pentose and glucuronate interconversions and citrate cycle TCA cycle pathways (Supplementary Figure 9A). The cluster C2 was enriched in ECM receptor interaction, neuroactive ligand receptor interaction, cell adhesion molecules cams, hedgehog signaling pathway and basal cell carcinoma pathway (Supplementary Figure 9B). Furthermore, 15 of the 24 measured immune cell infiltration was significantly different between cluster C1 and cluster C2 (Supplementary Figure 9C; Supplementary Table 5). The most prominent difference is the higher number of infiltrating CD 4+ T cells in cluster C2.
Discovery of potential drugs by computational methods
In our study, we input the top 1000 DEGs (500 up-regulated and 500 down-regulated genes) between high- and low-Mayo score group into the “XSum” algorithm to perform cMap analysis. Then, cMap analysis revealed that Exisulind has the minimum XSum scores (Supplementary Table 6). Chemical structure formulae of Exisulind was shown in Table 1. Therefore, Exisulind was identified as the potential small molecular compounds to reverse the high Mayo score. In other words, Exisulind had the potential to attenuate the severity of UC and delay the disease progression. To further predict whether Exisulind could be a direct inhibitor for HMGSs, molecular docking was we performed based on the Schrodinger software. Exisulind showed best binding affinities for GPR4, ST3GAL2 and LILRB1 with the docking glide scores of –7.400 kcal/mol, –7.191 kcal/mol and –6.721 kcal/mol, respectively (Figures 6A–C). In the present study, we employed RT-qPCR to validate the gene expression levels of GPR4, ST3GAL2, and LILRB1 in the inflamed intestine of UC patients. Consistent with our previous findings, upregulation of GPR4, ST3GAL2, and LILRB1 was observed in the inflamed intestine of UC patients (n=4) compared to normal intestinal tissue (n=4), laying the foundation for considering them as potential therapeutic targets for UC (Supplementary Figure 10). Therefore, partial validation of Exisulind’s potential for anti-UC activity was established by its favorable molecular docking poses with the above-mentioned three genes. The docking glide scores between Exisulind and CHST15, CYYR1, ITGA5, SLFN11, GPR137B and BGN protein were -4.582 kcal/mol, -4.496 kcal/mol, -5.484 kcal/mol, -4.571 kcal/mol, -4.784 kcal/mol and -3.740 kcal/mol, respectively. In summary, Exisulind was a potential therapeutic agent for the treatment of UC.
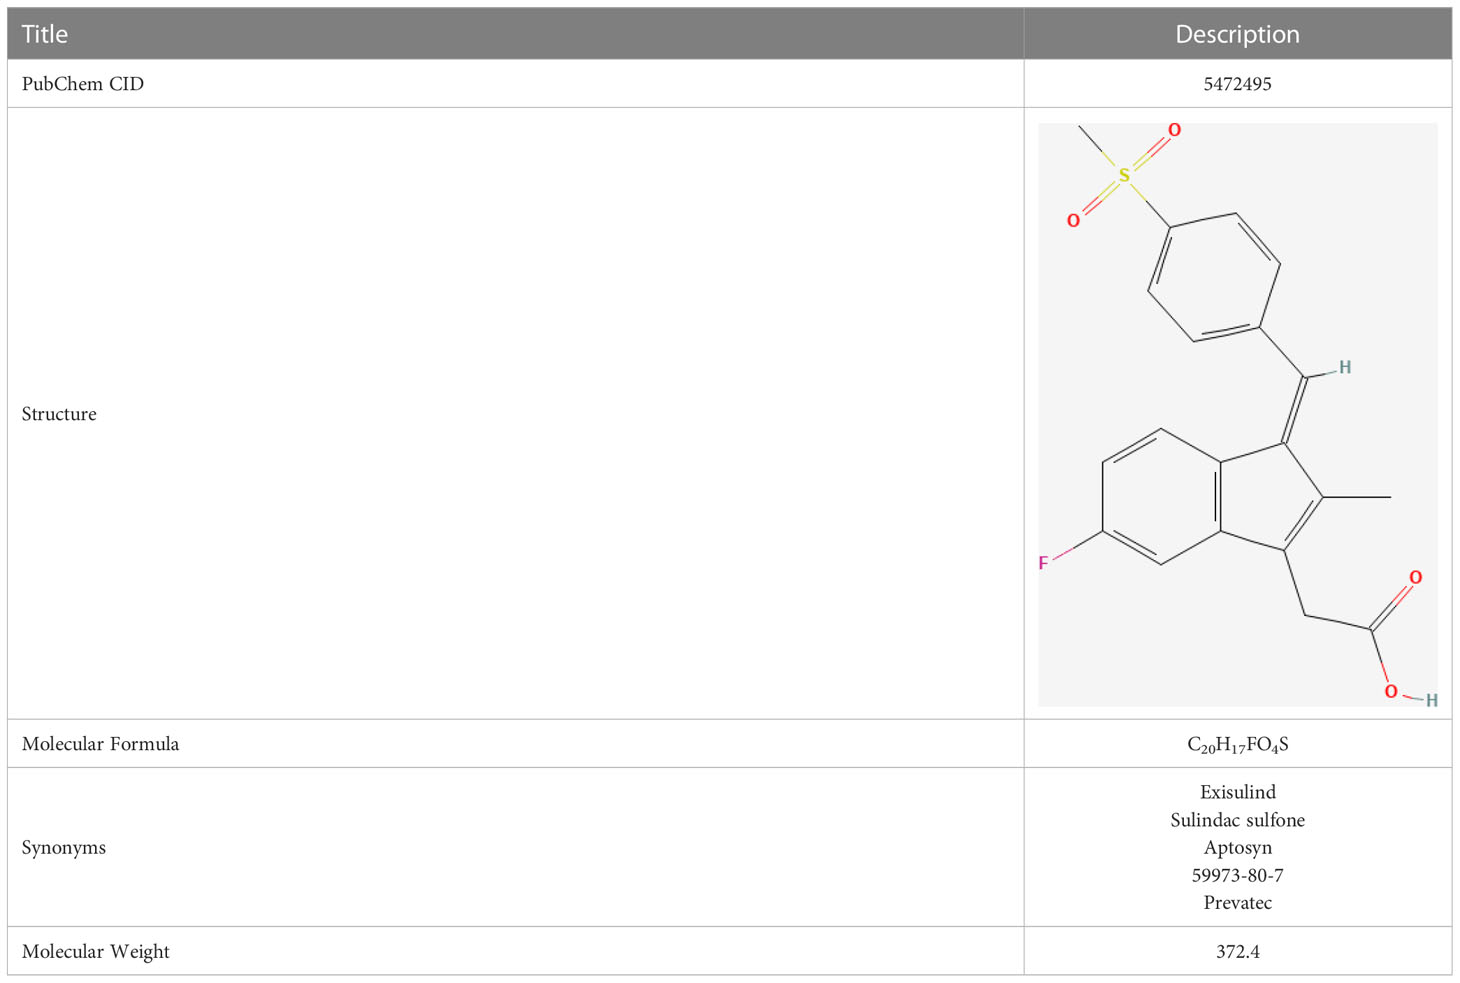
Table 1 Chemical structure formulae of Exisulind.
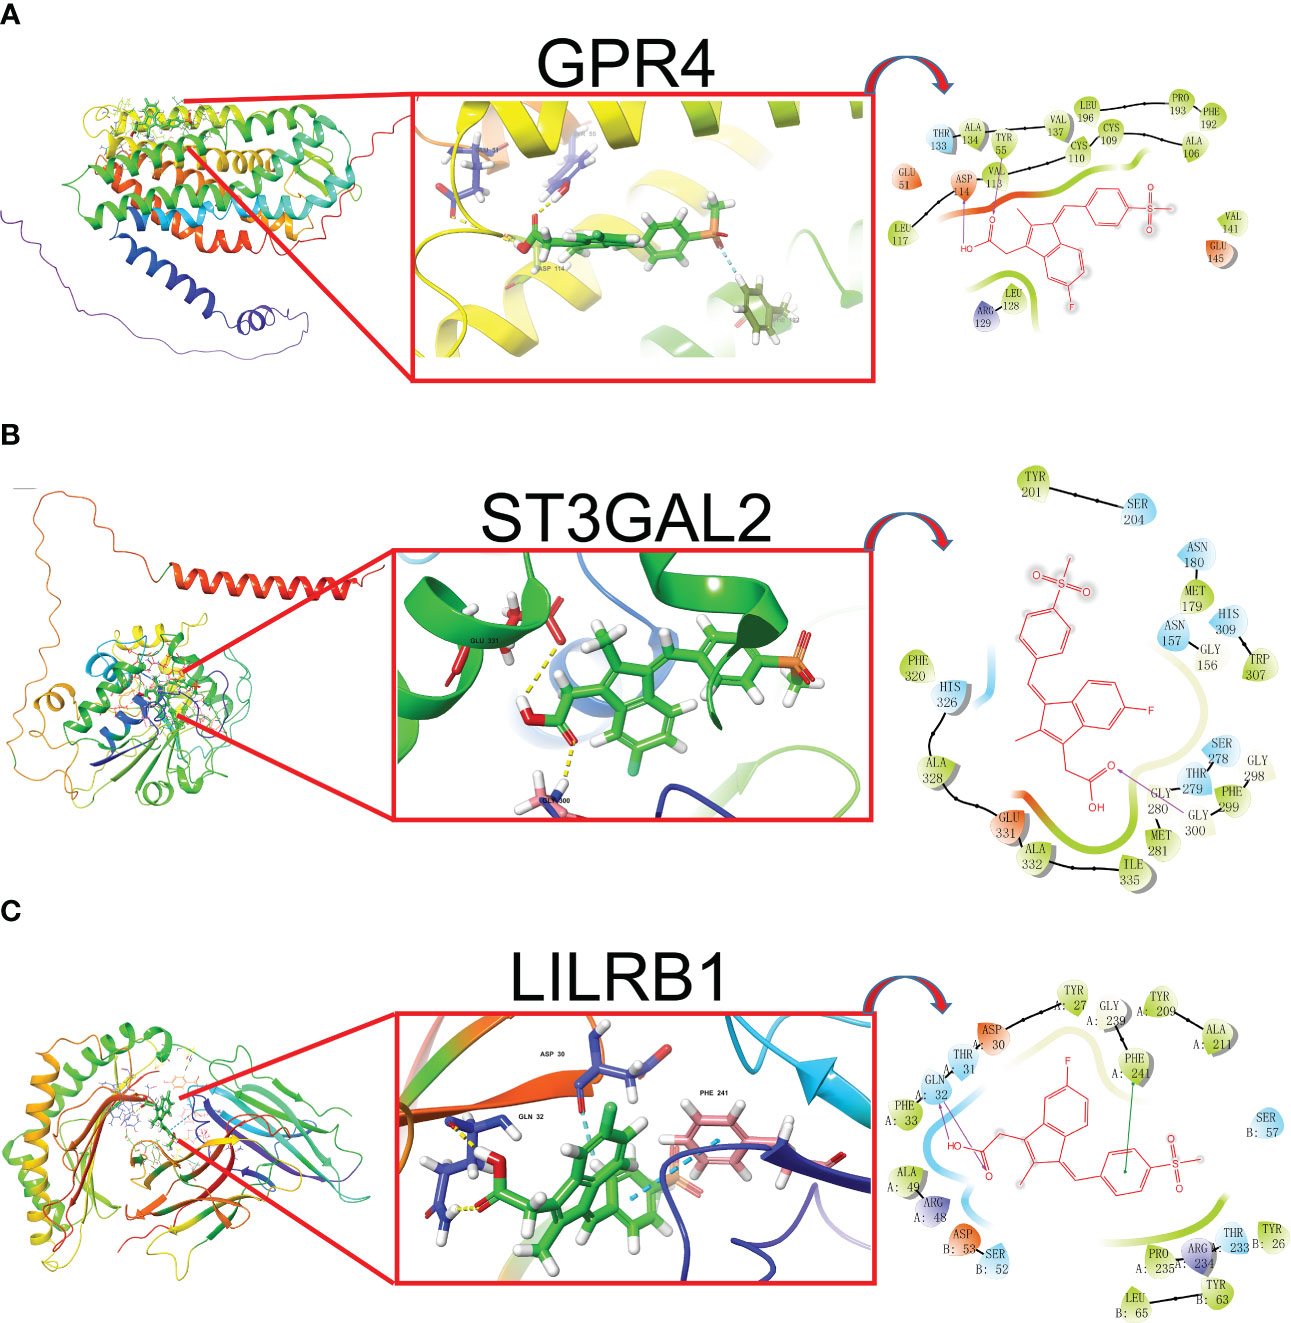
Figure 6 The best docked position of Exisulind inside GPR4 (A), ST3GAL2 (B) and LILRB1 protein (C).
Exploration of environmental toxin exposures with potential to impact the severity of UC
We explored all potential Environmental Toxin Exposures that may impact the expression levels of HMGSs by leveraging the CTD database. Subsequently, we have acquired a total of 110 different types of Environmental Toxin Exposures that could affect the expression level or methylation state of HMGSs, showing in Table 2. Thus, these Environmental Toxin Exposures have the potential to modulate the severity of UC, an effect that is mediated by the intermediary factors HMGSs. Hence, avoiding exposure to these toxins might facilitate an improvement in therapeutic responsiveness among UC patients.

Table 2 The interaction between environmental toxin exposure and HMGSs
Moreover, we investigated the relationship between certain drugs and HMGSs through the CTD database (Table 3). Therefore, the administration of these drugs may exacerbate or alleviate the severity of UC. Further studies may be warranted to elucidate the underlying mechanisms to optimize drug choice and dosages, ultimately promoting better outcomes in UC management.

Table 3 The interaction between drug exposure and HMGSs
Discussion
As yet, the genetic abnormalities involved in the exacerbation of UC have not been adequately explored. The identification of these genetic abnormalities may have great clinical implications in targeting UC treatment and hold the promise for achieving clinical disease remission of UC.
Based on multiple bioinformatic methods, we identified 9 gene signatures (HMGSs) and one potential therapeutic small-molecule drug (Exisulind) of the exacerbation of UC. Verification in multiple datasets suggested that the 9 HMGSs exhibit good diagnostic capacity in predicting the severity of UC. Furthermore, the 9 HMGSs were also good biomakers of UC. Thus, our research here provided a resource for future studies and highlighted 9 potential therapeutic targets. In addition, we generated a novel genotyping scheme based on the 9 HMGSs and then found that UC patients in cluster C1 were susceptible to benefit from CS-IV treatment. A further GSEA enrichment analysis indicated that cluster C1 was indeed enriched in several energy metabolism-associated signaling pathways, including the oxidative phosphorylation, pentose and glucuronate interconversions and citrate cycle TCA cycle pathways. Corticosteroids plays an important role in regulating both energy metabolism and glucose homeostasis (35). The unique energy metabolism pattern of cluster C1 was most likely responsible for the sensitivity to corticosteroids therapy. Numerous studies have shown evidence supporting that cellular energy metabolism pathways are altered during the differentiation and activation of immune cells (36). In addition, metabolic products and intermediates also regulate the cellular function of several immune cells (37). Our study yielded similar result that cluster C1 had a remarkably distinct immune cell infiltration characterization compared to cluster C2. The cluster C2 had a significant higher level of CD4+ T cells. CD4+ T cells have been reported as a major initiators in the disease process of UC (38). Blockade and depletion of CD4+ T cells are an effective means of treatments for IBD (39). Therefore, a higher degree of CD4+ T cells in cluster C2 may contributed to the higher disease severity. Overall, our study provided a convenient and valuable tool to predict severity of UC and screen UC patients suitable for CS-IV treatment. Intravenous administration of corticosteroids can achieve therapeutic effects with reduced oral administration dosages, and can alleviate adverse reactions associated with oral corticosteroids such as gastrointestinal discomfort. Additionally, it is worth noting that most UC patients that receive corticosteroid therapy via the intravenous route have a higher degree of disease severity. It is worth noting that a majority of UC patients who receive corticosteroid administration via the intravenous route have a higher degree of disease severity. Thus, our molecular typing scheme may be specific only to the severe UC patient population in predicting therapeutic responsiveness.
Exisulind, or what is also termed “Sulindac sulfone”, is a metabolite of sulindac and is also a non-steroidal anti-inflammatory drug (NSAID). NSAIDs have generally been were considered to be related to an increased risk of mucosal ulceration. But a high-quality meta-analyze showed that NSAIDs did not elicit exacerbations and serious complications of the IBD (40). By the way, the anti-tumor application of Exisulind has already been explored in Phase I or Phase II clinical trials, suggesting that Exisulind is well tolerated with relatively few adverse effects (41–44). Although Exisulind has only weak anti-inflammatory effect, extensive experimental data have proved that Exisulind have a therapeutic potential to prevent and cure many diseases of the colon. The mTORC1 pathway has been reported to modulate the regulation and differentiation of immune cells, and then ameliorate colitis (45). It is worthy to mention that Exisulin has been shown to inhibit the mTORC1 pathway by directly targeting voltage-dependent anion channel 1 and 2 (46). Regulation of the mTORC1 pathway may be one of the underlying mechanisms responsible for the therapeutic effectiveness of Exisulind.
Additionally, our molecular docking results suggested that GPR4 is the protein with the highest docking score with Exisulind. Thus, GPR4 protein might be another potential targets of Exisulind in UC. As a pro-inflammatory G protein-coupled receptor (GPCR), GPR4 showed a higher expression level in vascular endothelial cells (47–49). GPR4 has a significant role in regulating endothelium-blood cell interaction and leukocyte infiltration. In addition, GPR4 exhibits capability to regulate vascular permeability and tissue edema under inflammatory conditions (50–52). Numerous experimental animal studies revealed that GPR4 is involved in the development and progression of UC. GPR4 played a protective pole in dextran sulfate sodium-induced acute colitis mouse model (53–55). Therefore, the inhibition of GPR4 could be a underlying mechanism responsible for the therapeutic effects of Exisulind on UC.
We present a comprehensive review aimed at investigating the effect of environmental toxins exposure on HMGSs expression levels - a phenomenon that may play a potential role in influencing the severity of UC. It is noteworthy to mention that this effect is not limited solely to environmental toxins as some drug exposure may trigger similar effects. Our objective is to shed light on the crucial interplay between external factors and HMGSs, and its clinical implications in the context of UC pathogenesis. Our research provides novel insights and resources that can facilitate a more comprehensive examination of the complex relationship between UC progression and environmental toxin exposure. Consequently, these findings can potentially inform novel perspectives for guiding clinical treatment strategies for UC patients, thereby improving the standard of care for this condition.
This study provided new ideas and materials for the personalized clinical treatment plans for patients with UC, although some limitations to the present study need to be considered. First of all, this research only included a bioinformatics analysis, lacking further experimental verification as a solid foundation. Secondly, one of the imitations of our study is that this research is a retrospective study rather than a prospectively trial. Our identification of potential therapeutic agents for UC was based on computational methods, thus necessitating further in vitro and in vivo experimental validation and exploration of underlying mechanisms. Therefore, future follow-up studies with prospective clinical trials and mechanistic exploration are required for corroboration of our findings.
Conclusion
In summary, we explored the genetic abnormalities involved in the exacerbation of UC based on microarray technology. By combining WGCNA and random forest algorithm, we identified 9 gene signatures (HMGSs) of the exacerbation of UC. Then a novel genotyping scheme was generated based on the 9 HMGSs, dividing patients into two subtypes (cluster C1 and cluster C2). Patients in cluster C1 were susceptible to benefit from CS-IV treatment. Subsequently, we identified a small molecule drug (Exisulind) with potential therapeutic effects for UC. We also provided a comprehensive review of the environmental toxins and drug exposures that potentially impact the progression of UC. Thus, our research contributed to the development of personalized clinical management and treatment regimens for UC.
Data availability statement
Publicly available datasets were analyzed in this study. This data can be found in Gene Expression Omnibus (GEO) database (https://www.ncbi.nlm.nih.gov/geo/). The accession numbers can be found in the article/Supplementary Material.
Ethics statement
The studies involving human subjects were evaluated and authorized by the Ethics Committees of the Jiangsu Province Hospital. Participants in the study provided written, informed consent to participate in this study. Consent was obtained in writing from individuals for the use of any potentially discernible data or images in this article.
Author contributions
Conceptualization, YW; Formal analysis, YW and R-HZ; Methodology, HZ and YW; Project administration, Z-NF; Supervision, H-YW; Writing - original draft, YW; Writing - review and editing, Z-NF and HW; Sample collection and PCR, X-HJ. All authors have contributed to this article and have approved the final version submitted.
Funding
This research was funded by the Nanjing Municipal Science and Technology Plan Project (202205052), the GSKY20220109 Scientific Research Project of Gu Su College, Nanjing Medical University, the Nanjing Municipal Science and Technology Plan Project (202110014), the Social Development Program of Jiangsu Provincial Department of Science and Technology (BE2022704), and the National Natural Science Foundation of China (82000621).
Acknowledgments
We thank particularly Dr. Sonia Zebaze Dongmo (E-mail:emViYXplZG9uZ21vc29uaWFAMTYzLmNvbQ==) for carefully reading the manuscript and editing the language.
Conflict of interest
The authors declare that the research was conducted in the absence of any commercial or financial relationships that could be construed as a potential conflict of interest.
Publisher’s note
All claims expressed in this article are solely those of the authors and do not necessarily represent those of their affiliated organizations, or those of the publisher, the editors and the reviewers. Any product that may be evaluated in this article, or claim that may be made by its manufacturer, is not guaranteed or endorsed by the publisher.
Supplementary material
The Supplementary Material for this article can be found online at: https://www.frontiersin.org/articles/10.3389/fimmu.2023.1162458/full#supplementary-material
Supplementary Figure 1 | Flowchart illustrating the workflow of this study.
Supplementary Figure 2 | Flow chart of the WGCNA analysis pipeline.
Supplementary Figure 3 | Determination of soft-threshold power in the WGCNA in GSE109142 cohort. (A) Analysis of the scale-free index for various soft-threshold powers (β). (B) Analysis of the mean connectivity for various soft-threshold powers. (C) Clustering dendrogram of UC patients in the GSE109142 cohort. Identification of modules closely associated with Mayo score. (D) Dendrogram of all differentially expressed genes clustered based on the measurement of dissimilarity (1-TOM). The color band shows the results obtained from the automatic single-block analysis. (E) Number of genes in each module.
Supplementary Figure 4 | Determination of soft-threshold power in the WGCNA in GSE92415 cohort. (A) Analysis of the scale-free index for various soft-threshold powers (β). (B) Analysis of the mean connectivity for various soft-threshold powers. (C) Clustering dendrogram of UC patients in the GSE92415 cohort. Identification of modules closely associated with Mayo score. (D) Dendrogram of all differentially expressed genes clustered based on the measurement of dissimilarity (1-TOM). The color band shows the results obtained from the automatic single-block analysis. (E) Number of genes in each module.
Supplementary Figure 5 | PCA,UMAP and tSNE cluster representation of the 9 HMGSs expression patterns. ROC curve of first principal component, second principal component and the sum of first and second principal component for differentiating UC from normal samples.
Supplementary Figure 6 | (A) Correlations between Mayo score and HMGSs assessed by Spearman correlation in GSE92415 cohort. (B) Based on upper and lower quartiles of the set of Mayo scores in GSE92415 cohort, UC patients were stratified to high- (red), moderate- (blue), and low- (green) Mayo score groups. Boxplots showing the expression levels of the 9 HMGSs across different Mayo score group. (C) Boxplots showing the expression levels of HMGSs in UC intestinal samples (red) and normal intestinal samples (blue).
Supplementary Figure 7 | ROC curve illustrating the potential of HMGSs to differentiate between UC patients with high- and low- Mayo scores in GSE92415 cohort.
Supplementary Figure 8 | Independent dataset (GSE73661) verification results. (A) Boxplots showing the expression levels of the HMGSs in the UC patient groups with different Mayo endoscopic scores. (B) Boxplots showing the expression levels of HMGSs in UC intestinal samples (red) and normal intestinal samples (blue). (C) ROC curve illustrating the potential of HMGSs to differentiate between UC patients with high- and low- Mayo endoscopic scores in GSE73661 cohort.
Supplementary Figure 9 | GSEA enrichment analysis results in GSE109142 cohort. The top five most enriched KEGG pathways in cluster C1 (A) and Cluster C2 (B) were shown. (C) Box-plot highlighting the differences in immune cell infiltration between the cluster C1 (red) and Cluster C2 (blue).
Supplementary Figure 10 | Experimental verification of gene expression levels of GPR4, ST3GAL2, and LILRB1 using qRT-PCR.
Supplementary Table 5 | The immune cell infiltration of each UC patient of GSE109142 cohort evaluated by ImmuCellAI database.
References
1. Ordás I, Eckmann L, Talamini M, Baumgart DC, Sandborn WJ. Ulcerative colitis. Lancet (2012) 380:1606–19. doi: 10.1016/S0140-6736(12)60150-0
2. Lu PD, Zhao YH. Targeting NF-κB pathway for treating ulcerative colitis: comprehensive regulatory characteristics of Chinese medicines. Chin Med (2020) 15:15. doi: 10.1186/s13020-020-0296-z
3. Zeng B, Shi S, Ashworth G, Dong C, Liu J, Xing F. ILC3 function as a double-edged sword in inflammatory bowel diseases. Cell Death Dis (2019) 10:315. doi: 10.1038/s41419-019-1540-2
4. Gogokhia L, Buhrke K, Bell R, Hoffman B, Brown DG, Hanke-Gogokhia C, et al. Expansion of bacteriophages is linked to aggravated intestinal inflammation and colitis. Cell Host Microbe (2019) 25:285–299.e8. doi: 10.1016/j.chom.2019.01.008
5. Yang L, Wu G, Wu Q, Peng L, Yuan L. METTL3 overexpression aggravates LPS-induced cellular inflammation in mouse intestinal epithelial cells and DSS-induced IBD in mice. Cell Death Discovery (2022) 8:62. doi: 10.1038/s41420-022-00849-1
6. Shi YJ, Hu SJ, Zhao QQ, Liu XS, Liu C, Wang H. Toll-like receptor 4 (TLR4) deficiency aggravates dextran sulfate sodium (DSS)-induced intestinal injury by down-regulating IL6, CCL2 and CSF3. Ann Transl Med (2019) 7:713. doi: 10.21037/atm.2019.12.28
7. Wang Y, Wang Z, Sun J, Qian Y. Identification of HCC subtypes with different prognosis and metabolic patterns based on mitophagy. Front Cell Dev Biol (2021) 9:799507. doi: 10.3389/fcell.2021.799507
8. Wang Y, Sun J, Yang Y, Zebaze Dongmo S, Qian Y, Wang Z. Identification and development of subtypes with poor prognosis in gastric cancer based on both hypoxia and immune cell infiltration. Int J Gen Med (2021) 14:9379–99. doi: 10.2147/IJGM.S326647
9. Chen H, Zhang J, Sun X, Wang Y, Qian Y. Mitophagy-mediated molecular subtypes depict the hallmarks of the tumour metabolism and guide precision chemotherapy in pancreatic adenocarcinoma. Front Cell Dev Biol (2022) 10:901207. doi: 10.3389/fcell.2022.901207
10. Guerrero-Alba R, Valdez-Morales EE, Jimenez-Vargas NN, Lopez-Lopez C, Jaramillo-Polanco J, Okamoto T, et al. Stress activates pronociceptive endogenous opioid signalling in DRG neurons during chronic colitis. Gut (2017) 66:2121–31. doi: 10.1136/gutjnl-2016-311456
11. Gottlieb K, Requa J, Karnes W, Chandra Gudivada R, Shen J, Rael E, et al. Central reading of ulcerative colitis clinical trial videos using neural networks. Gastroenterology (2021) 160:710–719.e2. doi: 10.1053/j.gastro.2020.10.024
12. Mohammed Vashist N, Samaan M, Mosli MH, Parker CE, MacDonald JK, Nelson SA, et al. Endoscopic scoring indices for evaluation of disease activity in ulcerative colitis. Cochrane Database Syst Rev (2018) 1:CD011450. doi: 10.1002/14651858.CD011450.pub2
13. Rutgeerts P, Sandborn WJ, Feagan BG, Reinisch W, Olson A, Johanns J, et al. Infliximab for induction and maintenance therapy for ulcerative colitis. N Engl J Med (2005) 353:2462–76. doi: 10.1056/NEJMoa050516
14. Yang S, Park JS, Hwang SH, Cho KH, Na HS, Choi J, et al. Metformin-inducible small heterodimer partner interacting leucine zipper protein ameliorates intestinal inflammation. Front Immunol (2021) 12:652709. doi: 10.3389/fimmu.2021.652709
15. Colombel JF, Rutgeerts P, Reinisch W, Esser D, Wang Y, Lang Y, et al. Early mucosal healing with infliximab is associated with improved long-term clinical outcomes in ulcerative colitis. Gastroenterology (2011) 141:1194–201. doi: 10.1053/j.gastro.2011.06.054
16. Clough E, Barrett T. The gene expression omnibus database. Methods Mol Biol (2016) 1418:93–110. doi: 10.1007/978-1-4939-3578-9_5
17. Langfelder P, Horvath S. WGCNA: an r package for weighted correlation network analysis. BMC Bioinf (2008) 9:559. doi: 10.1186/1471-2105-9-559
18. Wang F, Wang B, Long J, Wang F, Wu P. Identification of candidate target genes for endometrial cancer, such as ANO1, using weighted gene co-expression network analysis. Exp Ther Med (2019) 17:298–306. doi: 10.3892/etm.2018.6965
19. Wang Z, Li X, Chen H, Han L, Ji X, Wang Q, et al. Decreased HLF expression predicts poor survival in lung adenocarcinoma. Med Sci Monit (2021) 27:e929333. doi: 10.12659/MSM.929333
20. Zhou Y, Zhou B, Pache L, Chang M, Khodabakhshi AH, Tanaseichuk O, et al. Metascape provides a biologist-oriented resource for the analysis of systems-level datasets. Nat Commun (2019) 10:1523. doi: 10.1038/s41467-019-09234-6
21. Subramanian A, Tamayo P, Mootha VK, Mukherjee S, Ebert BL, Gillette MA, et al. Gene set enrichment analysis: a knowledge-based approach for interpreting genome-wide expression profiles. Proc Natl Acad Sci USA (2005) 102:15545–50. doi: 10.1073/pnas.0506580102
22. Kanehisa M, Furumichi M, Tanabe M, Sato Y, Morishima K. KEGG: new perspectives on genomes, pathways, diseases and drugs. Nucleic Acids Res (2017) 45:D353–61. doi: 10.1093/nar/gkw1092
23. Ritchie ME, Phipson B, Wu D, Hu Y, Law CW, Shi W. Smyth, G.K. limma powers differential expression analyses for RNA-sequencing and microarray studies. Nucleic Acids Res (2015) 43:e47. doi: 10.1093/nar/gkv007
24. Alderden J, Pepper GA, Wilson A, Whitney JD, Richardson S, Butcher R, et al. Predicting pressure injury in critical care patients: a machine-learning model. Am J Crit Care (2018) 27:461–8. doi: 10.4037/ajcc2018525
25. Wilkerson MD, Hayes DN. ConsensusClusterPlus: a class discovery tool with confidence assessments and item tracking. Bioinformatics (2010) 26:1572–3. doi: 10.1093/bioinformatics/btq170
26. Miao YR, Zhang Q, Lei Q, Luo M, Xie GY, Wang H, et al. ImmuCellAI: a unique method for comprehensive T-cell subsets abundance prediction and its application in cancer immunotherapy. Advanced Sci (Weinheim Baden-Wurttemberg Germany) (2020) 7:1902880. doi: 10.1002/advs.201902880
27. Cheng J, Yang L, Kumar V, Agarwal P. Systematic evaluation of connectivity map for disease indications. Genome Med (2014) 6:540. doi: 10.1186/s13073-014-0095-1
28. Berman HM, Westbrook J, Feng Z, Gilliland G, Bhat TN, Weissig H, et al. The protein data bank. Nucleic Acids Res (2000) 28:235–42. doi: 10.1093/nar/28.1.235
29. Kim S, Chen J, Cheng T, Gindulyte A, He J, He S, et al. PubChem in 2021: new data content and improved web interfaces. Nucleic Acids Res (2021) 49:D1388–95. doi: 10.1093/nar/gkaa971
30. Bhachoo J, Beuming T. Investigating protein-peptide interactions using the schrödinger computational suite. Methods Mol Biol (2017) 1561:235–54. doi: 10.1007/978-1-4939-6798-8_14
31. Mandrekar JN. Receiver operating characteristic curve in diagnostic test assessment. J Thorac Oncol (2010) 5:1315–6. doi: 10.1097/JTO.0b013e3181ec173d
33. Vermeulen M, Smith K, Eremin K, Rayner G, Walton M. Application of uniform manifold approximation and projection (UMAP) in spectral imaging of artworks. Spectrochim Acta A Mol Biomol Spectrosc (2021) 252:119547. doi: 10.1016/j.saa.2021.119547
34. Cheng Y, Wang X, Xia Y. Supervised t-distributed stochastic neighbor embedding for data visualization and classification. INFORMS J ON COMPUTING (2021) 33:419–835. doi: 10.1287/ijoc.2020.0961
35. Vegiopoulos A, Herzig S. Glucocorticoids, metabolism and metabolic diseases. Mol Cell Endocrinol (2007) 275:43–61. doi: 10.1016/j.mce.2007.05.015
36. Eleftheriadis T, Pissas G, Yiannaki E, Markala D, Arampatzis S, Antoniadi G, et al. Inhibition of indoleamine 2,3-dioxygenase in mixed lymphocyte reaction affects glucose influx and enzymes involved in aerobic glycolysis and glutaminolysis in alloreactive T-cells. Hum Immunol (2013) 74:1501–9. doi: 10.1016/j.humimm.2013.08.268
37. Hosomi K, Kunisawa J. Diversity of energy metabolism in immune responses regulated by micro-organisms and dietary nutrition. Int Immunol (2020) 32:447–54. doi: 10.1093/intimm/dxaa020
38. Imam T, Park S, Kaplan MH, Olson MR. Effector T helper cell subsets in inflammatory bowel diseases. Front Immunol (2018) 9:1212. doi: 10.3389/fimmu.2018.01212
39. Stronkhorst A, Radema S, Yong SL, Bijl H, ten Berge IJ, Tytgat GN, et al. CD4 antibody treatment in patients with active Crohn's disease: a phase 1 dose finding study. Gut (1997) 40:320–7. doi: 10.1136/gut.40.3.320
40. Moninuola OO, Milligan W, Lochhead P, Khalili H. Systematic review with meta-analysis: association between acetaminophen and nonsteroidal anti-inflammatory drugs (NSAIDs) and risk of Crohn's disease and ulcerative colitis exacerbation. Aliment. Pharmacol Ther (2018) 47:1428–39. doi: 10.1111/apt.14606
41. Dawson NA, Halabi S, Ou SS, Biggs DD, Kessinger A, Vogelzang N, et al. A phase II study of estramustine, docetaxel, and exisulind in patients with hormone- refractory prostate cancer: results of cancer and leukemia group b trial 90004. Clin Genitourin Cancer. (2008) 6:110–6. doi: 10.3816/CGC.2008.n.017
42. Attia S, Traynor AM, Kim K, Merchant JJ, Hoang T, Ahuja HG, et al. Phase I/II study of vinorelbine and exisulind as first-line treatment of advanced non-small cell lung cancer in patients at least 70 years old: a wisconsin oncology network study. J Thorac Oncol (2008) 3:1018–25. doi: 10.1097/JTO.0b013e3181834fa1
43. Weiss GJ, Vokes EE, Bunn PA Jr., Magree L, Rusk J, Albert D, et al. Docetaxel and exisulind in previously treated non-small cell lung cancer (NSCLC) patients: a multicenter, phase II clinical trial. J Thorac Oncol (2007) 2:933–8. doi: 10.1097/JTO.0b013e3181462051
44. Sinibaldi VJ, Elza-Brown K, Schmidt J, Eisenberger MA, Rosenbaum E, Denmeade SR, et al. Phase II evaluation of docetaxel plus exisulind in patients with androgen independent prostate carcinoma. Am J Clin Oncol (2006) 29:395–8. doi: 10.1097/01.coc.0000225411.95479.b4
45. Wu X, Dou Y, Yang Y, Bian D, Luo J, Tong B, et al. Arctigenin exerts anti-colitis efficacy through inhibiting the differentiation of Th1 and Th17 cells via an mTORC1-dependent pathway. Biochem Pharmacol (2015) 96:323–36. doi: 10.1016/j.bcp.2015.06.008
46. Aono Y, Horinaka M, Iizumi Y, Watanabe M, Taniguchi T, Yasuda S, et al. Sulindac sulfone inhibits the mTORC1 pathway in colon cancer cells by directly targeting voltage-dependent anion channel 1 and 2. Biochem Biophys Res Commun (2018) 505:1203–10. doi: 10.1016/j.bbrc.2018.10.050
47. Chen A, Dong L, Leffler NR, Asch AS, Witte ON, Yang LV. Activation of GPR4 by acidosis increases endothelial cell adhesion through the cAMP/Epac pathway. PloS One (2011) 6:e27586. doi: 10.1371/journal.pone.0027586
48. Dong L, Li Z, Leffler NR, Asch AS, Chi JT, Yang LV. Acidosis activation of the proton-sensing GPR4 receptor stimulates vascular endothelial cell inflammatory responses revealed by transcriptome analysis. PloS One (2013) 8:e61991. doi: 10.1371/journal.pone.0061991
49. Dong L, Krewson EA, Yang LV. Acidosis activates endoplasmic reticulum stress pathways through GPR4 in human vascular endothelial cells. Int J Mol Sci (2017) 18:278. doi: 10.3390/ijms18020278
50. Yang LV, Oppelt KA, Thomassen MJ, Marie MA, Nik Akhtar S, McCallen JD. Can GPR4 be a potential therapeutic target for COVID-19. Front Med (Lausanne) (2020) 7:626796. doi: 10.3389/fmed.2020.626796
51. Velcicky J, Miltz W, Oberhauser B, Orain D, Vaupel A, Weigand K, et al. Development of selective, orally active GPR4 antagonists with modulatory effects on nociception, inflammation, and angiogenesis. J Med Chem (2017) 60:3672–83. doi: 10.1021/acs.jmedchem.6b01703
52. Krewson EA, Sanderlin EJ, Marie MA, Akhtar SN, Velcicky J, Loetscher P, et al. The proton-sensing GPR4 receptor regulates paracellular gap formation and permeability of vascular endothelial cells. iScience (2020) 23:100848. doi: 10.1016/j.isci.2020.100848
53. Sanderlin EJ, Leffler NR, Lertpiriyapong K, Cai Q, Hong H, Bakthavatchalu V, et al. GPR4 deficiency alleviates intestinal inflammation in a mouse model of acute experimental colitis. Biochim Biophys Acta Mol Basis Dis (2017) 1863:569–84. doi: 10.1016/j.bbadis.2016.12.005
54. Sanderlin EJ, Marie M, Velcicky J, Loetscher P, Yang LV. Pharmacological inhibition of GPR4 remediates intestinal inflammation in a mouse colitis model. Eur J Pharmacol (2019) 852:218–30. doi: 10.1016/j.ejphar.2019.03.038
Keywords: ulcerative colitis, microarray, biomarker, genomics, bioinformatics
Citation: Wang Y, Zhuang H, Jiang X-h, Zou R-h, Wang H-y and Fan Z-n (2023) Unveiling the key genes, environmental toxins, and drug exposures in modulating the severity of ulcerative colitis: a comprehensive analysis. Front. Immunol. 14:1162458. doi: 10.3389/fimmu.2023.1162458
Received: 09 February 2023; Accepted: 19 May 2023;
Published: 19 July 2023.
Edited by:
Dimitris Tsoukalas, Metabolomic Medicine, GreeceReviewed by:
Shumin Qin, The Second Affiliated Hospital of Guangzhou University of Chinese Medicine, ChinaRui Shi, Dongfang Hospital, China
Copyright © 2023 Wang, Zhuang, Jiang, Zou, Wang and Fan. This is an open-access article distributed under the terms of the Creative Commons Attribution License (CC BY). The use, distribution or reproduction in other forums is permitted, provided the original author(s) and the copyright owner(s) are credited and that the original publication in this journal is cited, in accordance with accepted academic practice. No use, distribution or reproduction is permitted which does not comply with these terms.
*Correspondence: Zhi-ning Fan, ZmFuemhpbmluZ25tdUBob3RtYWlsLmNvbQ==; Hai-yang Wang, bmFuamluZ3doeUAxMjYuY29t
†These authors have contributed equally to this work