
95% of researchers rate our articles as excellent or good
Learn more about the work of our research integrity team to safeguard the quality of each article we publish.
Find out more
ORIGINAL RESEARCH article
Front. Immunol. , 27 April 2023
Sec. Nutritional Immunology
Volume 14 - 2023 | https://doi.org/10.3389/fimmu.2023.1162175
 Chunchun Yuan1,2,3†
 Jing Wang3,4,5†
 Weiqiang Zhang3,6†
 Honggang Yi7†
 Bing Shu1,2,3,5†Chenguang Li1,2,3,5
 Qianqian Liang1,2,3,5De Liang8Bolai Chen9,10Xingwen Xie11,12
 Xinchao Lin13
 Xu Wei14
 Hui Wang15
 Peizhan Chen16
 Chen Huang1,2,3
 Hao Xu1,2,3
 Yueli Sun1,2,3
 Yongjian Zhao1,2,3Qi Shi1,2,3,5
 Dezhi Tang1,2,3,5*Yongjun Wang1,2,3,5*
Background: Obesity is often accompanied by lower 25(OH)D levels, whereas these two parameters exhibit opposite effects on bone health. It is uncertain what are the effects of lower 25(OH)D levels in obesity on bone health in elderly Chinese people.
Methods: A nationally representative cross-sectional analysis of China Community-based Cohort of Osteoporosis (CCCO) was performed from 2016 to 2021, which consisted of 22,081 participants. Demographic data, disease history, Body mass index (BMI), bone mineral density (BMD), the levels of the biomarkers of vitamin D status and those of bone metabolism markers were measured for all participants (N = 22,081). The genes (rs12785878, rs10741657, rs4588, rs7041, rs2282679 and rs6013897) related to 25(OH)D transportation and metabolism were performed in a selected subgroup (N = 6008).
Results: Obese subjects exhibited lower 25(OH)D levels (p < 0.05) and higher BMD (p < 0.001) compared with those of normal subjects following adjustment. The genotypes and allele frequency of rs12785878, rs10741657, rs6013897, rs2282679, rs4588 and rs7041 indicated no significant differences among three BMI groups following correction by the Bonferroni’s method (p > 0.05). The levels of total 25(OH)D (ToVD) were significantly different among the GC1F, GC1S and GC2 haplotype groups (p < 0.05). Correlation analysis indicated that ToVD levels were significantly correlated with parathyroid hormone levels, BMD, risk of osteoporosis (OP) and the concentration levels of other bone metabolism markers (p < 0.05). Generalized varying coefficient models demonstrated that the increasing BMI, ToVD levels and their interactions were positively associated with BMD outcomes (p < 0.001), whereas the reduced levels of ToVD and BMI increased the risk of OP, which was noted notably for the subjects with reduced ToVD levels (less than 20.69 ng/ml) combined with decreased BMI (less than 24.05 kg/m2).
Conclusion: There was a non-linear interaction of BMI and 25(OH)D. And higher BMI accompanied by decreased 25(OH)D levels is associated with increased BMD and decreased incidence of OP, optimal ranges exist for BMI and 25(OH)D levels. The cutoff value of BMI at approximately 24.05 kg/m2 combined with an approximate value of 25(OH)D at 20.69 ng/ml are beneficial for Chinese elderly subjects.
Osteoporosis occurs mainly in the process of aging in populations over 50 years old and is referred as the decrease of bone mineral density (BMD) or imbalance between bone resorption and formation (1). Worldwide, approximately 200 million subjects have osteoporosis (2), which causes significant financial burden on the corresponding countries and higher health costs for families (3). BMD is detected using dual-energy X-ray absorptiometry (DXA) and is considered an effective index for evaluating bone health (4).
Body mass index (BMI) is usually used to assess bone health, since it can be determined conveniently and is not influenced by affections of other physical or pathological factors (5). Higher BMI was always regarded as a protective factor for increasing BMD (6), due to higher weight which could promote the increase in BMD (7, 8) and maintain myokine levels. The latter positively regulate bone formation and reabsorption (9, 10). However, certain studies have shown that populations with higher BMI suffer more easily from fractures (11). The optimal ranges of BMI may play a role in balancing the relationship between bone protection and bone fracture.
25(OH)D, including 25(OH)D2 and 25(OH)D3, is considered the marker of vitamin D (VD) status (12) and it has been shown that the lower a person’s VD level, the greater the likelihood of poor health, disease occurrence and mortality (13). Concomitantly, several studies have shown statistical correlations between lower 25(OH)D levels and decreasing BMD (14) as well as skeletal disorders including osteopenia, osteoporosis and the risk of fractures (15, 16).
BMI is inversely associated with 25(OH)D levels (17, 18), but it is still uncertain whether reduced 25(OH)D levels in subjects with higher BMI will attenuate bone health. In the present study, the interactive effects of 25(OH)D levels and BMI were evaluated on BMD and osteoporosis. The study aimed at providing the quantitative results in Chinese elderly subjects in order to guide the clinical diagnosis and treatment of bone-related diseases.
The Chinese community-based cohort of osteoporosis (CCCO) is a population-based nationwide, prospective cohort study, which has been ongoing since 2016 and it currently includes 22,081 participants (19). A cross-sectional study was performed in middle-aged and older participants who were living in urban areas from CCCO that were distributed in Shanghai (East China), Beijing (North China), Guangzhou (South China) and Lanzhou (West China). Only participants who had completed genotyping, and those with BMI > 18.5 kg/m2, and had no a history of endocrine and metabolic diseases, and were not taken VD, calcium, estrogen, diphosphonate and glucocorticoid analogues were included in the present study (4,124 participants) (Figure S1 in the Supplementary Materials).
The present study, registered protocol at Clinical trials. gov (NCT02958020), was approved by the institutional review board at Longhua Hospital affiliated to the Shanghai University of Traditional Chinese Medicine (No. 2016LCSY065) and was implemented in accordance with the ethical standards laid down in the 1964 Declaration of Helsinki and its later amendments or comparable ethical standards. All subjects provided written informed consent.
Basic characteristics, disease history, physical measurements and other common information of the participants were collected in the community field work. An interviewer-administrator paper questionnaire was implemented by experienced physicians to facilitate a higher response rate. The International Physical Activity Questionnaire (IPAQ) was used to access the physical activity conditions. The data of the mean annual hours corresponding to sunshine were derived from the Chinese Meteorological Administration (http://cdc.cma.gov.cn/).
Weight and height were measured with the participants wearing no shoes and were used to define BMI. The World Health Organization criteria were used in the present study for the Chinese population and 3 BMI (kg/m2) categories were provided as follows: normal weight (18.5-22.9 kg/m2), overweight (22.9-24.9 kg/m2), and obese (>25.0 kg/m2) (20). The grip strength of both hands was determined with a hand dynamometer and five-times-sit-to-stand test (FTSST) was used to evaluate the physical function. Lumbar and hip BMD were measured with the DXA (Hologic Discovery CI, Bedford, Massachusetts, USA) equipped in a mobile research vehicle.
25(OH)D was measured with a Shimadzu series HPLC (Shimadzu Corporation, Japan) instrument connected to an API 5500 LC-MS/MS system (Applied Biosystems Inc., USA). Bioavailable 25(OH)D (BioVD) levels were calculated following the methods of Powe et al. (2013) (21). The plasma vitamin D binding protein (DBP) concentrations were measured with a highly sensitive two-site enzyme linked immunoassay (ELISA) test kit (GENWAY, BIOTECH INC, USA).
Parathyroid hormone (PTH), albumin (Alb), creatinine (CRE), calcium (Ca), phosphorous (P), alkaline phosphatase (ALP), N-terminal propeptide of type I procollagen (PINP), osteocalcin (OST) and β-Cross Laps of type I collagen levels containing cross linked C-telopeptide (CTX) were detected with a Roche automatic analyzer method (see the detailed methods of Table S1 in the Supplementary Materials). Genotyping methods can be found in the Supplementary Methods and gene locus single nucleotide polymorphisms (SNPs) information is described in Table S2 in the Supplementary Materials.
We used a cross-sectional study design to explore the population-level association between the explanatory covariates and BMD outcomes. The continuous variables were summarized as mean (standard deviation) or median (inter-quartile range) depending on the normativity of the distribution. The categorical variables were listed as numbers and percentages. The box-cox transformation was used to reduce the skewness of the outcomes. The univariate analysis was performed by examining the differences of the BMI or genetic groups using the χ2 test for categorical variables and the one-way ANOVA or Kruskal-Wallis test for continuous variables. Spearman’s rank correlation was used to assess the correlation among serum and BMD measures.
Generalized varying coefficient models (GVCM) with penalized cubic regression splines were employed to characterize the nonlinear relationships of outcomes and explanatory covariates, as well as the interactions of explanatory covariates to account for the complexity. The relationship between each covariate and the outcome is allowed to vary as a potentially nonlinear, smooth function of an effect modifying covariate estimated from the data in the GVCM. A stepwise forward method was used to select the variables in the final model for multivariate analysis. Bayesian 95% confidence intervals (CI) were estimated to present the association of each covariate with the outcome.
All results were calculated and adjusted for the identified potential confounders as fixed effects in the GVCMs, including age (in years, continuous), sex (men or women), educational status, smoking status, drinking status, dietary types, family income levels, seasons, regions, and mean annual hours of sunshine (in hours, continuous). Missing data patterns were visualized and imputed using the R multivariate imputation by the chained equation (MICE) package in R (the number of imputations is set to 5). The GVCM was fitted to each imputed dataset and the results were combined across the 5 datasets using the Rubin’s method, which computes imputation-adjusted variances and effects estimations.
All p values presented were two-sided, with statistical significance determined by a family-wise type I error less than 0.05. The Bonferroni’s method was used for multiple comparisons following multiple imputations. All the analyses were performed with the use of R software (R Foundation for Statistical Computing, version 4.0.5) and Stata 15.0 software (STATA Corp, College Station, TX). Additional details regarding the statistical analysis are provided in the Methods section of the Supplementary Materials.
Obese (1,653 participants), overweight (1,039 participants) and normal (1,432 participants) were similar in terms of sampling seasons, dietary types and drinking habits (Table 1). However, three groups were different with regard to gender, age, BMI, mean annual hours of sunshine, family income, educational degree and smoking (Table 1). The genotyping results indicated that none of the six variants was departed from the Hardy-Weinberg equilibrium (HWE) test.

Table 1 Characteristics of included subjects in normal, overweight and obese groups (N = 4,124).
The comparison among the normal, overweight and obese groups indicated that unadjusted levels of ToVD were gradually decreased statistically (normal, 21.80 ng/ml (IQ:15.60, 27.60 ng/ml); overweight 21.15 ng/ml (IQ:15.10, 26.45 ng/ml); obese, 20.05 ng/ml (IQ:14.40, 24.90 ng/ml), p < 0.001) (Figure 1). The differences between normal and obese groups persisted following multivariable adjustment (p < 0.05) (Table S3 in the Supplementary Materials). The unadjusted median BMD of the hip was statistical greater in the higher BMI groups than that noted in the normal group (obese, 0.85 g/cm3 (IQ:0.77, 0.94 g/cm3) and overweight, 0.82 g/cm3 (IQ:0.74, 0.90 g/cm3) vs. normal, 0.76g/cm3 (IQ:0.68, 0.84 g/cm3), p < 0.001, respectively) (Figure 1). The significant differences of the three groups were applied to the median BMD of lumbar (obese, 0.91 g/cm3 (IQ: 0.81, 1.03 g/cm3) and overweight, 0.88 g/cm3 (IQ: 0.78, 0.98 g/cm3) vs. normal groups, 0.83g/cm3 (IQ: 0.73, 0.92 g/cm3), p < 0.001, respectively) (Figure 1). The same statistical differences in the hip and lumbar BMD persisted following multivariable adjustment (Table S3 in the Supplementary Materials). The results without imputation were also consistent with the fore mentioned data (Table S4 in the Supplementary Materials).
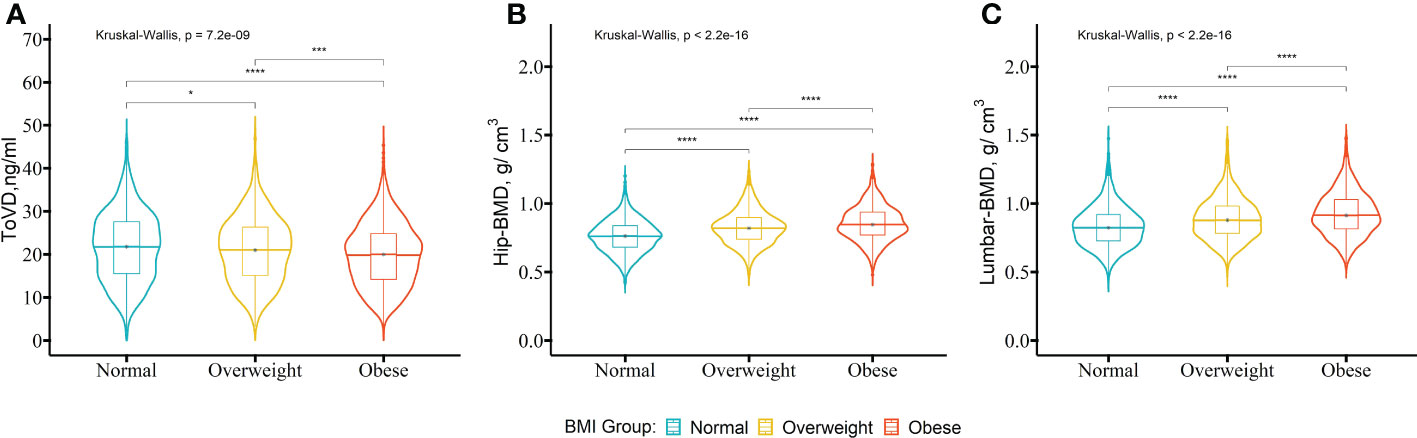
Figure 1 The levels of ToVD, Hip-BMD and Lumbar-BMD of the participants with different BMI groups. A comparison of the distributions of the biochemical parameters between the BMI groups was performed using the Kruskal-Wallis test. The post-hoc test was used in order to examine the differences between the pairs of the BMI groups with the Bonferroni’s method. The participants were divided into three groups based on BMI including the normal group (18.5-22.9 kg/m2), overweight group (22.9-24.9 kg/m2) and obese group (>25.0 kg/m2).The box represents the median and interquartile ranges. BMI, body mass index; ToVD, total 25(OH)D; Hip-BMD, hip bone mineral density; Lumbar-BMD, lumbar bone mineral density. ****p < 0.0001; ***p < 0.001; **p < 0.01; *p < 0.05.
In the unadjusted and adjusted models, PTH was higher statistically in the obese group than that of the normal group (p < 0.001, p < 0.05, respectively) (Table 2). The expression levels of BioVD indicated statistical significance (p = 0.05), whereas no difference was noted between the groups following adjustment. Additional differences were not found following estimation of the proportion of BioVD. Albumin and DBP could associate with the concentration levels of BioVD. The levels of these two parameters did not differ according to the BMI value of each group. The p value was lower statistically in the overweight and obese groups than that noted in the normal group (p < 0.05, p < 0.001, respectively). There was no significant difference when specific parameters including season, region, sex, age, education, salary, smoking, drinking, diet and total annual sunshine hours were added to the model. Ca and CRE did not exhibit significant differences among the three groups investigated (Table 2).
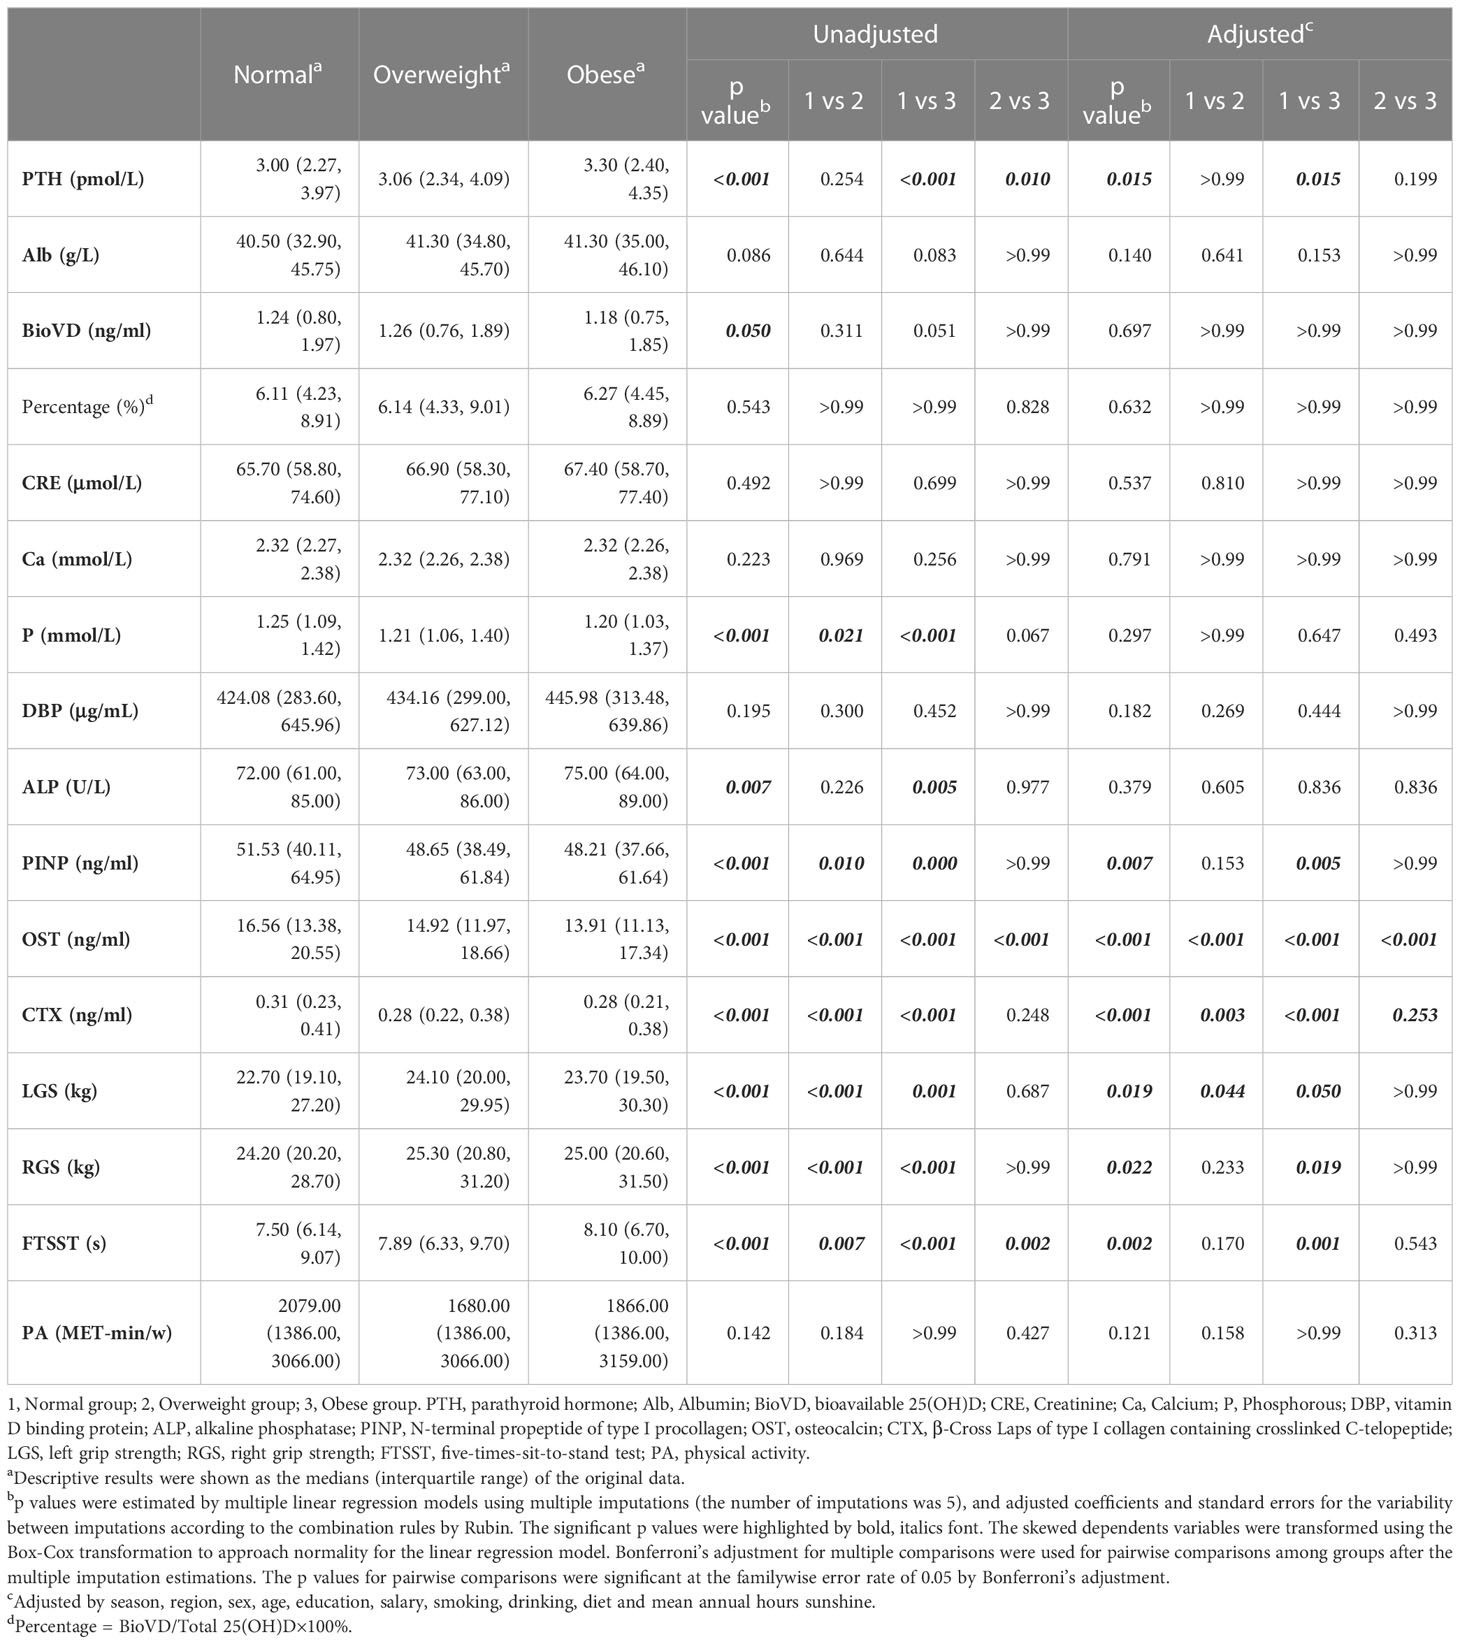
Table 2 Comparision of serum biomarkers and physical measurements among different BMI participants.
The comparison of bone metabolism markers among different groups demonstrated that PINP, CTX and OST indicated reduced levels in obese than those noted in normal subjects (p < 0.05, p < 0.001, p < 0.001, respectively, adjusted model). Although ALP levels were higher in obese subjects compared with those noted in normal subjects (p < 0.05), the results were altered due to adjustment. The grip strength of both hands was different between normal and obese groups following adjustment. FTSST was longer statistically in obese than in normal subjects (p < 0.001, p < 0.001, unadjusted and adjusted model). There is no significant difference among the three BMI groups on the level of PA (Table 2).
The classification of the genes according to BMI and ToVD can be found in Figure S2 (Supplementary Materials), which indicates that haplotypes of the other types were not the same cluster as the Gc2, Gc1F and Gc1S. The genotype frequency and the allele frequency of the rs12785878, rs10741657, rs6013897, rs2282679, rs4588 and rs7041 SNPs showed no significant difference among the three BMI groups (Table S5 in the Supplementary Materials). The frequency of the haplotype types was different significantly among groups (p < 0.05) (Table S5 in the Supplementary Materials) and was sorted by the frequency of Gc2 from the highest to the lowest as follows: Obese, overweight and normal (Figure S3 in the Supplementary Materials). ToVD levels were the lowest in Gc2 homozygous participants, intermediate in Gc1F homozygous participants and highest in Gc1S homozygous participants according to the unadjusted and adjusted models (Table S6 in the Supplementary Materials). BMD levels did not differ significantly by the haplotype group (Table S6 in the Supplementary Materials) and further analysis of osteoporosis indicated failure to support the correlation between gene and disease in the biological model of codominant, dominant and recessive inheritance after Bonferroni’s adjustment (Table 3).
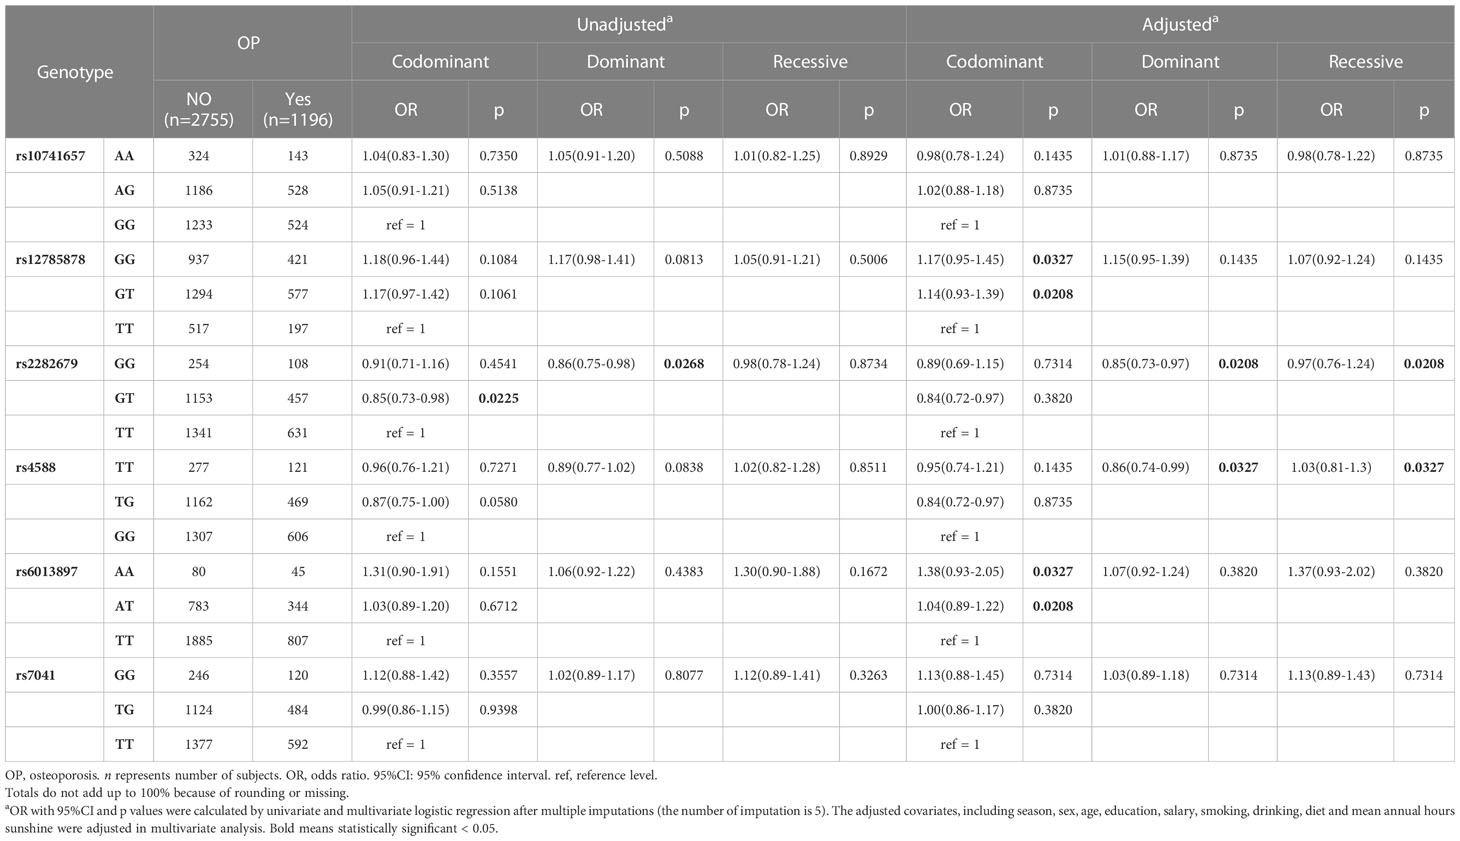
Table 3 Association between single nucleotide polymorphisms and OP after multiple imputation.
ToVD levels were positively correlated with BioVD, DBP and BMD levels and negatively correlated with the levels of the bone formation markers ALP and CTX, whereas BioVD levels did not correlate with the levels of any bone metabolism marker. All the bone metabolism markers demonstrated significant correlations with each other (p < 0.001, respectively). Ca and P showed statistical correlations with bone metabolism markers including OST, PINP and vitamin D status markers (including Alb, DBP and BioVD). It is interesting to note that CRE levels were positively correlated with the levels of the bone formation markers ALP, OST and PINP (p < 0.05, p < 0.001, p < 0.001, respectively), whereas they were not correlated with CTX levels statistically. Hip BMD may exhibit a high correlation with ToVD and PTH levels compared with that noted for lumbar BMD (Figure 2, Tables S7, S8 in the Supplementary Materials).
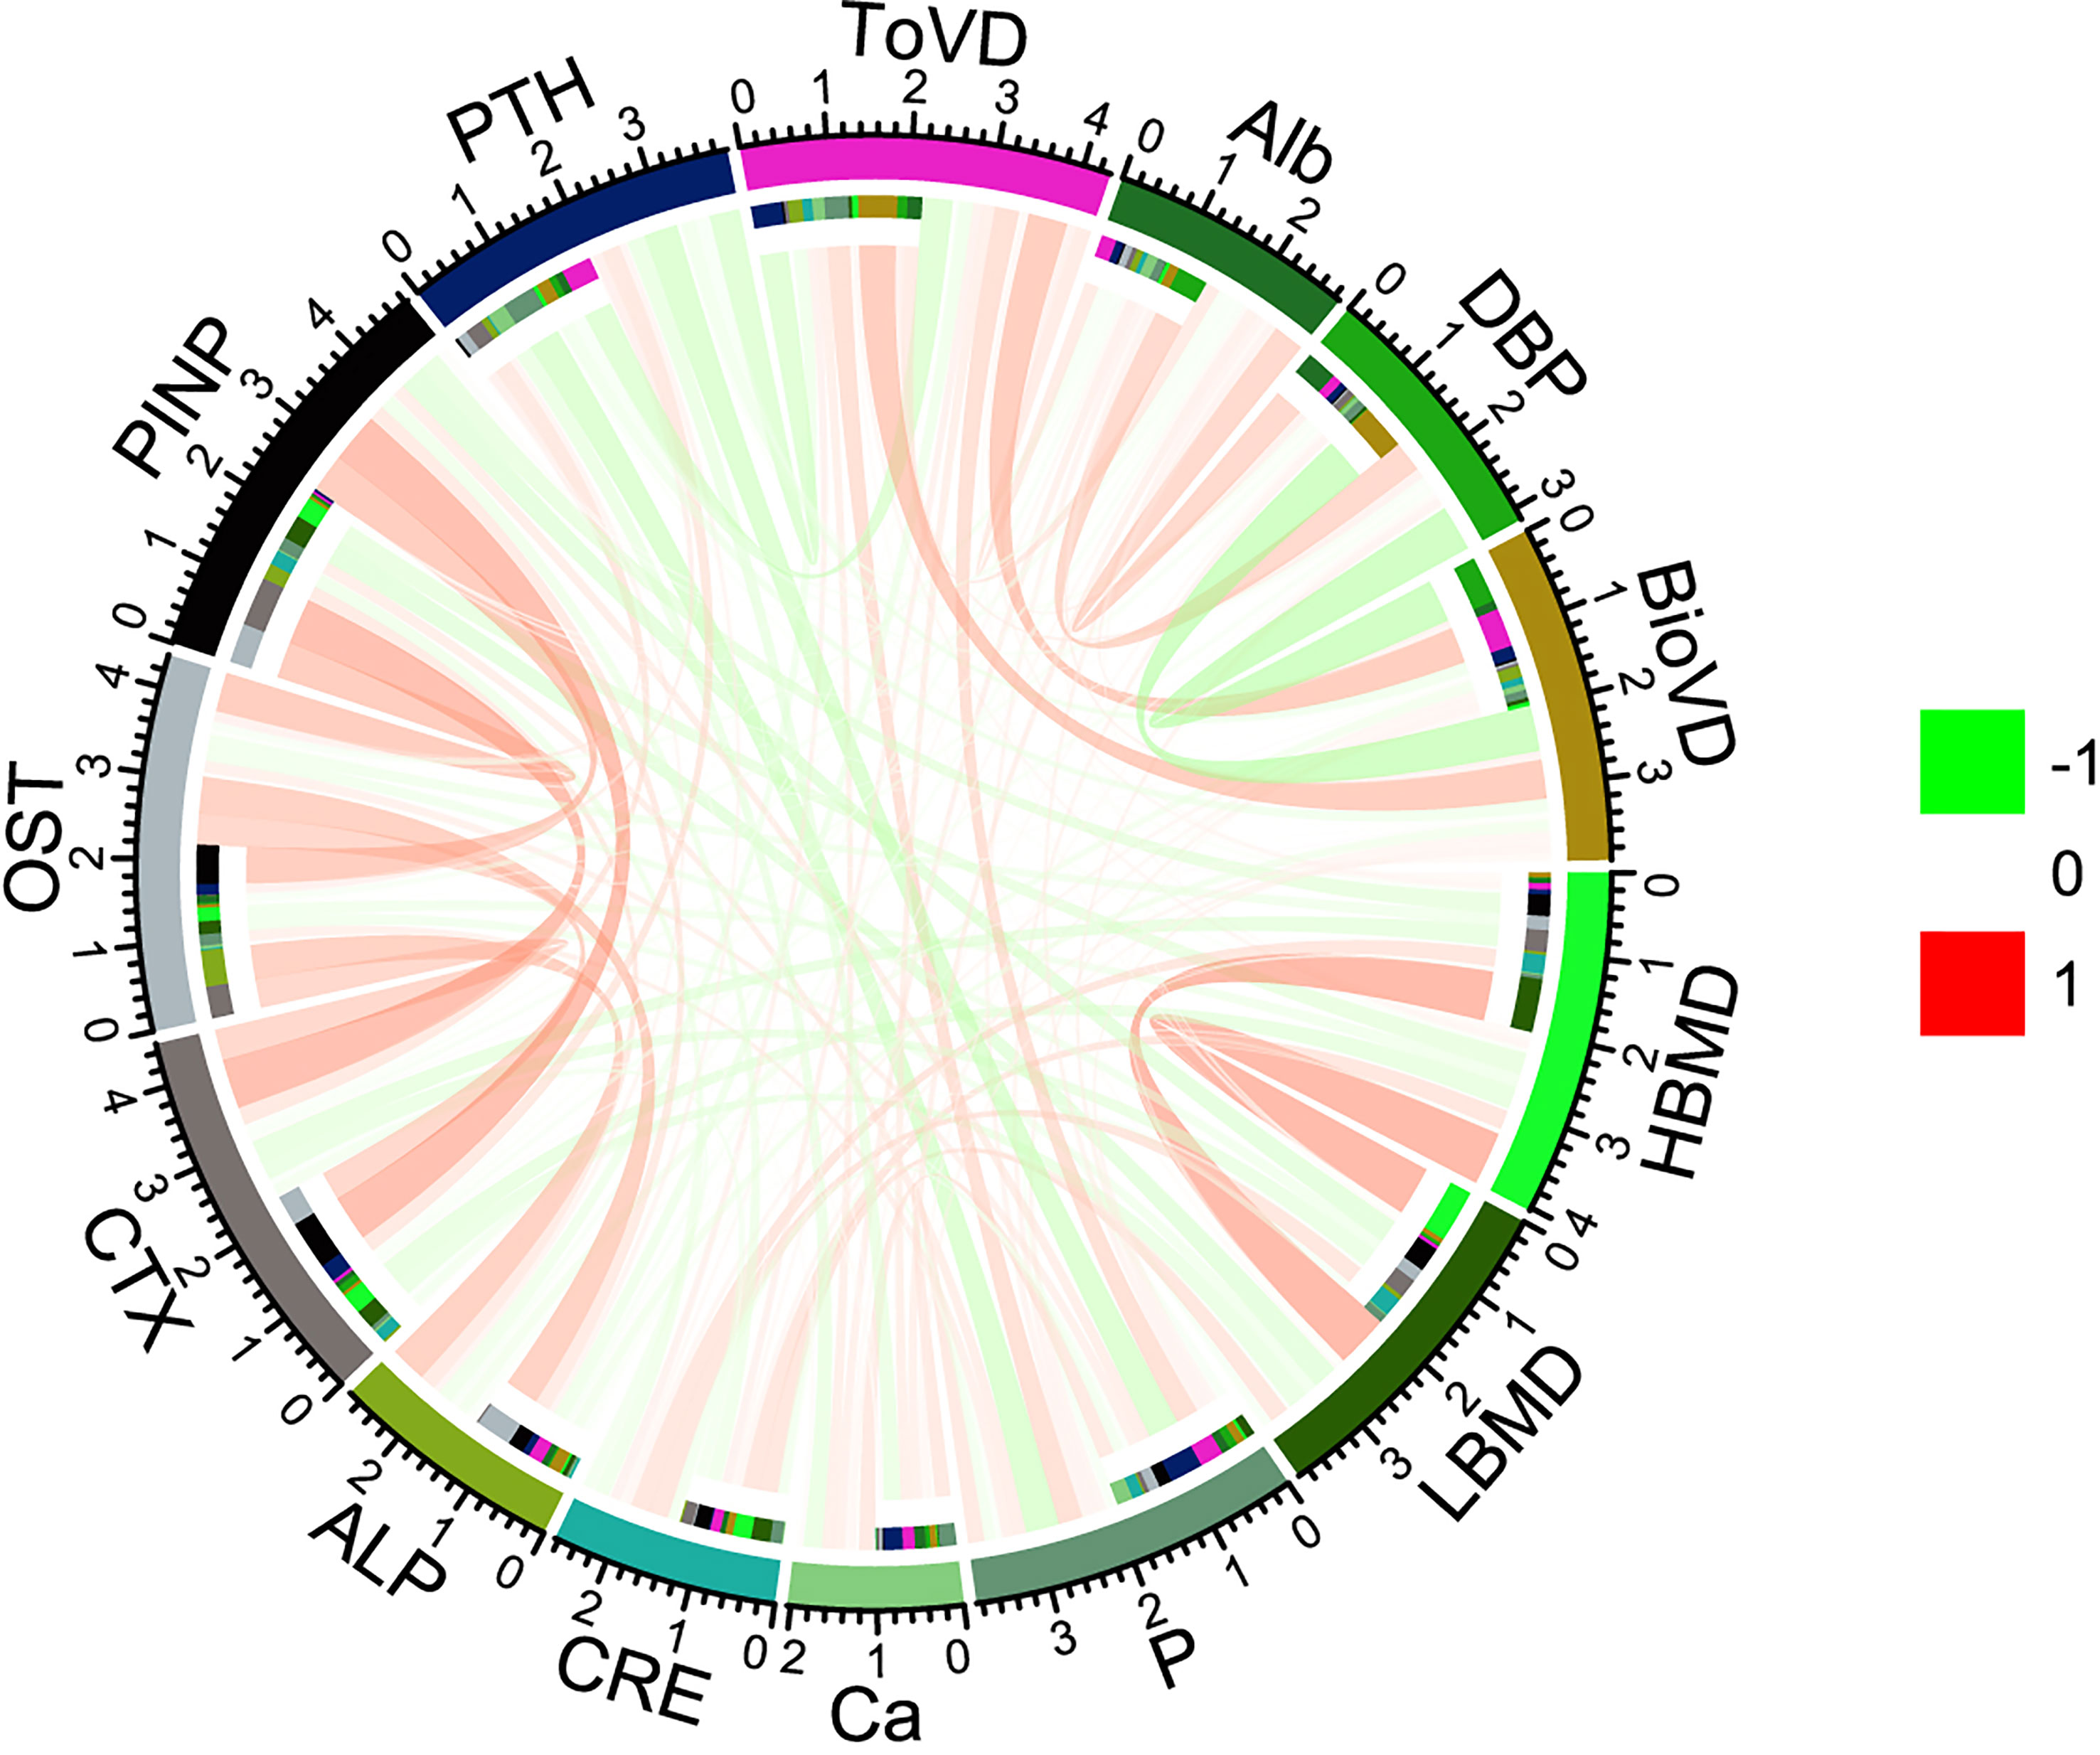
Figure 2 Spearman correlations among serum measures and BMD. The correlation coefficient between each pair of parameters is shown with a specific color and width of the line. Red lines represent positive correlations and green lines negative correlations. HBMD, Hip Bone Mineral Density; LBMD, lumbar bone mineral density; P, Phosphorous; Ca, Calcium; CRE, Creatinine; ALP, alkaline phosphatase; CTX, β-Cross Laps of type I collagen containing crosslinked C-telopeptide; OST, osteocalcin; PINP, N-terminal propeptide of type I procollagen; PTH, parathyroid hormone; ToVD, Total 25(OH)D; Alb, Albumin; DBP, vitamin D binding protein; BioVD, bioavailable 25(OH)D.
ToVD levels exhibited negative correlation with PTH levels (Spearman’s r = -0.384, p < 0.001). In addition, BioVD levels also exhibited negative correlation with PTH levels (Spearman’s r = -0.165, p < 0.05) (Figure 2, Tables S7, S8 in the Supplementary Materials). According to the international guidelines, the vitamin D-sufficient threshold was mainly determined based on PTH and related markers, which were reassessed in the current study and presented in Figure 3 and Figure S4 in the Supplementary Materials. The adjusted generalized additive model exhibited a cutoff value of ToVD = 18.33 ng/ml for PTH, although the change was not apparent. The hip BMD exhibited a steep increase at ToVD < 21.96 ng/ml and a stationary phase at ToVD > 21.96 ng/ml. The same trend was found in the plot of the lumbar BMD with the exception that the cutoff of ToVD was 27.40 ng/ml. The analysis of the risk of developing osteoporosis demonstrated that when ToVD was less than 20.69 ng/ml, the odds ratio of osteoporosis was steadily increased. Ca levels exhibited a cutoff at ToVD = 23.77 ng/ml and were slowly increased. Unadjusted models are noted in Figure S4 in the Supplementary Materials and all cutoff points of ToVD were less than 30 ng/ml.
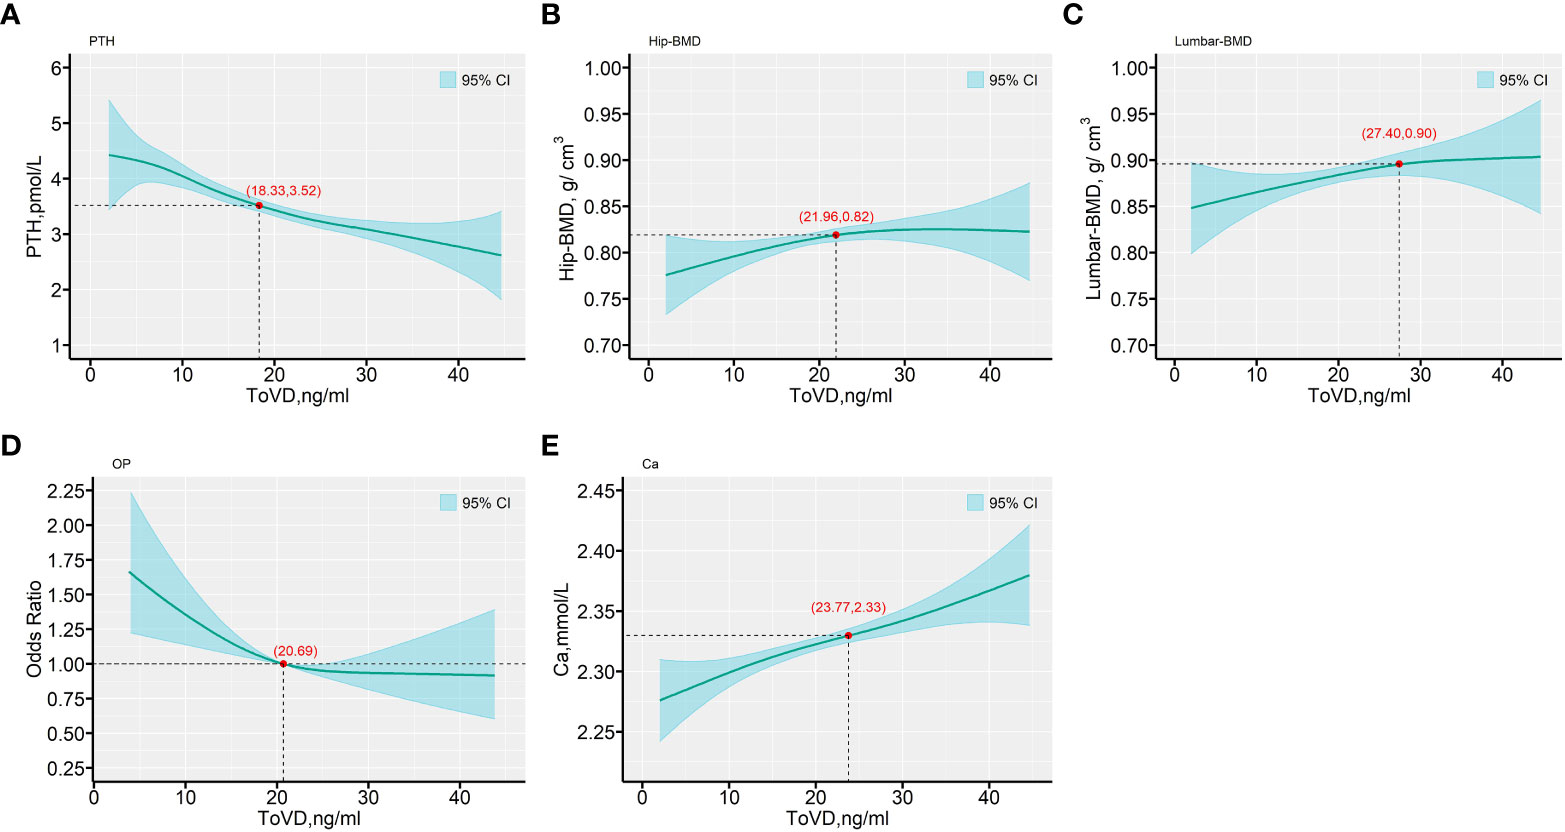
Figure 3 The predictive values for the outcomes of PTH, BMD biomarkers, OP risk and Ca, as functions of ToVD (ng/ml). (A) PTH; (B) Hip-BMD; (C) Lumbar-BMD; (D) OP; (E) Ca. The fitted values are shown in cyan lines, with a reference line provided (—). The Bayesian 95% confidence intervals are included in with cyan-color areas and calculated as described in the text. All plots are from generalized varying coefficient models (GVCM) with penalized cubic regression splines for the smooth coefficient functions. The smoothing parameters were selected by the generalized cross-validation (GCV) criterion. The red points with axis values denote the tangent points with the maximum changes of the predicted values by ToVD. In all panels, multivariate analyses were adjusted for age (in years, continuous), sex (men or women), educational status, smoking status, drinking status, dietary types, family income levels, seasons, regions and MAHS (in hours, continuous). The missing data were imputed by multiple imputation and all estimations were combined across the 5 imputed datasets using the Rubin’s method. ToVD, total 25(OH)D; PTH, parathyroid hormone; Hip-BMD, hip bone mineral density; Lumbar-BMD, lumbar bone mineral density; OP, osteoporosis; OR, odds ratio; Ca, Calcium; MAHS, mean annual hours sunshine; BMI, body mass index.
Figure 4 indicated the nonlinear modification by BMI for the effects of the predicted values of Hip-BMD, Lumbar-BMD and OP risk. The plots indicated the predicted values of Hip-BMD, which were positively associated with the function indicating increased BMI exposure, notably for the subjects with BMI > 26.01 kg/m2. Similar results were also observed with regard to the association between Lumbar-BMD and BMI, notably for the subjects with BMI > 25.71 kg/m2. However, the increasing BMI value was associated with the decrease in the OP risk that was demonstrated in the predicted risk curve in the GVCM, notably for the subjects with BMI > 24.05 kg/m2. The unadjusted results indicated similar results (Figure S5 in the Supplementary Materials).
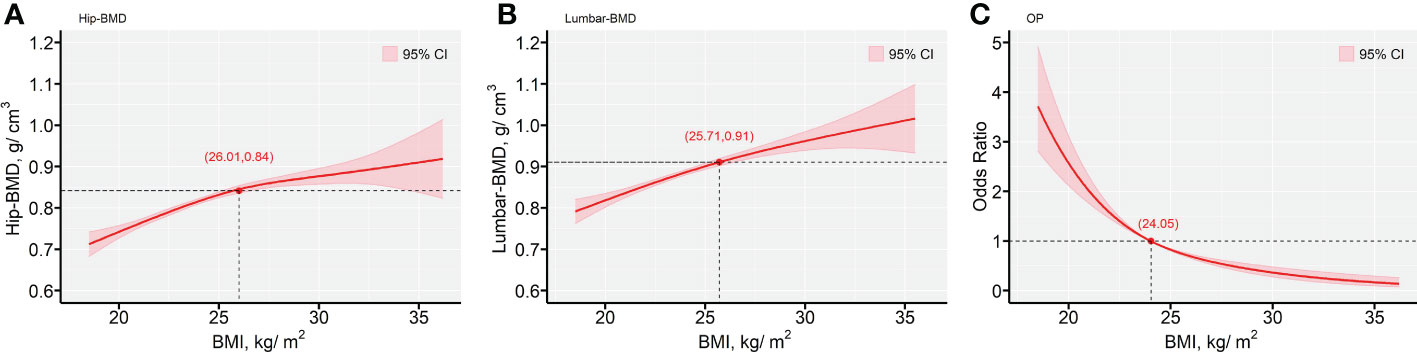
Figure 4 The predictive values for the outcomes of BMD biomarkers and OP risk, as functions of BMI (kg/m2). (A) Hip-BMD; (B) Lumbar-BMD; (C) OP. The fitted values are shown in red lines, with a reference line provided (—). The Bayesian 95% confidence intervals are included in with red-color areas, calculated as described in the text. All plots are from generalized varying coefficient models (GVCM) with penalized cubic regression splines for the smooth coefficient functions. Smoothing parameters were selected by the generalized cross-validation (GCV) criterion. The red points with axis values denoted the tangent points with the maximum changes of the predicted values by BMI. In all panels, multivariate analyses were adjusted for age (in years, continuous), sex (men or women), educational status, smoking status, drinking status, dietary types, family income levels, seasons, regions and MAHS (in hours, continuous). The missing data were imputed by multiple imputation and all estimations were combined across the 5 imputed datasets using the Rubin’s method. Hip-BMD, hip bone mineral density; Lumbar-BMD, lumbar bone mineral density; OP, osteoporosis; OR, odds ratio; MAHS, mean annual hours sunshine; BMI, body mass index.
The results of the interactions between the covariate ToVD and the effect modifier BMI for Hip-BMD, Lumbar-BMD and OP risk outcomes are illustrated in Figure S6 in the Supplementary Materials. The slope values of ToVD indicated a positive association of ToVD by BMI for Hip-BMD and Lumbar-BMD outcomes. In addition, a constant non-zero slope line for ToVD modified by BMI demonstrated a synergistic effect for the Lumbar-BMD outcome. The interaction between ToVD and BMI with regard to the OP risk outcome was negative, however it was not significant considering that the 95% CIs of the slope values were approaching zero. The unadjusted results indicated similar result in Figure S7 of the Supplementary Materials.
In the three-dimensional illustration of the trajectory of the level of Hip-BMD, Lumbar-BMD and OP risk were adjusted by covariates according to ToVD levels and BMI, respectively (Figure 5). The unadjusted results are indicated in Figure S8 in the Supplementary Materials. The levels of BMD were increased with the BMI and ToVD levels and with their interaction (p < 0.001). The peak of BMD was observed among obesity subjects (BMI > 30 kg/m2) with the concentration of 40 to 50 ng/ml of ToVD (Figures 5A, B). In the three-dimensional illustration of the OP risk, it was found that the lower levels of ToVD and BMI would increase the risk of OP statistically, notably for those subjects with lower ToVD (less than 20.69 ng/ml) combined with lower BMI (less than 24.05 kg/m2) (Figure 5C).
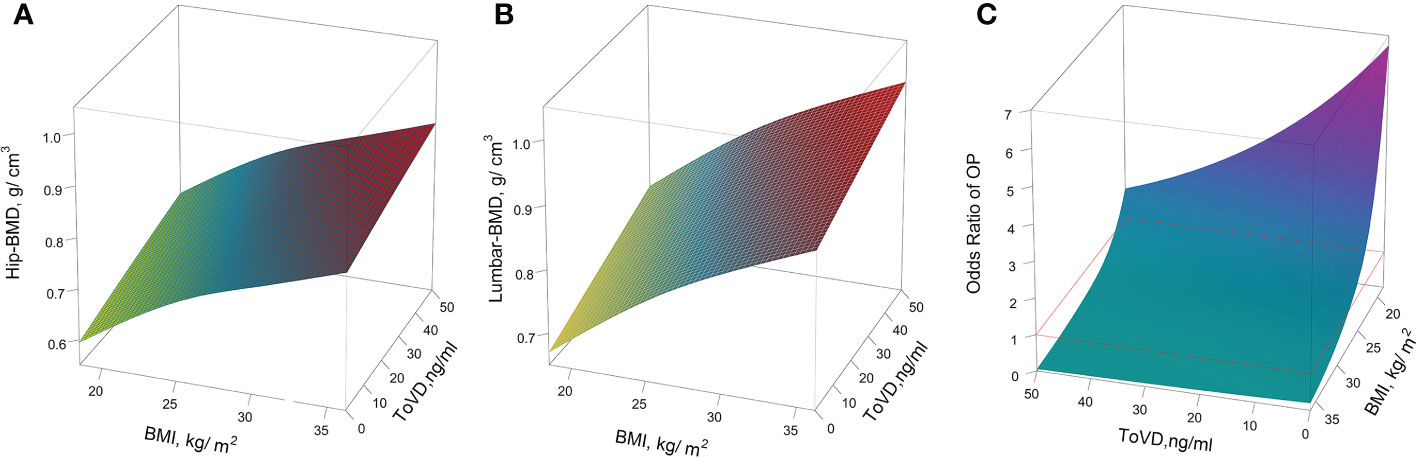
Figure 5 The predictive values for the outcomes of BMD biomarkers and OP risk, as functions of ToVD (ng/ml) and BMI (kg/m2). (A) Hip-BMD; (B) Lumbar-BMD; (C) OP. The yellow-colored region maps indicate the lower levels of the BMD area, and the red-colored area corresponds to the higher level of the BMD area; In the plot of the expression levels of Lumbar-BMD according to ToVD levels and BMI, The yellow-colored region maps the lower level of the BMD area, whereas the red-colored area corresponds to the higher level of the BMD area; In the plot of OP risk trajectory according to ToVD levels and BMI, compared with the reference values, the cyan-colored region maps the lower risk area and the red violet colored area corresponds to the higher risk area. Red lines are used to illustrate reference risk levels (OR=1, subjects with BMI = 24 kg/m2 and ToVD = 20.88 ng/ml as reference). In all panels, multivariate analyses were adjusted for age (in years, continuous), sex (men or women), educational status, smoking status, drinking status, dietary types, family income levels, seasons, regions and MAHS (in hours, continuous). The missing data were imputed by multiple imputation and all estimations were combined across the 5 imputed datasets using the Rubin’s method. ToVD, total 25(OH)D; Hip-BMD, hip bone mineral density; Lumbar-BMD, lumbar bone mineral density; OP, osteoporosis; OR, odds ratio; MAHS, mean annual hours sunshine; BMI, body mass index.
25(OH)D levels are consistently lower in obese than in normal and overweight subjects. Therefore, obese individuals are frequently classified as VD deficient (22, 23). The present study involved middle-elder community-dwelling adults throughout China and the data indicated that lower 25(OH)D levels and higher BMD were confirmed for obese or high BMI subjects. We investigated the concrete additive effects of lower 25(OH)D levels and higher BMI on bone health among a large healthy sample size in China. The data indicated that higher BMI may have a beneficial effect on BMD, overshadowing the impact of reduced 25(OH)D levels, further the beneficial cutoff values of BMI and VD were given to maintain bone health, which could effectively reduce the burden of osteoporosis and its related fractures.
Reduced 25(OH)D levels are often accompanied with low BMD levels (14, 24). However, subjects with higher BMI and lower 25(OH)D levels exhibited higher BMD in the present study. This could be caused by the different levels of the bioavailable 25(OH)D. Bioavailable 25(OH)D consists primarily of albumin binding 25(OH)D (10% to 15% total 25(OH)D) and its free form (less than 10% of total 25(OH)D), acting directly on target tissue and cells (25). It could have a stronger effect on BMD compared with total 25(OH)D levels, as determined in our previous study (26). Therefore, the current study examined the difference of bioavailable 25(OH)D and its percentage in 25(OH)D among the three different BMI groups. The results indicated no significant differences among the three groups. Subsequently, the differences of the related metabolic indicators were examined among the different BMI groups. The participants of the obese group exhibited higher PTH levels compared with those of the normal group. PTH is a center hormone regulating calcium and phosphate levels through its actions at several organs. Its biological function resembles 1α, 25(OH)2D in increasing serum calcium. A higher PTH would in turn inhibit the production and secretion of 25(OH)D (27), a precursor of 1α, 25(OH)2D, resulting in BMD reduction. The characteristics of bone metabolism of the subjects investigated in the current study demonstrated that obese participants exhibited reduced concentration levels of OST and PINP. Concomitantly, these subjects experienced lower CTX levels, which may not weaken the influence of OST and PINP on BMD levels. The aforementioned finding has been previously confirmed in obese children and adolescents (28).
Genetic evidence pointing to lower VD and higher BMD is necessary. According to the genome-wide association study (GWAS) data (29) and a previous study published by our group (26), we genotyped rs12785878, rs10741657, rs4588, rs7041, rs2282679 and rs6013897, the VD related metabolism and transportation proteins gene locus SNPs information, finding absence of SNPs distribution differences among the three groups with the exception of the haplotypes. The Gc2 variant (TT for rs7041 and TT rs4588) accounted for the majority of obese homozygous participants. Due to the lower affinity constant between 25(OH)D and DBP, subjects carrying Gc2 always acquired lower 25(OH)D (21), which may explain why the obese group exhibited lower 25(OH)D levels. A research study on the association between DBP SNPs and obesity (30) revealed that certain DBP SNPs were significantly correlated with percentages of human fat mass. Therefore, the potential of the sampling to increase the susceptibility of obese subjects to carry Gc2 requires detailed investigation and verification in a larger sample size. No statistical associations were observed between the expression of specific genes and BMD in order to explain the higher BMD value noted in obese subjects. In addition, codominant, dominant and recessive models were applied to identify the susceptible SNPs in the six gene loci related to osteoporosis. The findings indicated that the gene locus SNPs included in the present study exhibited no association with the risk of developing osteoporosis.
In addition to the genetic factors, stores of 25(OH)D and serum25(OH)D are limited in humans (23). As a result, obese subjects would experience higher volume of distribution of 25(OH)D and bioavailable 25(OH)D. Sunlight exposure plays a key role in 25(OH)D3 production, which is a main component for the production of 25(OH)D. Reduced exposure to sunlight occurs in obese subjects, due to their reduced outdoor activities, which would also explain the diversity of 25(OH)D levels between obese and normal-weight subjects (31, 32). Given that overconsumption of food always leads to obesity, subjects with obesity often suffer from micronutrient deficiencies, notably hypovitaminosis D (33, 34). In contrast to these findings, adipose tissue acts as the most important storing compartment of VD and its analogues (35), which may contribute to the reduced VD levels in the obese population.
Although 25(OH)D levels were reduced in obese subjects, they cannot be used for pathological diagnosis. According to the guidelines on the management of VD deficiency in adults published in 2013 by the United Kingdom National Osteoporosis Society (36), the deficiency in serum 25(OH)D levels suggests that the serum concentration of 25(OH)D is below 30 ng/ml. Based on this threshold, the majority of the participants (nearly 80% of total participants) would be diagnosed as VD deficient. By comprehensively considering the osteoporosis occurrence risk, PTH reduction level and other indicators, the range from 18.33 to 27.40 ng/ml may be an optimization for the VD threshold, which again supports the conclusion that the VD deficiency threshold should be assessed according to pathological situations and ethnicity rather than adhering to a single standard.
Obesity or high BMI is recognized as a disease related to physical and psychological disorders (37). This may be an exception for BMD. High BMI is beneficial to lumbar or hip BMD and excessively higher BMI will not proportionally contribute to BMD accumulation. Reduced exposure to sunlight, decreased will to exercise and the negative influence of adipose tissue mass on bone caused by elevated BMI may counteract the advantage of weight-bearing effects (38). The participants of the present study exhibited a BMI ranging from 24.05 to 26.01 kg/m2. This can provide benefits to BMD and osteoporosis prevention. In other words, from the perspective of bone health, this range is suitable for Chinese elderly subjects, which is consistent with previously reported findings (39–41).
Interactive effects of lower 25(OH)D and higher BMI on BMD and osteoporosis were explored by constructing statistical models. We found that BMI and 25(OH)D always exerted interactions with BMD. The consideration that the BMI or 25(OH)D effect occurs separately on BMD is not suitable in Chinese elderly subjects. Those with lower 25(OH)D levels (< 20.69 ng/ml) combined with lower BMI (< 24.05 kg/m2) would suffer from higher risk of osteoporosis. Up to now, only a limited number of studies (23, 42) examined the associations among BMD, BMI and 25(OH)D levels, without comprehensive considerations for each of these parameters. Our study confirms a complex and bidirectional regulation of BMI and 25(OH)D for BMD, which deserves further exploration in the future.
The current study contains certain limitations which will be important to consider in future studies. Firstly, the current findings indicated a complex, nonlinear relationship between ToVD levels and the outcomes of BMD and OP risk modified by BMI status that may advance existing research examining these potential correlations among different outcomes. It is important to note that statistical associations do not imply causal relationships. However, our findings provide the biological plausibility of associations for future studies when evaluating these types of associations. Secondly, due to the cross-sectional design of our study, possible information and selection bias as well as other confounding variables, unknown or not were not considered in our statistical analysis. Therefore these factors may have influenced the reported results. Finally, we applied multiple statistical tests in our study, which increases the chance of type I errors. In the present study, a Bonferroni’s correction was applied to control the family-wise error rate.
In conclusion, for middle-elder obese people, higher BMI may compensate for the adverse effects of lower 25(OH)D levels on BMD. Since 25(OH)D levels interact with BMI, BMI will most likely need to be considered when 25(OH)D levels are used to evaluate bone health. By retaining BMI at approximately 24.05 kg/m2 and VD at approximately 20.69 ng/ml, several benefits can be provided for Chinese elderly subjects.
The raw data supporting the conclusions of this article will be made available by the authors, without undue reservation.
The studies involving human participants were reviewed and approved by Longhua Hospital affiliated to the Shanghai University of Traditional Chinese Medicine. The patients/participants provided their written informed consent to participate in this study.
YW and DT had full access to the data in the study and take responsibility for the integrity of the data and the accuracy of the data analysis. CY, JW, WZ, HY, and BS are co-firster authors. YW and DT are co-corresponding authors. Concept and design, CY, WZ, DT, and YW. Acquisition, analysis, or interpretation of data, all authors. Drafting of the manuscript, WZ, CY, and HY. Critical revision of the manuscript for important intellectual content, DT, YW, WZ, CY, JW, and BS. Statistical analysis, HY, CY, and WZ. Obtained funding, YW, BS, QL, HW, PC, and DT. Administrative, technical, or material support, CY, JW, WZ, HY, BS, CL, QL, DL, BC, XX, XL, XW, HW, PC, CH, HX, YS, YZ, QS, DT, and YW. Supervision, DT, CY, WZ, HY, BS, JW, and YW. All authors contributed to the article and approved the submitted version.
This work was partially supported by the National Key R&D Program of China (2018YFC1704300), the National Natural Science Foundation of China(NSFC) (81730107, 81973883, 81929004), the Shanghai Municipal Science and Technology Major Project (2017SHZDZX01), the Program for Innovative Research Team of Ministry of Education of China (IRT1270), the Program for Innovative Research Team of Ministry of Science and Technology of China (2015RA4002), Natural Science Foundation of Shanghai (20ZR1434100), and the Inheritance and Innovation Team Project of National Traditional Chinese Medicine (ZYYCXTD-C-202202).
The authors declare that the research was conducted in the absence of any commercial or financial relationships that could be construed as a potential conflict of interest.
The reviewer GZ declared a shared affiliation, with no collaboration, with the authors XL and XW to the handling editor at the time of the review.
All claims expressed in this article are solely those of the authors and do not necessarily represent those of their affiliated organizations, or those of the publisher, the editors and the reviewers. Any product that may be evaluated in this article, or claim that may be made by its manufacturer, is not guaranteed or endorsed by the publisher.
The Supplementary Material for this article can be found online at: https://www.frontiersin.org/articles/10.3389/fimmu.2023.1162175/full#supplementary-material
1. Yu F, Xia W. The epidemiology of osteoporosis, associated fragility fractures, and management gap in China. Arch Osteoporos. (2019) 14(1):32. doi: 10.1007/s11657-018-0549-y
2. Gueldner SH, Britton GR, Madhavan G, Pierce CS, Grabo TN, Penrod J, et al. Ultrasonometric profiling of incidence and risk of osteoporosis in rural women. J Women Aging (2008) 20(1-2):21–30.
3. Burge R, Dawson-Hughes B, Solomon DH, Wong JB, King A, Tosteson A. Incidence and economic burden of osteoporosis-related fractures in the united states, 2005-2025. J Bone Miner Res (2007) 22(3):465–75. doi: 10.1359/jbmr.061113
4. Shah VN. Bone mineral density as a surrogate biomarker for fracture risk reduction. Lancet Diabetes Endocrinol (2020) 8(11):875. doi: 10.1016/S2213-8587(20)30338-7
5. Ouyang Y, Quan Y, Guo C, Xie S, Liu C, Huang X, et al. Saturation effect of body mass index on bone mineral density in adolescents of different ages: a population-based study. Front Endocrinol (Lausanne). (2022) 13:922903. doi: 10.3389/fendo.2022.922903
6. Zeng Q, Li N, Wang Q, Feng J, Sun D, Zhang Q, et al. The prevalence of osteoporosis in China, a nationwide, multicenter DXA survey. J Bone Miner Res (2019) 34(10):1789–97. doi: 10.1002/jbmr.3757
7. Han EY, Choi JH, Kim SH, Im SH. The effect of weight bearing on bone mineral density and bone growth in children with cerebral palsy: a randomized controlled preliminary trial. Med (Baltimore). (2017) 96(10):e5896. doi: 10.1097/MD.0000000000005896
8. Oldroyd A, Dubey S. The association between bone mineral density and higher body mass index in men. Int J Clin Pract (2015) 69(1):145–7. doi: 10.1111/ijcp.12523
9. Luo Y, Jiang K, He M. Association between grip strength and bone mineral density in general US population of NHANES 2013-2014. Arch Osteoporos. (2020) 15(1):47. doi: 10.1007/s11657-020-00719-2
10. Guo B, Zhang ZK, Liang C, Li J, Liu J, Lu A, et al. Molecular communication from skeletal muscle to bone: a review for muscle-derived myokines regulating bone metabolism. Calcif Tissue Int (2017) 100(2):184–92. doi: 10.1007/s00223-016-0209-4
11. Tencerova M, Frost M, Figeac F, Nielsen TK, Ali D, Lauterlein JL, et al. Obesity-associated hypermetabolism and accelerated senescence of bone marrow stromal stem cells suggest a potential mechanism for bone fragility. Cell Rep (2019) 27(7):2050–62 e6. doi: 10.1016/j.celrep.2019.04.066
12. Hossein-nezhad A, Holick MF. Vitamin d for health: a global perspective. Mayo Clin Proc (2013) 88(7):720–55. doi: 10.1016/j.mayocp.2013.05.011
13. Autier P, Mullie P, Macacu A, Dragomir M, Boniol M, Coppens K, et al. Effect of vitamin d supplementation on non-skeletal disorders: a systematic review of meta-analyses and randomised trials. Lancet Diabetes Endocrinol (2017) 5(12):986–1004. doi: 10.1016/S2213-8587(17)30357-1
14. Adami S, Bertoldo F, Braga V, Fracassi E, Gatti D, Gandolini G, et al. 25-hydroxy vitamin d levels in healthy premenopausal women: association with bone turnover markers and bone mineral density. Bone (2009) 45(3):423–6. doi: 10.1016/j.bone.2009.05.012
15. Paranhos-Neto FP, Vieira Neto L, Madeira M, Moraes AB, Mendonca LMC, Lima ICB, et al. Vitamin d deficiency is associated with cortical bone loss and fractures in the elderly. Eur J Endocrinol (2019) 181(5):509–17. doi: 10.1530/EJE-19-0197
16. Theodoratou E, Tzoulaki I, Zgaga L, Ioannidis JP. Vitamin d and multiple health outcomes: umbrella review of systematic reviews and meta-analyses of observational studies and randomised trials. BMJ (2014) 348:g2035. doi: 10.1136/bmj.g2035
17. Oliai Araghi S, van Dijk SC, Ham AC, Brouwer-Brolsma EM, Enneman AW, Sohl E, et al. BMI and body fat mass is inversely associated with vitamin d levels in older individuals. J Nutr Health Aging. (2015) 19(10):980–5. doi: 10.1007/s12603-015-0657-y
18. Vitezova A, Muka T, Zillikens MC, Voortman T, Uitterlinden AG, Hofman A, et al. Vitamin d and body composition in the elderly. Clin Nutr (2017) 36(2):585–92. doi: 10.1016/j.clnu.2016.04.017
19. Wang J, Shu B, Li CG, Xie XW, Liang, Chen BL, et al. Polymorphisms of genes related to vitamin d metabolism and transportation and its relationship with the risk of osteoporosis: protocol for a multicentre prospective cohort study in China. BMJ Open (2019) 9(11):e028084. doi: 10.1136/bmjopen-2018-028084
20. Jang H, Lee Y, Park K. Obesity and vitamin d insufficiency among adolescent girls and young adult women from Korea. Nutrients (2019) 11(12). doi: 10.3390/nu11123049
21. Powe CE, Evans MK, Wenger J, Zonderman AB, Berg AH, Nalls M, et al. Vitamin d-binding protein and vitamin d status of black americans and white americans. N Engl J Med (2013) 369(21):1991–2000. doi: 10.1056/NEJMoa1306357
22. Vimaleswaran KS, Berry DJ, Lu C, Tikkanen E, Pilz S, Hiraki LT, et al. Causal relationship between obesity and vitamin d status: bi-directional mendelian randomization analysis of multiple cohorts. PloS Med (2013) 10(2):e1001383. doi: 10.1371/journal.pmed.1001383
23. Walsh JS, Evans AL, Bowles S, Naylor KE, Jones KS, Schoenmakers I, et al. Free 25-hydroxyvitamin d is low in obesity, but there are no adverse associations with bone health. Am J Clin Nutr (2016) 103(6):1465–71. doi: 10.3945/ajcn.115.120139
24. Mezquita-Raya P, Muñoz-Torres M, Luna JD, Luna V, Lopez-Rodriguez F, Torres-Vela E, et al. Relation between vitamin d insufficiency, bone density, and bone metabolism in healthy postmenopausal women. J Bone Miner Res (2001) 16(8):1408–15. doi: 10.1359/jbmr.2001.16.8.1408
25. Yousefzadeh P, Shapses SA, Wang X. Vitamin d binding protein impact on 25-hydroxyvitamin d levels under different physiologic and pathologic conditions. Int J Endocrinol (2014) 2014:981581. doi: 10.1155/2014/981581
26. Li C, Chen P, Duan X, Wang J, Shu B, Li X, et al. Bioavailable 25(OH)D but not total 25(OH)D is an independent determinant for bone mineral density in Chinese postmenopausal women. EBioMedicine (2017) 15:184–92. doi: 10.1016/j.ebiom.2016.11.029
27. Ferrone F, Pepe J, Danese VC, Fassino V, Cecchetti V, De Lucia F, et al. The relative influence of serum ionized calcium and 25-hydroxyvitamin d in regulating PTH secretion in healthy subjects. Bone (2019) 125:200–6. doi: 10.1016/j.bone.2019.05.029
28. Geserick M, Vogel M, Eckelt F, Schlingmann M, Hiemisch A, Baber R, et al. Children and adolescents with obesity have reduced serum bone turnover markers and 25-hydroxyvitamin d but increased parathyroid hormone concentrations - results derived from new pediatric reference ranges. Bone (2020) 132:115124. doi: 10.1016/j.bone.2019.115124
29. Wang TJ, Zhang F, Richards JB, Kestenbaum B, van Meurs JB, Berry D, et al. Common genetic determinants of vitamin d insufficiency: a genome-wide association study. Lancet (2010) 376(9736):180–8. doi: 10.1016/S0140-6736(10)60588-0
30. Jiang H, Xiong DH, Guo YF, Shen H, Xiao P, Yang F, et al. Association analysis of vitamin d-binding protein gene polymorphisms with variations of obesity-related traits in Caucasian nuclear families. Int J Obes (Lond). (2007) 31(8):1319–24. doi: 10.1038/sj.ijo.0803583
31. Karampela I, Sakelliou A, Vallianou N, Christodoulatos GS, Magkos F, Dalamaga M. Vitamin d and obesity: current evidence and controversies. Curr Obes Rep (2021) 10(2):162–80. doi: 10.1007/s13679-021-00433-1
32. Fleury N, Geldenhuys S, Gorman S. Sun exposure and its effects on human health: mechanisms through which sun exposure could reduce the risk of developing obesity and cardiometabolic dysfunction. Int J Environ Res Public Health (2016) 13(10):999. doi: 10.3390/ijerph13100999
33. Asghari G, Khalaj A, Ghadimi M, Mahdavi M, Farhadnejad H, Valizadeh M, et al. Prevalence of micronutrient deficiencies prior to bariatric surgery: Tehran obesity treatment study (TOTS). Obes Surg (2018) 28(8):2465–72. doi: 10.1007/s11695-018-3187-y
34. Via M. The malnutrition of obesity: micronutrient deficiencies that promote diabetes. ISRN Endocrinol (2012) 2012:103472. doi: 10.5402/2012/103472
35. Abbas MA. Physiological functions of vitamin d in adipose tissue. J Steroid Biochem Mol Biol (2017) 165(Pt B):369–81. doi: 10.1016/j.jsbmb.2016.08.004
36. Aspray TJ, Bowring C, Fraser W, Gittoes N, Javaid MK, Macdonald H, et al. National osteoporosis society vitamin d guideline summary. Age Ageing (2014) 43(5):592–5. doi: 10.1093/ageing/afu093
37. King DE, Xiang J, Pilkerton CS. Multimorbidity trends in united states adults, 1988-2014. J Am Board Fam Med (2018) 31(4):503–13. doi: 10.3122/jabfm.2018.04.180008
38. Dolan E, Swinton PA, Sale C, Healy A, O’Reilly J. Influence of adipose tissue mass on bone mass in an overweight or obese population: systematic review and meta-analysis. Nutr Rev (2017) 75(10):858–70. doi: 10.1093/nutrit/nux046
39. Caleyachetty R, Barber TM, Mohammed NI, Cappuccio FP, Hardy R, Mathur R, et al. Ethnicity-specific BMI cutoffs for obesity based on type 2 diabetes risk in England: a population-based cohort study. Lancet Diabetes Endocrinol (2021) 9(7):419–26. doi: 10.1016/S2213-8587(21)00088-7
40. Teufel F, Seiglie JA, Geldsetzer P, Theilmann M, Marcus ME, Ebert C, et al. Body-mass index and diabetes risk in 57 low-income and middle-income countries: a cross-sectional study of nationally representative, individual-level data in 685 616 adults. Lancet (2021) 398(10296):238–48. doi: 10.1016/S0140-6736(21)00844-8
41. Li Y, Teng D, Shi X, Qin G, Qin Y, Quan H, et al. Prevalence of diabetes recorded in mainland China using 2018 diagnostic criteria from the American diabetes association: national cross sectional study. Bmj (2020) 369:m997. doi: 10.1136/bmj.m997
Keywords: osteoporosis, older people, obesity, reduced 25(OH)D, cohort study
Citation: Yuan C, Wang J, Zhang W, Yi H, Shu B, Li C, Liang Q, Liang D, Chen B, Xie X, Lin X, Wei X, Wang H, Chen P, Huang C, Xu H, Sun Y, Zhao Y, Shi Q, Tang D and Wang Y (2023) Effects of obesity with reduced 25(OH)D levels on bone health in elderly Chinese people: a nationwide cross-sectional study. Front. Immunol. 14:1162175. doi: 10.3389/fimmu.2023.1162175
Received: 09 February 2023; Accepted: 17 April 2023;
Published: 27 April 2023.
Edited by:
Weicheng Hu, Yangzhou University, ChinaReviewed by:
Mara Carsote, Carol Davila University of Medicine and Pharmacy, RomaniaCopyright © 2023 Yuan, Wang, Zhang, Yi, Shu, Li, Liang, Liang, Chen, Xie, Lin, Wei, Wang, Chen, Huang, Xu, Sun, Zhao, Shi, Tang and Wang. This is an open-access article distributed under the terms of the Creative Commons Attribution License (CC BY). The use, distribution or reproduction in other forums is permitted, provided the original author(s) and the copyright owner(s) are credited and that the original publication in this journal is cited, in accordance with accepted academic practice. No use, distribution or reproduction is permitted which does not comply with these terms.
*Correspondence: Yongjun Wang, d2FuZ3lvbmdqdW5Ac2h1dGNtLmVkdS5jbg==; Dezhi Tang, ZHp0YW5nQHNodXRjbS5lZHUuY24=
†These authors have contributed equally to this work
Disclaimer: All claims expressed in this article are solely those of the authors and do not necessarily represent those of their affiliated organizations, or those of the publisher, the editors and the reviewers. Any product that may be evaluated in this article or claim that may be made by its manufacturer is not guaranteed or endorsed by the publisher.
Research integrity at Frontiers
Learn more about the work of our research integrity team to safeguard the quality of each article we publish.