
94% of researchers rate our articles as excellent or good
Learn more about the work of our research integrity team to safeguard the quality of each article we publish.
Find out more
ORIGINAL RESEARCH article
Front. Immunol., 16 March 2023
Sec. Autoimmune and Autoinflammatory Disorders : Autoimmune Disorders
Volume 14 - 2023 | https://doi.org/10.3389/fimmu.2023.1152294
 Zhixin Tu1
 Yao Wang2Yan Wang1Jianjie Huang1Yujin Han1Qijia Ji1Xiaoxuan Cao1Xiaoyu Wen1Yang Wang1
 Qinglong Jin1*
Introduction: The aim of this study was to develop a noninvasive prediction model for histological stages in PBC that is simple, easy to implement, and highly accurate.
Methods: A total of 114 patients with PBC were included in this study. Demographic, laboratory data and histological assessments were collected. The independent predictors of histological stages were selected to establish a noninvasive serological model. The scores of 22 noninvasive models were calculated and compared with the established model.
Results: This study included 99 females (86.8%) and 15 males (13.2%). The number of patients in Scheuer’s stage 1, 2, 3 and 4 was 33 (29.0%), 34 (29.8%), 16 (14.0%), and 31 (27.2%), respectively. TBA and RDW are independent predictors of PBC histological stages. The above indexes were used to establish a noninvasive model-TR score. When predicting early histological change (S1) or liver fibrosis and cirrhosis (S3-S4), the AUROC of TR score were 0.887 (95% CI, 0.809-0.965) and 0.893 (95% CI, 0.816-0.969), higher than all of the other 22 models included in this study. When predicting cirrhosis (S4), its AUROC is still as high as 0.921 (95% CI, 0.837-1.000).
Conclusion: TR score is an easy, cheap and stable noninvasive model, without complex calculation formulas and tools, and shows good accuracy in diagnosing the histological stages of PBC.
Primary biliary cholangitis (PBC, formerly known as primary biliary cirrhosis), is a chronic autoimmune liver disease characterized by bile duct epithelial cell damage, cholestasis, and autoantibody production. In the last 50 years, the incidence of PBC has been on the rise. In addition to the improvement in diagnostic capabilities (detection of anti-mitochondrial antibodies, etc.) and the increased awareness of this disease, the incidence of PBC is still realistically increasing in regions such as the Asia-Pacific region, Italy, and the Netherlands, which may be related to the increase in the aging population and changes in environmental causative factors (1, 2). The pathogenesis of PBC remains poorly understood. It is currently believed that genetic factors, epigenetic and environmental triggers underlie the pathogenesis of PBC, the consequence of which is the combination of innate and acquired immune response to biliary tract injury and bile acid physiology (3–5).
The histology of PBC is characterized by chronic non-suppurative destructive cholangitis involving the interlobular and septal bile ducts, and the typical changes are severe inflammatory infiltrates and necrotic focal lesions around the bile ducts, called ‘florid duct lesions’ (6, 7). The pathological manifestations of PBC are usually divided into four stages: stage 1 is characterized by inflammation of the confluent area with or without bile duct lesions, in which characteristic florid duct lesions are seen; stage 2 is characterized by the spread of inflammation of the confluent area to the liver parenchyma, with fine bile duct hyperplasia and the formation of interfacial hepatitis; stage 3 is characterized by structural changes of the liver with visible fibrous septa; and stage 4 by the presence of cirrhosis with regenerative nodules (8, 9).
Due to the high specificity of serum markers, liver biopsy is not mandatory for the diagnosis of PBC. The European Association for the Study of the Liver (EASL) recommends monitoring the progression of PBC by vibration-controlled transient elastography (VCTE) (7). A previous study has shown that liver stiffness measurement (LSM) ≤6.5 and >11.0 kPa measured by VCTE can identify the presence of advanced fibrosis in patients with PBC (10). Whereas VCTE is not reliable for patients with LSM between these two cut-off values, and VCTE is weak for the identification of early lesions in PBC.
Therefore, T he use of noninvasive models to predict the prognosis and hepatic histological changes in patients with PBC is essential in clinical practice. Recent studies have shown that the albumin-bilirubin score (ALBI) reflects the pathological staging of Japanese PBC patients and that a lower ALBI score before ursodeoxycholic acid (UDCA) prescription predicts better liver transplant-free survival (11). Elevated aspartate aminotransferase (AST) to platelet ratio index (APRI) has also been validated in different cohorts to be associated with the risk of adverse events in patients with PBC (12). A study that included 35 patients with biopsy-proven PBC showed that the gamma-glutamyl transferase (GGT) to platelet ratio (GPR) was more sensitive than APRI and FIB-4 (fibrosis index based on the four factors) in detecting advanced fibrosis in patients with PBC (13). A Korean study showed that the neutrophil-to-lymphocyte ratio (NLR) was significantly associated with transplant-free survival in patients with PBC (14). The red blood cell distribution width (RDW) to platelet ratio (RPR) can be used as a predictor of significant liver fibrosis and cirrhosis in patients with chronic hepatitis B. It has been shown that RPR can provide useful information for predicting the histological severity of PBC (15, 16). AST to alanine aminotransferase (ALT) ratio (AAR) was significantly different between the presence or absence of cirrhosis in chronic liver disease, but its correlation with the liver fibrosis stage in PBC was poor (17, 18).
In addition, noninvasive models commonly used in clinical to predict the prognosis and severity of fibrosis include age-platelets simplifies index (AP index), three-parameter cirrhosis discriminant score (CDS), Doha score, fibrosis cirrhosis index (FCI), fibrosis index (FI), FIB-4, fibro-quotient (FibroQ), globulin/platelet model (GP model), Göteburg University Cirrhosis Index (GUCI), hepatitis B-fibrosis score (HB-F), Lok index, King’s score, non-invasive Koelin-Essen-index (NIKEI), Pohl model, S index, and model of end-stage liver disease(MELD) (19–33). However, these noninvasive models are mostly used for other types of chronic liver diseases (such as viral and fatty liver diseases). Noninvasive models applied to PBC in the clinic are still relatively few, and there is a lack of simple, inexpensive, and easy-to-use scoring models. This study aims to find a noninvasive prediction model for histological lesions in PBC that is simple, easy to implement, and highly accurate.
A total of 114 patients with PBC who underwent liver biopsy from January 1st, 2013 to October 31, 2022, at the First Hospital of Jilin University were enrolled in this study. Inclusion criteria include: (1) meeting the diagnostic criteria for PBC published by the American Association for the Study of Liver Diseases(AASLD) in 2018 (6); (2) being either untreated with UDCA or non-responders to UDCA treatment. Demographic and laboratory data within the last week before the liver biopsy were collected. Exclusion criteria included: (1) combined with other types of liver disease, such as viral hepatitis, autoimmune hepatitis, drug-related liver disease, alcoholic liver disease or non-alcoholic fatty liver disease; (2) combined with severe cardiovascular disease; (3) combined with malignant tumor or other important organ failures; (4) incomplete information on clinical data. Laboratory data include AST, ALT, GGT, alkaline phosphatase (ALP), albumin (ALB), globulin (GLB), total bilirubin (TBil), total bile acid (TBA), neutrophil count (NE), lymphocyte count (LY), RDW, platelet count(PLT), international normalized ratio(INR), prothrombin time(PT) and serum creatinine(SCr).
The formulas of the 23 noninvasive models included in this study are shown in the Supplementary Material.
After obtaining the patient’s informed consent, a liver biopsy was performed under color Doppler ultrasound guidance with 18G Tru-Cut needles. The puncture required a liver tissue length of 1 to 2.2 cm, including more than 6 intact confluent areas. The specimens were fixed with 10% formaldehyde solution, embedded in paraffin, and stained with hematoxylin and eosin(H&E) and argentophilic staining methods. The pathological diagnosis of each liver tissue was determined after a double-blind examination by 2 experts from the Pathological Diagnostic Center of the First Hospital of Jilin University, and histological staging was performed using Scheuer’s staging method.
SPSS 25.0 and Graghpad Prism 9.0 software were applied for statistical analysis and graphing of data. The quantitative data were expressed as mean ± standard deviation or median (interquartile range), and intergroup comparisons were analyzed by independent samples t-test or Mann-Whitney nonparametric test. The qualitative or categorical data were expressed as percentages, and the intergroup comparisons were measured by the chi-square test. One-way ANOVA or K independent samples nonparametric test was applied to analyze the predictors associated with the histological stages of PBC. Grade correlation analysis was performed using Spearman correlation analysis. Independent predictors associated with histological stages were analyzed using multivariate ordered logistic regression, and the selected independent variables were modeled by multivariate stepwise regression analysis. The receiver operating curve (ROC) was applied to assess the predictive value of each noninvasive model. The best cutoff points were selected according to the Youden index from the ROC curve. The accuracy of the constructed model was evaluated by consistency, sensitivity, specificity, positive predictive value (PPV), negative predictive value (NPV) and consistency test with pathological diagnosis. P values< 0.05 was considered statistically significant.
This study included 114 PBC patients, including 99 females (86.8%) and 15 males (13.2%). The ratio of male vs. female was 1:6.6, and the median age was 53 (48,58) years. The number of patients in Scheuer’s stage 1, 2, 3 and 4 was 33 (29.0%), 34 (29.8%), 16 (14.0%), and 31 (27.2%), respectively. All patients were randomly divided into a model group (n=78) and a validation group (n=36). The general information of the two groups is shown in Table 1. There was no statistically significant difference between the model group and the validation group.
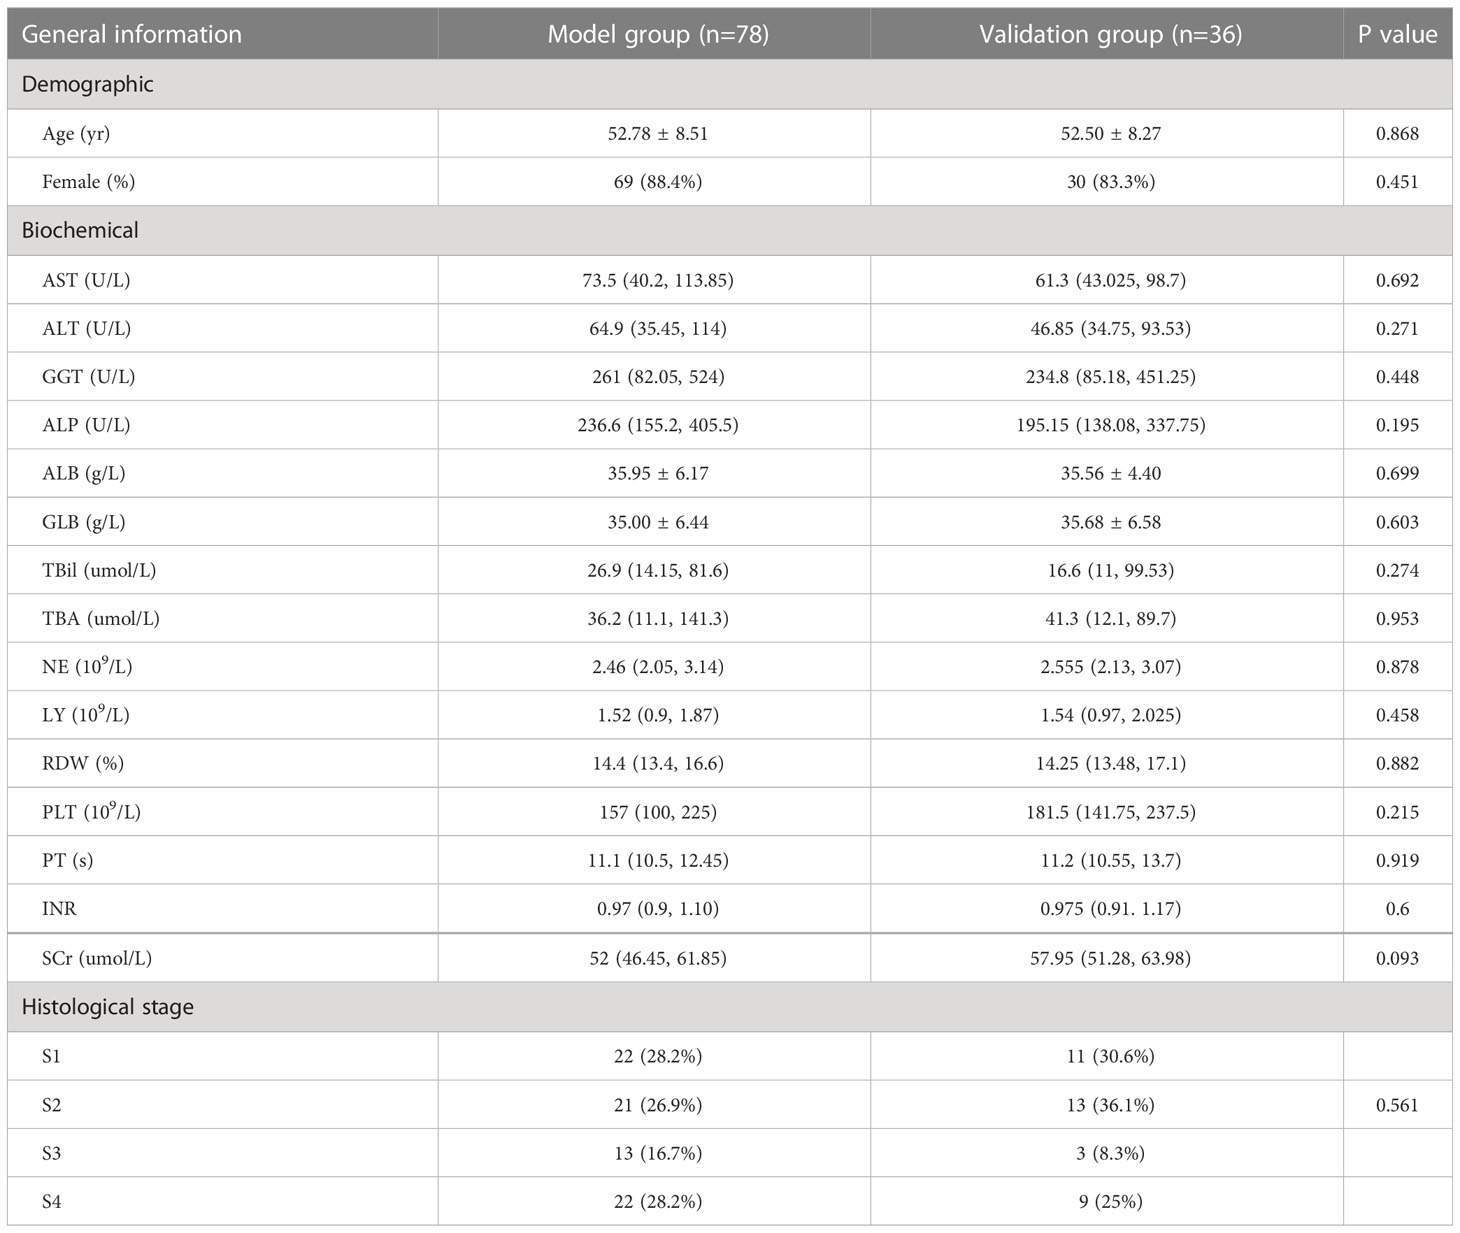
Table 1 General information of model group and validation group.
The clinical characteristics of patients with different pathological stages in the model group are shown in Table 2. All indicators except age, sex, AST and NE differed among different pathological stages (P<0.05). Bivariate Spearman correlation analysis showed that TBA, TBil, RDW, LY, PT, ALB, PLT, INR, SCr, GGT, AST, and GLB were significantly correlated with pathological stage grade (Table 3). The block diagrams of TBA, TBil, RDW, LY, PT, ALB, PLT, INR, SCr, GGT GLB and ALT according to the histological stage were shown in Figure 1. It can be seen that with the progression of the histological stage, the levels of TBA, TBil and RDW gradually increased, while the levels of LY, ALB and PLT decreased. PT, INR, SCr, GGT, GLB and ALT changed less significantly with histological stages.
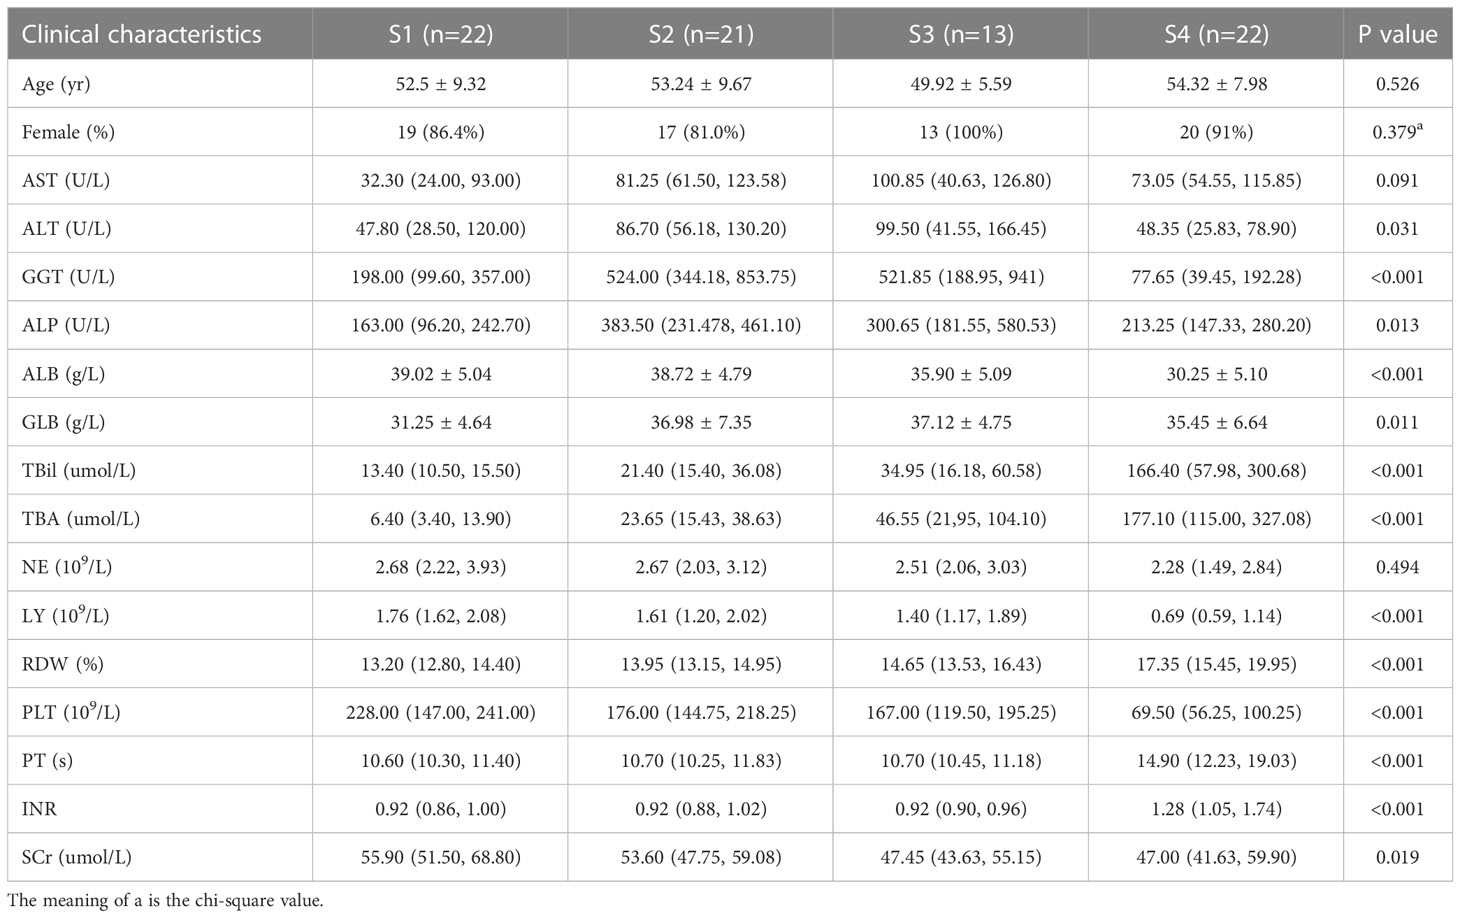
Table 2 Clinical characteristics of patients with different histological stages in the model group.
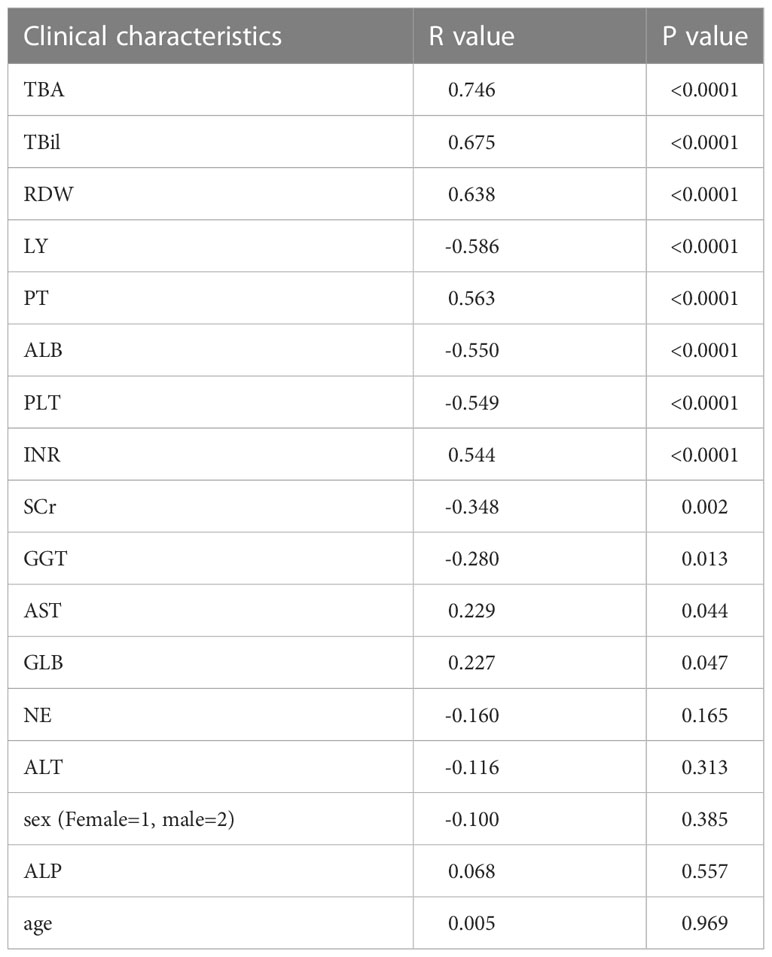
Table 3 Correlation analysis between clinical characteristics and histological stages in the model group.
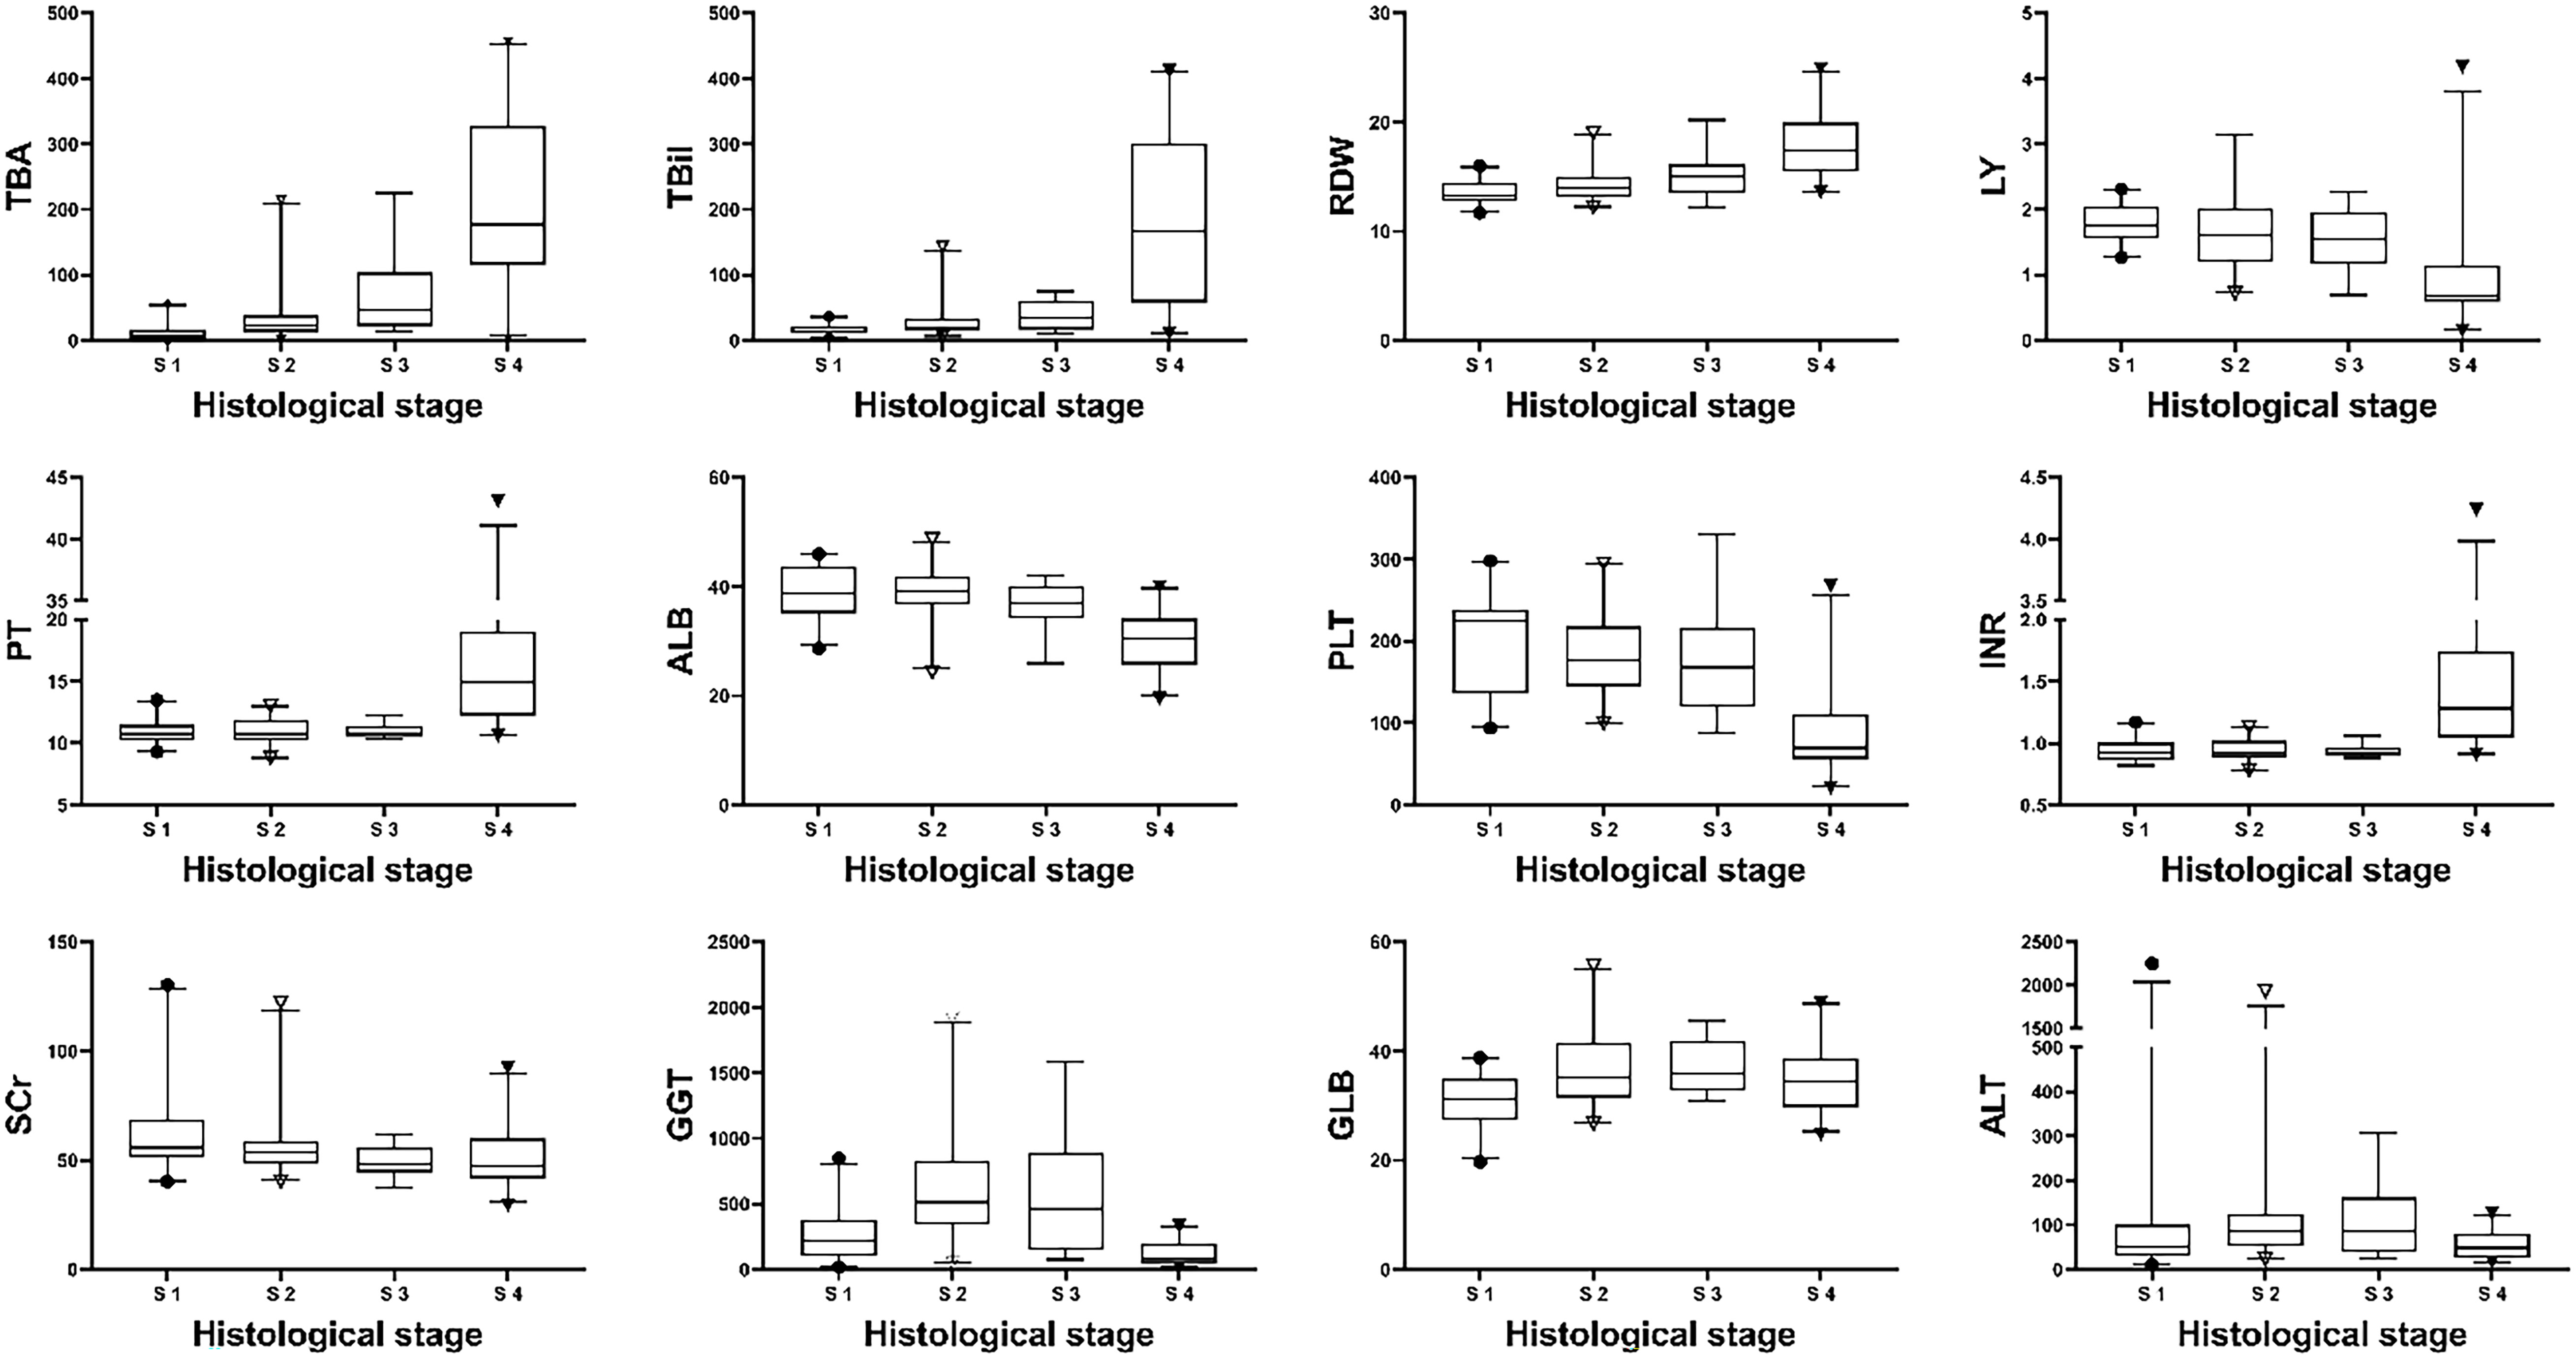
Figure 1 Distribution of biochemical parameters with histological stages in the model group. Note: The top and bottom of each box are the 25th and 75th percentiles, the horizontal line through the box is the median, and the error bars are the 5% and 95% percentiles.
All eight serological parameters in Table 3 with correlation coefficient >0.5 in absolute value were included in the multivariate ordered logistic regression analysis. It was suggested that only TBA (adjusted OR: 1.017,95%CI, 1.004-1.030) and RDW (adjusted OR: 1.647, 95%CI, 1.114-2.514) were independent predictors of PBC histological stage (p<0.05). Multiple stepwise regression analysis of TBA and RDW with PBC histologic stage was performed. The adjusted R-squared after incorporation both TBA and RDW was 0.563, and the regression model was:
To facilitate calculation and application in the clinic practice, the model was simplified to:
The validity of TR score in predicting the histological stages of PBC will be compared with Model S and 22 other models in the following.
TR scores, Model S and other 22 noninvasive models were calculated for patients in the model group according to the formula shown in the Supplementary Material. 24 models were analyzed for Spearman correlation with the pathological stage as shown in Table 4. All models except the S index and GPR showed significant correlation (p<0.05) with the pathological stage of PBC, with the TR score showing the strongest correlation (r=0.770, p<0.0001). The correlation of TR score is similar to Model S.
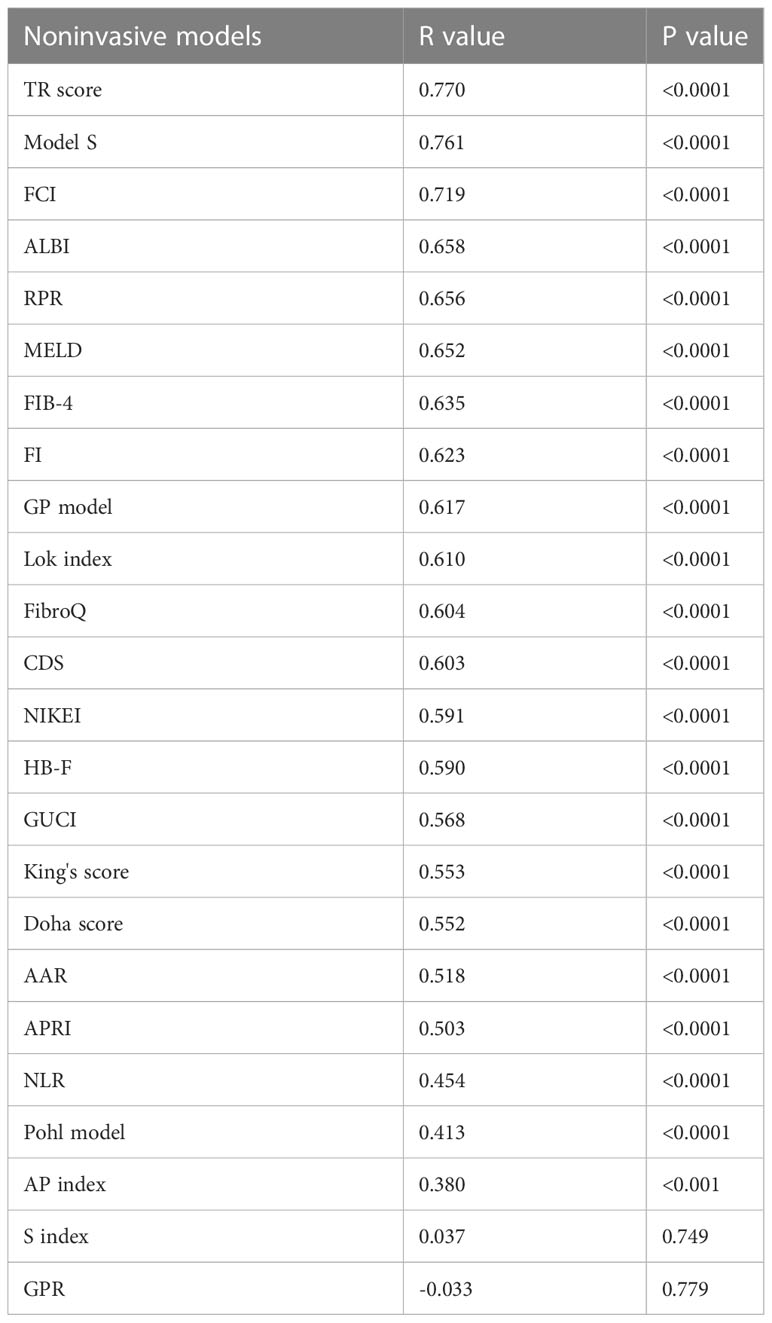
Table 4 Correlation analysis between 24 models and the histological stage of PBC in the model group.
The patients in the model group were divided into stage 1 (S1) and stage 2-4 (S2-4) according to pathological stages. The receiver operating curve (ROC) of the TR score and Model S for predicting the histological stage of S1 and S2-S4 was shown in Figure 2A. The AUROC, sensitivity, specificity and cutoff value of 23 models were shown in Table 5. The AUROC of TR score, Model S and FCI was more than 0.85, which were considered to be effective in predicting PBC with histological stage S2-4. The AUROC of TR score was 0.887 (95% CI, 0.809~0.965), which was higher than all other noninvasive models included in the study, indicating that its ability to distinguish histological changes in ultra-early stage (S1) was better than that of the other 23 models. The cutoff value of the TR score for prediction S2-S4 is 23.923, and the sensitivity, specificity, PPV and NPV of the TR score is 85.2%, 81.8%, 92.0%, 69.2%, respectively.
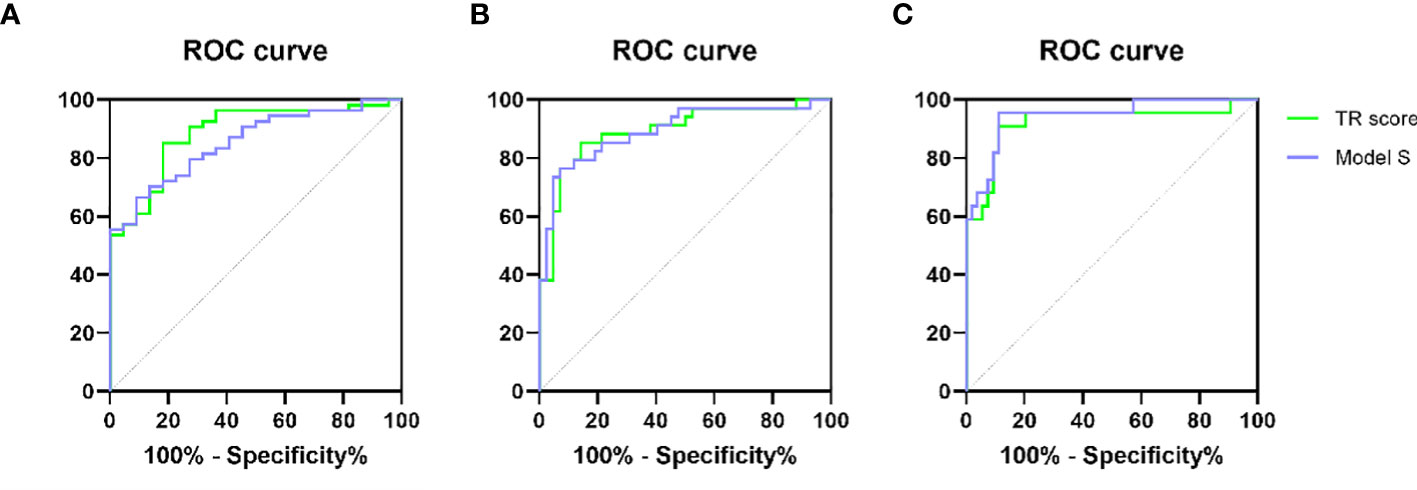
Figure 2 ROC generated by TR score and Model S for prediction of S2-S4 (A), S3-S4 (B) and S4 (C).
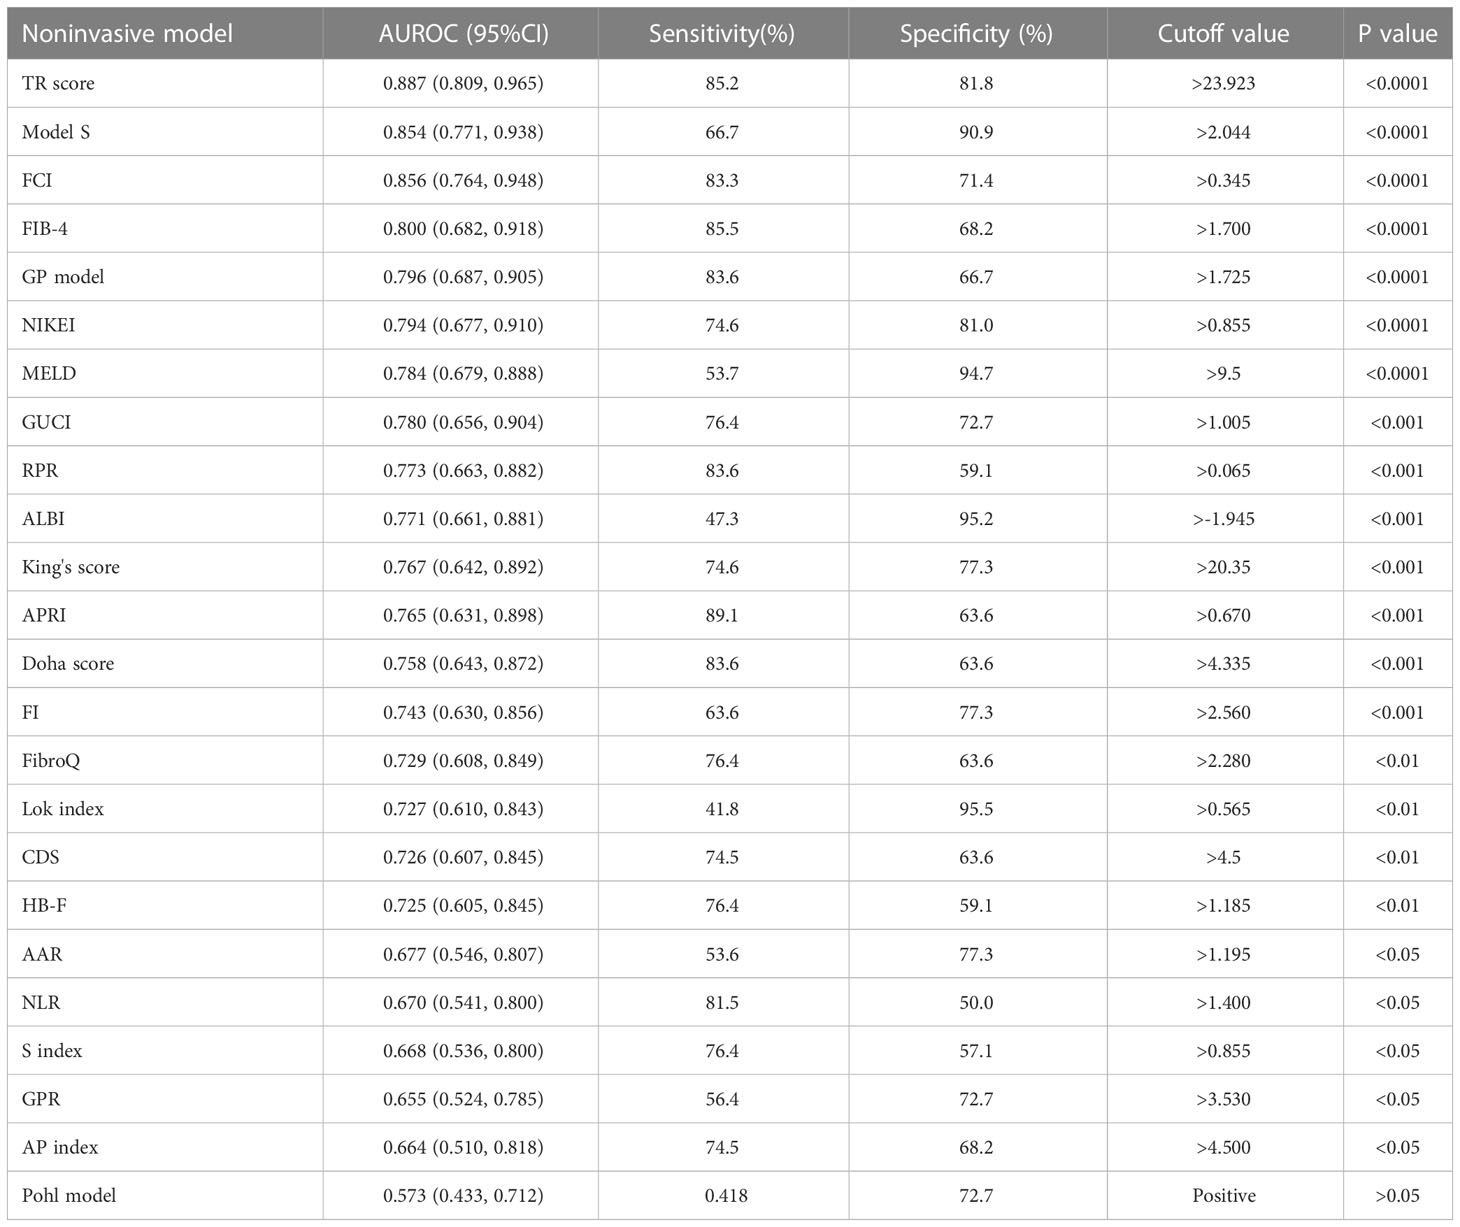
Table 5 Validity of each models for prediction of S2-S4.
Patients in the model group were divided into stage 1-2 (S1-S2) and stage 3-4 (S3-S4). The ROC of the TR score and Model S for predicting the histological stage of S3-S4 was shown in Figure 2B. AUROC, sensitivity, specificity and cutoff value of 24 models were shown in Table 6. The AUROC of TR score, Model S, ALBI and FCI were more than 0.85, indicating that the above 4 models were effective in predicting PBC at S3-S4. The AUROC of TR score for prediction S3-S4 in patients with PBC was 0.893 (95%CI, 0.816-0.969), which was higher than that of the other 22 existing models, indicating that its ability to differentiate fibrosis and cirrhosis (S3-S4) was better than that of all other models included in this study. The cutoff value of the TR score for prediction S3-S4 is 61.189, and the sensitivity, specificity, PPV and NPV of the TR score is 85.3%, 85.7%, 82.9%, 87.8%, respectively.
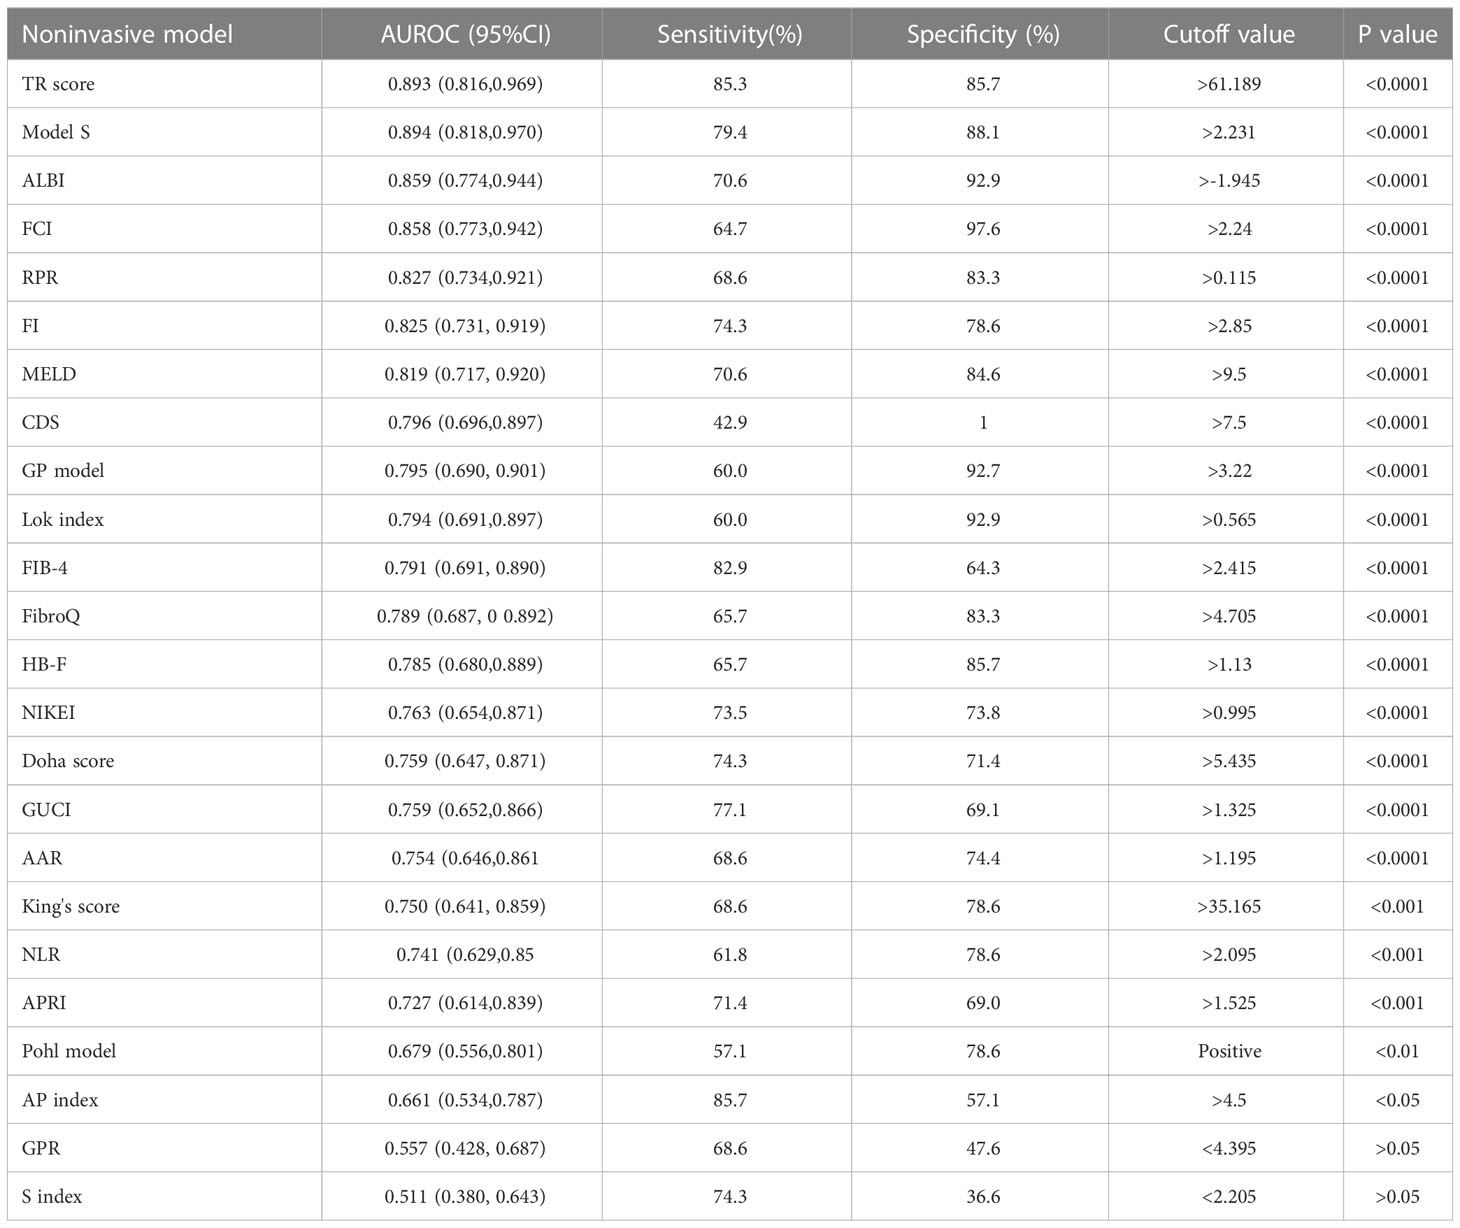
Table 6 Validity of each models for prediction of fibrosis and cirrhosis (S3-S4).
Patients in the model group were divided into stages 1-3 (S1-S3) and stage 4 (S4) according to pathological stages. The ROC of the TR score and Model S for predicting S4 was shown in Figure 2C, and the AUROC, sensitivity, specificity and cutoff value of each model were shown in Table 7. Many models showed well performance for the prediction of S4, with the AUROC of TR score, Model S, Lok index, FibroQ, RPR, HB-F, CDS, FI, FCI, ALBI and MELD over 0.9. The AUROC of TR score for prediction of cirrhosis (S4) in PBC was 0.921 (95%CI, 0.837-1.000), which had great predictive ability and ranked 7th among 24 models. The cutoff value of the TR score for predicting S4 is 97.465, and the sensitivity, specificity, PPV and NPV of the TR score is 90.9%, 88.9%, 76.9%, 96.0%, respectively.
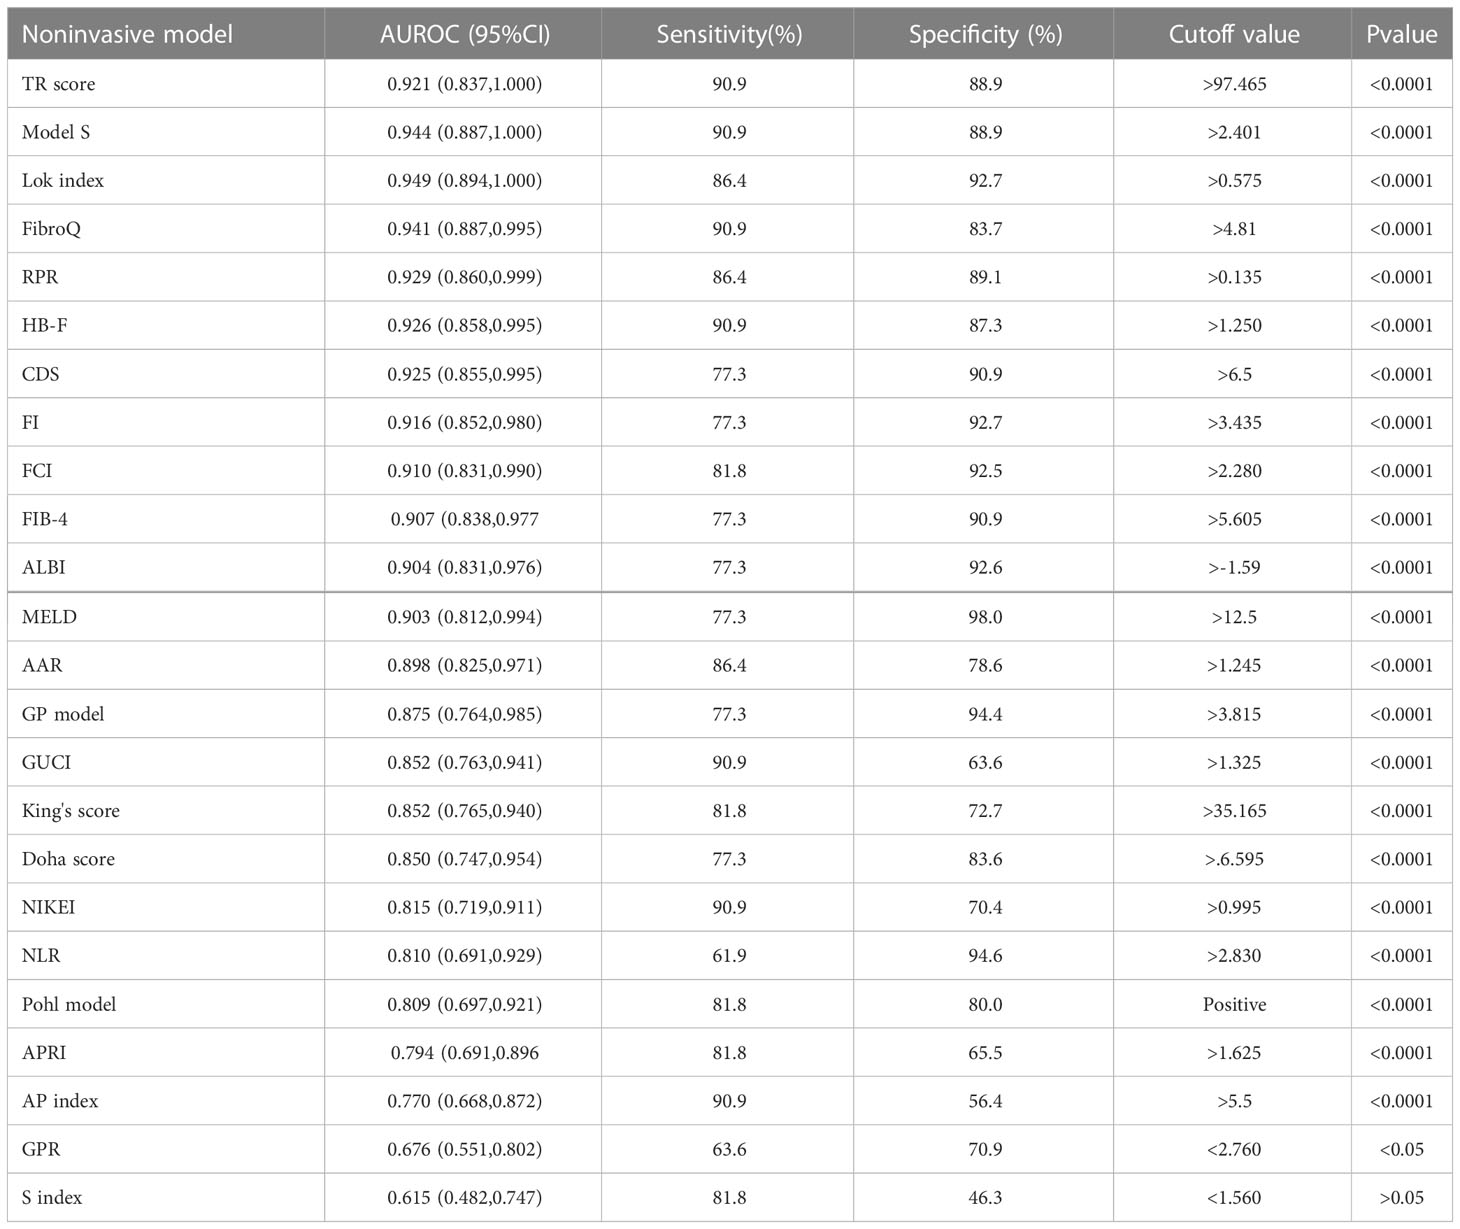
Table 7 Validity of each models for prediction of cirrhosis (S4).
In predicting S2-S4 (0.887 and 0.854), S3-S4 (0.893 and 0.894), and S4 (0.921 and 0.944), the AUC values of TR score and Model S were very close, and the sensitivity and specificity were close. In terms of calculation, TR score is simpler than Model S, and the diagnostic criteria of Model S are very close, while which of TR model span more, therefore, TR score is chosen as the final prediction model.
The ability of the TR score to predict the histological stage was analyzed in 36 patients in the validation group. TR score>23.923 was used as the diagnostic criteria for distinguishing histological manifestations of S2-S4, and the accuracy, sensitivity, specificity, PPV and NPV of the TR score were 72.2%, 80%, 54.5%, 83.3% and 54.5%, respectively. After the consistency test, the kappa value of the pathological gold standard was 0.345 (P<0.05). Using TR score>61.189 as the diagnostic criteria for distinguishing S3-S4, the consistency rate, sensitivity, specificity, specificity, PPV and NPV were 75.0%, 83.3%, 70.8%, 58.8% and 89.5%, respectively. The kappa was 0.491 (P<0.01). Using TR score>97.465 as the diagnostic criteria for distinguishing S4, the consistency rate, sensitivity, specificity, specificity, PPV and NPV were 80.6%, 77.8%, 81.5%,58.3% and 91.7%, respectively. The kappa was 0.533 (P<0.01).
PBC is a chronic cholestatic disease characterized by the destruction of intrahepatic bile ducts, leading to fibrosis and potential cirrhosis (34). Because of the high specificity of immunological markers, liver biopsy is not necessary for the diagnosis of PBC. However, when PBC-specific antibodies are negative or autoimmune hepatitis or nonalcoholic fatty liver disease is suspected, liver biopsy is still necessary (7). Advanced histological stages are closely related to poor curative effect and prognosis in patients with PBC (35–37). For patients with inadequate response to UDCA, dynamic monitoring of liver histological lesions is helpful to adjust the treatment plan in time (7). However, sampling errors, contraindications, poor compliance and economic conditions and complications including bleeding and death limit the implementation of liver biopsy (38). Most of the noninvasive models in clinical are used for the evaluation of viral or fatty liver disease, but few models are used in PBC, and most of the models are complex in the calculation, which is not convenient for clinical application. The aim of this study is to find a simple, easy and accurate noninvasive model for predicting the histological stages in PBC.
A total of 114 patients with PBC were included in this study, with a ratio of male to female of 1: 6.6. Compared with the previous understanding that the ratio was about 1:9, this result is closer to the recent epidemiological findings (1:5-1:6) (39, 40). This study shows that TBA and RDW are independent predictors of PBC histological stages and are helpful to distinguish patients with different stages. The imbalance between bile acid synthesis and metabolism in PBC leads to excessive accumulation of cytotoxic bile acids. Hydrophobic bile acid inhibits the expression of anion exchange protein 2 (AE2) by inducing oxidative stress and increases the expression of immune-related cell surface markers HLA-DR and CD40 on biliary epithelial cells (BECs); Down-regulation of AE2 activates soluble adenylyl cyclase, which makes BECs sensitive to apoptosis induced by bile salt (4, 41). RDW is measure of the variability of circulating red blood size and has previously played an important role in the differential diagnosis of anemia, with levels often increasing following ineffective red blood cell production (e.g. iron, vitamin B12 or folic acid deficiency), increased red blood cell destruction (e.g. hemolytic anemia) or after transfusion therapy (42). Elevated RDW levels are thought to be associated with acute and chronic heart failure, coronary artery disease, peripheral artery disease, end-stage renal disease, pulmonary hypertension, stroke, gram-negative bacteremia, alcoholic or non-alcoholic fatty liver disease, hepatitis B and all-cause mortality in adults (42–50). Elevated RDW levels in patients with liver disease may be associated with inflammatory states, impaired renal function, nutritional deficiencies, and increased erythrocyte destruction due to hypersplenism (48). This study also pointed out that there was no significant correlation between PBC histological stage with age, sex and neutrophil count. When the histological lesion progressed to S4, namely cirrhosis, the levels of AST, ALT, GGT and ALP decreased compared with those in the early stage.
To facilitate clinical calculation and application, a new noninvasive model was constructed by using the above two variables:
This study shows that the TR score is excellent in predicting the histological stages of PBC. When predicting early histological lesions (S1), the AUROC of TR score was 0.887 (95% CI, 0.809-0.965), which was higher than all of the other 22 models included in this study. In other models, FCI performed well in predicting the early stages of PBC, while the Pohl model had no significance. When predicting liver fibrosis and cirrhosis (S3-S4), the AUROC of TR score was 0.893 (95% CI, 0.816-0.969), which was also higher than that of the other 22 models. Among the other 22 models, ALBI also had a good predictive ability in addition to FCI, which supported the previous study that ALBI had a good prediction of the prognosis of PBC patients (11). When predicting cirrhosis (S4), most models have good prediction ability. Although the TR score does not show the best prediction ability compared with other models, its AUROC is still as high as 0.921 (95% CI, 0.837-1.000). It shows that the TR score has a great ability to predict the histology stages of PBC.
We analyzed the effectiveness of the TR score in another PBC cohort in the same center. When TR score ≤ 23.923 was used to predict early lesions, the specificity of the TR score was 80%, and the kappa value of the pathological gold standard was 0.345. When TR score > 61.189 was used to predict hepatic fibrosis and cirrhosis, the sensitivity (83.3%) and specificity (70.8%) of the TR score were higher, and the kappa value was 0.491. When TR score > 97.465 was used to predict liver cirrhosis, the sensitivity and specificity were 77.8% and 81.5%, and the kappa value was 0.533. In the validation group, although the TR score has a good ability to predict each histological stage, it is the most effective in predicting liver cirrhosis.
This study still has some limitations. This study is a retrospective study of a single center, so the included cases mainly represent the general manifestations of PBC patients in Northeast China. Further validation of the TR score at other centers is needed. More large-scale studies are needed to further refine the diagnostic criteria of the model and evaluate its ability to predict the prognosis of patients with PBC.
In summary, TBA and RDW are independent risk factors for advanced histological stages in PBC, and TR score has a great ability to predict the stage of histological. Compared with 22 existing noninvasive models, the TR score showed the highest AUROC in predicting early stage (S1) and hepatic fibrosis or cirrhosis (S3-S4), and excellent predictive ability in predicting cirrhosis (S4). The indexes included in the TRscore are easy to obtain, cheap and stable, without complex calculation formulas and tools, and show good accuracy in diagnosing the histological stages.
The original contributions presented in the study are included in the article/Supplementary Material. Further inquiries can be directed to the corresponding author.
The studies involving human participants were reviewed and approved by the Ethics Committee of the First Hospital of Jilin University. The patients/participants provided their written informed consent to participate in this study.
Conceptualization, QJin and XW; methodology, ZT and QJin; formal analysis, ZT, JH and YanW; data curation, YaoW, QJi, XC and YH; writing—original draft preparation, ZT; writing-review and editing, YangW, XW and QJin; supervision, QJin; funding acquisition, QJin All authors have read and agreed to the published version of the manuscript.
This research was funded by the National Natural Science Foundation of China (No.82170535) and the Program of Jilin Financial Department (No. JLSCZD2019-027).
The authors declare that the research was conducted in the absence of any commercial or financial relationships that could be construed as a potential conflict of interest.
All claims expressed in this article are solely those of the authors and do not necessarily represent those of their affiliated organizations, or those of the publisher, the editors and the reviewers. Any product that may be evaluated in this article, or claim that may be made by its manufacturer, is not guaranteed or endorsed by the publisher.
The Supplementary Material for this article can be found online at: https://www.frontiersin.org/articles/10.3389/fimmu.2023.1152294/full#supplementary-material
1. Lv T, Chen S, Li M, Zhang D, Kong Y, Jia J. Regional variation and temporal trend of primary biliary cholangitis epidemiology: A systematic review and meta-analysis. J Gastroenterol Hepatol (2021) 36(6):1423–34. doi: 10.1111/jgh.15329
2. Zeng N, Duan W, Chen S, Wu S, Ma H, Ou X. Epidemiology and clinical course of primary biliary cholangitis in the Asia-pacific region: A systematic review and meta-analysis. Hepatol Int (2019) 13(6):788–99. doi: 10.1007/s12072-019-09984-x
3. Carbone M, Milani C, Gerussi A, Ronca V, Cristoferi L, Invernizzi P. Primary biliary cholangitis: A multifaceted pathogenesis with potential therapeutic targets. J Hepatol (2020) 73(4):965–6. doi: 10.1016/j.jhep.2020.05.041
4. Gulamhusein AF, Hirschfield GM. Primary biliary cholangitis: Pathogenesis and therapeutic opportunities. Nat Rev Gastroenterol Hepatol (2020) 17(2):93–110. doi: 10.1038/s41575-019-0226-7
5. Lleo A, Leung PSC, Hirschfield GM, Gershwin EM. The pathogenesis of primary biliary cholangitis: A comprehensive review. Semin Liver Dis (2020) 40(1):34–48. doi: 10.1055/s-0039-1697617
6. Lindor KD, Bowlus CL, Boyer J, Levy C, Mayo M. Primary biliary cholangitis: 2018 practice guidance from the American association for the study of liver diseases. Hepatology (2019) 69(1):394–419. doi: 10.1002/hep.30145
7. European Association for the Study of the Liver, Electronic address, e.e.e, European Association for the Study of the Liver. EASL clinical practice guidelines: The diagnosis and management of patients with primary biliary cholangitis. J Hepatol (2017) 67(1):145–72. doi: 10.1016/j.jhep.2017.03.022
8. Rosen PP. Subareolar sclerosing duct hyperplasia of the breast. Cancer (1987) 59(11):1927–30. doi: 10.1002/1097-0142(19870601)59:11<1927::AID-CNCR2820591115>3.0.CO;2-U
10. Cristoferi L, Calvaruso V, Overi D, Vigano M, Rigamonti C, Degasperi E, et al. Accuracy of transient elastography in assessing fibrosis at diagnosis in naive patients with primary biliary cholangitis: A dual cut-off approach. Hepatology (2021) 74(3):1496–508. doi: 10.1002/hep.31810
11. Fujita K, Nomura T, Morishita A, Shi T, Oura K, Tani J, et al. Prediction of transplant-free survival through albumin-bilirubin score in primary biliary cholangitis. J Clin Med (2019) 8(8):1258. doi: 10.3390/jcm8081258
12. Trivedi PJ, Bruns T, Cheung A, Li KK, Kittler C, Kumagi T, et al. Optimising risk stratification in primary biliary cirrhosis: AST/platelet ratio index predicts outcome independent of ursodeoxycholic acid response. J Hepatol (2014) 60(6):1249–58. doi: 10.1016/j.jhep.2014.01.029
13. Avcioglu U, Eruzun H, Ustaoglu M. The gamma-glutamyl transferase to platelet ratio for noninvasive evaluation of liver fibrosis in patients with primary biliary cholangitis. Med (Baltimore) (2022) 101(40):e30626. doi: 10.1097/MD.0000000000030626
14. Yoo JJ, Cho EJ, Lee B, Kim SG, Kim YS, Lee YB, et al. Prognostic value of biochemical response models for primary biliary cholangitis and the additional role of the neutrophil-to-Lymphocyte ratio. Gut Liver (2018) 12(6):714–21. doi: 10.5009/gnl18271
15. Chen B, Ye B, Zhang J, Ying L, Chen Y. RDW to platelet ratio: A novel noninvasive index for predicting hepatic fibrosis and cirrhosis in chronic hepatitis b. PloS One (2013) 8(7):e68780. doi: 10.1371/journal.pone.0068780
16. Wang H, Xu H, Wang X, Wu R, Gao X, Jin Q, et al. Red blood cell distribution width to platelet ratio is related to histologic severity of primary biliary cirrhosis. Med (Baltimore) (2016) 95(11):e3114. doi: 10.1097/MD.0000000000003114
17. Williams AL, Hoofnagle JH. Ratio of serum aspartate to alanine aminotransferase in chronic hepatitis. relationship to cirrhosis. Gastroenterology (1988) 95(3):734–9. doi: 10.1016/s0016-5085(88)80022-2
18. Murillo Perez CF, Hirschfield GM, Corpechot C, Floreani A, Mayo MJ, Meer der van A, et al. Fibrosis stage is an independent predictor of outcome in primary biliary cholangitis despite biochemical treatment response. Aliment Pharmacol Ther (2019) 50(10):1127–36. doi: 10.1111/apt.15533
19. Sterling RK, Lissen E, Clumeck N, Sola R, Correa MC, Montaner J, et al. Development of a simple noninvasive index to predict significant fibrosis in patients with HIV/HCV coinfection. Hepatology (2006) 43(6):1317–25. doi: 10.1002/hep.21178
20. Cross TJ, Rizzi P, Berry PA, Bruce M, Portmann B, Harrison PM, et al, et al. King's score: an accurate marker of cirrhosis in chronic hepatitis c. Eur J Gastroenterol Hepatol (2009) 21(7):730–8. doi: 10.1097/MEG.0b013e32830dfcb3
21. Ahmad W, Ijaz B, Javed FT, Gull S, Kausar H, Sarwar MT, et al. A comparison of four fibrosis indexes in chronic HCV: Development of new fibrosis-cirrhosis index (FCI). BMC Gastroenterol (2011) 11:44. doi: 10.1186/1471-230X-11-44
22. Lok AS, Ghany MG, Goodman ZD, Wright EC, Everson GT, Sterling RK, et al. Predicting cirrhosis in patients with hepatitis c based on standard laboratory tests: Results of the HALT-c cohort. Hepatology (2005) 42(2):282–92. doi: 10.1002/hep.20772
23. Ohta T, Sakaguchi K, Fujioka Fujiwara S-i A, Iwasaki Y, Makino Y. Simple surrogate index of the fibrosis stage in chronic hepatitis c patients using platelet count and serum albumin level. Acta Med Okayama (2006) 60(2):77–84. doi: 10.18926/AMO/30729
24. Poynard T, Bedossa P. Age and platelet count: a simple index for predicting the presence of histological lesions in patients with antibodies to hepatitis c virus. METAVIR and CLINIVIR cooperative study groups. J Viral Hepatitis (1997) 4(3):199–208. doi: 10.1046/j.1365-2893.1997.00141.x
25. Bonacini M, Hadi G, Govindarajan S, Lindsay KL. Utility of a discriminant score for diagnosing advanced fibrosis or cirrhosis in patients with chronic hepatitis c virus infection. Am J Gastroenterol (1997) 92(8):1302–4.
26. Hsieh Y-Y, Tung SY, Lee IL, Lee K, Shen CH, Wei KL, et al. FibroQ: An easy and useful noninvasive test for predicting liver fibrosis in patients with chronic viral hepatitis. Chang Gung Med J (2009) 32(6):614–22.
27. Thandassery RB, Kaabi Al S, Soofi ME, Mohiuddin SA, John AK, Mohannadi Al M, et al. Mean platelet volume, red cell distribution width to platelet count ratio, globulin platelet index, and 16 other indirect noninvasive fibrosis scores: How much do routine blood tests tell about liver fibrosis in chronic hepatitis c? J Clin Gastroenterol (2016) 50(6):518–23. doi: 10.1097/MCG.0000000000000489
28. Liu XD, Wu JL, Liang J, Zhang T, Sheng QS. Globulin-platelet model predicts minimal fibrosis and cirrhosis in chronic hepatitis b virus infected patients. World J Gastroenterol (2012) 18(22):2784–92. doi: 10.3748/wjg.v18.i22.2784
29. Islam S, Antonsson L, Westin J, Lagging M. Cirrhosis in hepatitis c virus-infected patients can be excluded using an index of standard biochemical serum markers. Scand J Gastroenterol (2005) 40(7):867–72. doi: 10.1080/00365520510015674
30. Hsu C-W, Liang KH, Huang SF, Tsao KC, Yeh CT. Development of a non-invasive fibrosis test for chronic hepatitis b patients and comparison with other unpatented scores. BMC Res Notes (2013) 6:212. doi: 10.1186/1756-0500-6-212
31. Demir M, Lang S, Schlattjan M, Drebber U, Wedemeyer I, Nierhoff D, et al. NIKEI: A new inexpensive and non-invasive scoring system to exclude advanced fibrosis in patients with NAFLD. PloS One (2013) 8(3):e58360. doi: 10.1371/journal.pone.0058360
32. Pohl A, Behling C, Oliver D, Kilani M, Monson P, Hassanein T. Serum aminotransferase levels and platelet counts as predictors of degree of fibrosis in chronic hepatitis c virus infection. Am J Gastroenterol (2001) 96(11):3142–6. doi: 10.1111/j.1572-0241.2001.05268.x
33. Zhou K, Gao CF, Zhao YP, Liu HL, Zheng RD, Xian JC, et al. Simpler score of routine laboratory tests predicts liver fibrosis in patients with chronic hepatitis b. J Gastroenterol Hepatol (2010) 25(9):1569–77. doi: 10.1111/j.1440-1746.2010.06383.x
34. Carey EJ, Ali AH, Lindor KD. Primary biliary cirrhosis. Lancet (2015) 386(10003):1565–75. doi: 10.1016/S0140-6736(15)00154-3
35. Corpechot C, Abenavoli L, Rabahi N, Chretien Y, Andreani T, Johanet C, et al. Biochemical response to ursodeoxycholic acid and long-term prognosis in primary biliary cirrhosis. Hepatology (2008) 48(3):871–7. doi: 10.1002/hep.22428
36. Lammers WJ, Kowdley KV, van Buuren HR. Predicting outcome in primary biliary cirrhosis. Ann Hepatol (2014) 13(4):316–26. doi: 10.1016/S1665-2681(19)30838-5
37. Roll J, Boyer JL, Barry D, Klatskin G. The prognostic importance of clinical and histologic features in asymptomatic and symptomatic primary biliary cirrhosis. New Engl J Med (1983) 308(1):1–7. doi: 10.1056/NEJM198301063080101
38. Rockey DC, Caldwell SH, Goodman ZD, Nelson RC, Smith AD. Liver biopsy. Hepatology (2009) 49(3):1017–44. doi: 10.1002/hep.22742
39. Fan X, Wang T, Shen Y, Xi X, Yang L. Underestimated Male prevalence of primary biliary cholangitis in China: Results of a 16-yr cohort study involving 769 patients. Sci Rep (2017) 7(1):6560. doi: 10.1038/s41598-017-06807-7
40. Lleo A, Jepsen P, Morenghi E, Carbone M, Moroni L, Battezzati PM, et al. Evolving trends in female to Male incidence and Male mortality of primary biliary cholangitis. Sci Rep (2016) 6:25906. doi: 10.1038/srep25906
41. Lleo A, Wang GQ, Gershwin ME, Hirschfield GM. Primary biliary cholangitis. Lancet (2020) 396(10266):1915–26. doi: 10.1016/S0140-6736(20)31607-X
42. Felker GM, Allen LA, Pocock SJ, Shaw LK, McMurray JJ, Pfeffer MA, et al. Red cell distribution width as a novel prognostic marker in heart failure: Data from the CHARM program and the duke databank. J Am Coll Cardiol (2007) 50(1):40–7. doi: 10.1016/j.jacc.2007.02.067
43. van Kimmenade RR, Mohammed AA, Uthamalingam S, Meer der van P, Felker GM, Januzzi JL Jr. Red blood cell distribution width and 1-year mortality in acute heart failure. Eur J Heart Fail (2010) 12(2):129–36. doi: 10.1093/eurjhf/hfp179
44. Ye Z, Smith C, Kullo IJ. Usefulness of red cell distribution width to predict mortality in patients with peripheral artery disease. Am J Cardiol (2011) 107(8):1241–5. doi: 10.1016/j.amjcard.2010.12.023
45. Rhodes CJ, Howard LS, Busbridge M, Ashby D, Kondili E, Gibbs JSR, et al. Iron deficiency and raised hepcidin in idiopathic pulmonary arterial hypertension. J Am Coll Cardiol (2011) 58(3):300–9. doi: 10.1016/j.jacc.2011.02.057
46. Ani C, Ovbiagele B. Elevated red blood cell distribution width predicts mortality in persons with known stroke. J Neurol Sci (2009) 277(1-2):103–8. doi: 10.1016/j.jns.2008.10.024
47. Ku NS, Kim HW, Oh HJ, Kim YC, Kim MH, Song JE, et al. Red blood cell distribution width is an independent predictor of mortality in patients with gram-negative bacteremia. Shock (2012) 38(2):123–7. doi: 10.1097/SHK.0b013e31825e2a85
48. Hu Z, Sun Y, Wang Q, Han Z, Huang Y, Liu X, et al. Red blood cell distribution width is a potential prognostic index for liver disease. Clin Chem Lab Med (2013) 51(7):1403–8. doi: 10.1515/cclm-2012-0704
49. Chen PC, Sung FC, Chien KL, Hsu HC, Su TC, Lee YT. Red blood cell distribution width and risk of cardiovascular events and mortality in a community cohort in Taiwan. Am J Epidemiol (2010) 171(2):214–20. doi: 10.1093/aje/kwp360
Keywords: primary biliary cholangitis, noninvasive model, total bile acid, red blood cell distribution width, histological stage
Citation: Tu Z, Wang Y, Wang Y, Huang J, Han Y, Ji Q, Cao X, Wen X, Wang Y and Jin Q (2023) TR score: A noninvasive model to predict histological stages in patients with primary biliary cholangitis. Front. Immunol. 14:1152294. doi: 10.3389/fimmu.2023.1152294
Received: 27 January 2023; Accepted: 06 March 2023;
Published: 16 March 2023.
Edited by:
Ciro Romano, University of Campania Luigi Vanvitelli, ItalyReviewed by:
Atsumasa Komori, National Hospital Organization Nagasaki Medical Center, JapanCopyright © 2023 Tu, Wang, Wang, Huang, Han, Ji, Cao, Wen, Wang and Jin. This is an open-access article distributed under the terms of the Creative Commons Attribution License (CC BY). The use, distribution or reproduction in other forums is permitted, provided the original author(s) and the copyright owner(s) are credited and that the original publication in this journal is cited, in accordance with accepted academic practice. No use, distribution or reproduction is permitted which does not comply with these terms.
*Correspondence: Qinglong Jin, amlucWxAamx1LmVkdS5jbg==
Disclaimer: All claims expressed in this article are solely those of the authors and do not necessarily represent those of their affiliated organizations, or those of the publisher, the editors and the reviewers. Any product that may be evaluated in this article or claim that may be made by its manufacturer is not guaranteed or endorsed by the publisher.
Research integrity at Frontiers
Learn more about the work of our research integrity team to safeguard the quality of each article we publish.