 Hanxiao Cui
 Xueting Ren
 Luyao Dai
 Lidan Chang
 Dandan Liu
 Huafeng Kang
 Xiaobin Ma
- Department of Oncology, The Second Affiliated Hospital of Xi’an Jiaotong University, Xi’an, Shaanxi, China
Background: Breast cancer (BC) is the most common malignancy among women. Nicotinamide (NAM) metabolism regulates the development of multiple tumors. Herein, we sought to develop a NAM metabolism-related signature (NMRS) to make predictions of survival, tumor microenvironment (TME) and treatment efficacy in BC patients.
Methods: Transcriptional profiles and clinical data from The Cancer Genome Atlas (TCGA) were analyzed. NAM metabolism-related genes (NMRGs) were retrieved from the Molecular Signatures Database. Consensus clustering was performed on the NMRGs and the differentially expressed genes between different clusters were identified. Univariate Cox, Lasso, and multivariate Cox regression analyses were sequentially conducted to develop the NAM metabolism-related signature (NMRS), which was then validated in the International Cancer Genome Consortium (ICGC) database and Gene Expression Omnibus (GEO) single-cell RNA-seq data. Further studies, such as gene set enrichment analysis (GSEA), ESTIMATE, CIBERSORT, SubMap, and Immunophenoscore (IPS) algorithm, cancer-immunity cycle (CIC), tumor mutation burden (TMB), and drug sensitivity were performed to assess the TME and treatment response.
Results: We identified a 6-gene NMRS that was significantly associated with BC prognosis as an independent indicator. We performed risk stratification according to the NMRS and the low-risk group showed preferable clinical outcomes (P < 0.001). A comprehensive nomogram was developed and showed excellent predictive value for prognosis. GSEA demonstrated that the low-risk group was predominantly enriched in immune-associated pathways, whereas the high-risk group was enriched in cancer-related pathways. The ESTIMATE and CIBERSORT algorithms revealed that the low-risk group had a higher abundance of anti-tumor immunocyte infiltration (P < 0.05). Results of Submap, IPS, CIC, TMB, and external immunotherapy cohort (iMvigor210) analyses showed that the low-risk group were indicative of better immunotherapy response (P < 0.05).
Conclusions: The novel signature offers a promising way to evaluate the prognosis and treatment efficacy in BC patients, which may facilitate clinical practice and management.
1 Introduction
Breast cancer (BC) is the most frequent malignancy in women, and its incidence rate increases by 0.5% annually (1, 2). In 2020, BC overtook lung cancer as the leading cause of cancer-related morbidity worldwide. In addition, it ranks fifth among global cancer-related deaths and places a great burden on society (3). Clinically, BC can be divided into four primary subtypes (4). Based on subtype classification, BC has distinct therapeutic strategies, including surgical intervention, radiotherapy, chemotherapy, endocrine therapy, and targeted therapy (5–7). However, after conventional treatment, approximately 25% BC patients develop distant metastases (8). In recent years, tremendous advances have been achieved in systemic treatment, and the long-term survival probability of BC patients has clearly improved. Immunotherapy is an emerging field in the management of BC, and multiple research has revealed that the immune system plays an indispensable role in the occurrence and development of BC (9). Previous studies have demonstrated that checkpoint inhibitors targeting programmed cell death-1/programmed death ligand-1 (PD-1/PD-L1) can effectively improve clinical outcomes in patients with advanced BC (10–12). Additionally, novel therapeutic strategies, including targeting myeloid-derived suppressive cells and regulatory T cells (Tregs), have attracted the attention of researchers (13, 14). However, currently, approximately 80% of patients fail to respond to these treatments due to tumor heterogeneity. Therefore, it is significant to explore the molecular characteristics of BC and identify biomarkers that can precisely predict its response to immunotherapy.
Metabolic reprogramming is an important hallmark of cancer that modulates energy metabolism in the tumor microenvironment, thus leading to the uncontrolled growth of cancer cells (15, 16). Recent studies have revealed that metformin, a widely used first-line drug for type II diabetes, has good efficacy against a variety of malignancies, including breast cancer (17). Therefore, we speculated that regulation of metabolism could be a promising strategy for tumor treatment. Nicotinamide (NAM) is the active amide form of vitamin B3 (18). It can be supplemented externally or synthesized in vivo. NAM is easily absorbed by various cells and serves as a precursor for the coenzyme nicotinamide adenine dinucleotide (NAD+). As an important enzyme in biological redox reactions, NAD+ participates in cellular energy metabolism and signal transduction, including the tricarboxylic acid cycle, DNA damage repair, and epigenetic regulation (19, 20). Previous studies have demonstrated that NAM supplementation effectively delayed aging (21). Senescence and cancer are interconnected. The reduction in NAD+ during cell senescence leads to an increase in reactive oxygen species (ROS), thus promoting the accumulation of hypoxia-inducible factor-1α, resulting in metabolic reprogramming. Based on these findings, researchers have begun to explore the antitumor potential of NAM. Previous studies have observed that NAM enhanced tumor blood flow and ameliorated the tumor hypoxia microenvironment, thus improving sensitivity to radiotherapy (22). Phase II trials in head and neck cancer and advanced bladder carcinoma have demonstrated the efficacy and safety of NAM as a radiosensitizer for radiotherapy (23, 24). In chronic lymphocytic leukemia, NAM exerted anticancer effects by inducing apoptosis via activation of the p53/miR-34a/SIRT1 pathway (25). In triple-negative BC, NAM regulated lipid metabolism and strengthened ROS-induced apoptosis-related pathways, thereby inhibiting tumor proliferation and invasion (18). Nicotinamide phosphoribosyl transferase (NAMPT), a key enzyme in NAD+ salvage synthesis, catalyzes NAM to generate nicotinamide mononucleotide (NMN) and is the initiating factor in the immunosuppressive microenvironment (26–28). In some tumors, NAMPT was found to drive PD-L1 expression and regulate tumor immune escape in a CD8+ T cell-dependent manner (20, 29). Based on these findings, we recognized the significance and predictive potential of NAM metabolism in tumor prognosis and immunity.
Therefore, in this study, we developed a six-gene NMRS using RNA-seq and clinical data from the TCGA database. Subsequently, we evaluated the predictive ability of the model for survival outcomes, immunotherapy response, and immune landscape. Moreover, we verified the expression of the gene signature at the transcriptional level through single-cell sequencing data (scRNA-seq).
2 Materials and methods
2.1 Data gathering
We collected RNA-seq data of 1057 BC samples and 111 adjacent normal samples from TCGA database (https://portal.gdc.cancer.gov/). TPM-formatted files for gene expression were acquired. The term TPM, which referred to transcripts per kilobase of exon model per million reads, indicated that it was successively normalized by the gene length and sequencing depth. Clinical data were obtained, including age, TNM stage, expression status of ER, PR, and HER-2, survival time and survival status. The prognostic prediction capacity of NMRS was verified using an external cohort made up of 98 BC samples that was retrieved from the ICGC database (https://dcc.icgc.org). Additionally, the IMvigor210 cohort, which included 298 advanced urothelial carcinomas with immunotherapy data, was obtained from the ‘IMvigor210CoreBiologies’ R package to predict therapeutic response (30). Moreover, scRNA-seq data (GSE118389) of 1534 BC cells were acquired from the GEO database (http://www.ncbi.nlm.nih.gov/geo) to validate the expression levels of the model genes in different cellular subtypes. The Molecular Signatures Database (MSigDB) was searched for two gene sets associated with NAM metabolism that were used in this investigation. The flow of the analyses is presented in Figures 1, S1.
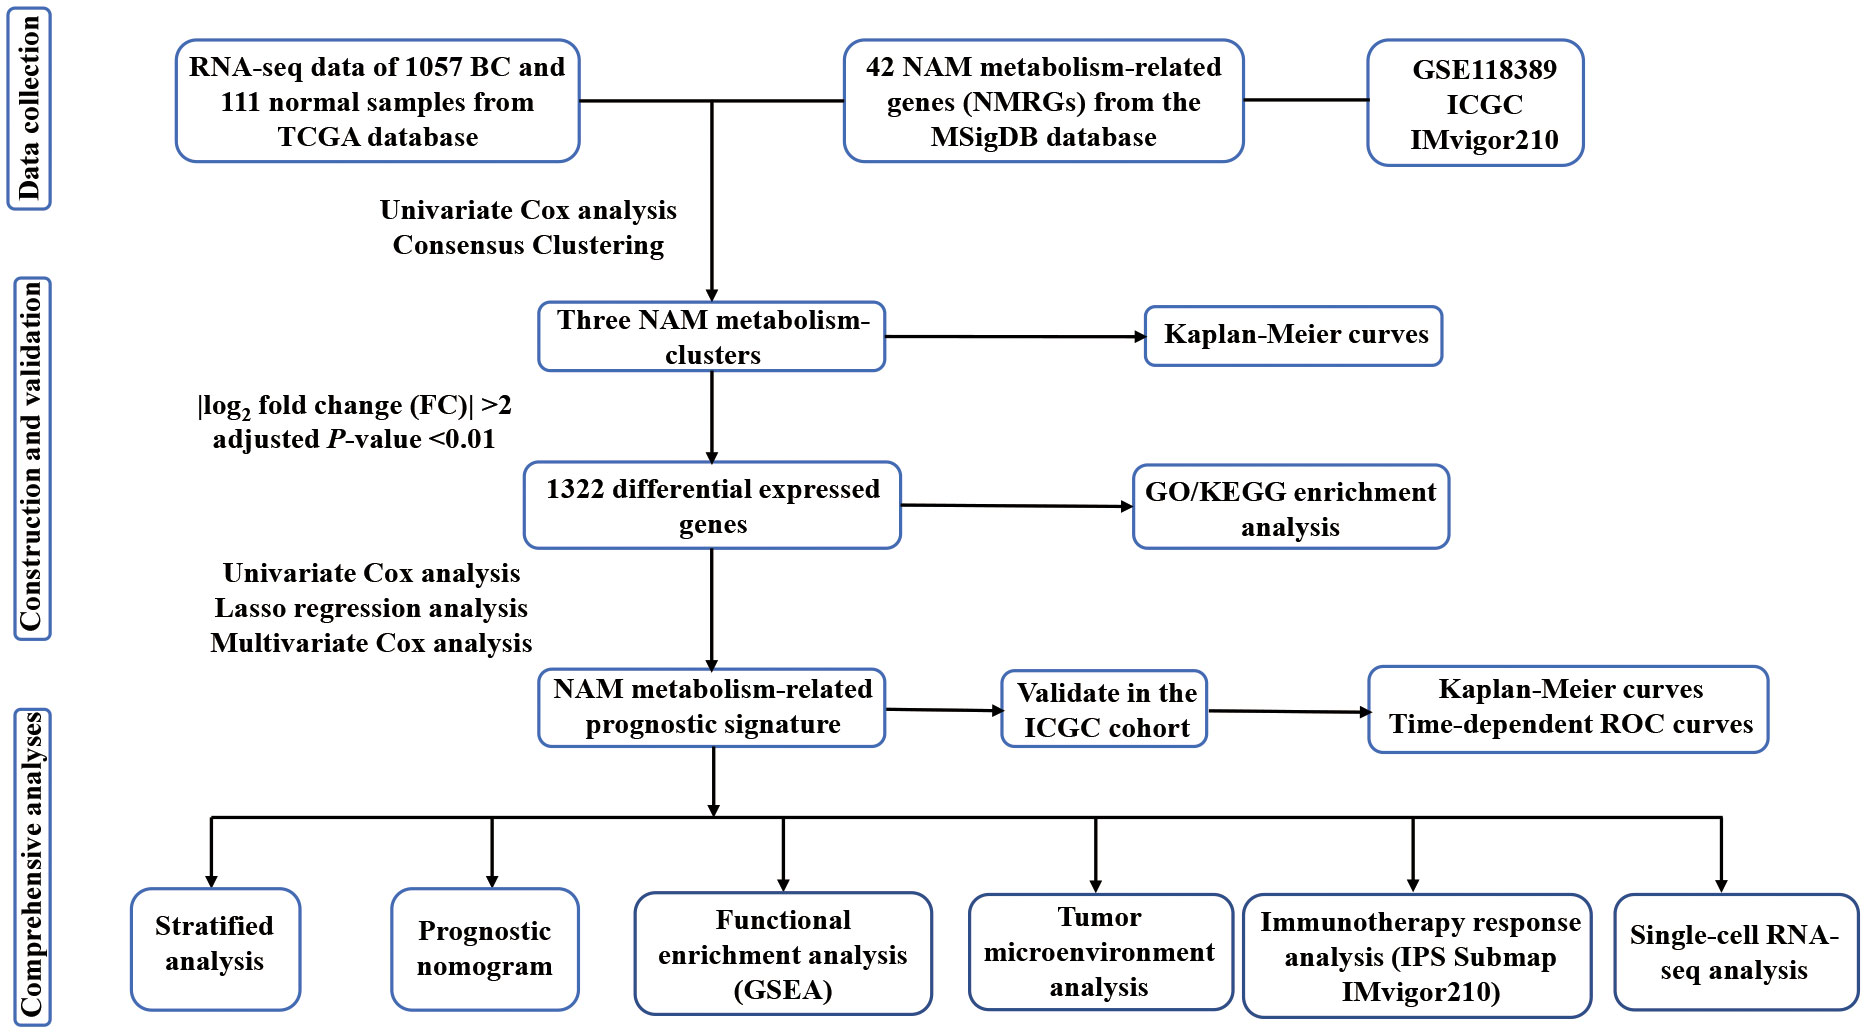
Figure 1 The flow chart of the study.
2.2 Mutation landscape of NMRGs
Somatic mutation profiles were collected from TCGA database in the maf’ format. Using the ‘maftools’ R package, we plotted a waterfall diagram to visualize the mutation landscape of patients with BC. In addition, we obtained copy number variation (CNV) data from the UCSC Xena database (https://xena.ucsc.edu/) and analyzed the CNV frequency of the NMRGs.
2.3 Consensus clustering of the NMRGs
We utilized the ‘ConsensusClusterPlus’ R package to perform consensus clustering and identified distinct NAM metabolism-related clusters based on the expression level of the NMRGs (31). The cluster number (k) was set between 2 and 10, and the optimum k value was selected according to the cumulative distribution function. We evaluated the different clustering results and duplicated this procedure 1000 times to ensure stability and reliability. Furthermore, we used the ‘survminer’ R package to visualize the survival variations between different clusters.
2.4 Identification and enrichment analysis of the differentially expressed genes
Using the ‘limma’ package, differentially expressed genes (DEGs) were determined among different clusters. The screening criteria were |log2 fold change (FC)| more than 2 and an adjusted P-value of less than 0.01. Then, using the ‘clusterProfiler’ R package, Gene Ontology (GO) and Kyoto Encyclopedia of Genes and Genomes (KEGG) enrichment analyses for pathway and function annotations were conducted (32).
2.5 Development and validation of the NMRS
To derive the prognostic DEGs, a univariate Cox analysis was performed. After that, we ran a Lasso regression with a minimum penalty coefficient to avoid overfitting (33). We then conducted multivariate Cox analysis to identify the optimal independent predictive signature. The expression level and corresponding coefficient of each prognostic gene were used to calculate the risk score of BC patients: risk score = h0 (t)*exp[Σexpression*coefficient]. Based on the median cutoff value, we separated patients with BC into distinct risk groups for subsequent analyses. For the training, internal validation, entire TCGA and ICGC cohorts, survival curves were used to explore the ability of NMRS to differentiate prognosis between different risk groups. Similarly, the time-dependent receiver operating characteristic (ROC) curve was used to evaluate the reliability of the signature using the ‘timeROC’ package. Furthermore, we performed stratified analysis to assess the prognostic value of NMRS in distinct subgroups stratified by clinical characteristics.
2.6 Development and assessment of the NAM metabolism-related nomogram
We performed univariate and multivariate Cox regression of the 6-gene signature and clinical indicators to determine independent prognostic factors. Based on the independent predictors, we developed a nomogram to quantify the 3-, 5-, and 10-year survival probabilities of patients with BC. The consistency and accuracy of the nomogram were assessed using calibration and time-dependent ROC curves. Additionally, by using decision curve analysis (DCA), we evaluated the net benefit of the comprehensive nomogram versus the model that only included clinical variables.
2.7 Functional enrichment analysis
With the use of the annotated gene set ‘c2.cp.kegg.v7.5.1. symbols.gmt’ from the MSigDB database, we conducted gene set enrichment analysis (GSEA) to identify the variations in corresponding pathways between different risk groups (P < 0.05, false discovery rate (FDR) < 0.25) (34).
2.8 Identification of the immune landscape and immunotherapy efficacy
The ESTIMATE algorithm was used to evaluate the tumor purity, immune score, stromal score and ESTIMATE score (35). According to the ‘CIBERSORT’ algorithm, LM22 gene signature matrix was employed to measure the relative proportion of 22 immunocytes per sample under 1000 permutations (36–38). The relative infiltration of 28 immunocyte subpopulations in BC TME were quantified by single-sample gene set enrichment (ssGSEA) (39). The expression levels of a few checkpoint genes, the prevalence of tumor mutations, the score of the cancer-immunity cycle (CIC) and immunotherapy-related signals were then compared in different risk groups. Immunophenoscore (IPS) refers to the four major gene categories that determine immunogenicity, and is obtained by unbiased analysis using machine learning (40). Existing studies have confirmed that the IPS can be used as a predictive tool for the clinical outcomes of immunotherapy (41, 42). In this study, using IPS data from The Cancer Immunome Atlas (TCIA) (https://tcia.at/home), we evaluated the potential immunotherapy response between the high- and low-risk group. Additionally, the Submap algorithm (http://cloud.genepattern.org/gp) was applied to predict how the risk groups would react to anti-PD-1 and anti-Cytotoxic T-Lymphocyte Associated Antigen 4 (CTLA-4) therapy (43). To further evaluate the predictability of the NMRS for responsiveness to anti-PD-1 therapy, we downloaded the corresponding immunotherapy data and clinical information from the ‘IMvigor210CoreBiologies’ package for analysis.
2.9 Comparisons of drug sensitivity
Half-maximal inhibitory concentration (IC50) values for the most commonly used chemotherapeutic medicines were calculated using the ‘pRRophetic’ R package. The drug sensitivity of one risk group was compared to the other, and any statistically significant differences were tested using the Wilcox test (44, 45).
2.10 Validation of the 6-gene signature using scRNA-seq analysis
To further discriminate the cellular subtypes and illustrate the distribution of the model genes in various subtypes, we acquired an scRNA-seq cohort (GSE118389) from the GEO database for analysis. The ‘Seurat’ R package was used to convert the matrix into Seurat object and carry out strict quality control (46). The data were normalized and principal component analysis (PCA) was performed for genes with large coefficients of variation. Then, using the ‘SingleR’ package, t-distributed statistical neighbor embedding (tSNE) and subtype annotations were carried out to determine the model gene expression levels and internal relationships (47).
2.11 Statistical analyses
All statistical calculations and graphs were completed using R software 4.2.1. With the use of Kaplan-Meier curves and log-rank test, survival disparities between distinct risk groups were examined. In addition, we utilized the Wilcox test to evaluate the divergency between two sets of data. As a statistical threshold, a two-sided P-value <0.05 was used.
3 Results
3.1 Genomic and transcriptomic landscape of NMRGs
Based on the two NAM metabolism-related gene sets, we identified 42 NMRG (Table S1). In the genetic variation analysis, 105 (11.12%) of the 944 samples showed mutations, of which missense mutations were the most common (Figure 2A). The top three mutant NMRGs were Homo sapiens aldehyde oxidase 1 (AOX1), poly (ADPribose) polymerase family, member 14 (PARP14) and Homo sapiens poly (ADP-ribose) polymerase family, member 9 (PARP9). In addition, we analyzed the frequency of CNV in the NMRGs and observed that both amplification and loss of the copy number were frequent (Figure 2B). The differential analysis results demonstrated that, compared with the adjacent normal samples from TCGA database, there were 13 upregulated and 21 downregulated genes (P < 0.05) (Figure 2C and Table S2).
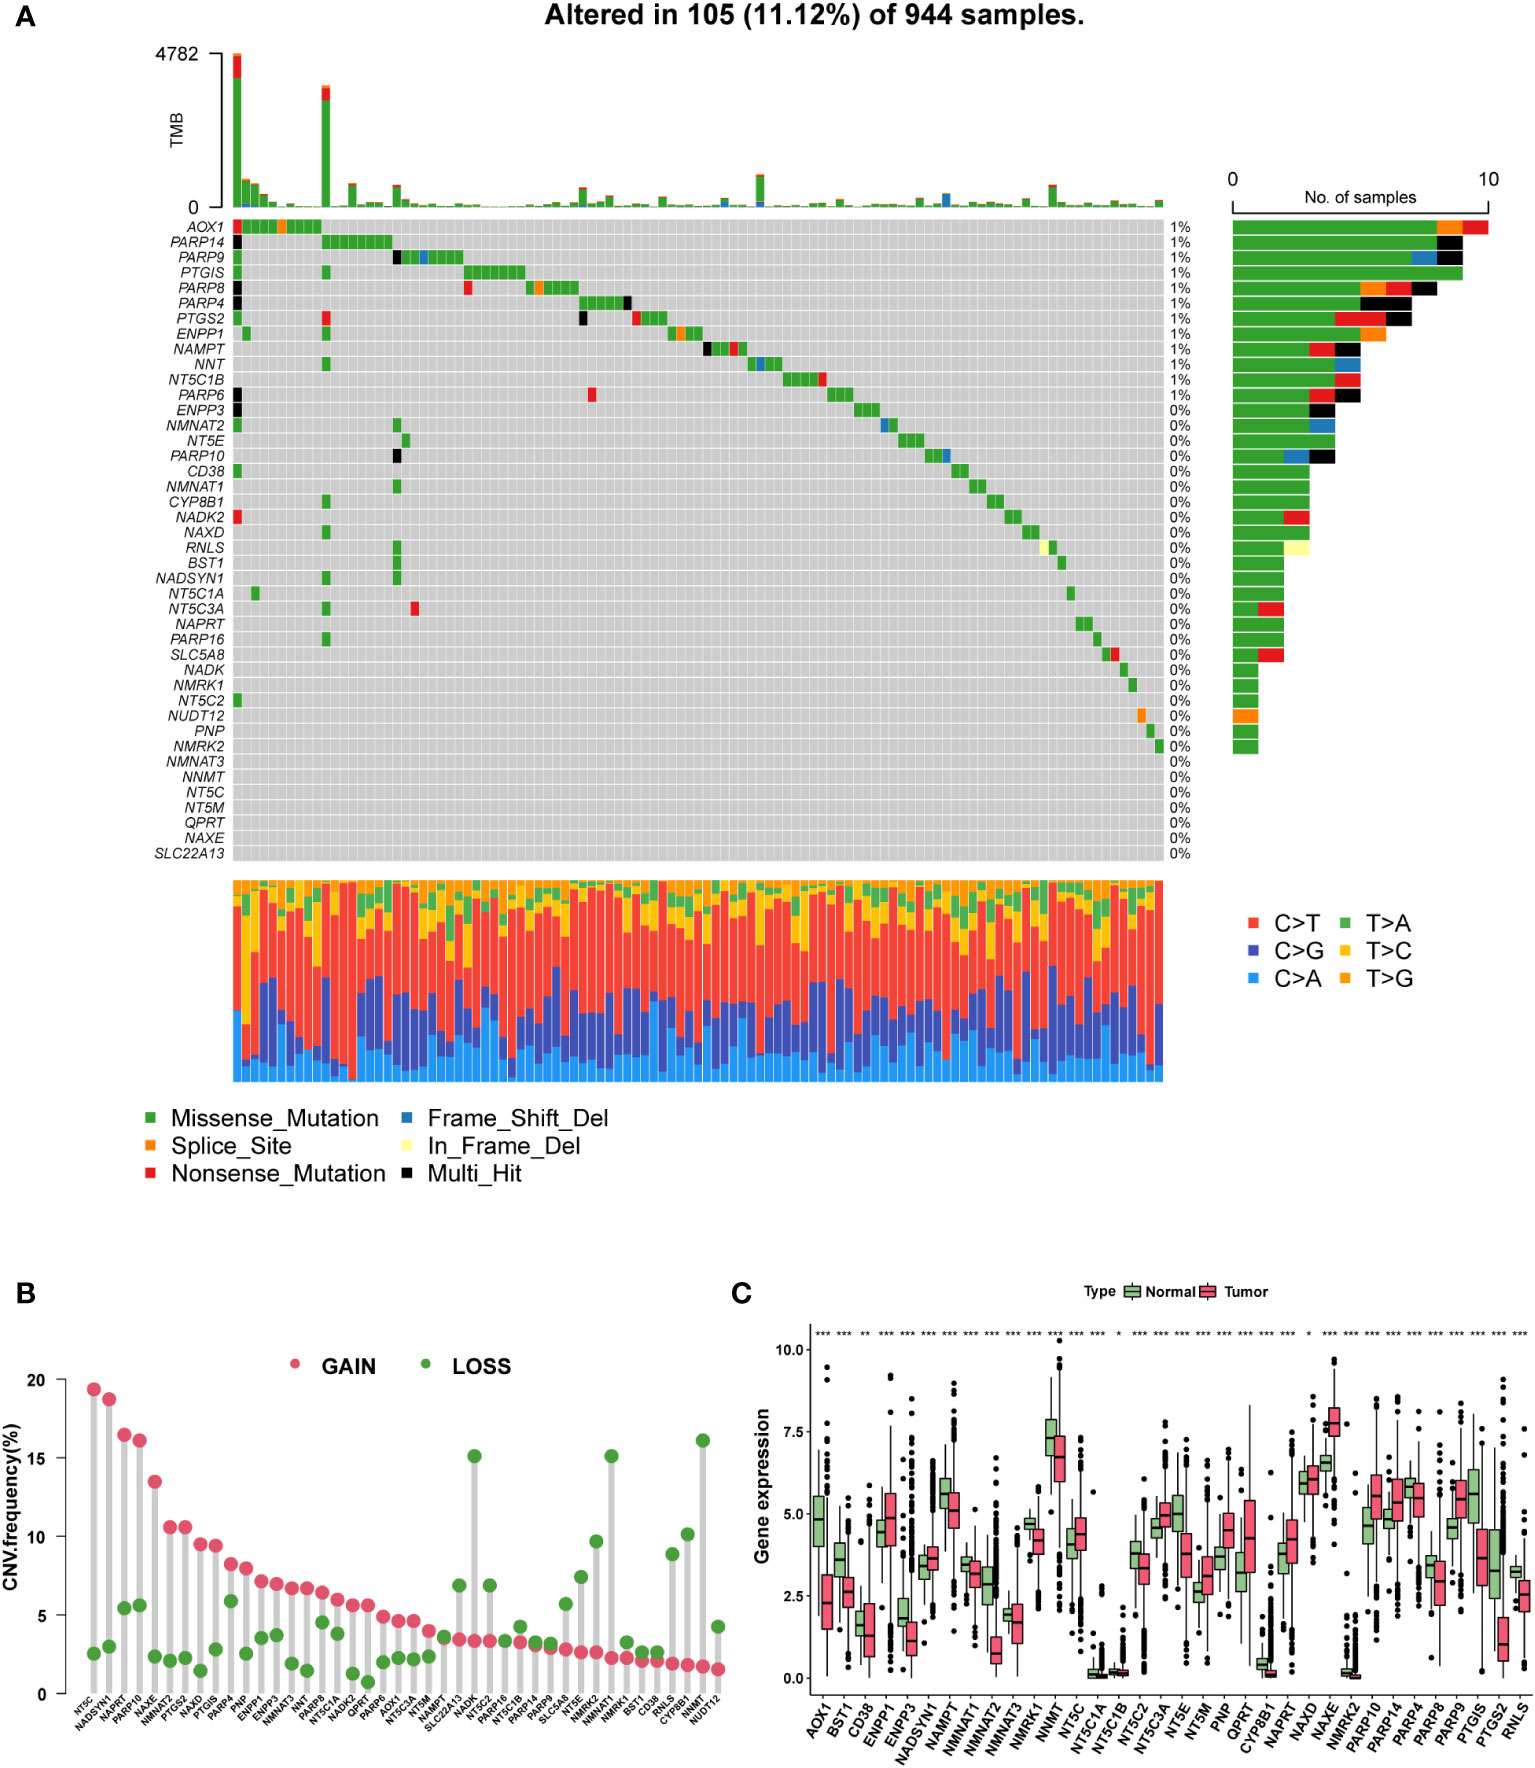
Figure 2 The genomic and transcriptomic landscape of NMRGs. (A) The mutation landscape of NMRGs in the TCGA database. (B) The CNV frequency of NMRGs. (C) The differential expression of NMRGs in BC between tumor and adjacent normal tissues (* p<0.05, ** p<0.01, *** p<0.001).
3.2 Consensus clustering analysis based on NMRGs
Consensus clustering was performed to identify the NAM metabolism-related clusters based on the expression levels of NMRGs. According to the cumulative distribution function, k = 3 exhibited excellent clustering resilience, with relatively strong intra-cluster correlation and low inter-cluster correlation (Figures 3A–C). As a result, patients were separated into three clusters: 168 patients placed in cluster A, 575 in cluster B, and 275 in cluster C. We observed that patients in cluster C had prolonged overall survival (Figure 3D, P = 0.021). Considering the significant differences in transcriptome levels and survival outcomes among the distinct clusters, we speculated about the presence of DEGs. According to the screening standard, we collected 1322 DEGs and then ran functional enrichment analysis on the DEGs. GO analysis enriched DEGs from three categories: biological processes (BPs), cellular components (CCs), and molecular functions (MFs). BPs were mainly enriched in ameboidal-type cell migration, cell-substrate adhesion, and regulation of angiogenesis. CCs were mainly enriched in cell-substrate junctions, focal adhesions, and cell-cell junctions. Additionally, the significantly enriched MFs were extracellular matrix structural constituents, integrin binding, and growth factor binding (Figure 3E). Results of the KEGG enrichment analysis showed that the DEGs were predominantly enriched in focal adhesion, the MAPK signaling pathway, and regulation of the actin cytoskeleton (Figure 3F). These findings suggested that the DEGs were involved in signaling pathway modulation and tumor growth.
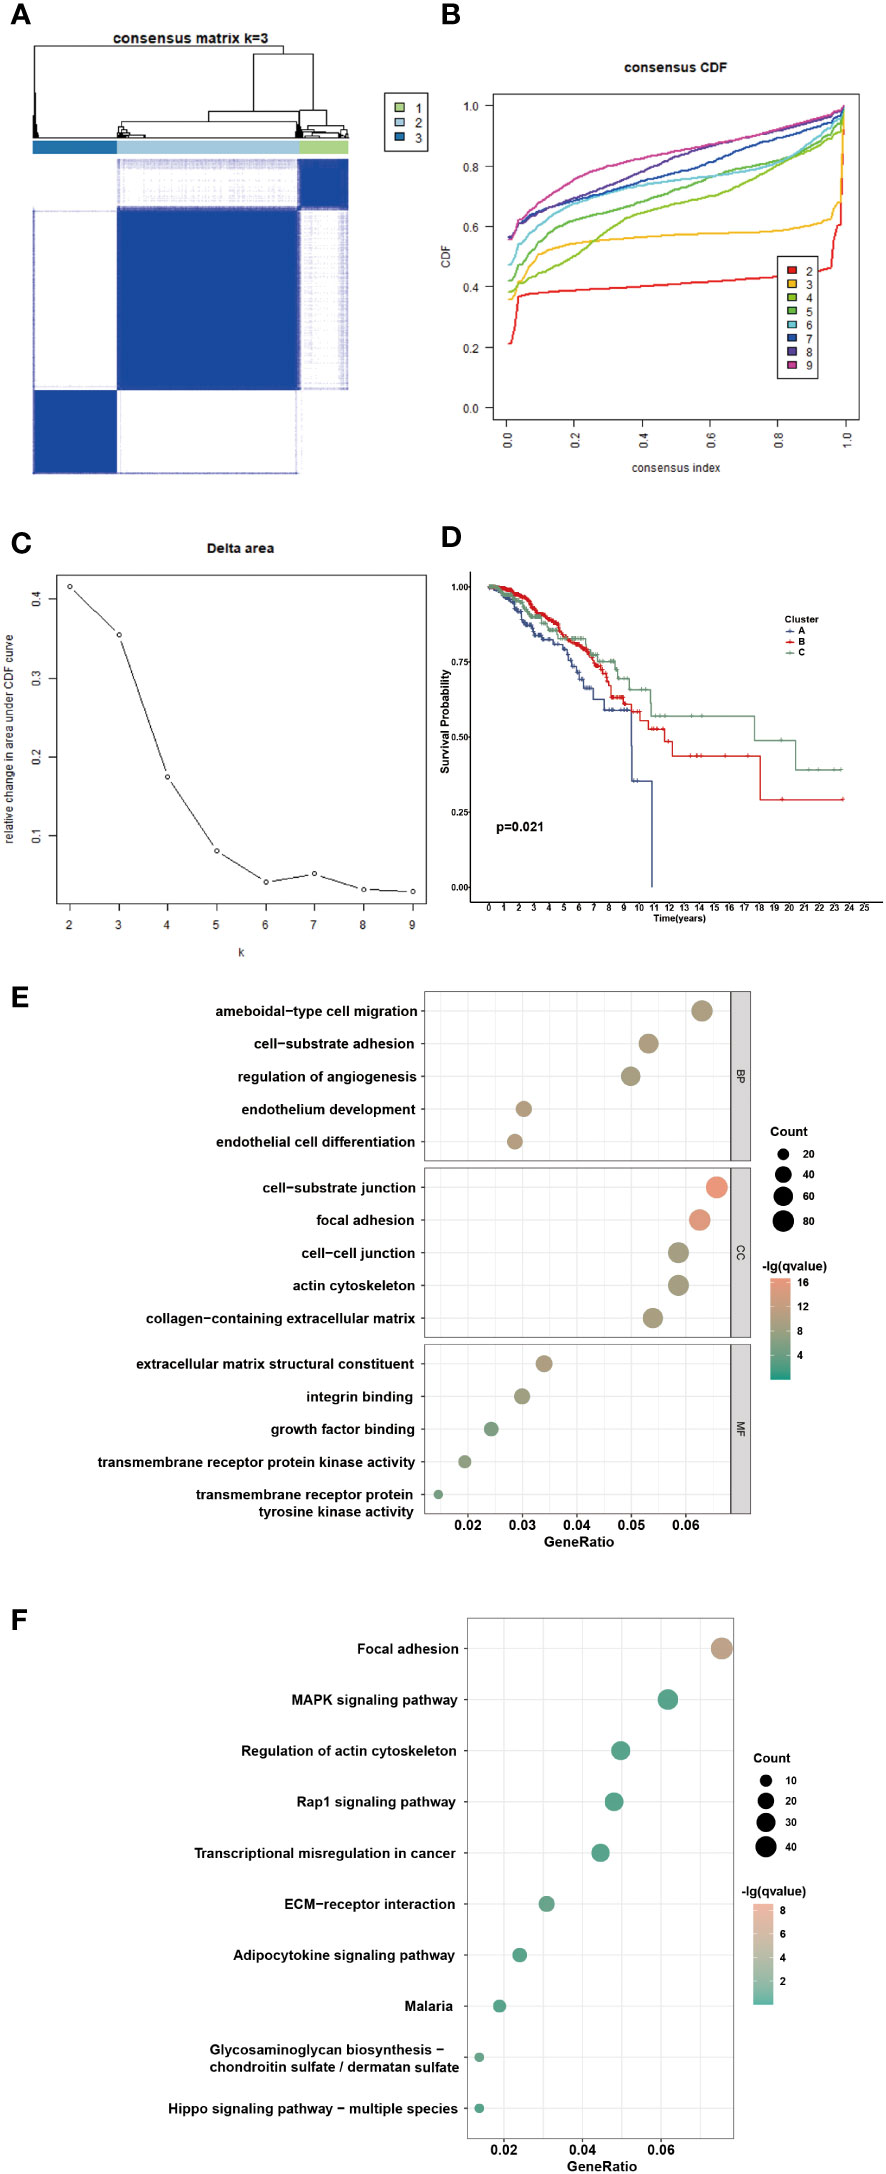
Figure 3 Identification of potential NAM metabolism-related clusters in BC patients. (A) The consensus clustering analysis of NMRGs in TCGA-BRCA cohort (k=3). (B) Consensus CDF. (C) Delta area. (D) The OS Kaplan-Meier curve of different clusters. (E-F) GO and KEGG enrichment analysis of differential expressed genes.
3.3 Development and validation of the NAM metabolism-related prognostic signature
Through univariate Cox analysis, we identified genes significantly associated with survival in patients with BC. Lasso regression demonstrated that the cross-validation effect was best when λ = -3.5, and relevant genes were included in the multivariate Cox analysis (Figures 4A, B). Finally, a NAM metabolism-related 6-gene signature was created to predict prognosis. The following equation was developed to calculate the risk scores based on gene expression levels and the regression coefficient: risk score = h0 exp [(0.002 × SFRP4) + (0.021 × KLB) + (0.051 × ZMAT3) – (0.022 × CNOT10) + (0.011 × C8orf55) – (0.008 × PSME2)]. Patients in the TCGA-BRCA cohort had their individual risk scores determined, and based on the median value, they were assigned to different risk groups. The survival curve showed that the low-risk group had a favorable OS compared with the patients in the high-risk group (Figure 4C, P < 0.001). The distribution of risk score, clinical outcomes, and model gene expression patterns between the two risk groups was displayed in Figure 4D. Among TCGA cohort, the AUC values for the predicted survival rates at 3-, 5-, and 10-year were 0.723, 0.726, and 0.770, respectively, demonstrating the robust prognostic power of the signature (Figure 4E). Compared with some existing BC biomarkers, our gene signature had better predictive performance with higher AUC and c-index values (Figures 4F–I) (48–50). Using a BC cohort from the ICGC database, we performed external validation to further confirm the predictive capacity of the NMRS. Based on the risk score calculation formula, 98 patients in the ICGC cohort were divided into high- (n = 49) and low-risk (n = 49) groups according to the median value. The KM survival curve showed that the survival of the high-risk group was significantly poorer than that of the low-risk group (Figure 4J, P = 0.031). Moreover, the AUC value of the 5-year OS in the external testing cohort was 0.762 (Figure 4K).
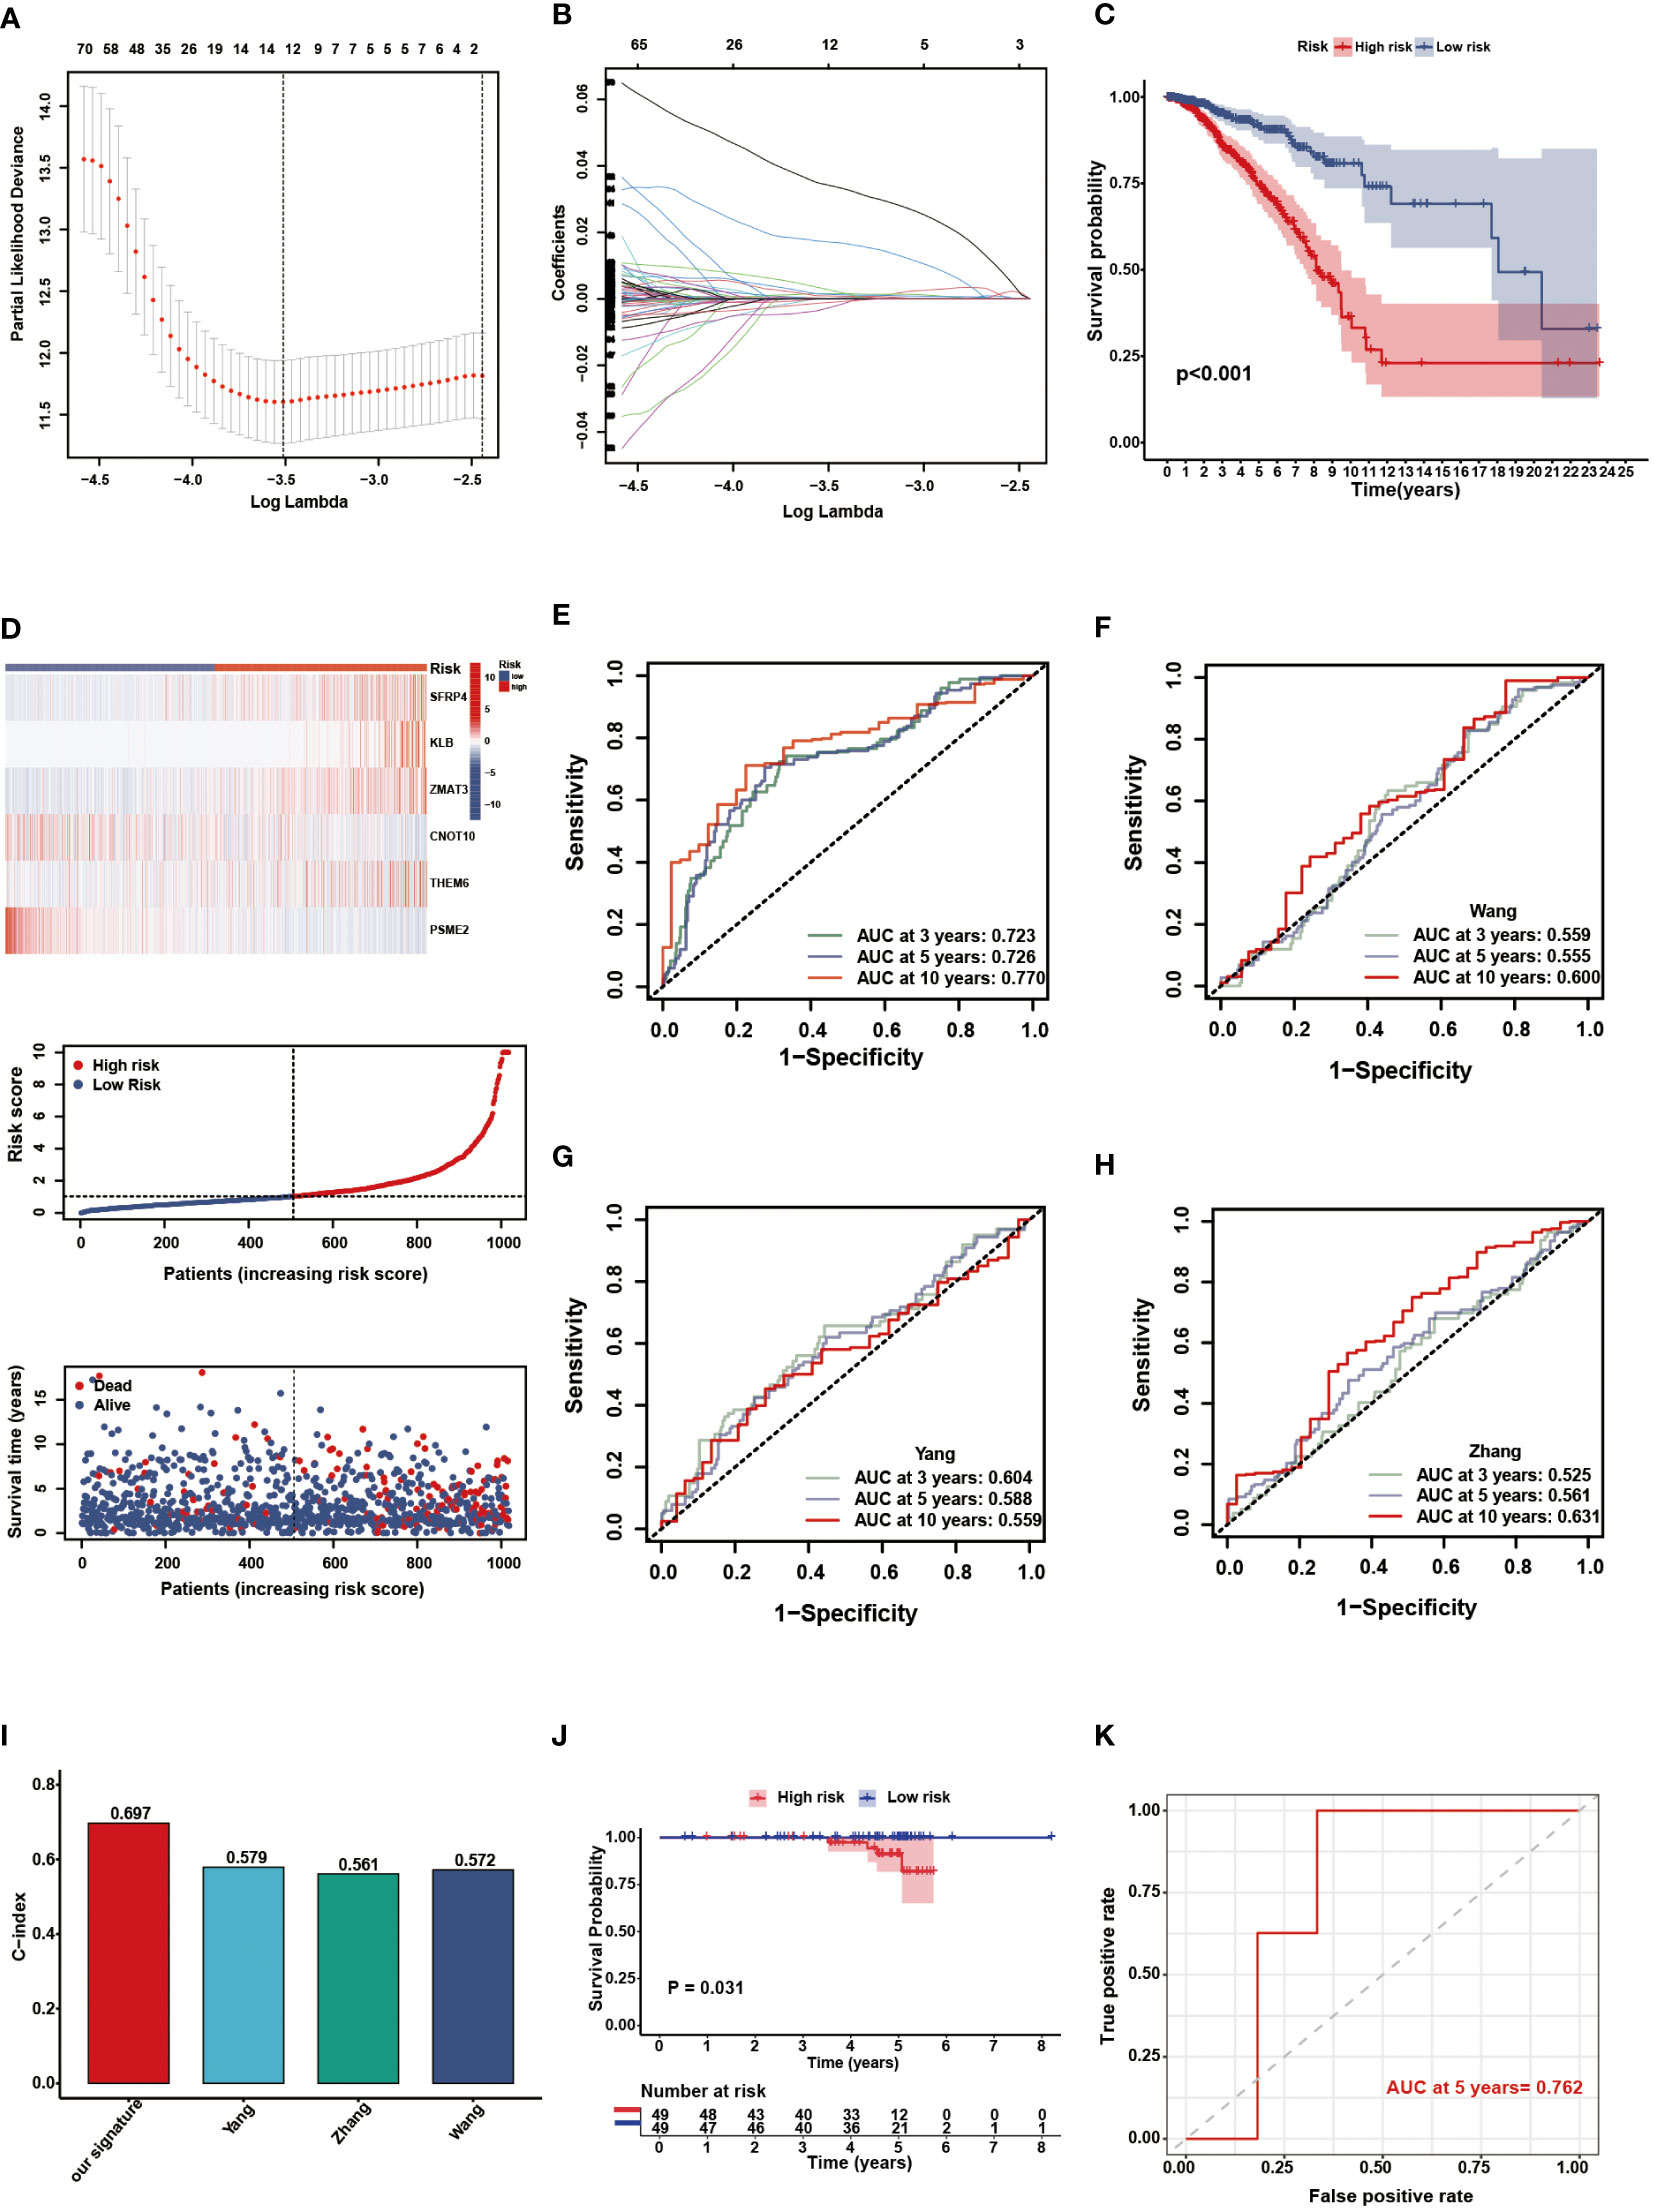
Figure 4 Construction and validation of the NMRS. (A) Cross validation method to select optimal genes. (B) The Lasso coefficient profiles. (C) The OS KM curves between high- and low-risk groups in the TCGA-BRCA cohort. (D) The model genes, risk score and clinical outcomes in the two risk groups. (E) The time-dependent ROC curves of the NMRS. (F-H) The time-dependent ROC curves of Wang’s, Yang’s and Zhang’s gene signature. (I) C-idex of our signature, Wang’s, Yang’s and Zhang’s signature. (J) The OS KM curves between high- and low-risk groups in the ICGC cohort. (K) The time-dependent ROC curves of the NMRS in the ICGC cohort.
3.4 Stratified analysis and establishment of a NAM metabolism-based nomogram
To further verify the prognostic value of the signature in subgroups with distinct clinical features, we conducted a stratified analysis. Based on age, pathological stage, TNM stage, and ER, PR, and HER-2 status, we divided patients into different subgroups and performed survival analysis. Figures 5A–H showed the distribution characteristics of the different risk groups in each subgroup. The results showed that, consistent with the observation in the entire cohort, the low-risk group had better clinical outcomes in all subgroups except in the M1 stage (Figures 6A–P). Additionally, significant clinicopathological indicators and the gene signature were subjected to the univariate and multivariate Cox analyses. In the univariate regression analysis, we observed that age (HR: 1.050, 95% confidence interval (CI):1.030– 1.070, P < 0.001), stage (2.588, 1.594–4.204, P < 0.001), HER-2 status (1.731, 1.032–2.903, 0.037), and risk score (0.305, 0.174–0.535, P < 0.001) were significantly related to BC prognosis (Figure 7A). After adjusting for potential bias using multivariate regression analysis, age (1.048, 1.028–1.068, P < 0.001), stage (2.714, 1.649–4.469, P < 0.001), and risk score (0.319, 0.181–0.563, P < 0.001) were found to be independent predictors (Figure 7B). Based on the independent prognostic factors, a comprehensive nomogram was developed to make quantitative predictions of the 3-, 5-, and 10-year OS probabilities in patients with BC (Figure 7C). The AUC values were 0.806, 0.766, and 0.723 at 3, 5, and 10-years, respectively, indicating that the nomogram could provide accurate predictions (Figure 7D). The calibration curves demonstrated a high consistency between the predicted and actual OS (Figure 7E). The clinical applicability of the nomogram was examined using the DCA curve (51). Compared to the model with clinical characteristics only, we found that this comprehensive nomogram could generate more net benefits, which might contribute to better clinical management (Figure 7F).
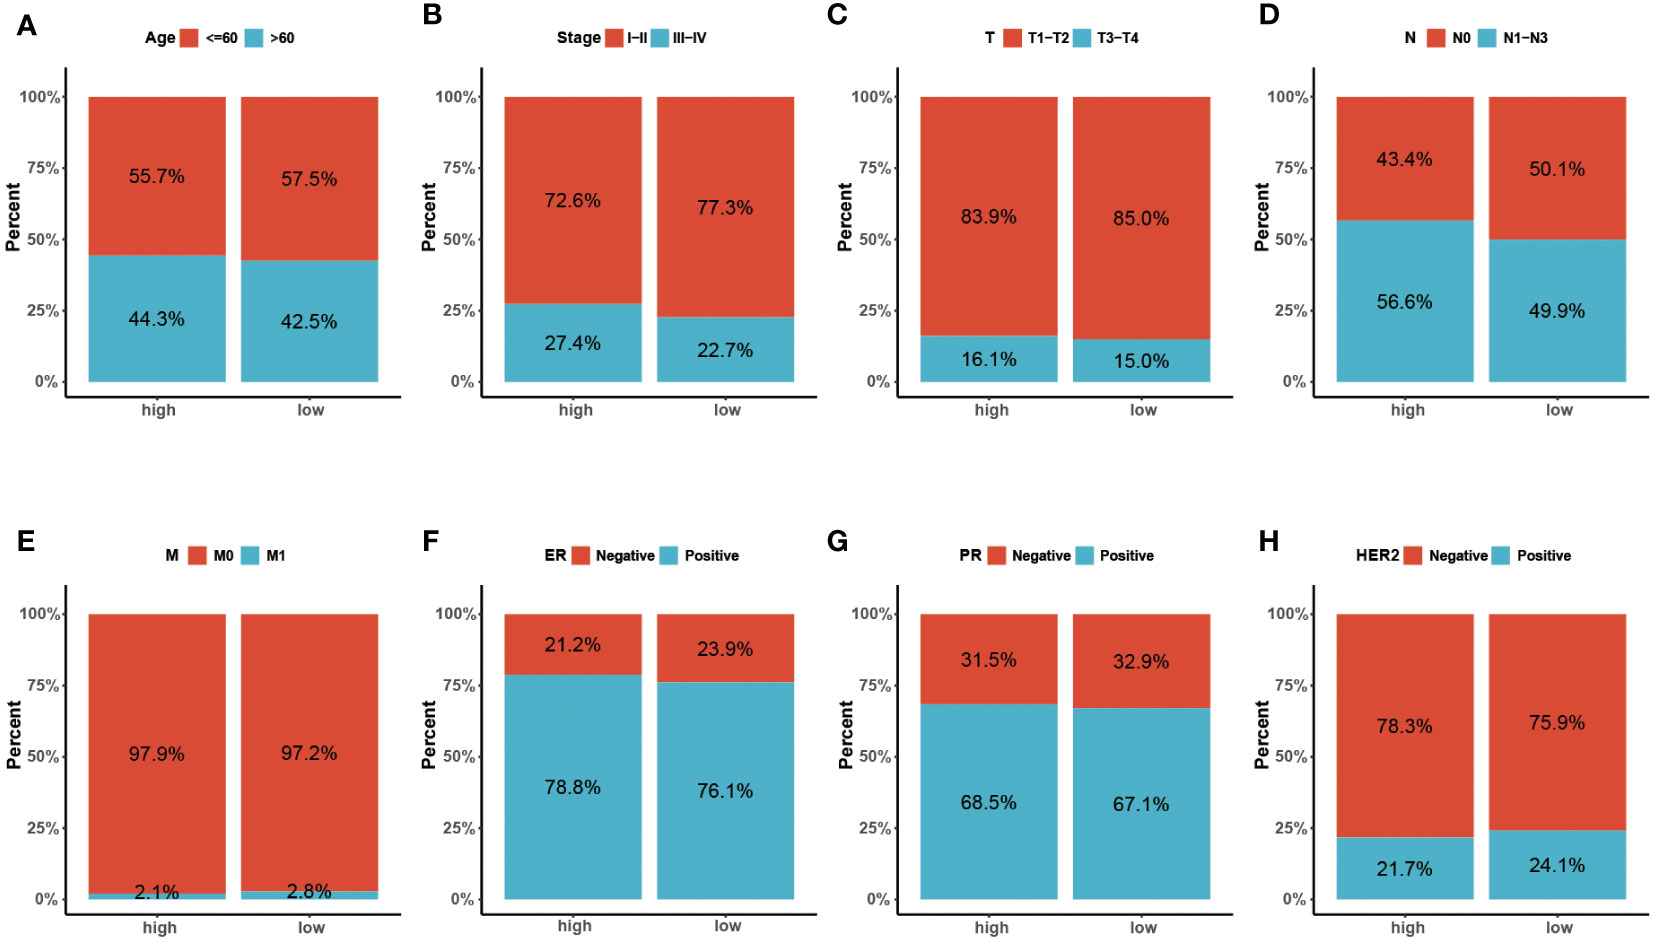
Figure 5 (A-H) The distribution characteristics of different clinicopathological factors in the two risk groups (Age, Stage, T, N, M, ER, PR and HER-2, respectively).
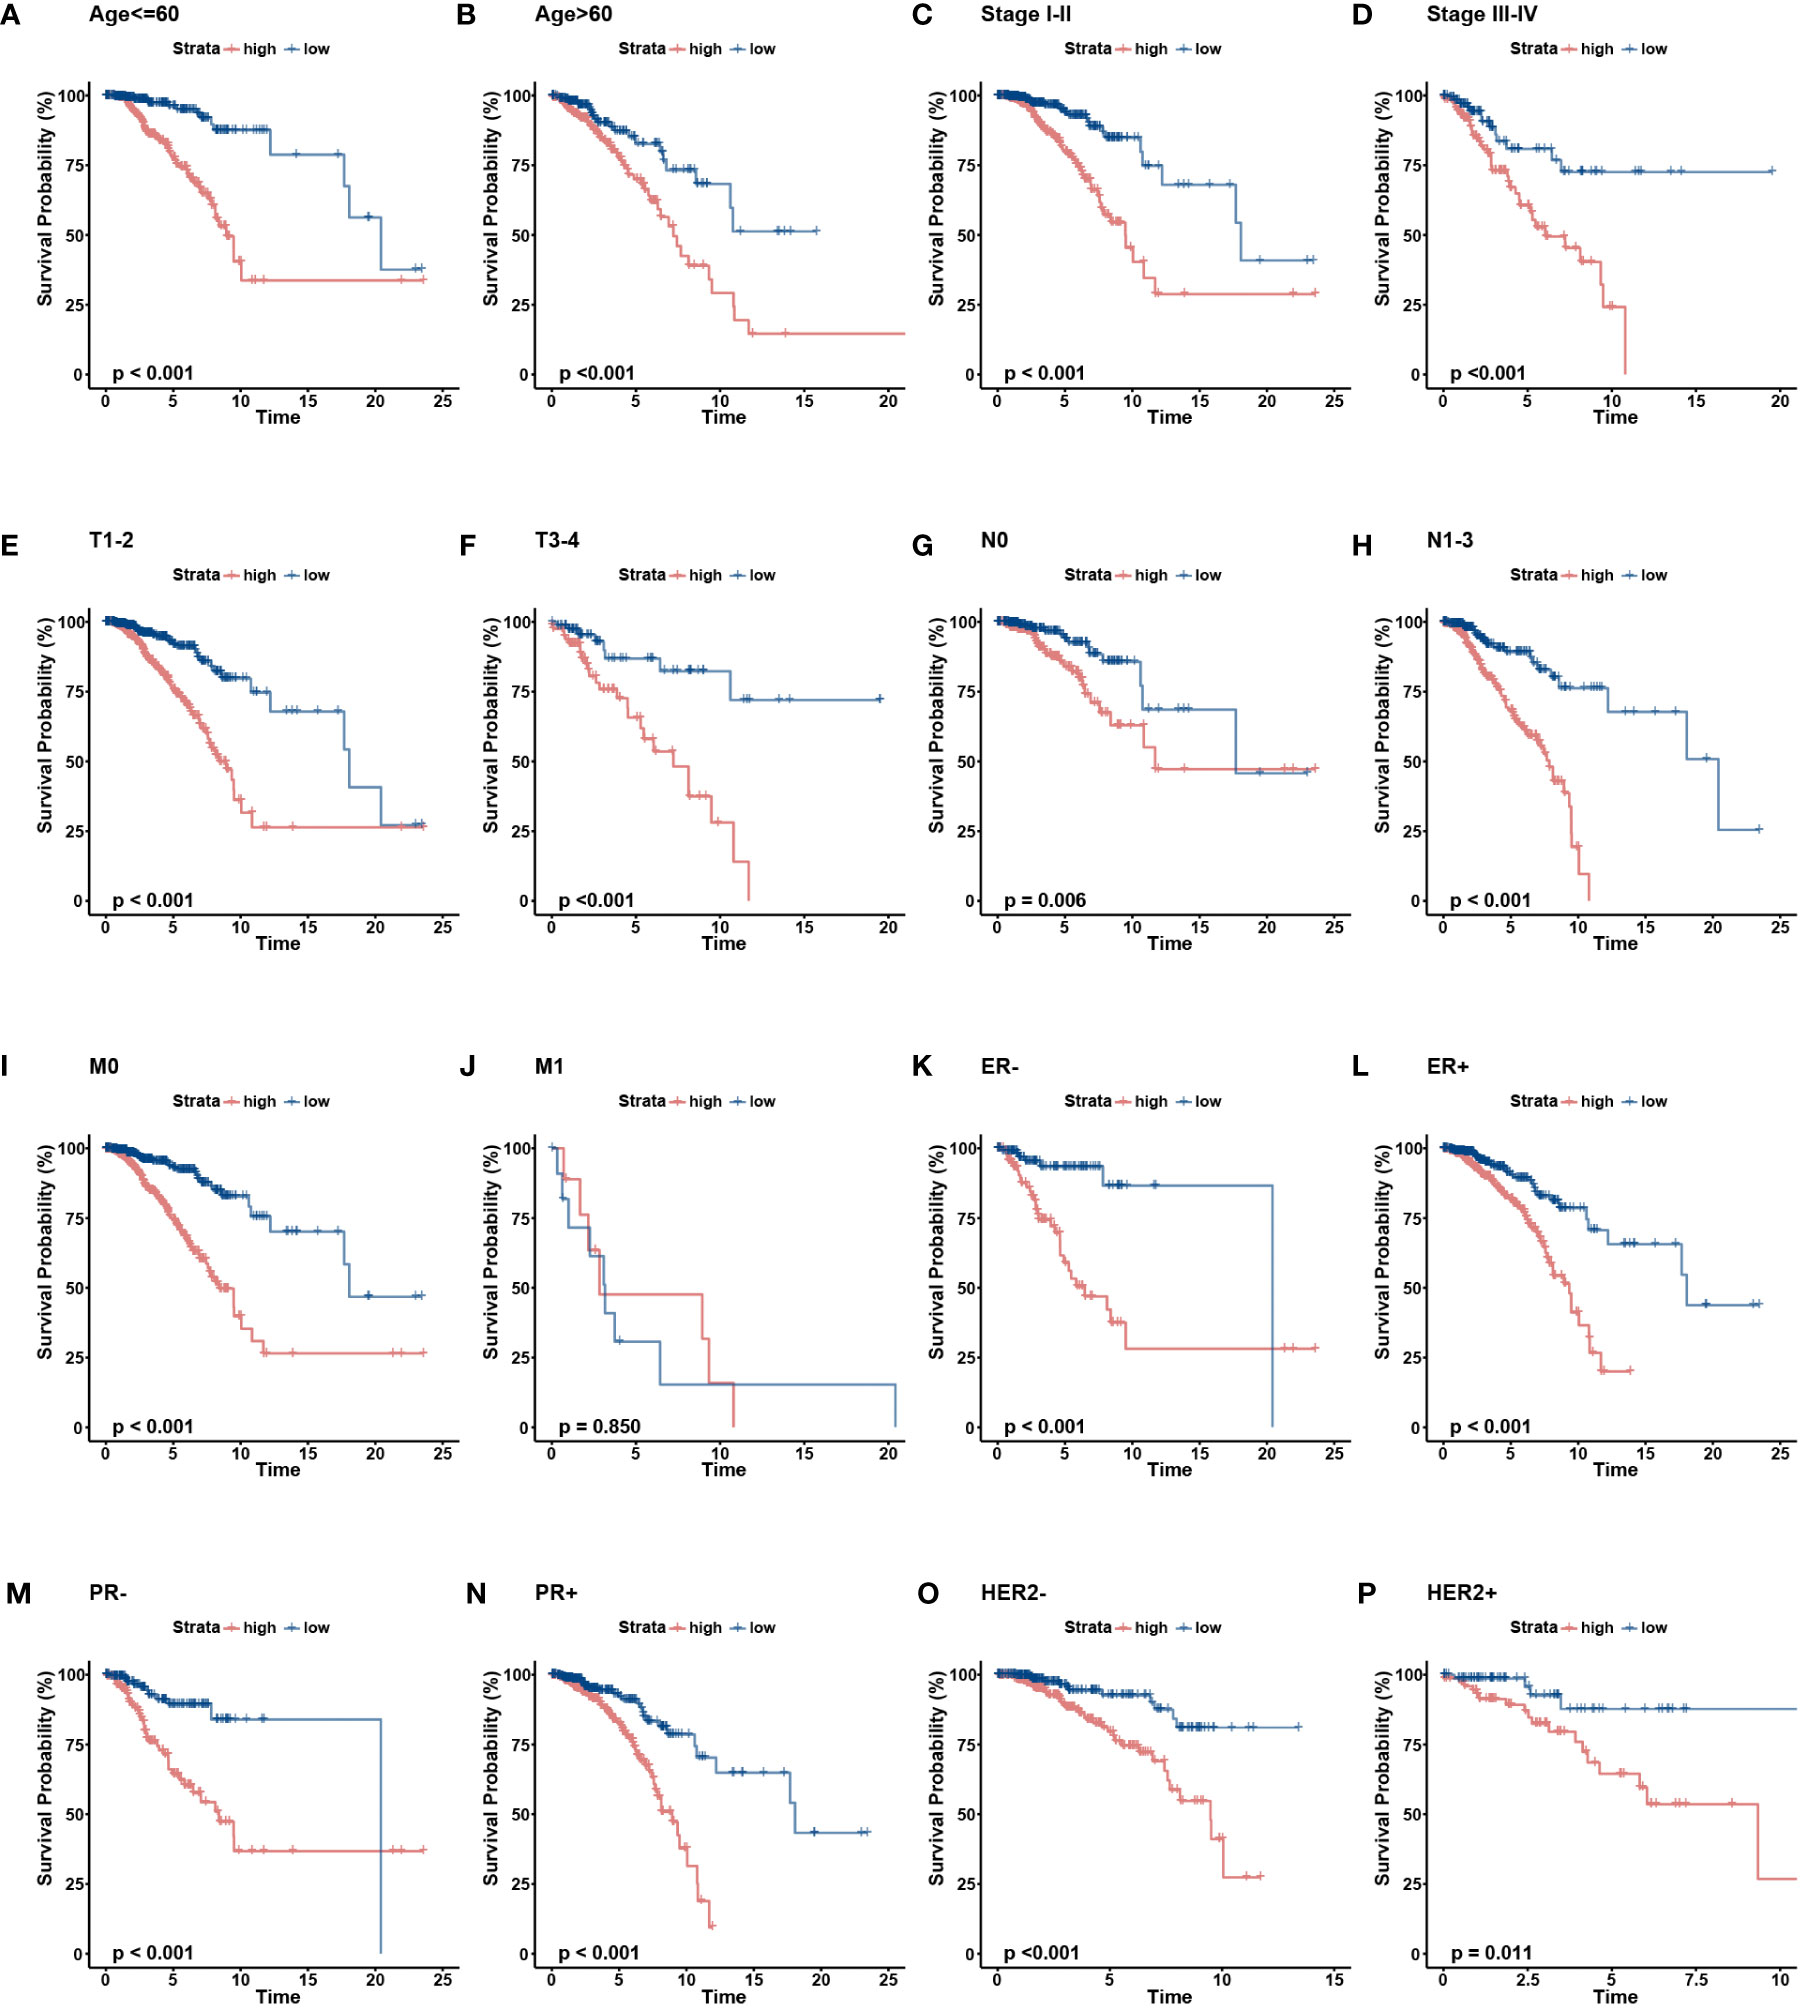
Figure 6 The OS KM curves of the two risk groups stratified by the clinicalpathological factors. (A-B) Age, (C-D) Stage, (E-F) AJCC T stage, (G. H), AJCC N stage, (I, J) AJCC M stage, (K, L) ER status, (M, N) PR status, (O, P) HER-2 status.
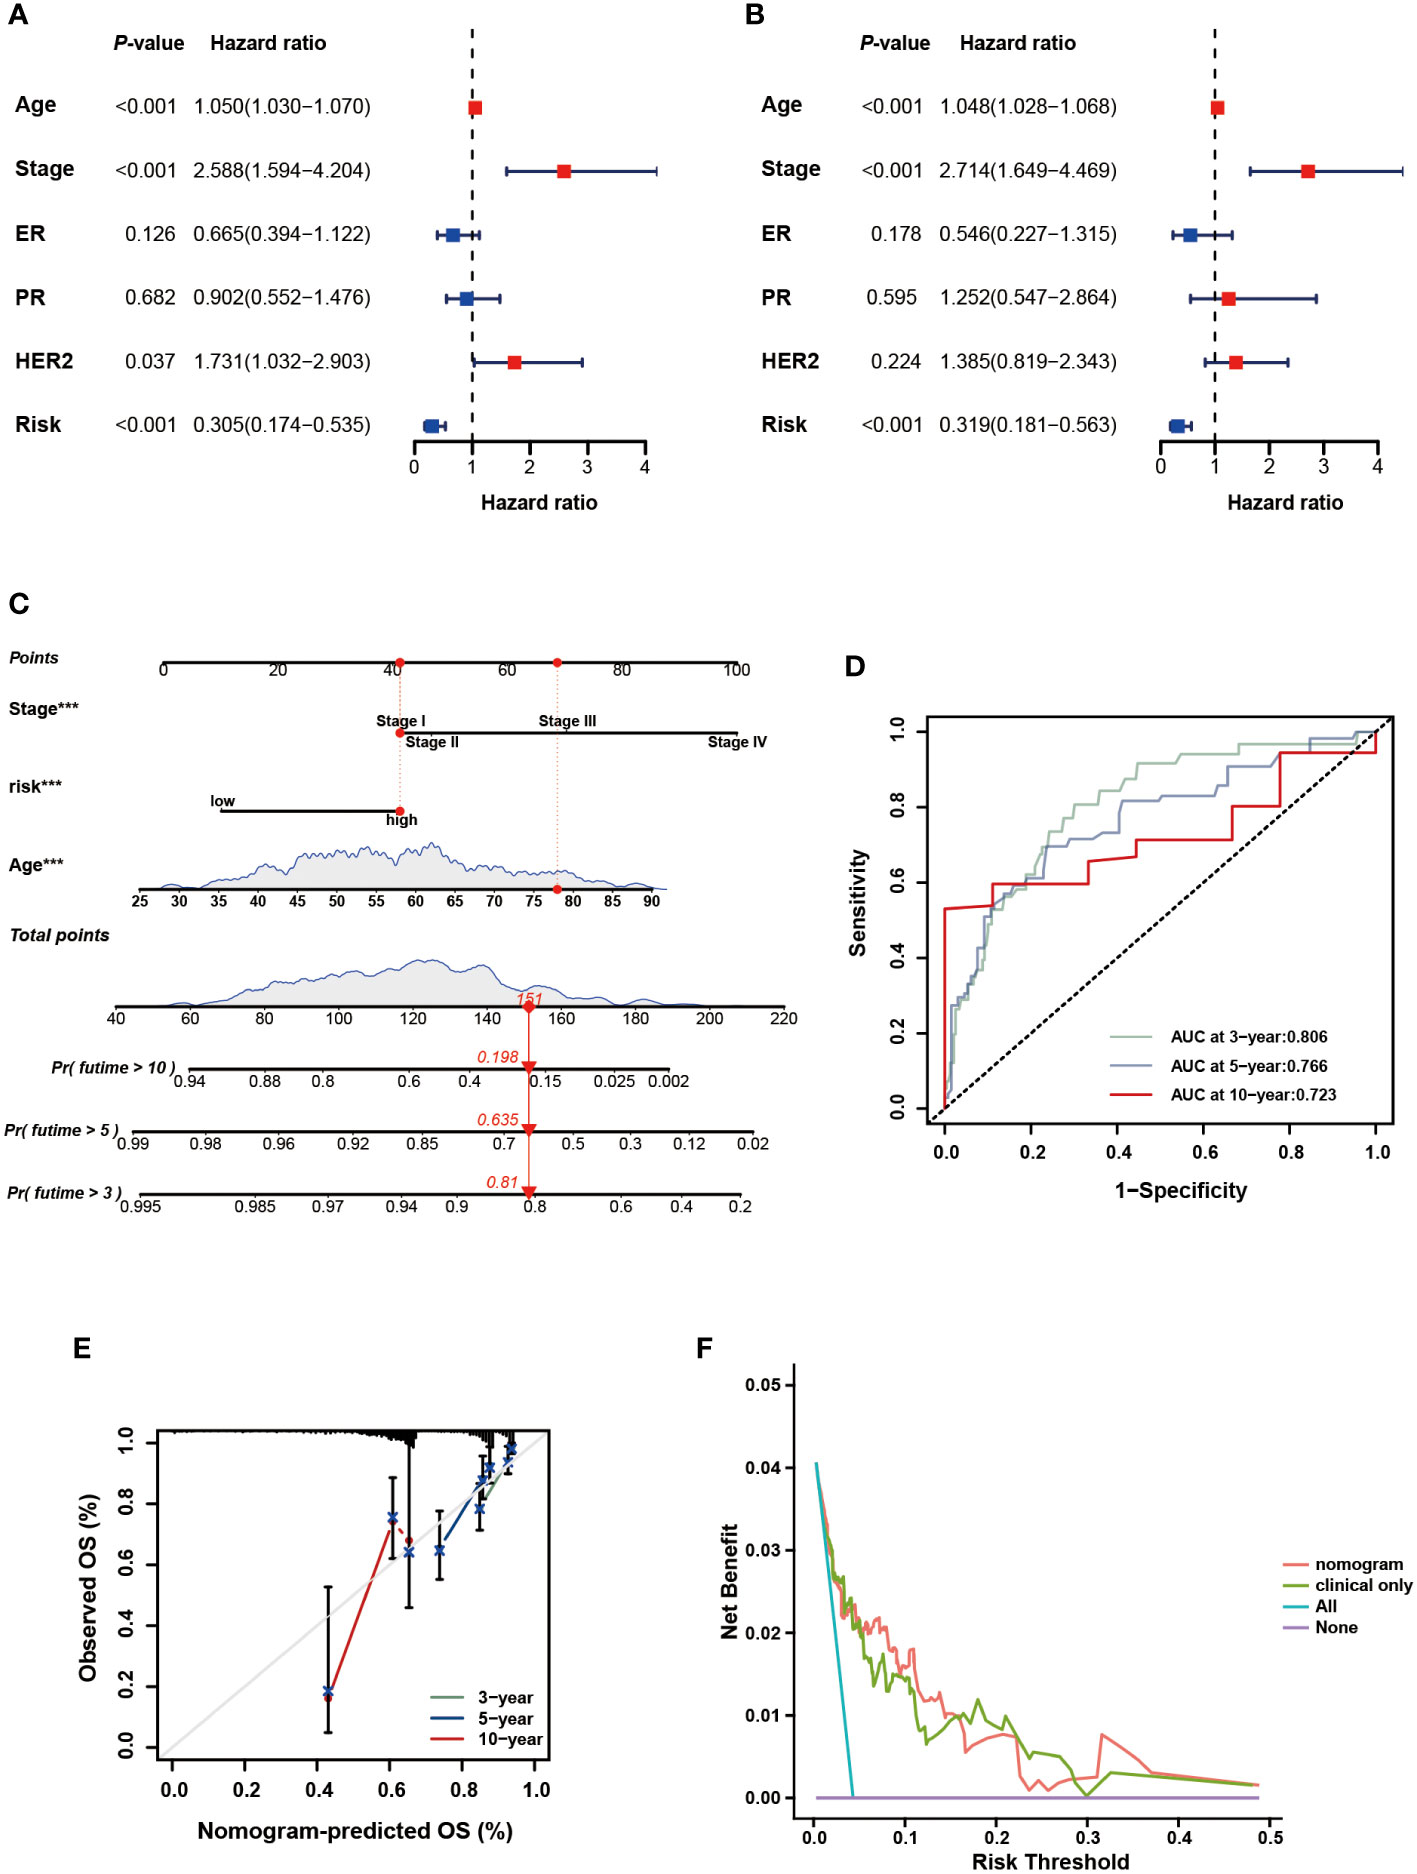
Figure 7 Development and assessment of the nomogram. (A) Univariate regression. (B) Multivariate regression of the clinicopathological indicators and gene signature. (C) A comprehensive nomogram for predicting BC patients’ survival probability. (D) The time-dependent ROC curves of the nomogram. (E) Calibration curves of the nomogram at 3-, 5-, and 10-year intervals. (F) DCA curves of the clinicopathological indicators and this nomogram.
3.5 Identification of the immune landscape
GSEA of DEGs was performed to determine the biological processes of the two risk groups. Notably, the low-risk group was predominantly enriched in immune-associated processes, such as antigen processing and presentation, chemokine signaling pathways, and natural killer cell-mediated cytotoxicity, whereas the high-risk group was enriched in cancer-related processes, such as focal adhesion and ECM receptor interaction (Figures 8A, B). Then, the ESTIMATE and CIBERSORT algorithms were employed to explore the tumor microenvironment. ESTIMATE analysis showed that the low-risk group had lower stromal scores, estimated scores, and higher immune scores (P < 0.05) (Figure 8C). According to the results of CIBERSORT, the low-risk group had a significantly higher proportion of CD8 T cells, activated memory CD4 T cells, follicular helper T cells, regulatory T cells, M0 macrophages, M1 macrophages, activated mast cells, and eosinophils (P < 0.05) (Figure 8D). The ssGSEA results were demonstrated in a heatmap to visualize the relative abundance of 28 immunocyte subpopulations (Figure S2). We found that the immune infiltrating cell subpopulations with anti-tumor effects were mainly enriched in the low-risk group, such as the activated dendritic cell and activated CD4/CD8 T cell, while the immunocyte subpopulations with pro-tumor effects were mainly enriched in the high-risk group, such as the myeloid-derived suppressor cells (MDSC) and immature dendric cell. Additionally, nine frequent checkpoint genes, including the well-known BTLA, CTLA-4, and PDCD1, were strongly elevated in the low-risk group (P < 0.05) (Figure 8E). Furthermore, higher scores were observed in the committed steps of the cancer-immunity cycle and immune-associated positive signals in the low-risk group (P < 0.05) (Figures 8F, G). Tumor cells evade immunosurveillance by enhancing TMB, whereas TMB conversely serves as a predictor of immunological response. Thus, we further visualized the mutation landscape in distinct risk groups and explored the correlation between risk score and TMB. Figures 8H, I demonstrate the top 20 genes with high mutation frequency in the risk groups, of which PIK3CA and TP53 have been shown to be of great significance (52–55). 391 (85.75%) of the 456 samples had mutations in the high-risk group, whereas in the low-risk group, 388 (87.19%) of the 445 samples did so. Furthermore, significantly higher TMB was observed in the low-risk group than in the high-risk group (Figure 8J). These findings suggest that the immune landscape between the two risk groups differ considerably.
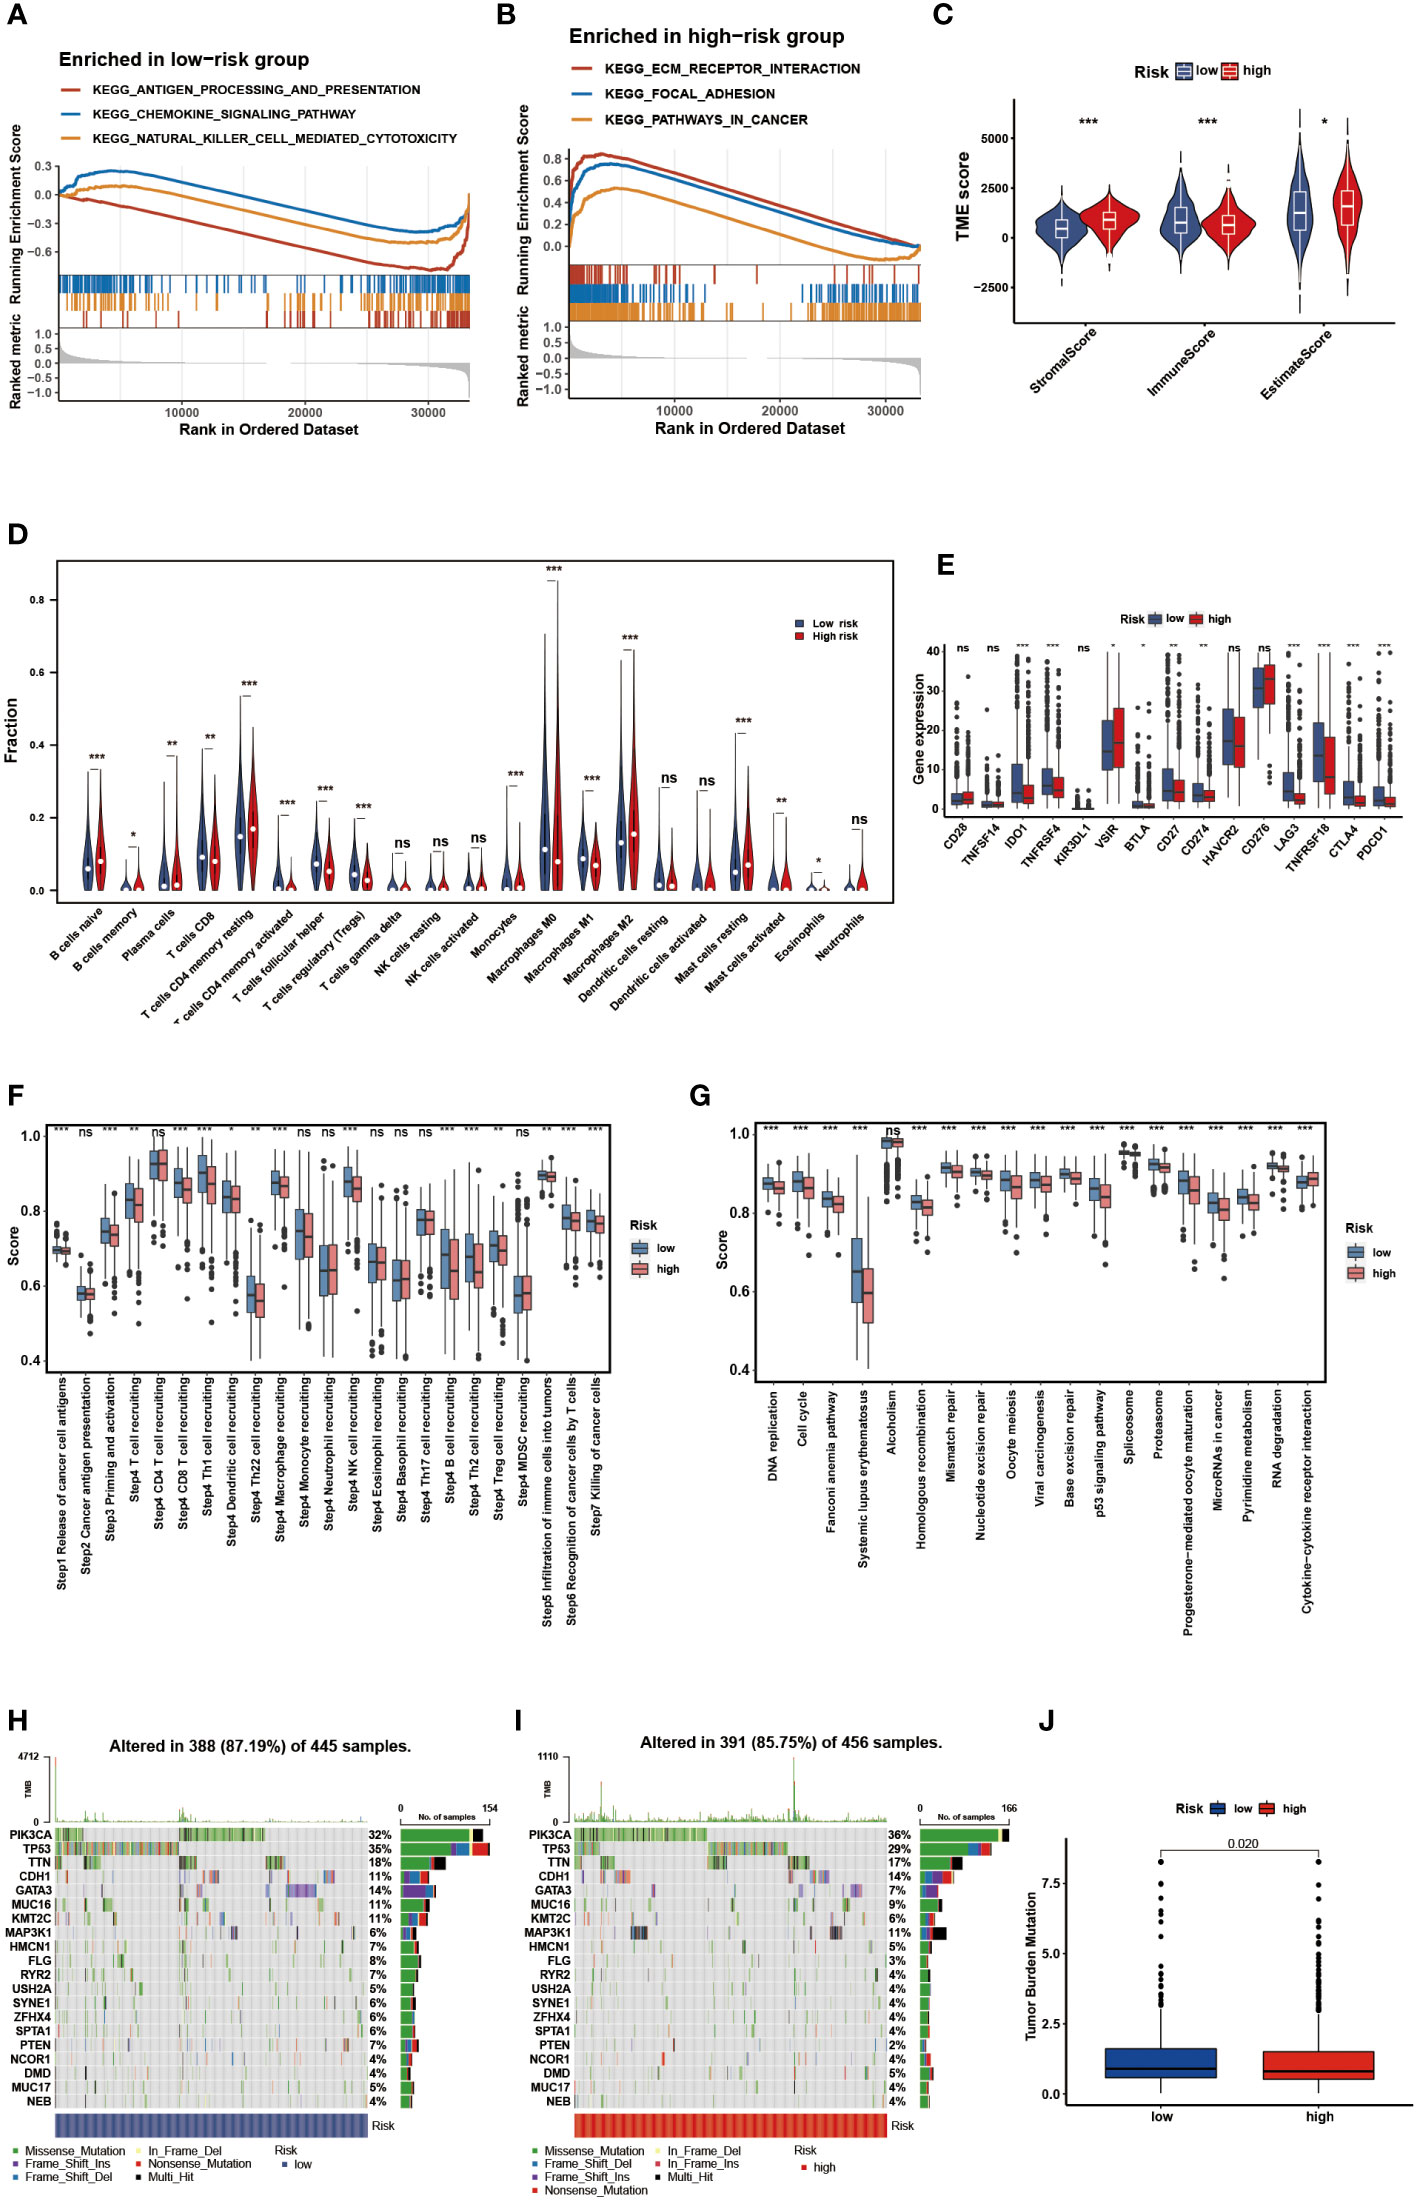
Figure 8 Identification of the immune landscape between the two risk groups. The GSEA of the DEGs. (A) in the low-risk group. (B) in the high-risk group. (C) Comparisons of the stromal, immune and ESTIMATE score in the two risk groups. (D) Comparisons of immunocyte’s infiltration fractions in the two risk groups. (E) The differential expression of checkpoint genes in the two risk groups. (F) Differences of cancer-immunity cycle scores in the two risk groups. (G) Differences of immune-associated positive signals in the two risk groups. The mutation landscape of the top 20 genes. (H) in the low-risk group. (I) in the high-risk group. (J) Comparisons of TMB in the two risk groups. * p<0.05, ** p<0.01, *** p<0.001, ns p>0.05.
3.6 Prediction of immunotherapy efficacy
The immunotherapy response in the two risk groups was evaluated using the IPS, Submap algorithms, and an external immunotherapy cohort. The IPS showed marked therapeutic benefits from checkpoint inhibitor treatment in the low-risk group (Figure 9A). Results from Submap revealed the therapeutic response to anti-CTLA4 and anti-PD-1 immunotherapy in BC patients (Figure 9B). The probability that the low-risk would react to anti-PD-1 immunotherapy was higher, as shown by the nominal P-value (P = 0.007) and Bonferroni corrected P-value (P < 0.001). Moreover, in the iMvigor210 cohort, we observed that the objective response rate (CR/PR) and survival probability in the low-risk group were higher than that in the high-risk group (Figures 9C, D). The outcomes in the external cohort verified that the NMRS could identify individuals that were immunotherapy-sensitive.
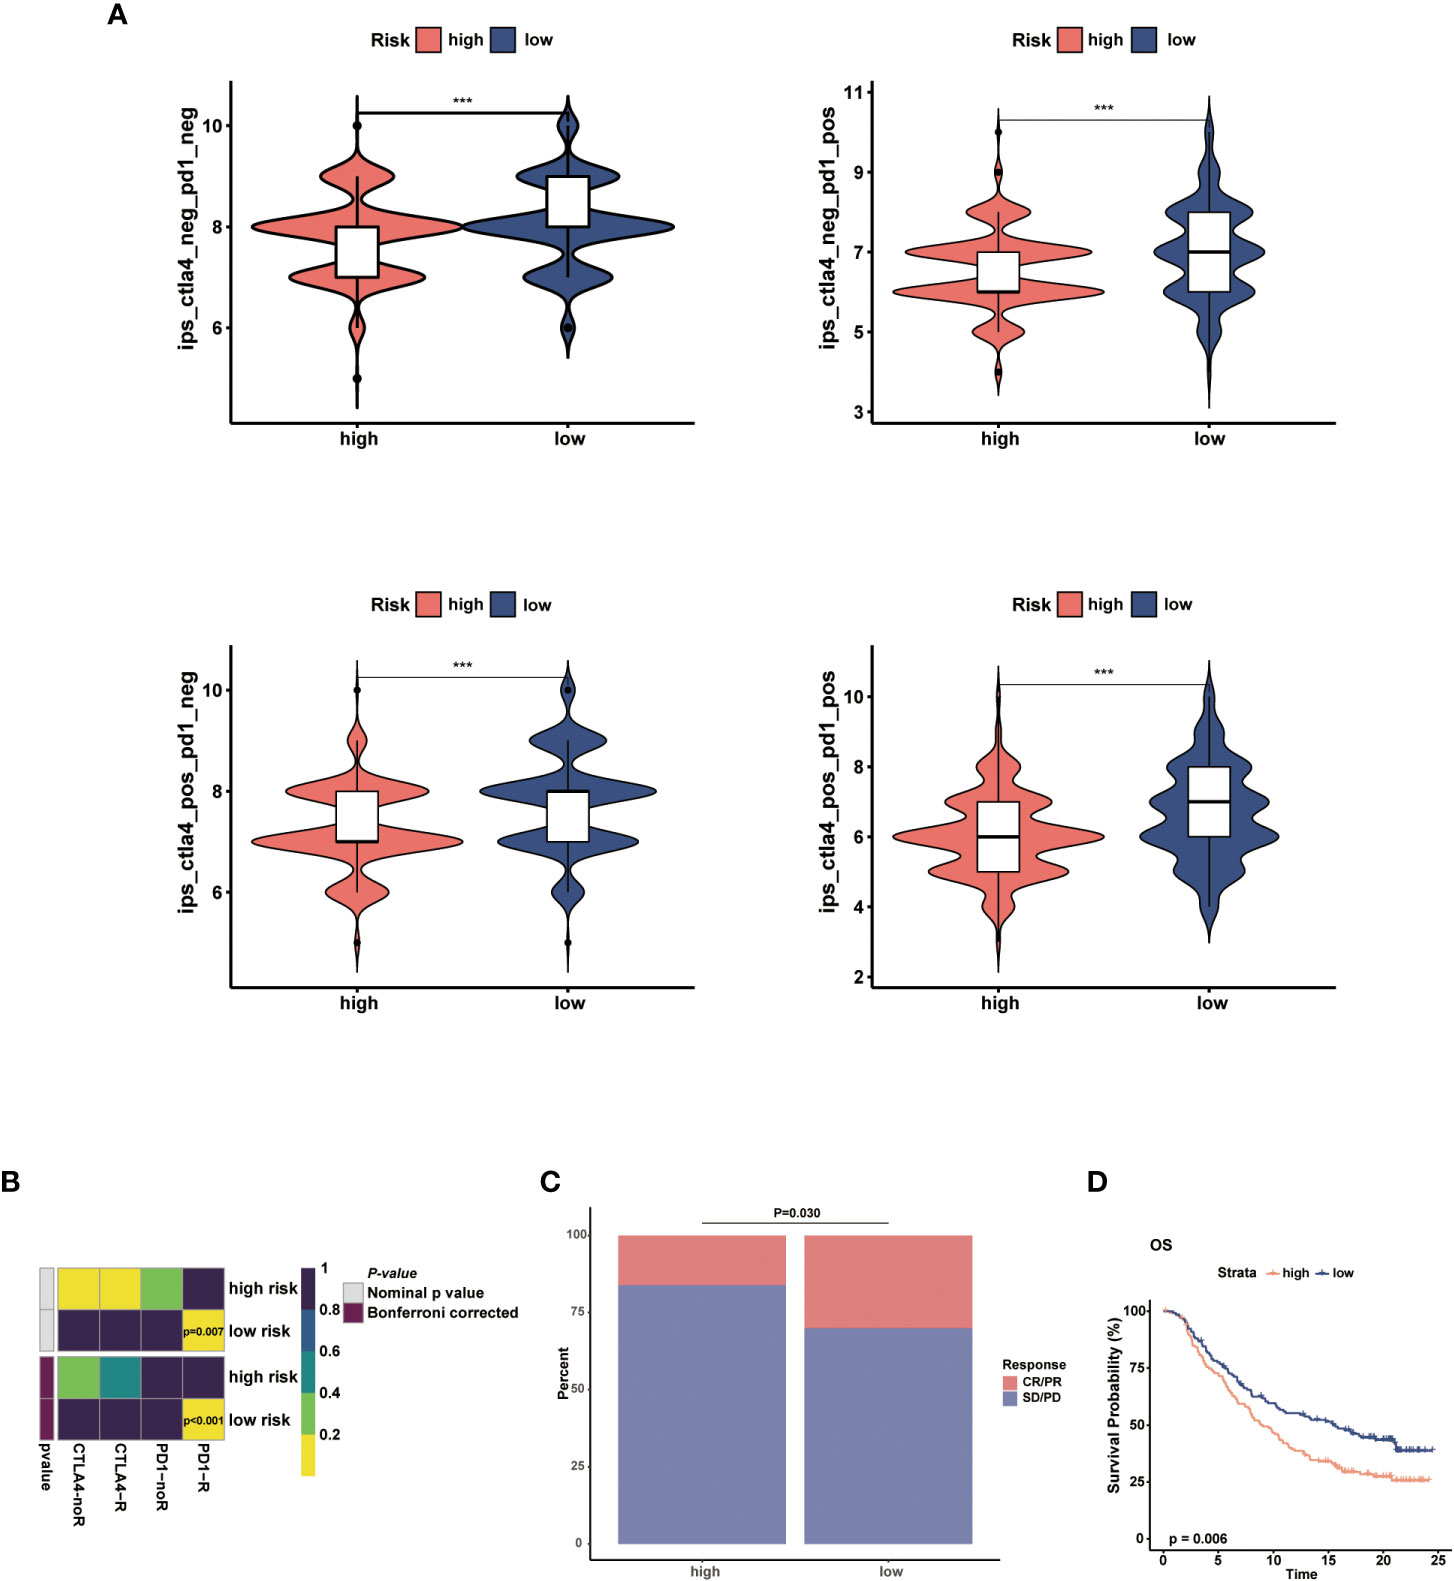
Figure 9 Prediction of the immunotherapy response in the two risk groups. (A) Comparisons of the IPS in the two risk groups. (B) Submap analysis between the two risk groups. (C) The proportion of clinical response to anti-PD-L1 immunotherapy in different risk groups in iMvigor210 cohort. (D) KM curves for the low-risk and high-risk groups in the iMvigor210 cohort. *** p<0.001.
3.7 Comparisons of drug sensitivity
To further investigate the clinical utility of NMRS in precise BC treatment, we assessed the therapeutic efficacy of frequently prescribed chemotherapeutic medications in different risk groups. According to the findings, low-risk individuals were more responsive to temzolomide, celiparib, doxorubicin, gefitinib, tamoxifen, 5-Flurouracil and gemcitabine, while less sensitive to sorafenib, sunitinib, and lapatinib (Figures 10A–J, P < 0.05).
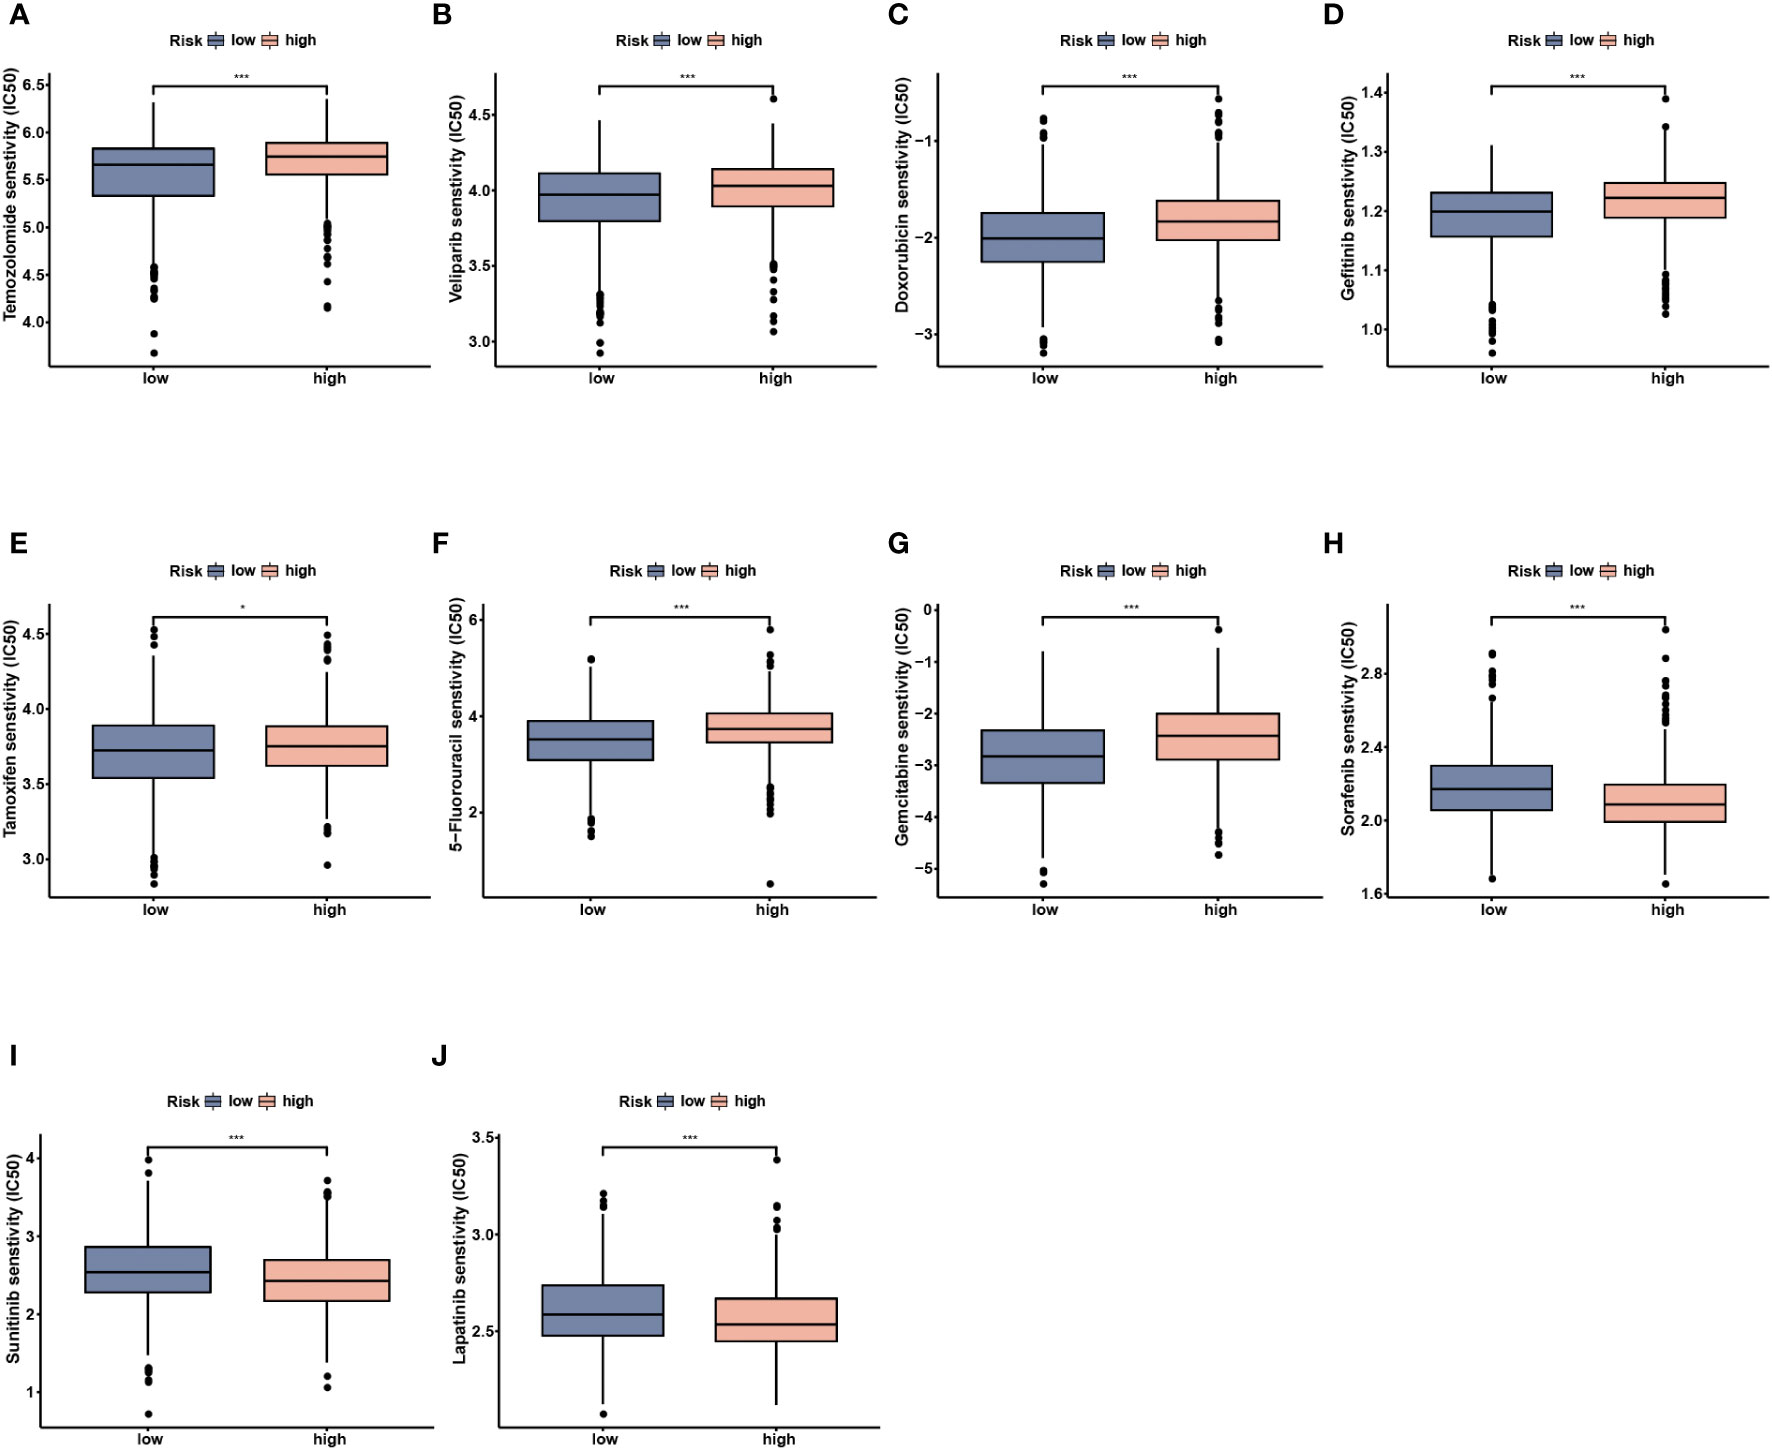
Figure 10 Drug sensitivity analysis between the low- and high-risk groups. (A) Temozolomide. (B) Veliparib. (C) Doxorubicin. (D) Gefitinib. (E) Tamoxifen. (F) 5-Fluorouracil. (G) Gemcitabine. (H) Sorafenib. (I) Sunitinib. (J) Lapatinib. * p<0.05, *** p<0.001.
3.8 Validation of the gene signature using scRNA-seq analysis
We analyzed a scRNA-seq cohort to see whether the gene signature could be utilized to discriminate between different cellular subtypes. Using the tSNE analysis, fourteen clusters were identified (Figure 11A). These clusters could be divided into nine different cell subtypes, including epithelial cells, embryonic stem cells, monocyte, T cells, fibroblasts, tissue stem cells, smooth muscle cells, chondrocytes and endothelial cells, according to the results of the cellular subtype annotation (Figure 11B). The expression level of the gene signature in each subtype was displayed in a bubble plot, and the cellular subtypes could be distinguished (Figure 11C). KLB, ZMAT3, CNOT10, and PSME2 were highly expressed in most cell subtypes, whereas the other model genes had relatively specific expression patterns. SFRP4, and THEM6 were highly expressed in fibroblasts and epithelial cells, respectively. These findings demonstrated the stability of this gene signature for cellular subtype discrimination.
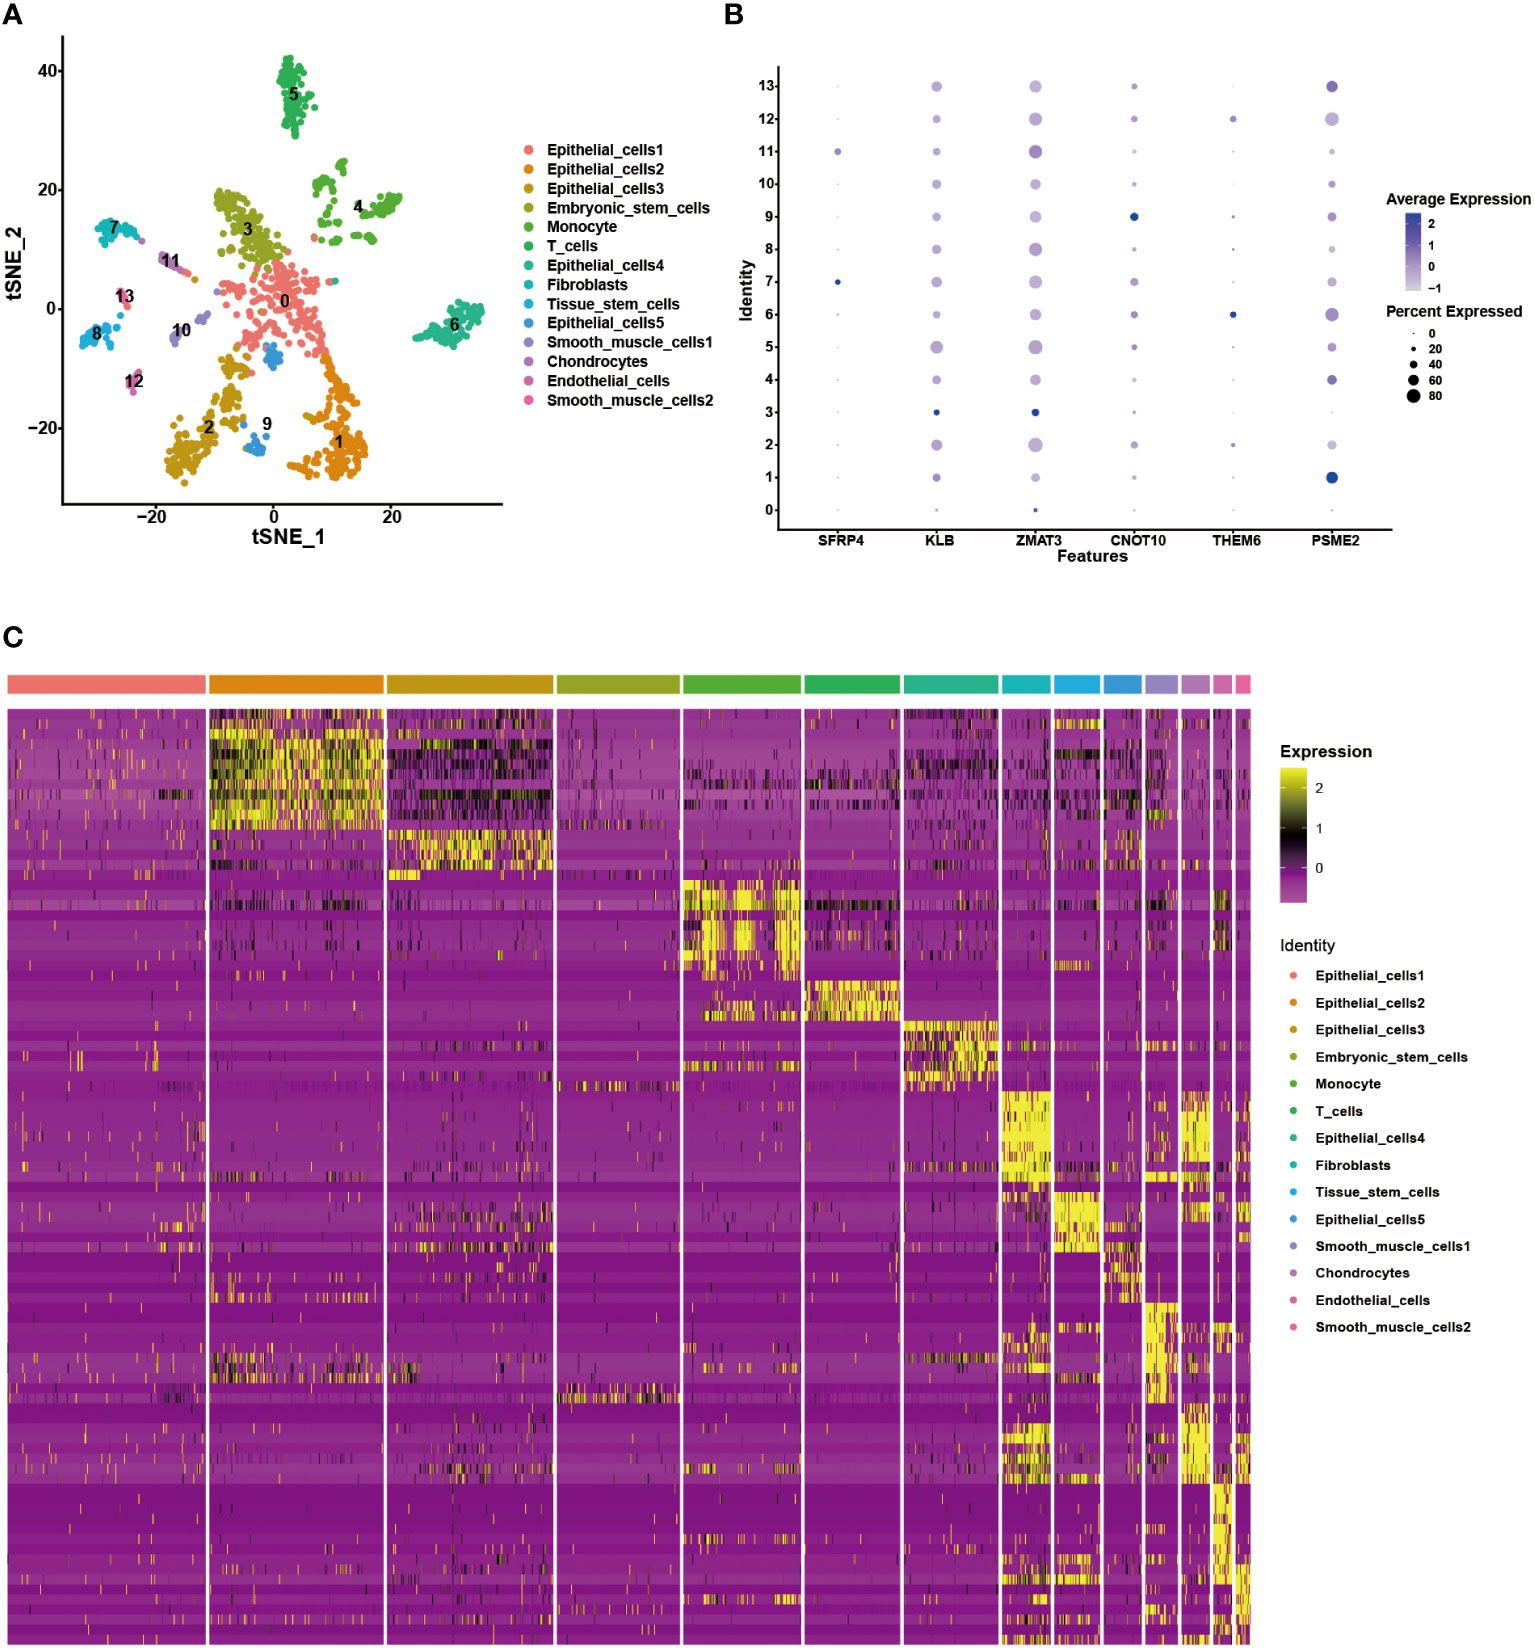
Figure 11 Validation of the gene signature in the scRNA-seq data. (A) The tSNE analysis showing 14 cellular subtypes in the scRNA-seq data. (B) The heatmap demonstrating the corresponding genes in each cellular subtype. (C) The expression level of the model genes in each cellular subtype.
4 Discussion
Nicotinamide (NAM) is a water-soluble amide form of vitamin B3 and precursor of NAD+ (18). Components of NAM-related metabolism, such as NAD+, NMN, and the core enzyme NAMPT, play an important role in maintaining DNA repair and gene stability, and regulating the immune microenvironment (19, 20, 25–28). Recent studies have shown that NAM supplementation effectively inhibited the development of various malignancies such as breast cancer, chronic lymphocytic leukemia, and hepatocellular carcinoma (18, 25, 56). In recent years, the morbidity of BC has steadily increased, making it the most frequent malignancy in women. Clinicopathological characteristics (such as age, stage, histological grade, tumor size, and lymph node status) remain the primary indicators to predict prognosis and guide treatment in clinical practice. However, owing to the high heterogeneity of BC, traditional clinicopathological factors are insufficient to predict prognosis precisely. With the development of sequencing technology, an increasing number of researchers have begun to attach importance to the prognostic value of tumor molecular mechanisms, and corresponding biomarkers have been developed (57, 58). Several biomarkers have been applied in clinical molecular diagnosis and formulation of individualized treatment schemes. For example, the breast cancer 21-gene assay (Oncotype DX) is used to predict the recurrence risk and chemotherapy benefits in patients with hormone receptor-positive, HER2 receptor negative and lymph node-negative subtypes (59). Additionally, although some molecular risk models have not been used in clinical management, they show great potential for the precise prediction of BC, such as pyroptosis-associated and TP53 mutation-related models (60, 61). However, the significance of the NAM metabolism in BC remains unclear. In this study, we constructed a NAM metabolism-related signature to conduct risk stratification, predict prognosis, and provide immunotherapy guidance at the transcriptional level for clinicians treating patients with BC.
Due to the unrobustness of models based on individual genes, we identified a NAM metabolism-related 6-gene signature using machine learning methods. All of the six genes have significant roles in tumorigenesis and progression, but they are not correlated with each other. By combining the signature with two clinical indicators (age and pathological stage), a comprehensive nomogram was developed for accurate predictions. We observed that the risk score accounted for a considerable proportion of the total score in the model, verifying its significance.
Tumor microenvironment (TME) is a complex and dynamic ecosystem that mainly includes tumor cells, immune cells, and Sertoli cells. It plays a crucial role in the occurrence, development, and metastasis of tumors (62). Compared to the high-risk group, the low-risk group had a higher immune score, which was consistent with previous studies showing that high immune infiltration indicated a good clinical outcome (63–65). In addition, the low-risk group showed abundant infiltration of CD8 + T cells and M1 macrophages. Previous studies have reported that these immunocytes have robust anticancer and immunity-enhancing ability (66, 67). However, M2 macrophages and MDSCs were the primary component of the high-risk group immune cells. They can inhibit the immune response and promote tumor angiogenesis and lymphangiogenesis, thus leading to tumor growth and metastasis (68–70).
Tumor cells escape immune surveillance through multiple mechanisms, including activation of the immune checkpoint pathway. ICIs reverse immunological tolerance by overcoming tumor cell-mediated immune incapacity, restoring anticancer immunity, and clearing tumor cells (71). Previously, BC was not considered a highly immunogenic tumor owing to its low mutation burden and limited ability to form neoantigens (72). However, an increasing number of studies have reported a close association between BC and the immune system. Turajlic et al. found that, compared with other subtypes, TNBC has a relatively high TMB that can lead to an increase in tumor-related antigens, making it possible for the immune system to recognize and fight against tumor cells (73). Su et al. observed that trastuzumab treatment in HER2-positive patients can reshape the TME and enhance PD-L1 expression, providing a theoretical basis for the combination of immunotherapy and targeted therapy (74). Researchers have also found that the combination of endocrine therapy with ICIs may cause a decline in immunosuppressive cells in hormone receptor (+) patients (75). In summary, patients with all BC subtypes may benefit from immunotherapy. However, the efficacy of immunotherapy varies greatly among individuals, and only a portion of patients can benefit from it (76). Therefore, the development of predictive biomarkers for ICI treatment is particularly important for screening specific populations for individualized treatment. Currently, some biomarkers for predicting treatment response to ICIs have been identified, such as tumor mutation burden and CD8 infiltration (77, 78). In this study, based on the NAM metabolism-related signature, we used multiple algorithms and an independent cohort to explore the immunotherapy response between different risk groups. The results consistently showed patients in the low-risk group were more likely to benefit from immunotherapy, demonstrating the signature’s robust predictive power for immunotherapy response. In addition, a comprehensive consideration of this gene signature could effectively distinguish distinct BC cell subtypes, showing great application prospects.
However, our study had some limitations. First, our research was based on an existing public database and the findings require multicenter prospective trials for validation. Second, there may be some unknown interactions between genes and gene products in the signature, which has implications in physiology and pathology. Further exploration is required to characterize the mechanisms of the identified gene signature in vitro and vivo experiments.
5 Conclusion
In summary, we identified a novel NAM metabolism-related signature for the prognostic prediction in BC using bioinformatic analyses. Moreover, the gene signature had promising potential for predicting the immune microenvironment and immunotherapy response, which might facilitate clinical management.
Data availability statement
Publicly available datasets were analyzed in this study. This data can be found here: https://portal.gdc.cancer.gov/, https://dcc.icgc.org, http://www.ncbi.nlm.nih.gov/geo, and https://xena.ucsc.edu/.
Author contributions
HK and XM designed the study and supervised the completion, HC and XR contributed to data collection and analysis, HC, LD and LC wrote the manuscript, DL and ZZ reviewed the background and edited the manuscript. All the authors approved the final version of the manuscript.
Funding
This study was supported by the Key Research and Development Plan of Shaanxi Provincial Department of Science and Technology (No.2022SF-001) and the International Science and Technology Cooperation Program Project of Shaanxi Province, China (2022KW-01).
Acknowledgments
We appreciate the cooperation of the TCGA, GEO and ICGC databases for the original data, as well as Editage (www.editage.cn) for the language enhancement.
Conflict of interest
The authors declare that the research was conducted in the absence of any commercial or financial relationships that could be construed as a potential conflict of interest.
Publisher’s note
All claims expressed in this article are solely those of the authors and do not necessarily represent those of their affiliated organizations, or those of the publisher, the editors and the reviewers. Any product that may be evaluated in this article, or claim that may be made by its manufacturer, is not guaranteed or endorsed by the publisher.
Supplementary material
The Supplementary Material for this article can be found online at: https://www.frontiersin.org/articles/10.3389/fimmu.2023.1145552/full#supplementary-material.
Supplementary Figure 1 | The workflow of this study.
Supplementary Figure 2 | Single-sample gene set enrichment analysis identified the relative infiltration of 28 types of immune cell subpopulations in different risk groups.
Supplementary Table 1 | A total of 42 NAM metabolism-related genes used in this study
Supplementary Table 2 | The upregulated and downregulated NAM metabolism-related genes.
References
1. Zhai Z, Zheng Y, Yao J, Liu Y, Ruan J, Deng Y, et al. Evaluation of adjuvant treatments for T1 N0 M0 triple-negative breast cancer. JAMA Netw Open (2020) 3(11):e2021881. doi: 10.1001/jamanetworkopen.2020.21881
2. Siegel RL, Miller KD, Fuchs HE, Jemal A. Cancer statistics, 2022. CA Cancer J Clin (2022) 72(1):7–33. doi: 10.3322/caac.21708
3. Sung H, Ferlay J, Siegel RL, Laversanne M, Soerjomataram I, Jemal A, et al. Global cancer statistics 2020: GLOBOCAN estimates of incidence and mortality worldwide for 36 cancers in 185 countries. CA Cancer J Clin (2021) 71(3):209–49. doi: 10.3322/caac.21660
4. Maughan KL, Lutterbie MA, Ham PS. Treatment of breast cancer. Am Fam Physician (2010) 81(11):1339–46.
5. Peart O. Breast intervention and breast cancer treatment options. Radiol Technol (2015) 86(5):535M–58M.
6. Low SK, Zembutsu H, Nakamura Y. Breast cancer: The translation of big genomic data to cancer precision medicine. Cancer Sci (2018) 109(3):497–506. doi: 10.1111/cas.13463
7. Harbeck N, Gnant M. Breast cancer. Lancet (2017) 389(10074):1134–50. doi: 10.1016/s0140-6736(16)31891-8
8. Britt KL, Cuzick J, Phillips KA. Key steps for effective breast cancer prevention. Nat Rev Cancer (2020) 20(8):417–36. doi: 10.1038/s41568-020-0266-x
9. Gonzalez H, Hagerling C, Werb Z. Roles of the immune system in cancer: From tumor initiation to metastatic progression. Genes Dev (2018) 32(19-20):1267–84. doi: 10.1101/gad.314617.118
10. Nanda R, Chow LQ, Dees EC, Berger R, Gupta S, Geva R, et al. Pembrolizumab in patients with advanced triple-negative breast cancer: Phase ib KEYNOTE-012 study. J Clin Oncol (2016) 34(21):2460–7. doi: 10.1200/jco.2015.64.8931
11. Emens LA. Breast cancer immunotherapy: Facts and hopes. Clin Cancer Res (2018) 24(3):511–20. doi: 10.1158/1078-0432.Ccr-16-3001
12. Emens LA, Adams S, Barrios CH, Diéras V, Iwata H, Loi S, et al. First-line atezolizumab plus nab-paclitaxel for unresectable, locally advanced, or metastatic triple-negative breast cancer: IMpassion130 final overall survival analysis. Ann Oncol (2021) 32(8):983–93. doi: 10.1016/j.annonc.2021.05.355
13. Diaz-Montero CM, Salem ML, Nishimura MI, Garrett-Mayer E, Cole DJ, Montero AJ. Increased circulating myeloid-derived suppressor cells correlate with clinical cancer stage, metastatic tumor burden, and doxorubicin-cyclophosphamide chemotherapy. Cancer Immunol Immunother (2009) 58(1):49–59. doi: 10.1007/s00262-008-0523-4
14. Polat MF, Taysi S, Polat S, Böyük A, Bakan E. Elevated serum arginase activity levels in patients with breast cancer. Surg Today (2003) 33(9):655–61. doi: 10.1007/s00595-002-2563-2
15. Hanahan D, Weinberg RA. Hallmarks of cancer: The next generation. Cell (2011) 144(5):646–74. doi: 10.1016/j.cell.2011.02.013
16. Hanahan D. Hallmarks of cancer: new dimensions. Cancer Discovery (2022) 12(1):31–46. doi: 10.1158/2159-8290.Cd-21-1059
17. Chen GG, Woo PYM, Ng SCP, Wong GKC, Chan DTM, van Hasselt CA, et al. Impact of metformin on immunological markers: Implication in its anti-tumor mechanism. Pharmacol Ther (2020) 213:107585. doi: 10.1016/j.pharmthera.2020.107585
18. Jung M, Lee KM, Im Y, Seok SH, Chung H, Kim DY, et al. Nicotinamide (niacin) supplement increases lipid metabolism and ROS-induced energy disruption in triple-negative breast cancer: Potential for drug repositioning as an anti-tumor agent. Mol Oncol (2022) 16(9):1795–815. doi: 10.1002/1878-0261.13209
19. Cairns RA, Harris IS, Mak TW. Regulation of cancer cell metabolism. Nat Rev Cancer (2011) 11(2):85–95. doi: 10.1038/nrc2981
20. Lv H, Lv G, Chen C, Zong Q, Jiang G, Ye D, et al. NAD+ metabolism maintains inducible PD-L1 expression to drive tumor immune evasion. Cell Metab (2021) 33(1):110–27.e5. doi: 10.1016/j.cmet.2020.10.021
21. Verdin E. NAD+ in aging, metabolism, and neurodegeneration. Science (2015) 350(6265):1208–13. doi: 10.1126/science.aac4854
22. Domínguez-Gómez G, Díaz-Chávez J, Chávez-Blanco A, Gonzalez-Fierro A, Jiménez-Salazar JE, Damián-Matsumura P, et al. Nicotinamide sensitizes human breast cancer cells to the cytotoxic effects of radiation and cisplatin. Oncol Rep (2015) 33(2):721–8. doi: 10.3892/or.2014.3661
23. Kaanders JH, Pop LA, Marres HA, Bruaset I, van den Hoogen FJ, Merkx MA, et al. ARCON: Experience in 215 patients with advanced head-and-neck cancer. Int J Radiat Oncol Biol Phys (2002) 52(3):769–78. doi: 10.1016/s0360-3016(01)02678-5
24. Hoskin PJ, Rojas AM, Phillips H, Saunders MI. Acute and late morbidity in the treatment of advanced bladder carcinoma with accelerated radiotherapy, carbogen, and nicotinamide. Cancer (2005) 103(11):2287–97. doi: 10.1002/cncr.21048
25. Audrito V, Vaisitti T, Rossi D, Gottardi D, D'Arena G, Laurenti L, et al. Nicotinamide blocks proliferation and induces apoptosis of chronic lymphocytic leukemia cells through activation of the p53/miR-34a/SIRT1 tumor suppressor network. Cancer Res (2011) 71(13):4473–83. doi: 10.1158/0008-5472.Can-10-4452
26. Burgos ES. NAMPT in regulated NAD biosynthesis and its pivotal role in human metabolism. Curr Med Chem (2011) 18(13):1947–61. doi: 10.2174/092986711795590101
27. Garten A, Schuster S, Penke M, Gorski T, de Giorgis T, Kiess W. Physiological and pathophysiological roles of NAMPT and NAD metabolism. Nat Rev Endocrinol (2015) 11(9):535–46. doi: 10.1038/nrendo.2015.117
28. Travelli C, Consonni FM, Sangaletti S, Storto M, Morlacchi S, Grolla AA, et al. Nicotinamide phosphoribosyltransferase acts as a metabolic gate for mobilization of myeloid-derived suppressor cells. Cancer Res (2019) 79(8):1938–51. doi: 10.1158/0008-5472.Can-18-1544
29. Li M, Kirtane AR, Kiyokawa J, Nagashima H, Lopes A, Tirmizi ZA, et al. Local targeting of NAD+ salvage pathway alters the immune tumor microenvironment and enhances checkpoint immunotherapy in glioblastoma. Cancer Res (2020) 80(22):5024–34. doi: 10.1158/0008-5472.Can-20-1094
30. Mariathasan S, Turley SJ, Nickles D, Castiglioni A, Yuen K, Wang Y, et al. TGFβ attenuates tumour response to PD-L1 blockade by contributing to exclusion of T cells. Nature (2018) 554(7693):544–8. doi: 10.1038/nature25501
31. Wilkerson MD, Hayes DN. ConsensusClusterPlus: A class discovery tool with confidence assessments and item tracking. Bioinformatics (2010) 26(12):1572–3. doi: 10.1093/bioinformatics/btq170
32. Yu G, Wang LG, Han Y, He QY. clusterProfiler: An r package for comparing biological themes among gene clusters. Omics (2012) 16(5):284–7. doi: 10.1089/omi.2011.0118
33. Friedman J, Hastie T, Tibshirani R. Regularization paths for generalized linear models via coordinate descent. J Stat Softw (2010) 33(1):1–22. doi: 10.18637/jss.v033.i01
34. Subramanian A, Kuehn H, Gould J, Tamayo P, Mesirov JP. GSEA-p: a desktop application for gene set enrichment analysis. Bioinformatics (2007) 23(23):3251–3. doi: 10.1093/bioinformatics/btm369
35. Yoshihara K, Shahmoradgoli M, Martínez E, Vegesna R, Kim H, Torres-Garcia W, et al. Inferring tumour purity and stromal and immune cell admixture from expression data. Nat Commun (2013) 4:2612. doi: 10.1038/ncomms3612
36. Newman AM, Liu CL, Green MR, Gentles AJ, Feng W, Xu Y, et al. Robust enumeration of cell subsets from tissue expression profiles. Nat Methods (2015) 12(5):453–7. doi: 10.1038/nmeth.3337
37. Newman AM, Steen CB, Liu CL, Gentles AJ, Chaudhuri AA, Scherer F, et al. Determining cell type abundance and expression from bulk tissues with digital cytometry. Nat Biotechnol (2019) 37(7):773–82. doi: 10.1038/s41587-019-0114-2
38. Hu T, Wang Y, Wang X, Wang R, Song Y, Zhang L, et al. Construction and validation of an angiogenesis-related gene expression signature associated with clinical outcome and tumor immune microenvironment in glioma. Front Genet (2022) 13:934683. doi: 10.3389/fgene.2022.934683
39. Barbie DA, Tamayo P, Boehm JS, Kim SY, Moody SE, Dunn IF, et al. Systematic RNA interference reveals that oncogenic KRAS-driven cancers require TBK1. Nature (2009) 462(7269):108–12. doi: 10.1038/nature08460
40. Charoentong P, Finotello F, Angelova M, Mayer C, Efremova M, Rieder D, et al. Pan-cancer immunogenomic analyses reveal genotype-immunophenotype relationships and predictors of response to checkpoint blockade. Cell Rep (2017) 18(1):248–62. doi: 10.1016/j.celrep.2016.12.019
41. Xu Q, Chen S, Hu Y, Huang W. Landscape of immune microenvironment under immune cell infiltration pattern in breast cancer. Front Immunol (2021) 12:711433. doi: 10.3389/fimmu.2021.711433
42. Xu Z, Song J, Cao L, Rong Z, Zhang W, He J, et al. Improving ovarian cancer treatment decision using a novel risk predictive tool. Aging (Albany NY) (2022) 14(8):3464–83. doi: 10.18632/aging.204023
43. Hoshida Y, Brunet JP, Tamayo P, Golub TR, Mesirov JP. Subclass mapping: identifying common subtypes in independent disease data sets. PloS One (2007) 2(11):e1195. doi: 10.1371/journal.pone.0001195
44. Geeleher P, Cox NJ, Huang RS. Clinical drug response can be predicted using baseline gene expression levels and in vitro drug sensitivity in cell lines. Genome Biol (2014) 15(3):R47. doi: 10.1186/gb-2014-15-3-r47
45. Geeleher P, Cox N, Huang RS. pRRophetic: An r package for prediction of clinical chemotherapeutic response from tumor gene expression levels. PloS One (2014) 9(9):e107468. doi: 10.1371/journal.pone.0107468
46. Butler A, Hoffman P, Smibert P, Papalexi E, Satija R. Integrating single-cell transcriptomic data across different conditions, technologies, and species. Nat Biotechnol (2018) 36(5):411–20. doi: 10.1038/nbt.4096
47. Aran D, Looney AP, Liu L, Wu E, Fong V, Hsu A, et al. Reference-based analysis of lung single-cell sequencing reveals a transitional profibrotic macrophage. Nat Immunol (2019) 20(2):163–72. doi: 10.1038/s41590-018-0276-y
48. Wang Z, Bao A, Liu S, Dai F, Gong Y, Cheng Y. A pyroptosis-related gene signature predicts prognosis and immune microenvironment for breast cancer based on computational biology techniques. Front Genet (2022) 13:801056. doi: 10.3389/fgene.2022.801056
49. Zhang Z, Fang T, Lv Y. A novel lactate metabolism-related signature predicts prognosis and tumor immune microenvironment of breast cancer. Front Genet (2022) 13:934830. doi: 10.3389/fgene.2022.934830
50. Yang Y, Liu HL, Liu YJ. A novel five-gene signature related to clinical outcome and immune microenvironment in breast cancer. Front Genet (2022) 13:912125. doi: 10.3389/fgene.2022.912125
51. Vickers AJ, Holland F. Decision curve analysis to evaluate the clinical benefit of prediction models. Spine J (2021) 21(10):1643–8. doi: 10.1016/j.spinee.2021.02.024
52. Martínez-Sáez O, Chic N, Pascual T, Adamo B, Vidal M, González-Farré B, et al. Frequency and spectrum of PIK3CA somatic mutations in breast cancer. Breast Cancer Res (2020) 22(1):45. doi: 10.1186/s13058-020-01284-9
53. Loibl S, Poortmans P, Morrow M, Denkert C, Curigliano G. Breast cancer. Lancet (2021) 397(10286):1750–69. doi: 10.1016/s0140-6736(20)32381-3
54. Sheikh A, Hussain SA, Ghori Q, Naeem N, Fazil A, Giri S, et al. The spectrum of genetic mutations in breast cancer. Asian Pac J Cancer Prev (2015) 16(6):2177–85. doi: 10.7314/apjcp.2015.16.6.2177
55. Kaur RP, Vasudeva K, Kumar R, Munshi A. Role of p53 gene in breast cancer: Focus on mutation spectrum and therapeutic strategies. Curr Pharm Des (2018) 24(30):3566–75. doi: 10.2174/1381612824666180926095709
56. Luo J, Nikolaev AY, Imai S, Chen D, Su F, Shiloh A, et al. Negative control of p53 by Sir2alpha promotes cell survival under stress. Cell (2001) 107(2):137–48. doi: 10.1016/s0092-8674(01)00524-4
57. Cardoso F, van't Veer LJ, Bogaerts J, Slaets L, Viale G, Delaloge S, et al. 70-gene signature as an aid to treatment decisions in early-stage breast cancer. N Engl J Med (2016) 375(8):717–29. doi: 10.1056/NEJMoa1602253
58. Weichselbaum RR, Ishwaran H, Yoon T, Nuyten DS, Baker SW, Khodarev N, et al. An interferon-related gene signature for DNA damage resistance is a predictive marker for chemotherapy and radiation for breast cancer. Proc Natl Acad Sci U.S.A. (2008) 105(47):18490–5. doi: 10.1073/pnas.0809242105
59. Sparano JA, Gray RJ, Makower DF, Pritchard KI, Albain KS, Hayes DF, et al. Adjuvant chemotherapy guided by a 21-gene expression assay in breast cancer. N Engl J Med (2018) 379(2):111–21. doi: 10.1056/NEJMoa1804710
60. Zhang H, Yu X, Yang J, He G, Zhang X, Wu X, et al. Comprehensive analysis of pyroptotic gene prognostic signatures associated with tumor immune microenvironment and genomic mutation in breast cancer. Front Immunol (2022) 13:933779. doi: 10.3389/fimmu.2022.933779
61. Jiang M, Wu X, Bao S, Wang X, Qu F, Liu Q, et al. Immunometabolism characteristics and a potential prognostic risk model associated with TP53 mutations in breast cancer. Front Immunol (2022) 13:946468. doi: 10.3389/fimmu.2022.946468
63. Loi S, Michiels S, Salgado R, Sirtaine N, Jose V, Fumagalli D, et al. Tumor infiltrating lymphocytes are prognostic in triple negative breast cancer and predictive for trastuzumab benefit in early breast cancer: results from the FinHER trial. Ann Oncol (2014) 25(8):1544–50. doi: 10.1093/annonc/mdu112
64. Adams S, Gray RJ, Demaria S, Goldstein L, Perez EA, Shulman LN, et al. Prognostic value of tumor-infiltrating lymphocytes in triple-negative breast cancers from two phase III randomized adjuvant breast cancer trials: ECOG 2197 and ECOG 1199. J Clin Oncol (2014) 32(27):2959–66. doi: 10.1200/jco.2013.55.0491
65. Sui S, An X, Xu C, Li Z, Hua Y, Huang G, et al. An immune cell infiltration-based immune score model predicts prognosis and chemotherapy effects in breast cancer. Theranostics (2020) 10(26):11938–49. doi: 10.7150/thno.49451
66. Ali HR, Provenzano E, Dawson SJ, Blows FM, Liu B, Shah M, et al. Association between CD8+ T-cell infiltration and breast cancer survival in 12,439 patients. Ann Oncol (2014) 25(8):1536–43. doi: 10.1093/annonc/mdu191
67. Mehta AK, Kadel S, Townsend MG, Oliwa M, Guerriero JL. Macrophage biology and mechanisms of immune suppression in breast cancer. Front Immunol (2021) 12:643771. doi: 10.3389/fimmu.2021.643771
68. Dore MP, Portoghese M, Pes GM. The elderly with glucose-6-phosphate dehydrogenase deficiency are more susceptible to cardiovascular disease. J Atheroscler Thromb (2021) 28(6):604–10. doi: 10.5551/jat.56531
69. Cheng N, Bai X, Shu Y, Ahmad O, Shen P. Targeting tumor-associated macrophages as an antitumor strategy. Biochem Pharmacol (2021) 183:114354. doi: 10.1016/j.bcp.2020.114354
70. Chen Y, Song Y, Du W, Gong L, Chang H, Zou Z. Tumor-associated macrophages: An accomplice in solid tumor progression. J BioMed Sci (2019) 26(1):78. doi: 10.1186/s12929-019-0568-z
71. Darvin P, Toor SM, Sasidharan Nair V, Elkord E. Immune checkpoint inhibitors: recent progress and potential biomarkers. Exp Mol Med (2018) 50(12):1–11. doi: 10.1038/s12276-018-0191-1
72. Saito Y, Koya J, Araki M, Kogure Y, Shingaki S, Tabata M, et al. Landscape and function of multiple mutations within individual oncogenes. Nature (2020) 582(7810):95–9. doi: 10.1038/s41586-020-2175-2
73. Zhang Q, Li X, Wei Z, Ye X, Zhu L, Xie M, et al. Risk factors and clinical characteristics of non-promyelocytic acute myeloid leukemia of intracerebral hemorrhage: A single center study in China. J Clin Neurosci (2017) 44:203–6. doi: 10.1016/j.jocn.2017.06.058
74. Su S, Zhao J, Xing Y, Zhang X, Liu J, Ouyang Q, et al. Immune checkpoint inhibition overcomes ADCP-induced immunosuppression by macrophages. Cell (2018) 175(2):442–57.e23. doi: 10.1016/j.cell.2018.09.007
75. Terranova-Barberio M, Pawlowska N, Dhawan M, Moasser M, Chien AJ, Melisko ME, et al. Exhausted T cell signature predicts immunotherapy response in ER-positive breast cancer. Nat Commun (2020) 11(1):3584. doi: 10.1038/s41467-020-17414-y
76. Setordzi P, Chang X, Liu Z, Wu Y, Zuo D. The recent advances of PD-1 and PD-L1 checkpoint signaling inhibition for breast cancer immunotherapy. Eur J Pharmacol (2021) 895:173867. doi: 10.1016/j.ejphar.2021.173867
77. Wu S, Ou T, Xing N, Lu J, Wan S, Wang C, et al. Whole-genome sequencing identifies ADGRG6 enhancer mutations and FRS2 duplications as angiogenesis-related drivers in bladder cancer. Nat Commun (2019) 10(1):720. doi: 10.1038/s41467-019-08576-5
Keywords: breast cancer, nicotinamide metabolism, prognosis, tumor microenvironment, immunotherapy
Citation: Cui H, Ren X, Dai L, Chang L, Liu D, Zhai Z, Kang H and Ma X (2023) Comprehensive analysis of nicotinamide metabolism-related signature for predicting prognosis and immunotherapy response in breast cancer. Front. Immunol. 14:1145552. doi: 10.3389/fimmu.2023.1145552
Received: 16 January 2023; Accepted: 22 February 2023;
Published: 08 March 2023.
Edited by:
Jinghua Pan, Jinan University, ChinaReviewed by:
Xuxu Gou, University of California, San Francisco, United StatesVasyl Nagibin, National Academy of Sciences of Ukraine, Ukraine
Nikolay Mikhaylovich Borisov, Moscow Institute of Physics and Technology, Russia
Copyright © 2023 Cui, Ren, Dai, Chang, Liu, Zhai, Kang and Ma. This is an open-access article distributed under the terms of the Creative Commons Attribution License (CC BY). The use, distribution or reproduction in other forums is permitted, provided the original author(s) and the copyright owner(s) are credited and that the original publication in this journal is cited, in accordance with accepted academic practice. No use, distribution or reproduction is permitted which does not comply with these terms.
*Correspondence: Xiaobin Ma, YmluYmlubXhiQHNvaHUuY29t; Huafeng Kang, a2FuZ2h1YWZlbmcxOTczQDEyNi5jb20=
†These authors have contributed equally to this work and share first authorship