 Xianyuan Chen
 Shengsheng Yang1,2†
 Shun Yu
94% of researchers rate our articles as excellent or good
Learn more about the work of our research integrity team to safeguard the quality of each article we publish.
Find out more
ORIGINAL RESEARCH article
Front. Immunol. , 03 July 2023
Sec. Autoimmune and Autoinflammatory Disorders : Autoimmune Disorders
Volume 14 - 2023 | https://doi.org/10.3389/fimmu.2023.1136925
Background: Disease activity is relevant to the treatment and prognosis of axSpA, and methods to quantitatively assess disease activity and efficacy of axSpA are still being explored.
Objective: The purpose of this study was to find an optimal quantitative indicator for evaluating disease activity and curative effect of axSpA, using multi-b-values-fitting RESOLVE DWI.
Methods: The prospective study included 106 patients divided into axSpA group (n=89) and no-axSpA group (n=17) by Assessment of Spondyloarthritis international Society (ASAS) criteria. The axSpA group were divided into active group and inactive group according to ASDAS-CRP. The active group treated with systematic tumour necrosis factor inhibitors (TNFi) was selected as treatment group (n=20). All patients underwent MRI examination of sacroiliac joints (SIJs), including RESOLVE DWI. The ADC values of subchondral bone marrow in SIJs were measured (ADC50,500 was b=50,500s/mm2 fitting, ADC50,700 was b=50,700s/mm2 fitting, and ADC50,500,700 was b=50,500,700s/mm2 fitting). By comparing the ADC values between different groups, a relatively optimal b-values-fitting sequence was obtained, further evaluating curative effect of the treatment group.
Resultd: The ADC values of axSpA group, inactive group and active group SIJs were all higher than those of no-axSpA group. The ADC values of active group SIJs were all higher than those of inactive group. ADC50,500,700 had the largest AUC, relative higher sensitivity and specificity while taking account of the image quality than ADC50,700 and ADC50,500 between different groups. In the treatment group, there was no significant difference in ADC values between pre-treatment and 3 weeks, 3 weeks and 6 weeks, 6 weeks and 12 weeks (all P>0.0083, Bonferroni-corrected threshold), while the decreased ADC values in the interval of 6 weeks or more were statistically significant (all P<0.0083, Bonferroni-corrected threshold).
Conclusion: Multi-b-values-fitting (b=50,500,700s/mm2) RESOLVE DWI has a certain advantage in evaluating disease activity of axSpA. It was worth noting that short-term review (3 weeks or less) of RESOLVE DWI was unsatisfactory and review at 6 weeks or later would help to evaluate curative effect of axSpA.
AxSpA is a chronic systemic autoimmune disease involving sacroiliac joints, predominantly affecting sacroiliac joints and correlated with HLA-B27 (1, 2). The main symptom is inflammatory low back pain (LBP). By virtue of its long course, poor prognosis and high disability rate, it seriously affects the quality of life and working ability of patients (3, 4). Early diagnosis and early treatment are particularly important.
The study about the pathogenesis of sacroiliitis displayed that pannus formation in subchondral tissue may be the pathological sign of sacroiliac arthritis in the early stage, followed by inflammatory cell infiltration, pannus formation progress bone plate injury and cartilage invasion (5). In addition, several inflammatory factors, including TNF- α, were also involved in the above-mentioned inflammatory response process, which were also targets for clinical drug therapy (6, 7). Therefore, the inflammatory response, caused by inflammatory cells and factors, play a vital role in the occurrence and development of sacroiliac arthritis. The process of inflammatory reaction caused by inflammatory cells can be characterized by the increase of laboratory indicators (CRP, ESR) and the formation of local bone marrow edema (BME). In 2009, ASAS proposed that imaging changes of active inflammation of sacroiliac joints play an important role in the diagnosis of axSpA, especially MRI (8). In 2019, ASAS updated consensus definitions for MRI lesions of the sacroiliac joints (9). By virtue of multiple sequences and directions, MRI can more sensitively distinguish the signal of BME of sacroiliac joints (10).
Conventional DWI is a functional MRI technique, which can non-invasively evaluate the random motion of water molecules by measuring ADC values. In several studies, ADC values as a quantitative indicator were used to diagnose SpA and evaluate the disease activity of patients with axSpA (11–15). However, conventional DWI is vulnerable to geometric distortion, T2*-induced blurring, and susceptibility artifacts, which will reduce the quality of the image and the detection of lesions. RESOLVE-DWI has been suggested as an alternative approach to overcome the limitations of conventional DWI through innovative technology, whose core is that the k-space is divided into several segments along the direction of the readout (16–18). The superiority of the RESOLVE DWI sequence has been displayed in various organs, including the brain, head and neck, and pelvis (19–22), except the axial skeleton. Furthermore, in the study of Salma et al., the fitting of multiple low b-values can achieve similar lesion detection rates with high b-values (23). There were few reports about the application of RESOLVE DWI in the sacroiliac joints, and even fewer with multiple b-values fitting.
The clinical treatment decision of the patients with axSpA depends on the disease activity, evaluated by ASDAS widely, which is a comprehensive assessment of clinical symptoms and laboratory data (24). At the present time, reducing disease activity by comprehensive treatment, including TNFi (25, 26), is recommended for patients with high activity (ASDAS≥2.1) (27). ASAS/EULAR, jointly developed by axSpA guidelines, recommended in 2016 that patients with continuous relief of inflammation should be considered for reducing TNFi (28), which was help for timely adjustment of clinical treatment plan to reduce the financial burden of patients and side effects. Currently, although the ASDAS score is widely accepted in assessing disease activity of axSpA and clinical monitoring the curative effect of axSpA, it is affected by subjective factors of the patients, which may cause some bias.
In this study, multi-b-values fitting RESOLVE DWI was used in the examination of sacroiliac joints in patients with axSpA, no-axSpA or treatment to discuss the value of multi-b-values-fitting RESOLVE DWI in distinguishing the inflammatory activity of sacroiliac joints and evaluate and monitor curative effect of axSpA.
This prospective clinical study was conducted with the approval of the institutional review board (K2016-04-015, K2020-07-023). Written informed consent was obtained from all of the participants.
This study collected 89 participants with axSpA (axSpA group) and 17 participants with normal sacroiliac joints (no-axSpA group), admitted to our institution from May 2017 to May 2021 (Supplementary Figure S1). A total of 89 individuals met the inclusion criteria of axSpA group: accordance with the ASAS (8), low back pain persisted for more than 3 months, age at symptom onset of less than 45 years. A total of 17 individuals met the inclusion criteria of no-axSpA group: sacroiliac joints MR examination because of simple chronic low back pain, absence of high signal intensity in subchondral bone marrow of bilateral sacroiliac joints in fat suppression proton density weighted imaging (PDWI), exclusion from axSpA. Exclusion criteria: contraindications of MR examination, primary osteoporosis, immune system diseases, tumors, axSpA complicated with other bone diseases or history of using hormones and immune drugs in recent 6 months, incomplete data, including clinical, laboratory and MRI. In addition, the activity group treated with systematic TNFi (Etanercept, manufacturer: Pfizer Investment Co., Ltd.; related precautions were operated according to the instructions; usage: once a week, once 50mg.) was selected as the treatment group(n=20). The treatment group began regular TNFi treatment after the first MR examination.
Two rheumatologists applied the ASAS classification criteria to classify participants into either the axSpA group or the no-axSpA group, independently. Disagreement between the rheumatologists was resolved in consensus. For a total of 89 participants diagnosed with axSpA according to the criteria of ASAS (54 male and 35 female participants; age: median, 32.0 years; IQR: 25.0–47.5 years; range, 17–71 years). The remaining 17 participants were classified as no-axSpA group (10 male and 7 female participants; age: median, 39.0 years; IQR, 29.5–45.0 years; range, 17–57 years) (Table 1). ASDAS which assesses the activity of ax-SpA is associated with back pain, morning stiffness, patient global assessment, peripheral pain, swelling, and CRP level, as detailed in the formula in Table 1. The axSpA group with ASDAS <1.3 was divided into the inactive group and the ASDAS≥1.3 was divided into the active group. There was no significant difference in sex and age among no-axSpA group, axSpA group, active group and inactive group (all P>0.05) (Supplementary Table S1).
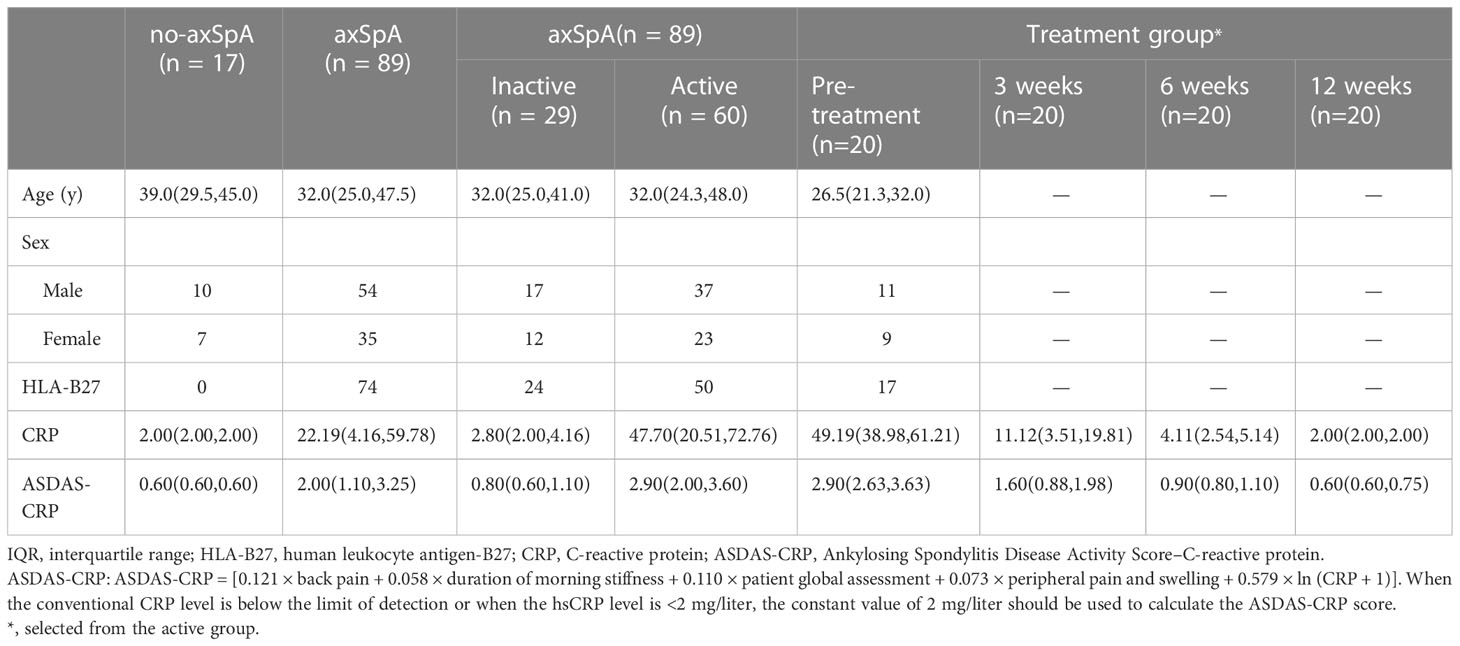
Table 1 Demographic and Clinical Characteristics.
The MRI examinations were performed on a 1.5T unit (MAGNETOM Aera, Manufacturer: Siemens Magnetic Resonance Co., Ltd.), using the body flexed array coil in the supine position participants. All participants’ head entered firstly, and the transverse and oblique coronal positions were scanned from the upper edge of the pelvis to the acetabulum. The scanning sequences included conventional transverse axial T1WI, T2WI and T2WI-fs, oblique coronal T1WI, fat suppression proton density weighted imaging (PDWI), and RESOLVE DWI (Table 2).
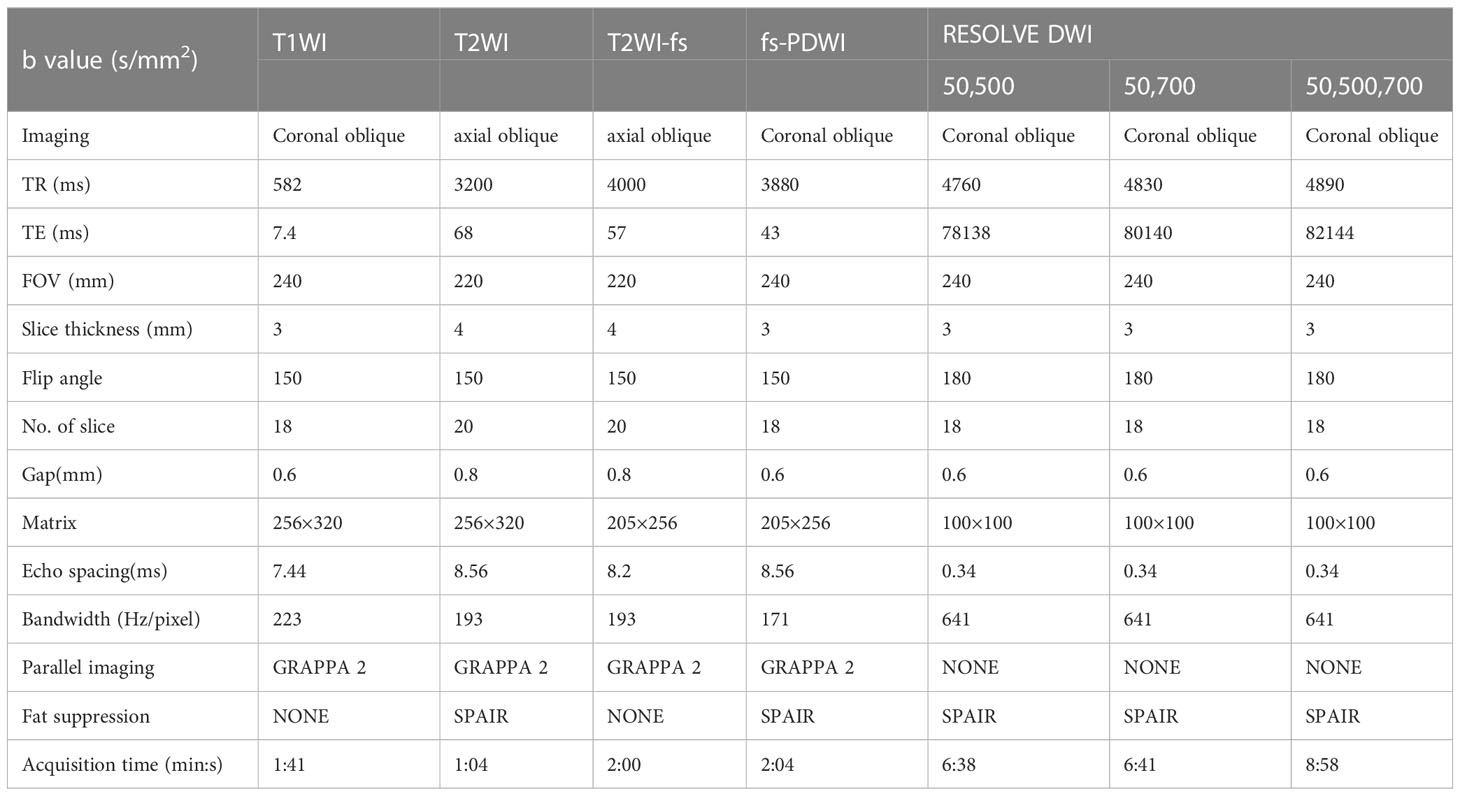
Table 2 Conventional sacroiliac joint MRI sequences and imaging parameters.
At the end of the study period, all MRI examination images (routine MRI sequences and RESOLVE DWI) of the participants were evaluated by two musculoskeletal radiologists, who were blinded to the clinical, laboratory and imaging data. Disagreement between the radiologists was resolved in consensus. The interpreters manually placed ROIs on the corresponding areas of the sacroiliac joints on ADC maps, where the ROI neared but not included the articular cartilage and avoided bone cortex and blood vessels. Referring to conventional MRI sequences, the sacroiliac joints were divided into four subchondral portions (left ilium, left sacrum, right ilium, and right sacrum), and three ROIs were placed on each subchondral portion. To guide ROI placement, the interpreters assessed the sacroiliac joints and took BME as a marker of active inflammatory changes. BME was deemed to be present if the reader identified hyperintense area on PDWI-fs. If BME was detected in the subchondral bone, three non-overlapping ROIs (25–35 mm2) (Figure 1A) were placed on areas of the ADC maps corresponding with the highest signal intensity on the PDWI-fs. If BME was not detected, then three non-overlapping ROIs (25–35 mm2) (Figure 1B) were placed on superior, middle, and inferior subchondral bone marrow. Through this process, 12 ROIs were obtained from the ADC maps each participant. The mean ADC values of the 6 ROIs on the sacral or iliac sides were taken as the final values. The musculoskeletal radiologists with 6 years of experience performed manual image measurements twice with an interval of at least 3 months to assess intra-observer agreement.
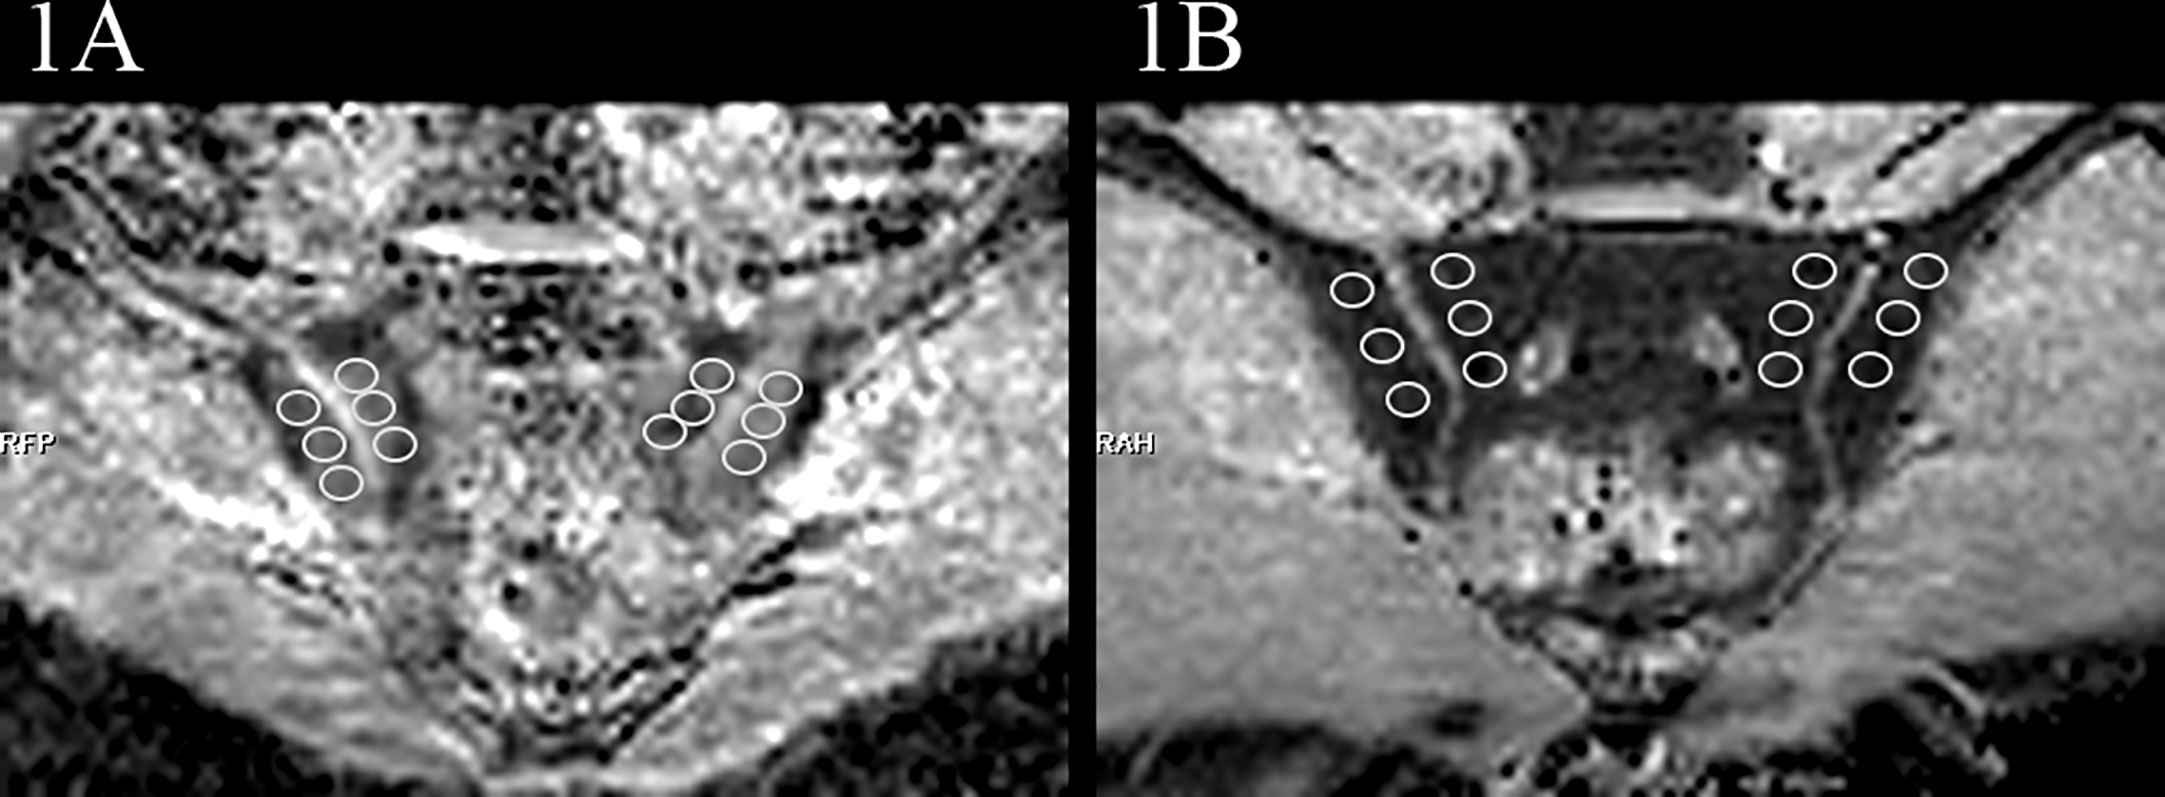
Figure 1 Examples of ROIs placement in the ADC maps (b=50,500,700s/mm2). (A) images of the participant with BME showed ROIs. (B) images of the participant without BME showed ROIs.
All statistical analyses were performed with the Statistical Package for the Social Sciences (SPSS, version 25.0, Inc., Chicago, IL, USA). Categorical variables are presented as frequencies. The Shapiro-Wilk tests were conducted to analyses normality on the continuous variables. Data following normal distribution was represented by means ± standard deviation (SD) and non-normally distributed data was represented by median and IQR. The Wilcoxon test was performed to compare ADC values of sacral or iliac sides in sacroiliac joints within each group. The Kruskal-Wallis test was used to compare the difference of ADC values between each group. The receiver operating characteristic (ROC) curve was used to evaluate the diagnostic efficiency of ADC values obtained by fitting with different b values between each group, by calculating area under the curve (AUC), sensitivity, specificity, cut-off value and Youden index. Friedman test was used to compare the ADC values and ASDAS-CRP before treatment, 3 weeks, 6 weeks and 12 weeks after treatment. The Bonferroni correction for multiple comparisons was applied for the comparison of ADC values among the six possible pairwise combinations of different treatment cycles, and P’ <0.0083 showed statistical significance. For the remaining statistical analyses, P< 0.05 was considered to be statistically significant.
In the no-axSpA group, there was no obvious abnormality in sacroiliac joints, the joint spaces on both sides were normal, the joint surfaces were smooth, and the bone signals were uniform. PDWI-fs showed no high signal (Figure 2A), DWI showed slightly low signal (Figure 2B), and ADC maps showed low signal (Figure 2C). The MRI findings of sacroiliac joints in axSpA group mainly included BME, fat deposition and bone erosion. The lesions of BME showed low signal on T1WI, high signal on PDWI-fs, high, equal and slightly high signal on RESOLVE DWI, and high signal on ADC maps. In the inactive group, the high signal intensity of bilateral sacroiliac joints was not obvious on PDWI-fs, RESOLVE DWI and ADC maps (Figures 3A–C). With the aggravation of BME, the higher signals on PDWI-fs (Figures 3A, 4A1 and 5A1), the higher signals on DWI (Figure 3B, 4B1 and 5B1) and ADC maps (Figure 3C, 4C1 and 5C1).
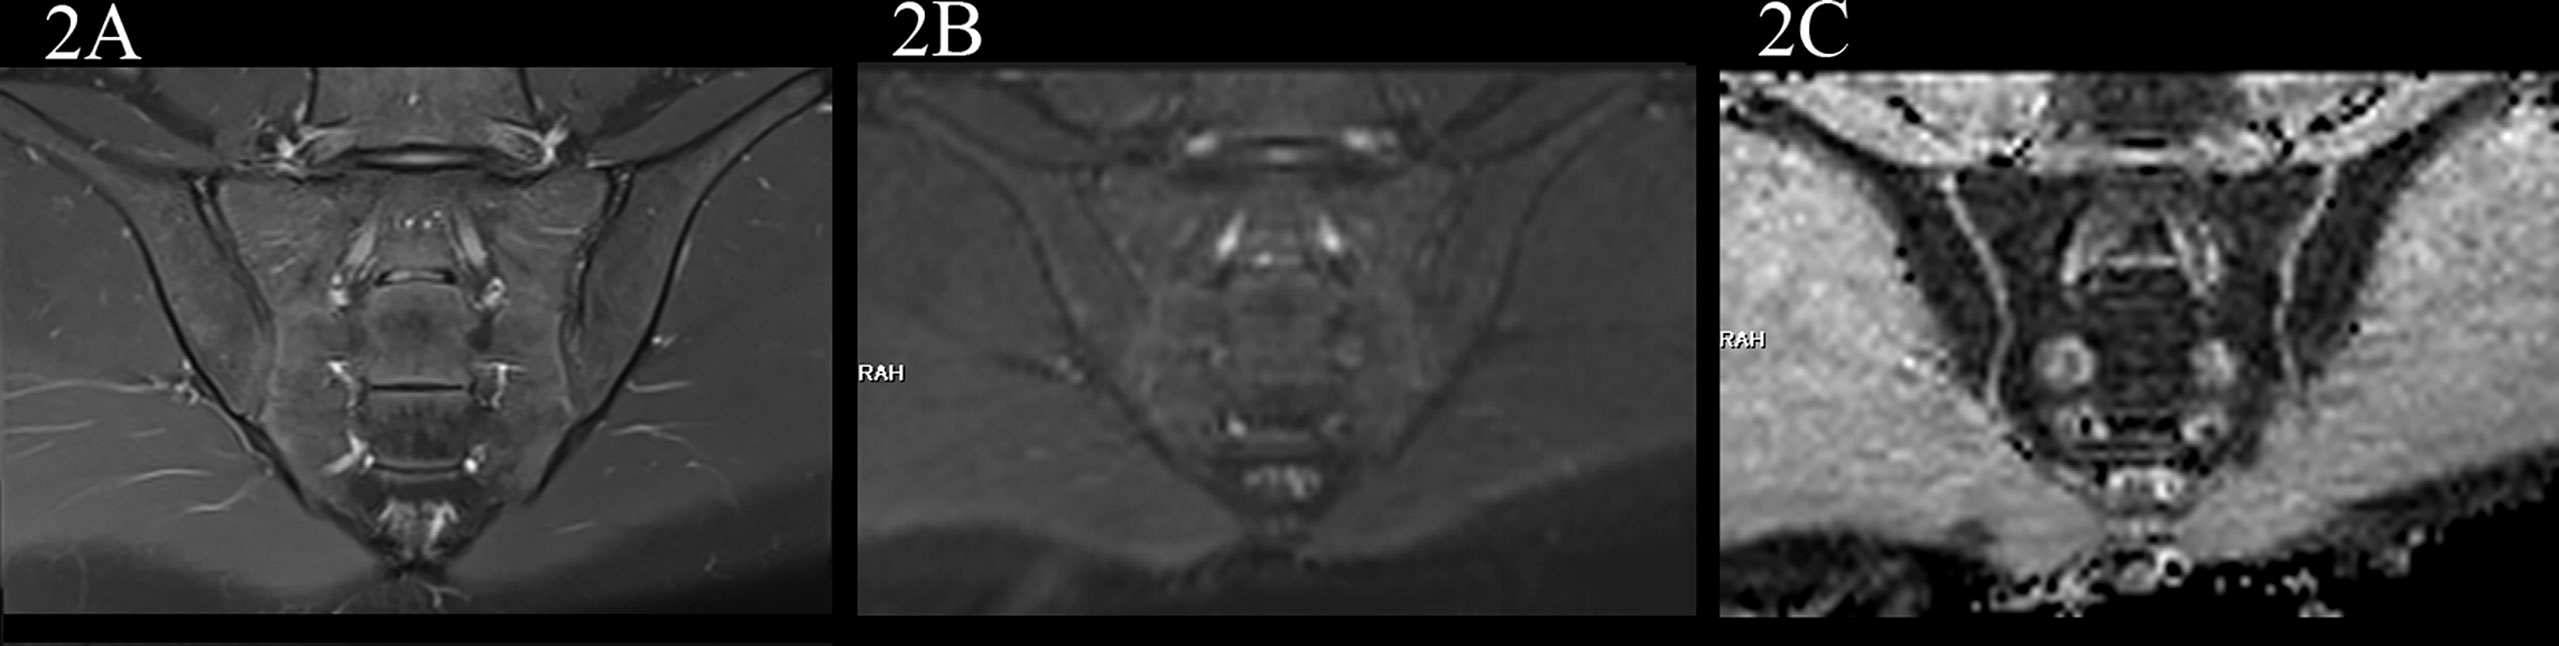
Figure 2 male, 24 years old, HLA-B27: -, CRP:<0.715mg/L, ASDAS-CRP:0.6, belonged to the no-axSpA group. (A, B) The coronal plane of PDWI-fs and RESOLVE DWI (b=50,500,700s/mm2) showed no obvious high signal intensity in the subchondral bone of bilateral sacroiliac joints, and the corresponding articular surfaces are smooth. (C) The ADC maps (b=50,500,700s/mm2) showed that the ADC values of subchondral bone marrow of bilateral sacroiliac joints were 0.455×10⁻³ mm2/s (iliac) and 0.487×10⁻³ mm2/s (sacral), respectively.
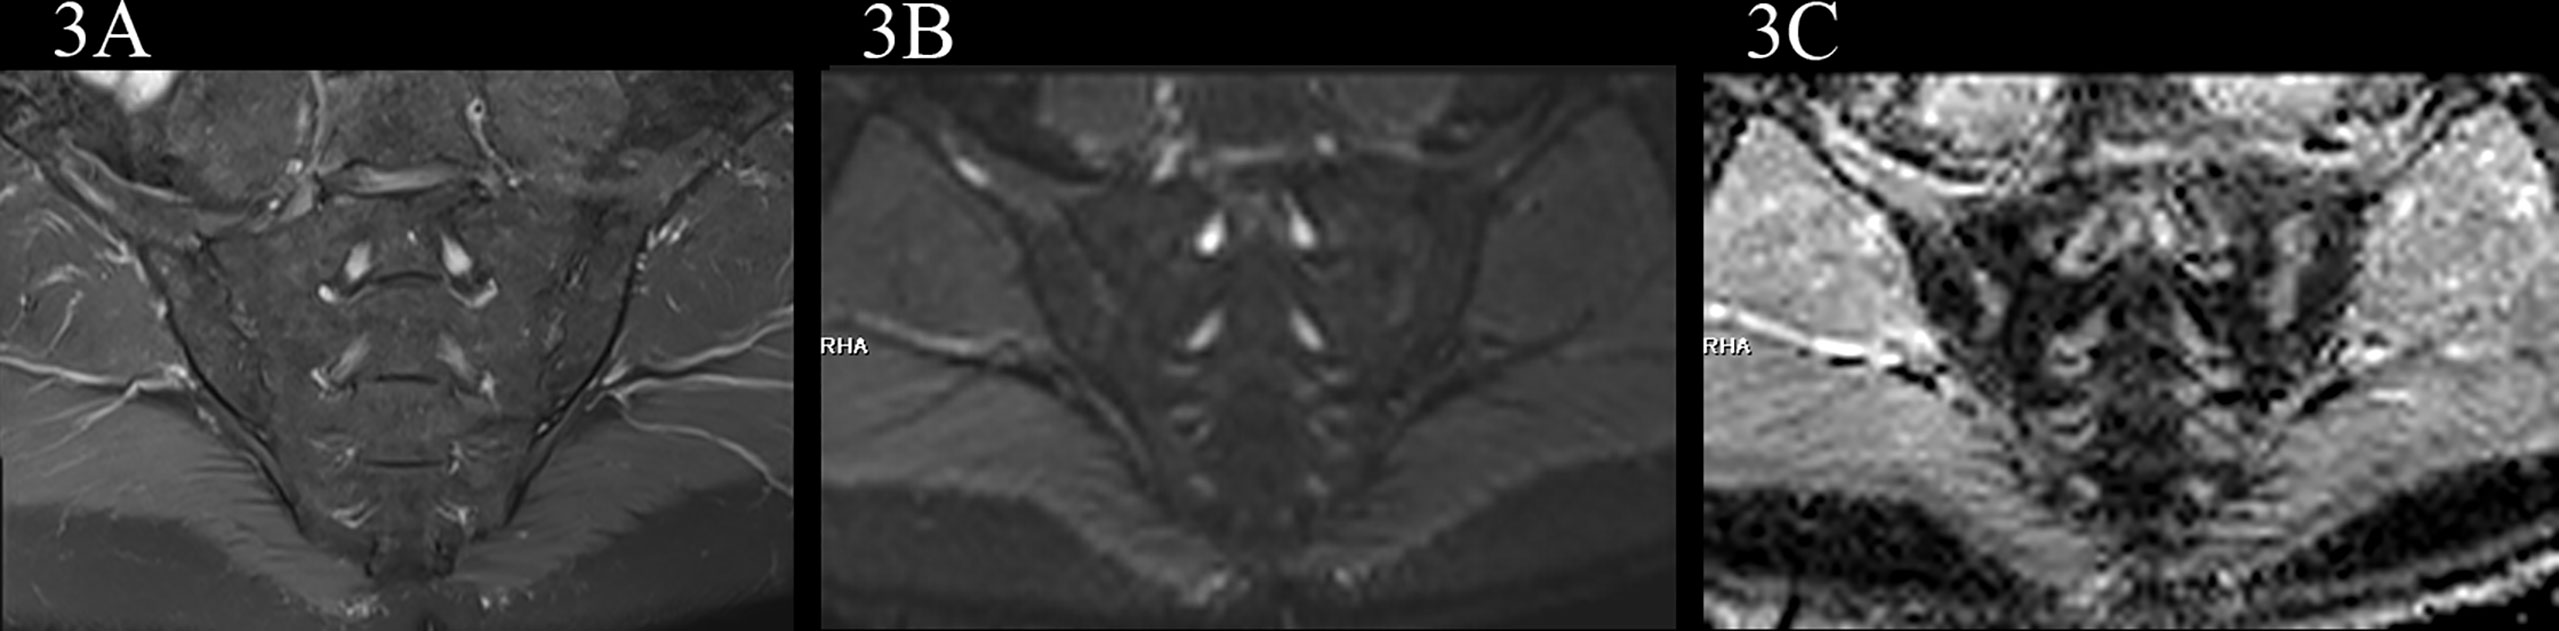
Figure 3 male, 61 years old, HLA-B27: +, CRP:2.85mg/L ASDAS-CRP:0.9, belonged to the inactive group. (A, B) The coronal plane of PDWI-fs and RESOLVE DWI (b=50,500,700s/mm2) did not show significant high signal intensity in subchondral bone marrow area of the sacroiliac joints and slightly rough bilateral sacroiliac joints surfaces. (C) The ADC maps (b=50,500,700s/mm2) showed the ADC values of subchondral bone marrow in bilateral sacroiliac joints were 0.593×10⁻³ mm2/s (iliac) and 0.723×10⁻³ mm2/s (sacral), respectively.
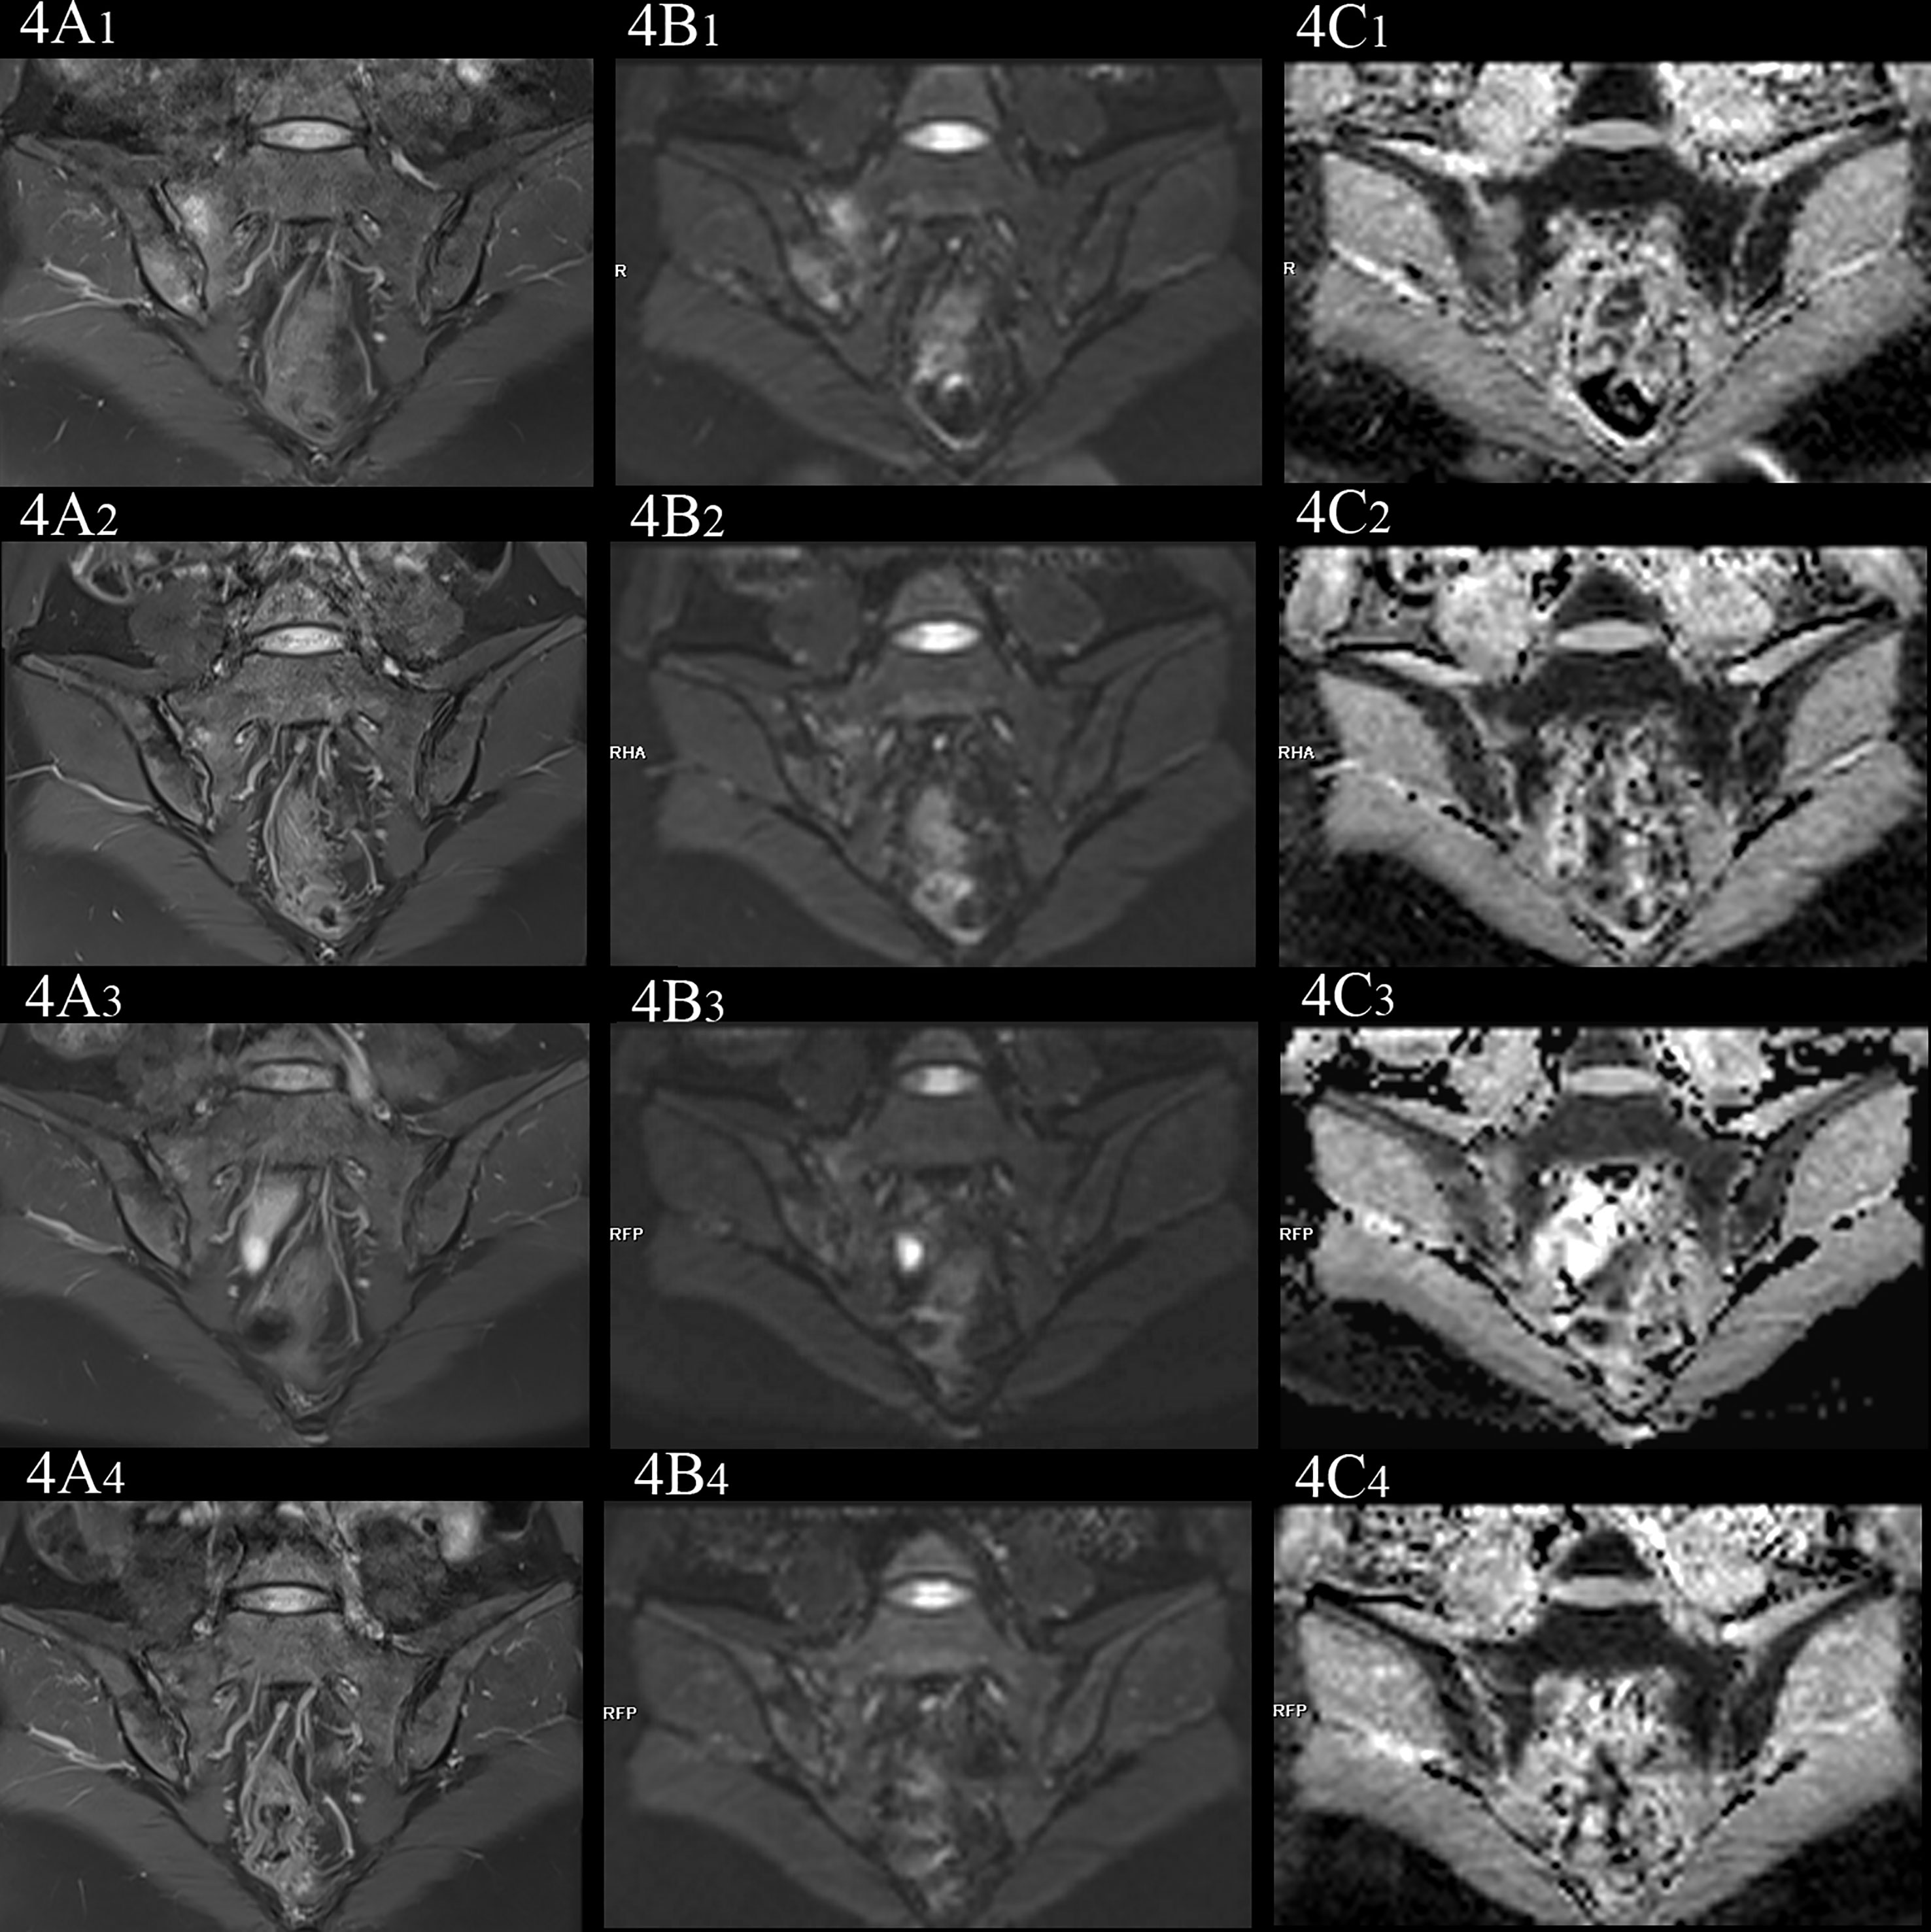
Figure 4 female, 33 years old, HLA-B27: +, CRP:21.7mg/L, ASDAS-CRP:3.4, belonged to active group and the treatment group; (A(1-4)-C(1-4)) showed the same patient before treatment and 3 weeks, 6 weeks and 12 weeks after treatment, respectively. (A(1-4)) showed the coronal plane of PDWI-fs; (B(1-4)) showed the coronal plane of RESOLVE DWI (b=50,500,700s/mm2); (C(1-4)) showed the ADC maps (b=50,500,700s/mm2). In patients with effective treatment, the ASDAS-CRP score decreased with the increase of the treatment cycle (3.4, 0.6, 0.6, 0.6). (A(1-4), B(1-4)) PDWI-fs and RESLOVE DWI showed that the signal in the subchondral bone of bilateral sacroiliac joints decreases, gradually; (C(1-4)) showed that the ADC values in the bone marrow area of the lesion decreased gradually (1.483, 1.327, 1.027, 0.831×10⁻³ mm2/s).
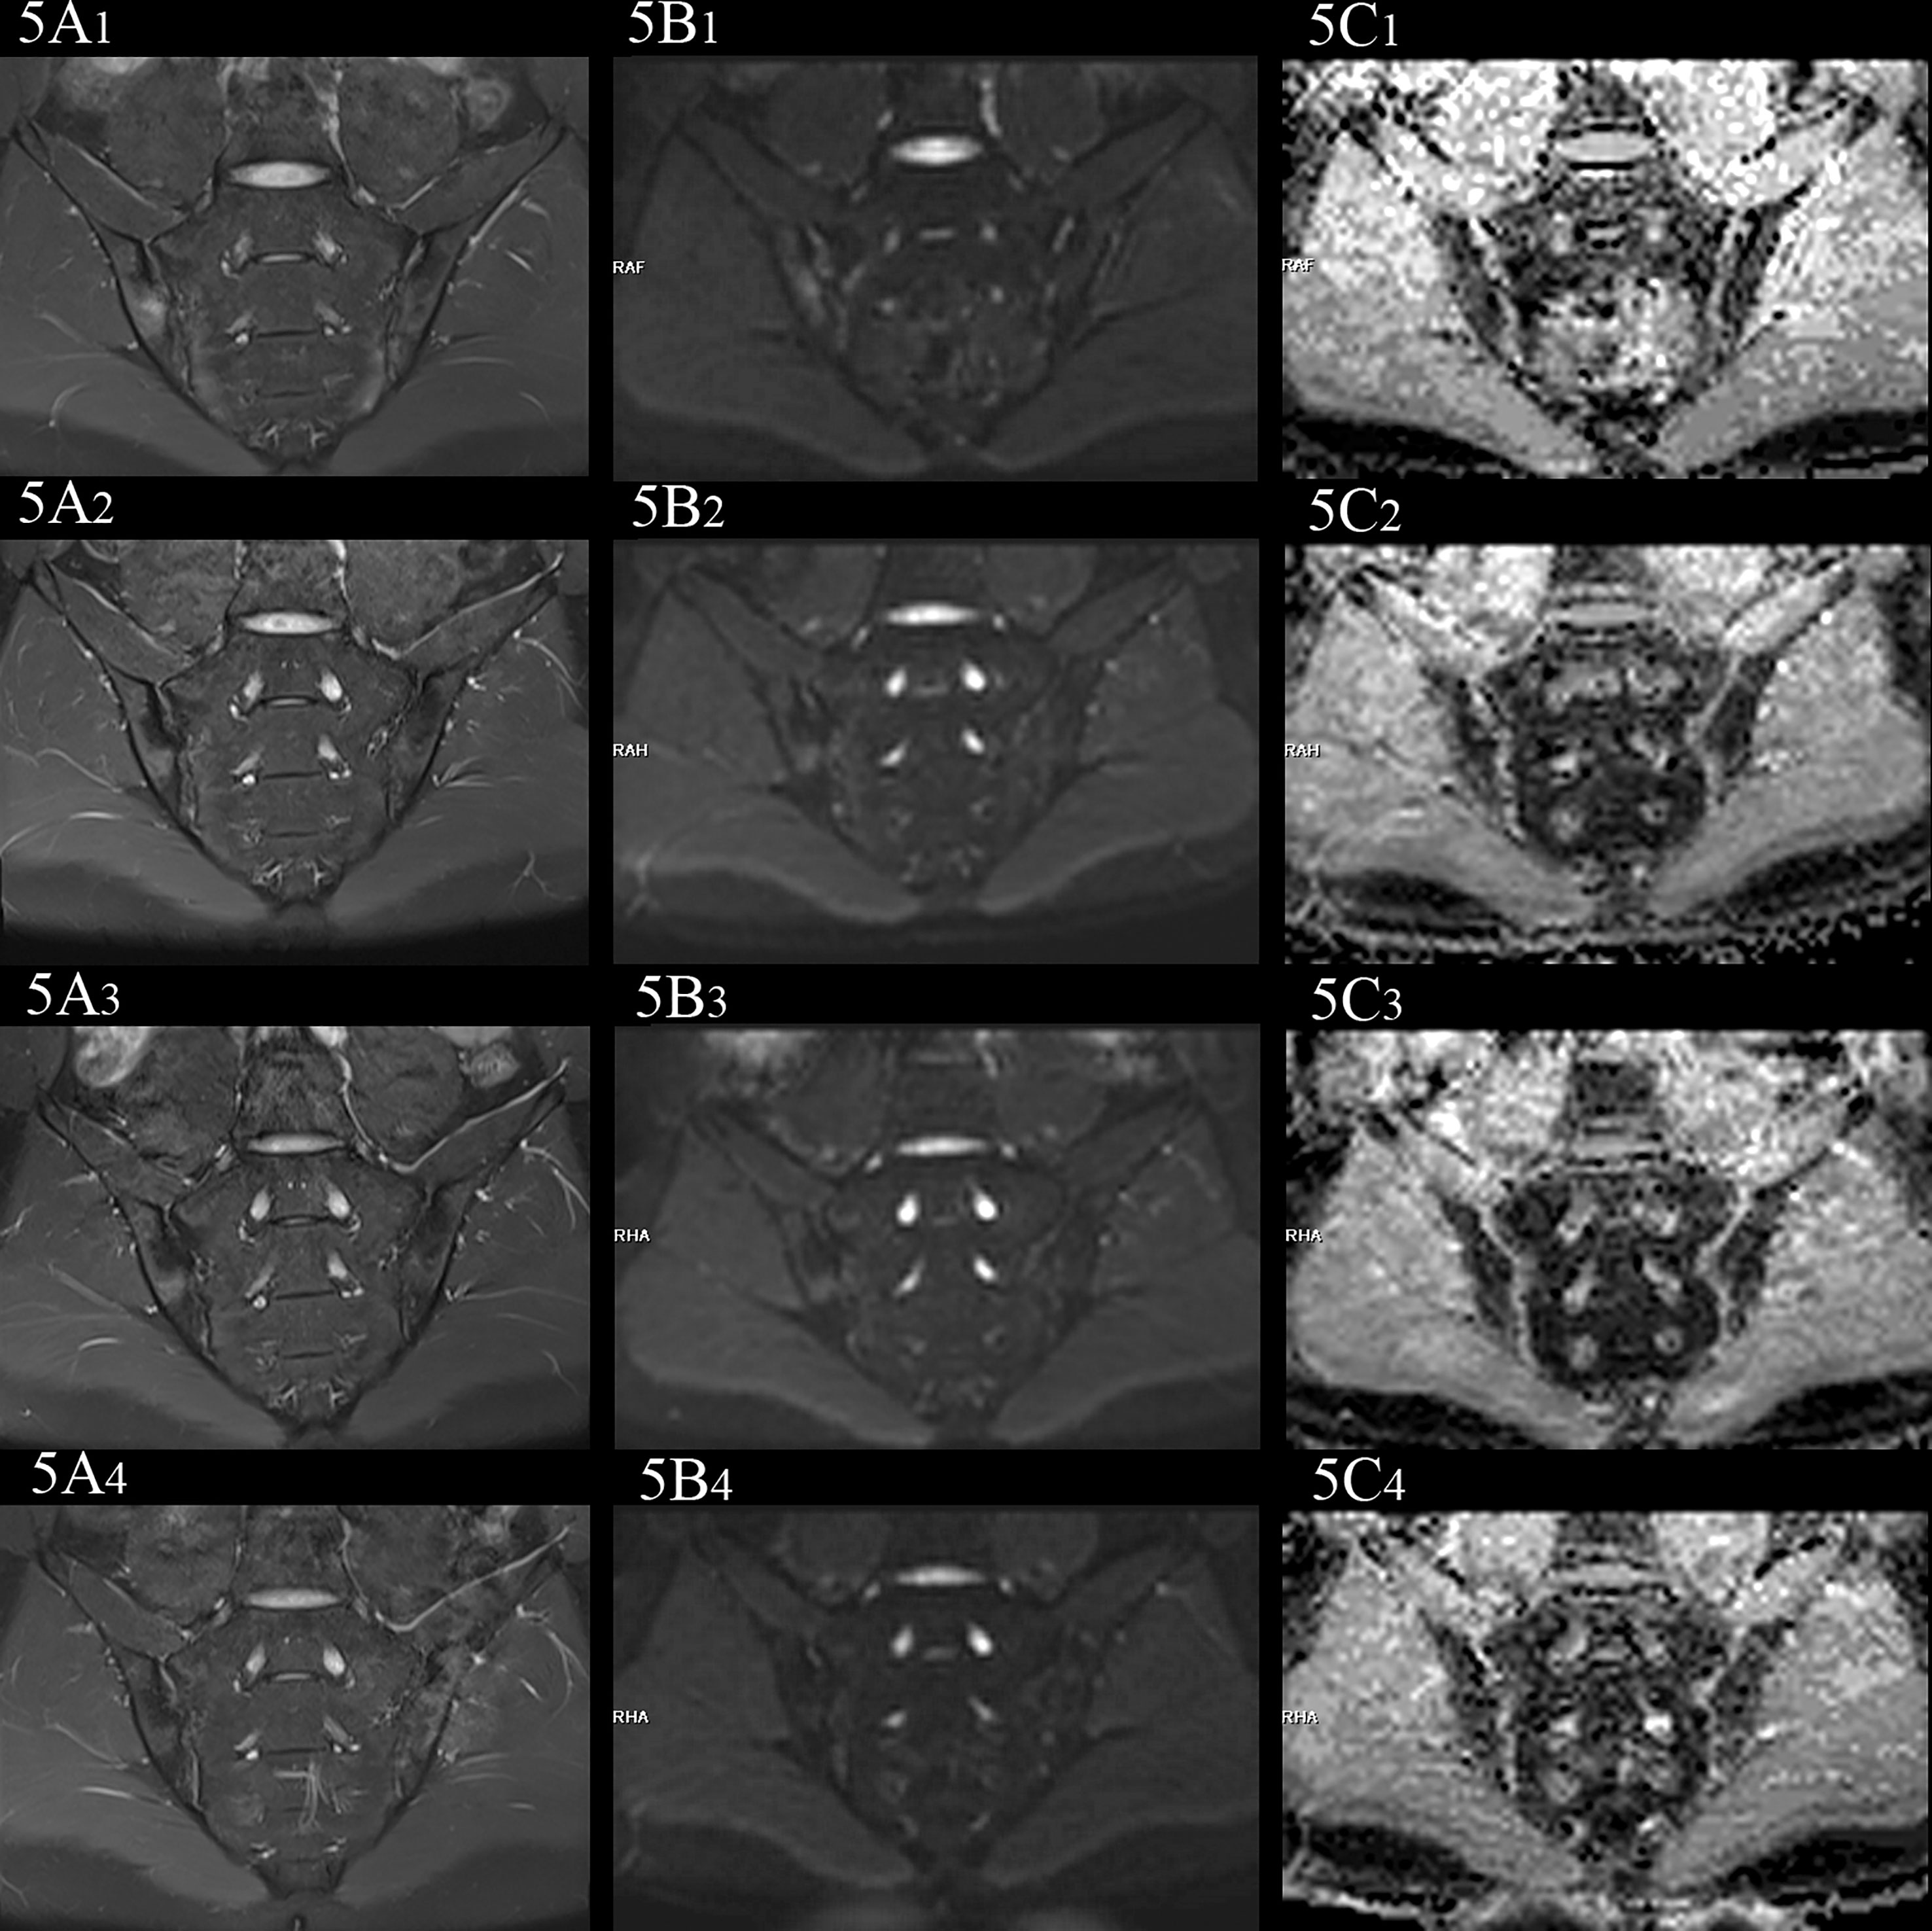
Figure 5 female, 27 years old, HLA-B27: +, CRP:31.5mg/L, ASDAS-CRP:4.6, belonged to active group and the treatment group; (A(1-4)-C(1-4)) showed the same patient before treatment and 3 weeks, 6 weeks and 12 weeks after treatment, respectively. (A(1-4)) showed the coronal plane of PDWI-fs; (B(1-4)) showed the coronal plane of RESOLVE DWI (b=50,500,700s/mm2); (C(1-4)) showed the ADC maps (b=50,500,700s/mm2). In patients with effective treatment, the ASDAS-CRP score decreases with the increase of the treatment cycle (4.6, 3.5, 2.2, 1.5). (A(1-4), B(1-4)) PDWI-fs and RESLOVE DWI showed the gradual decrease of the signal in the subchondral bone of bilateral sacroiliac joints; (C(1-4)) showed the ADC values in the bone marrow area of the lesion decreased gradually (1.047, 0.710, 0.666, 0.648×10⁻³ mm2/s).
It was tested that the ADC values of the sacral and iliac side in the no-axSpA, axSpA, inactive group and active group were not normally distributed, and there was no significant difference in sacral and iliac ADC values in the four groups (all P>0.05). With the increase of b value, the ADC values within each group decreased in different degrees. For the most part ADC50, 500,700 values were lower than the values of ADC50, 500 and ADC50,700 (Figure 6–8, Supplementary Table S2).
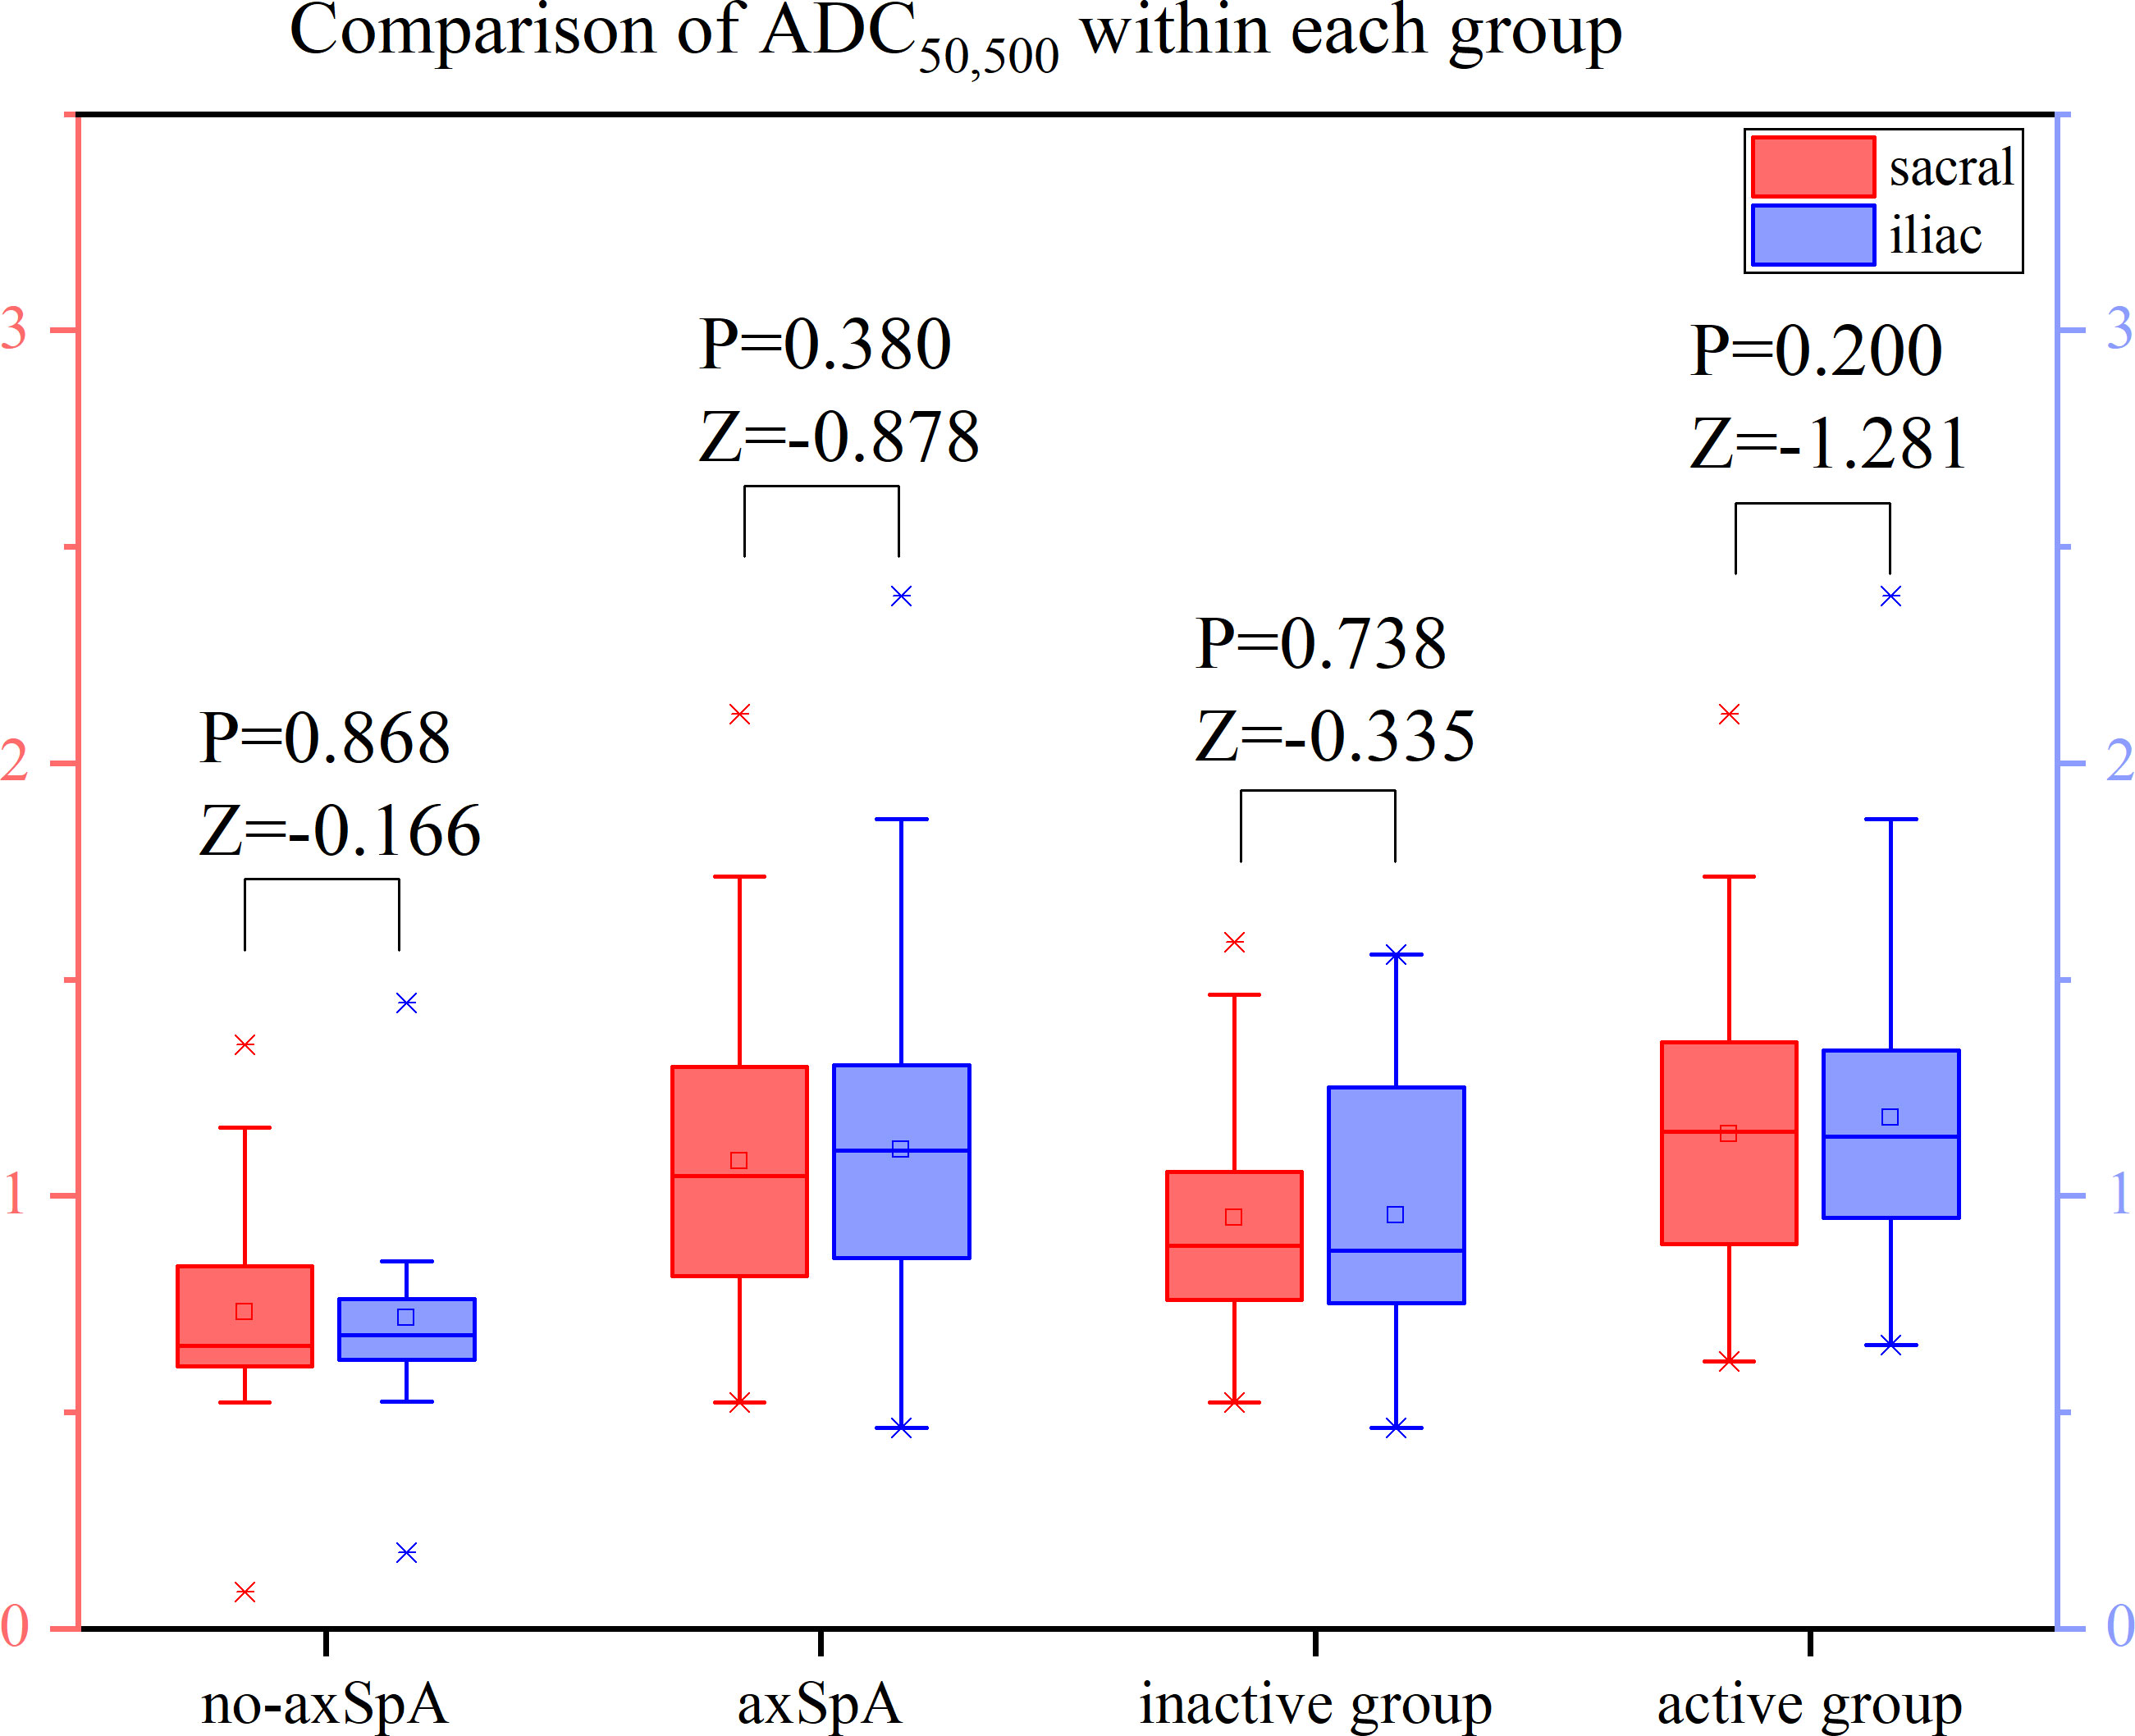
Figure 6 Boxplot for Comparison of ADC50,500 within each group. p-value of <0.05 was considered statistically signifificant.
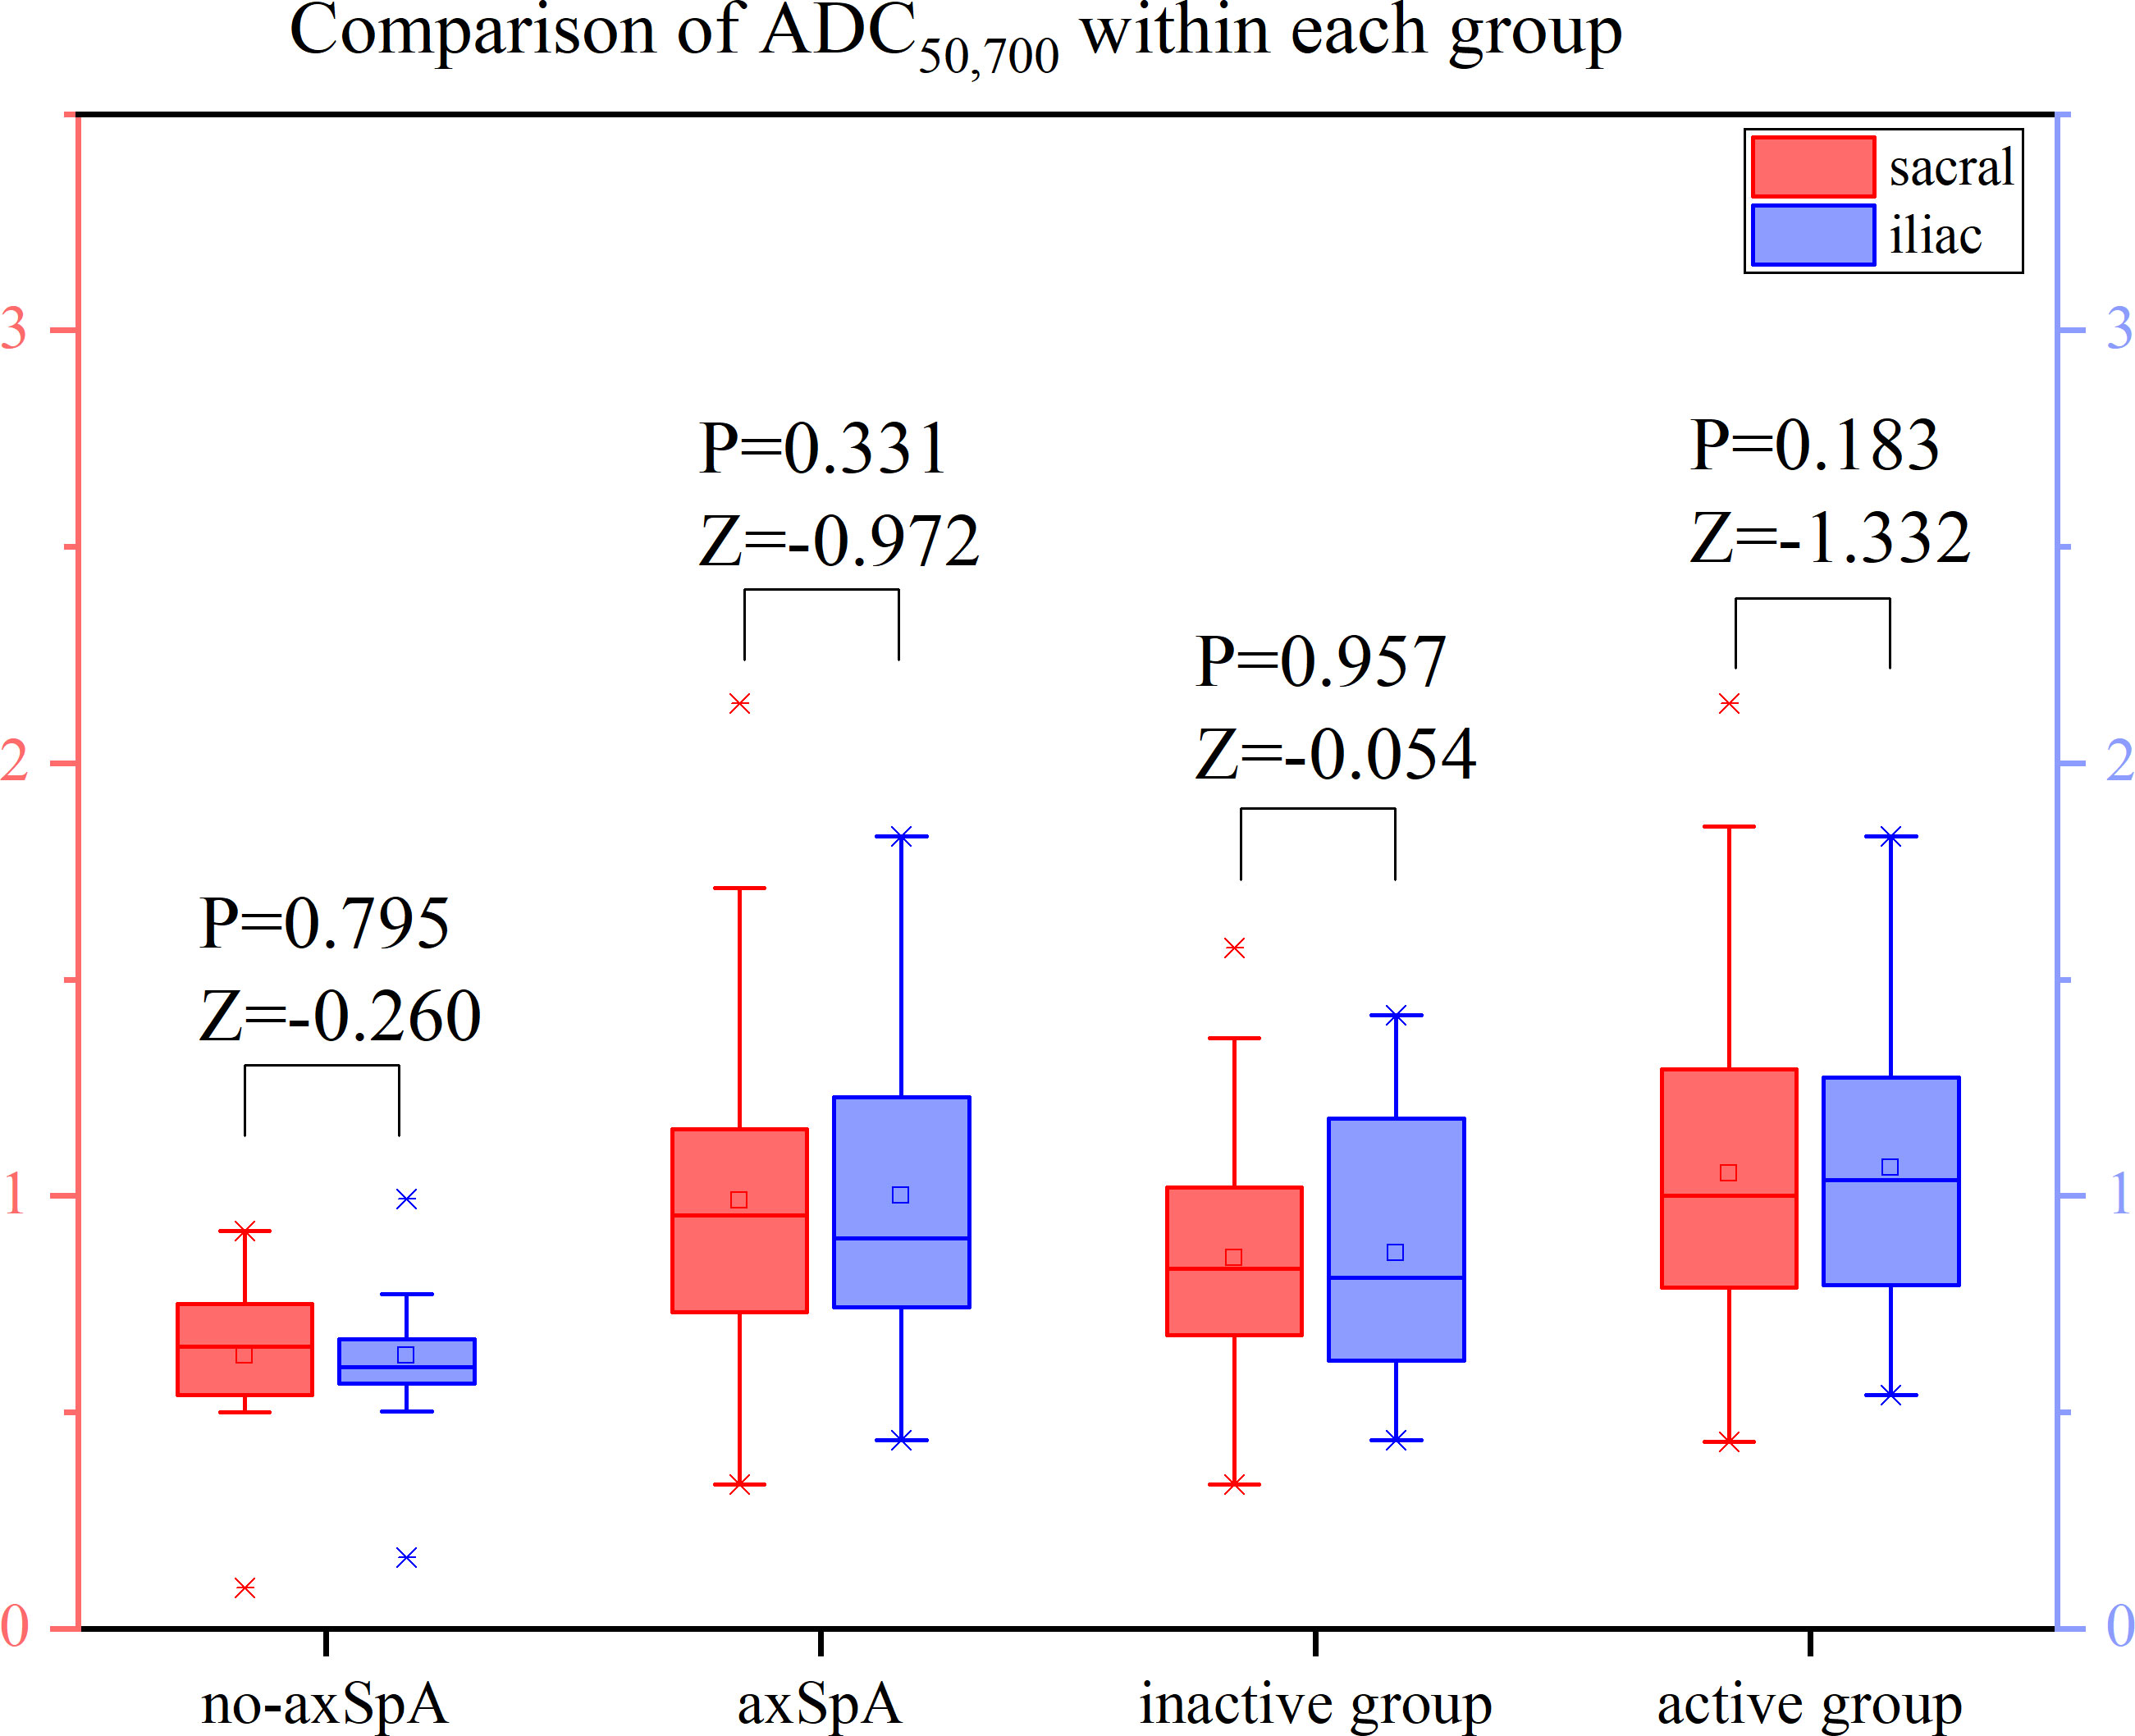
Figure 7 Boxplot for Comparison of ADC50,700 within each group. p-value of <0.05 was considered statistically signifificant.
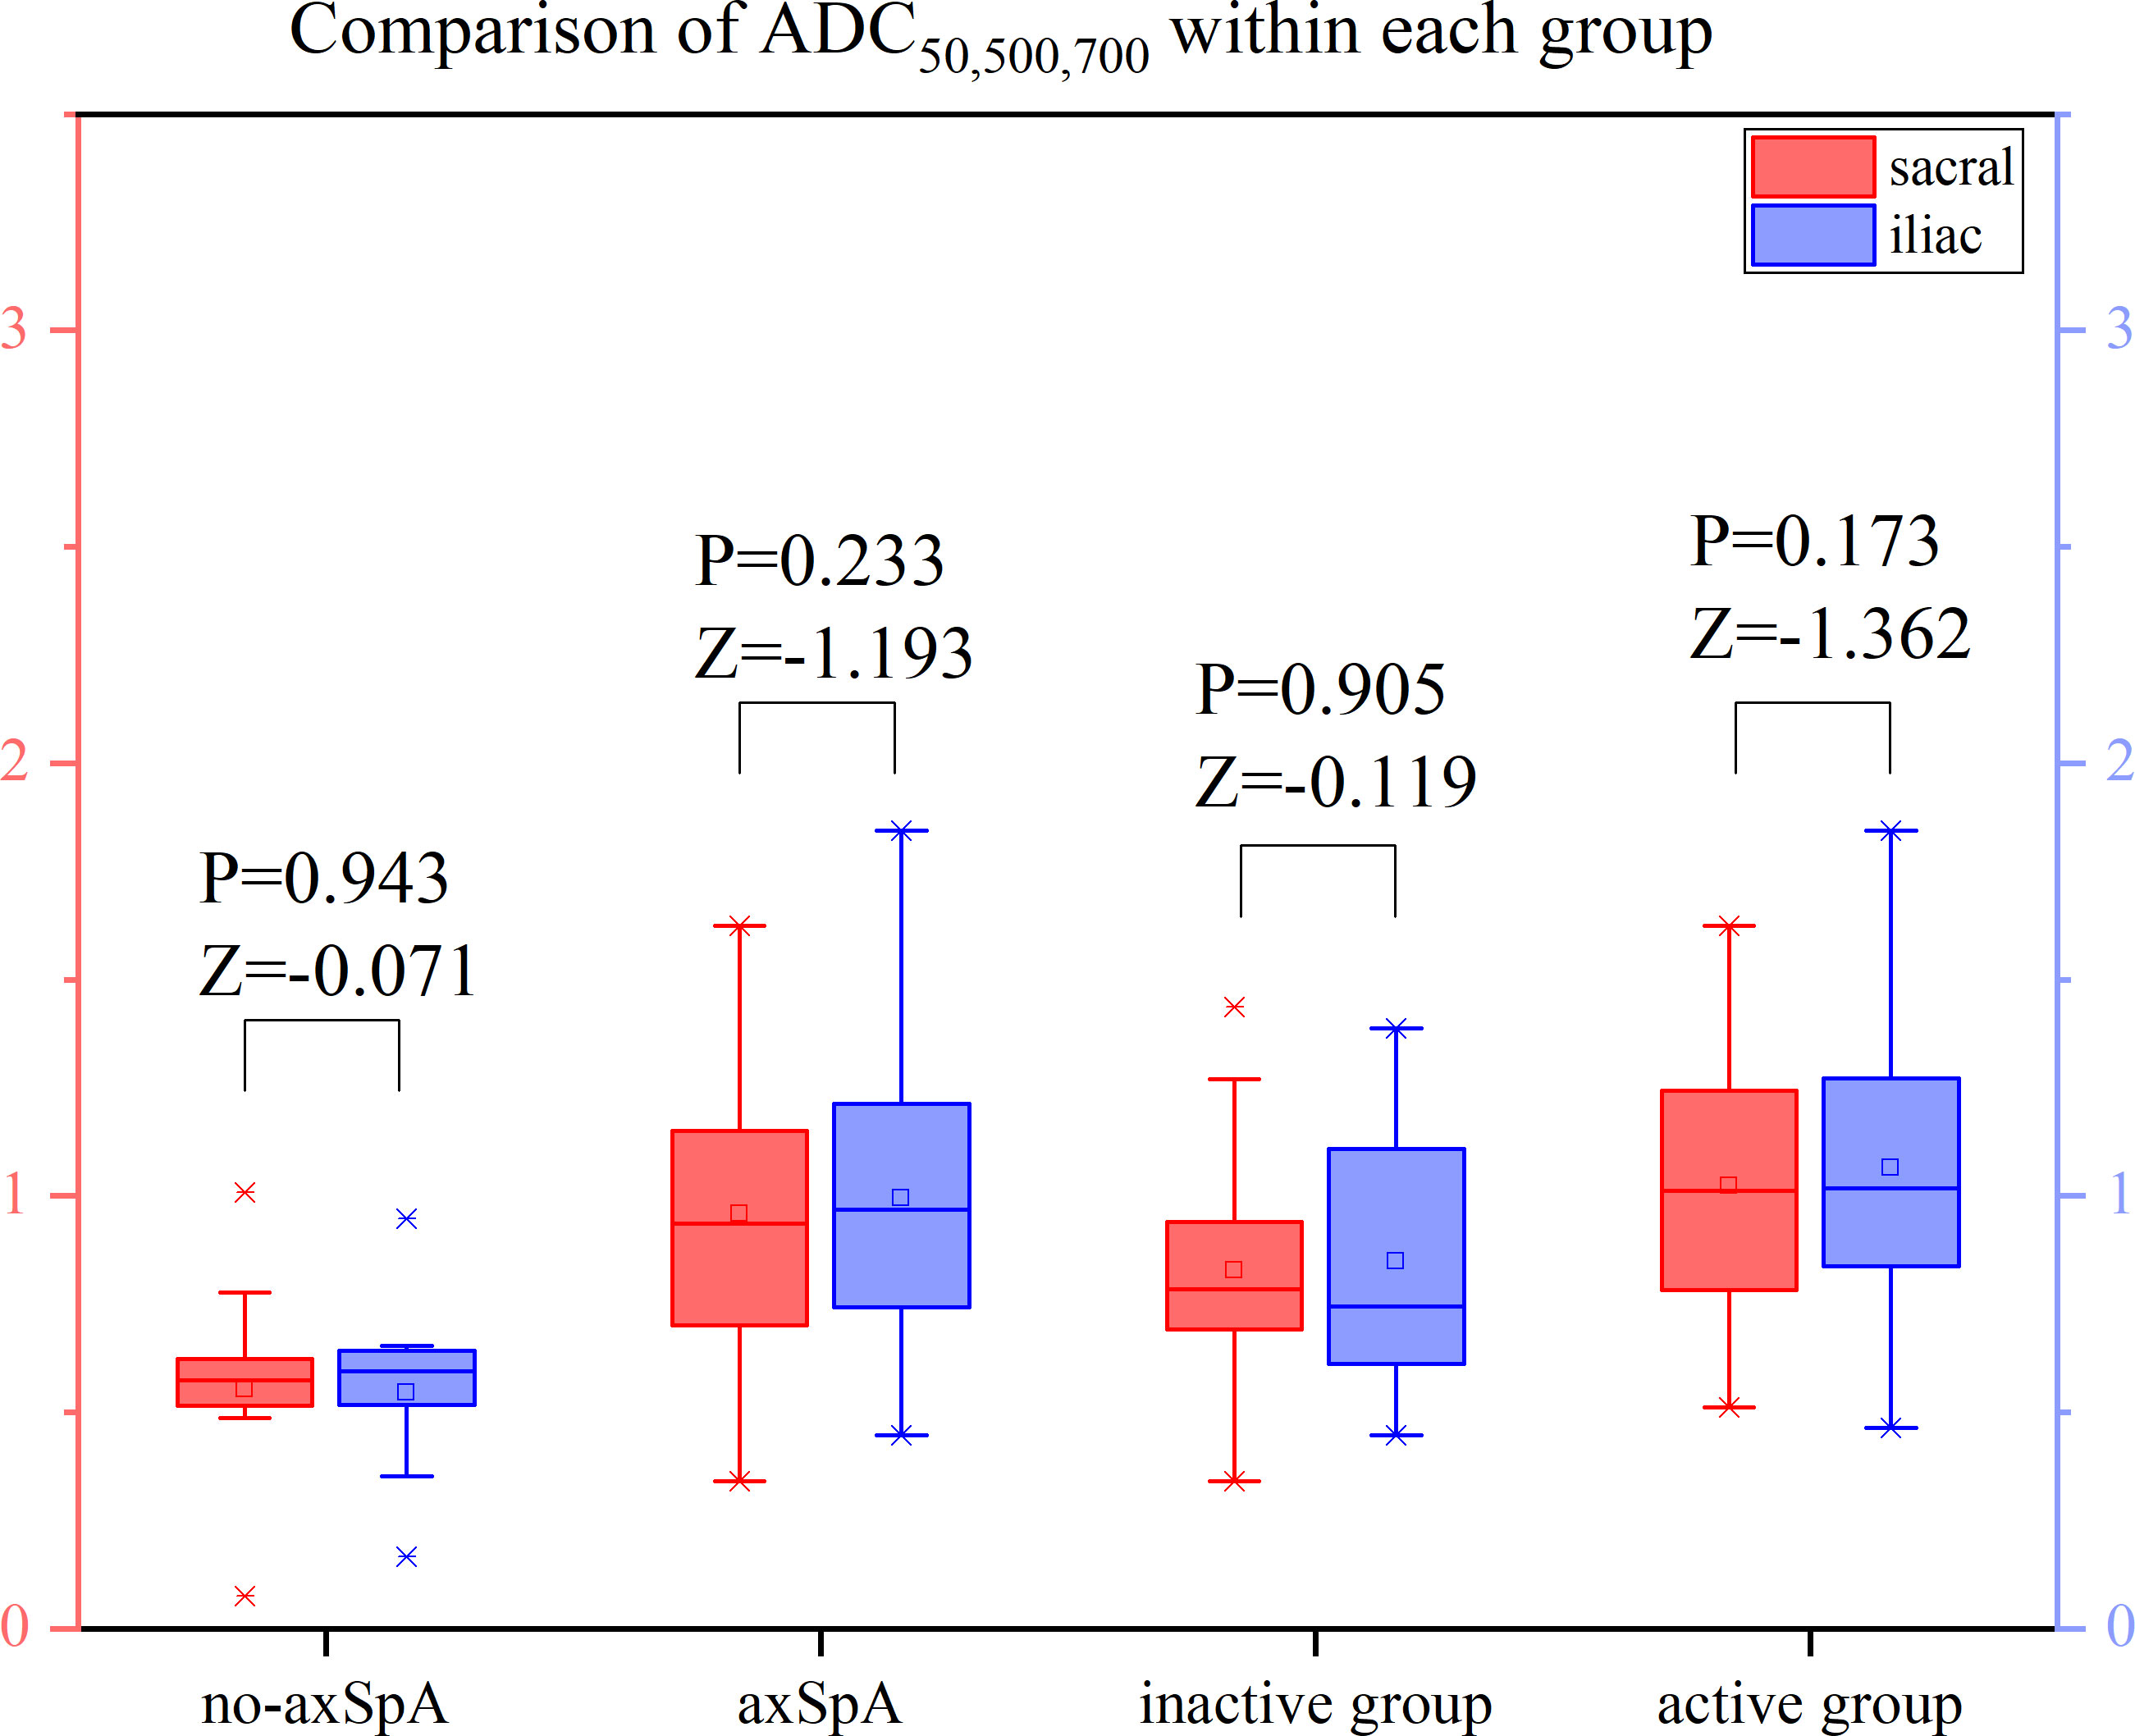
Figure 8 Boxplot for Comparison of ADC50,500,700 within each group. p-value of <0.05 was considered statistically signifificant.
The ADC values of axSpA, active and inactive group were higher than those of no-axSpA group, while those of active group were all higher than those of inactive group. The ADC values obtained by fitting with different b values were significantly different between no-axSpA and axSpA, no-axSpA and inactive, no-axSpA and active, inactive and active groups, no matter on the sacral side or the iliac side (P<0.05) (Table 3).

Table 3 Comparison of different ADC values between each group.
According to the analysis of ROC curve, the AUCs of ADC50, 500,700 between no-axSpA and axSpA, no-axSpA and inactive, no-axSpA and active and inactive and active groups were higher than those of ADC50,700, ADC50,500 (Table 4, Supplementary Figure S2-3). The sensitivity of ADC50, 500,700 was better than ADC50,700 in most inter-group comparisons. The specificity of ADC50, 500,700 was better than ADC50,500 in most inter-group comparisons.
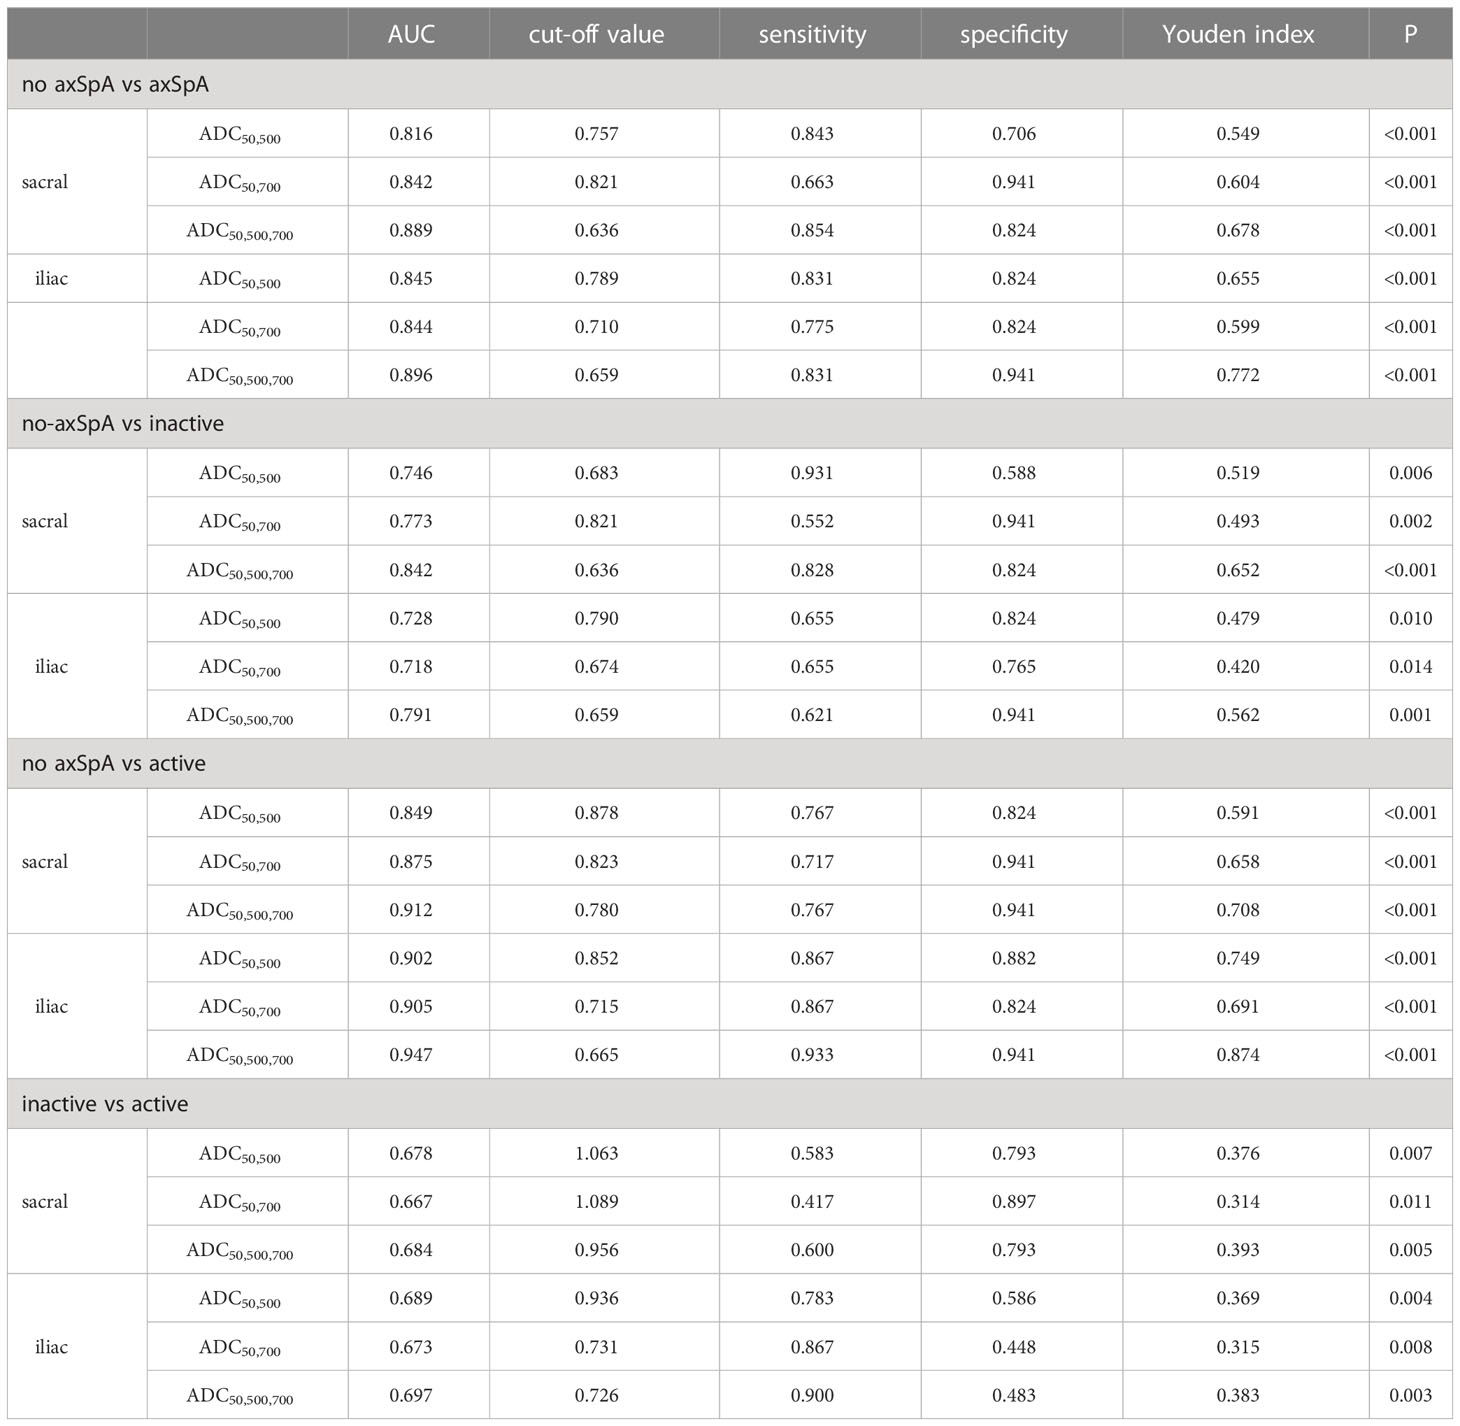
Table 4 Comparison of diagnostic efficacy of ADC values between each group.
In the treatment group, the signal intensity of subchondral bone marrow decreased in different degrees in 3 weeks, 6 weeks and 12 weeks after treatment. PDWI-fs sequence showed that the signal intensity of subchondral bone marrow in sacroiliac joints decreased in varying degrees (Figure 4A(1-4), 5A(1-4)); DWI signal decreased in varying degrees (Figure 4B(1-4), 5B(1-4)); ADC value showed a downward trend (Figure 4C(1-4), 5C(1-4)); ADC values decreased with ASDAS-CRP values, synchronously (Figure 9). The median ADC values of the treatment group before treatment, 3 weeks, 6 weeks and 12 weeks after treatment were 1.177×10⁻³ mm2/s, 0.886×10⁻³ mm2/s, 0.668 ×10⁻³ mm2/s and 0.519 ×10⁻³ mm2/s, respectively.
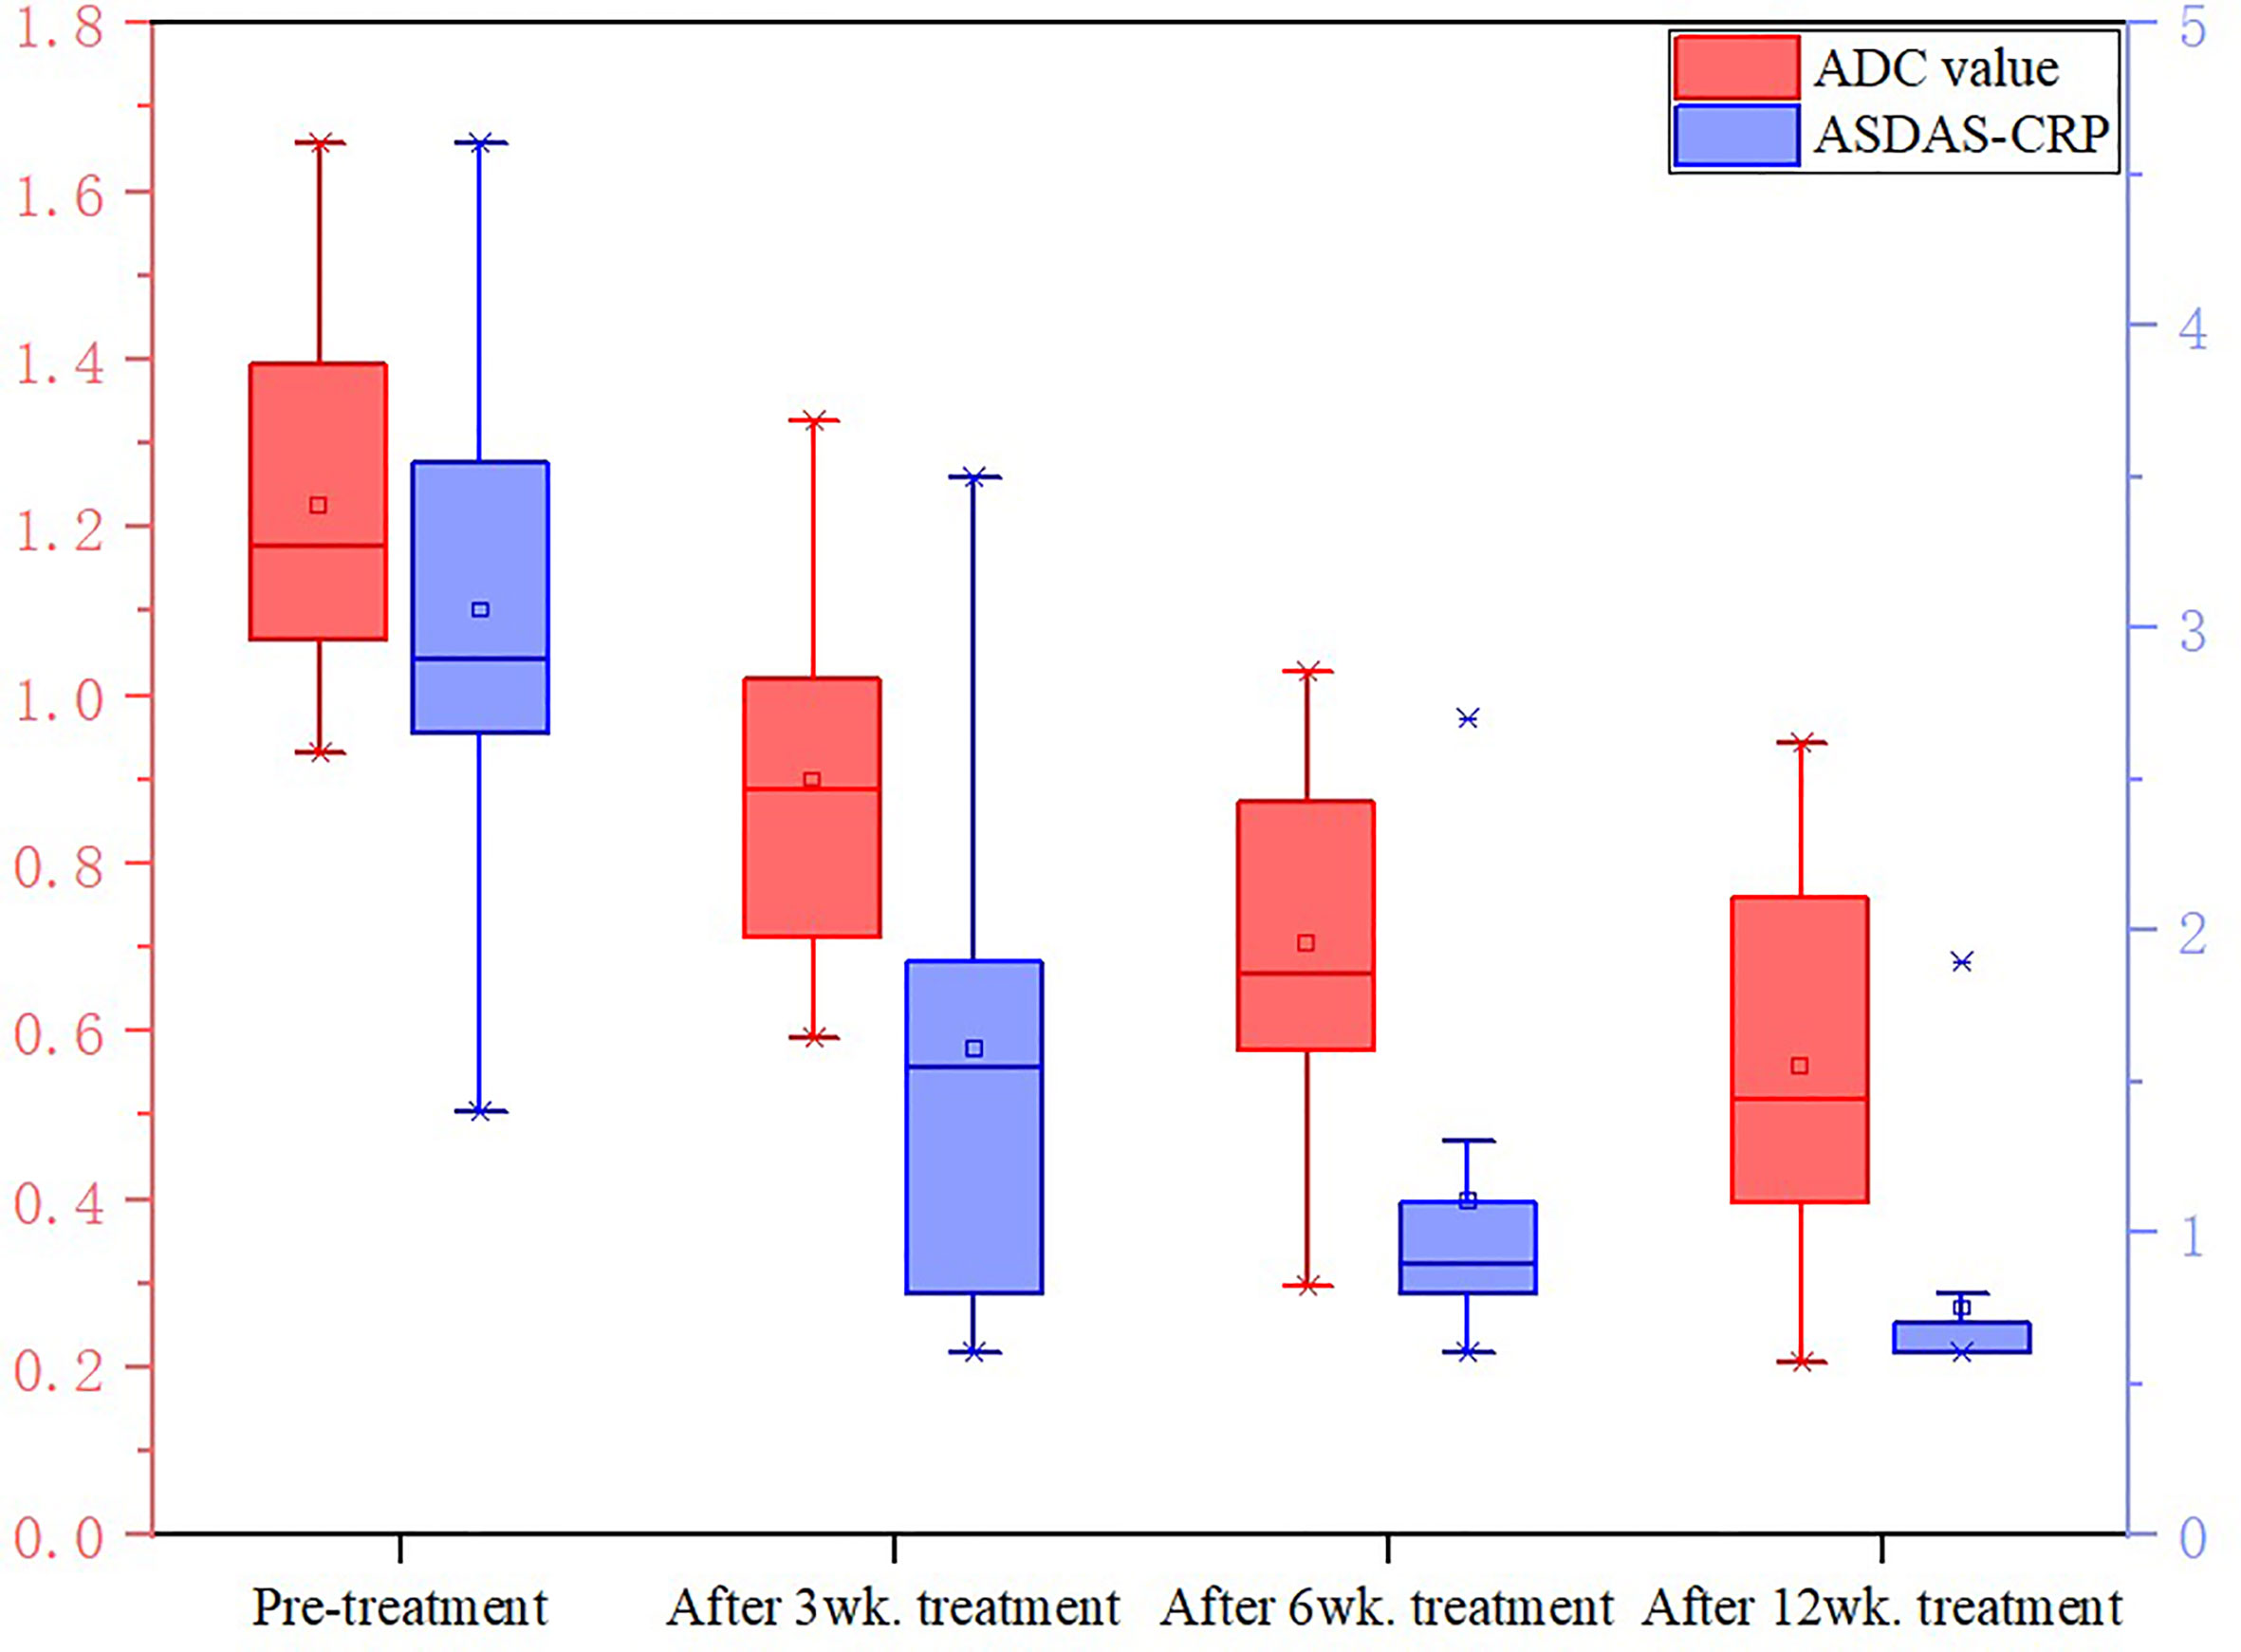
Figure 9 Changes in ADC values and ASDAS in the treatment group. The values of ADC and ASDAS-CRP in the treatment group decreased synchronously with the treatment period.
Friedman test showed that there was significant difference in ASDAS-CRP between treatment groups(P<0.0083, Bonferroni-corrected threshold), except between the 3-week and 6-week treatment groups (P=0.141, Bonferroni-corrected threshold) and between the 6-week and 12-week treatment groups(P=0.027, Bonferroni-corrected threshold).
Friedman test showed that there was significant difference in ADC values between pre-treatment and 6-week treatment (P<0.0083, Bonferroni-corrected threshold), between pre-treatment and 12-week treatment (P<0.0083, Bonferroni-corrected threshold), and between 3-week treatment and 12-week treatment (P<0.0083, Bonferroni-corrected threshold). There was no significant difference in ADC values between pre-treatment and 3 weeks (P=0.086, Bonferroni-corrected threshold), 3 weeks and 6 weeks (P=0.072, Bonferroni-corrected threshold), 6 weeks and 12 weeks (P= 0.086, 0.072, 0.120, respectively. all P>0.0083, Bonferroni-corrected threshold).
The study verified that RESOLVE DWI technique can assist in diagnosis of diseases by showing the diffusion and distribution of water molecules in the microstructure of sacroiliac joints. Increased ADC values can be used to quantitatively evaluate subchondral BME of sacroiliac joints (11–13).
The b value and ADC value are two important parameters in DWI sequence. The b value affects the sensitivity of diffusion motion of water molecules and can reflect the degree of diffusion weighting. Theoretically, two different b values can be used to obtain the ADC graph and calculate the ADC value, which can reflect the dispersion movement and microcirculation perfusion status of water molecules in local tissues through objective quantitative values. Consequently, the selection of b value directly affects the accuracy of ADC value. Different from the IVIM study using the double-index model with multiple B-values, the influence of microcirculation perfusion in the single-index model (DWI) cannot be ignored (29). To reduce the influence of microcirculation perfusion, the common way is to use a high b value. The images with high b value increase the significance of lesions and improve the detection of lesions by reducing the influence of microcirculation perfusion, while the images quality may also be decreased by magnetic susceptibility artifacts and the reduction in signal-to-noise ratio (SNR) (30). In the several study, the commonly range of b values in sacroiliac joints scanning sequence were 500–800s/mm2 (13, 18, 31, 32), therefore, the b values used in our study were 50,500,700s/mm2.
This study displayed that the ADC values of sacroiliac joints in inactive group and active group were significantly higher than those in no-axSpA group, which was consistent with the results of Wang et al. (31), illustrating that subchondral BME was a meaningful sign in diagnosis of axSpA. Furthermore, BME was still present in subchondral bone marrow of inactive patients, indicating that though patients in the inactive stage, according to ASDAS, still cannot rule out inflammatory activity in sacroiliac joints, which is also the limitation of clinical subjective score. Compared with the inactive group, the ADC50,500,700 and ADC50,700 values of sacroiliac joints in the active group increased, displaying a higher signal on RESOLVE DWI images, indicating that with the aggravation of the disease, the degree of subchondral BME was further aggravated, which was consistent with the results of Zhang et al. (18).
The diagnostic efficiency of ADC values obtained by fitting with different b values were evaluated comprehensively according to ROC curve. In this study, the RESOLVE DWI images corresponding to ADC50,500 could clearly show the sacroiliac joints with good contrast, but the specificity to assess inflammation was decreased. Mostly due to the influence of microcirculation perfusion, ADC50,500 values were on the relatively high side, increasing the number of false positives. The RESOLVE DWI images corresponding to ADC50,700 were more accurate to assess inflammation, but the images were prone to deformation and artifact, and the image contrast decreased, resulting in inaccurate assessments of some inflammation and increasing the number of false negatives. Consequently, the sensitivity of ADC50,700 was inferior to ADC50,500. Meanwhile, it also explains the reason why the AUCs of ADC50,500 and ADC50,700 were similar. Furthermore, the AUC of ADC50, 500,700 was higher than those of ADC50,500 and ADC50,700. The results indicated that the diagnostic efficiency of ADC values obtained by multi-b value fitting were higher than those obtained by two b value fitting. We speculated that the background noise was effectively reduced in ADC50,500,700, and the higher image quality in ADC50,500,700 may preserve the higher ADC values in BME and prevented decreased ADC values from averaging with normal bone marrow.
Therefore, ADC50,500,700 values may be more reliable for diffusion quantification in BME than the values of ADC50,500 andADC50,700. As a consequence, the RESOLVE DWI images corresponding to ADC50,500,700 had relative higher sensitivity and specificity to assess inflammation, while taking into account the image quality. The results of the study manifested the detection of lesions depended not only on ADC values close to the real dispersion, correlated with the highest b value, but also on the clear anatomical structure, correlated with the low b value and the number of b values. ADC50, 500,700 is superior to ADC50, 500 and ADC50,700 in terms of overall image quality and diagnostic confidence, which can further improve the diagnosis of disease activity and help to optimize image quality.
In this study, it exhibited that after TNFi treatment, the ADC values in the treatment group were significantly lower than that before treatment, and ADC values decreased more in the treatment group with the prolongation of the treatment cycles, showing that the degree of BME decreased with the prolongation of the treatment cycles, which further proved that TNFi can effectively control the active state of axSpA disease, by inhibiting the abnormal immune response and inflammatory process mediated by TNF-α.
In the course of the study, it was worth noting that there was significant difference between groups with a difference of 6 weeks or more, but there was no significant difference when the interval was 3 weeks, indicating that the ADC values of BME decreased gradually and the short-term difference was not significant. Compared with the clinical symptoms and laboratory indexes (ASDAS-CRP) which were significantly improved in the short term after treatment, the dissipation of BME was relatively delayed. BME was one of the results of inflammatory reaction, mediated by inflammatory cells and inflammatory factors. Although TNFi inhibited part of the inflammatory process, it would take some time for BME to dissipate. Consequently, there were two recommendations of the study. Firstly, frequent reexamination in the early stage of treatment (less than 3 weeks or so) did not have higher benefits. Secondly, re-examination at 6 weeks or beyond without significant reduction of the ADC values of BME shows the inflammation of the sacroiliac joints is slow to resolve and the treatment plan should be adjusted clinically. The relationship between specific treatment period and reexamination needs to be further studied.
This study had some limitations. Firstly, it was a prospective study with a relatively small sample, which may cause the deviation of the results. Larger samples, multicenter, and randomized controlled trials is warranted. Secondly, although patients were divided based on ASDAS-CRP score, they were not subdivided into subgroups. The number and range of b values combinations is small. Increasing the grouping for further study may compensate for this disadvantage. Thirdly, in this study, the follow-up time of the patients in the treatment group was short, and no relapsing patients were found after remission. it is necessary to extend the follow-up time. Fourthly, because of the different treatment schemes and economic constraints of patients, patients who did not receive TNFi treatment were not followed up. It is the next step to evaluate the correlation between different treatment schemes and the prognosis of axSpA patients by imaging techniques.
In conclusion, multi-b-values fitting (b=50,500,700s/mm2) RESOLVE DWI provided an effective quantitative indicator for evaluating the inflammatory activity of sacroiliac joints and the curative effect of TNFi in axSpA. It was worth noting that short-term review (3 weeks or less) of RESOLVE DWI was unsatisfactory and review at 6 weeks or later would help to evaluate the curative effect of axSpA.
The original contributions presented in the study are included in the article/Supplementary Material. Further inquiries can be directed to the corresponding author.
The studies involving human participants were reviewed and approved by the Ethics Committee of Fujian Province Hospital. Written informed consent to participate in this study was provided by the participants’ legal guardian/next of kin.
XC and ML: designing the study and writing the manuscript. SSY: data collection and data analysis. FG and MM gave advice in the statistical analysis and data interpretation. SY: revise the manuscript. All authors contributed to the article and approved the submitted version.
This research was supported by the Science and technology project of Natural Science Foundation of Fujian Province (No.2017J01172), Young and Middle-aged Key Personnel Training Project of Fujian Provincial Health Commission (No. 2020GGA005) and the Sky imaging research fund development project of China International Medical Exchange Foundation (No.Z-2014-07-1912-14).
The authors wish to thank Ruobei Luo, Wei Zhang, Yijun Dai for the data collection, Shengmei Lin and Jiawei Su for technician, nurse Fang Huang for helping with the MR examination, and Fayang Lian, working in the hospital scientific research department, for providing scientific advice.
The authors declare that the research was conducted in the absence of any commercial or financial relationships that could be construed as a potential conflict of interest.
All claims expressed in this article are solely those of the authors and do not necessarily represent those of their affiliated organizations, or those of the publisher, the editors and the reviewers. Any product that may be evaluated in this article, or claim that may be made by its manufacturer, is not guaranteed or endorsed by the publisher.
The Supplementary Material for this article can be found online at: https://www.frontiersin.org/articles/10.3389/fimmu.2023.1136925/full#supplementary-material
1. Robinson PC, van der Linden S, Khan MA, Taylor WJ. Axial spondyloarthritis: concept, construct, classification and implications for therapy. Nat Rev Rheumatol (2021) 17:109–18. doi: 10.1038/s41584-020-00552-4
2. Sieper J, Poddubnyy D. Axial spondyloarthritis. Lancet (2017) 390:73–84. doi: 10.1016/S0140-6736(16)31591-4
3. Zhao SS, Pittam B, Harrison NL, Ahmed AE, Goodson NJ, Hughes DM. Diagnostic delay in axial spondyloarthritis: a systematic review and meta-analysis. Rheumatol (Oxford) (2021) 60:1620–8. doi: 10.1093/rheumatology/keaa807
4. Yi E, Ahuja A, Rajput T, George AT, Park Y. Clinical, economic, and humanistic burden associated with delayed diagnosis of axial spondyloarthritis: a systematic review. Rheumatol Ther (2020) 7:65–87. doi: 10.1007/s40744-020-00194-8
5. Wang DM, Lin L, Peng JH, Gong Y, Hou ZD, Chen SB, et al. Pannus inflammation in sacroiliitis following immune pathological injury and radiological structural damage: a study of 193 patients with spondyloarthritis. Arthritis Res Ther (2018) 20:120. doi: 10.1186/s13075-018-1594-z
6. Furst DE, Louie JS. Targeting inflammatory pathways in axial spondyloarthritis. Arthritis Res Ther (2019) 21:135. doi: 10.1186/s13075-019-1885-z
7. Danve A, Deodhar A. Treatment of axial spondyloarthritis: an update. Nat Rev Rheumatol (2022) 18:205–16. doi: 10.1038/s41584-022-00761-z
8. Rudwaleit M, van der Heijde D, Landewé R, Listing J, Akkoc N, Brandt J, et al. The development of assessment of SpondyloArthritis international society classification criteria for axial spondyloarthritis (part II): validation and final selection. Ann Rheum Dis (2009) 68:777–83. doi: 10.1136/ard.2009.108233
9. Maksymowych WP, Lambert RG, Østergaard M, Pedersen SJ, Machado PM, Weber U, et al. MRI Lesions in the sacroiliac joints of patients with spondyloarthritis: an update of definitions and validation by the ASAS MRI working group. Ann Rheum Dis (2019) 78:1550–8. doi: 10.1136/annrheumdis-2019-215589
10. Lin M, Chen X, Yu S, Gao F, Ma M. Monitoring the efficacy of tumor necrosis factor alpha antagonists in the treatment of ankylosing spondylarthritis: a pilot study based on MR relaxometry technique. BMC Med Imaging (2021) 21:117. doi: 10.1186/s12880-021-00646-9
11. Wang F, Chu C, Zhu L, Zhao C, Wei Y, Chen W, et al. Whole-lesion ADC histogram analysis and the spondyloarthritis research consortium of canada (SPARCC) MRI index in evaluating the disease activity of ankylosing spondylitis. J Magn Reson Imaging (2019) 50:114–26. doi: 10.1002/jmri.26568
12. Bradbury LA, Hollis KA, Gautier B, Shankaranarayana S, Robinson PC, Saad N, et al. Diffusion-weighted imaging is a sensitive and specific magnetic resonance sequence in the diagnosis of ankylosing spondylitis. J Rheumatol (2018) 45:771–8. doi: 10.3899/jrheum.170312
13. Kucybała I, Ciuk S, Urbanik A, Wojciechowski W. The usefulness of diffusion-weighted imaging (DWI) and dynamic contrast-enhanced (DCE) sequences visual assessment in the early diagnosis of axial spondyloarthritis. Rheumatol Int (2019) 39:1559–65. doi: 10.1007/s00296-019-04373-x
14. Chan CWS, Tsang HHL, Li PH, Lee KH, Lau CS, Wong PYS, et al. Diffusion-weighted imaging versus short tau inversion recovery sequence: usefulness in detection of active sacroiliitis and early diagnosis of axial spondyloarthritis. PloS One (2018) 13(8):e0201040. doi: 10.1371/journal.pone.0201040
15. Toslak İE, Bilgilisoy Filiz M, Çekiç B, Parlak AE, Çay HF, Yildiz S, et al. Application of diffusion-weighted imaging in the detection of active sacroiliitis and the comparison of apparent diffusion coefficient and relative apparent diffusion coefficient values. Arch Rheumatol (2016) 31(3):254–64. doi: 10.5606/ArchRheumatol.2016.5915
16. Yeom KW, Holdsworth SJ, Van AT, Iv M, Skare S, Lober RM, et al. Comparison of readout-segmented echo-planar imaging (EPI) and single-shot EPI in clinical application of diffusion-weighted imaging of the pediatric brain. AJR Am J Roentgenol (2013) 200:W437–443. doi: 10.2214/AJR.12.9854
17. Wisner DJ, Rogers N, Deshpande VS, Newitt DN, Laub GA, Porter DA, et al. High-resolution diffusion-weighted imaging for the separation of benign from malignant BI-RADS 4/5 lesions found on breast MRI at 3T. J Magn Reson Imaging (2014) 40:674–81. doi: 10.1002/jmri.24416
18. Zhang H, Huang H, Zhang Y, Tu Z, Xiao Z, Chen J, et al. Diffusion-weighted MRI to assess sacroiliitis: improved image quality and diagnostic performance of readout-segmented echo-planar imaging (EPI) over conventional single-shot EPI. AJR Am J Roentgenol (2021) 217:450–9. doi: 10.2214/AJR.20.23953
19. Kim TH, Baek MY, Park JE, Ryu YJ, Cheon JE, Kim IO, et al. Comparison of DWI methods in the pediatric brain: PROPELLER turbo spin-echo imaging versus readout-segmented echo-planar imaging versus single-shot echo-planar imaging. AJR Am J Roentgenol (2018) 210:1352–8. doi: 10.2214/AJR.17.18796
20. Song C, Cheng P, Cheng J, Zhang Y, Sun M, Xie S, et al. Differential diagnosis of nasopharyngeal carcinoma and nasopharyngeal lymphoma based on DCE-MRI and RESOLVE-DWI. Eur Radiol (2020) 30:110–8. doi: 10.1007/s00330-019-06343-0
21. Jiang JS, Zhu LN, Wu Q, Sun Y, Liu W, Xu XQ, et al. Feasibility study of using simultaneous multi-slice RESOLVE diffusion weighted imaging to assess parotid gland tumors: comparison with conventional RESOLVE diffusion weighted imaging. BMC Med Imaging (2020) 20:93. doi: 10.1186/s12880-020-00492-1
22. Xie M, Ren Z, Bian D, Li D, Yu L, Zhu F, et al. High resolution diffusion-weighted imaging with readout segmentation of long variable echo-trains for determining myometrial invasion in endometrial carcinoma. Cancer Imaging (2020) 20:66. doi: 10.1186/s40644-020-00346-7
23. Jendoubi S, Wagner M, Montagne S, Ezziane M, Mespoulet J, Comperat E, et al. MRI For prostate cancer: can computed high b-value DWI replace native acquisitions? Eur Radiol (2019) 29:5197–204. doi: 10.1007/s00330-019-06085-z
24. Machado P, Landewé R, Lie E, Kvien TK, Braun J, Baker D, et al. Assessment of SpondyloArthritis international society. ankylosing spondylitis disease activity score (ASDAS): defining cut-off values for disease activity states and improvement scores. Ann Rheum Dis (2011) 70:47–53. doi: 10.1136/ard.2010.138594
25. Pons M, Chevret S, Briot K, d'Agostino MA, Roux C, Dougados M, et al. Evaluation of long-term TNFi effectiveness after a first switch in early axial spondyloarthritis considering time-varying prescription bias: an inverse-probability weighting analysis of the DESIR cohort. RMD Open (2022) 8:e001846. doi: 10.1136/rmdopen-2021-001846
26. Molnar C, Scherer A, Baraliakos X, de Hooge M, Micheroli R, Exer P, et al. TNF blockers inhibit spinal radiographic progression in ankylosing spondylitis by reducing disease activity: results from the Swiss clinical quality management cohort. Ann Rheum Dis (2018) 77:63–9. doi: 10.1136/annrheumdis-2017-211544
27. Ward MM, Deodhar A, Gensler LS, Dubreuil M, Yu D, Khan MA, et al. Update of the American college of Rheumatology/Spondylitis association of America/Spondyloarthritis research and treatment network recommendations for the treatment of ankylosing spondylitis and nonradiographic axial spondyloarthritis. Arthritis Rheumatol (2019) 71:1599–613. doi: 10.1002/art.41042
28. van der Heijde D, Ramiro S, Landewé R, Baraliakos X, Van den Bosch F, Sepriano A, et al. Update of the ASAS-EULAR management recommendations for axial spondyloarthritis. Ann Rheum Dis (2016) 76:978–91. doi: 10.1136/annrheumdis-2016-210770
29. Ren C, Zhu Q, Yuan H. Mono-exponential and bi-exponential model-based diffusion-weighted MR imaging and IDEAL-IQ sequence for quantitative evaluation of sacroiliitis in patients with ankylosing spondylitis. Clin Rheumatol (2018) 7:3069–76. doi: 10.1007/s10067-018-4321-x
30. Xi Y, Liu A, Olumba F, Lawson P, Costa DN, Yuan Q, et al. Low-to-high b value DWI ratio approaches in multiparametric MRI of the prostate: feasibility, optimal combination of b values, and comparison with ADC maps for the visual presentation of prostate cancer. Quant Imaging Med Surg (2018) 8:557–67. doi: 10.21037/qims.2018.06.08
31. Wang D, Yin H, Liu W, Li Z, Ren J, Wang K, et al. Comparative analysis of the diagnostic values of T2 mapping and diffusion-weighted imaging for sacroiliitis in ankylosing spondylitis. Skeletal Radiol (2020) 49:1597–606. doi: 10.1007/s00256-020-03442-8
Keywords: RESOLVE DWI, multi-b-values-fitting, axial spondyloarthritis, quantitative, tumour necrosis factor inhibitors
Citation: Chen X, Yang S, Lin M, Gao F, Ma M and Yu S (2023) Multi-b-values-fitting readout-segmentation of long variable echo-trains diffusion-weighted imaging (RESOLVE DWI) in evaluation of disease activity and curative effect of axial spondyloarthritis (axSpA). Front. Immunol. 14:1136925. doi: 10.3389/fimmu.2023.1136925
Received: 03 January 2023; Accepted: 12 June 2023;
Published: 03 July 2023.
Edited by:
Cong-Qiu Chu, Oregon Health and Science University, United StatesReviewed by:
Zhan Ye, University of Kansas Medical Center, United StatesCopyright © 2023 Chen, Yang, Lin, Gao, Ma and Yu. This is an open-access article distributed under the terms of the Creative Commons Attribution License (CC BY). The use, distribution or reproduction in other forums is permitted, provided the original author(s) and the copyright owner(s) are credited and that the original publication in this journal is cited, in accordance with accepted academic practice. No use, distribution or reproduction is permitted which does not comply with these terms.
* Correspondence: Shun Yu, NzY0MjkzMTBAcXEuY29t
†These authors have contributed equally to this work
Disclaimer: All claims expressed in this article are solely those of the authors and do not necessarily represent those of their affiliated organizations, or those of the publisher, the editors and the reviewers. Any product that may be evaluated in this article or claim that may be made by its manufacturer is not guaranteed or endorsed by the publisher.
Research integrity at Frontiers
Learn more about the work of our research integrity team to safeguard the quality of each article we publish.