 Jing Li
 FeiMing Huang
 QingLan Ma
 Wei Guo
 KaiYan Feng
 Tao Huang
 Yu-Dong Cai
- 1School of Computer Science, Baicheng Normal University, Baicheng, Jilin, China
- 2School of Life Sciences, Shanghai University, Shanghai, China
- 3Key Laboratory of Stem Cell Biology, Shanghai Jiao Tong University School of Medicine (SJTUSM) and Shanghai Institutes for Biological Sciences (SIBS), Chinese Academy of Sciences (CAS), Shanghai, China
- 4Department of Computer Science, Guangdong AIB Polytechnic College, Guangzhou, China
- 5CAS Key Laboratory of Computational Biology, Bio-Med Big Data Center, Shanghai Institute of Nutrition and Health, University of Chinese Academy of Sciences, Chinese Academy of Science, Shanghai, China
- 6CAS Key Laboratory of Tissue Microenvironment and Tumor, Shanghai Institute of Nutrition and Health, University of Chinese Academy of Sciences, Chinese Academy of Sciences, Shanghai, China
The widely used ChAdOx1 nCoV-19 (ChAd) vector and BNT162b2 (BNT) mRNA vaccines have been shown to induce robust immune responses. Recent studies demonstrated that the immune responses of people who received one dose of ChAdOx1 and one dose of BNT were better than those of people who received vaccines with two homologous ChAdOx1 or two BNT doses. However, how heterologous vaccines function has not been extensively investigated. In this study, single-cell RNA sequencing data from three classes of samples: volunteers vaccinated with heterologous ChAdOx1–BNT and volunteers vaccinated with homologous ChAd–ChAd and BNT–BNT vaccinations after 7 days were divided into three types of immune cells (3654 B, 8212 CD4+ T, and 5608 CD8+ T cells). To identify differences in gene expression in various cell types induced by vaccines administered through different vaccination strategies, multiple advanced feature selection methods (max-relevance and min-redundancy, Monte Carlo feature selection, least absolute shrinkage and selection operator, light gradient boosting machine, and permutation feature importance) and classification algorithms (decision tree and random forest) were integrated into a computational framework. Feature selection methods were in charge of analyzing the importance of gene features, yielding multiple gene lists. These lists were fed into incremental feature selection, incorporating decision tree and random forest, to extract essential genes, classification rules and build efficient classifiers. Highly ranked genes include PLCG2, whose differential expression is important to the B cell immune pathway and is positively correlated with immune cells, such as CD8+ T cells, and B2M, which is associated with thymic T cell differentiation. This study gave an important contribution to the mechanistic explanation of results showing the stronger immune response of a heterologous ChAdOx1–BNT vaccination schedule than two doses of either BNT or ChAdOx1, offering a theoretical foundation for vaccine modification.
1 Introduction
The coronavirus disease 2019 (COVID-19) pandemic was brought on by the emergence of a new coronavirus strain known as severe acute respiratory syndrome coronavirus 2 (SARS-CoV-2)(1). On March 11, 2020, COVID-19 was eventually classified as a pandemic by the World Health Organization (2). As of August 12, 2022, over 588 million cases and 6.4 million deaths due to COVID-19 were reported worldwide (3). Fever, sore throat, dry cough, and pneumonia symptoms are the common clinical manifestations of the disease (4). To combat COVID-19, scientists have started working on COVID-19 vaccines. The vaccines have been injected in doses totaling over 12 billion (3). To date, several types of vaccines against SARS-CoV-2, such as RNA-based, nonreplicating viral vector, and protein-based vaccines, have been developed and are in widespread use worldwide (5).
BNT162b2 (BNT) and ChAdOx1-S-nCoV-19 (ChAd) vaccines have been the most widely used authorized COVID-19 vaccines worldwide (6). BioNTech developed BNT with the assistance of the pharmaceutical company Pfizer (7). The complete spike protein is encoded by mRNA packaged in lipid nanoparticles and modified by the addition of two prolines that stabilize prefusion conformation and improve immunogenicity to one of mRNA subunits (5, 8). The components of ChAd are chimpanzee adenoviruses (Ads) encoding the SARS-CoV-2 spike-in glycoprotein (5). Ads are double-stranded and envelope-free DNA viruses that can target a wide range of host tissues for cellular infection (9, 10).
BNT and ChAd vaccines have strong protective effects on vaccinated individuals (11, 12). The first dose of BNT vaccination has resulted in a 91% reduction in COVID-19 admissions, and ChAd vaccination has induced an 88% reduction. After two vaccination doses, clinical trials for the licensed vaccines have demonstrated 95% efficacy for BNT and 70% efficacy for ChAd against symptomatic diseases (13, 14). BNT can induce high-peak anti-spike IgG titers, and ChAd-induced antibody levels fall slowly (12). However, heterologous vaccines offer higher protection than homologous vaccines. A study showed that a heterologous ChAd–BNT vaccination regimen provided stronger protective immunity than homologous BNT–BNT (15). Another study found that ChAd–BNT heterologous vaccines exhibited significantly stronger immune responses, including the production of stronger cellular and antibody responses, than ChAd–ChAd homologous vaccines(16). Single-cell sequencing (scRNA-seq) technology can measure gene expression on a transcriptome-wide scale (17). In the COVID-19 pandemic, this method has been widely used in revealing the characteristic immune responses of the different immune cells of patients with COVID-19 (18) or recipients of COVID-19 vaccines (19). In addition, a recent study used scRNA-seq to assess the protective capacity of different COVID-19 vaccines (20). However, the molecular mechanisms of differential immune responses induced by heterologous vaccines remain unclear.
COVID-19 vaccination enables recipients to generate a suitable immune response against severe COVID-19 or SARS-CoV-2 infection. Specifically, COVID-19 vaccination can elicit T cell responses (cellular immunity) and B cell responses (antibody immunity) (21). The components of cellular immune responses are CD8+ cytotoxic T cells, which kill virus-infected cells with the help of perforin and granzyme and retard and stop infections. CD4+ helper T cells activate B cells to produce antibodies specific to antigens. Activated B cells then produce plasma cells and memory B cells, which respond to antigens upon reinfection (22).
In our study, we worked on the immunological effects of different COVID-19 vaccine combination strategies. Blood single cell data on gene expression differences caused by different vaccine strategies were obtained from Gene Expression Omnibus (GEO), and we focused on the gene expression of lymphocytes 7 days after a booster injection. Samples were divided into three groups: homologous BNT–BNT, ChAd–ChAd and heterologous ChAd–BNT according to different prime-boost vaccination strategies. According to the great success of machine learning methods in medicine (23–28), several of them were integrated into a computational framework in this study to identify differences in gene expression induced by vaccines administered with different vaccination strategies. First, the data was investigated by five feature raking algorithms: max-relevance and min-redundancy (mRMR) (29), Monte Carlo feature selection (MCFS) (30), least absolute shrinkage and selection operator (LASSO) (31), light gradient-boosting machine (LightGBM) (32) and permutation feature importance (PFI) (33). Five gene lists were obtained. Then, these lists were subject to incremental feature selection (IFS) (34) method, containing two classification algorithms (decision tree (35) and random forest (36)). After such process, important genes (e.g., PLCG2, B2M, JUN, etc.) and classification rules, indicating different expression patterns for volunteers vaccinated with three different strategies, were accessed. The genes and rules may be useful in discovering vaccination strategies with enhanced protection and long durations, thus providing guidance for prime-boost vaccination.
2 Materials and methods
2.1 Data
The scRNA-seq profiles of volunteers vaccinated with heterologous ChAd–BNT vaccinations or homologous two ChAd or two BNT doses were derived 7 days after vaccine administration from the GEO database under accession number GSE201534 (37). We mapped the scRNA-seq data to Azimuth datasets, which are well-curated and annotated referenced datasets, and extracted three types of immune cells as the subjects of our analysis, including 3654 B cells, 8212 CD4+ T cells, and 5608 CD8+ T cells. Each cell was represented by expression levels on 36 601 genes, which were deemed as features in this analysis. Each type of immune cell was classified into three classes according to the original sample as homologous BNT–BNT, homologous ChAd–ChAd, and heterologous ChAd–BNT. The detailed number of each class is provided in Table 1.
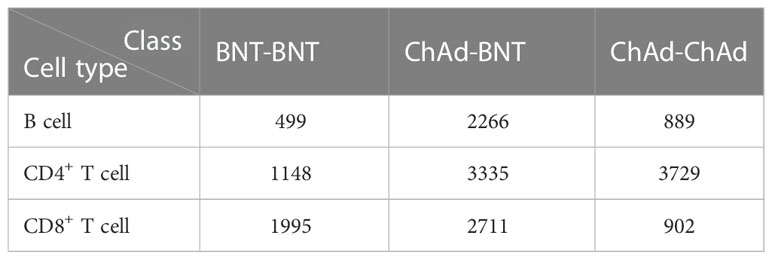
Table 1 Number of cells in each class for three cell types.
2.2 Feature ranking algorithms
To date, lots of feature analysis algorithms have been proposed in computer science. Several of them assess the importance of features by ranking them in one list. However, each algorithm has its own advantages and disadvantages. The application of one algorithm to the profiles mentioned in Section 2.1 may produce bias. One algorithm can only mine a part of essential information from the profiles. To obtain essential information as complete as possible, five feature ranking algorithms were employed in this study, which were briefly described as below.
2.2.1 Max-relevance and min-redundancy
The mRMR is a widely used method for assessing the importance of features and often used in gene expression profiling for screening genes with specific biological significance (29, 38, 39). It generates a list to reflect the importance of features. Initially, it is empty. mRMR repeatedly selects a feature from the rest features, which has maximum relevance with respect to a target variable and minimum redundancy with respect to features selected during previous iterations. Relevance and redundancy are measured according to mutual information, which is expressed by the following equation:
where p(x) and p(y) stand for the marginal probabilistic densities of x and y, respectively, p(x,y) stands for the joint probabilistic density of x and y. When all features are in the list, the procedures stop. In the present study, we utilized the mRMR program from Peng’s lab (http://home.penglab.com/proj/mRMR/) and ran the analysis by using the default settings.
2.2.2 Monte Carlo feature selection
The MCFS is a DT-based feature importance evaluation algorithm and commonly used to process biological data (30, 40, 41). In MCFS, m features are randomly selected to comprise a feature subset. On such subset, t DTs are constructed using different randomly selected training samples. Above procedure executes s times, thereby generating s×t trees. A feature’s relative importance (RI), as measured by how many times it has been selected by these trees and how much it contributes to prediction of the trees, was estimated as follows:
where wAcc is the weighted accuracy, IG(ng(τ)) is the information gain (IG) of node ng(τ) , ( no.in ng(τ)) is the number of samples in node ng(τ) , and (no.in τ) is the sample sizes in the tree root; u and v are two settled positive integers. After each feature is assigned a RI score, features are sorted in a list with decreasing order of their RI scores. In the present study, the MCFS program was retrieved from http://www.ipipan.eu/staff/m.draminski/mcfs.html. It was performed using its default parameters.
2.2.3 Least absolute shrinkage and selection operator
A penalty function that selectively eliminates features was created by applying a high penalty to features with high coefficients and using an L1 paradigm in LASSO. This practice has the effect of actually forcing some coefficients to become zero, which effectively performs feature selection by removing features from models (31). As a result, the coefficients of features can be used to rank features. This study used the LASSO program collected in Scikit-learn (42). Default parameters were used to execute such program.
2.2.4 Light gradient-boosting machine
The LightGBM is a gradient-boosting framework based on DTs, which can increase the efficiency of models and reduce memory usage (32). As a measure of feature importance for prediction, the LightGBM counts the total number of times (i.e., T Split ) that each feature is used in trees and the benefits (i.e., T Gain ) that a feature receives from being used for splitting in all DTs.
where K is the number of DTs generated by K iterations. Here, we used the setting of split as a metric in measuring the importance of features. Features are ranked in a list with decreasing order of their splits. The LightGBM program used in this study was sourced from https://lightgbm.readthedocs.io/en/latest/. For convenience, it was executed with default parameters.
2.2.5 Permutation feature importance
Permutation feature importance (PFI) was first introduced in 2001 by Breiman for RFs and was later extended to fitted estimators by Fisher, Rudin, and Dominici (33, 36). If a feature is more important, after its values are shuffled, prediction error will increase. A feature is considered unimportant if shuffling its values does not increase prediction error. Its computations include the following steps:
1. The training model is denoted as f ; the feature matrix, as X ; target variable, as y ; and the error measure, as L(y,f) .
2. Given a dataset X , its baseline prediction error is calculated as ebase=L(y,f(X)) .
3. Given a feature j∈{1,…,J} for each repetition k∈{1,…,K}
a) Randomly shuffle feature j , and generate a permuted version of feature matrix Xperm ;
b) Estimate the prediction error ej,k=L(y,f(Xperm)) based on the permuted data Xperm ;
c) Calculate differences between baseline score and the shuffled dataset score as the feature importance Ij,k=ej,k/ebase .
4. Calculate the mean score of the feature importance .
5. Sort the features based on Ij .
Here, we used the PFI program downloaded from scikit-learn (42), which was performed with default parameters.
The profiles mentioned in Section 2.1 were fed into above five feature ranking algorithms. Each algorithm yielded a gene list. For an easy description, these lists were called mRMR, MCFS, LASSO, LightGBM and PFI gene lists, respectively.
2.3 Incremental feature selection
As stated in Section 2.2, five gene lists can be obtained using five feature ranking algorithms. The best feature subset for classification can be extracted from each list. The IFS method was introduced to complete this task. IFS is a popular approach for finding the optimal feature subset for classification using a supervised classification algorithm (34, 43, 44). The IFS method was applied to each gene list. Its procedures can be broken down into the following main steps: (1) From the gene list, several gene subsets were constructed by repeatedly adding ten features, i.e., the first subset contained the first ten genes, the second subset included the top twenty features, and so forth. (2) On each gene subset, one classifier was built using genes in this subset and it was evaluated by 10-fold cross-validation (45). (3) The feature set and classifier with the best classification performance are referred to as the optimal feature subset and classifier, respectively.
2.4 Synthetic minority oversampling technique
As listed in Table 1, the profile for each cell type is imbalanced. The classifier directly built on such profile may produce bias. The profile must be processed first to reduce the influence of imbalanced problem. This study adopted the synthetic minority oversampling technique (SMOTE), which is a data augmentation technique for minorities (46–48). Beginning with samples that are close to a randomly selected sample in a feature space, SMOTE creates a new sample along the line it draws between two samples. Specifically, a random sample from a minority class is initially determined. The k nearest neighbors in the same class are then observed for that sample. A synthetic sample is built at a randomly selected place in a feature space between the sample and its randomly selected neighbor. For each class except the largest class, SMOTE repeatedly generated several new samples until this class contained samples as many as those in the largest class. The SMOTE algorithm in this study was implemented via python.
2.5 Classification algorithm
Classification algorithm is necessary to execute IFS method. Here, two algorithms (DT (35) and RF (36)) were employed. They have wide applications in dealing with medical and biological problems (49–55).
2.5.1 Decision tree
DTs are basic classification and regression methods with tree-like structures (35). A DT model represents the classification and discrimination of data as a tree-like structure with nodes and directed edges. When a rule is built for each path of a DT from the root node to the leaf node, each internal node corresponds to the rule’s condition, and a leaf node displays the outcome of an associated rule. Thus, a DT can be deemed as a collection of if-then rules. To implement DT, we employed the CART method and the scikit-learn package (42), with Gini coefficients serving as the IG.
2.5.2 Random forest
RF is an ensemble method that adopts DT as the basic unit (36). In the concentration of a forest, trees are created several times using randomly selected features and samples. The sample is predicted by aggregating the predictions of all DTs. The RF package from Python’s scikit-learn module was employed in this study for building RF classifiers in the IFS method.
2.6 Performance evaluation
The weighted F1 was used in mainly evaluating the performance of classifiers that were constructed in IFS method. To calculate such measurement, the F1-measure for each class should be computed first, as follows:
where i denotes the index of one class, TPi, FPi and FNi denote true positive, false positive and false negative for the i-th class, respectively. Then, the weighted F1 can be computed by
where wi denotes the proportion of samples in the i-th class to all samples, L denotes the total number of classes.
In addition, the macro F1, prediction accuracy (ACC) and Matthew correlation coefficients (MCC) (56) were also employed in this study to fully display the performance of all classifiers. Macro F1 is similar to weighted F1, which is the direct average of all F1-measure values. ACC is one of the most widely used measurements, which is defined as the proportion of correctly predicted samples to all samples. MCC is a balanced measurement. When the dataset is imbalanced, it is much more accurate than ACC. It can be computed by
where X and Y are two matrices, storing the true and predicted classes of all samples, respectively, cov(X,Y) stands for the covariance of X and Y.
3 Results
In the current work, we employed several efficient feature selection methods and classification algorithms to design a computational framework for mining significant genes and rules in various cell types, which can determine the efficacy of homologous and heterologous COVID-19 vaccines. The overall computational framework is shown in Figure 1. The results associated with each step of the computation process are described below.
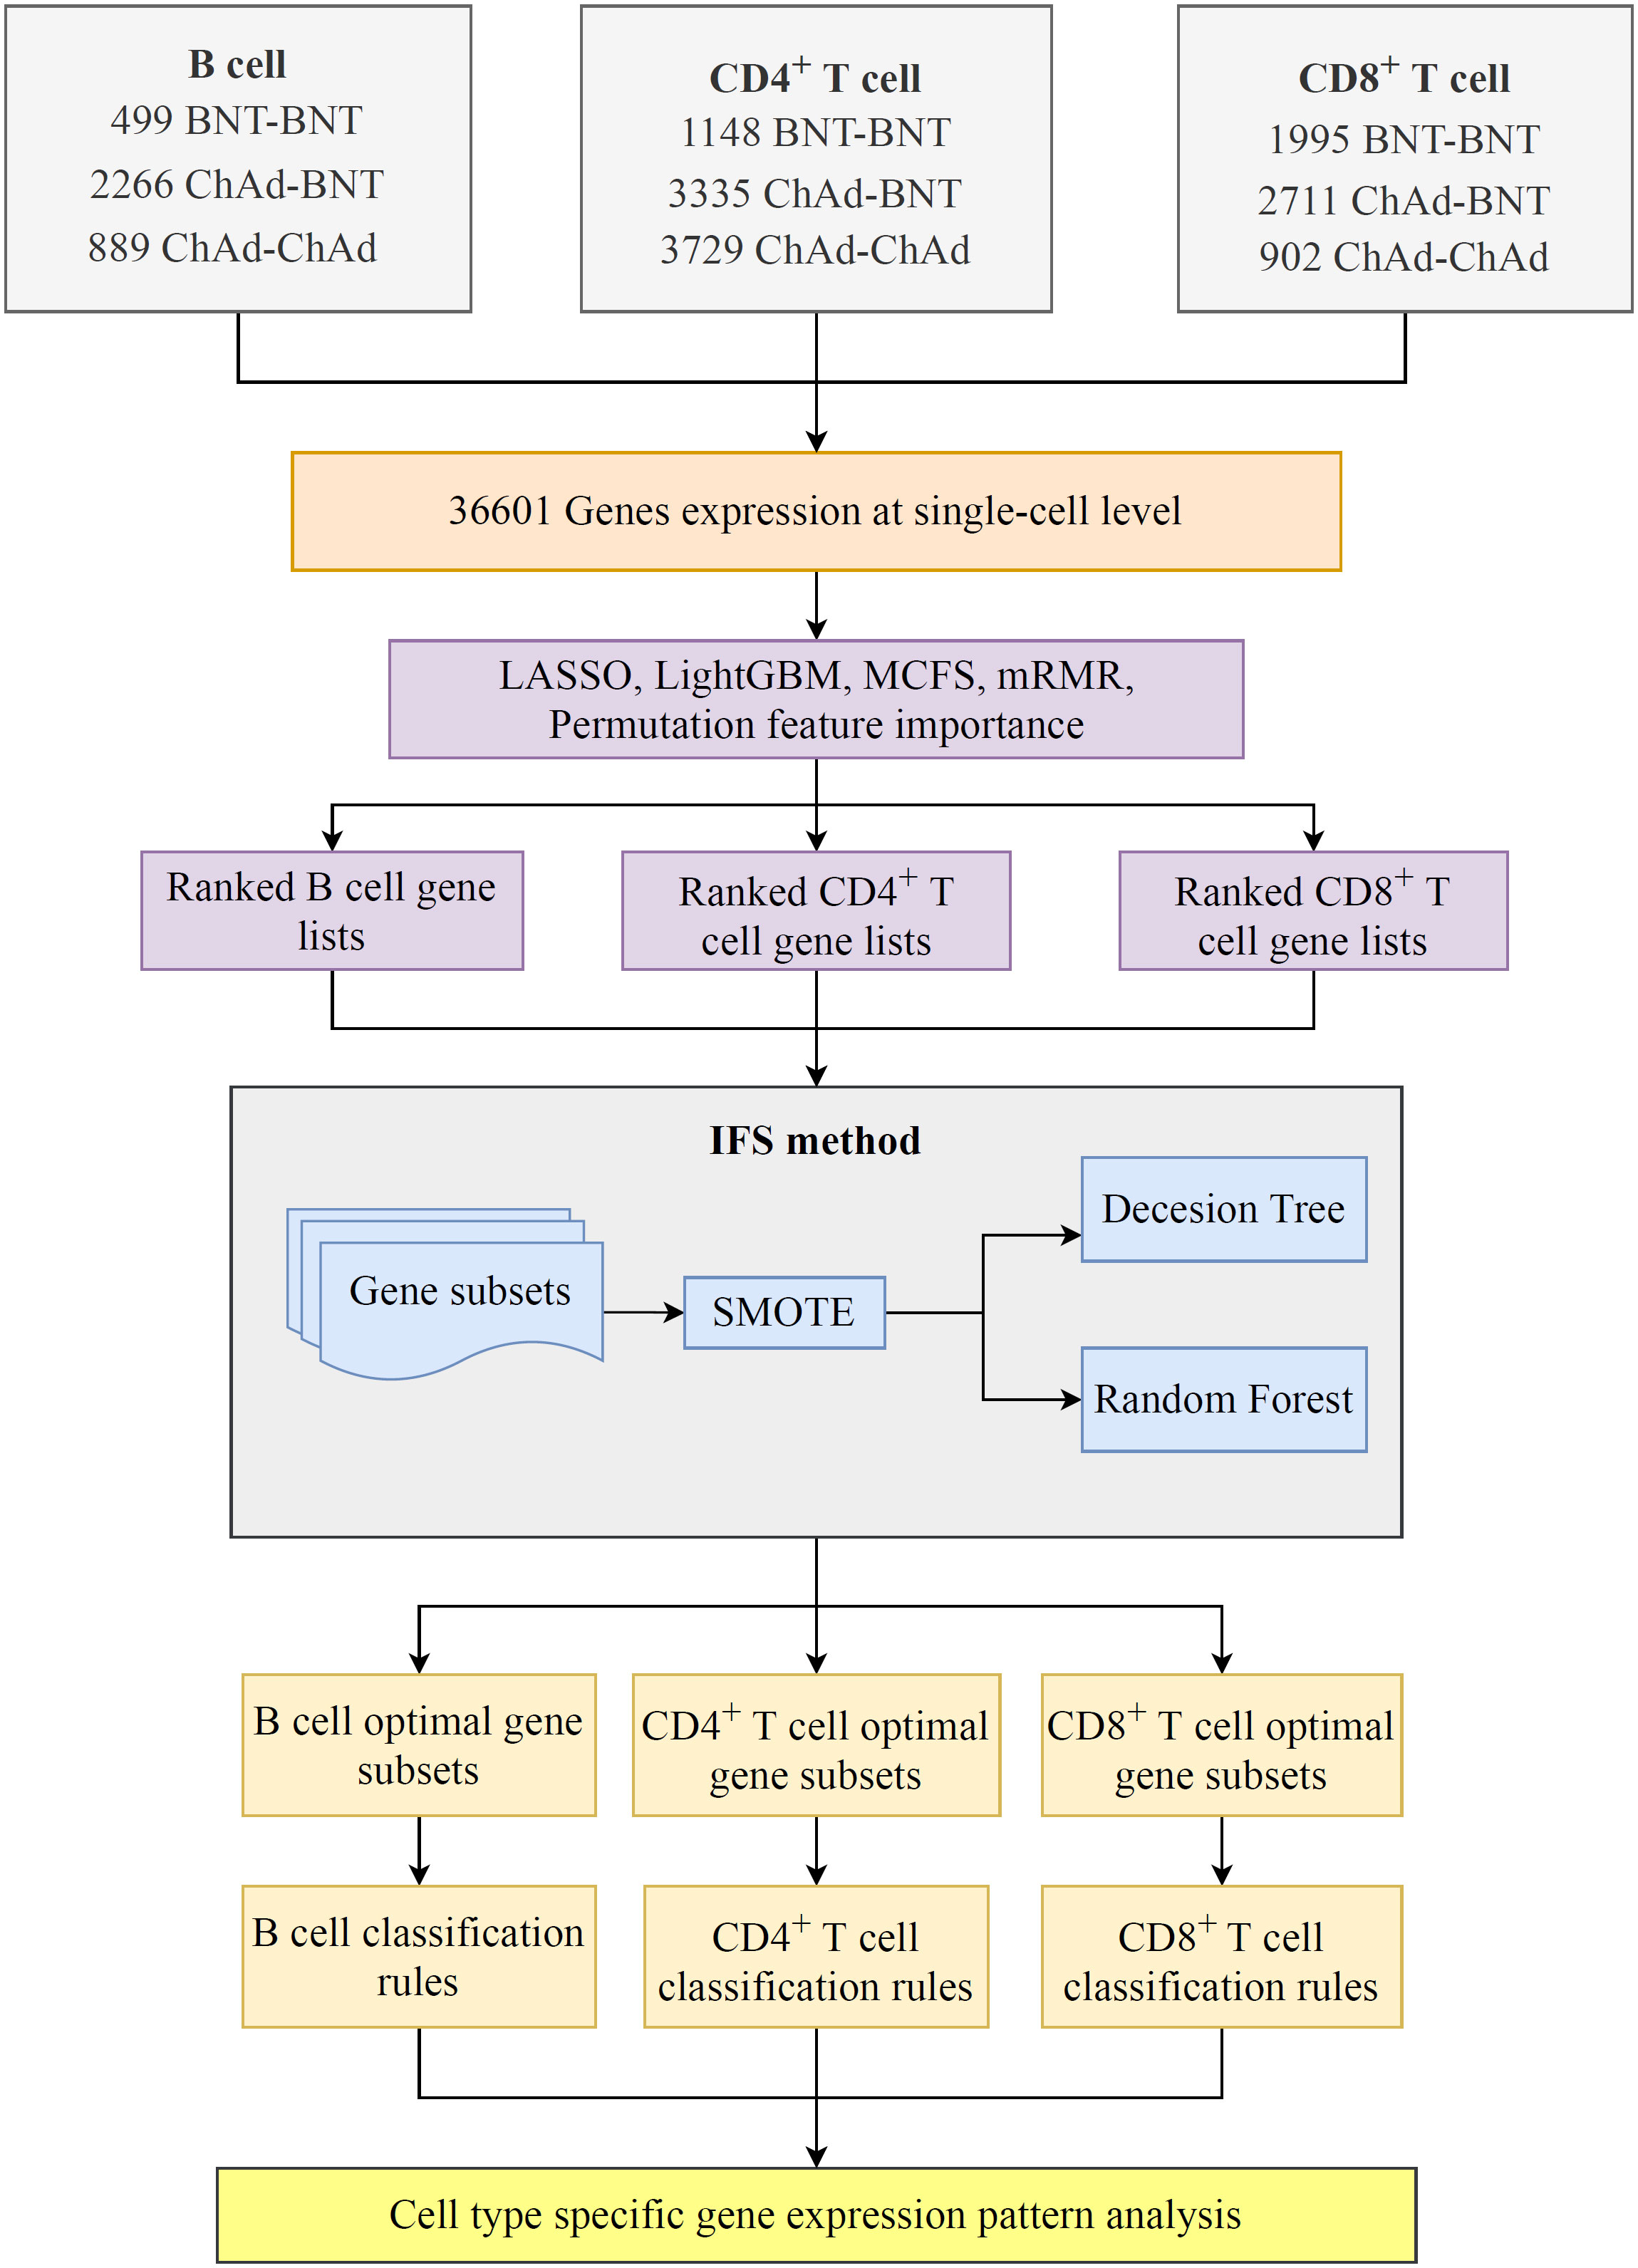
Figure 1 Flowchart of the computational framework that integrates multiple feature selection algorithms and classification algorithms. The single-cell profiles of COVID-19 includes B, CD4+ T, and CD8+ T cells, each of which has three vaccination states, namely, BNT–BNT, ChAd–BNT, and ChAd–ChAd. On each cell type, a set of gene lists were obtained using five feature ranking algorithms: LASSO, LightGBM, mRMR, MCFS, and permutation feature importance (PFI). Subsequently, the optimal classifiers and the corresponding optimal feature subsets on each gene list were obtained using the incremental feature selection (IFS) method. Finally, the classification rules were mined by each optimal decision tree (DT) classifier.
3.1 Feature ranking results
The current study included three cell types with a total of 17 474 cells and 36 601 genes. As shown in Supplementary Table S1, genes were sorted for each cell type using five feature ranking algorithms to provide a set of feature lists (mRMR, MCFS, LASSO, LightGBM and PFI gene lists). The feature lists for B, CD4+ T, and CD8+ T cells would be entered into the IFS method to determine the optimal features.
3.2 Results of IFS method with RF and DT algorithms
The IFS method was used in combination with RF and DT to determine the optimal features and construct the best classifiers for each cell type. The mRMR, MCFS, LASSO, LightGBM and PFI gene lists were used in this procedure. Considering the huge number of gene features, only top 5000 features in each list were considered and feature subsets were constructed using ten as the step. Thus, 500 feature subsets were generated from each list. DT and RF classifiers were built using features in each subset and evaluated by 10-fold cross-validation. In the 10-fold cross-validation, the SMOTE was utilized in creating samples for minor classes in the training dataset, which addressed the problem of sample imbalance. Weighted F1 was used in assessing the performance of all classifiers. The detailed results of the IFS method are shown in Supplementary Table S2. With weighted F1 on the Y-axis and the number of features on the X-axis, Figures 2–4 depict the IFS curves of DT and RF in B, CD4+ T, and CD8+ T cells.
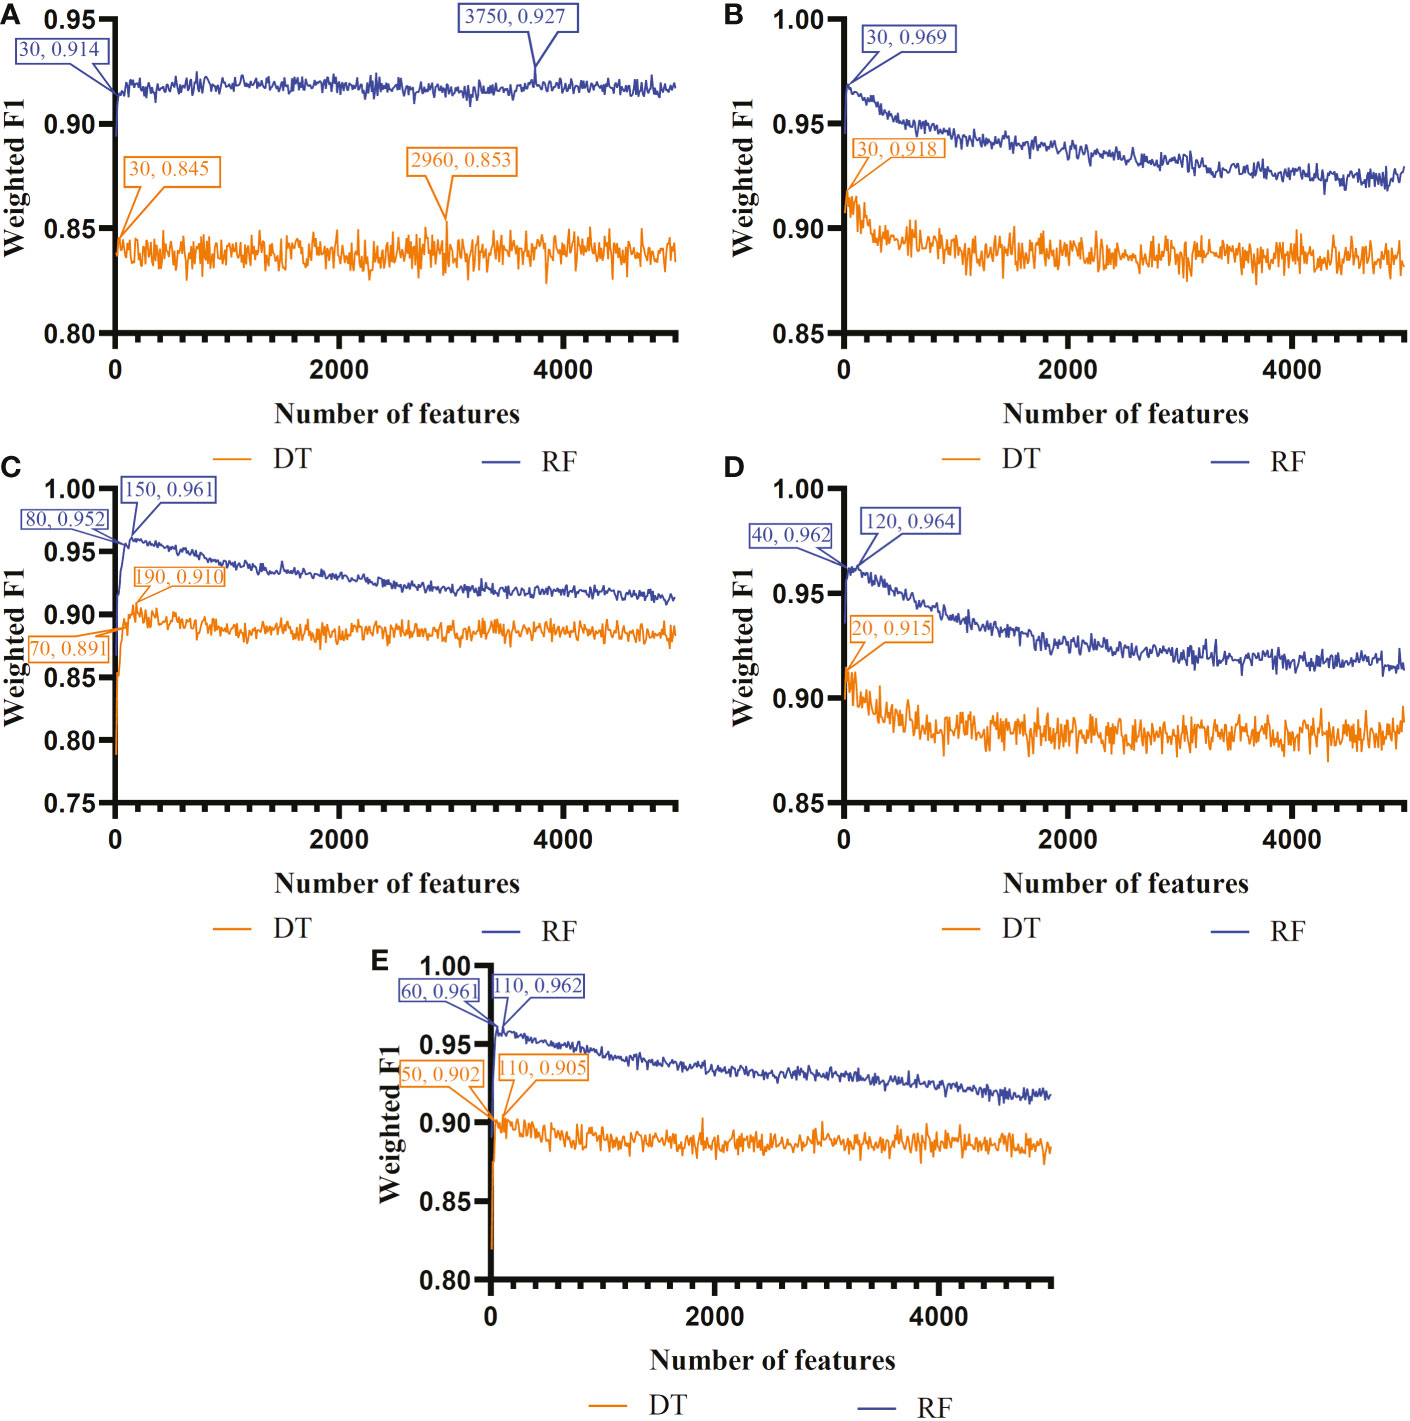
Figure 2 Incremental feature selection (IFS) curves of two classification algorithms in B cells. (A) IFS results obtained based on the LASSO gene list. (B) IFS results obtained based on the LightGBM gene list. (C) IFS results obtained based on the mRMR gene list. (D) IFS results obtained based on the MCFS gene list. (E) IFS results obtained based on the PFI gene list.
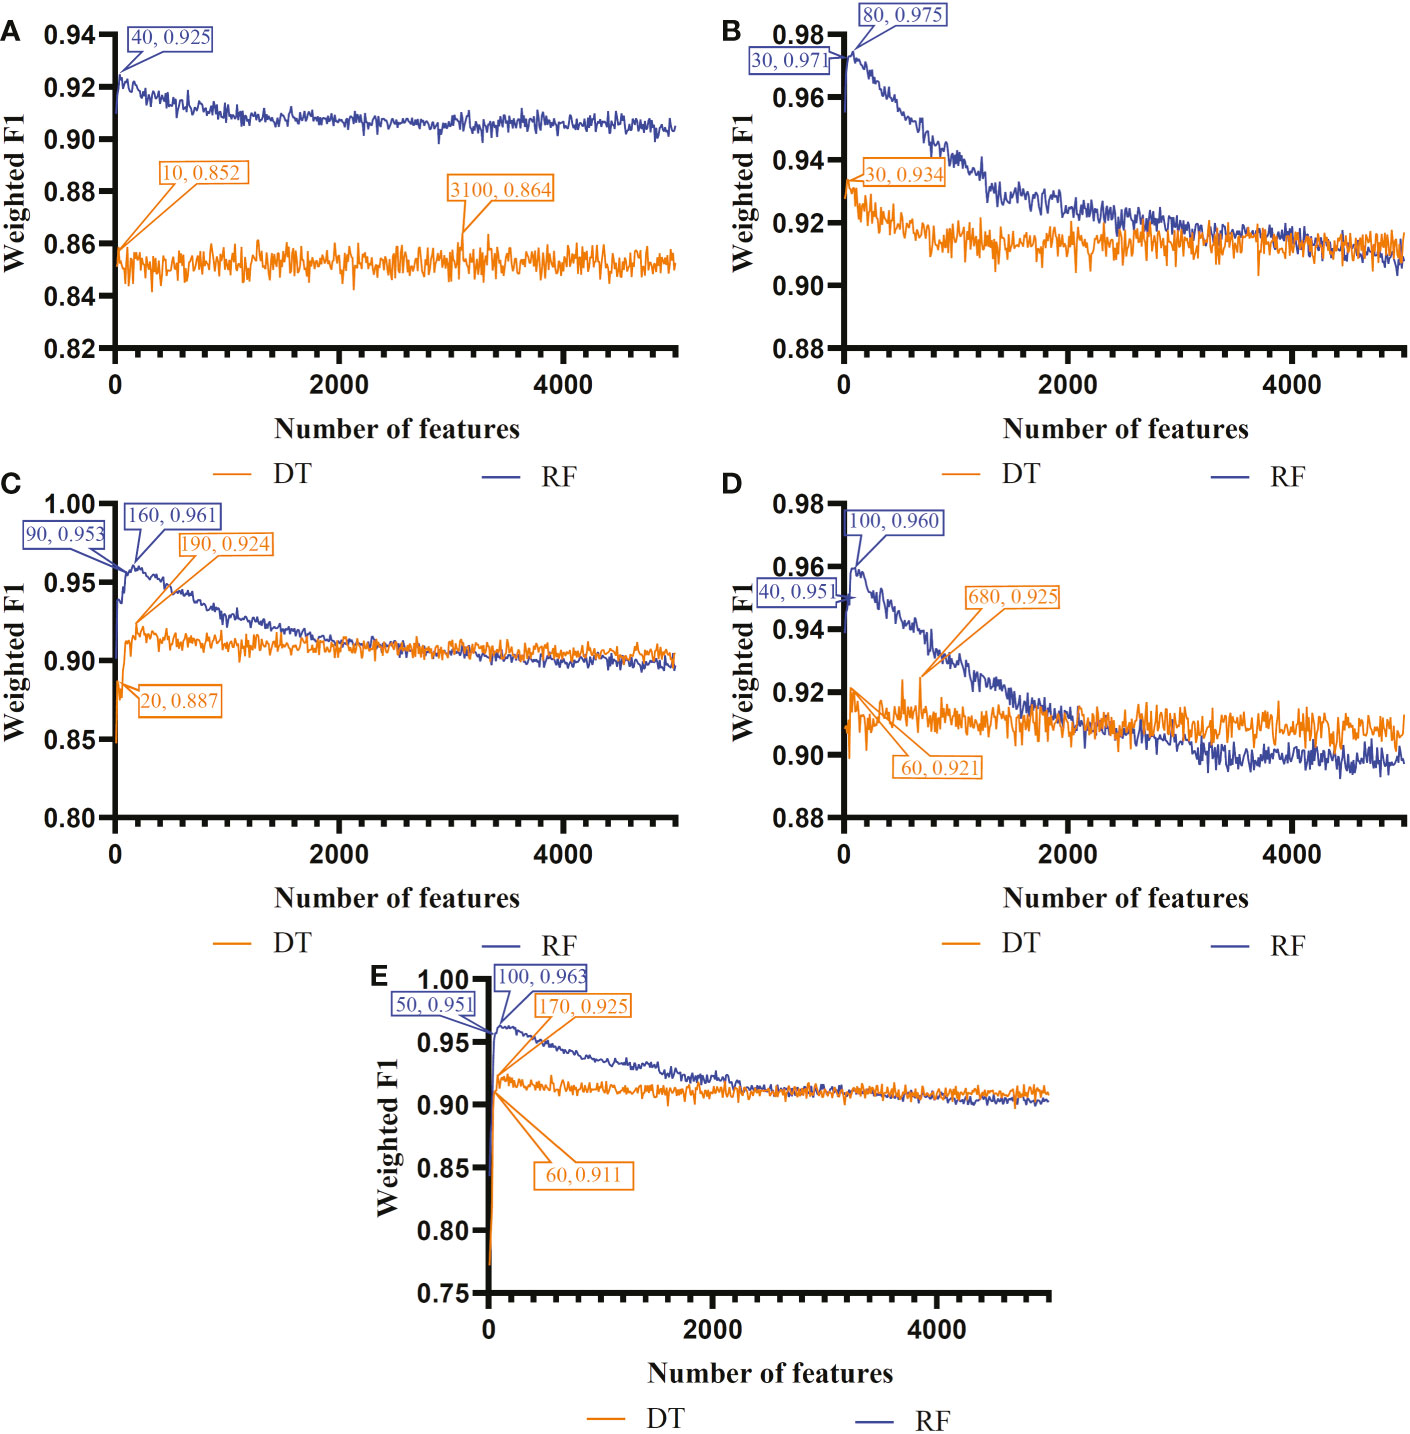
Figure 3 Incremental feature selection (IFS) curves of two classification algorithms in CD8+ T cells. (A) IFS results obtained based on the LASSO gene list. (B) IFS results obtained based on the LightGBM gene list. (C) IFS results obtained based on the mRMR gene list. (D) IFS results obtained based on the MCFS gene list. (E) IFS results obtained based on the PFI gene list.
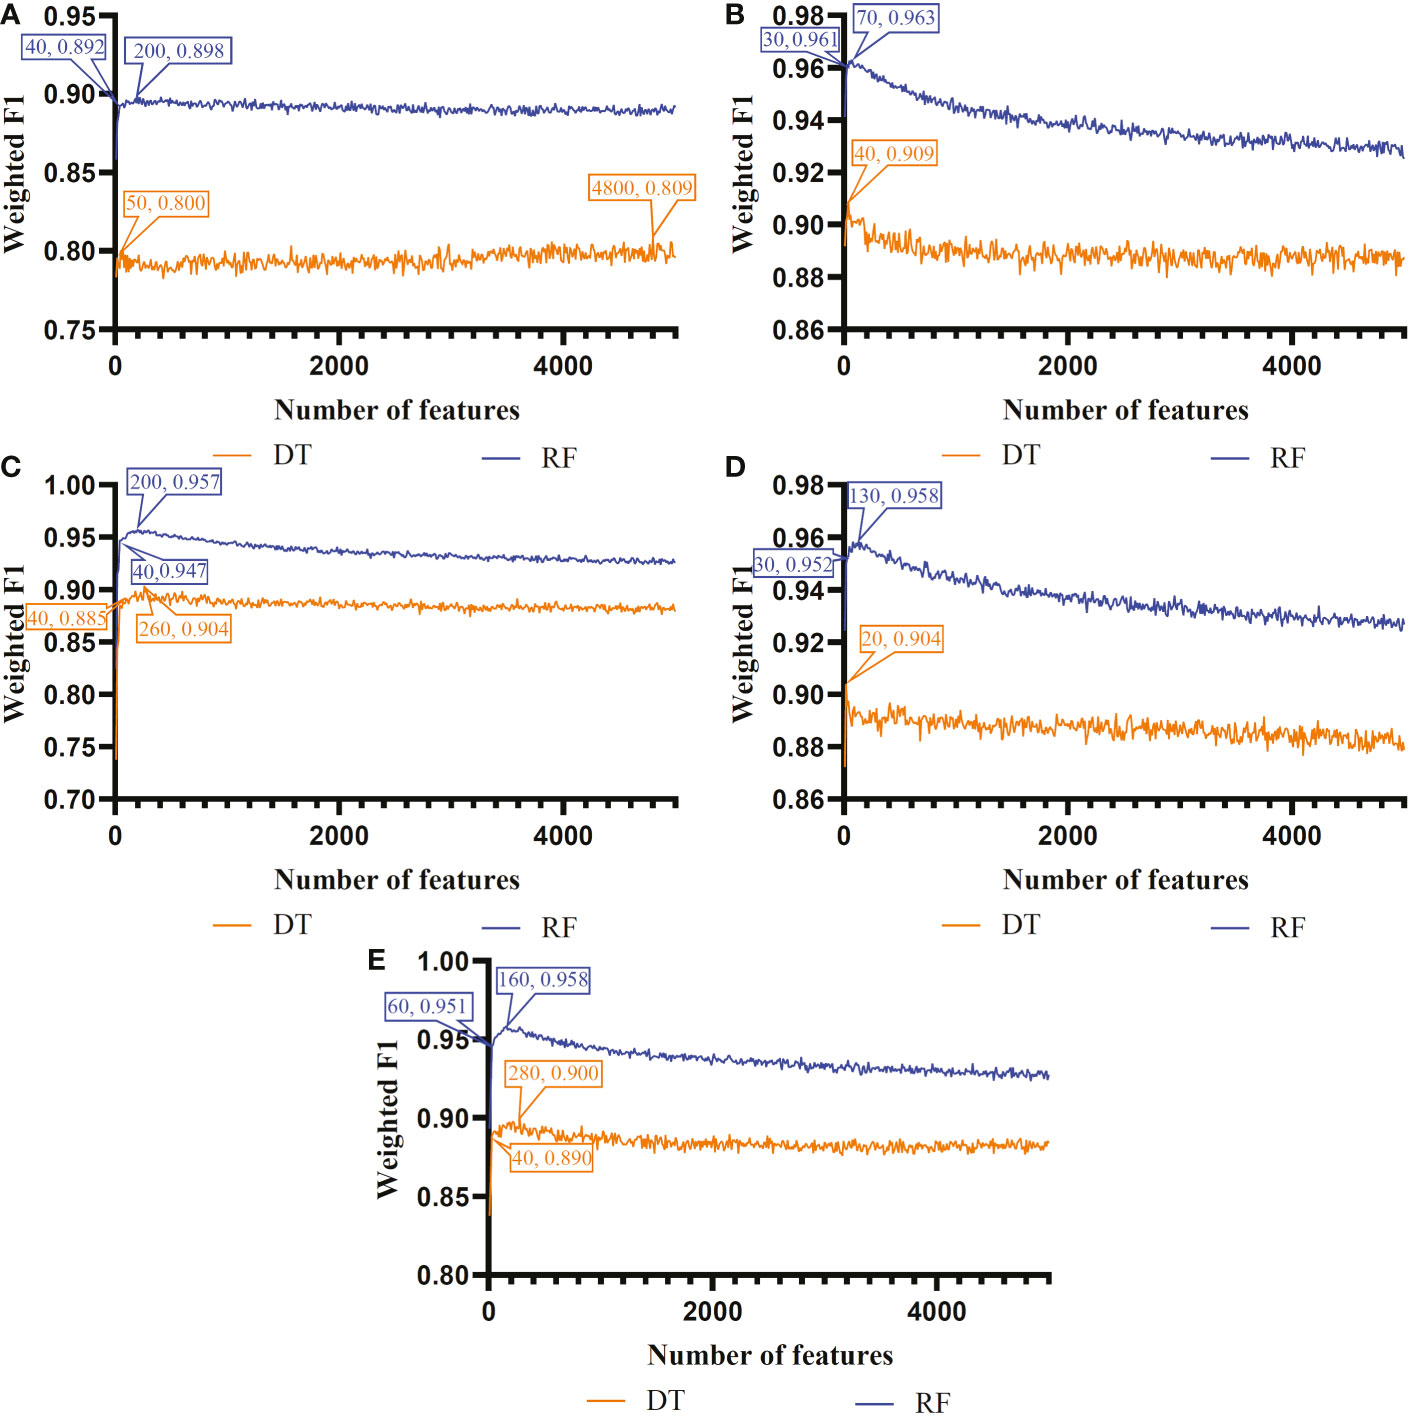
Figure 4 Incremental feature selection (IFS) curves of two classification algorithms in CD4+ T cells. (A) IFS results obtained based on the LASSO gene list. (B) IFS results obtained based on the LightGBM gene list. (C) IFS results obtained based on the mRMR gene list. (D) IFS results obtained based on the MCFS gene list. (E) IFS results obtained based on the PFI gene list.
For B cell, the IFS curves of DT and RF on five gene lists are shown in Figure 2. On the LASSO gene list, DT and RF yielded the highest weighted F1 values of 0.853 and 0.927, respectively, when top 2960 and 3750 features were adopted. These features were deemed as the optimal features for DT and RF identified by LASSO. With such features, the optimal DT and RF classifiers were built. Under the similar operation, the optimal DT and RF classifiers on other four gene lists can be set up. In detail, the optimal DT and RF classifiers on LightGBM gene list used the top 30 and 30 features, respectively, yielding the weighted F1 values of 0.918 and 0.969. On the MCFS gene list, such two optimal classifiers employed the top 190 and 150 features, and their weighted F1 values were 0.910 and 0.961, respectively. For the mRMR gene list, top 20 and 120 features were used to build the optimal DT and RF classifiers, generating the weighted F1 values of 0.915 and 0.964, respectively. For the last PFI gene list, the two optimal classifiers were set up using top 110 and 110 features, producing the weighted F1 values of 0.905 and 0.962, respectively. The detailed performance of above optimal classifiers, including F1-measure on three classes, ACC, MCC, macro F1 and weighted F1, are listed in Table 2. All these classifiers were quite good with weighted F1 around 0.900. Obviously, given the classification algorithm (DT or RF), the optimal classifier on LightGBM gene list always provided the best performance.
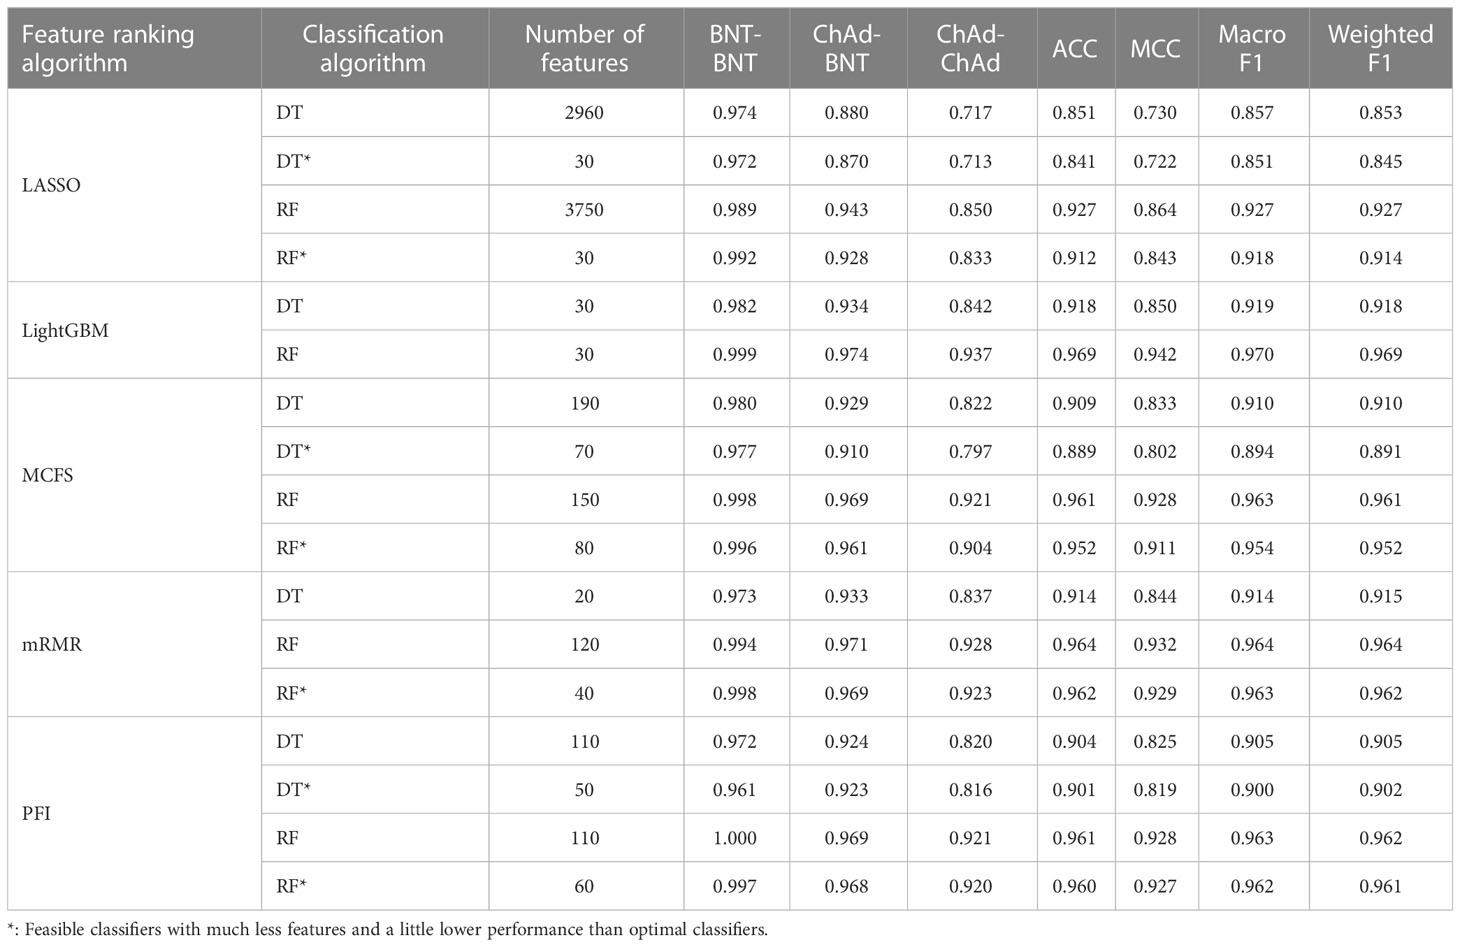
Table 2 Performance of key classifiers in B cell.
For CD4+ T cell, the optimal DT and RF classifiers on each gene list can be extracted from Figure 4. On LASSO gene list, top 4800 and 200 features were used. Optimal feature numbers on other four gene lists were 40 and 70 (LightGBM gene list), 260 and 200 (MCFS gene list), 20 and 130 (mRMR gene list), 280 and 160 (PFI gene list). Table 3 lists the detailed performance of these optimal classifiers. These classifiers also provided high performance, similar to those for B cell. Similarly, on the LightGBM gene list, the DT/RF optimal classifier always provided the best performance.
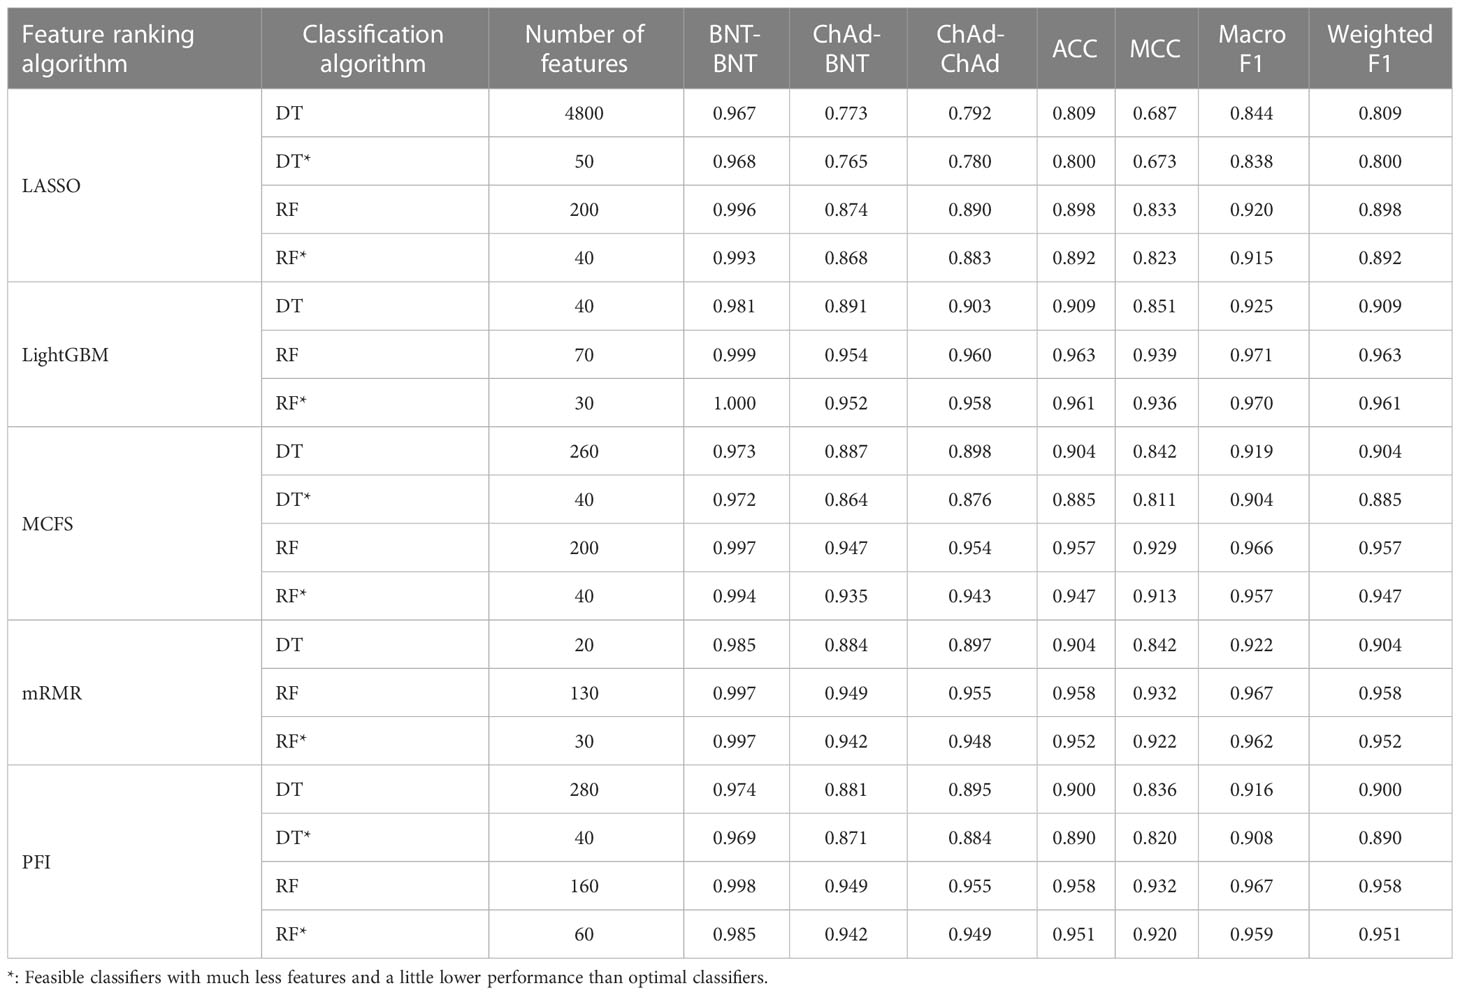
Table 3 Performance of key classifiers in CD4+ T cell.
As for the CD8+ T cell, we also built the optimal DT and RF classifiers by applying IFS method on five gene lists. According to Figure 3, their optimal feature numbers were 3100 and 40 (LASSO gene list), 30 and 80 (LightGBM gene list), 190 and 160 (MCFS gene list), 680 and 100 (mRMR gene list), 170 and 100 (PFI gene list). The detailed performance of these classifiers is listed in Table 4. Similar to the optimal classifiers for B and CD4+ T cells, these classifiers also yielded high performance. Again, the optimal DT/RF classifier on LightGBM gene list generated the best performance.
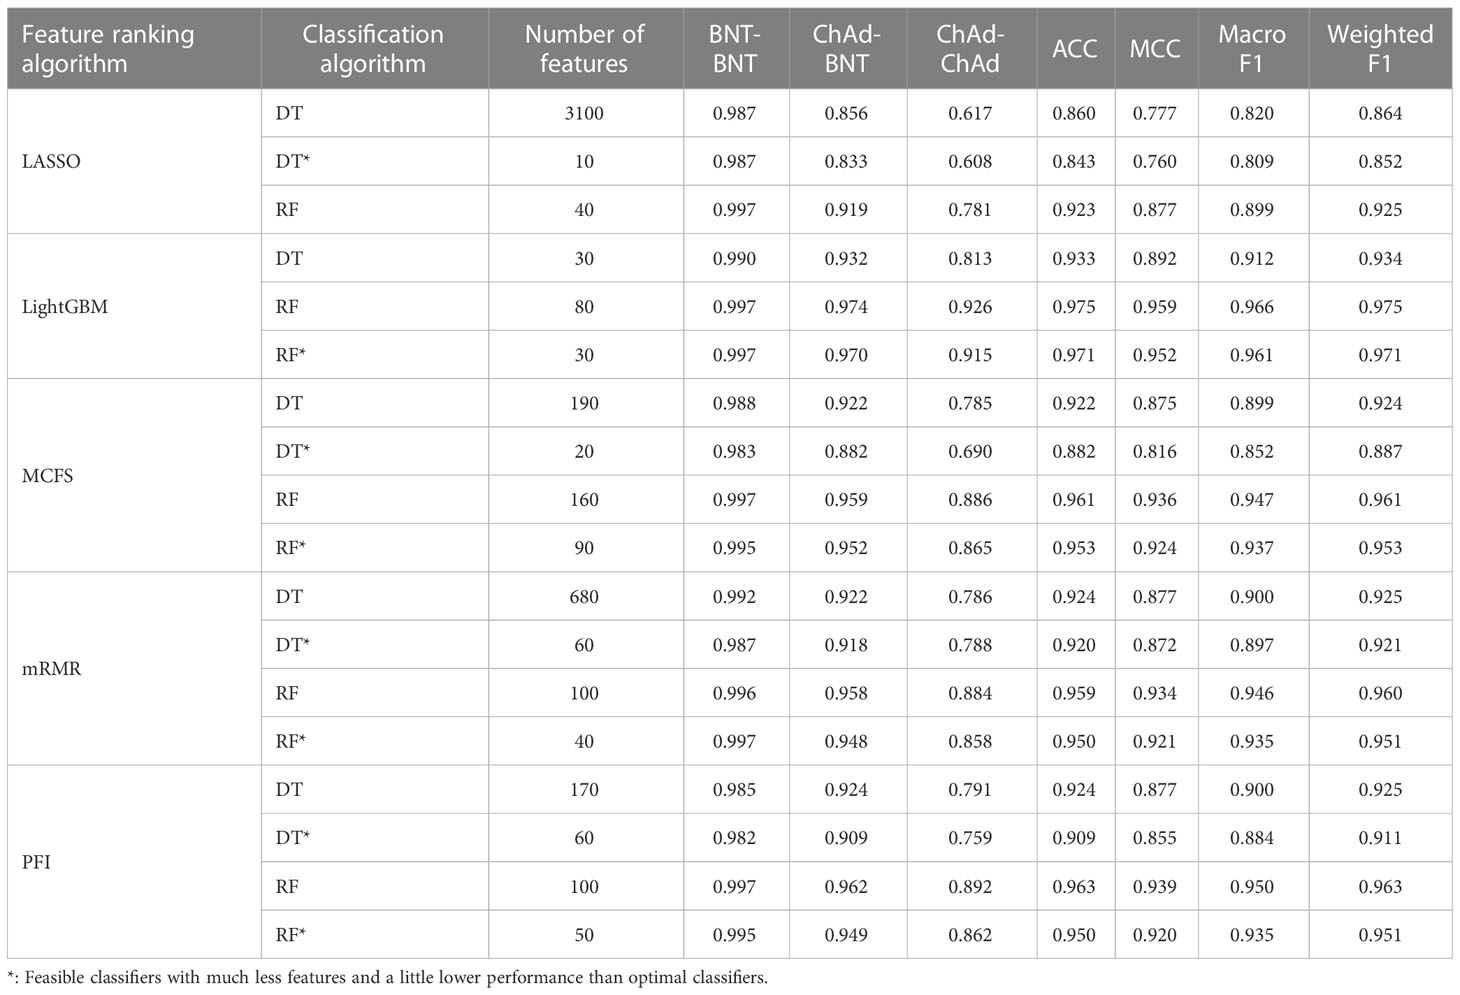
Table 4 Performance of key classifiers in CD8+ T cell.
Based on the performance of optimal DT and RF classifiers for three cell types (Figures 2–4 and Tables 2–4), RF classifiers were always better than DT classifiers. For B cell, the optimal RF classifier on LightGBM gene list was best, which used the top 30 features in the LightGBM gene list. For other two cell types, same results can be obtained, i.e., the optimal RF classifier on LightGBM gene list was better than other optimal classifiers. Top 70 (CD4+ T cell) and 80 (CD8+ T cell) features in corresponding LightGBM gene lists were used. Five feature ranking algorithms were employed in this study, it is necessary to investigate their utilities in analyzing the scRNA-seq profiles. The weighted F1 values of the optimal DT/RF classifiers for three cell types are illustrated in Figure 5. It was interesting that the trendies of weighted F1 values yielded by the optimal DT/RF classifier on different gene lists were quite similar for three cell types. On LightGBM gene lists, the optimal classifiers were always best, as mentioned in above paragraphs, the optimal classifiers on LASSO gene list were evidently inferior to the optimal classifiers on other four gene lists, the performance of the optimal classifiers on MCFS, mRMR and PFI gene lists was quite close. It was indicated that LightGBM may be the best algorithm to analyze the profiles, the abilities of MCFS, mRMR and PFI were almost equal and LASSO was weaker than others.
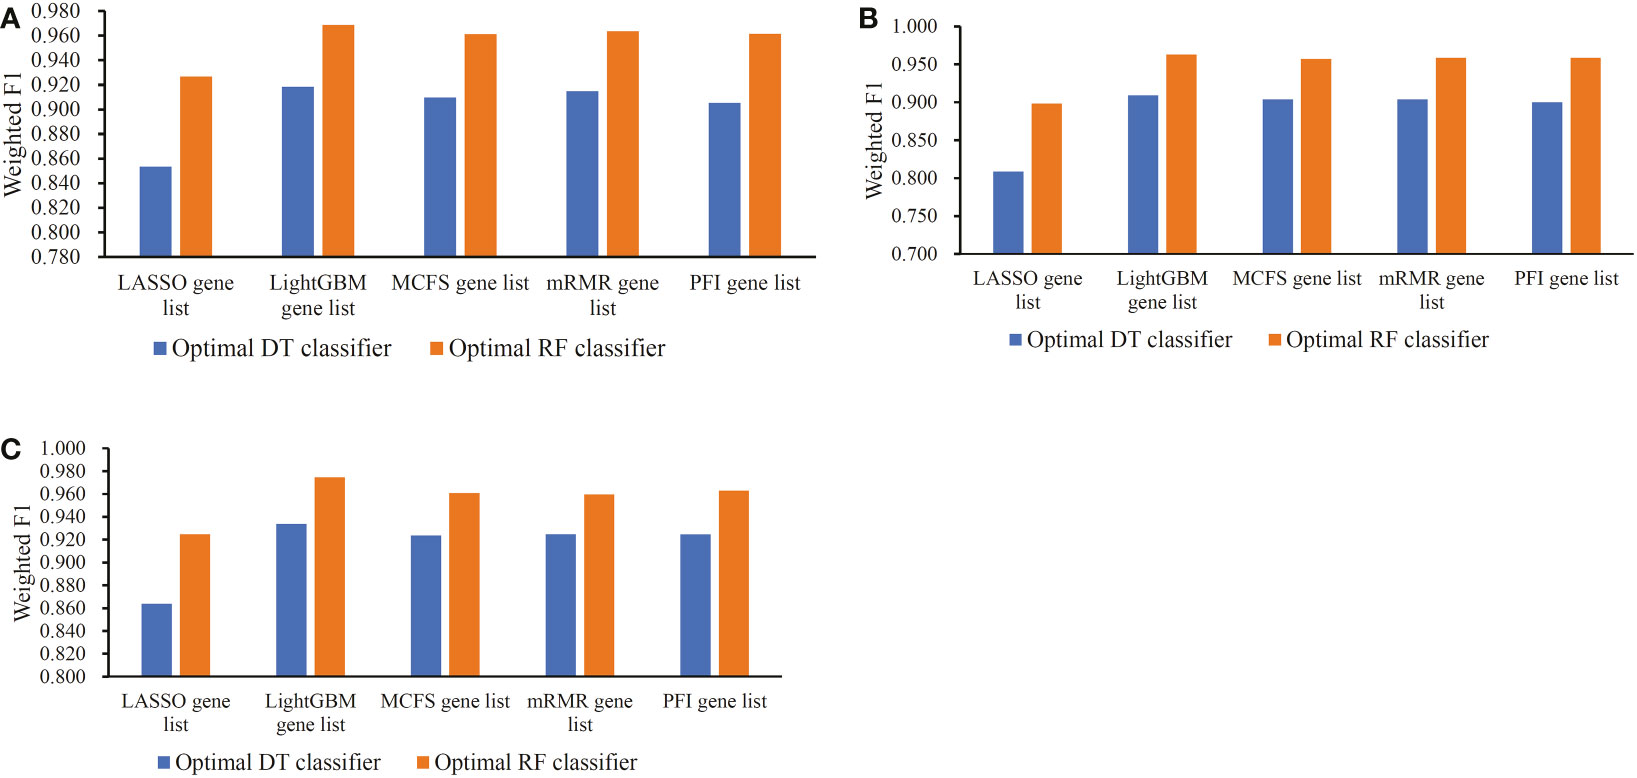
Figure 5 Bar chart to show weighted F1 yielded by the optimal classifiers on different gene lists for three cell types. (A) Bar chart for B cell. (B) Bar chart for CD4+ T cell. (C) Bar chart for CD8+ T cell.
According to Figures 2–4, some optimal DT or RF classifiers on different gene lists used lots of features. The efficiencies of these classifiers were not high enough to process the large-scale data. By checking the IFS results in Supplementary Table S2, the feasible DT or RF classifiers were built for some optimal DT or RF classifiers that adopted lots of features. For example, the optimal DT classifier on LASSO gene list for B cell used the top 2960 features. However, the DT classifier with top 30 features yielded the weighted F1 of 0.845, a little lower than that of the optimal DT classifier (0.853). Much less features sharply increased the efficiency but the utility was limited dropped. Thus, we named it as the feasible DT classifier. In Tables 2–4, the performance of all feasible classifiers is listed (see rows marked by “*”). Clearly, their performance was a little lower than the corresponding optimal classifiers. Notably, it was not necessary to identify the feasible classifiers for the optimal classifiers that adopted a small quantity of features. Multiple feature ranking algorithms were employed in this study to analyze the profiles on three cell types. They may all give contributions to mine essential information from the profiles. In view of this, the features used to construct feasible RF classifiers (if available) or optimal RF classifiers on five gene lists for each cell type were picked up. Five feature sets were obtained accordingly for each cell type. The Venn diagram, as illustrated in Figure 6, shows the relationships between these feature sets. Some features (genes) belonged to multiple sets, meaning that multiple feature ranking algorithms identified them as essential genes. The detailed overlapped results are provided in Supplementary Table S3. In Section 4, we would focus on the biological significance of some overlapped genes.
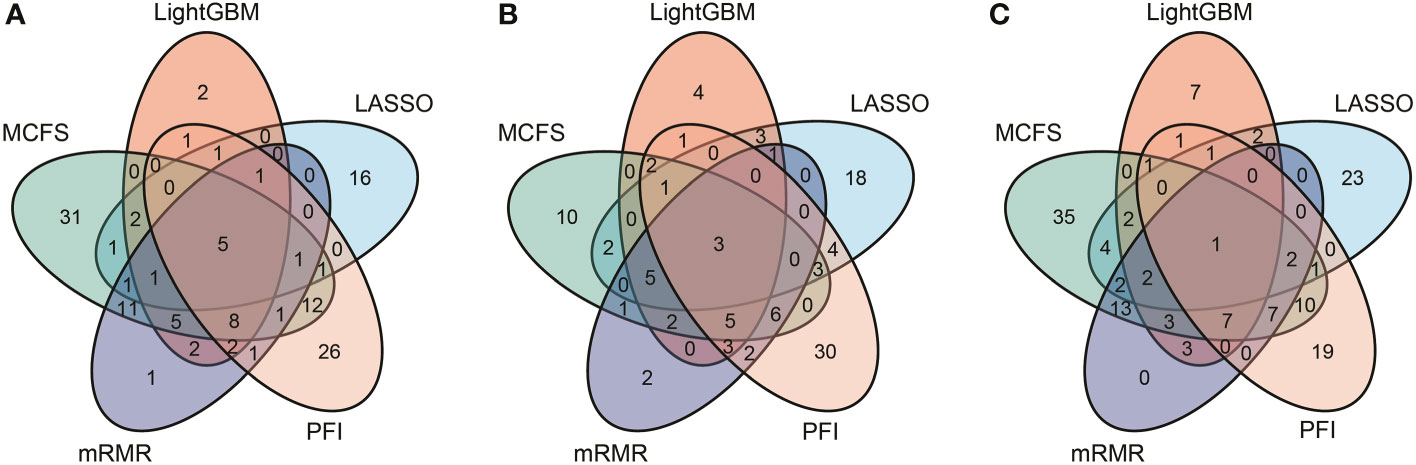
Figure 6 Venn results of five essential feature subsets identified by five feature ranking algorithms in three immune cell types. Genes found in multiple overlapping circles indicate that they were highly ranked in multiple ranking algorithms and were more likely to differ in homologous and heterologous vaccine immune responses. (A) Venn results for B cell. (B) Venn results for CD4+ T cell. (C) Venn results for CD8+ T cell.
3.3 Classification rules created by the optimal DT classifier
For each cell type and each gene list, the optimal DT classifier was inferior to the optimal RF classifier. However, DT has a great merit. As it is a white-box algorithm, i.e., the classification procedures are completely open, it provides more possible to uncover hidden information that human can understand. Here, we used each optimal DT classifier to generate classification rules, which are available in Supplementary Table S4. The number of rules based on each gene list for each cell type is listed in Table 5. Each rule incorporated many gene features and specified requirements for their quantitative expression, revealing different gene expression patterns for three different vaccination strategies in three cell types. Some important rules would be discussed in detail in Section 4.
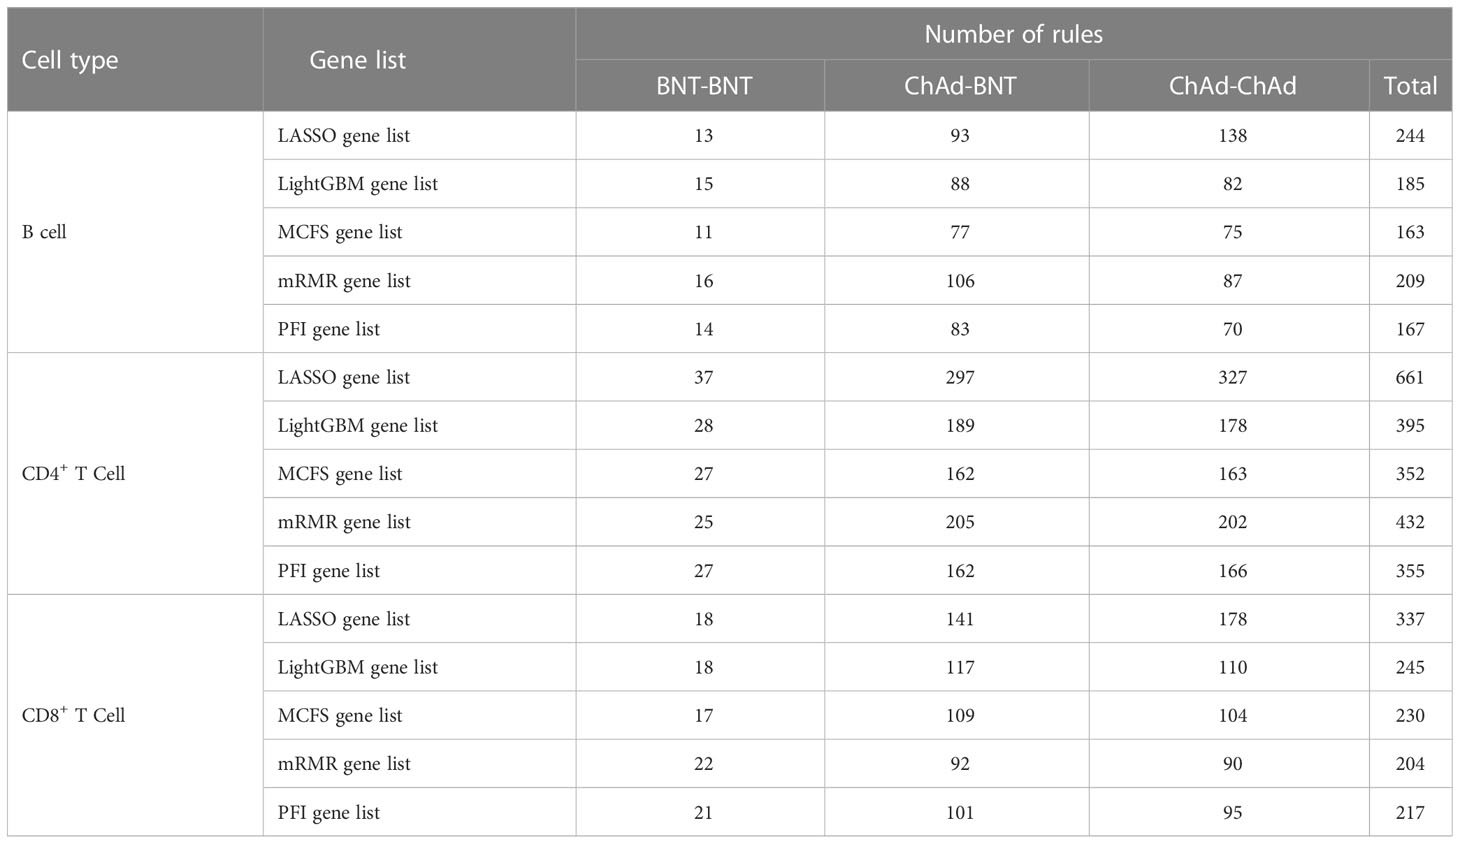
Table 5 Breakdown of rules yielded by decision tree on different gene lists for each cell type.
4 Discussion
4.1 Analysis of gene features in lymphocytes associated with COVID-19 vaccination
On the basis of our computational framework, a set of important genes were identified, which were differentially expressed in B and T cells and facilitated distinction among the immunological effects of different prime-boost vaccinations. As shown in Figure 6, some genes were identified by multiple feature ranking algorithms. These genes may be highly related to different biological activities in lymphocytes that perform immune functions after vaccination or natural infection. Here, we selected five genes in B, CD4+ T, and CD8+ T cells for detailed analysis, which are listed in Table 6.
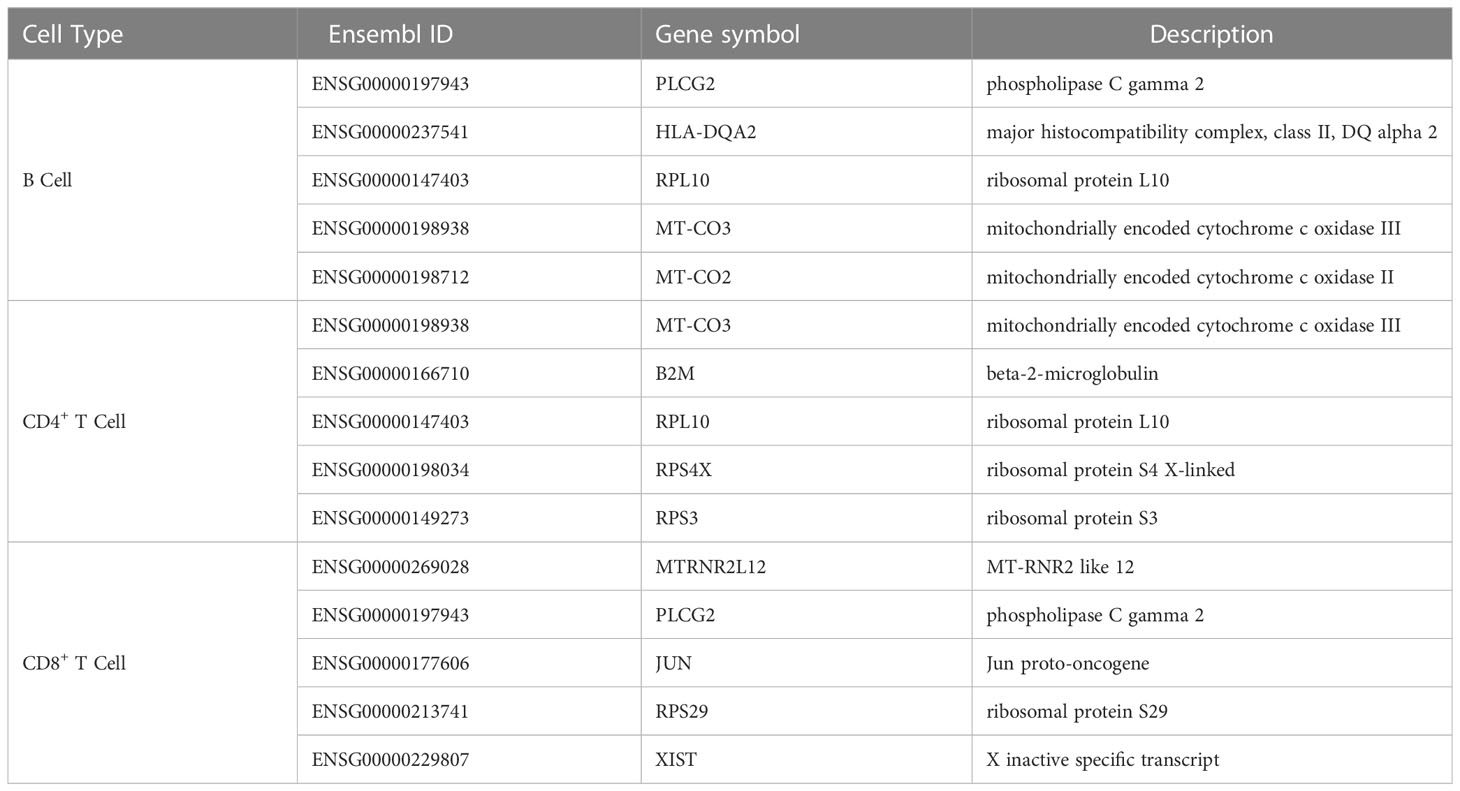
Table 6 Top five genes identified by the computational framework in lymphocytes.
4.1.1 Qualitative features in B cells
The first identified feature gene was PLCG2 (ENSG00000197943). PLCG2 is involved in B cell receptor signaling pathway (57–59) and B cell differentiation (58). Mutations in PLCG2 can impaire B cell memory and antibody production (60). In addition, the protein encoded by the PLCG2 gene, phospholipase Cγ2, plays an important role in the transmembrane transduction of immune signals (61, 62). In summary, PLCG2 is closely related to B cells, and differential expression of PLCG2 is important to the B cell immune pathway. Recent publications have provided evidence of the differential expression of PLCG2 after COVID-19 vaccination. Although no direct evidence of COVID-19 vaccination has been reported, changes in PLCG2 expression after infection with SARS-CoV-2 partially demonstrate the effectiveness of PLCG2 as a feature. In 2022, a study found that PLCG2 was upregulated as an infection-associated gene in the kidneys of patients with COVID-19 (63). Another 2022 study found no elevated anti-S1 IgA levels in a subject carrying a mutation in the PLCG2 gene after a booster dose of BNT vaccine, suggesting a role of PLCG2 after COVID-19 vaccination (64). Therefore, PLCG2 gene expression may be altered after vaccination, and PLCG2 in B cells can be used as an effective feature.
The next identified feature was HLA–DQA2 (ENSG00000237541). HLA–DQA2 gene is involved in immunoglobulin production and immunoglobulin-mediated immune responses (65) and is involved in antigen processing and presentation of exogenous peptide antigens via MHC class II (65, 66). Thus, HLA–DQA2 plays an important role in immune response. COVID-19 vaccines may have an impact on how HLA–DQA2 is expressed, though direct evidence following COVID-19 vaccination is limited. In recent year, researchers have shown that HLA–DQA2 gene expression can be changed according to COVID-19 severity and HLA–DQA2 was upregulated in patients with mild COVID-19 and those who recovered (67, 68) and downregulated in patients with severe COVID-19 (66, 67, 69). HLA–DQA2 gene expression may have a trend similar to that in patients with mild COVID-19 and recovered individuals after vaccination. In addition, HLA–DQA2 gene plays an immunological role in B cells as previously mentioned, suggesting altered expression after vaccination. Therefore, HLA–DQA2 may be altered in expression after COVID-19 vaccination. In conclusion, the expression of HLA–DQA2 in B cells can be a useful feature.
The next identified feature genes were MT-CO2 (ENSG00000198712) and MT-CO3 (ENSG00000198938). MT-CO2 and MT-CO3 are mitochondrial genes involved in aerobic respiration and ATP synthesis for energy supply (65, 70). Viral infection is known to affect mitochondrial function (71, 72), and mitochondrial genes play a key role in the host immune response (73, 74). MT-CO2 and MT-CO3 gene expression may be altered after COVID-19 vaccination, and SARS-CoV-2 infection can alter MT-CO2 and MT-CO3 expression. For example, MT-CO2 and MT-CO3 are downregulated in severe COVID-19 patients (75, 76). An increased expression of mitochondrial genes was found in SARS-CoV-2-infected lung cells (77) and upregulated expression in alveolar epithelial cells of patients with mild or moderate COVID-19 (78). Furthermore, in 2022, Adamo et al. viewed the MT-CO2 gene as a gene tag for recovery in COVID-19 patients and considered that increase in its expression indicates improvement in COVID-19 (79), suggesting that immune response induced by COVID-19 vaccination also leads to differential MT-CO2 and MT-CO3 gene expression. According to the functions of MT-CO2 and MT-CO3 genes discussed above, their expression may be changed after COVID-19 vaccination and may respond to the intensity of the immune response after vaccination. Therefore, MT-CO2 and MT-CO3 are potentially useful features.
The last identified gene was RPL10 (ENSG00000147403). RPL10 encodes ribosomal protein L10, which promotes ribosome biogenesis and its ability to synthesize proteins (80–82). Thus, immunoglobulins, such as antibodies, as proteins, and RPL10 in B cells may play a role in immunoglobulin production. Some recent papers have provided evidence of altered RPL10 gene expression after COVID-19 vaccination. Chang et al. suggested that ribosomal genes, such as RPL10, can serve as biomarkers for identifying SAR-CoV-2 infection (83), suggesting the possibility of altered RPL10 gene expression after vaccination. Similarly, another study found altered expression of ribosomal genes, including RPL10, after SARS-CoV-2 infection (84). COVID-19 vaccination produces a large number of antibodies (85–87), and based on the previously postulated contribution of the RPL10 gene to antibody production by B cells, RPL10 expression may be altered after vaccination. As a result, RPL10 gene in B cells can be an effective feature.
4.1.2 Qualitative features in CD4+ T cells
The first identified feature gene was B2M (ENSG00000166710), which has a broad role in immune response and is a marker of lymphocyte turnover (88, 89). In T cells, B2M is associated with thymic T cell differentiation (90), involved in the positive regulation of T cell activation (65) and is a hub gene for cytokine storm (91). COVID-19 vaccination may cause the differential expression of B2M gene. B2M is widely recognized as a good biomarker of responses to COVID-19 severity and treatment (92, 93) and is upregulated in the olfactory bulb of patients of COVID-19 (92). SARS-CoV-2 natural infection alters B2M expression, partially demonstrating the differential expression of B2M after vaccination. Given the previously mentioned important role of B2M gene in immune response, immune response induced by a COVID-19 vaccine may alter the expression of B2M Thus, B2M is a potential feature.
The next identified gene was MT-CO3 (ENSG00000198938), which is a mitochondrial gene that we have previously discussed as a feature in B cells. Although little has been written about the specific role of MT-CO3 in CD4+ T cells, according to the important role of MT-CO3 gene in the immune response (94) and its involvement in aerobic respiratory energy supply (65, 70), MT-CO3 gene may show differential expression after COVID-19 vaccination. Furthermore, SARS-CoV-2 natural infection leads to differential MT-CO3 gene expression (75–77), further demonstrating that immunological response induced by COVID-19 vaccination may change MT-CO3 expression. As a result, MT-CO3 gene in CD4+ T cells can be used as an effective feature.
The next identified features were RPL10 (ENSG00000147403), RPS3 (ENSG00000149273), and RPS4X (ENSG00000198034). RPL10, RPS3, and RPS4X are all ribosomal genes, and RPL10 gene is a feature gene in B cells. RPL10 has crucial function in the immune systems of numerous plants and animals (95–97), and thus has potential function in the human immune system. RPS3 is involved in the positive regulation of activated T cell proliferation (98, 99) and cytokine production and proliferation in T cells (100), and its function correlates with the function of CD4+ helper T cells. However, no publication has directly explored the role of RPS4X in immune response, but it is presumed to be related to the execution of immune functions by CD4+ T cells because of its involvement in protein translation as a ribosomal gene (101). The alteration of gene expression by SARS-CoV-2 infection may partially demonstrate the trend of the alteration of these genes after COVID-19 vaccination. In 2022, an article suggested that the RPS4X gene showed downregulated expression after SARS-CoV-2 infection (102). Although no subsequent literature has demonstrated COVID-19 vaccination-induced differential expression of RPL10, RPS3, and RPS4X in CD4+ T cells, these genes are still considered potent features.
4.1.3 Qualitative features in CD8+ T cells
The first identified feature was JUN (ENSG00000177606), which is involved in the negative host regulation of viral transcription (103) and thus has potential role in immune response. In addition, c-Jun expression is a key component of the JNK/AP-1 pathway, which plays an important role in the regulation of stress response genes with anti-inflammatory and cytoprotection function (104). The immune functions of JUN may provide indirect evidence of the differential expression of JUN after COVID-19 vaccination. Further, a 2020 paper identified that SARS-CoV-2 infection can cause the differential expression of JUN through pathway enrichment analysis and identified the JUN as a novel biomarker (105). Therefore, JUN may exhibit differential expression after COVID-19 vaccination and may serve as a plausible signature gene.
The next identified feature gene was MTRNR2L12 (ENSG00000269028), which is a paralog of protein-coding genes and associated with apoptosis (65). Although no paper has discussed the immune function of MTRNR2L12 in CD8+ T cells, the differential expression of MTRNR2L12 in patients with COVID-19 may provide indirect evidence of COVID-19 vaccination. In 2021, researchers found that MTRNR2L12 was upregulated in immune cells, such as CD8+ T cells, in bronchoalveolar lavage fluid from mild and severe COVID-19 patients (106), suggesting the possibility of altered expression following COVID-19 vaccination. Two recent papers published in 2022 found the differential expression of MTRNR2L12 in bronchoalveolar lavage fluid samples from patients with severe COVID-19 (107) and classification of the MTRNR2L12 gene as an important gene determining COVID-19 positive status by association classification model (108). Thus, COVID-19 vaccination may cause the differential expression of MTRNR2L12 and serve as a feature that facilitates the differentiation among the protective capacities of different vaccination strategies.
The next identified gene was PLCG2 (ENSG00000197943), which is a feature gene that may respond to vaccine protection in B cells. In contrast to what was previously mentioned, PLCG2 is implicated in the T cell receptor signaling pathway (109). Li et al. also found that PLCG2 expression is positively correlated with immune cells, such as CD8+ T cells (110). The alteration of PLCG2 expression by natural infection with SARS-CoV-2 has been discussed in the previous section. PLCG2 expression in CD8+ T cells may represent T cell immunological response following COVID-19 vaccination. In summary, PLCG2 in CD8+ T cells can be used as an effective feature.
The next identified feature was RPS29 (ENSG00000213741), which encodes a ribosomal protein involved in the protein translation (111, 112) and is associated with CD8+ T cells that kill infected cells (113). Additionally, differential expression of RPS29 may partially react to the differential expression of RPS29 following vaccination in patients with COVID-19. In 2020, Vastrad et al. identified RPS29 as a biomarker for the diagnosis of SARS-CoV-2 infection through pathway enrichment analysis (114), so RPS29 expression may be altered after COVID-19 vaccination. In addition, Yang et al. found that ribosome-encoding genes, such as RPS29, were specifically downregulated in patients with long duration of toxic shedding. Based on the above discussion, RPS29 may be differentially expressed in CD8+ T cells after COVID-19 vaccination as a feature of the protective power of response vaccine.
The last identified gene was XIST (ENSG00000229807), which encodes noncoding RNAs that specifically silences X chromosome (115). XIST expression is closely associated with T cells. A study found that the high expression of the XIST gene was associated with CD8+ T cell and total T cell levels (116). In addition, the high expression of XIST stimulates the proliferation and differentiation of naïve CD4+ T cells (117). Thus, XIST is closely associated with T cell-induced immune response and may be differentially expressed after COVID-19 vaccination. XIST can still be a feature in CD8+ T cells according to its immunological role even if no study provides clear evidence of differential expression of XIST after vaccination.
4.2 Analysis of decision rules in lymphocytes for distinguishing among vaccination strategies
As described above, we identified a set of validated features that can help qualitatively distinguish among lymphocyte gene expression samples from various prime-boost vaccination strategies. Some top features have been validated by recent studies. For a more thorough discussion, we selected a few representative rules for each class based on blood single cell data for B, CD4+ T, and CD8+ T cells, which are listed in Table 7. We compared the protective effects of BNT–BNT, BNT–ChAd, and ChAd–ChAd vaccine combinations based on the differential expression of some important genes. Then, the effectiveness of immunity induced by vaccination strategies based on the roles of these genes in B, CD4+ T, and CD8+ T cells were predicted.
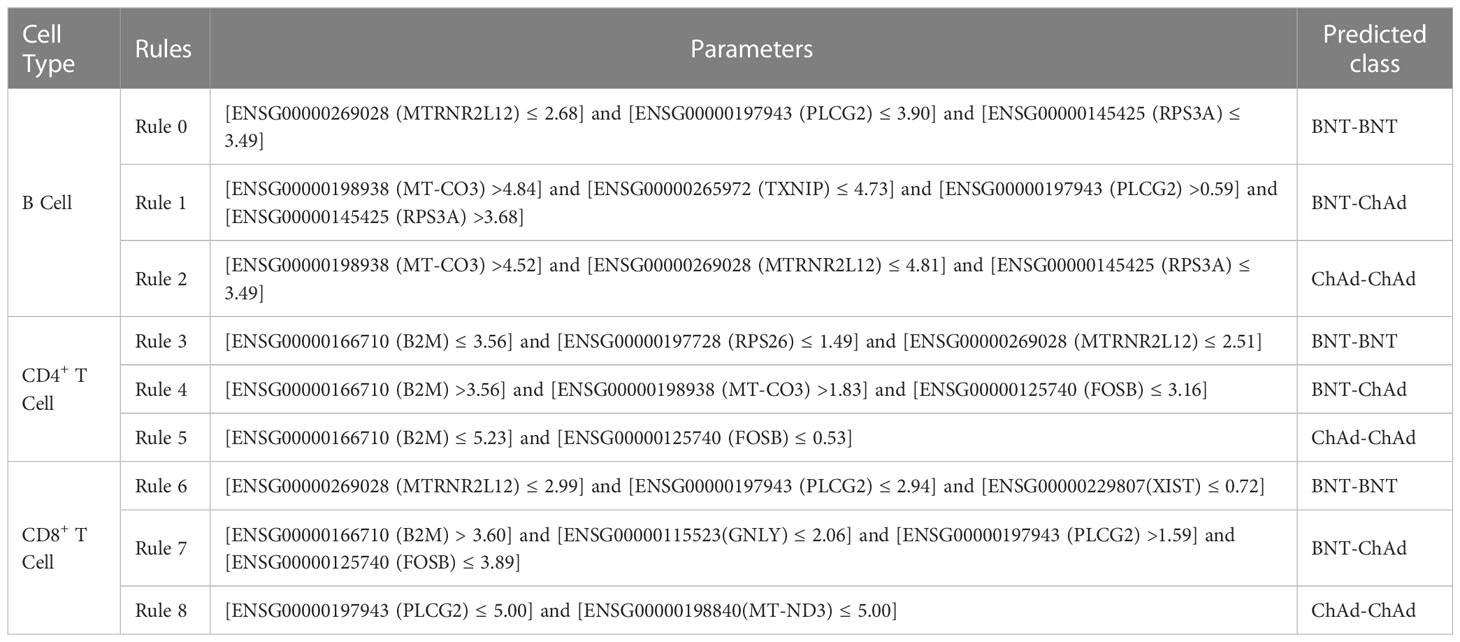
Table 7 Representative rules in lymphocytes.
4.2.1 Quantitative rules in B cells
MTRNR2L12 (ENSG00000269028) is downregulated in B cells after two doses of BNT or ChAd vaccination. MTRNR2L12 is an anti-apoptotic lncRNA (106), and the expression of MTRNR2L12 is positively correlated with cellular stress (118). Based on the relationship between MTRNR2L12 expression and cellular stress, we hypothesized that the low expression of MTRNR2L12 may be associated with decrease in adverse vaccine reactions. A study in 2021 reported a higher incidence of serious adverse events due to ChAd–BNT than that after homologous vaccines (119). Thus, the low expression of MTRNR2L12 facilitates differentiation among homologous vaccines with low adverse reaction rates.
PLCG2 (ENSG00000197943) is involved in the B cell receptor signaling pathway (59) and associated with antibody production and B cell memory (60). Therefore, the expression of PLCG2 is altered after COVID-19 vaccine administration. In addition, the expression level of PLCG2 may suggest the effectiveness of humoral immunity induced by different vaccine combinations. In 2022, a study found that homologous BNT–BNT-induced lower anti-S IgM and IgG concentrations to a higher degree than heterologous BNT–ChA (120). Similarly, Pozzetto et al. (15) found that heterologous ChAd–BNT vaccination strategy produced more effective neutralizing antibodies than vaccination with homologous BNT-BNT. Thus, PLCG2 is useful in identifying ChAd–BNT vaccine recipients.
RPS3A (ENSG00000145425) is overexpressed after BNT–ChAd vaccination. The small ribosomal subunit (40S) contains RPS3A, which is primarily found in the cytoplasm and nucleus (121). RPS3A plays a critical role in regulating translation initiation and protein synthesis (122, 123), so the expression of RPS3A may be related to antibody secretion. In 2022, a study found that BNT–ChAd vaccination produced more anti-S IgG than BNT–BNT vaccination in people without previous SARS-CoV-2 infection (124). In 2021, another study found that BNT–ChAd induced higher titers of anti-S protein IgG and IgA subclasses than a homologous vaccination strategy (16), confirming that RPS3A is a valid parameter for predicting people receiving heterologous BNT–ChAd vaccines.
High expression of MT-CO3 (ENSG00000198938) is associated with vaccination with heterologous BNT–ChAd vaccines. MT-CO3, a mitochondrial gene (65), enables B cells to obtain sufficient energy to perform their functions. When B cells are activated by an antigen and differentiate into plasma cells to secrete antibodies, a high level of oxidative phosphorylation is required (125). Therefore, the upregulation of MT-CO3 is reasonable given that COVID-19 vaccination induces B-cell-mediated humoral immunity (126, 127). In 2021, a study found that initial booster vaccination with heterologous BNT–ChAd induced the production of high concentrations of anti-S IgG (128). In addition, BNT–ChAd vaccinees produce more anti-RBD IgG than ChAd–ChAd vaccines (129). The effectiveness of MT-CO3 upregulation was demonstrated by the fact that heterologous vaccines induce the production of a large number of antibodies and therefore require a large energy supply.
TXNIP (ENSG00000265972) is downregulated after BNT–ChAd vaccination, helping to identify homologous vaccinated individuals. The product encoded by TXNIP can inhibit the activity of Trx1, thereby suppressing rapid cellular proliferation (130). Thus, TXNIP can inhibit the proliferation of B cells during an immune response. Immune response to vaccination causes B cell proliferation, indicating the downregulation of TXNIP in B cells. In view of the strong humoral immune response induced by BNT–ChAd prime-boost vaccination reported in 2021 (15), low TXNIP expression is associated with heterologous vaccination.
4.2.2 Quantitative rules in CD4+ T cells
B2M (ENSG00000166710) is a marker of immune activation and involved in the positive regulation of T cell activation (88). Therefore, B2M expression in CD4+ T cells may be related to CD4+ T cell activation and executive functions. Schmidt et al. found that the homologous vaccination strategy resulted in lower IFN-γ level than the heterologous vaccination strategy (10, 129), demonstrating a weaker CD4+ T cell immune response in BNT–BNT vaccinees. Thus, the overexpression of B2M in CD4+ T cells can facilitate distinction of BNT–ChAd prime-boost vaccination from other types of vaccination.
RPS26 (ENSG00000197728) has low expression to predict BNT–BNT vaccines. RPS26 is a ribosomal protein-encoding gene and plays a key role in regulating T cell survival (131). The expression of RPS26 is related to T cell-mediated cellular immunity. In addition, in 2022, a study found differential expression of RPS26 after COVID-19 mRNA vaccination (132), demonstrating the validity of RPS26 as a parameter. In 2021, another study demonstrated that the BNT–BNT vaccination strategy induced less spike-specific IFN-γ than the BNT–ChAd vaccination strategy did (133). Therefore, the downregulation of RPS26 is associated with the identification of BNT–BNT vaccine recipients.
In B cells, the low expression of MTRNR2L12 (ENSG00000269028) is associated with a low incidence of adverse reactions to two doses of BNT vaccine and with the identification of a BNT+BNT vaccination strategy. As previously explained, a low incidence of adverse reactions to two doses of the BNT vaccine is related to the low expression of MTRNR2L12. Therefore, MTRNR2L12 can also be used as a valid parameter in CD4+ T cells.
The expression of MT-CO3 (ENSG00000198938) in CD4+ T cells facilitates the identification of a group that has received heterologous BNT–ChAd vaccination. We have already discussed MT-CO3 as a mitochondrial gene in B cells engaged in ATP synthesis. A study in 2021 suggested that the BNT–ChAd immunization method produced great protection (134), suggesting that MT-CO3 is a useful parameter in CD4+ T cells.
FOSB (ENSG00000125740) is downregulated after heterologous BNT–ChAd vaccination. FOSB is an AP-1 family transcription factor that participates in the regulation of T cell proliferation, differentiation, and immune response (135). In 2022, a study found that the FOSB-encoded AP-1 transcription factor was downregulated after BNT vaccination (136), suggesting the extent at which FOSB downregulation may facilitate distinction among different vaccine strategies. Although no publications have proven the validity of FOSB, FOSB can still be identified as a parameter in this rule.
4.2.3 Quantitative rules in CD8+ T cells
MTRNR2L12 (ENSG00000269028) contributes to the low incidence of adverse reactions after BNT–BNT vaccination (119, 137) and is thus a valid parameter in CD8+ T cells and facilitates the differentiation of a BNT–BNT vaccination population from another population.
PLCG2 (ENSG00000197943) expression is positively correlated with CD8+ T cells (110), and the protective capacity of homologous vaccination is lower than that of BNT–ChAd vaccination (128), PLCG2 can be used as a valid parameter in CD8+ T cells for identifying individuals with BNT–ChAd vaccines.
The low expression of XIST (ENSG00000229807) may be the result of the reduced level of response of CD8+ T cells after BNT–BNT vaccination because a high expression of XIST increases the amounts of CD8+ T cells (117). In 2021, a study found that BNT–BNT vaccination produced less IFN-γ than heterologous vaccination (133), also demonstrating that the expression of XIST in CD8+ T cells can facilitate the identification of people who have received two doses of the BNT vaccine.
The upregulated expression of B2M (ENSG00000166710) in CD8+ T cells facilitates the identification of BNT–ChAd vaccination strategies. The B2M gene is involved in T cell-mediated cytotoxicity (90) and T cell activation (65), and so B2M plays an important role in the immune function of CD8+ T cells. Given that the heterologous BNT–ChAd vaccination strategy induces stronger cellular immunity than the homologous vaccination strategy does (15, 129), B2M can be regarded as a parameter.
GNLY (ENSG00000115523) expression in CD8+ T cells is useful in predicting BNT–ChAd vaccine recipients. GNLY is a cytotoxicity-associated gene involved in CD8+ T cell-mediated protective immunity (138, 139). However, the low expression of GNLY in this rule may be due to the fact that GNLY is released by CD8+ T cells to kill cells infected by SARS-CoV-2. The BNT–ChAd vaccination strategy induces stronger cellular immunity (128), and thus GNLY facilitates the identification of individuals with the BNT–ChAd vaccine.
The expression of FOSB (ENSG00000125740) in CD8+ T cells helps in identifying people who received heterologous BNT–ChAd vaccination. In 2021, a study found high FOSB expression in senescent T cells (140), presumably with few senescent CD8+ T cells due to the induction of CD8+ T cell proliferation by vaccination with BNT–ChAd vaccine. In addition, the BNT–ChAd vaccination strategy induces stronger cellular immunity than the homologous vaccination strategy does (16), and thus FOSB can serve as an effective parameter in CD8+ T cells.
MT-ND3 (ENSG00000198840) is a mitochondrial gene associated with the energy supply of CD8+ T cells performing immune functions. The downregulation of MT-ND3 CD8+ T cells allows the identification of homologous ChAd–ChAd vaccination strategies, as BNT–ChAd heterologous vaccines induce strong immune responses (134). Therefore, MT-ND3 can be regarded as a valid parameter in CD8+ T cells.
5 Conclusion
In the present study, a set of potential genes that reveal differential expression in B, CD4+ T, and CD8+ T cells induced by COVID-19 vaccination were identified. The genes may facilitate distinction among the immunological effects of BNT–BNT, ChAd–ChAd, and ChAd–BNT vaccinations. The differential expression of the features we identified in subjects vaccinated with different COVID-19 vaccine types may provide evidence of the protective capacities of different vaccination strategies and help advance effective vaccination methods, providing protection against SARS-CoV-2 infection. According to newly released publication, some features and quantitative rules were associated with COVID-19 vaccination and SARS-CoV-2 infection. Meanwhile, some efficient classifiers with the screened features were set up, indicating that selected features can effectively distinguish between heterologous and homologous vaccines. The high efficacy of the heterologous ChAdOx1–BNT162b2 vaccine can be partly explained by this study, which offers a theoretical foundation for vaccine modification.
Data availability statement
Publicly available datasets were analyzed in this study. This data can be found here: https://www.ncbi.nlm.nih.gov/geo/query/acc.cgi?acc=GSE201534.
Author contributions
TH and Y-DC designed the study. JL, WG, and KF performed the experiments. FH and QM analyzed the results. JL, FH, and QM wrote the manuscript. All authors contributed to the research and reviewed the manuscript. All authors contributed to the article and approved the submitted version.
Funding
This research was supported by the National Key R&D Program of China (2022YFF1203202), Strategic Priority Research Program of Chinese Academy of Sciences (XDA26040304, XDB38050200), the Fund of the Key Laboratory of Tissue Microenvironment and Tumor of Chinese Academy of Sciences (202002), Shandong Provincial Natural Science Foundation (ZR2022MC072).
Conflict of interest
The authors declare that the research was conducted in the absence of any commercial or financial relationships that could be construed as a potential conflict of interest.
Publisher’s note
All claims expressed in this article are solely those of the authors and do not necessarily represent those of their affiliated organizations, or those of the publisher, the editors and the reviewers. Any product that may be evaluated in this article, or claim that may be made by its manufacturer, is not guaranteed or endorsed by the publisher.
Supplementary material
The Supplementary Material for this article can be found online at: https://www.frontiersin.org/articles/10.3389/fimmu.2023.1131051/full#supplementary-material
Supplementary Table 1 | List of features in three immune cell types sorted by LASSO, LightGBM, mRMR, MCFS, and PFI methods.
Supplementary Table 2 | IFS results of DT and RF on lists yielded by different feature ranking algorithms in three immune cell types.
Supplementary Table 3 | Venn results for essential features, used in feasible classifiers (if available) or optimal classifiers, identified by five feature ranking algorithms in three immune cell types.
Supplementary Table 4 | Classification rules based on the optimal DT classifiers created in three immune cell types. Each rule is composed of gene symbol and its expression level and describes how the expression level determines the class labels of samples.
References
1. Adil MT, Rahman R, Whitelaw D, Jain V, Al-Taan O, Rashid F, et al. SARS-CoV-2 and the pandemic of COVID-19. Postgraduate Med J (2021) 97:110–6. doi: 10.1136/postgradmedj-2020-138386
2. Song C, Li Z, Li C, Huang M, Liu J, Fang Q, et al. SARS-CoV-2: The monster causes COVID-19. Front Cell Infect Microbiol (2022) 12:835750. doi: 10.3389/fcimb.2022.835750
3. Kourouklis AP, Kaylan KB, Underhill GH. Substrate stiffness and matrix composition coordinately control the differentiation of liver progenitor cells. Biomaterials (2016) 99:82–94. doi: 10.1016/j.biomaterials.2016.05.016
4. Parasher A. COVID-19: Current understanding of its pathophysiology, clinical presentation and treatment. Postgraduate Med J (2021) 97:312–20. doi: 10.1136/postgradmedj-2020-138577
5. Fiolet T, Kherabi Y, Macdonald CJ, Ghosn J, Peiffer-Smadja N. Comparing COVID-19 vaccines for their characteristics, efficacy and effectiveness against SARS-CoV-2 and variants of concern: a narrative review. Clin Microbiol Infect (2022) 28:202–21. doi: 10.1016/j.cmi.2021.10.005
6. Lv J, Wu H, Xu J, Liu J. Immunogenicity and safety of heterologous versus homologous prime-boost schedules with an adenoviral vectored and mRNA COVID-19 vaccine: a systematic review. Infect Dis Poverty (2022) 11:53. doi: 10.1186/s40249-022-00977-x
7. Teo SP. Review of COVID-19 mRNA vaccines: BNT162b2 and mRNA-1273. J Pharm Pract (2022) 35:947–51. doi: 10.1177/08971900211009650
8. Hadj Hassine I. Covid-19 vaccines and variants of concern: A review. Rev Med Virol (2022) 32:e2313. doi: 10.1002/rmv.2313
9. Lee CS, Bishop ES, Zhang R, Yu X, Farina EM, Yan S, et al. Adenovirus-mediated gene delivery: Potential applications for gene and cell-based therapies in the new era of personalized medicine. Genes Dis (2017) 4:43–63. doi: 10.1016/j.gendis.2017.04.001
10. Chang A, Yu J. Fighting fire with fire: Immunogenicity of viral vectored vaccines against COVID-19. Viruses (2022) 14:380. doi: 10.3390/v14020380
11. Agrawal U, Katikireddi SV, Mccowan C, Mulholland RH, Azcoaga-Lorenzo A, Amele S, et al. COVID-19 hospital admissions and deaths after BNT162b2 and ChAdOx1 nCoV-19 vaccinations in 2.57 million people in Scotland (EAVE II): a prospective cohort study. Lancet Respir Med (2021) 9:1439–49. doi: 10.1016/S2213-2600(21)00380-5
12. Wei J, Pouwels KB, Stoesser N, Matthews PC, Diamond I, Studley R, et al. Antibody responses and correlates of protection in the general population after two doses of the ChAdOx1 or BNT162b2 vaccines. Nat Med (2022) 28:1072–82. doi: 10.1038/s41591-022-01721-6
13. Logunov DY, Dolzhikova IV, Shcheblyakov DV, Tukhvatulin AI, Zubkova OV, Dzharullaeva AS, et al. Safety and efficacy of an rAd26 and rAd5 vector-based heterologous prime-boost COVID-19 vaccine: an interim analysis of a randomised controlled phase 3 trial in Russia. Lancet (2021) 397:671–81. doi: 10.1016/S0140-6736(21)00234-8
14. Voysey M, Clemens S, Madhi SA, Weckx LY, Folegatti PM, Aley PK, et al. Safety and efficacy of the ChAdOx1 nCoV-19 vaccine (AZD1222) against SARS-CoV-2: an interim analysis of four randomised controlled trials in Brazil, south Africa, and the UK. Lancet (2021) 397:99–111. doi: 10.1016/S0140-6736(20)32661-1
15. Pozzetto B, Legros V, Djebali S, Barateau V, Guibert N, Villard M, et al. Immunogenicity and efficacy of heterologous ChAdOx1-BNT162b2 vaccination. Nature (2021) 600:701–6. doi: 10.1038/s41586-021-04120-y
16. Barros-Martins J, Hammerschmidt SI, Cossmann A, Odak I, Stankov MV, Morillas Ramos G, et al. Immune responses against SARS-CoV-2 variants after heterologous and homologous ChAdOx1 nCoV-19/BNT162b2 vaccination. Nat Med (2021) 27:1525–9. doi: 10.1038/s41591-021-01449-9
17. Stuart T, Satija R. Integrative single-cell analysis. Nat Rev Genet (2019) 20:257–72. doi: 10.1038/s41576-019-0093-7
18. Zhu L, Yang P, Zhao Y, Zhuang Z, Wang Z, Song R, et al. Single-cell sequencing of peripheral mononuclear cells reveals distinct immune response landscapes of COVID-19 and influenza patients. Immunity (2020) 53:685–96.e683. doi: 10.1016/j.immuni.2020.07.009
19. Cao Q, Wu S, Xiao C, Chen S, Chi X, Cui X, et al. Integrated single-cell analysis revealed immune dynamics during Ad5-nCoV immunization. Cell Discov (2021) 7:64. doi: 10.1038/s41421-021-00300-2
20. Tong R, Zhong J, Li R, Chen Y, Hu L, Li Z, et al. Characterizing cellular and molecular variabilities of peripheral immune cells in healthy inactivated SARS-CoV-2 vaccine recipients by single-cell RNA sequencing. medRxiv (2021). doi: 10.1101/2021.05.06.21256781
21. Sapkota B, Saud B, Shrestha R, Al-Fahad D, Sah R, Shrestha S, et al. Heterologous prime-boost strategies for COVID-19 vaccines. J Travel Med (2022) 29:taab191. doi: 10.1093/jtm/taab191
22. Crooke SN, Ovsyannikova IG, Poland GA, Kennedy RB. Immunosenescence and human vaccine immune responses. Immun Ageing (2019) 16:25. doi: 10.1186/s12979-019-0164-9
23. Dai Q, Bao C, Hai Y, Ma S, Zhou T, Wang C, et al. MTGIpick allows robust identification of genomic islands from a single genome. Briefings Bioinf (2016) 19:361–73. doi: 10.1093/bib/bbw118
24. Kong R, Xu X, Liu X, He P, Zhang MQ, Dai Q. 2SigFinder: the combined use of small-scale and large-scale statistical testing for genomic island detection from a single genome. BMC Bioinf (2020) 21:159. doi: 10.1186/s12859-020-3501-2
25. Yang S, Wang Y, Chen Y, Dai Q. MASQC: Next generation sequencing assists third generation sequencing for quality control in N6-methyladenine DNA identification. Front Genet (2020) 11:269. doi: 10.3389/fgene.2020.00269
26. Zhou J-P, Chen L, Guo Z-H. iATC-NRAKEL: An efficient multi-label classifier for recognizing anatomical therapeutic chemical classes of drugs. Bioinformatics (2020) 36:1391–6. doi: 10.1093/bioinformatics/btaa166
27. Zhou J-P, Chen L, Wang T, Liu M. iATC-FRAKEL: A simple multi-label web-server for recognizing anatomical therapeutic chemical classes of drugs with their fingerprints only. Bioinformatics (2020) 36:3568–9. doi: 10.1093/bioinformatics/btaa166
28. Yang Y, Chen L. Identification of drug–disease associations by using multiple drug and disease networks. Curr Bioinf (2022) 17:48–59. doi: 10.2174/2212392XMTE3kNDg22
29. Peng H, Long F, Ding C. Feature selection based on mutual information: criteria of max-dependency, max-relevance, and min-redundancy. IEEE Trans Pattern Anal Mach Intell (2005) 27:1226–38. doi: 10.1109/TPAMI.2005.159
30. Micha D, Rada-Iglesias A, Enroth S, Wadelius C, Koronacki J. Monte Carlo Feature selection for supervised classification. Bioinformatics (2008) 24:110–7. doi: 10.1093/bioinformatics/btm486
31. Tibshirani RJ. Regression shrinkage and selection via the LASSO. J Royal Stat Soc (1996) 58:267–88.
32. Ke G, Meng Q, Finley T, Wang T, Chen W, Ma W, et al. LightGBM: A highly efficient gradient boosting decision tree. In: 31st Conference on Neural Information Processing Systems (NIPS 2017), Long Beach, CA, USA. (2017)
33. Fisher A, Rudin C, Dominici F. All models are wrong, but many are useful: Learning a variable's importance by studying an entire class of prediction models simultaneously. J Mach Learn Res (2019) 20:1–81.
34. Liu HA, Setiono R. Incremental feature selection. Appl Intell (1998) 9:217–30. doi: 10.1023/A:1008363719778
35. Safavian SR, Landgrebe D. A survey of decision tree classifier methodology. IEEE Trans systems man cybernetics (1991) 21:660–74. doi: 10.1109/21.97458
37. Lee HK, Go J, Sung H, Kim SW, Walter M, Knabl L, et al. Heterologous ChAdOx1-BNT162b2 vaccination in Korean cohort induces robust immune and antibody responses that includes omicron. iScience (2022) 25:104473. doi: 10.1016/j.isci.2022.104473
38. Zhao X, Chen L, Lu J. A similarity-based method for prediction of drug side effects with heterogeneous information. Math Biosci (2018) 306:136–44. doi: 10.1016/j.mbs.2018.09.010
39. Huang F, Chen L, Guo W, Huang T, Cai YD. Identification of human cell cycle phase markers based on single-cell RNA-seq data by using machine learning methods. BioMed Res Int (2022) 2022:2516653. doi: 10.1155/2022/2516653
40. Chen X, Jin Y, Feng Y. Evaluation of plasma extracellular vesicle MicroRNA signatures for lung adenocarcinoma and granuloma with Monte-Carlo feature selection method. Front Genet (2019) 10:367. doi: 10.3389/fgene.2019.00367
41. Li J, Lu L, Zhang YH, Xu Y, Liu M, Feng K, et al. Identification of leukemia stem cell expression signatures through Monte Carlo feature selection strategy and support vector machine. Cancer Gene Ther (2020) 27:56–69. doi: 10.1038/s41417-019-0105-y
42. Pedregosa F, Varoquaux G, Gramfort A, Michel V, Thirion B, Grisel O, et al. Scikit-learn: Machine learning in Python. J Mach Learn Res (2011) 12:2825–30.
43. Chen L, Zeng T, Pan X, Zhang YH, Huang T, Cai YD. Identifying methylation pattern and genes associated with breast cancer subtypes. Int J Mol Sci (2019) 20:4269. doi: 10.3390/ijms20174269
44. Zhang YH, Li Z, Zeng T, Pan X, Chen L, Liu D, et al. Distinguishing glioblastoma subtypes by methylation signatures. Front Genet (2020) 11:604336. doi: 10.3389/fgene.2020.604336
45. Kohavi R. A study of cross-validation and bootstrap for accuracy estimation and model selection. In: Proceedings of the 14th international joint conference on artificial intelligence, vol. 2. . Montreal, Quebec, Canada: Morgan Kaufmann Publishers Inc (1995).
46. Chawla NV, Bowyer KW, Hall LO, Kegelmeyer WP. SMOTE: Synthetic minority over-sampling technique. J Artif Intell Res (2002) 16:321–57. doi: 10.1613/jair.953
47. Ren J, Zhou X, Guo W, Feng K, Huang T, Vcai Y-D. Identification of methylation signatures and rules for sarcoma subtypes by machine learning methods. BioMed Res Int (2022) 2022:5297235. doi: 10.1155/2022/5297235
48. Huang F, Ma Q, Ren J, Li J, Wang F, Huang T, et al. Identification of smoking associated transcriptome aberration in blood with machine learning methods. BioMed Res Int (2023) 2023:5333361. doi: 10.1155/2023/5333361
49. Zhu L, Yang X, Zhu R, Yu L. Identifying discriminative biological function features and rules for cancer-related long non-coding RNAs. Front Genet (2020) 11:598773. doi: 10.3389/fgene.2020.598773
50. Onesime M, Yang Z, Dai Q. Genomic island prediction via chi-square test and random forest algorithm. Comput Math Methods Med (2021) 2021:9969751. doi: 10.1155/2021/9969751
51. Zhang YH, Zeng T, Chen L, Huang T, Cai YD. Determining protein-protein functional associations by functional rules based on gene ontology and KEGG pathway. Biochim Biophys Acta Proteins Proteom (2021) 1869:140621. doi: 10.1016/j.bbapap.2021.140621
52. Ran B, Chen L, Li M, Han Y, Dai Q. Drug-drug interactions prediction using fingerprint only. Comput Math Methods Med (2022) 2022:7818480. doi: 10.1155/2022/7818480
53. Tang S, Chen L. iATC-NFMLP: Identifying classes of anatomical therapeutic chemicals based on drug networks, fingerprints and multilayer perceptron. Curr Bioinf (2022) 17:814–24. doi: 10.2174/1574893617666220318093000
54. Wang H, Chen L. PMPTCE-HNEA: Predicting metabolic pathway types of chemicals and enzymes with a heterogeneous network embedding algorithm. Curr Bioinf (2023).
55. Wu C, Chen L. A model with deep analysis on a large drug network for drug classification. Math Biosci Eng (2023) 20:383–401. doi: 10.3934/mbe.2023018
56. Gorodkin J. Comparing two K-category assignments by a K-category correlation coefficient. Comput Biol Chem (2004) 28:367–74. doi: 10.1016/j.compbiolchem.2004.09.006
57. Rodriguez R, Matsuda M, Perisic O, Bravo J, Paul A, Jones NP, et al. Tyrosine residues in phospholipase cgamma 2 essential for the enzyme function in b-cell signaling. J Biol Chem (2001) 276:47982–92. doi: 10.1074/jbc.M107577200
58. Kim YJ, Sekiya F, Poulin B, Bae YS, Rhee SG. Mechanism of b-cell receptor-induced phosphorylation and activation of phospholipase c-gamma2. Mol Cell Biol (2004) 24:9986–99. doi: 10.1128/MCB.24.22.9986-9999.2004
59. Bernal-Quirós M, Wu Y-Y, Alarcón-Riquelme ME, Castillejo-López C. BANK1 and BLK act through phospholipase c gamma 2 in b-cell signaling. PloS One (2013) 8:e59842. doi: 10.1371/journal.pone.0059842
60. Novice T, Kariminia A, Del Bel KL, Lu H, Sharma M, Lim CJ, et al. A germline mutation in the C2 domain of PLCgamma2 associated with gain-of-Function expands the phenotype for PLCG2-related diseases. J Clin Immunol (2020) 40:267–76. doi: 10.1007/s10875-019-00731-3
61. Mirzoyev SA, Davis MD. Brachioradial pruritus: Mayo clinic experience over the past decade. Br J Dermatol (2013) 169:1007–15. doi: 10.1111/bjd.12483
62. Van Der Lee SJ, Conway OJ, Jansen I, Carrasquillo MM, Kleineidam L, Van Den Akker E, et al. A nonsynonymous mutation in PLCG2 reduces the risk of alzheimer's disease, dementia with lewy bodies and frontotemporal dementia, and increases the likelihood of longevity. Acta Neuropathol (2019) 138:237–50. doi: 10.1007/s00401-019-02026-8
63. Reindl-Schwaighofer R, Heinzel A, Mayrdorfer M, Jabbour R, Hofbauer TM, Merrelaar A, et al. Comparison of SARS-CoV-2 antibody response 4 weeks after homologous vs heterologous third vaccine dose in kidney transplant recipients: A randomized clinical trial. JAMA Intern Med (2022) 182:165–71. doi: 10.1001/jamainternmed.2021.7372
64. Pulvirenti F, Di Cecca S, Sinibaldi M, Piano Mortari E, Terreri S, Albano C, et al. T-Cell defects associated to lack of spike-specific antibodies after BNT162b2 full immunization followed by a booster dose in patients with common variable immune deficiencies. Cells (2022) 11:1918. doi: 10.3390/cells11121918
65. Gaudet P, Livstone MS, Lewis SE, Thomas PD. Phylogenetic-based propagation of functional annotations within the gene ontology consortium. Brief Bioinform (2011) 12:449–62. doi: 10.1093/bib/bbr042
66. Kvedaraite E, Hertwig L, Sinha I, Ponzetta A, Hed Myrberg I, Lourda M, et al. Major alterations in the mononuclear phagocyte landscape associated with COVID-19 severity. Proc Natl Acad Sci USA (2021) 118:e2018587118. doi: 10.1073/pnas.2018587118
67. Policard M, Jain S, Rego S, Dakshanamurthy S. Immune characterization and profiles of SARS-CoV-2 infected patients reveals potential host therapeutic targets and SARS-CoV-2 oncogenesis mechanism. Virus Res (2021) 301:198464. doi: 10.1016/j.virusres.2021.198464
68. Saichi M, Ladjemi MZ, Korniotis S, Rousseau C, Ait Hamou Z, Massenet-Regad L, et al. Single-cell RNA sequencing of blood antigen-presenting cells in severe COVID-19 reveals multi-process defects in antiviral immunity. Nat Cell Biol (2021) 23:538–51. doi: 10.1038/s41556-021-00681-2
69. Kudryavtsev I, Rubinstein A, Golovkin A, Kalinina O, Vasilyev K, Rudenko L, et al. Dysregulated immune responses in SARS-CoV-2-Infected patients: A comprehensive overview. Viruses (2022) 14:1082. doi: 10.3390/v14051082
70. Zong S, Wu M, Gu J, Liu T, Guo R, Yang M. Structure of the intact 14-subunit human cytochrome c oxidase. Cell Res (2018) 28:1026–34. doi: 10.1038/s41422-018-0071-1
71. Anand SK, Tikoo SK. Viruses as modulators of mitochondrial functions. Adv Virol (2013) 2013:738794. doi: 10.1155/2013/738794
72. Ashton-Rickardt PG. Mitochondria apply the brake to viral immunity. Cell Metab (2016) 23:967–8. doi: 10.1016/j.cmet.2016.05.018
73. Weinberg SE, Sena LA, Chandel NS. Mitochondria in the regulation of innate and adaptive immunity. Immunity (2015) 42:406–17. doi: 10.1016/j.immuni.2015.02.002
74. Garaude J, Acin-Perez R, Martinez-Cano S, Enamorado M, Ugolini M, Nistal-Villan E, et al. Mitochondrial respiratory-chain adaptations in macrophages contribute to antibacterial host defense. Nat Immunol (2016) 17:1037–45. doi: 10.1038/ni.3509
75. Chilunda V, Martinez-Aguado P, Xia LC, Cheney L, Murphy A, Veksler V, et al. Transcriptional changes in CD16+ monocytes may contribute to the pathogenesis of COVID-19. Front Immunol (2021) 12:665773. doi: 10.3389/fimmu.2021.665773
76. Garg M, Li X, Moreno P, Papatheodorou I, Shu Y, Brazma A, et al. Meta-analysis reveals consistent immune response patterns in COVID-19 infected patients at single-cell resolution. bioRxiv (2021). doi: 10.1101/2021.01.24.427089
77. Duan F, Guo L, Yang L, Han Y, Thakur A, Nilsson-Payant BE, et al. Modeling COVID-19 with human pluripotent stem cell-derived cells reveals synergistic effects of anti-inflammatory macrophages with ACE2 inhibition against SARS-CoV-2. Res Sq (2020), rs.3.rs–62758. doi: 10.21203/rs.3.rs-62758/v1
78. Duan C, Ma R, Zeng X, Chen B, Hou D, Liu R, et al. SARS-CoV-2 achieves immune escape by destroying mitochondrial quality: Comprehensive analysis of the cellular landscapes of lung and blood specimens from patients with COVID-19. Front Immunol (2022) 13:946731. doi: 10.3389/fimmu.2022.946731
79. Adamo S, Michler J, Zurbuchen Y, Cervia C, Taeschler P, Raeber ME, et al. Signature of long-lived memory CD8(+) T cells in acute SARS-CoV-2 infection. Nature (2022) 602:148–55. doi: 10.1038/s41586-021-04280-x
80. Odintsova TI, Muller EC, Ivanov AV, Egorov TA, Bienert R, Vladimirov SN, et al. Characterization and analysis of posttranslational modifications of the human large cytoplasmic ribosomal subunit proteins by mass spectrometry and edman sequencing. J Protein Chem (2003) 22:249–58. doi: 10.1023/A:1025068419698
81. Zanni G, Kalscheuer VM, Friedrich A, Barresi S, Alfieri P, Di Capua M, et al. A novel mutation in RPL10 (Ribosomal protein L10) causes X-linked intellectual disability, cerebellar hypoplasia, and spondylo-epiphyseal dysplasia. Hum Mutat (2015) 36:1155–8. doi: 10.1002/humu.22860
82. Fahl SP, Sertori R, Zhang Y, Contreras AV, Harris B, Wang M, et al. Loss of ribosomal protein paralog Rpl22-like1 blocks lymphoid development without affecting protein synthesis. J Immunol (2022) 208:870–80. doi: 10.4049/jimmunol.2100668
83. Chang JJ, Gleeson J, Rawlinson D, De Paoli-Iseppi R, Zhou C, Mordant FL, et al. Long-read RNA sequencing identifies polyadenylation elongation and differential transcript usage of host transcripts during SARS-CoV-2 In vitro infection. Front Immunol (2022) 13:832223. doi: 10.3389/fimmu.2022.832223
84. Alexander MR, Brice AM, Jansen Van Vuren P, Rootes CL, Tribolet L, Cowled C, et al. Ribosome-profiling reveals restricted post transcriptional expression of antiviral cytokines and transcription factors during SARS-CoV-2 infection. Int J Mol Sci (2021) 22:3392. doi: 10.3390/ijms22073392
85. Thomas SJ, Moreira ED Jr., Kitchin N, Absalon J, Gurtman A, Lockhart S, et al. Safety and efficacy of the BNT162b2 mRNA covid-19 vaccine through 6 months. N Engl J Med (2021) 385:1761–73. doi: 10.1056/NEJMoa2110345
86. Paran Y, Saiag E, Spitzer A, Angel Y, Yakubovsky M, Padova H, et al. Short-term safety of booster immunization with BNT162b2 mRNA COVID-19 vaccine in healthcare workers. Open Forum Infect Dis (2022) 9:ofab656. doi: 10.1093/ofid/ofab656
87. Wang W, Balfe P, Eyre DW, Lumley SF, O'donnell D, Warren F, et al. Time of day of vaccination affects SARS-CoV-2 antibody responses in an observational study of health care workers. J Biol Rhythms (2022) 37:124–9. doi: 10.1177/07487304211059315
88. Salazar-Gonzalez JF, Martinez-Maza O, Nishanian P, Aziz N, Shen LP, Grosser S, et al. Increased immune activation precedes the inflection point of CD4 T cells and the increased serum virus load in human immunodeficiency virus infection. J Infect Dis (1998) 178:423–30. doi: 10.1086/515629
89. Mohammed Y, Goodlett DR, Cheng MP, Vinh DC, Lee TC, Mcgeer A, et al. Longitudinal plasma proteomics analysis reveals novel candidate biomarkers in acute COVID-19. J Proteome Res (2022) 21:975–92. doi: 10.1021/acs.jproteome.1c00863
91. Zou M, Su X, Wang L, Yi X, Qiu Y, Yin X, et al. The molecular mechanism of multiple organ dysfunction and targeted intervention of COVID-19 based on time-order transcriptomic analysis. Front Immunol (2021) 12:729776. doi: 10.3389/fimmu.2021.729776
92. Ashino Y, Chagan-Yasutan H, Hatta M, Shirato Y, Kyogoku Y, Komuro H, et al. Successful treatment of a COVID-19 case with pneumonia and renal injury using tocilizumab. Reports (2020) 3:29. doi: 10.3390/reports3040029
93. Al-Mustanjid M, Mahmud SMH, Akter F, Rahman MS, Hossen MS, Rahman MH, et al. Systems biology models to identify the influence of SARS-CoV-2 infections to the progression of human autoimmune diseases. Inform Med Unlocked (2022) 32:101003. doi: 10.1016/j.imu.2022.101003
94. Sonawane AR, Tian L, Chu CY, Qiu X, Wang L, Holden-Wiltse J, et al. Microbiome-transcriptome interactions related to severity of respiratory syncytial virus infection. Sci Rep (2019) 9:13824. doi: 10.1038/s41598-019-50217-w
95. Oh C, De Zoysa M, Nikapitiya C, Whang I, Kim YC, Kang DH, et al. Tumor suppressor QM-like gene from disk abalone (Haliotis discus discus): molecular characterization and transcriptional analysis upon immune challenge. Fish Shellfish Immunol (2010) 29:494–500. doi: 10.1016/j.fsi.2010.05.007
96. Zorzatto C, Machado JP, Lopes KV, Nascimento KJ, Pereira WA, Brustolini OJ, et al. NIK1-mediated translation suppression functions as a plant antiviral immunity mechanism. Nature (2015) 520:679–82. doi: 10.1038/nature14171
97. Ramu VS, Dawane A, Lee S, Oh S, Lee HK, Sun L, et al. Ribosomal protein QM/RPL10 positively regulates defence and protein translation mechanisms during nonhost disease resistance. Mol Plant Pathol (2020) 21:1481–94. doi: 10.1111/mpp.12991
98. Wan F, Anderson DE, Barnitz RA, Snow A, Bidere N, Zheng L, et al. Ribosomal protein S3: a KH domain subunit in NF-kappaB complexes that mediates selective gene regulation. Cell (2007) 131:927–39. doi: 10.1016/j.cell.2007.10.009
99. Li C, Kan A, Zeng X. Bioinformatics analysis in different expression genes and potential pathways of CD4+ cells in childhood allergic asthma. Res Square (2021). doi: 10.21203/rs.3.rs-189597/v1
100. Wan F, Lenardo MJ. Specification of DNA binding activity of NF-kappaB proteins. Cold Spring Harb Perspect Biol (2009) 1:a000067. doi: 10.1101/cshperspect.a000067
101. Anger AM, Armache JP, Berninghausen O, Habeck M, Subklewe M, Wilson DN, et al. Structures of the human and drosophila 80S ribosome. Nature (2013) 497:80–5. doi: 10.1038/nature12104
102. Wang JY, Zhang W, Roehrl MW, Roehrl VB, Roehrl MH. An autoantigen profile of human A549 lung cells reveals viral and host etiologic molecular attributes of autoimmunity in COVID-19. J Autoimmun (2021) 120:102644. doi: 10.1016/j.jaut.2021.102644
103. Mermod N, Williams TJ, Tjian R. Enhancer binding factors AP-4 and AP-1 act in concert to activate SV40 late transcription in vitro. Nature (1988) 332:557–61. doi: 10.1038/332557a0
104. Bartolini D, Stabile AM, Vacca C, Pistilli A, Rende M, Gioiello A, et al. Endoplasmic reticulum stress and NF-kB activation in SARS-CoV-2 infected cells and their response to antiviral therapy. IUBMB Life (2022) 74:93–100. doi: 10.1002/iub.2537
105. Alshabi AM, Shaikh IA, Vastrad BM, Vastrad CM. Identification of differentially expressed genes and enriched pathways in SARS-CoV-2/ COVID-19 using bioinformatics analysis. Res Square (2020). doi: 10.21203/rs.3.rs-122015/v1
106. Huang K, Wang C, Vagts C, Raguveer V, Finn PW, Perkins DL. Long non-coding RNAs (lncRNAs) NEAT1 and MALAT1 are differentially expressed in severe COVID-19 patients: An integrated single cell analysis. PLos One (2022) 17:e0261242. doi: 10.1371/journal.pone.0261242
107. Alarabi AB, Mohsen A, Mizuguchi K, Alshbool FZ, Khasawneh FT. Co-Expression analysis to identify key modules and hub genes associated with COVID-19 in platelets. BMC Med Genomics (2022) 15:83. doi: 10.1186/s12920-022-01222-y
108. Balik i İ ek İ., Kaya DMO, olak C. Assessment of COVID-19-Related genes through associative classification techniques. Konuralp Med J (2022) 14:1–8. doi: 10.18521/ktd.958555
109. Chan J, Quintanal-Villalonga A, Gao V, Xie Y, Allaj V, Chaudhary O, et al. OA07.01 signatures of plasticity and immunosuppression in a single-cell atlas of human small cell lung cancer. J Thorac Oncol (2021) 16:S858. doi: 10.1016/j.jtho.2021.08.054
110. Li Z, Zhao R, Yang W, Li C, Huang J, Wen Z, et al. PLCG2 as a potential indicator of tumor microenvironment remodeling in soft tissue sarcoma. Med (Baltimore) (2021) 100:e25008. doi: 10.1097/MD.0000000000025008
111. Yu Y, Ji H, Doudna JA, Leary JA. Mass spectrometric analysis of the human 40S ribosomal subunit: native and HCV IRES-bound complexes. Protein Sci (2005) 14:1438–46. doi: 10.1110/ps.041293005
112. Behrmann E, Loerke J, Budkevich TV, Yamamoto K, Schmidt A, Penczek PA, et al. Structural snapshots of actively translating human ribosomes. Cell (2015) 161:845–57. doi: 10.1016/j.cell.2015.03.052
113. Feng P, Li Y, Tian Z, Qian Y, Miao X, Zhang Y. Analysis of gene Co-expression network to identify the role of CD8 + T cell infiltration-related biomarkers in high-grade glioma. Int J Gen Med (2022) 15:1879–90. doi: 10.2147/IJGM.S348470
114. Vastrad B, Vastrad C, Tengli A. Bioinformatics analyses of significant genes, related pathways, and candidate diagnostic biomarkers and molecular targets in SARS-CoV-2/COVID-19. Gene Rep (2020) 21:100956. doi: 10.1016/j.genrep.2020.100956
115. Syrett CM, Paneru B, Sandoval-Heglund D, Wang J, Banerjee S, Sindhava V, et al. Altered X-chromosome inactivation in T cells may promote sex-biased autoimmune diseases. JCI Insight (2019) 4:e126751. doi: 10.1172/jci.insight.126751
116. Cheng Q, Xu J, Chen M, Chen X, Zhang P, Wu H, et al. LncRNA XIST alters the balance of peripheral blood immune cells in systemic lupus erythematosus by regulating the miR-17-92, OFLM4 and CEACAM8 axis. Res Square (2021). doi: 10.21203/rs.3.rs-621553/v1
117. She C, Yang Y, Zang B, Yao Y, Liu Q, Leung PSC, et al. Effect of LncRNA XIST on immune cells of primary biliary cholangitis. Front Immunol (2022) 13:816433. doi: 10.3389/fimmu.2022.816433
118. Du C, Xie H, Zang R, Shen Z, Li H, Chen P, et al. Apoptotic neuron-secreted HN12 inhibits cell apoptosis in hirschsprung's disease. Int J Nanomedicine (2016) 11:5871–81. doi: 10.2147/IJN.S114838
119. Liu X, Shaw RH, Stuart ASV, Greenland M, Aley PK, Andrews NJ, et al. Safety and immunogenicity of heterologous versus homologous prime-boost schedules with an adenoviral vectored and mRNA COVID-19 vaccine (Com-COV): a single-blind, randomised, non-inferiority trial. Lancet (2021) 398:856–69. doi: 10.1016/S0140-6736(21)01694-9
120. Gross R, Zanoni M, Seidel A, Conzelmann C, Gilg A, Krnavek D, et al. Heterologous ChAdOx1 nCoV-19 and BNT162b2 prime-boost vaccination elicits potent neutralizing antibody responses and T cell reactivity against prevalent SARS-CoV-2 variants. EBioMedicine (2022) 75:103761. doi: 10.1016/j.ebiom.2021.103761
121. Kashuba E, Yurchenko M, Szirak K, Stahl J, Klein G, Szekely L. Epstein-Barr Virus-encoded EBNA-5 binds to Epstein-Barr virus-induced Fte1/S3a protein. Exp Cell Res (2005) 303:47–55. doi: 10.1016/j.yexcr.2004.08.025
122. Naora H. Involvement of ribosomal proteins in regulating cell growth and apoptosis: translational modulation or recruitment for extraribosomal activity? Immunol Cell Biol (1999) 77:197–205. doi: 10.1046/j.1440-1711.1999.00816.x
123. Zhou C, Weng J, Liu C, Zhou Q, Chen W, Hsu JL, et al. High RPS3A expression correlates with low tumor immune cell infiltration and unfavorable prognosis in hepatocellular carcinoma patients. Am J Cancer Res (2020) 10:2768–84.
124. Westrop SJ, Whitaker HJ, Powell AA, Power L, Whillock C, Campbell H, et al. Real-world data on immune responses following heterologous prime-boost COVID-19 vaccination schedule with pfizer and AstraZeneca vaccines in England. J Infect (2022) 84:692–700. doi: 10.1016/j.jinf.2022.01.038
125. Faas MM, De Vos P. Mitochondrial function in immune cells in health and disease. Biochim Biophys Acta Mol Basis Dis (2020) 1866:165845. doi: 10.1016/j.bbadis.2020.165845
126. Carlberg C, Velleuer E. B cell immunity: BCRs, antibodies and their effector functions. Cham: Springer International Publishing (2022).
127. Hulme WJ, Williamson EJ, Green ACA, Bhaskaran K, Mcdonald HI, Rentsch CT, Sterne J.a.C, et al. Comparative effectiveness of ChAdOx1 versus BNT162b2 covid-19 vaccines in health and social care workers in England: cohort study using OpenSAFELY. BMJ (2022) 378:e068946. doi: 10.1136/bmj-2021-068946
128. Benning L, Töllner M, Hidmark A, Schaier M, Nusshag C, Kälble F, et al. Heterologous ChAdOx1 nCoV-19/BNT162b2 prime-boost vaccination induces strong humoral responses among health care workers. Vaccines (2021) 9:857. doi: 10.3390/vaccines9080857
129. Schmidt T, Klemis V, Schub D, Mihm J, Hielscher F, Marx S, et al. Immunogenicity and reactogenicity of heterologous ChAdOx1 nCoV-19/mRNA vaccination. Nat Med (2021) 27:1530–5. doi: 10.1038/s41591-021-01464-w
130. Muri J, Thut H, Kopf M. The thioredoxin-1 inhibitor txnip restrains effector T-cell and germinal center b-cell expansion. Eur J Immunol (2021) 51:115–24. doi: 10.1002/eji.202048851
131. Chen C, Peng J, Ma S, Ding Y, Huang T, Zhao S, et al. Ribosomal protein S26 serves as a checkpoint of T-cell survival and homeostasis in a p53-dependent manner. Cell Mol Immunol (2021) 18:1844–6. doi: 10.1038/s41423-021-00699-4
132. Gao M, Nakajima An D, Parks JM, Skolnick J. AF2Complex predicts direct physical interactions in multimeric proteins with deep learning. Nat Commun (2022) 13:1744. doi: 10.1038/s41467-022-29394-2
133. Fabricius D, Ludwig C, Scholz J, Rode I, Tsamadou C, Jacobsen EM, et al. mRNA vaccines enhance neutralizing immunity against SARS-CoV-2 variants in convalescent and ChAdOx1-primed subjects. Vaccines (Basel) (2021) 9:918. doi: 10.3390/vaccines9080918
134. Tenbusch M, Schumacher S, Vogel E, Priller A, Held J, Steininger P, et al. Heterologous prime-boost vaccination with ChAdOx1 nCoV-19 and BNT162b2. Lancet Infect Dis (2021) 21:1212–3. doi: 10.1016/S1473-3099(21)00420-5
135. Wu H, Dong J, Yu H, Wang K, Dai W, Zhang X, et al. Single-cell RNA and ATAC sequencing reveal hemodialysis-related immune dysregulation of circulating immune cell subpopulations. Front Immunol (2022) 13:878226. doi: 10.3389/fimmu.2022.878226
136. Li C, Lee A, Grigoryan L, Arunachalam PS, Scott MKD, Trisal M, et al. Mechanisms of innate and adaptive immunity to the pfizer-BioNTech BNT162b2 vaccine. Nat Immunol (2022) 23:543–55. doi: 10.1038/s41590-022-01163-9
137. Hillus D, Schwarz T, Tober-Lau P, Vanshylla K, Hastor H, Thibeault C, et al. Safety, reactogenicity, and immunogenicity of homologous and heterologous prime-boost immunisation with ChAdOx1 nCoV-19 and BNT162b2: A prospective cohort study. Lancet Respir Med (2021) 9:1255–65. doi: 10.1016/S2213-2600(21)00357-X
138. Schmitz JE, Kuroda MJ, Santra S, Sasseville VG, Simon MA, Lifton MA, et al. Control of viremia in simian immunodeficiency virus infection by CD8+ lymphocytes. Science (1999) 283:857–60. doi: 10.1126/science.283.5403.857
139. Thuong PH, Tam DB, Sakurada S, Hang NT, Hijikata M, Hong LT, et al. Circulating granulysin levels in healthcare workers and latent tuberculosis infection estimated using interferon-gamma release assays. BMC Infect Dis (2016) 16:580. doi: 10.1186/s12879-016-1911-6
Keywords: ChAdOx1-BNT162b2 vaccine, immune, lymphocyte, machine learning, scRNA-seq profile
Citation: Li J, Huang F, Ma Q, Guo W, Feng K, Huang T and Cai Y-D (2023) Identification of genes related to immune enhancement caused by heterologous ChAdOx1–BNT162b2 vaccines in lymphocytes at single-cell resolution with machine learning methods. Front. Immunol. 14:1131051. doi: 10.3389/fimmu.2023.1131051
Received: 30 December 2022; Accepted: 13 February 2023;
Published: 02 March 2023.
Edited by:
P. Bernard Fourie, University of Pretoria, South AfricaCopyright © 2023 Li, Huang, Ma, Guo, Feng, Huang and Cai. This is an open-access article distributed under the terms of the Creative Commons Attribution License (CC BY). The use, distribution or reproduction in other forums is permitted, provided the original author(s) and the copyright owner(s) are credited and that the original publication in this journal is cited, in accordance with accepted academic practice. No use, distribution or reproduction is permitted which does not comply with these terms.
*Correspondence: Tao Huang, dG9odWFuZ3Rhb0AxMjYuY29t; Yu-Dong Cai, Y2FpX3l1ZEAxMjYuY29t
†These authors have contributed equally to this work