
95% of researchers rate our articles as excellent or good
Learn more about the work of our research integrity team to safeguard the quality of each article we publish.
Find out more
ORIGINAL RESEARCH article
Front. Immunol. , 22 March 2023
Sec. Autoimmune and Autoinflammatory Disorders : Autoimmune Disorders
Volume 14 - 2023 | https://doi.org/10.3389/fimmu.2023.1130735
This article is part of the Research Topic Microglia in Neuroinflammation View all 9 articles
 Kaira A. Church1,2
 Derek Rodriguez1,2
 Andrew S. Mendiola1,2†Difernando Vanegas1,2
 Irene L. Gutierrez1,3Ian Tamayo1Abdul Amadu1Priscila Velazquez1
 Sandra M. Cardona1,2Stefka Gyoneva4,5Anne C. Cotleur5
 Richard M. Ransohoff5,6,7†
 Tejbeer Kaur8
 Astrid E. Cardona1,2*
Diabetic retinopathy, a microvascular disease characterized by irreparable vascular damage, neurodegeneration and neuroinflammation, is a leading complication of diabetes mellitus. There is no cure for DR, and medical interventions marginally slow the progression of disease. Microglia-mediated inflammation in the diabetic retina is regulated via CX3CR1-FKN signaling, where FKN serves as a calming signal for microglial activation in several neuroinflammatory models. Polymorphic variants of CX3CR1, hCX3CR1I249/M280, found in 25% of the human population, result in a receptor with lower binding affinity for FKN. Furthermore, disrupted CX3CR1-FKN signaling in CX3CR1-KO and FKN-KO mice leads to exacerbated microglial activation, robust neuronal cell loss and substantial vascular damage in the diabetic retina. Thus, studies to characterize the effects of hCX3CR1I249/M280-expression in microglia-mediated inflammation in the diseased retina are relevant to identify mechanisms by which microglia contribute to disease progression. Our results show that hCX3CR1I249/M280 mice are significantly more susceptible to microgliosis and production of Cxcl10 and TNFα under acute inflammatory conditions. Inflammation is exacerbated under diabetic conditions and coincides with robust neuronal loss in comparison to CX3CR1-WT mice. Therefore, to further investigate the role of hCX3CR1I249/M280-expression in microglial responses, we pharmacologically depleted microglia using PLX-5622, a CSF-1R antagonist. PLX-5622 treatment led to a robust (~70%) reduction in Iba1+ microglia in all non-diabetic and diabetic mice. CSF-1R antagonism in diabetic CX3CR1-WT prevented TUJ1+ axonal loss, angiogenesis and fibrinogen deposition. In contrast, PLX-5622 microglia depletion in CX3CR1-KO and hCX3CR1I249/M280 mice did not alleviate TUJ1+ axonal loss or angiogenesis. Interestingly, PLX-5622 treatment reduced fibrinogen deposition in CX3CR1-KO mice but not in hCX3CR1I249/M280 mice, suggesting that hCX3CR1I249/M280 expressing microglia influences vascular pathology differently compared to CX3CR1-KO microglia. Currently CX3CR1-KO mice are the most commonly used strain to investigate CX3CR1-FKN signaling effects on microglia-mediated inflammation and the results in this study indicate that hCX3CR1I249/M280 receptor variants may serve as a complementary model to study dysregulated CX3CR1-FKN signaling. In summary, the protective effects of microglia depletion is CX3CR1-dependent as microglia depletion in CX3CR1-KO and hCX3CR1I249/M280 mice did not alleviate retinal degeneration nor microglial morphological activation as observed in CX3CR1-WT mice.
Diabetic retinopathy (DR), an incurable eye disease caused by prolonged high glucose levels is a leading complication of diabetes mellitus and a common cause of blindness amongst working age adults (1). DR has been defined as a microvascular disease characterized by microaneurysms, intraretinal hemorrhaging, deposition of hard and soft exudates and abnormal angiogenesis (2). However, DR is also a neurodegenerative and neuroinflammatory disorder. Retinal ischemia leads to the development of cotton wool spots, stemming from the axoplasmic material of degenerating retinal ganglion cells (3). Microglia, the resident macrophages of the CNS, mediate a myriad of cellular functions in the retina, including synaptic pruning and wiring, surveillance and phagocytosis, and maintenance of neuroretinal homeostasis (4, 5). Microglia rapidly respond and become activated due to hyperglycemia and fluctuations in vascular vasoregulation (4, 6). More specifically, microglial contact with capillaries and pericytes is associated with reduced retinal blood flow in the early diabetic murine retina (6). In addition to inducing vascular abnormalities, microglia produce proinflammatory mediators including IL-1β, IL-6, TNF-α, vascular endothelial growth factor (VEGF) and reactive oxygen species (ROS) (7), and respond to circulating blood factors such as fibrin(ogen) (8–11). However, the exact mechanisms that initiate and regulate tissue damage in DR remain poorly understood.
CX3CR1, a receptor constitutively expressed by microglia in the CNS, and its ligand, fractalkine (FKN), a chemokine expressed uniquely in neurons, mitigates microglia mediated inflammation, often but not always tempering the severity of the reaction (12–16). A polymorphic variant of the CX3CR1 gene encodes a protein with amino acid substitutions at residues 249 (valine substituted for isoleucine) and 280 (threonine substituted for methionine), hCX3CR1I249/M280, in ~25% of the population and produces an adhesive-defective receptor with decreased binding affinity for FKN (17, 18). In the diabetic murine retina, genetic and pharmacological inhibition of CX3CR1-FKN signaling inhibited diabetes associated vaso-constriction (6). In murine models of DR, absence of FKN or its receptor CX3CR1, lead to robust microglial activation, elevated release of pro-inflammatory mediators-IL-1β and TNF-α, and decreased production of anti-inflammatory cytokines IL-10 and IL-13, and enhanced vascular and neuronal damage (14, 19). Intravitreal delivery of recombinant soluble FKN decreased perivascular microglial clustering and retinal fibrinogen deposition in FKN-KO mice (19). In animal models of multiple sclerosis, mice expressing hCX3CR1I249/M280 developed more severe clinical signs of experimental autoimmune encephalomyelitis (EAE) associated with increased cerebellar neuronal cell loss and demyelination (20). In the cuprizone-induced model of demyelination, CX3CR1-KO, FKN-KO, and hCX3CR1I249/M280 expressing mice displayed delayed remyelination and decreased mature oligodendrocyte differentiation (21). Transcriptional analysis of hCX3CR1I249/M280 expressing mice revealed enhanced gene expression patterns associated with inflammatory responses, production of reactive oxygen species and microglial activation under conditions of demyelination and neurodegeneration (20, 21). It is still uncertain how CX3CR1-variants affect disease development in DR.
Microglial depletion models are used to interrogate the role of microglia-mediated inflammation in disease initiation and progression (22–25). Utilizing the genetic model, CX3CR1CreER:R26iDTR, in which microglia become susceptible to the effects of diphtheria toxin (DTx), we recently showed that depletion and repopulation of microglia correlated with decreased neuronal cell loss and vascular damage in the diabetic retina (26). We also reported changes in the retinal transcriptome with reduced expression of complement-associated synaptic pruning and microglial activation genes (26). The CX3CR1-FKN signaling axis has also been shown to regulate microglial repopulation following ablation in CNS tissues, and delayed microglial repopulation is associated with lower CX3CR1 expression (27, 28). Collectively these findings underscore the relevance of the CX3CR1-FKN signaling axis in regulating microglia-mediated inflammation.
To better understand the role of CX3CR1-variants in microglia-mediated inflammation, we utilized LPS-induced low-level endotoxemia and STZ-induced diabetes, as a two-hit model of diabetes and systemic inflammation. LPS was used to mimic the systemic pro-inflammatory environment common in diabetic patients as a result of persistent infections (29). This study aimed to determine how closely hCX3CR1I249/M280 mice mirror the previously reported phenotype of CX3CR1-KO mice, showing enhanced microgliosis, and increased neuronal loss and vascular damage (14, 19). Moreover, we asked whether depletion of CX3CR1-WT, CX3CR1-KO or hCX3CR1I249/M280 microglia via PLX-5622 confers the same retinal phenotype in diabetic mice. Our results show that low-level endotoxemia in hCX3CR1I249/M280 mice increased microglial densities, angiogenesis and microglia perivascular clustering. Low-level endotoxemia significantly increased the expression of Cxcl10 and TNF-α in hCX3CR1I249/M280 mice in comparison to CX3CR1-WT mice. Diabetic CX3CR1-KO and hCX3CR1I249/M280 retinas revealed decreased TUJ1+ axonal immunoreactivity in comparison to CX3CR1-WT mice. PLX-5622 treatment led to ~70% reduction in Iba1+ microglia in all non-diabetic and diabetic groups. PLX-5622 microglia depletion in CX3CR1-WT mice correlated with prevention of TUJ1+ axonal loss, and ameliorated vascular damage and fibrinogen deposition in the diabetic retina. However, PLX-5622 treatment in CX3CR1-KO and hCX3CR1I249/M280 mice did not prevent TUJ1+ axonal loss, nor abnormal angiogenesis in the diabetic retina. Together these results highlight that the neuro- and vasculo-protective effects of microglia depletion in the diabetic retina is CX3CR1-dependent.
All experiments used male mice as female mice do not develop consistent hyperglycemic levels in response to STZ due to the antidiabetic actions elicited by 17β-estradiol (14, 30, 31). Male mice were 6-8 weeks of age at the time of STZ-induced diabetes, as STZ treatment in older rodents has been shown to lead to a high mortality rate (32). CXC3R1-WT (JAX stock number: 000664; RRID : IMSR_JAX:000664) and CX3CR1-KO (JAX stock number: 005582; RRID : IMSR_JAX:005582) mice were purchased from The Jackson Laboratory. Mice expressing the human CX3CR1 variant (hCX3CR1I249/M280) were bred and maintained as previously described (20). Mice containing the human CX3CR1 I250 or M280 polymorphism within the mouse CX3CR1 loci, mCX3CR1I250 and mCX3CR1M281 respectively, were obtained from Biogen ©. Mice were maintained at the Laboratory Animal Resource Center at The University of Texas at San Antonio under conventional housing conditions. All experiments were performed in accordance with National Institutes of Health guidelines and approved by UTSA-Institutional Animal Care and Use Committee.
Mice were intra-peritoneally (i.p.) injected once daily for five days with 60 mg/Kg of streptozotocin (STZ) to induce hyperglycemia (Sigma Aldrich catalog number: S0130) (19, 33). Age-matched non-diabetic controls received citrate buffer as a vehicle control. Animals were deemed hyperglycemic when blood glucose levels were > 250 mg/dL and blood glucose levels were measured weekly. Diabetic patients experience recurrent infections, low-grade systemic inflammation and increased plasma levels of lipopolysaccharide (LPS) (12, 34–36). Therefore, to mirror these manifestations, mice were treated with 0.08mg/kg LPS. Non-diabetic mice (Figure 1 and Supplementary Figure 1) received one daily injection of 0.08mg/kg LPS for four consecutive days. Due to these mice lacking the systemic inflammation caused by diabetes, we challenged them with 4 days of LPS to induce low level endotoxemia as previously characterized (19). Four months diabetic mice (Figure 2) did not receive LPS treatment, due to their increased sensitivity to cachexia at this more chronic stage of diabetes. Acute LPS treatment can cause hypoglycemia and induce large variation in circulating glucose levels in diabetic mice (37, 38). Therefore, to avoid large fluctuations in glucose levels and to prevent masking hyperglycemia, 10 weeks diabetic mice, (Figures 3–5 and Supplementary Figures 2–6) received one daily injection of 0.08mg/kg LPS for 2 consecutive days prior to euthanasia as previously characterized (26).
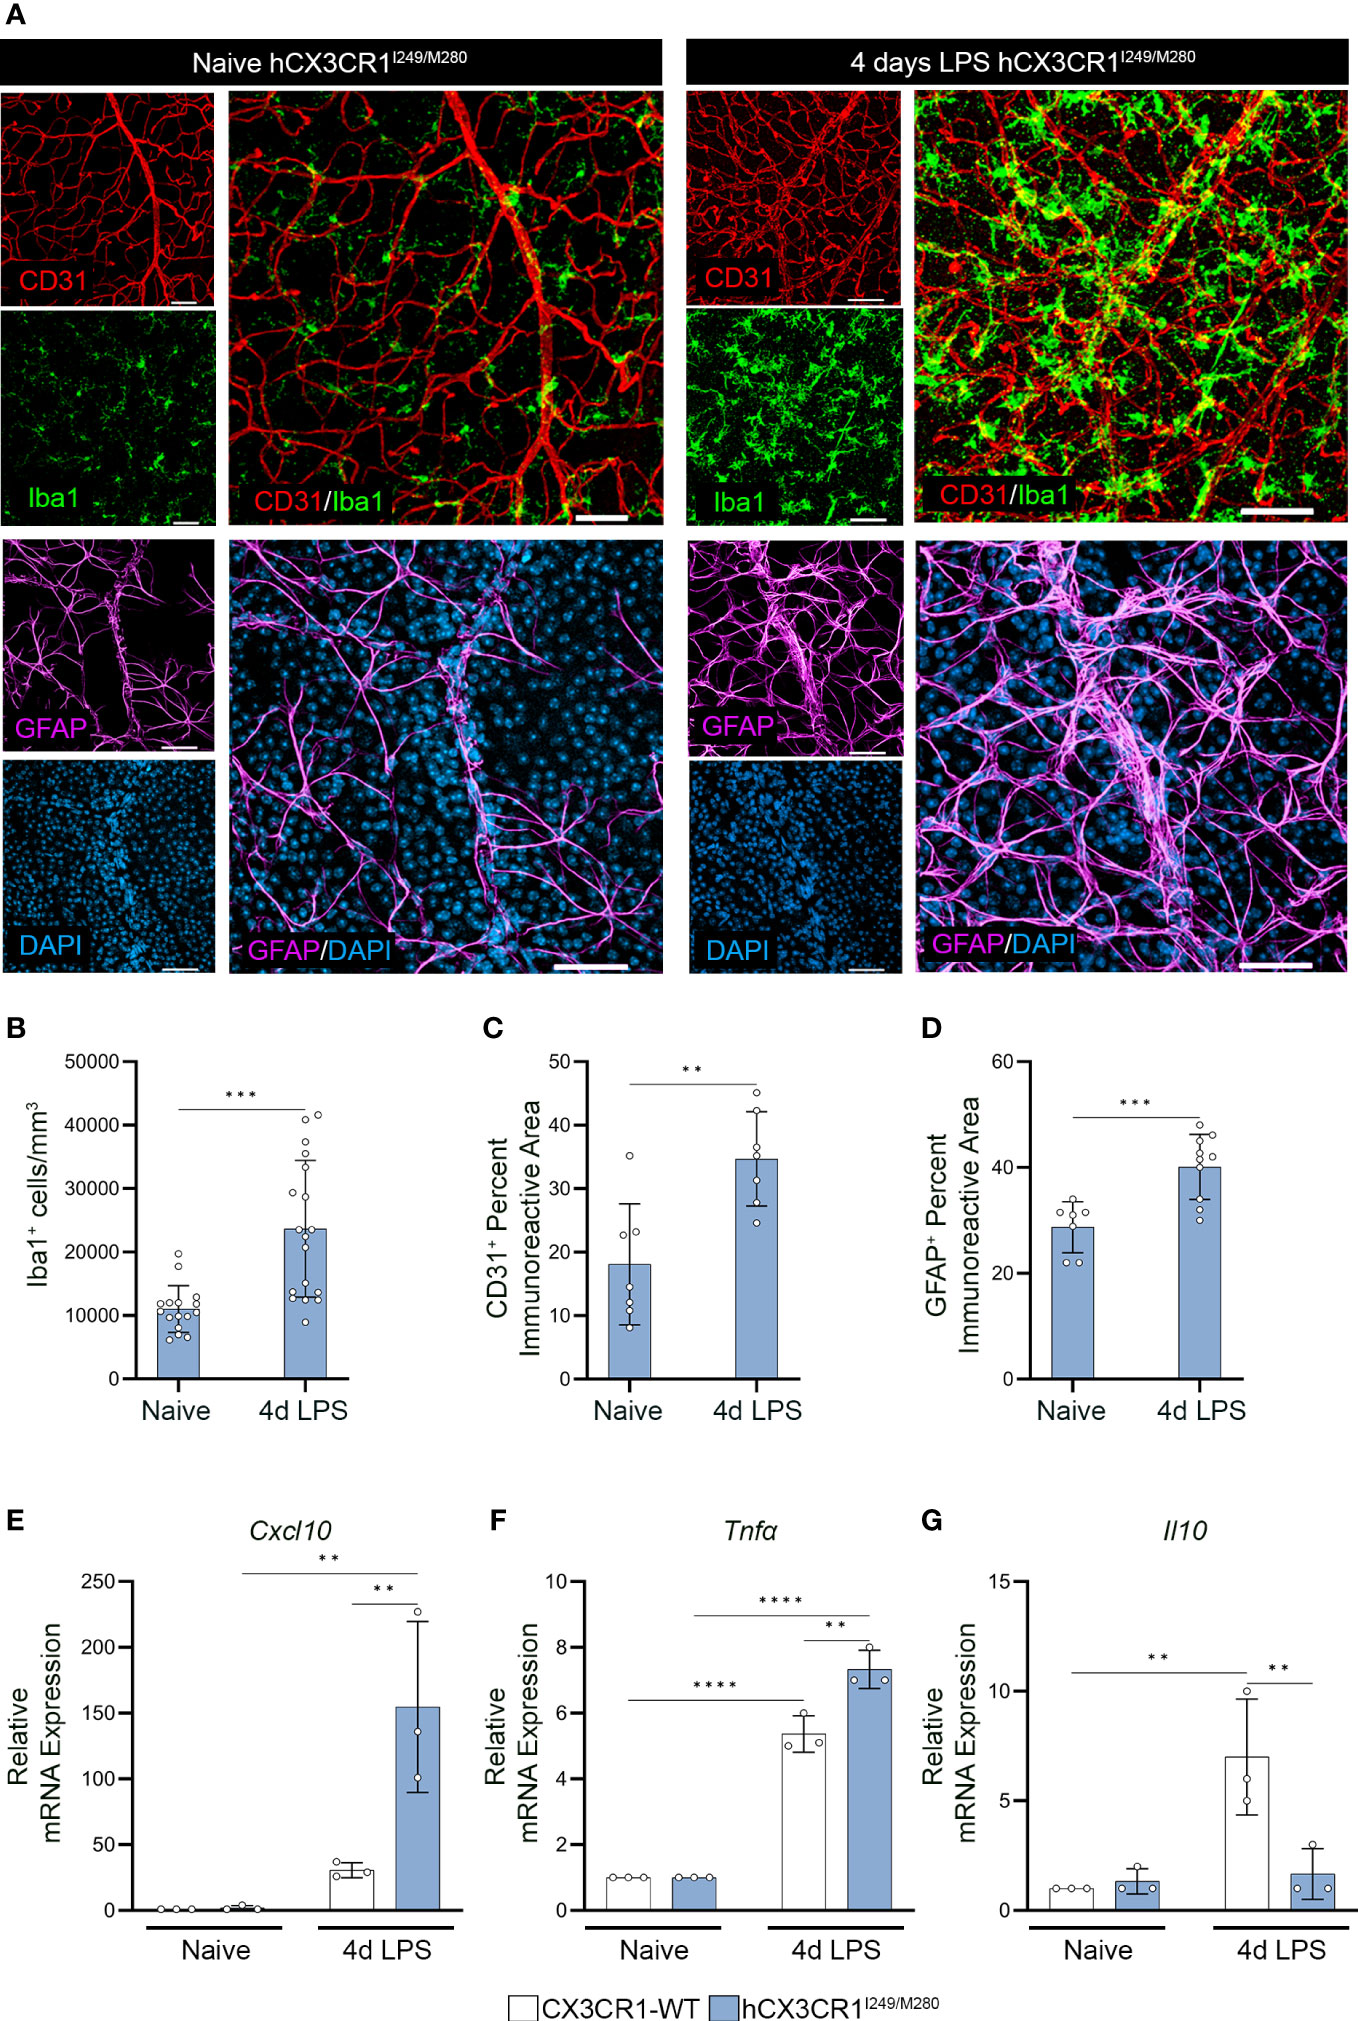
Figure 1 Acute LPS-induced inflammation induces aberrant angiogenesis and gliosis in the hCX3CR1I249/M280 retina. hCX3CR1I249/M280 mice were i.p. injected with 0.08mg/Kg LPS once daily for four days (4d), and naïve age-matched controls received PBS. (A) Confocal images of retinal tissues stained for Iba1 (green), CD31 (Red), GFAP (magenta) and DAPI (blue) in naïve and 4d LPS hCX3CR1I249/M280 mice. Confocal images represent the retinal ganglion cell layer in the peripheral retina. (B–D), Quantification of retinal IHC analysis for Iba1+ cells/mm3 (B), CD31+ percent immunoreactive area (C), and percent immunoreactive area for GFAP (D). (E–G), Graphical representation for RT-qPCR analysis of retinas for relative mRNA expression for Cxcl10 (E), Tnfα (F) and Il10 (G). Data show the average of the 2 central, 2 medial and 2 peripheral images taken per mouse. Data show mean ± SD, n = 3 to 10 mice per group where each dot represents an individual mouse. **P<0.01, ***P<0.001, ****P<0.0001 using Student’s t-test, with Welch’s correction. Scale bars measure 50µm.
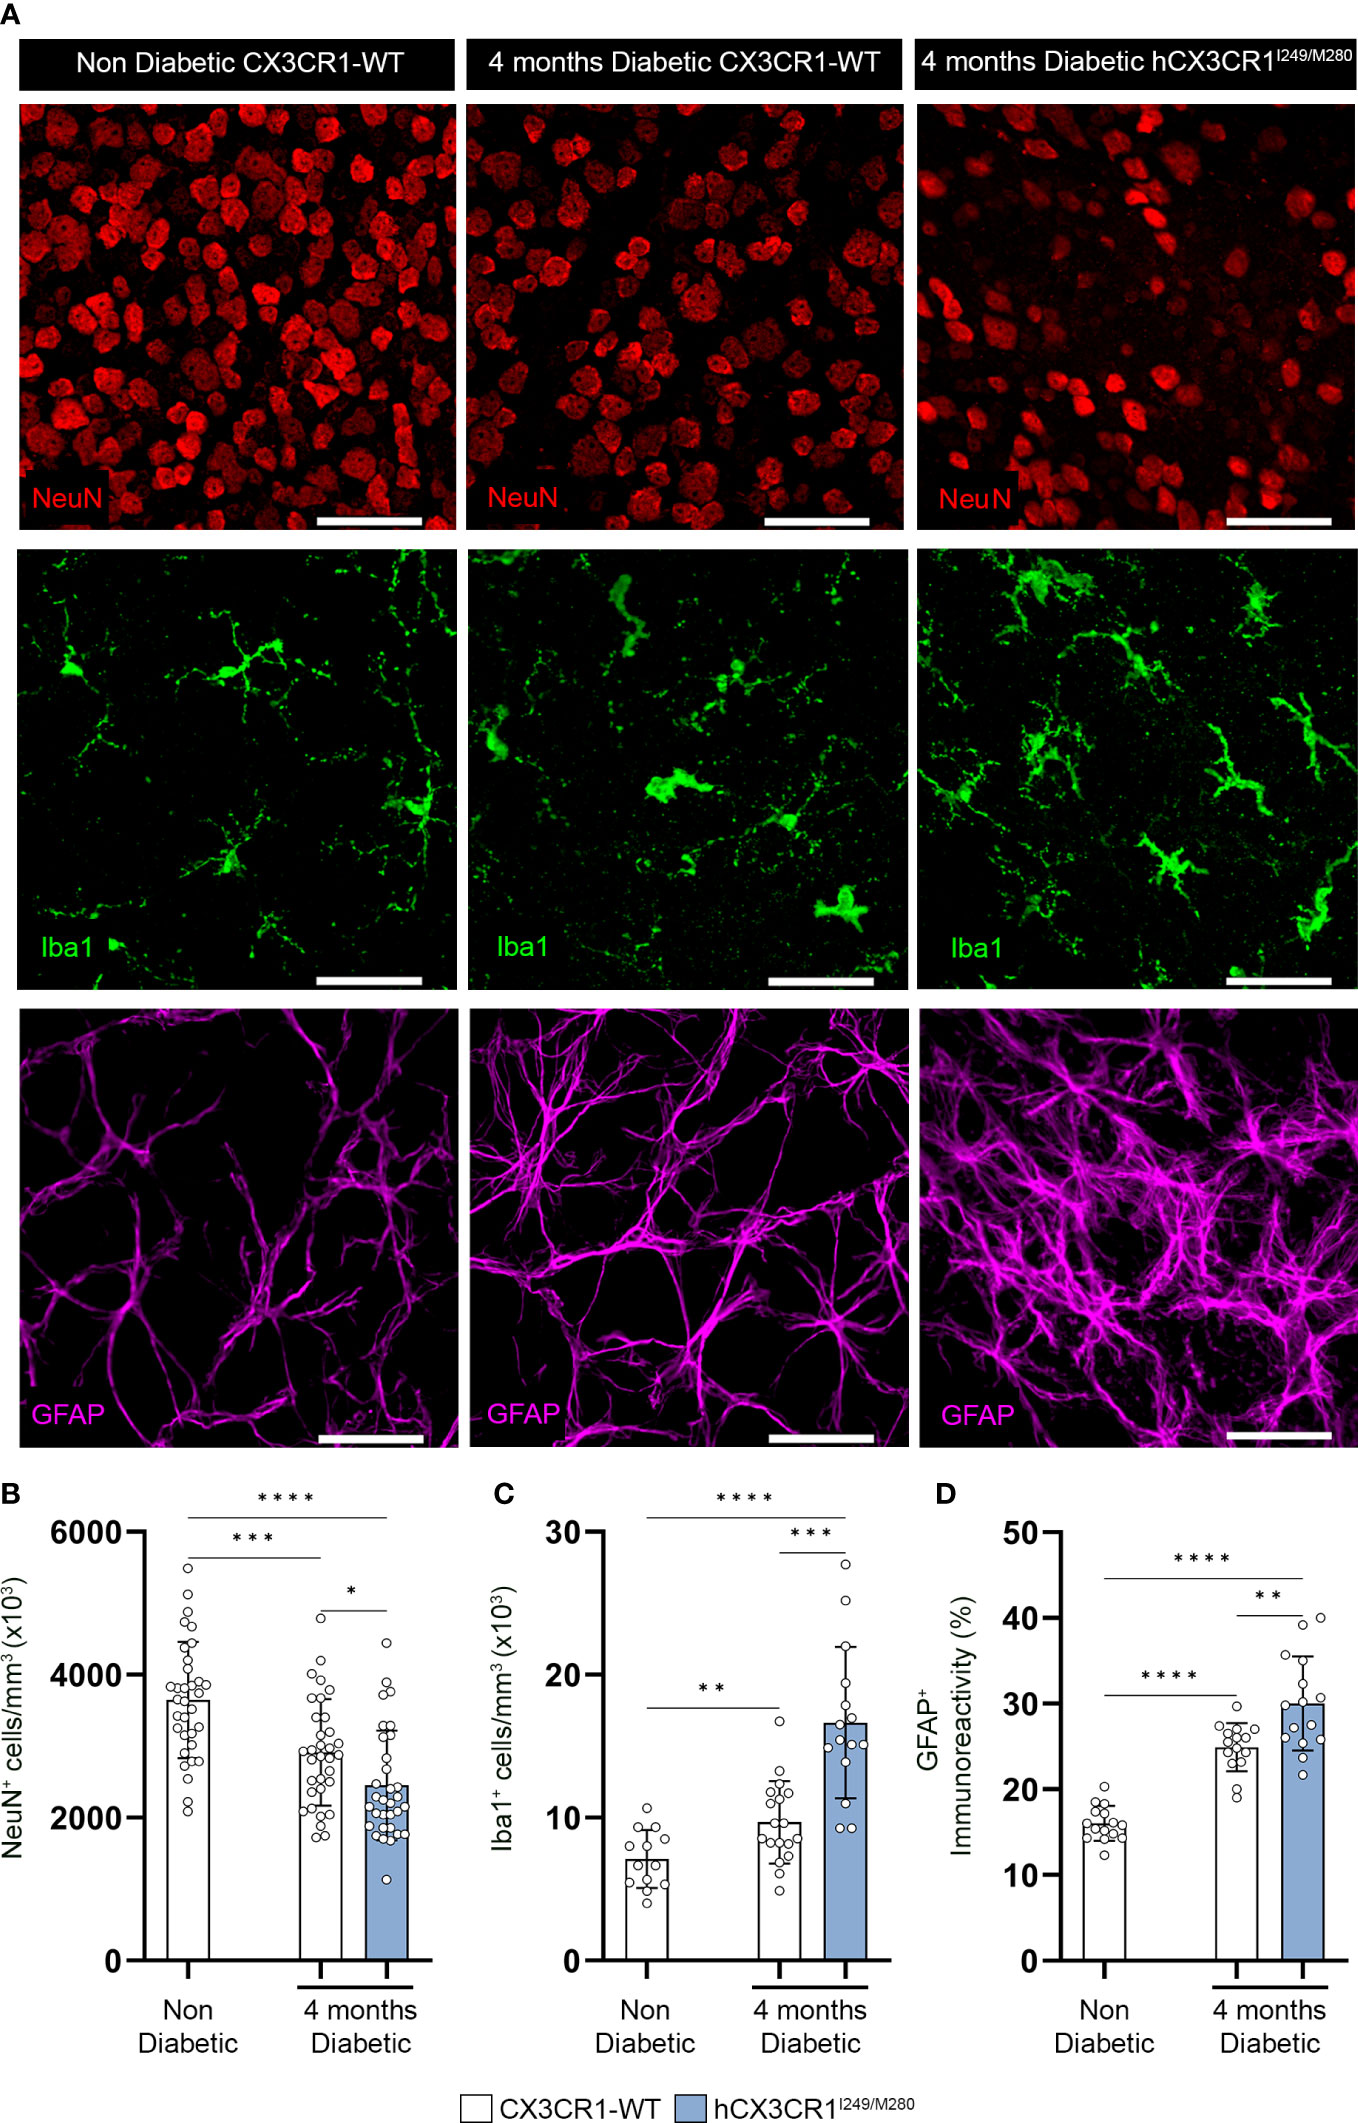
Figure 2 hCX3CR1I249/M280 variant is associated with increased neuronal cell loss and reactive gliosis in the diabetic retina. Hyperglycemia was induced in CX3CR1-WT and hCX3CR1I249/M280 mice via i.p. injection with STZ and retinal tissues were analyzed after four months of hyperglycemia. (A) Confocal images of retinal tissues stained for Iba1 (green), NeuN (Red) and GFAP (magenta) in naïve CX3CR1-WT and 4-months diabetic CX3CR1-WT and hCX3CR1I249/M280 mice. Confocal images represent the retinal ganglion cell layer in the peripheral retina. B-D, Quantification of retinal IHC analysis for NeuN+ cells/mm3 (B), Iba1+ cells/mm3 (C), and percent immunoreactive area for GFAP (D). Data show the 2 central, 2 medial and 2 peripheral images taken per mouse. Data show mean ± SD, n = 4 to 10 mice per group where each dot represents an individual mouse. *P<0.05, **P<0.01, ***P<0.001 ****P<0.0001 using Student’s t-test, with Welch’s correction. Scale bars measure 50µm.
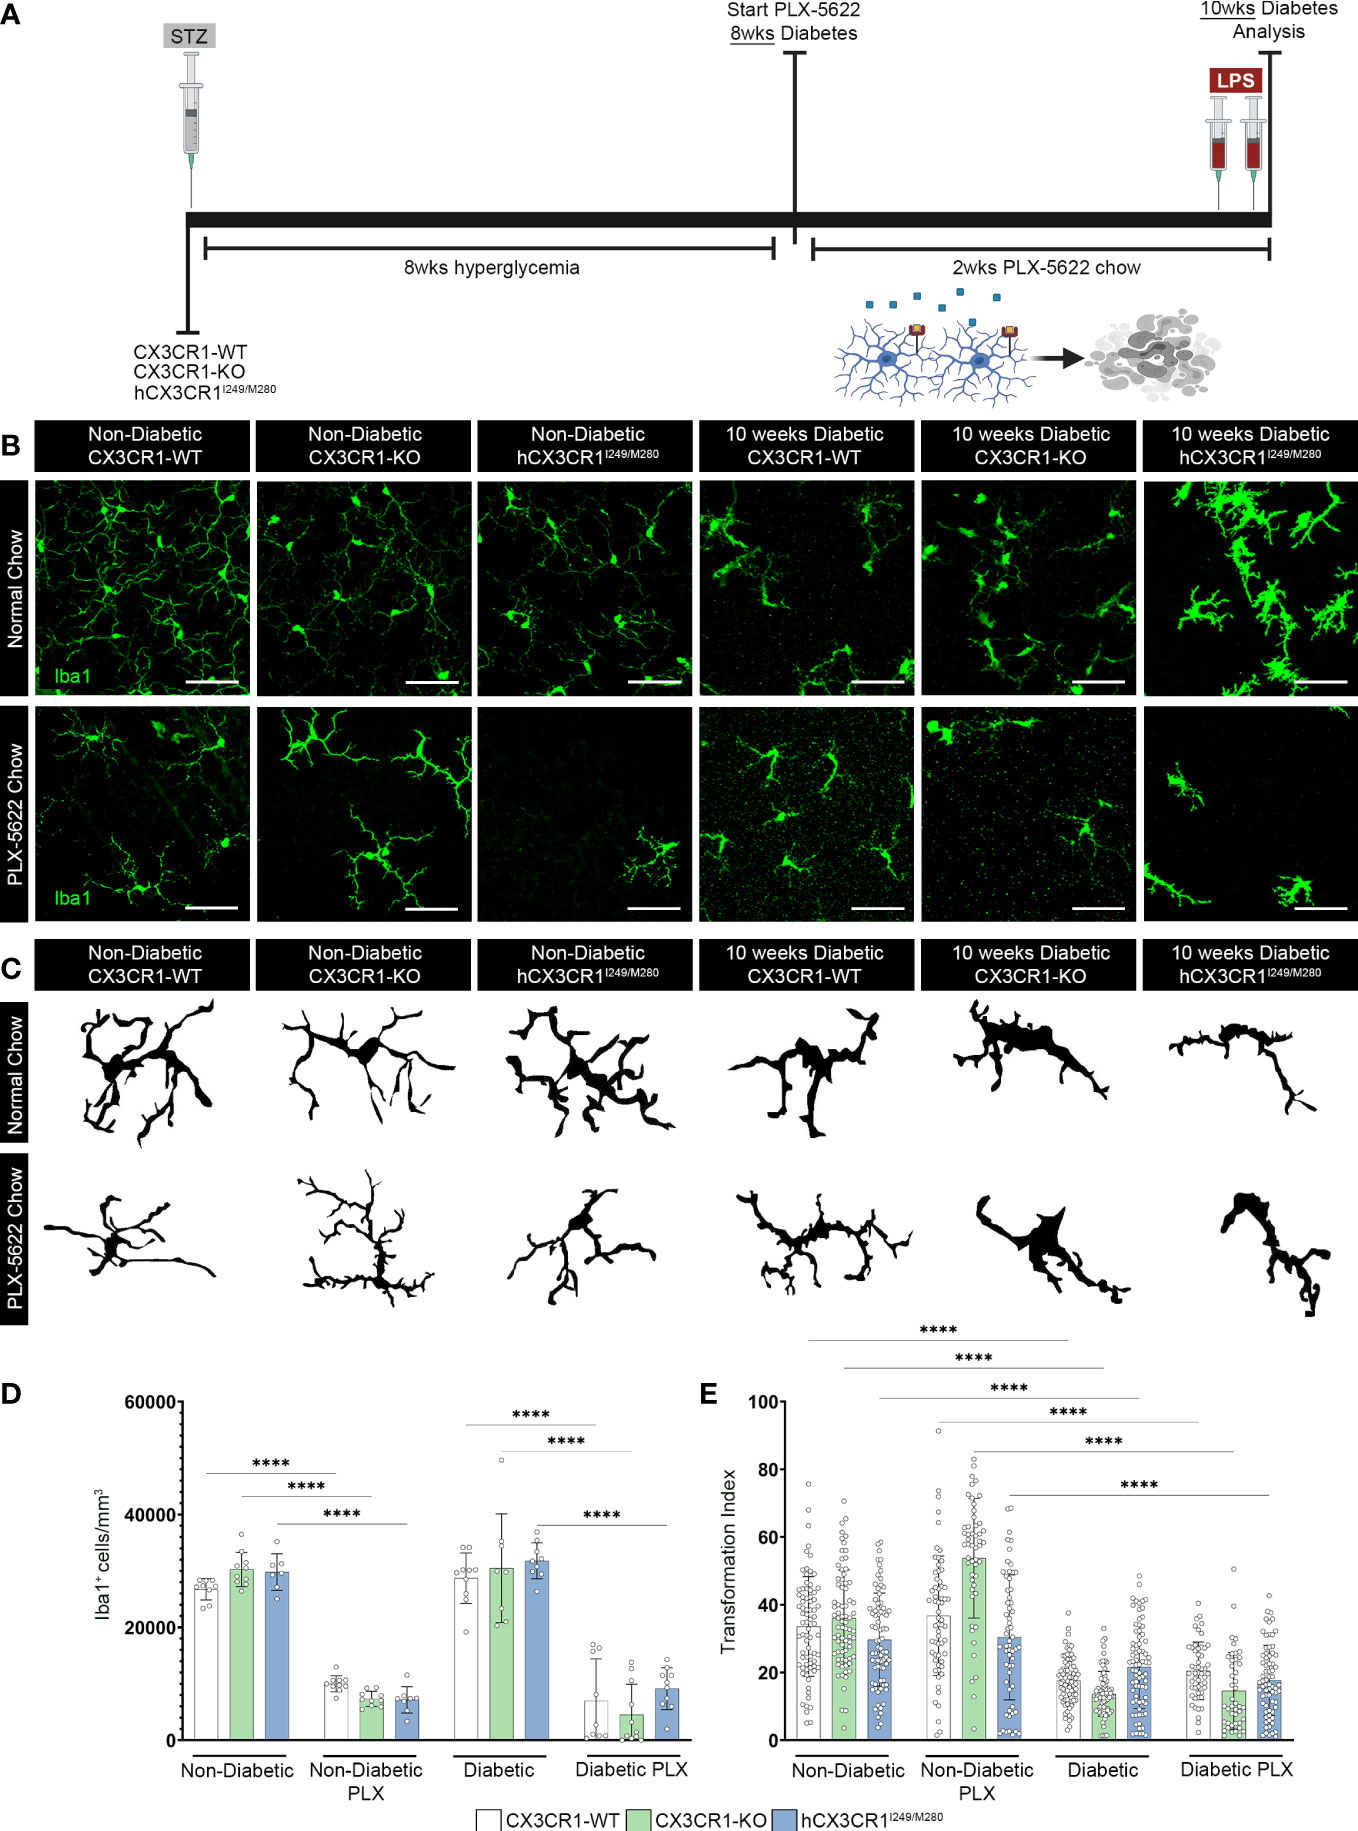
Figure 3 CSF-1R antagonism induces robust microglia depletion in the diabetic retina. (A) Microglia were pharmacologically depleted using PLX-5622 in non-diabetic and 8-wks diabetic CX3CR1-WT, CX3CR1-KO, and hCX3CR1I249/M280 mice for two weeks. Non-diabetic control mice received citrate buffer. Non-depleted, non-diabetic and diabetic controls remained on normal chow. Confocal images of retinal tissues stained for Iba1 (green) (B) and transformation index cellular tracings (C) in CX3CR1-WT, CX3CR1-KO and hCX3CR1I249/M280 mice. Confocal images represent the retinal ganglion cell layer in the peripheral retina. (D, E), Quantification of retinal IHC analysis for Iba1+ cells/mm3 (D) and transformation index (E). Data show the average of the 2 central, 2 medial and 2 peripheral images taken per mouse. Data show mean ± SD, n = 6 to 10 mice per group where each dot represents an individual mouse (D). Transformation index data show mean ± SD n = 44 to 75 microglia per group for n=5 mice where each dot represents an individual microglia cell (E). ****P<0.0001 using 2-way ANOVA. Scale bars measure 50µm.
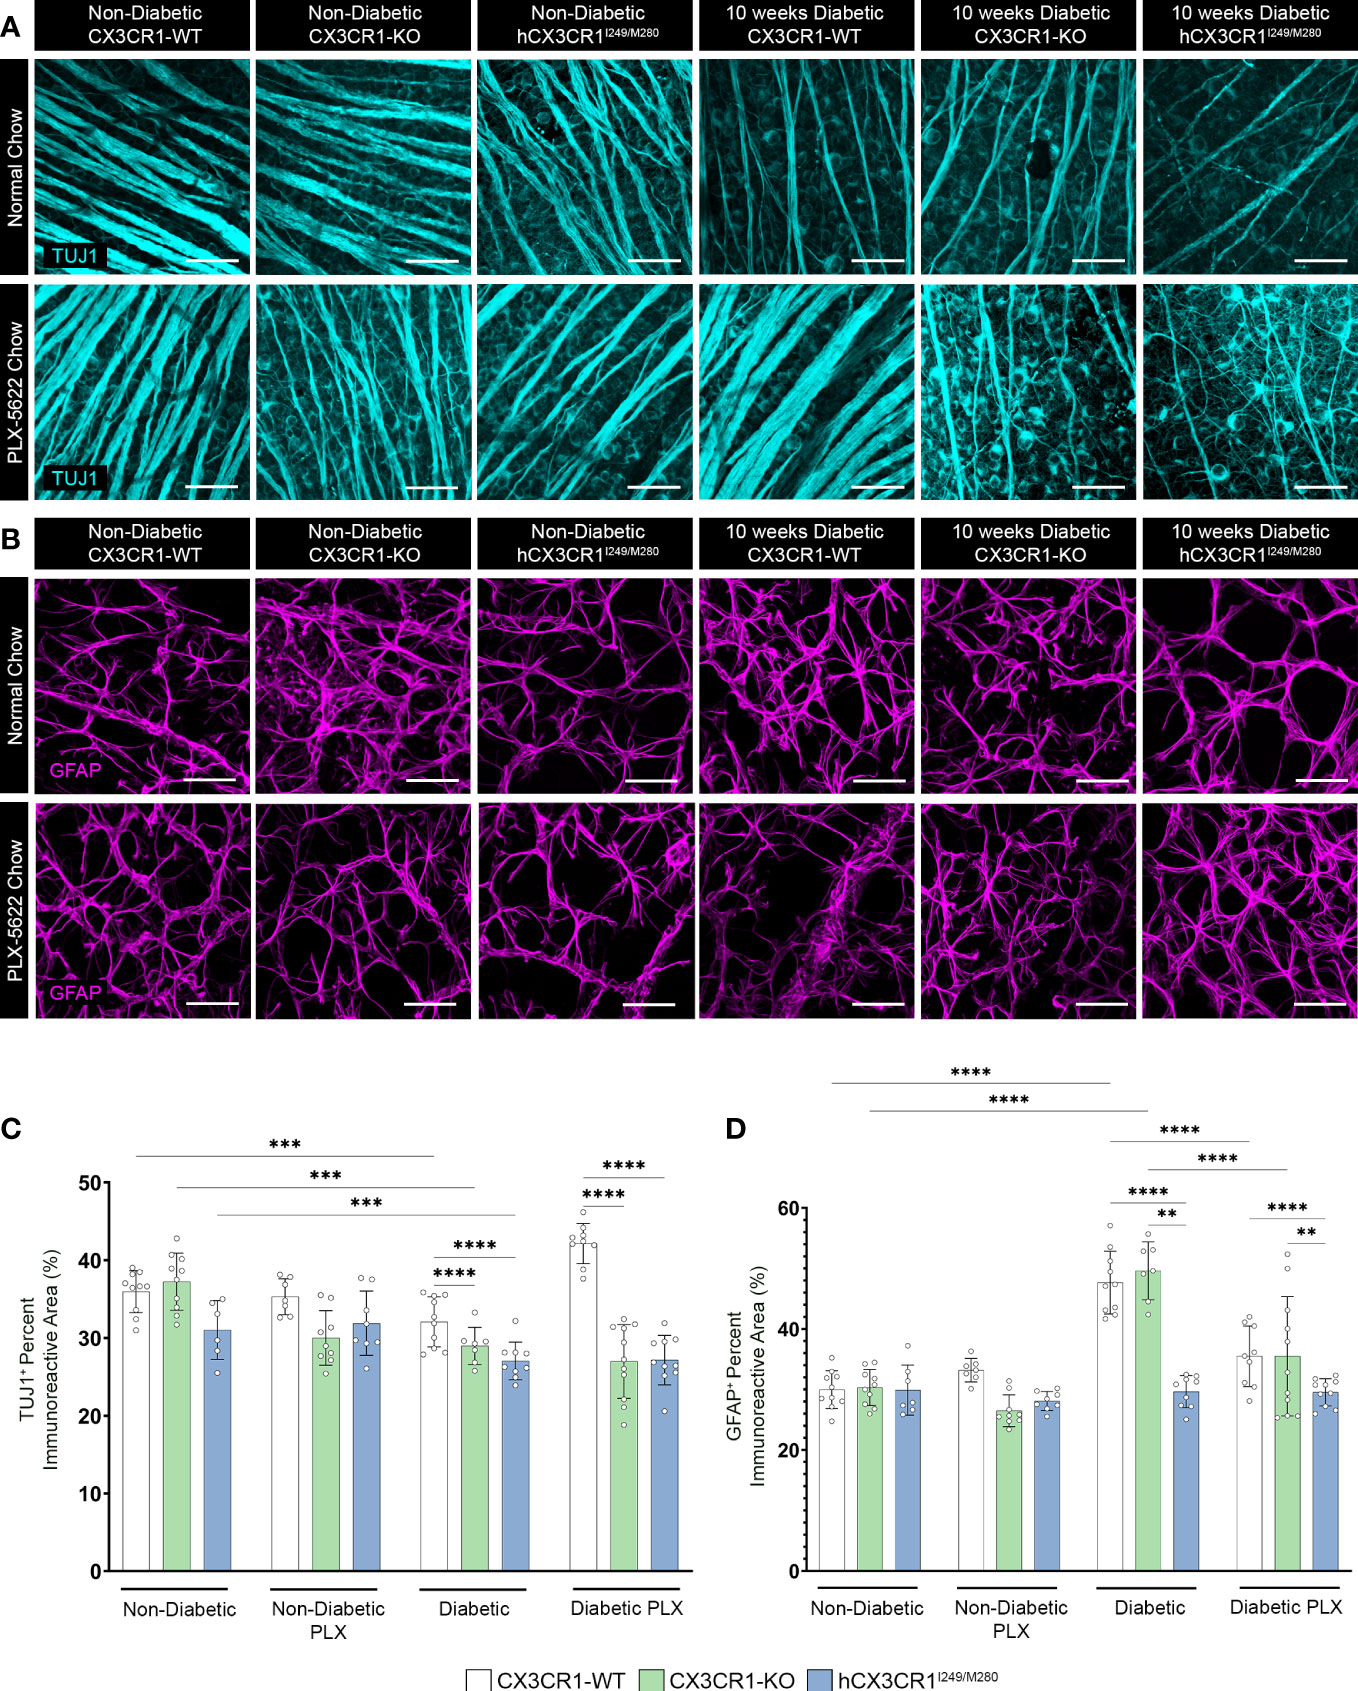
Figure 4 PLX-5622 treatment does not prevent TUJ1+ axonal loss in the diabetic CX3CR1-KO and hCX3CR1I249/M280 retinas. Microglia were pharmacologically depleted using PLX-5622 in non-diabetic and 8-wks diabetic CX3CR1-WT, CX3CR1-KO, and hCX3CR1I249/M280 mice for two weeks. Non-diabetic control mice received citrate buffer. Non-depleted, non-diabetic and diabetic controls remained on normal chow. Confocal images of retinal tissues stained for TUJ1 (turquoise) (A) and GFAP (magenta) (B) in CX3CR1-WT, CX3CR1-KO and hCX3CR1I249/M280 mice. Confocal images represent the retinal ganglion cell layer in the peripheral retina. (C, D), Quantification of retinal IHC analysis for TUJ1+ percent immunoreactive area (C) and GFAP+ percent immunoreactive area (D). Data show the average of the 2 central, 2 medial and 2 peripheral images taken per mouse. Data show mean ± SD, n = 6 to 10 mice per group where each dot represents an individual mouse. **P<0.01, ***P<0.001, ****P<0.0001 using 2-way ANOVA. Scale bars measure 50µm.
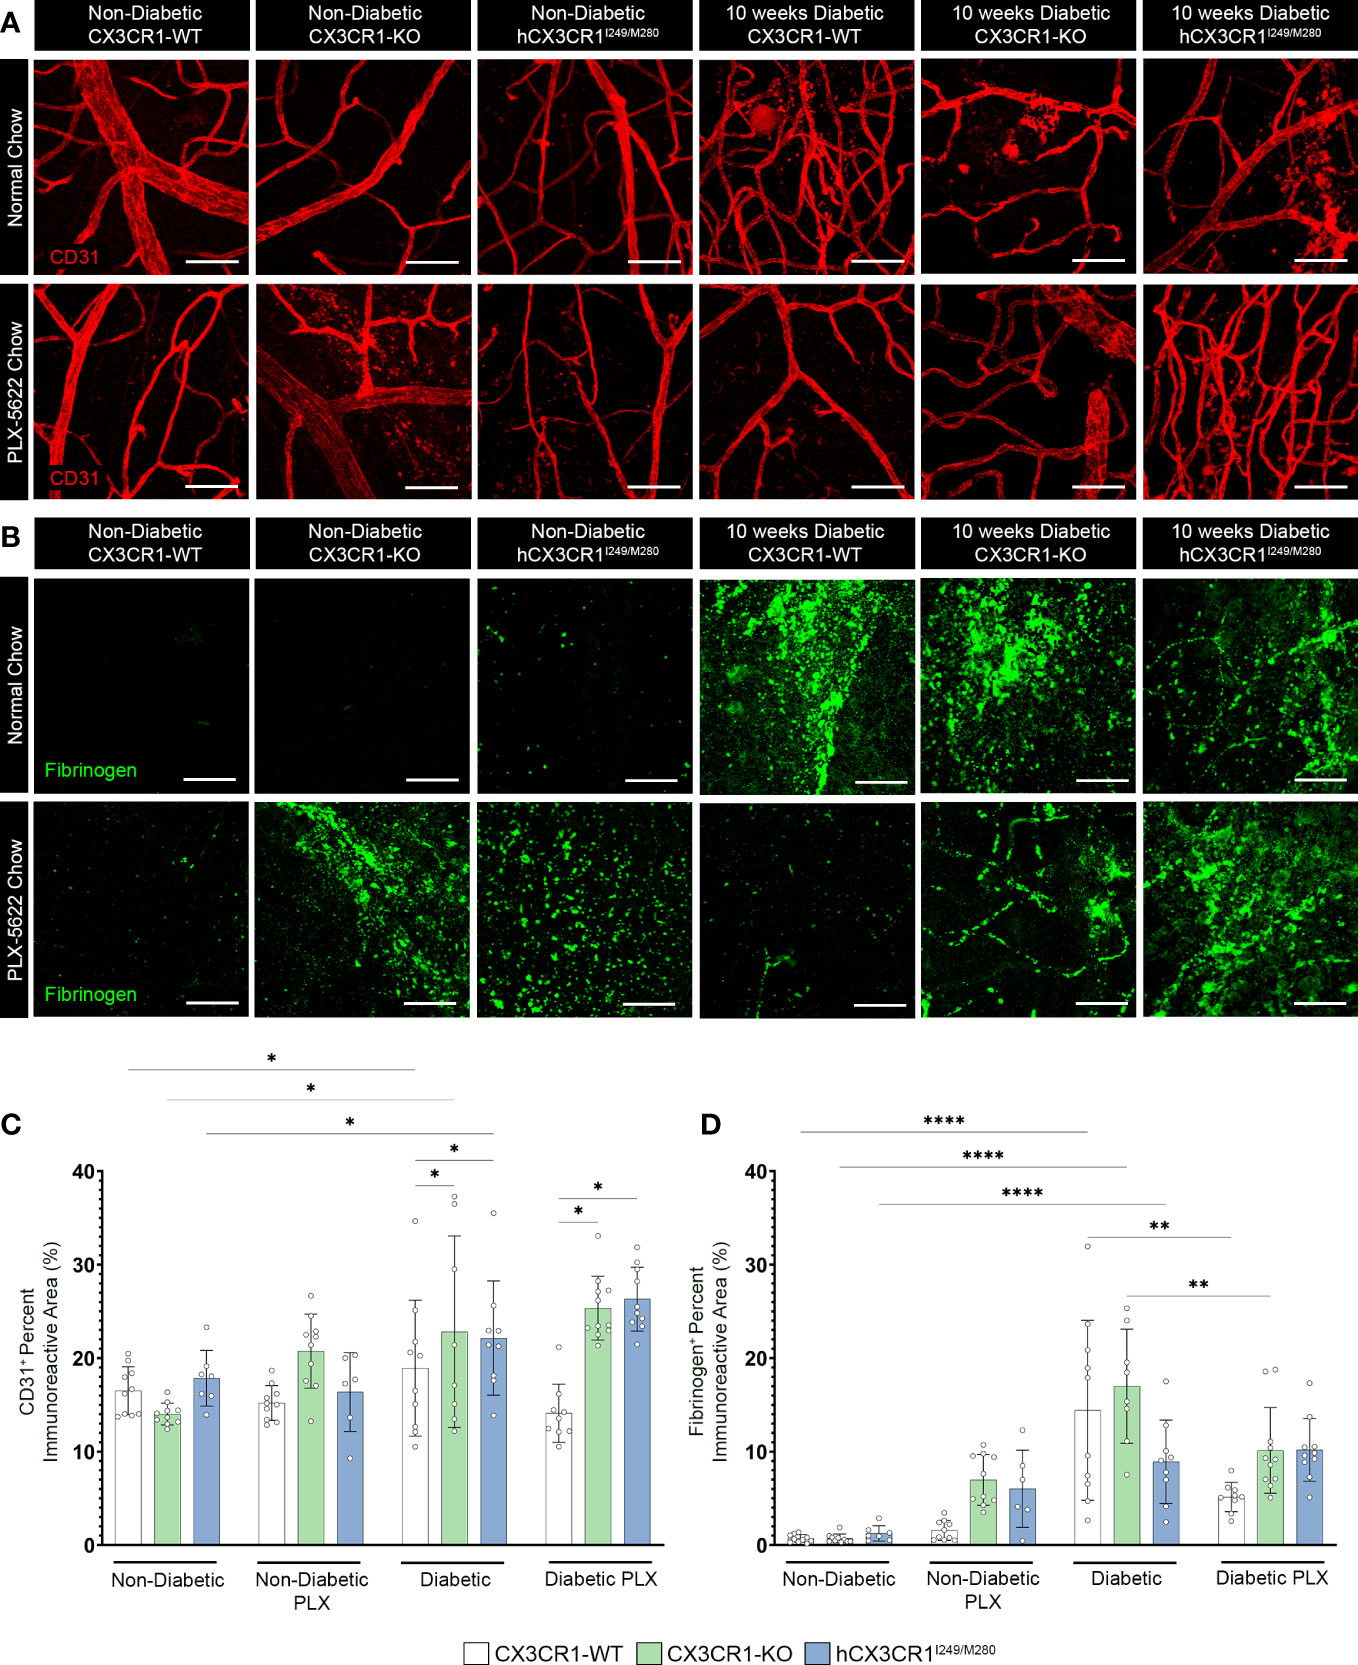
Figure 5 PLX-5622 treatment does not alleviate angiogenesis in the diabetic CX3CR1-KO and hCX3CR1I249/M280 retina. Microglia were pharmacologically depleted using PLX-5622 in non-diabetic and 8-wks diabetic CX3CR1-WT, CX3CR1-KO, and hCX3CR1I249/M280 mice for two weeks. Non-diabetic control mice received citrate buffer. Non-depleted, non-diabetic and diabetic controls remained on normal chow. Confocal images of retinal tissues stained for CD31 (red) (A) and fibrinogen (green) (B) in CX3CR1-WT, CX3CR1-KO and hCX3CR1I249/M280 mice. Confocal images represent the retinal ganglion cell layer in the peripheral retina. (C, D), Quantification of retinal IHC analysis for CD31+ percent immunoreactive area (C) and fibrinogen+ percent immunoreactive area (D). Data show the average of the 2 central, 2 medial and 2 peripheral images taken per mouse. Data show mean ± SD, n = 6 to 10 mice per group where each dot represents an individual mouse. *P<0.05, **P<0.01, ****P<0.0001 using 2-way ANOVA. Scale bars measure 50µm.
Eight-wks following STZ-induced hyperglycemia, CX3CR1-WT, CX3CR1-KO, hCX3CR1I249/M280, mCX3CR1I250 and mCX3CR1M281 mice were fed 0.12% PLX-5622 (MedChemExpress, catalog number: HY-114153) chow (7012, Blue, TD.200435, Envigo) for 2-wks, until 10-wks of hyperglycemia, the time point of tissue collection.
Mice were transcardially perfused with cold 1x Hanks’s Balanced Salt Solution (HBSS). Eyes were enucleated and placed in 4% paraformaldehyde (PFA) for 20 minutes. Next, retinas were dissected out of the globe of the eye and placed in 1% PFA for 1 hour. Fixed retinas were then place in cryoprotection solution (200 mL glycerol, 200 mL 0.4M Sorenson’s buffer and 600 mL MilliQ water) overnight at 4°C, and the following day placed in cryostorage solution (500 mL 0.2M PO4, 10 g PVP-40, 300 g sucrose and 300 mL ethylene glycol) at -20°C. Brain tissues were dissected from the skull and fixed in 4% PFA overnight at 4°C followed by cryoprotection overnight at 4°C. Cryoprotected brains were sectioned at 30µm using a freezing microtome and free floating brain sections were placed in cryostorage solution at -20°C.
Using the optic disc to center the retina, whole retinas were divided into 4 leaflets that each contained the central, medial and peripheral retina (Supplementary Figure 1A). ¼ leaflets were chosen at random to visualize proteins of interest. Two images were obtained per region for a total of 6 images per ¼ retinal leaflet (Supplementary Figure 1A). Retinal leaflet preparations were blocked overnight in 10% goat serum containing 1% Triton-X 100 at 4°C for immunohistochemical analysis. Tissues were then incubated overnight at 4°C with primary antibodies diluted in blocking solution (10% goat or donkey serum containing 1% Triton-X 100) to visualize proteins of interest, rabbit anti-ionized calcium binding adaptor molecule-1 (Iba1) (RRID: AB_839504), mouse anti-neuronal nuclei (NeuN) (RRID: AB_2298772), mouse anti-β tubulin III (TUJ1) (RRID: AB_10063408), rat anti-glial fibrillary acidic protein (GFAP) (RRID: AB_2532994), rat anti-pecam-1 (CD31) (RRID: AB_393571), and rabbit anti-fibrinogen (RRID: AB_2894406). To remove unbound antibodies, tissues underwent 7 washes each for 5 minutes in PBS/0.1% Triton-X 100. Tissues were incubated for three hours in species-specific secondary antibodies to visualize proteins of interest followed by 7 washes each at 5 minutes in PBS with 0.1% Triton-X 100. To label cellular nuclei, tissues were incubated in Hoechst 3342 (Thermo Fisher Scientific catalog number: H1399) for 7 minutes, followed by 3 washes in PBS for 5 minutes each. Tissues were mounted on Superfrost Plus microscope slides (Fisher Scientific catalog number: 12-550-15) and cover slipped using Fluorsave (Millipore Sigma catalog number: 345789). Antibody combinations and species-specific secondary antibody combinations are outlined in Supplementary Table 1.
Confocal microscopy was performed using a Zeiss 710 NLO confocal microscope and 3D compositions of confocal images were generated using Imaris software v7.2 (Bitplane). Six images were obtained per ¼ retinal leaflet, 2 images at the central retina nearest the optic nerve, 2 images in the middle of the leaflet and 2 images in the outer leaflet, per mouse (Supplementary Figure 1A). Quantifications shown represent the average of the six images taken per mouse. To quantify Iba1+ microglial and NeuN+RBPMS+ neuronal cell body densities, cells were manually counted in 40x images using the counter tool in Adobe Photoshop version 21.0.3. To quantify the percent immunoreactive area of TUJ1+ axons, GFAP+ glia, CD31+ blood vessels and fibrinogen, raw confocal images were converted to 32-bit in ImageJ Fiji analysis software (NIH) and an automatic threshold was applied. Data was normalized by volume based on X, Y and Z coordinates (i.e. 212µm *212 µm *Z stack thickness) to account for changes in confocal Z-stack thickness and images size (scale settings- distance in pixels: 1024; known distance: 206.25). We analyzed microglial morphological changes by determining the transformation index (TI) of microglia. To measure TI, 40x images were converted to 32-bit in ImageJ Fiji analysis software (NIH) and individual microglial cells were traced to determine the perimeter and area of a microglia cell. TI was calculated using the equation: perimeter2/4π × area2 (39). The TI was determined for 5 microglia per 40x image, spanning the 3 regions of the retina, central, medial and peripheral retina from 5 mice per treatment and genotype for a total of 15 microglia quantified per animal. Values are expressed as a range from 1 to 100, with a TI value closer to 1 representing a circular, amoeboid microglial cell with fewer and/or shorter cellular processes. Higher TI values represent ramified microglial cells with extensive branching and smaller cell bodies.
Retinal isolates from enucleated retinas were homogenized in Trizol (Invitrogen catalog number: 15-596-018) followed by RNA isolation using the Qiagen RNeasy Kit (Qiagen catalog number: 74104). To generate cDNA, 500 ng of total RNA was reverse-transcribed using the High-capacity cDNA Reverser Transcription Kit (Thermo Fisher Scientific catalog number: 4368814). The 7900 HT Fast Real-Time PCR system was used to run RT-qPCR reactions were ran in a 384-well plate in triplicates using SYBR Green PCR master mix (Thermo Fisher Scientific catalog number: 4344463), 250 nM forward and reverse primers and 20ng of cDNA template. Results were analyzed as previously described using the comparative Ct method (14, 21). Data was normalized to two housekeeping genes, Rn18s (18s) and Actb (β-actin) and is presented as the fold change relative to genotype-specific naïve controls. The following primers were used: 18s (Accession number: NR_003278.3): CGGCTACCACATCCAAGGAA (forward),
GTCGGAAATACCGCGGTC (reverse); β-actin (Accession number: NM_007393) 5’-CTCTGGCTCCTAGCACCATGAAGA-3’ (forward), 5’-GTAAAACGCAGCTCAGTAACAGTCCG-3’ (reverse); Cxcl10 (Accession number: NM_021274.2): 5’-TGCTGCCGTCATTTTCTG-3’ (forward), 5’-GCTCGCAGGGATGATTTCAAG-3’ (reverse); Il1β (Accession number: NM_008361.3): 5’-GTGTGGATCCAAAGCAATAC-3’ (forward), 5’-GTCTGCTCATTCATGACAAG-3’ (reverse); Nos2 (Accession number:NM_010927.4): 5’-GGCAGCCTGTGAGACCTTTG-3’ (forward), 5’-TGCATTGGAAGTGAAGCGTTT-3’ (reverse); Tnfα (Accession number: NM_013639.3): 5’- GGTGCCTATGTCTCAGCCTCTT-3’ (forward), 5’- GCCATAGAACTGATGAGAGGGAG-3’ (Reverse); Il6 (Accession number: NM_031168.1): 5’- TACCACTTCACAAGTCGGAGGC-3’ (forward), 5’- CTGCAAGTGCATCATCGTTGTTC-3’ (reverse); Il10 (Accession number: NM_010548.1): 5’- CGGGAAGACAATAACTGCACCC-3’ (forward), 5’- CGGTTAGCAGTATGTTGTCCAGC-3’ (reverse).
All analyses were conducted using GraphPad Prism v9.2 and a P value <0.05 was considered statistically significant. Statistical significance is denoted as *P value <0.05, **P value <0.01, ***P value <0.001 and ****P value <0.0001. Statistical tests performed included a two-tailed parametric unpaired student’s t test with Welch’s correction when comparing two groups (Figures 1, 2 and Supplementary Figure 3E). When comparing multiple groups, a two-way ANOVA with the Tukey’s post-hoc test was performed, using the treatment type as the first variable and genotype as the second variable (Figures 3–5 and Supplementary Figures 3D, 4, 5).
To visualize changes to the vasculature and glial responses, retinal tissues were stained with Iba1 (microglia), CD31 (endothelial cells) and GFAP (astrocytes) (Figure 1). Four-day LPS treatment induced a significant increase in Iba1+ cells (23657 ± 10762, student’s t test P=0.0001) in comparison to naïve controls (11028 ± 3657) (Figures 1A, B). Additionally, LPS treatment increased CD31+ percent immunoreactive area (34.69 ± 7.423, student’s t test P=0.0037) and GFAP+ astrogliosis (40.13 ± 6.143, students t test P=0.0007) in comparison to PBS naive controls (CD31+: 18.09 ± 9.503; GFAP+: 28.7 ± 4.811) (Figures 1A, C, D). Microglial clustering around the vasculature was evident in LPS treated hCX3CR1I249/M280 mice in contrast to naïve hCX3CR1I249/M280 mice (Figure 1A). RT-qPCR analysis of retinal RNA isolated from LPS treated hCX3CR1I249/M280 mice revealed a significant increase in gene expression for proinflammatory cytokines Cxcl10 and Tnfα, and a decrease in the anti-inflammatory cytokine Il10 (Figures 1E–G). Diabetes induced a significant increase in gene expression for Il1β and Il6 compared to ND mice, regardless of genotype (Supplementary Figures 1B, C). These data suggest that hCX3CR1I249/M280 mice are more susceptible to a proinflammatory response under acute inflammatory conditions.
Immunohistochemical analysis of retinal tissues after four months of hyperglycemia revealed a decrease in NeuN+ neuronal densities in diabetic CX3CR1-WT and hCX3CR1I249/M280 mice in comparison to the non-diabetic CX3CR1-WT (3646 ± 811.7) control group (Figures 2A, B). Notably, diabetic hCX3CR1I249/M280 mice showed a statistically significant decrease in NeuN+ neuronal densities (2451 ± 766.8, student’s t test, P<0.0001) compared to diabetic CX3CR1-WT mice (2911 ± 745.3, student’s t test, P=0.0003) (Figures 2A, B). hCX3CR1I249/M280 mice also showed an increase in Iba1+ cells/mm3 (16.64 x10³ ± 5.289, student’s t test, P=0.0002) and GFAP+ percent immunoreactive area (30.01 ± 5.513, student’s t test, P=0.0044) compared to diabetic CX3CR1-WT mice (Iba1: 9.679 x10³ ± 2.879; GFAP: 24.91 ± 2.797) (Figures 2A, C, D).
To further investigate the role of aberrantly activated microglia, in the absence of CX3CR1 (CX3CR1-KO) or expression of the human variant alleles of CX3CR1 (hCX3CR1I249/M280), in the diabetic retina, mice were treated for 2-wks with PLX-5622 (Figure 3A). To visualize genotype-specific changes in the degree of microglia depletion targeted with PLX-5622 treatment and microglial reactivity, we quantified the number of Iba1+ cells and transformation index (TI), respectively, in PLX-5622 treated and normal chow mice (Figure 3). PLX-5622 treatment resulted in a significant reduction in Iba1+ microglia in ND mice, CX3CR1-WT (10015.542 ± 1422.395, 2-way ANOVA P<0.0001), CX3CR1-KO (7342.444 ± 1326.141, 2-way ANOVA P< 0.0001) and hCX3CR1I249/M280 (7146.941 ± 2337.299, 2-way ANOVA P<0.0001) in comparison to their respective ND genotype-matched controls, CX3CR1-WT (26733.516± 1888.129), CX3CR1-KO (30248.529 ± 3004.598) and hCX3CR1I249/M280 (29796.14 ± 3240.632) (Figures 3B, D). Consistent with these results, under diabetic conditions PLX-5622 treatment led to a significant reduction in the number of Iba1+ cells in the retina and there were no differences between the degree of depletion across the CX3CR1-WT (6994.483 ± 7421.66), CX3CR1-KO (4537.517 ± 5401.353) and hCX3CR1I249/M280 (9155.333 ± 3713.293) diabetic groups (Figures 3B, D). Overall, PLX-5622 treatment led to a robust ~70% reduction in Iba1+ microglia in all non-diabetic and diabetic mice. Microglia retained high TI values with a ramified morphology and small cell bodies in CX3CR1-WT (36.772 ± 17.621), CX3CR1-KO (53.73 ± 17.67) and hCX3CR1I249/M280 (30.398 ± 18.472) in PLX-treated ND mice, compared to ND normal chow CX3CR1-WT (33.607 ± 14.709) CX3CR1-KO (36.01 ± 14.22) and hCX3CR1I249/M280 (29.711 ± 13.76) controls (Figures 3B, E). Retinal Iba1+ cells displayed a significant reduction in TI values in all diabetic groups, with microglia displaying an ameboid morphology with retracted cellular processes and large cell bodies (Figures 3C, E).
We next assessed the effects of PLX-5622 treatment on TUJ1+ and GFAP+ percent immunoreactive areas (Figure 4). Analysis of TUJ1+ retinal axons revealed that PLX treatment in ND mice did not alter TUJ1+ percent immunoreactive area in comparison to ND normal chow controls (Figures 4A, C). Diabetes led to a robust decrease in TUJ1+ percent immunoreactive area in all genotypes when compared to ND controls (Figures 4A, C). However, diabetic CX3CR1-KO (28.969 ± 2.393, 2-way ANOVA P<0.0001) and hCX3CR1I249/M280 (27.047 ± 2.43, 2-way ANOVA P<0.0001) mice were significantly more susceptible to TUJ1+ axonal loss in comparison to diabetic CX3CR1-WT (32.078 ± 3.225) mice (Figures 4A, C). TUJ1+ axonal loss was prevented in PLX-5622 treated diabetic CX3CR1-WT mice (42.155 ± 2.59) in comparison to the diabetic CX3CR1-WT normal chow (32.078 ± 3.25) control, closely mirroring the levels of TUJ1+ percent immunoreactivity found in the ND normal chow control group (35.953 ± 2.703) (Figures 4A, C). In contrast, PLX-5622 treatment in diabetic CX3CR1-KO and hCX3CR1I249/M280 mice did not alleviate TUJ1+ axonal loss caused by diabetes (Figures 4A, C). When we assessed GFAP+ glial cell responses to PLX-5622 treatment in ND mice, there were no observable changes in GFAP+ percent immunoreactive area in comparison to ND normal chow controls (Figures 4B, D). Diabetes induced a significant increase in GFAP+ percent immunoreactive area in CX3CR1-WT (47.64 ± 5.179, 2-way ANOVA P<0.0001) and CX3CR1-KO (49.60 ± 4.794, 2-way ANOVA P<0.0001) mice in comparison to ND controls, (CX3CR1-WT 29.969 ± 3.127 and CX3CR1-KO 30.325 ± 2.976; Figures 4B, D). PLX-5622 treatment led to a reduction in GFAP+ percent immunoreactive area in diabetic CX3CR1-WT (35.49 ± 4.996, 2-way ANOVA P<0.0001) and CX3CR1-KO (35.49 ± 9.865, 2-away ANOVA P=0.0001) in comparison to their diabetic CX3CR1-WT (47.639 ± 5.179) and CX3CR1-KO (49.601 ± 4.794) controls, respectively, closely resembling non-diabetic normal chow, CX3CR1-WT (29.969 ± 3.127) and CX3CR1-KO (30.325 ± 2.976) mice, respectively (Figures 4B, D).
We assessed vascular abnormalities in the diabetic retina and measured fibrinogen deposition and extravasation from the vasculature (Figure 5). PLX-5622 treatment in ND mice did not alter CD31+ percent immunoreactive area in CX3CR1-WT (15.209 ± 1.863), CX3CR1-KO (20.751 ± 3.962) and hCX3CR1I249/M280 (16.373 ± 4.219) mice compared to ND normal chow CX3CR1-WT (16.51 ± 2.565), CX3CR1-KO (14.017 ± 1.168) and hCX3CR1I249/M280 (17.842 ± 2.977) controls, respectively (Figures 5A, C). Diabetes induced a significant increase in CD31+ percent immunoreactive area in all genotypes when compared to ND controls (Figures 5A, C). However, CX3CR1-KO (22.82 ± 10.256, 2-way ANOVA P=0.0143) and hCX3CR1I249/M280 (22.145 ± 6.108, 2-way ANOVA P=0.0156) mice were more susceptible to an increase in CD31+ percent immunoreactive area indicative of more angiogenesis and vascular damage (Figures 5A, C). In diabetic mice ruptured and discontinuous blood vessels with aggregated endothelium were observed (Figure 5A). This phenotype was ameliorated in diabetic PLX-5622 treated CX3CR1-WT mice (14.098 ± 3.115), with a ~25% reduction in CD31+ percent immunoreactive area compared to diabetic normal chow CX3CR1-WT mice (18.926 ± 7.27), closely resembling their ND, normal chow CX3CR1-WT (16.51 ± 2.565) controls (Figures 5A, C). However, PLX-5622 treatment did not alleviate CD31+ angiogenesis nor abnormal vascular pathology in the diabetic CX3CR1-KO (25.348 ± 3.418) and hCX3CR1I249/M280 (26.305 ± 3.417) retina, compared to ND CX3CR1-KO (16.51 ± 2.565) and hCX3CR1I249/M280 (17.842 ± 2.977) controls, respectively (Figures 5A, C). PLX-treated diabetic CX3CR1-KO (25.348 ± 3.418, 2-way ANOVA P=0.0143) and hCX3CR1I249/M280 (26.305 ± 3.417, 2-way ANOVA P=0.0156) mice had significantly higher CD31+ percent immunoreactive areas in comparison to CX3CR1-WT (14.098 ± 3.115) mice (Figures 5A, C). Fibrinogen deposition was comparable in ND and ND PLX-5622 treated groups (Figures 5B, D). Diabetes led to an increase in fibrinogen deposition in the diabetic, normal chow retina in all genotypes (Figures 5B, D). Fibrinogen deposits were visualized as aggregates near areas of ruptured endothelium (Figure 5B). PLX-5622 treatment led to a significant ~64% reduction in fibrinogen deposition in diabetic CX3CR1-WT (5.141 ± 1.563, 2-way ANOVA P=0.012) mice and a ~40% reduction in CX3CR1-KO (10.12 ± 4.575, 2-way ANOVA P=0.012) mice with respect to their diabetic, normal chow, CX3CR1-WT (14.42 ± 9.626) and CX3CR1-KO (16.998 ± 6.096) controls, respectively (Figures 5B, D). Contrary to CX3CR1-WT and CX3CR1-KO mice, PLX-5622 treatment in the diabetic hCX3CR1I249/M280 retina (10.198 ± 3.355) did not significantly alter the percent of fibrinogen deposition in comparison to their diabetic, normal chow hCX3CR1I249/M280 (8.913 ± 4.469) control (Figures 5B, D).
Microglia support tissue homeostasis to include, synaptic pruning and rewiring via complement mediated deposition, the secretion of neurotrophic factors to promote in the survival and maintenance of neurons, immune surveillance and phagocytosis, vascular remodeling and the secretion of factors to support myelinogenesis and oligodendrocyte progenitor cell (OPC) maintenance. As notably plastic cells, the various roles microglia perform are largely governed by their activation state (40, 41). Under steady-state conditions, microglia maintain a ramified morphology, with small cell bodies and long cellular processes that they use to extend and retract to survey the CNS (42). Under diseased conditions or when microglia receive environmental cues of stress, microglia will acquire an amoeboid morphology more consistent with the morphology of phagocytic macrophages (42). These two morphologies of microglial activation initially described as “M1”, proinflammatory microglia, or “M2”, anti-inflammatory microglia (43) do not recapitulate their range of functions and it is now understood that microglia responses involve a spectrum of phenotypic and ‘omics’ changes (transcriptomics, proteomics, or metabolomics). Of the many variables regulating microglia inflammatory states, CX3CR1-FKN signaling has been shown to be heavily involved in regulating microglial responses in the retina to include vasoregulation, vascular damage, neuronal cell loss and proinflammatory cytokine production (6, 14, 19). Here we show that microglial depletion mediated by PLX-5622 is not 100% effective in the retina and that decreased microglial densities appear neuroprotective in CX3CR1-WT retinas but not in CX3CR1-KO or hCX3CR1I249/M280 mice (Figure 6). However, based on other studies it is likely that the microglia population detected after depletion arises from a depletion-resistant pool with phenotypic features that resembled their ancestor.
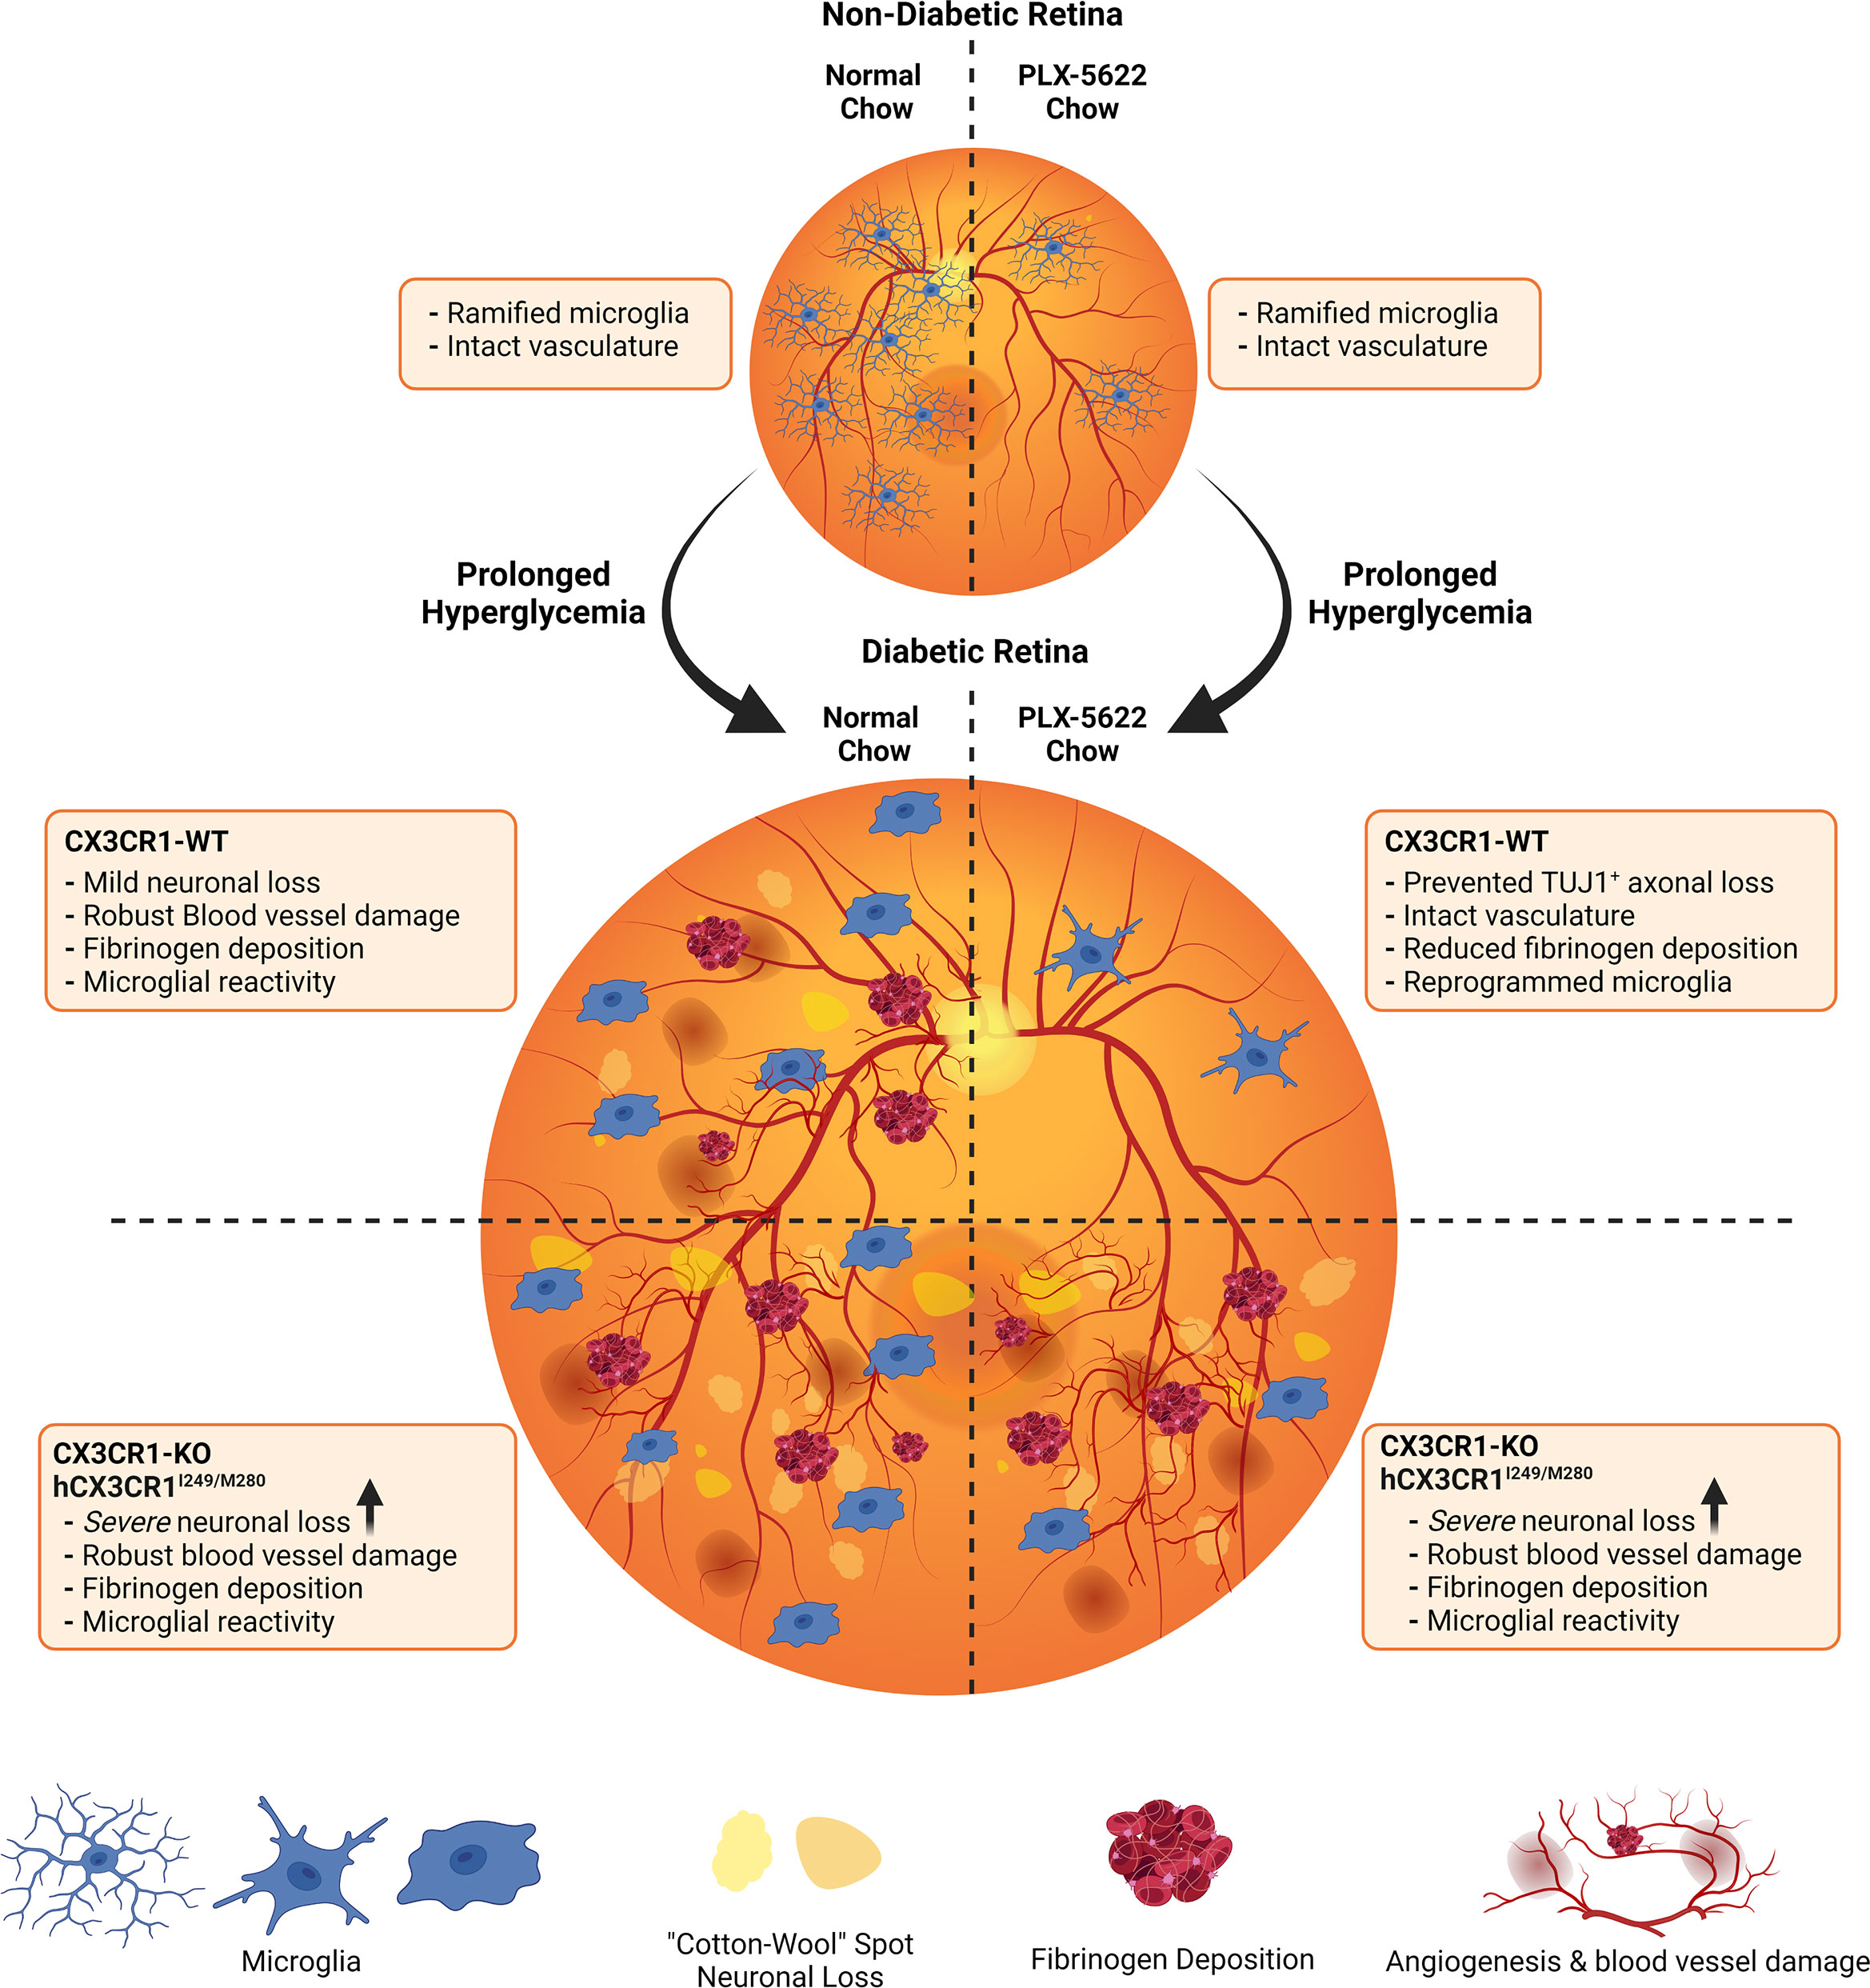
Figure 6 Schematic summary: Pharmacological depletion of microglia alleviates neuronal and vascular damage in the diabetic CX3CR1-WT retina but not in CX3CR1-KO or hCX3CR1I249/M280-expressing retina. In the non-diabetic retina, normal chow and PLX-5622 chow treated CX3CR1-WT, CX3CR1-KO, and hCX3CR1I249/M280 mice have intact vasculature and ramified microglia. PLX-5622 chow treatment induces robust microglia depletion in CX3CR1-WT, CX3CR1-KO, and hCX3CR1I249/M280 mice. Prolonged hyperglycemia results in angiogenesis, vascular damage and fibrinogen deposition in CX3CR1-WT, CX3CR1-KO, and hCX3CR1I249/M280 mice. Additionally, diabetic CX3CR1-KO, and hCX3CR1I249/M280 mice are more susceptible to neuronal and axonal loss. CSF-1R antagonism alleviates vascular damage and fibrinogen deposition and prevents neuronal loss in the diabetic CX3CR1-WT retina. In contrast, CSF-1R antagonism in CX3CR1-KO, and hCX3CR1I249/M280 mice does not prevent vascular damage, fibrinogen deposition and neuronal loss.
CX3CR1 deficiency has been shown to lead to a robust increase in proinflammatory gene expression including Il1β and Nos2 in models of systemic endotoxemia (19). To validate that these effects were CX3CR1-dependent, and to further characterize CX3CR1-variants in neurodegeneration and vascular damage in DR, we assessed the effect of LPS-mediated inflammation in the hCX3CR1I249/M280 retina (Figure 1). Consistent with previously published studies in the diabetic retina in CX3CR1-KO mice, LPS-induced acute inflammation (4d LPS treatment) in hCX3CR1I249/M280 expressing mice, revealed increased angiogenesis and abundant microglia clustering around the vasculature (Figure 1) (19). In addition to these pathological changes, RT-qPCR analysis showed significant increases in gene expression for proinflammatory genes in hCX3CR1I249/M280 mice in comparison to LPS-treated CX3CR1-WT mice (Figure 1).
In the diabetic retina, vascular damage leads to leakage of serum proteins and danger associated molecular patterns (DAMPs) and a decrease in neuronal derived CX3CL1 (fractalkine), creating a loop of inflammation perpetuated by microglia pro-inflammatory cytokine production (14, 19, 44). Furthermore, diabetic CX3CR1-KO and hCX3CR1I249/M280 mice were shown to exhibit greater neuronal cell loss, increased vascular damage, and elevated proinflammatory cytokine production (Figures 4, 5) (19). In addition to a heightened proinflammatory response in diabetic CX3CR1-KO mice, previous studies showed that CX3CR1-KO microglia display a gene signature of premature ageing, with an increased expression of proinflammatory genes under naïve conditions that is further amplified with LPS treatment (45). We recently reported that transient microglia depletion and repopulation utilizing the genetic CX3CR1CreER:R26iDTR model of microglia depletion prevented NeuN+RBPMS+ retinal ganglion cell and TUJ1+ axonal loss and alleviated vascular damage in the diabetic retina (26). This study revealed that in mice that retain functional CX3CR1-FKN signaling, microglia can be reprogrammed to be protective in the diabetic retina (26). However, CSF-1R antagonism in diabetic CX3CR1-KO and hCX3CR1I249/M280 mice did not alleviate TUJ1+ axonal loss nor vascular damage in contrast to CX3CR1-WT mice (Figures 4, 5). PLX-5622 treatment at doses used here does not induce 100% microglia ablation in CX3CR1-WT, CX3CR1-KO and hCX3CR1I249/M280 mice (Figures 3B, D). Since microglia depletion was shown to reset the microglia gene signature to mirror the ND transcriptome, CX3CR1-WT microglia repopulate from a homeostatic microglia cell population that elicits neuro- and vasculo-protective effects in the diabetic retina (26). However, due to their underlying proinflammatory gene signature, CX3CR1-KO and hCX3CR1I249/M280 microglia replenish from a retinal microglia population resistant to depletion that sustain a pro-inflammatory environment. Moreover, the morphology of microglia resistant to depletion was representative of amoeboid microglia with retracted cellular processes and larger cell bodies in all genotypes (Figures 3C, E). However, due to the protective effects PLX-5622 treatment caused in CX3CR1-WT mice, the morphology of microglia does not correlate to the neuro- and vasculo-protective effects of microglia. Together these data suggest that the CX3CR1-WT microglia population resistant to depletion acquire a homeostatic profile.
Previous studies revealed that CX3CR1 deficiency in diabetic mice is associated with enhanced neuronal and axonal loss (14, 19). Four months diabetic hCX3CR1I249/M280 mice were significantly more susceptible to NeuN+ neuronal cell death, microgliosis and astrogliosis in comparison to 4 months diabetic CX3CR1-WT mice (Figure 2). Consistent with exacerbated neuronal loss in 4 months diabetic hCX3CR1I249/M280 mice, 10-weeks diabetic CX3CR1-KO and hCX3CR1I249/M280 mice revealed significantly more TUJ1+ axonal loss in comparison to CX3CR1-WT mice (Figures 4A, C). PLX-5622 treatment in diabetic CX3CR1-WT mice prevented TUJ1+ axonal loss (Figures 4A, C). In contrast to these results, CSF-1R antagonism had no effect on TUJ1+ axonal loss in diabetic CX3CR1-KO and hCX3CR1I249/M280 mice (Figures 4A, C). It is likely that the homeostatic phenotype of CX3CR1-WT microglia is responsible for production of neuroprotective mediators. We recently showed that CSF-1R antagonism in CX3CR1-WT mice was correlated with a significant reduction in expression of complement-associated genes and an increase in keratin gene expression, supporting the neuroprotective effects we see in PLX-5622 treated CX3CR1-WT mice (Figures 4A, C) (26). This neuro-protective gene expression in PLX-5622 treated CX3CR1-WT mice was sustained when microglia were allowed to repopulate, indicating that replenished CX3CR1-WT microglia retain a homeostatic gene profile (26). We hypothesized that the CX3CR1-deficient microglia that remain in the retina following PLX-5622 treatment, due to their proinflammatory profile will have limited capacity to support neuronal loss. Microglia repopulation was shown to be CX3CR1-FKN dependent (27). Microglial cells present in the retina after PLX-5622 treatment in CX3CR1-KO mice revealed a significant decrease in branch points, dendritic segment per cell and microglial repopulation-proliferation fewer rates (27). Intravitreal delivery of soluble CX3CL1 in the CX3CR1-HET retina significantly increased microglia repopulation-proliferation rates in PLX-5622 treated CX3CR1-HET mice, whereas CX3CL1 treatment in CX3CR1-KO mice had no effect on microglia repopulation-proliferation in PLX-5622 treated CX3CR1-KO retinas (27). Future studies to investigate the effects of microglia repopulation in the diabetic CX3CR1-KO and hCX3CR1I249/M280 retina will further elucidate the role of FKN on microglial repopulation under diseased conditions. In addition to FKN-dependent repopulation, intravitreal FKN delivery in diabetic FKN-KO mice also reduces neuronal cell loss and Iba1+ microgliosis in the diabetic retina (19). Thus, the prevention of neuronal and axonal loss in PLX-5622 treated diabetic CX3CR1-WT reveals that CX3CR1-FKN signaling is necessary to induce neuroprotective cues in depletion-induced reprogramming of microglia.
Vasoregulation was shown to be altered in the early diabetic rat retina and was dependent on fractalkine-induced restriction at sites of microglial-capillary contact and pharmacological inhibition of CX3CR1 prevented fractalkine-induced vaso-restriction (6). Our data complements these findings and revealed that PLX-5622 treated non-diabetic CX3CR1-KO and hCX3CR1I249/M280 had an increase in fibrinogen deposition (Figure 5). In the diabetic CX3CR1-WT retina, CSF-1R antagonism reduced angiogenesis and fibrinogen deposition (Figure 5). PLX-5622 treatment in diabetic CX3CR1-KO mice had no effect on angiogenesis but led to a significant reduction in fibrinogen deposition (Figure 5). However, PLX-5622 treatment did not alleviate angiogenesis nor fibrinogen deposition in the diabetic hCX3CR1I249/M280 retina (Figure 5). These findings reveal that receptor variants behave differently in terms of vascular pathology compared to CX3CR1-KO mice, indicating that hCX3CR1I249/M280 mice provide a complementary model to study the CX3CR1-FKN signaling axis in regard to vascular abnormalities.
To further validate the findings in hCX3CR1I249/M280 mice and to ensure that the observed effects in hCX3CR1I249/M280 mice were not due to the presence of human CX3CR1 in the mouse loci, we characterized the effects of either the I250 (mCX3CR1I250/WT) or M281 (mCX3CR1M281/WT) polymorphism in the mouse CX3CR1 loci in the diabetic murine retina (Supplementary Figures 3-6). The phenotype in these mice (mCX3CR1I250/WT and mCX3CR1M281/WT) closely resembled the phenotype of the humanized model hCX3CR1I249/M280 mice. Surprisingly, PLX-5622 treatment in diabetic mCX3CR1I250/WT and mCX3CR1M281/WT led to a 100% depletion of Iba1+ cells in the retina (Supplementary Figure 3B–D). These findings indicate that the presence of these polymorphisms strongly affects retinal microglial sensitivity to CSF-1R blockade.
Overall, this study reveals that the protective effects of microglia depletion in CX3CR1-WT mice are CX3CR1-dependent as microglia depletion in CX3CR1-KO and hCX3CR1I249/M280 mice did not alleviate retinal degeneration. We characterized the humanized hCX3CR1I249/M280-expressing mice for the first time in the murine STZ model of diabetes. Our data revealed that PLX-5622 treated CX3CR1-KO microglial vascular responses diverge from hCX3CR1I249/M280, mCX3CR1I250/WT and mCX3CR1M281/WT microglial responses. These findings indicate that utilizing hCX3CR1I249/M280 mice in studies assessing CX3CR1-FKN signaling effects on the vasculature, represent a complementary model to study dysregulated CX3CR1-FKN signaling. Strategies to alter microglial densities in the human population may not be beneficial as we did not detect neuro- or vasculo-protection in PLX-5622 treated hCX3CR1I249/M280, mCX3CR1I250/WT and mCX3CR1M281/WT mice. Future studies to analyze the transcriptional changes of homeostatic, and repopulated microglia from CX3CR1-WT, CX3CR1-KO, FKN-KO and hCX3CR1I249/M280 mice will be valuable to further define the mechanisms by which FKN exerts its regulatory roles in the diabetic retina.
The original contributions presented in the study are included in the article/supplementary material, further inquiries can be directed to the corresponding author.
The animal study was reviewed and approved by University of Texas at San Antonio Institutional Animal Care and Use Committee. Written informed consent was obtained from the owners for the participation of their animals in this study.
AEC developed the concept of the study. AEC and KC designed experiments, analyzed and interpreted data and wrote the manuscript. Research development and data acquisition was performed by KC, DR, AM, DV, IG, IT, AA, PV, and SC. SG, AC, RR, and TK interpreted data and advised in manuscript preparation. All authors contributed to the article and approved the submitted version.
This study was supported in part by funds from the NIH grant R01EY029913 and the Jane and Roland Blumberg Professorship in Biology to AEC, and UTSA RISE-PhD Program grant GM060655 to KAC.
We recognized the UTSA Cell Analysis core for confocal microscopy support.
Author SG was employed by Biogen, Cambridge, MA, and is currently employed by Cerevel Therapeutics, Cambridge, MA. Author ACC is employed full-time by Biogen, Cambridge, MA. Author RR was employed full-time by Biogen, Cambridge, MA, and currently employed full-time by Third Rock Ventures, Boston, MA.
The remaining authors declare that the research was conducted in the absence of any commercial or financial relationships that could be construed as a potential conflict of interest.
All claims expressed in this article are solely those of the authors and do not necessarily represent those of their affiliated organizations, or those of the publisher, the editors and the reviewers. Any product that may be evaluated in this article, or claim that may be made by its manufacturer, is not guaranteed or endorsed by the publisher.
The Supplementary Material for this article can be found online at: https://www.frontiersin.org/articles/10.3389/fimmu.2023.1130735/full#supplementary-material
Supplementary Figure 1 | Acute LPS-induced inflammation in the hCX3CR1I249/M280 retina. (A) Schematic displaying the experimental method used to image whole retinas in all the studies presented. Retinas were divided into 4 sections, each containing central, medial and peripheral regions of the retina. Two images per retinal region were acquired for a total of 6 images per retina. (B, D), hCX3CR1I249/M280 mice were i.p. injected with 0.08mg/Kg LPS once daily for four days (4d), and naïve age-matched controls received PBS. Graphical representation for RT-qPCR analysis of retinas for relative mRNA expression for Il1β (B), Il6 (C) and Nos2 (D). Data show mean ± SD, n = 3 mice per group where each dot represents an individual mouse. *P<0.05, ***P<0.001 using Student’s t-test, with Welch’s correction.
Supplementary Figure 2 | PLX-5622 treatment does not prevent TUJ1+ axonal loss or vascular damage in the CX3CR1-KO and hCX3CR1I249/M280 retina. (A) Experimental design to pharmacologically deplete microglia in non-diabetic and 8-wks diabetic CX3CR1-WT, CX3CR1-KO, and hCX3CR1I249/M280 mice for two weeks. Non-diabetic control mice received citrate buffer. Non-depleted, non-diabetic and diabetic controls remained on normal chow. (B, C), Merged confocal images of retinal tissues stained for TUJ1 (turquoise) and GFAP (magenta) (B) and CD31 (red) and fibrinogen (green) (C) in CX3CR1-WT, CX3CR1-KO and hCX3CR1I249/M280 mice. Confocal images represent the peripheral retina. Scale bars measure 50µm.
Supplementary Figure 3 | CSF-1R antagonism induces 100% microglia depletion in the mCX3CR1I250/WT and mCX3CR1M281/WT diabetic retina. Microglia were pharmacologically depleted using PLX-5622 in non-diabetic and 8-wks diabetic CX3CR1-WT, mCX3CR1I250/WT and mCX3CR1M281/WT mice for two weeks. Non-diabetic control mice received citrate buffer. Non-depleted, non-diabetic and diabetic controls remained on normal chow. Confocal images of retinal tissues stained for Iba1 (green) (A) and transformation index cellular tracings (B) in CX3CR1-WT, mCX3CR1I250/WT and mCX3CR1M281/WT mice. Confocal images represent the retinal ganglion cell layer in the peripheral retina. (C, D), Quantification of retinal IHC analysis for Iba1+ cells/mm3 (C) and transformation index (D). Data show the average of the 2 central, 2 medial and 2 peripheral images taken per mouse. Data show mean ± SD, n = 6 to 10 mice per group where each dot represents an individual mouse (C). Transformation index data show mean ± SD n = 52 to 150 microglia per group for n=5 mice where each dot represents an individual microglia cell (D). *P<0.05, **P<0.01, ***P<0.001 ****P<0.0001 using 2-way ANOVA. Scale bars measure 50µm.
Supplementary Figure 4 | PLX-5622 treatment does not prevent TUJ1+ axonal loss in the diabetic mCX3CR1I250/WT and mCX3CR1M281/WT retina. Microglia were pharmacologically depleted using PLX-5622 in non-diabetic and 8-wks diabetic CX3CR1-WT, mCX3CR1I250/WT and mCX3CR1M281/WT mice for two weeks. Non-diabetic control mice received citrate buffer. Non-depleted, non-diabetic and diabetic controls remained on normal chow. Confocal images of retinal tissues stained for TUJ1 (turquoise) (A) and GFAP (magenta) (B) in CX3CR1-WT, mCX3CR1I250/WT and mCX3CR1M281/WT mice. Confocal images represent the retinal ganglion cell layer in the peripheral retina. (C, D), Quantification of retinal IHC analysis for TUJ1+ percent immunoreactive area (C) and GFAP+ percent immunoreactive area (D). Data show the average of the 2 central, 2 medial and 2 peripheral images taken per mouse. Data show mean ± SD, n = 4 to 10 mice per group where each dot represents an individual mouse. *P<0.05, **P<0.01, ***P<0.001 ****P<0.0001 using 2-way ANOVA. Scale bars measure 50µm.
Supplementary Figure 5 | PLX-5622 treatment does not alleviate vascular damage in the diabetic mCX3CR1I250/WT and mCX3CR1M281/WT retina. Microglia were pharmacologically depleted using PLX-5622 in non-diabetic and 8-wks diabetic CX3CR1-WT, mCX3CR1I250/WT and mCX3CR1M281/WT mice for two weeks. Non-diabetic control mice received citrate buffer. Non-depleted, non-diabetic and diabetic controls remained on normal chow. Confocal images of retinal tissues stained for CD31 (red) (A) and fibrinogen (white) (B) in CX3CR1-WT, mCX3CR1I250/WT and mCX3CR1M281/WT mice. Confocal images represent the retinal ganglion cell layer in the peripheral retina. (C, D), Quantification of retinal IHC analysis for CD31+ percent immunoreactive area (C) and fibrinogen+ percent immunoreactive area (D). Data show the average of the 2 central, 2 medial and 2 peripheral images taken per mouse. Data show mean ± SD, n = 4 to 10 mice per group where each dot represents an individual mouse. *P<0.05, **P<0.01, ***P<0.001 ****P<0.0001 using 2-way ANOVA. Scale bars measure 50µm.
Supplementary Figure 6 | PLX-5622 treatment does not prevent TUJ1+ axonal loss or vascular damage in the diabetic mCX3CR1I250/WT and mCX3CR1M281/WT retina. (A) Experimental design to pharmacologically deplete microglia in non-diabetic and 8-wks diabetic CX3CR1-WT, mCX3CR1I250/WT and mCX3CR1M281/WT mice for two weeks. Non-diabetic control mice received citrate buffer. Non-depleted, non-diabetic and diabetic controls remained on normal chow. (B, C), Merged confocal images of retinal tissues stained for TUJ1 (turquoise) and GFAP (magenta) (B) and CD31 (red) and fibrinogen (green) (C) in CX3CR1-WT, mCX3CR1I250/WT and mCX3CR1M281/WT mice. Confocal images represent the peripheral retina. Scale bars measure 50µm.
1. Cecilia OM, José Alberto CG, José NP, Ernesto Germán CM, Ana Karen LC, Luis Miguel RP, et al. Oxidative stress as the main target in diabetic retinopathy pathophysiology. J Diabetes Res (2019) 2019:8562408. doi: 10.1155/2019/8562408
2. Ren J, Zhang S, Pan Y, Jin M, Li J, Luo Y, et al. Diabetic retinopathy: Involved cells, biomarkers, and treatments. Front Pharmacol (2022) 13:953691. doi: 10.3389/fphar.2022.953691
3. McLeod D. Why cotton wool spots should not be regarded as retinal nerve fibre layer infarcts. Br J Ophthalmol (2005) 89(2):229–37. doi: 10.1136/bjo.2004.058347
4. Wang W, Lo ACY. Diabetic retinopathy: Pathophysiology and treatments. Int J Mol Sci (2018) 19(6). doi: 10.3390/ijms19061816
5. Ibrahim AS, El-Shishtawy MM, Peña A Jr., Liou GI. Genistein attenuates retinal inflammation associated with diabetes by targeting of microglial activation. Mol Vis (2010) 16:2033–42. Available at: https://www.molvis.org/molvis/v16/a219/.
6. Mills SA, Jobling AI, Dixon MA, Bui BV, Vessey KA, Phipps JA, et al. Fractalkine-induced microglial vasoregulation occurs within the retina and is altered early in diabetic retinopathy. Proc Natl Acad Sci U.S.A. (2021) 118(51). doi: 10.1073/pnas.2112561118
7. Grigsby JG, Cardona SM, Pouw CE, Muniz A, Mendiola AS, Tsin AT, et al. The role of microglia in diabetic retinopathy. J Ophthalmol (2014) 2014:705783. doi: 10.1155/2014/705783
8. Merlini M, Rafalski VA, Rios Coronado PE, Gill TM, Ellisman M, Muthukumar G, et al. Fibrinogen induces microglia-mediated spine elimination and cognitive impairment in an alzheimer's disease model. Neuron (2019) 101(6):1099–108.e6. doi: 10.1016/j.neuron.2019.01.014
9. Petersen MA, Ryu JK, Akassoglou K. Fibrinogen in neurological diseases: mechanisms, imaging and therapeutics. Nat Rev Neurosci (2018) 19(5):283–301. doi: 10.1038/nrn.2018.13
10. Davalos D, Ryu JK, Merlini M, Baeten KM, Le Moan N, Petersen MA, et al. Fibrinogen-induced perivascular microglial clustering is required for the development of axonal damage in neuroinflammation. Nat Commun (2012) 3:1227. doi: 10.1038/ncomms2230
11. Davalos D, Akassoglou K. Fibrinogen as a key regulator of inflammation in disease. Semin Immunopathol (2012) 34(1):43–62. doi: 10.1007/s00281-011-0290-8
12. Cardona AE, Pioro EP, Sasse ME, Kostenko V, Cardona SM, Dijkstra IM, et al. Control of microglial neurotoxicity by the fractalkine receptor. Nat Neurosci (2006) 9(7):917–24. doi: 10.1038/nn1715
13. Bhaskar K, Konerth M, Kokiko-Cochran ON, Cardona A, Ransohoff RM, Lamb BT. Regulation of tau pathology by the microglial fractalkine receptor. Neuron (2010) 68(1):19–31. doi: 10.1016/j.neuron.2010.08.023
14. Cardona SM, Mendiola AS, Yang YC, Adkins SL, Torres V, Cardona AE. Disruption of fractalkine signaling leads to microglial activation and neuronal damage in the diabetic retina. ASN Neuro. (2015) 7(5). doi: 10.1177/1759091415608204
15. Combadière C, Feumi C, Raoul W, Keller N, Rodéro M, Pézard A, et al. CX3CR1-dependent subretinal microglia cell accumulation is associated with cardinal features of age-related macular degeneration. J Clin Invest. (2007) 117(10):2920–8. doi: 10.1172/JCI31692
16. Yeo SI, Kim JE, Ryu HJ, Seo CH, Lee BC, Choi IG, et al. The roles of fractalkine/CX3CR1 system in neuronal death following pilocarpine-induced status epilepticus. J Neuroimmunol (2011) 234(1-2):93–102. doi: 10.1016/j.jneuroim.2011.03.005
17. McDermott DH, Fong AM, Yang Q, Sechler JM, Cupples LA, Merrell MN, et al. Chemokine receptor mutant CX3CR1-M280 has impaired adhesive function and correlates with protection from cardiovascular disease in humans. J Clin Invest. (2003) 111(8):1241–50. doi: 10.1172/JCI16790
18. Moatti D, Faure S, Fumeron F, Amara Mel W, Seknadji P, McDermott DH, et al. Polymorphism in the fractalkine receptor CX3CR1 as a genetic risk factor for coronary artery disease. Blood (2001) 97(7):1925–8. doi: 10.1182/blood.V97.7.1925
19. Mendiola AS, Garza R, Cardona SM, Mythen SA, Lira SA, Akassoglou K, et al. Fractalkine signaling attenuates perivascular clustering of microglia and fibrinogen leakage during systemic inflammation in mouse models of diabetic retinopathy. Front Cell Neurosci (2016) 10:303. doi: 10.3389/fncel.2016.00303
20. Cardona SM, Kim SV, Church KA, Torres VO, Cleary IA, Mendiola AS, et al. Role of the fractalkine receptor in CNS autoimmune inflammation: New approach utilizing a mouse model expressing the human CX3CR1(I249/M280) variant. Front Cell Neurosci (2018) 12:365. doi: 10.3389/fncel.2018.00365
21. Mendiola AS, Church KA, Cardona SM, Vanegas D, Garcia SA, Macklin W, et al. Defective fractalkine-CX3CR1 signaling aggravates neuroinflammation and affects recovery from cuprizone-induced demyelination. J Neurochem (2022) 162(5):430–43. doi: 10.1111/jnc.15616
22. Okunuki Y, Mukai R, Pearsall EA, Klokman G, Husain D, Park DH, et al. Microglia inhibit photoreceptor cell death and regulate immune cell infiltration in response to retinal detachment. Proc Natl Acad Sci U S A. (2018) 115(27):E6264–e73. doi: 10.1073/pnas.1719601115
23. Spangenberg E, Severson PL, Hohsfield LA, Crapser J, Zhang J, Burton EA, et al. Sustained microglial depletion with CSF1R inhibitor impairs parenchymal plaque development in an alzheimer's disease model. Nat Commun (2019) 10(1):3758. doi: 10.1038/s41467-019-11674-z
24. Fu H, Zhao Y, Hu D, Wang S, Yu T, Zhang L. Depletion of microglia exacerbates injury and impairs function recovery after spinal cord injury in mice. Cell Death Dis (2020) 11(7):528. doi: 10.1038/s41419-020-2733-4
25. Hilla AM, Diekmann H, Fischer D. Microglia are irrelevant for neuronal degeneration and axon regeneration after acute injury. J Neurosci (2017) 37(25):6113–24. doi: 10.1523/JNEUROSCI.0584-17.2017
26. Church KA, Rodriguez D, Vanegas D, Gutierrez IL, Cardona SM, Madrigal JLM, et al. Models of microglia depletion and replenishment elicit protective effects to alleviate vascular and neuronal damage in the diabetic murine retina. J Neuroinflammation. (2022) 19(1):300. doi: 10.1186/s12974-022-02659-9
27. Zhang Y, Zhao L, Wang X, Ma W, Lazere A, Qian HH, et al. Repopulating retinal microglia restore endogenous organization and function under CX3CL1-CX3CR1 regulation. Sci Adv (2018) 4(3):eaap8492. doi: 10.1126/sciadv.aap8492
28. Zhou K, Han J, Lund H, Boggavarapu NR, Lauschke VM, Goto S, et al. An overlooked subset of Cx3cr1(wt/wt) microglia in the Cx3cr1(CreER-eyfp/wt) mouse has a repopulation advantage over Cx3cr1(CreER-eyfp/wt) microglia following microglial depletion. J Neuroinflammation. (2022) 19(1):20. doi: 10.1186/s12974-022-02381-6
29. Bertoni AG, Saydah S, Brancati FL. Diabetes and the risk of infection-related mortality in the U.S. diabetes care. (2001) 24(6):1044–9. doi: 10.2337/diacare.24.6.1044
30. Le May C, Chu K, Hu M, Ortega CS, Simpson ER, Korach KS, et al. Estrogens protect pancreatic beta-cells from apoptosis and prevent insulin-deficient diabetes mellitus in mice. Proc Natl Acad Sci U S A. (2006) 103(24):9232–7. doi: 10.1073/pnas.0602956103
31. Deeds MC, Anderson JM, Armstrong AS, Gastineau DA, Hiddinga HJ, Jahangir A, et al. Single dose streptozotocin-induced diabetes: considerations for study design in islet transplantation models. Lab Anim. (2011) 45(3):131–40. doi: 10.1258/la.2010.010090
32. Wang-Fischer Y, Garyantes T. Improving the reliability and utility of streptozotocin-induced rat diabetic model. J Diabetes Res (2018) 2018:8054073. doi: 10.1155/2018/8054073
33. Krady JK, Basu A, Allen CM, Xu Y, LaNoue KF, Gardner TW, et al. Minocycline reduces proinflammatory cytokine expression, microglial activation, and caspase-3 activation in a rodent model of diabetic retinopathy. Diabetes (2005) 54(5):1559–65. doi: 10.2337/diabetes.54.5.1559
35. Raduolovic K, Mak'Anyengo R, Kaya B, Steinert A, Niess JH. Injections of lipopolysaccharide into mice to mimic entrance of microbial-derived products after intestinal barrier breach. J Vis Exp (2018) 135). doi: 10.3791/57610
36. Chen Z, Jalabi W, Shpargel KB, Farabaugh KT, Dutta R, Yin X, et al. Lipopolysaccharide-induced microglial activation and neuroprotection against experimental brain injury is independent of hematogenous TLR4. J Neurosci (2012) 32(34):11706–15. doi: 10.1523/JNEUROSCI.0730-12.2012
37. Sarker B, Cardona SM, Church KA, Vanegas D, Velazquez P, Rorex C, et al. Defibrinogenation ameliorates retinal microgliosis and inflammation in a CX3CR1-independent manner. ASN Neuro. (2022) 14:17590914221131446. doi: 10.1177/17590914221131446
38. Raetzsch CF, Brooks NL, Alderman JM, Moore KS, Hosick PA, Klebanov S, et al. Lipopolysaccharide inhibition of glucose production through the toll-like receptor-4, myeloid differentiation factor 88, and nuclear factor kappa b pathway. Hepatology (2009) 50(2):592–600. doi: 10.1002/hep.22999
39. Fujita H, Tanaka J, Toku K, Tateishi N, Suzuki Y, Matsuda S, et al. Effects of GM-CSF and ordinary supplements on the ramification of microglia in culture: a morphometrical study. Glia (1996) 18(4):269–81. doi: 10.1002/(SICI)1098-1136(199612)18:4<269::AID-GLIA2>3.0.CO;2-T
40. Lier J, Streit WJ, Bechmann I. Beyond activation: Characterizing microglial functional phenotypes. Cells (2021) 10(9). doi: 10.3390/cells10092236
41. Zhang L, Zhang J, You Z. Switching of the microglial activation phenotype is a possible treatment for depression disorder. Front Cell Neurosci (2018) 12:306. doi: 10.3389/fncel.2018.00306
42. Han J, Zhu K, Zhang XM, Harris RA. Enforced microglial depletion and repopulation as a promising strategy for the treatment of neurological disorders. Glia (2019) 67(2):217–31. doi: 10.1002/glia.23529
43. Dudvarski Stankovic N, Teodorczyk M, Ploen R, Zipp F, Schmidt MHH. Microglia-blood vessel interactions: a double-edged sword in brain pathologies. Acta Neuropathol. (2016) 131(3):347–63. doi: 10.1007/s00401-015-1524-y
44. Jiang M, Xie H, Zhang C, Wang T, Tian H, Lu L, et al. Enhancing fractalkine/CX3CR1 signalling pathway can reduce neuroinflammation by attenuating microglia activation in experimental diabetic retinopathy. J Cell Mol Med (2022) 26(4):1229–44. doi: 10.1111/jcmm.17179
45. Gyoneva S, Hosur R, Gosselin D, Zhang B, Ouyang Z, Cotleur AC, et al. Cx3cr1-deficient microglia exhibit a premature aging transcriptome. Life Sci Alliance (2019) 2(6). doi: 10.26508/lsa.201900453
Keywords: microglia, depletion, CX3CR1 chemokine receptor, diabetic retinopathy, inflammation
Citation: Church KA, Rodriguez D, Mendiola AS, Vanegas D, Gutierrez IL, Tamayo I, Amadu A, Velazquez P, Cardona SM, Gyoneva S, Cotleur AC, Ransohoff RM, Kaur T and Cardona AE (2023) Pharmacological depletion of microglia alleviates neuronal and vascular damage in the diabetic CX3CR1-WT retina but not in CX3CR1-KO or hCX3CR1I249/M280-expressing retina. Front. Immunol. 14:1130735. doi: 10.3389/fimmu.2023.1130735
Received: 23 December 2022; Accepted: 28 February 2023;
Published: 22 March 2023.
Edited by:
Lindsay B. Nicholson, University of Bristol, United KingdomReviewed by:
Sarah Elaine Webster, Western Michigan University, United StatesCopyright © 2023 Church, Rodriguez, Mendiola, Vanegas, Gutierrez, Tamayo, Amadu, Velazquez, Cardona, Gyoneva, Cotleur, Ransohoff, Kaur and Cardona. This is an open-access article distributed under the terms of the Creative Commons Attribution License (CC BY). The use, distribution or reproduction in other forums is permitted, provided the original author(s) and the copyright owner(s) are credited and that the original publication in this journal is cited, in accordance with accepted academic practice. No use, distribution or reproduction is permitted which does not comply with these terms.
*Correspondence: Astrid E. Cardona, YXN0cmlkLmNhcmRvbmFAdXRzYS5lZHU=
†Present address: Andrew S. Mendiola, Gladstone Institute of Neurological Disease San Francisco, CA, United States
Richard M. Ransohoff, Third Rock Ventures, Boston, MA, United States
Disclaimer: All claims expressed in this article are solely those of the authors and do not necessarily represent those of their affiliated organizations, or those of the publisher, the editors and the reviewers. Any product that may be evaluated in this article or claim that may be made by its manufacturer is not guaranteed or endorsed by the publisher.
Research integrity at Frontiers
Learn more about the work of our research integrity team to safeguard the quality of each article we publish.