 Changjie Yang1†
 Qiwei Qian2†
 Yudong Zhao1†
 Bingyuan Huang2Ruilin Chen2
 Qiyu Gong3Hao Ji1
 Chenchen Wang1Lei Xia1
 Zhengrui You2Jianjun Zhang1*
 Xiaosong Chen1*
- 1Department of Liver Surgery, Ren Ji Hospital, Shanghai Jiao Tong University, Shanghai, China
- 2Division of Gastroenterology and Hepatology, Ren Ji Hospital, Shanghai Jiao Tong University, Shanghai, China
- 3Shanghai Institute of Immunology, Shanghai Jiao Tong University, Shanghai, China
Background and aims: The key role of tissue-resident memory T (TRM) cells in the immune regulation of hepatocellular carcinoma (HCC) has been investigated and reported, but the regulatory mechanism of tumor microenvironment on TRM cells is still unclear. Lymphocyte activating gene 3 (LAG-3) is a promising next-generation immune checkpoint that is continuously expressed due to persistent antigen exposure in the tumor microenvironment. Fibrinogen-like protein 1 (FGL1) is a classical ligand of LAG-3 and can promote T cell exhaustion in tumors. Here, we excavated the effect of FGL1-LAG3 regulatory axis on TRM cells in HCC.
Methods: The function and phenotype of intrahepatic CD8+ TRM cells in 35 HCC patients were analyzed using multicolor flow cytometry. Using a tissue microarray of 80 HCC patients, we performed the prognosis analysis. Moreover, we investigated the suppressive effect of FGL1 on CD8+ TRM cells both in in vitro induction model and in vivo orthotopic HCC mouse model.
Results: There was an increase in LAG3 expression in CD8+ TRM cells in end-stage HCC; moreover, FGL1 levels were negatively correlated with CD103 expression and related to poor outcomes in HCC. Patients with high CD8+ TRM cell proportions have better outcomes, and FGL1-LAG3 binding could lead to the exhaustion of CD8+ TRM cells in tumors, indicating its potential as a target for immune checkpoint therapy of HCC. Increased FGL1 expression in HCC may result in CD8+ TRM cell exhaustion, causing tumor immune escape.
Conclusions: We identified CD8+TRM cells as a potential immunotherapeutic target and reported the effect of FGL1-LAG3 binding on CD8+ TRM cell function in HCC.
Introduction
Hepatocellular carcinoma (HCC) is an increasing global concern, ranking sixth in incidence and third in mortality among cancers (1). Immune checkpoint blocking (ICB) therapy, which focuses on reactivating the normal functions of T-cells, is an emerging treatment for liver cancer (2). However, while anti-PD-1/anti-PD-L1 and anti-CTLA-4 monoclonal antibodies (mAbs) have shown potential in eliminating tumor growth, the long-term survival remains poor (3–5). Therefore, it is necessary to identify other immune checkpoint pathways by exploring the immune escape mechanism in depth.
TRM cells are a group of non-circulating CD8+T cells that express CD69 and CD103 surface markers and permanently reside in peripheral tissues, where they readily mediate regional tumor immune surveillance (6–8). CD8+ TRM cells are involved in many liver diseases and are necessary for the pathogeneses of primary biliary cholangitis and autoimmune hepatitis (9). TRM cells are well-known for their immune reactions against infectious diseases, and there is growing evidence that they are pivotal in suppressing solid cancer growth (10–12). TRM cells secrete cytokines to mediate CD103-enhanced tumor cell killing and maintain tumor immune surveillance (6). The dynamics of CD103+ TRM and exhausted T cells also affect patient outcomes in HCC (13). Recently, TRM cells were shown to be the first responders upon pre-surgical ICB therapy in oral squamous cell carcinoma (14). Therefore, in order to improve HCC immunotherapy, targeting CD8+ TRM cells may be a viable approach.
Lymphocyte activation gene 3 (LAG3), a transmembrane protein found predominantly in activated T cells, regulates CD8+ T-cell proliferation, activation, effector functions, and homeostasis (15–17). LAG3 is a marker of CD8+ T-cell exhaustion, which occurs in response to repetitive antigenic stimulation in chronic viral infections and cancer (18–20). Several clinical trials have evaluated the anti-tumor activity of mAbs that block the interaction between LAG3 and its classical ligands, the MHC-II molecules (19, 20). Further, TRM cells exhibit elevated LAG3 expression during viral infections; and blocking the LAG3 pathway can restore the antiviral response and improve TRM cell functions (21). Fibrinogen-like protein 1 (FGL1), an emerging hepatic factor in the fibrinogen super-family, is mainly expressed in the liver under steady-state conditions and is abundantly expressed in hepatocellular carcinoma (22, 23). Chen et al. demonstrated that FGL1 could bind to LAG3 to suppress antigen-induced T-cell responses (24). However, the mechanism through which FGL1-LAG3 binding regulates TRM cell immunity in hepatocellular carcinoma remains unclear.
Here, we investigated the effect of FGL1-LAG3 binding on CD8+ TRM cells in HCC and explore new immune checkpoint therapy for HCC patients.
Materials and methods
Tissue samples
Blood was collected from healthy human donors, while tumors and matched adjacent normal tissues were donated by patients with HCC who had undergone partial hepatectomy or orthotopic liver transplantation at Ren Ji Hospital (Shanghai Jiao Tong University, China). From June 2020 to July 2021, freshly harvested tissues (Cohort 1, n = 35) were obtained and preserved. A tumor microarray (TMA) was developed using HCC samples (Cohort 2, n = 80) obtained from May 2015 to April 2016. Relevant clinical information is shown in Supplementary Tables 1, 2. Histological diagnoses were confirmed by two pathologists. All patients provided informed written consent before surgery. Protocols regarding the application of these samples were drafted and approved by the Ethics Committee of Ren Ji Hospital (permit number: KY2020–055).
Intrahepatic lymphocyte isolation and PBMC isolation
Intrahepatic lymphocytes were segregated as previous studies (25). Liver samples were carved into small pieces, digested with 0.01% collagenase IV and tapped four times per s for 2 min using a tapping homogenizer. By gently grinding through a 70-µm cell strainer, the homogenate was segregated. After centrifuged, the cells were collected for flow cytometry. Human peripheral blood mononuclear cells (PBMCs) were isolated from fresh blood via gradient centrifugation using Ficoll–Hypaque Plus (GE Healthcare).
In vitro generation of human CD8+ TRM cells
A previously reported CD69+CD103+CD8+ TRM cell polarization assay was used in vitro (26). To further explore the influence of FGL1 on CD8+ TRM cell proliferation, FGL1 (100 nmol/mL; R&D Systems) was supplemented to the culture medium of PBMCs pretreated with IL-15 and TGF-β. Cells were harvested and assessed using flow cytometry on the sixth day.
IHC and confocal microscopy
According to the procedure described previously (27), formalin-fixed, paraffin-embedded liver tissues were used for immunohistochemistry (IHC) and immunofluorescence with the primary antibodies targeting at CD103, CD8, TGF-β, IL-15 (all anti-human, ab129202, ab17147, ab170874, ab55276, Abcam, Cambridge, United Kingdom), and FGL1 (anti-human, ab275091, Abcam; anti-mouse, 16000-1-AP, Proteintech, San Diego, CA, USA). Then information of antibodies could be found in the Supplementary table. For the quantification of IHC data in Cohort 1, five areas of each liver section were randomly selected and assessed by two independent observers. The expression of CD103+ were evaluated by calculating the number of each high-magnification field of view. The expression of FGL1 in cohort 1 was scored from 0 to 4 according to its staining density, which was averaged from five captured high-powered field. A tissue microarray (TMA) of 80 HCC tissues from cohort 2 was employed to assess the prognostic value of CD103 and FGL-1 according to the elaborated survival data. We quantified the expression of CD103 and FGL1 in each patient in TMA by measuring the number of positive cells per area (28). Confocal scans were performed using an LSM-710 laser scanning confocal microscope (Carl Zeiss, Germany).
Database
Correlations of CD103 gene expression with the genes of immune checkpoints’ ligands in HCC were estimated via tumor immune estimation resource (TIMER)database. TIMER (https://cistrome.shinyapps.io/timer/) is based on TCGA data and can be used to systematically analyze the immune infiltrates of different cancer types online.
Kaplan-Meier analysis
Survival and correlation analyses were performed based on the follow-up information from patients from cohort 2. The expression of CD103 and FGL1 was grouped into low-level, medium-level, and high-level categories according to the tri-sectional quantiles. Kaplan-Meier survival analysis (i.e., the product-limit method) was employed to assess the probability of survival based on the statistics of observed survival time. Let t(i) denote ordered event times (not counting censoring times), d(i) denote the number of events at t(i), and n(i) denote the total of alive cases, which is hence at risk before t(i). Survival probability at t is calculated using the equation below.
The R package survival and survminer were taken for KM analysis and visualization.
Cox proportional hazards model
To relate survival times and predictors, including categorical variables, such as sex, and other continuous variables, such as age, the Cox proportional hazards model was used, which does not assume the shape of the underlying hazard. Let j(i) denote a person failing at t(i) and let R(i) denote the risk set of all persons alive just before t(i). exp(xβ) indicates the relative risk for a subject with covariate values compared to a subject at baseline. The probability that the person who failed at t(i) would be j(i) conditional on the risk set is calculated using:
The R package survival (v3.2) and forest plot (v2.0.1) were used for univariate Cox analysis and visualization. The ratio of positive cells was used to calculate the Spearman covariance between CD103 and FGL1 expression. The R package ggplot2 (v3.3.5) was used for visualization.
Quantitative real-time PCR
A tissue total RNA isolation kit (Vazyme, RC112) was employed to extract total RNA from the liver tissues, while a reverse transcriptase kit (Vazyme, R323-01) was used to synthesize cDNA. RT-qPCR was conducted through the use of SYBR Premix Ex Taq (Takara) with an ABI PRISM 7900HT sequence detector. A housekeeping gene, GAPDH, was used as an endogenous control. The data were evaluated by employing the 2-ΔΔCt method. Primer sequences could be found in the table of sequence-based reagents.
Western blot
The WB was conducted as reported previously (29). Relative quantities of protein were determined by comparing to GAPDH expression and analyzed using ImageJ 1.46 r. The antibodies used were mouse anti-GAPDH (1:10,000, Abcam, ab8245), rabbit anti-TGF-β (1:1000, Abcam, ab170874), rabbit anti-IL-15 (1:1000, Abcam, ab55276), and rabbit anti-FGL1 (1:1000, Abcam, ab38007).
Flow cytometric analysis
The flow cytometric was conducted as reported previously (27). For surface staining, the cells were cultured with antibodies specific for human cell surface markers CD3, CD4, CD8, CD103, CD69, LAG-3, PD-1, TIM-3, and CTLA-4 (564713, 564724,564116, 350225, 557745, 565775, 329920,
748820, 563931, all from BD Biosciences) for 30 min at 4°C. For intracellular cytokine staining (ICS), immune cells were first incubated in complete culture medium containing a leukocyte activation cocktail with GolgiPlug (BD Biosciences) at 37°C for 5 h. The cells were then stained with surface keratin and fixed with a BD Cytofix/Cytoperm kit for 20 min at 4°C. The cells were then stained with antibodies against IFN-γ, TNF-α (563416,559321, BD Biosciences), IL-2 and granzyme B (500310, 372221, Biolegend) for 30 min at 4°C. For nuclear factor staining, the cells were first stained with surface markers and then fixed with a transcription factor buffer set (BD Biosciences) for 50 min at 4°C. Next, the cells were stained with Runx3, T-bet (564814, 564141, BD Biosciences), TOX, and Eomes (50-6502-80, 25-4875-82, eBioscience) for 50 min at 4°C. All samples were detected using flow cytometry (BD LSR Fortessa, BD LSR Fortessa X20) and analyzed using FlowJo (v10.6.2, Tree Star, Ashland, USA).
Cell culture and reagents
Hepa1-6 cells were acquired from the Type Culture Collection of the Chinese Academy of Sciences (Shanghai, China). According to manufacturer’s instructions, we transfected two short hairpin RNAs (shRNAs) targeting the Fgl1 coding sequence to inhibit the expression of FGL1, which were purchased from Shanghai Zorin Biotechnology. The cells were cultured for 5 days, and then mRNA was quantified by Western blot. The shRNA sequences could be found in the table of sequence-based reagents.
Colony formation assays
Hepa1-6 and sh-Fgl1 Hepa1-6 cells were digested using trypsin, terminated in culture medium, and resuspended after centrifugation. Cell suspensions were prepared as concentration gradient dilutions, and each group of cells was added to 6-well plates at a concentration of 20, 40, and 80 cells per well. The medium was replenished (2 ml), and the cells were incubated in the medium for two weeks. The supernatant was discarded when visible clones appeared in the culture dish. After washed three times by PBS, the cells were fixed with an appropriate amount of 4% paraformaldehyde. An appropriate amount of Gimusa staining solution was added to the cells for half an hour. The 6-well plates were then rinsed with running water. After drying, photographs of the plates were obtained. Image analysis was performed using ImageJ (v1.46)
Animal studies
Twenty male C57BL/6J mice, 6 weeks old (SIMM Animal Center, Shanghai, China), specific pathogen-free, were administered a standard diet in the laboratory and provided with sufficient water, with their accommodation conditions in accordance with laboratory standards. All experiments of mice strictly followed the ethical guidance regarding animal care and were officially approved by the Institutional Animal Care and Use Committee at the Shanghai Institute of Materia Medica (approval no. 2021-08-LC-26). An orthotopic HCC murine model was established based on a previous study (30). The mice were randomly divided into four groups of five: untreated, sham operation, control, and sh-Fgl1. After anesthesia with isoflurane, the mice were injected in the left hepatic lobe with PBS (referred to as the sham-operation group), 5 × 10⁶ wild-type (WT) Hepa1-6 tumor cells (referred to as the control group), or 5 × 10⁶ Fgl1-KO Hepa1-6 tumor cells (referred to as the sh-Fgl1 group). After 14 days, the mice were euthanized, while the tumor sizes were measured based on width and length using vernier calipers. The corresponding volumes were calculated via the equation as follows: Volume=length*(width)2*π/6. To estimate the potential influences of FGL1 on CD8+ TRM cells with respect to survival rates in HCC mice, another set of mice was used as previously described (10 animals/group). The survival of the mice was assessed daily. And the survival curve was plotted by using GraphPad (v8.0).
Statistical analyses
All statistical tests were conducted through the use of GraphPad (v8.0) and R software (v4.2.1). Statistical differences in averagely distributed data were studied using the Student’s t-test. A paired t-test was conducted to contrast the number of CD8+TRM cells between HCC and adjacent tissues. The survival time was accumulated using the Kaplan–Meier method and further examinzed using the log-rank test. The expression scatterplots of correlations were studied using Spearman’s rank correlation. The ratio of positive cells was used to calculate the Spearman covariance between CD103 and FGL1 expression. *P< 0.05 was regarded essential.
Results
Increased CD103 expression in tumors is correlated with a better prognosis for HCC patients
First, IHC staining for CD103 in the HCC tissues from Cohort 1 revealed significantly more CD103+ cells in HCC (P< 0.001, Figure 1). To reveal the correlation between the number of CD103+ cells in liver cancer tissues and patient outcomes, IHC staining of CD103 was then performed using the TMA, which was collected from 80 patients in Cohort 2 (P< 0.001). By further using a TMA containing 80 HCC patients, we not only confirmed a higher number of CD103+ cells in cancer, but also found a positive correlation between the number of CD103+ cells and better prognoses (P = 0.028). Moreover, the density of CD103+ cells was negatively correlated with tumor size in Cohort 2 (Spearman r2 = 0.1091, P = 0.0027, Figures 1B, C). Double immunofluorescence staining confirmed that the majority of CD103+ cells in the livers of HCC patients were CD69+CD8+. Confocal microscopy demonstrated that CD103+ lymphocytes in HCC produced granzyme B (GZMB) to maintain cytotoxicity (Figure 1). These findings confirmed that patients with more CD103+ cells in HCC have better prognoses, indicating that CD8+ TRM cells in HCC are vital for anti-tumor immunity.
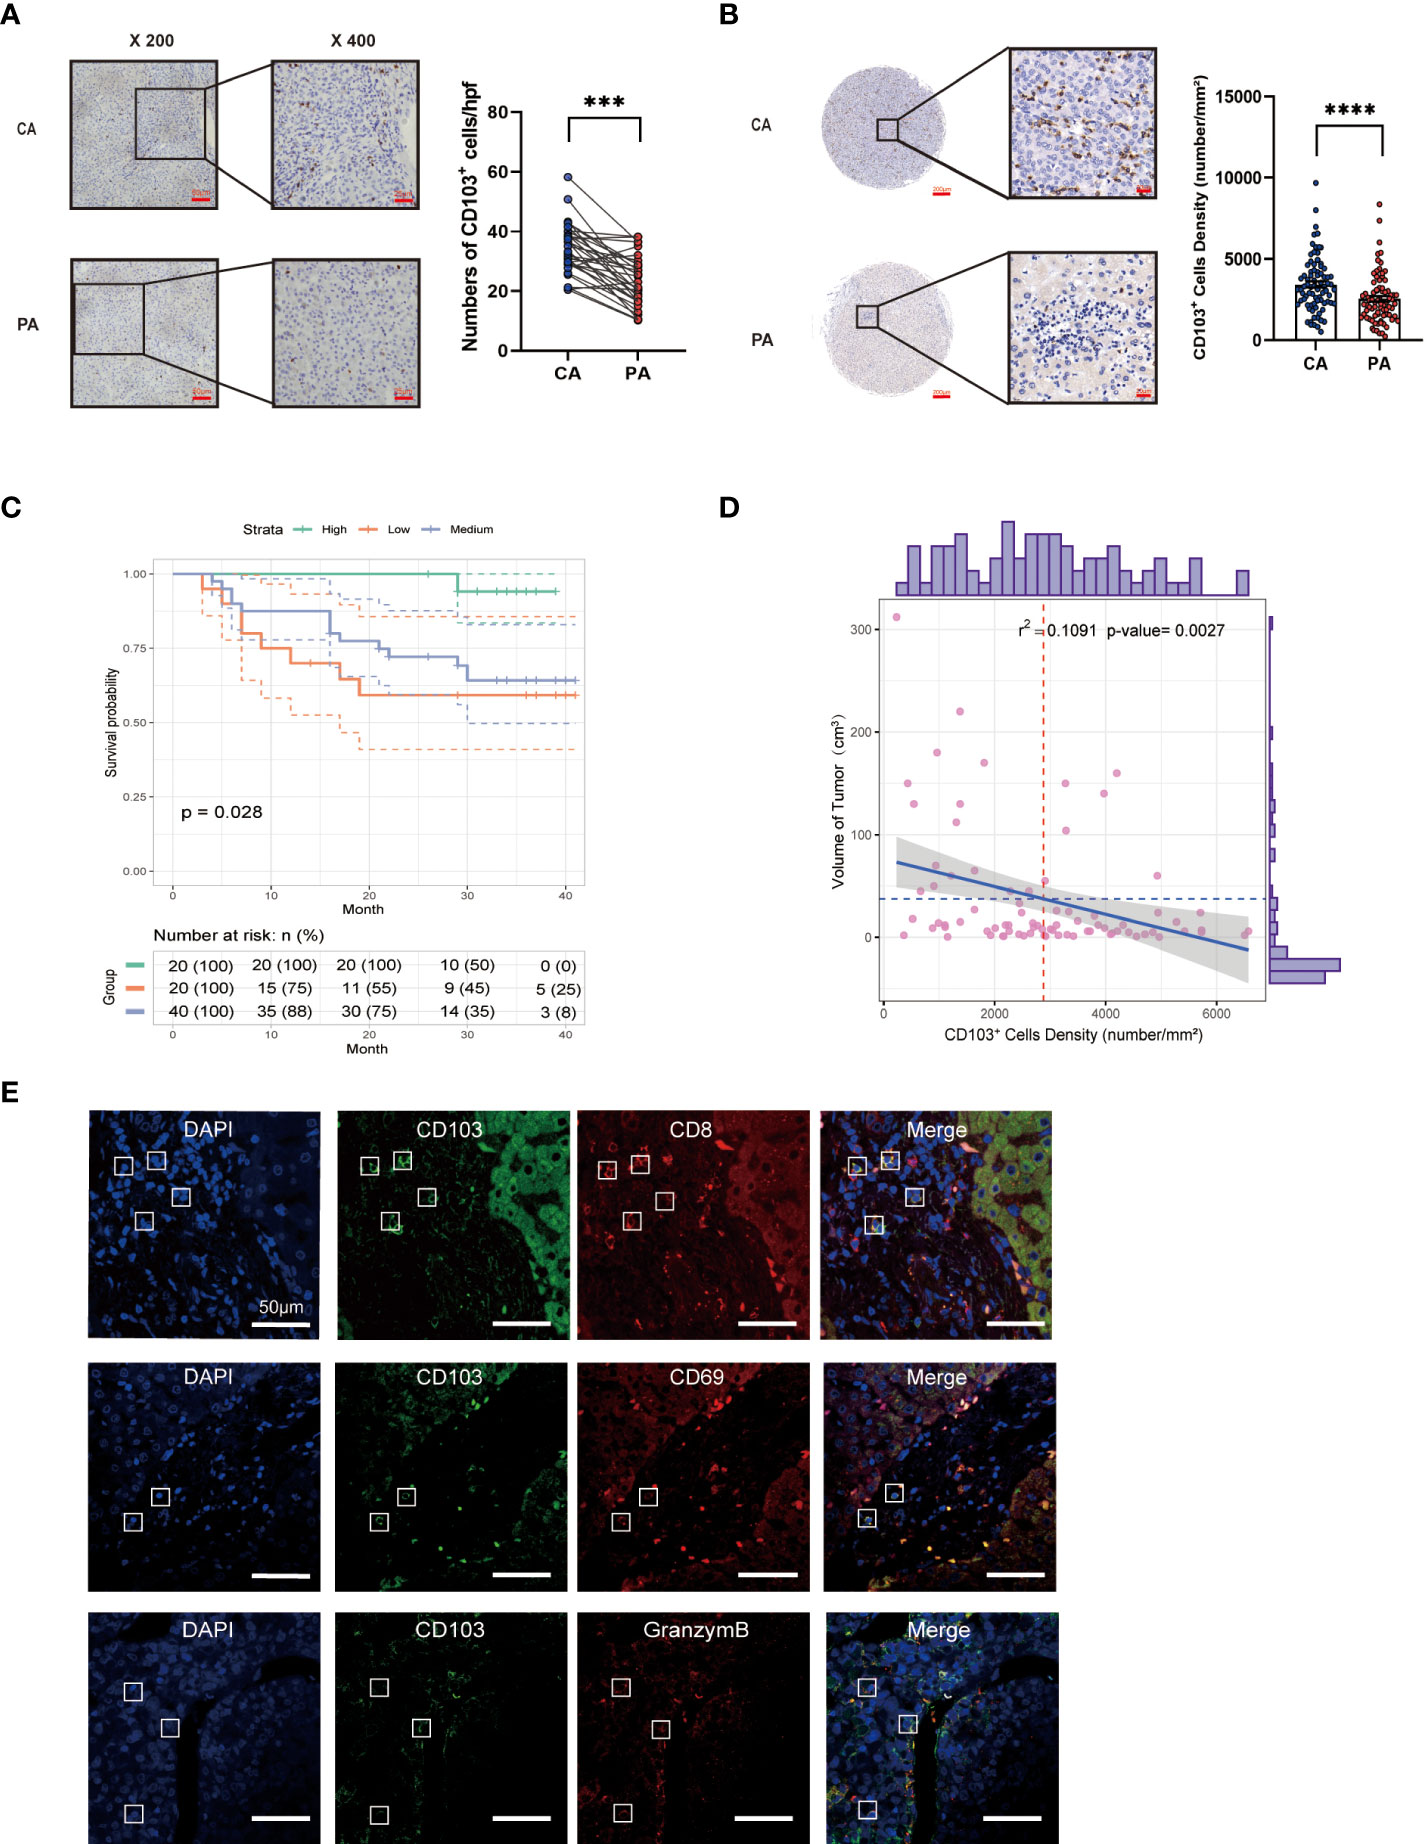
Figure 1 Hepatic CD69+CD103+CD8+ T-cell number is increased in HCC and is correlated with good prognosis. (A) Representative IHC staining of CD103 (inverted microscope, 200×, 400×) in CA and PA. Quantification of CD103 in the HCC patients from Cohort 1 (n = 35, A paired t-test). (B) Representative IHC staining of CD103 (inverted microscope, 200×, 400×) in TMA. Quantification of CD103 in the HCC patients from Cohort 2 (n = 80, A paired t-test). (C) Kaplan–Meier curves for the overall survival of the Cohort 2 groups with high, medium, and low CD103 expression, according to tri-sectional quantiles, showed that the patients with high CD103 expression had better prognostic outcomes than those with low CD103 expression (n = 80, log-rank test, P = 0.028). (D) Correlation between CD103+ cell density and tumor volume (n = 80, Spearman r2 = 0.1246, P = 0.001321) (E) Representative confocal assay of CD103 with CD69, CD8, and GZMB (400×) in the liver tissues of HCC patients from Cohort 1 (n = 8). (A–E) Bars represent mean ± SEM. CA, carcinoma tissue; GZMB, granzyme B; HCC, hepatocellular carcinoma; IHC, immunohistochemistry; PA, paracancerous tissue; TMA, tumor microarray. ***P< 0.001, ****P< 0.0001.
Increased intrahepatic CD8+ TRM cells demonstrate exhausted phenotypes in HCC
CD8+ TRM cells from Cohort 1 liver tissues were assessed in terms of the proportion, phenotype, and function using flow cytometry (Figure 2). We observed a significantly higher frequency of CD8+ TRM cells in cancer tissues than in paracancerous tissues (P< 0.0001, Figure 2). We then scored Cohort 1 patients based on Barcelona Clinic Liver Cancer (BCLC) staging classification and divided them into early-stage (A+B) and late-stage (C+D) groups. We found a higher frequency of CD8+ TRM cells in patients with early-stage disease than in those with advanced stage (P< 0.001, Figure 2C).
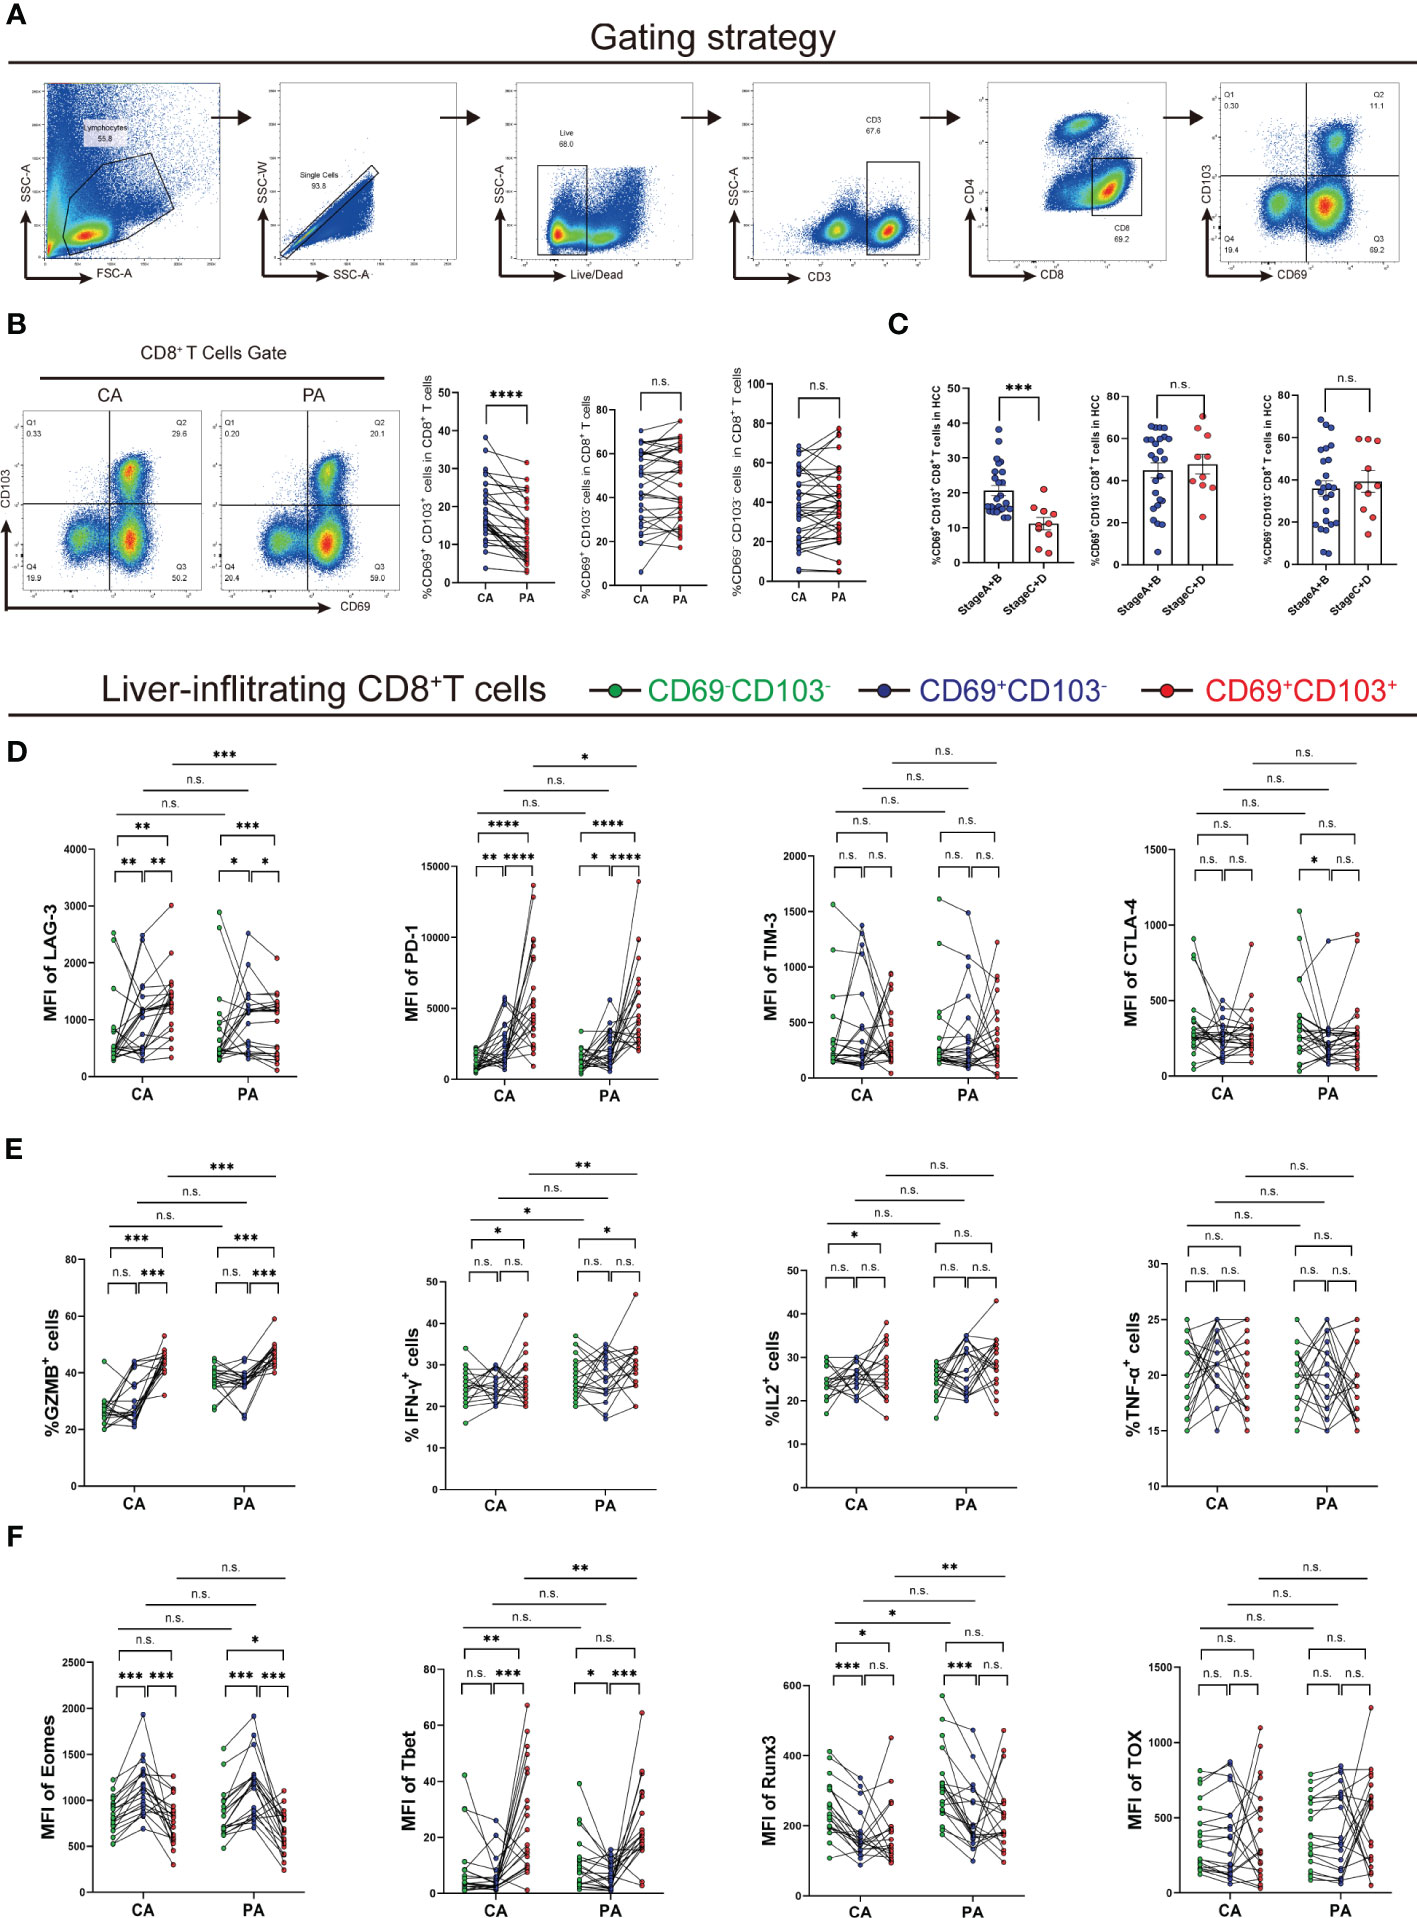
Figure 2 Analysis of the frequency, phenotype, and function of intrahepatic CD8+ TRM cells. (A) Gating strategy of intrahepatic CD8+ TRM cells. (B) Proportion of CD8+ TRM cells and other CD8+ T-cell subpopulations in CA and PA in Cohort 1 patients (n = 35, A paired t-test). (C) Ratio of CD8+ TRM cells and other CD8+ T-cell subpopulations in CA of Cohort 1 patients, which were grouped by the BCLC score (n = 35, Student’s t-test.). (D) Immune checkpoint expression on CD8+ TRM cells and other CD8+ T-cell subpopulations in CA and PA of HCC patients from Cohort 1 (n = 20, A paired t-test). (E) Cytokine expression in CD8+ TRM cells and other CD8+ T-cell subpopulations in CA and PA of HCC patients from Cohort 1 (n = 20, A paired t-test). (F) Transcription factor expression on CD8+ TRM cells and other CD8+ T-cell subpopulations in CA and PA of HCC patients from Cohort 1 (n = 20, A paired t-test). (B–F) BCLC, Barcelona Clinic Liver Cancer; CA, carcinoma tissue; HCC, hepatocellular carcinoma; MFI, mean fluorescence intensity; PA, paracancerous tissue. n.s. means not siginificant, *P< 0.05, **P< 0.01, ***P< 0.001, ****P< 0.0001.
Additionally, we detected the expression of immune checkpoints in CD8+ T-cell subsets, such as LAG3, PD-1, TIM-3, and CTLA-4. Expression levels of LAG3 and PD-1 in CD8+ TRM cells were substantially higher than those in other CD8+ T-cell subpopulations in HCC tissues. Moreover, expression levels of LAG3 and PD-1 in CD8+ TRM cells in HCC tissues were higher (Figures 2D, S1E). Next, we examined the levels of cytokines released by CD8+ TRM cells after activation and found that intratumoral CD8+ TRM cells released more GZMB and IFN-γ than other CD8+ T-cell subpopulations. Meanwhile, CD8+ TRM cells released less GZMB and IFN-γ in HCC tissues than in paracancerous tissues. We observed no significant difference in TNF-α and IL-2 expression among CD8+ T-cell subpopulations (Figures 2E, S1F). We also examined transcription factors in the CD8+ T-cell subpopulations and discovered that eomesodermin (Eomes) was less expressed in CD8+ TRM cells than in the two other groups of cells in HCC, while T-bet was more expressed in CD8+ TRM cells. They had higher expression of Runx3 in HCC tissues than those in paracancerous tissues, and there was no difference in TOX expression (Figure 2F, S1G). These results showed that the percentage of intratumoral CD8+ TRM cells had added, and their function changed.
FGL1 negatively correlates with signature genes of CD8+ TRM cells in HCC in silico
We next questioned how the immune microenvironment of HCC regulates the phenotypes and functions of CD8+ TRM cells. We first confirmed that key proteins associated with the T-cell residency phenotype, including IL-15 and TGF-β, were upregulated in HCC tissues using histological methods (Figures S1A–S1D), indicating that the HCC microenvironment is conducive to the development and residency of intrahepatic CD8+ TRM cells. Despite the increased number of intrahepatic CD8+ TRM cells, their function was impaired. Expression of immune checkpoint ligands (ICLs) is necessary to trigger inhibitory signaling via immune checkpoint receptors (ICRs) in exhausted T cells in the tumor immune microenvironment (31, 32). We then examined the correlations between the individual ICLs genes and ITGAE in the TIMER database and found that only FGL1, the ligand of LAG-3, showed a significant negative correlation with ITGAE, while other ICLs showed weak positive correlations (Spearman r = -0.19, P = 0.00018; Figure 3A) (33, 34). These data suggest that among different ICLs, FGL1 is the most important negative regulator of TRM cells.
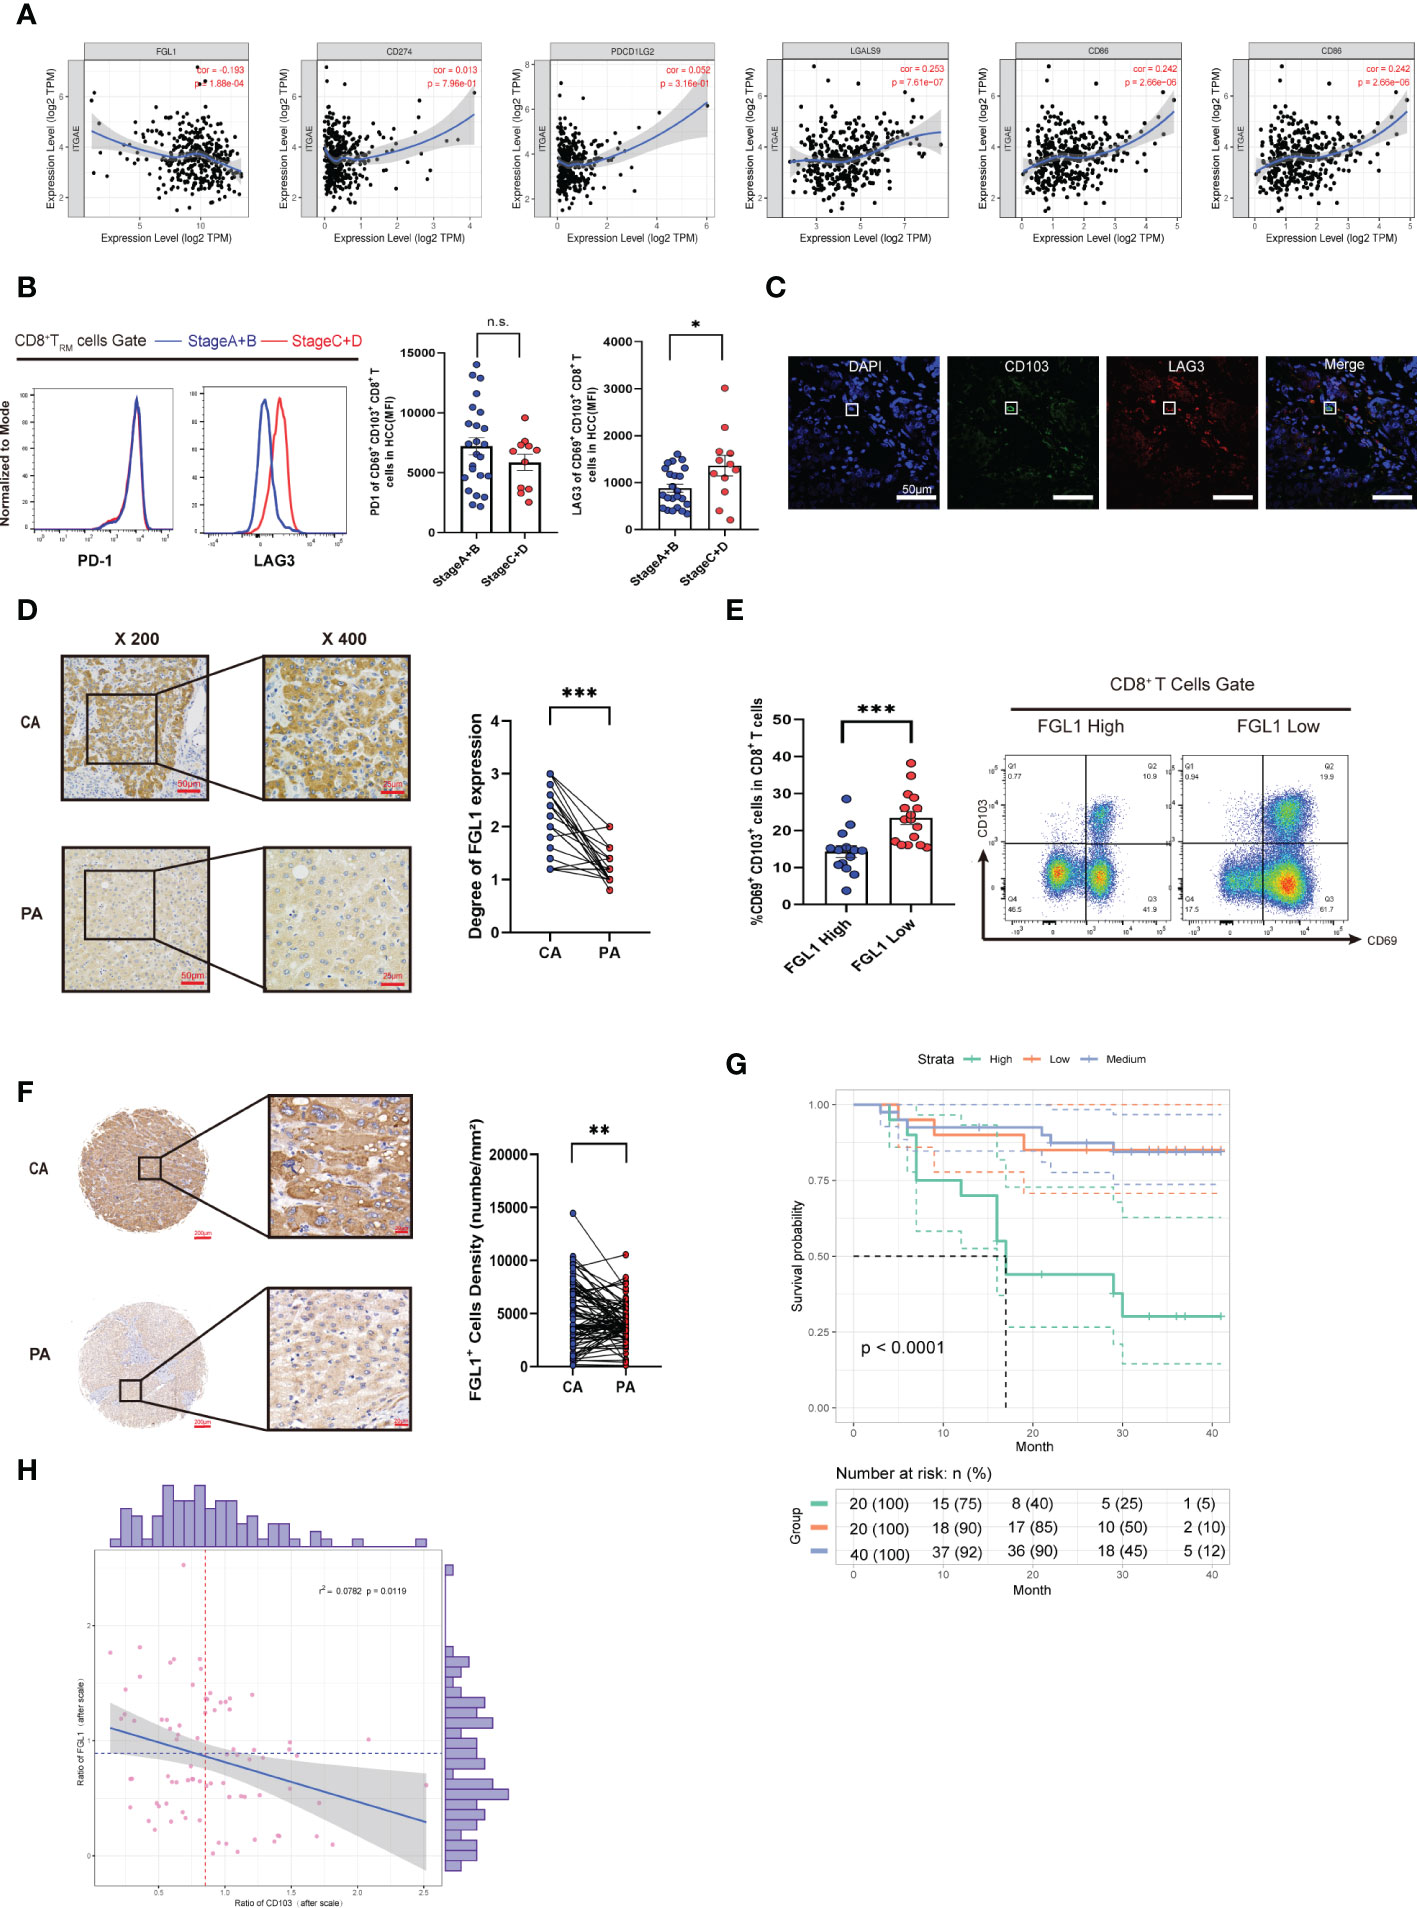
Figure 3 FGL1 expression is increased in HCC and correlates with poor prognosis. (A) Expression scatterplots of correlations between the genes of CD103 and FGL1, MHC-II, LSECtin, galectin-3, PD-L1, and PD-L2 in HCC of the TIMER cohort. Spearman correlation coefficient test was calculated. (B) MFI of PD-1 and LAG3 expression by CD8+ TRM cells in the liver cancer tissues of Cohort 1 patients, which were grouped by the BCLC score (n = 35, Student’s t-test). (C) Representative confocal assay of CD103 with LAG3 (400×) in the liver tissues of HCC patients from Cohort 1 (n = 10). (D) Representative IHC staining of FGL1 (inverted microscope, 200×, 400×) in CA and PA of patients from Cohort 1 (n = 35, A paired t-test). (E) The frequency of CD103+CD69+CD8+ T cells in groups with high or low FGL1 expression in HCC patients from Cohort 1. The cutoff for FGL1-based grouping was determined by the median (n = 30, Student’s t-test). (F) Representative IHC staining of FGL1 (inverted microscope, 200×, 400×) in TMA. Quantification of FGL1 in the HCC patients from Cohort 2 (n = 80, Student’s t-test). (G) Kaplan–Meier curves for the overall survival of the groups with high, medium, and low FGL1 expression in Cohort 2, according to the tri-sectional quantiles, showed that the patients with high FGL1 expression had worse outcomes than those with low FGL1 expression (n = 80, P< 0.0001). (H) Correlation between CD103+ cell density and tumor volume (n = 80, Spearman r2 = 0.0755, P = 0.007). (A–H) Bars represent mean ± SEM. BCLC, Barcelona Clinic Liver Cancer; CA, carcinoma tissue; FGL1, fibrinogen-like protein 1; HCC, hepatocellular carcinoma; IHC; immunohistochemistry; MFI, mean fluorescence intensity; PA, paracancerous tissue. *P< 0.05, **P< 0.01, ***P< 0.001. n.s. means not siginificant.
Increased FGL1 in HCC is related to a poor prognosis
We found that the CD8+ TRM cell surface in end-stage HCC expressed higher levels of LAG3 (n = 35, P< 0.05; Figure 3B), while there was no difference in the levels of PD-1. To further clarify the relationship between LAG3 and CD8+ TRM cells, we performed confocal staining for LAG3 and CD103 expression in cells (Figure 3C). The colocalization of CD103 with LAG3 on the cell membrane provided a basis to explore how FGL1 affects intrahepatic CD8+ TRM cells. We next explored the expression of FGL1 in HCC. As shown in Figure 3, FGL1 was expressed extensively in HCC (P< 0.001). Then, we separated patients into two groups by median based on their FGL1 level. As a result, patients with high FGL1 levels had a lower percentage of CD8+ TRM cells. Thus, we speculated that FGL1 might restrict the population of CD8+ TRM cells (Figure 3E). To further investigate whether FGL1 in liver cancer tissues is correlated with patient outcomes, we performed IHC staining for FGL1 using the TMA from Cohort 2 patients (P< 0.001, Figure 3F). The prognoses of patients with higher FGL1 levels were worse than those of patients with lower levels (P< 0.0001, Figure 3G). The levels of FGL1 correlated negatively with those of CD103 in Cohort 2(Spearman r2 = 0.0782, P = 0.0119, Figure 3H), which was consistent with the gene expression of the TIMER cohort. Univariate Cox regression analysis confirmed that FGL1 expression is an independent risk factor for HCC (Table 1). Thus, FGL1 may serve as an independent biomarker for the prognosis of patients with liver cancer.
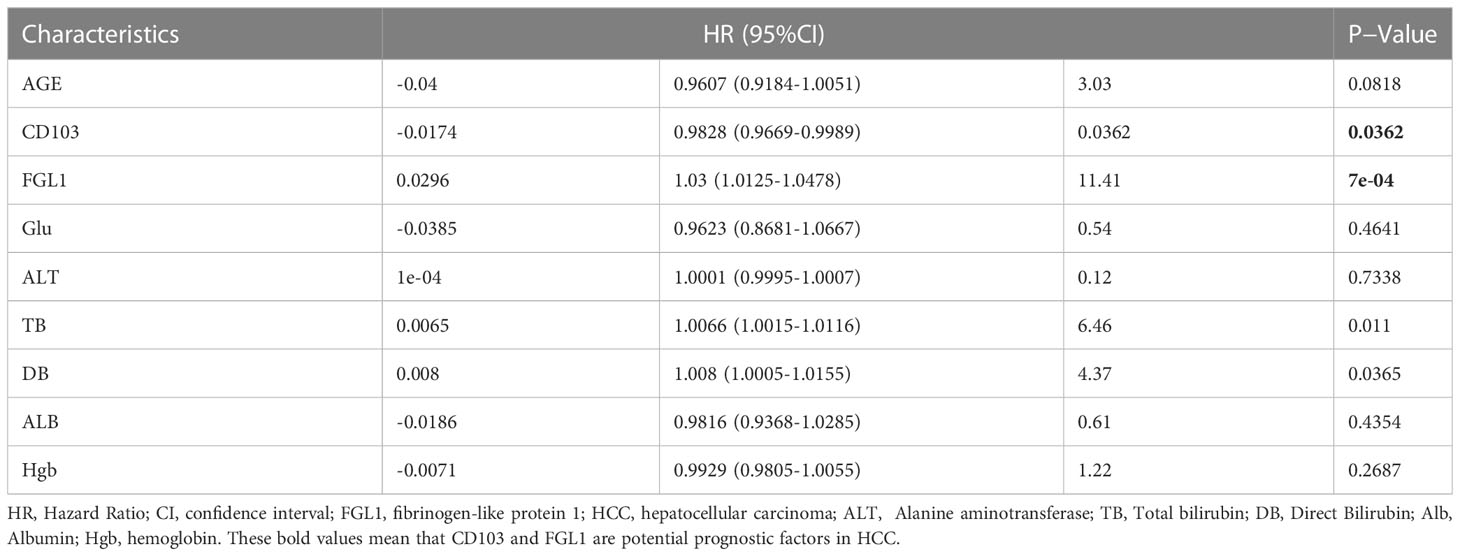
Table 1 Univariate Cox regression analysis of potential prognostic factors in HCC.
FGL1 affects CD8+ TRM cells in vitro
To further investigate CD8+ TRM cells in terms of their immune functions, a cellular model of CD8+ TRM cells was generated in vitro as previously described (26). Briefly, PBMCs were cultured in 24-well culture plates at 5×10⁵ cells/mL in complete medium in the presence of 20 IU/ml rhIL-2 and incubated with IL-15 (50 ng/ml) for three days, followed by further incubation with TGF-β (50 ng/ml) for three days. Cells were harvested on the sixth day. Activated CD8+ TRM cells displayed higher expression of LAG3, PD-1, TOX, and T-bet than CD69+CD103-CD8+ and CD69-CD103-CD8+ T cells, consistent with the CD8+ TRM cell phenotype reported previously. Activated CD8+ TRM cells also had higher Runx3 levels, contrasting with the results showing transcription factor levels in T-cell subpopulations in HCC, and there was no significant difference in Runx3 levels among the three intrahepatic populations (Figure 4A). We then added FGL1 to the activation system. The percentage of CD8+ TRM cells decreased after the addition of FGL1 compared with that of the control group (Figure 4B). Next, we examined surface molecules, cytokines, and immune checkpoints to investigate the inhibitory effects of FGL1 on CD8+ TRM cells. We found that the addition of FGL1 upregulated LAG3 expression on CD8+ TRM cell membranes (Figure 4C), decreased the release of IFN-γ and GZMB (Figure 4D), and upregulated levels of the transcription factor Eomes (Figure 4E). These results suggested that FGL1 affects the killing function of CD8+ TRM cells by binding to LAG3.
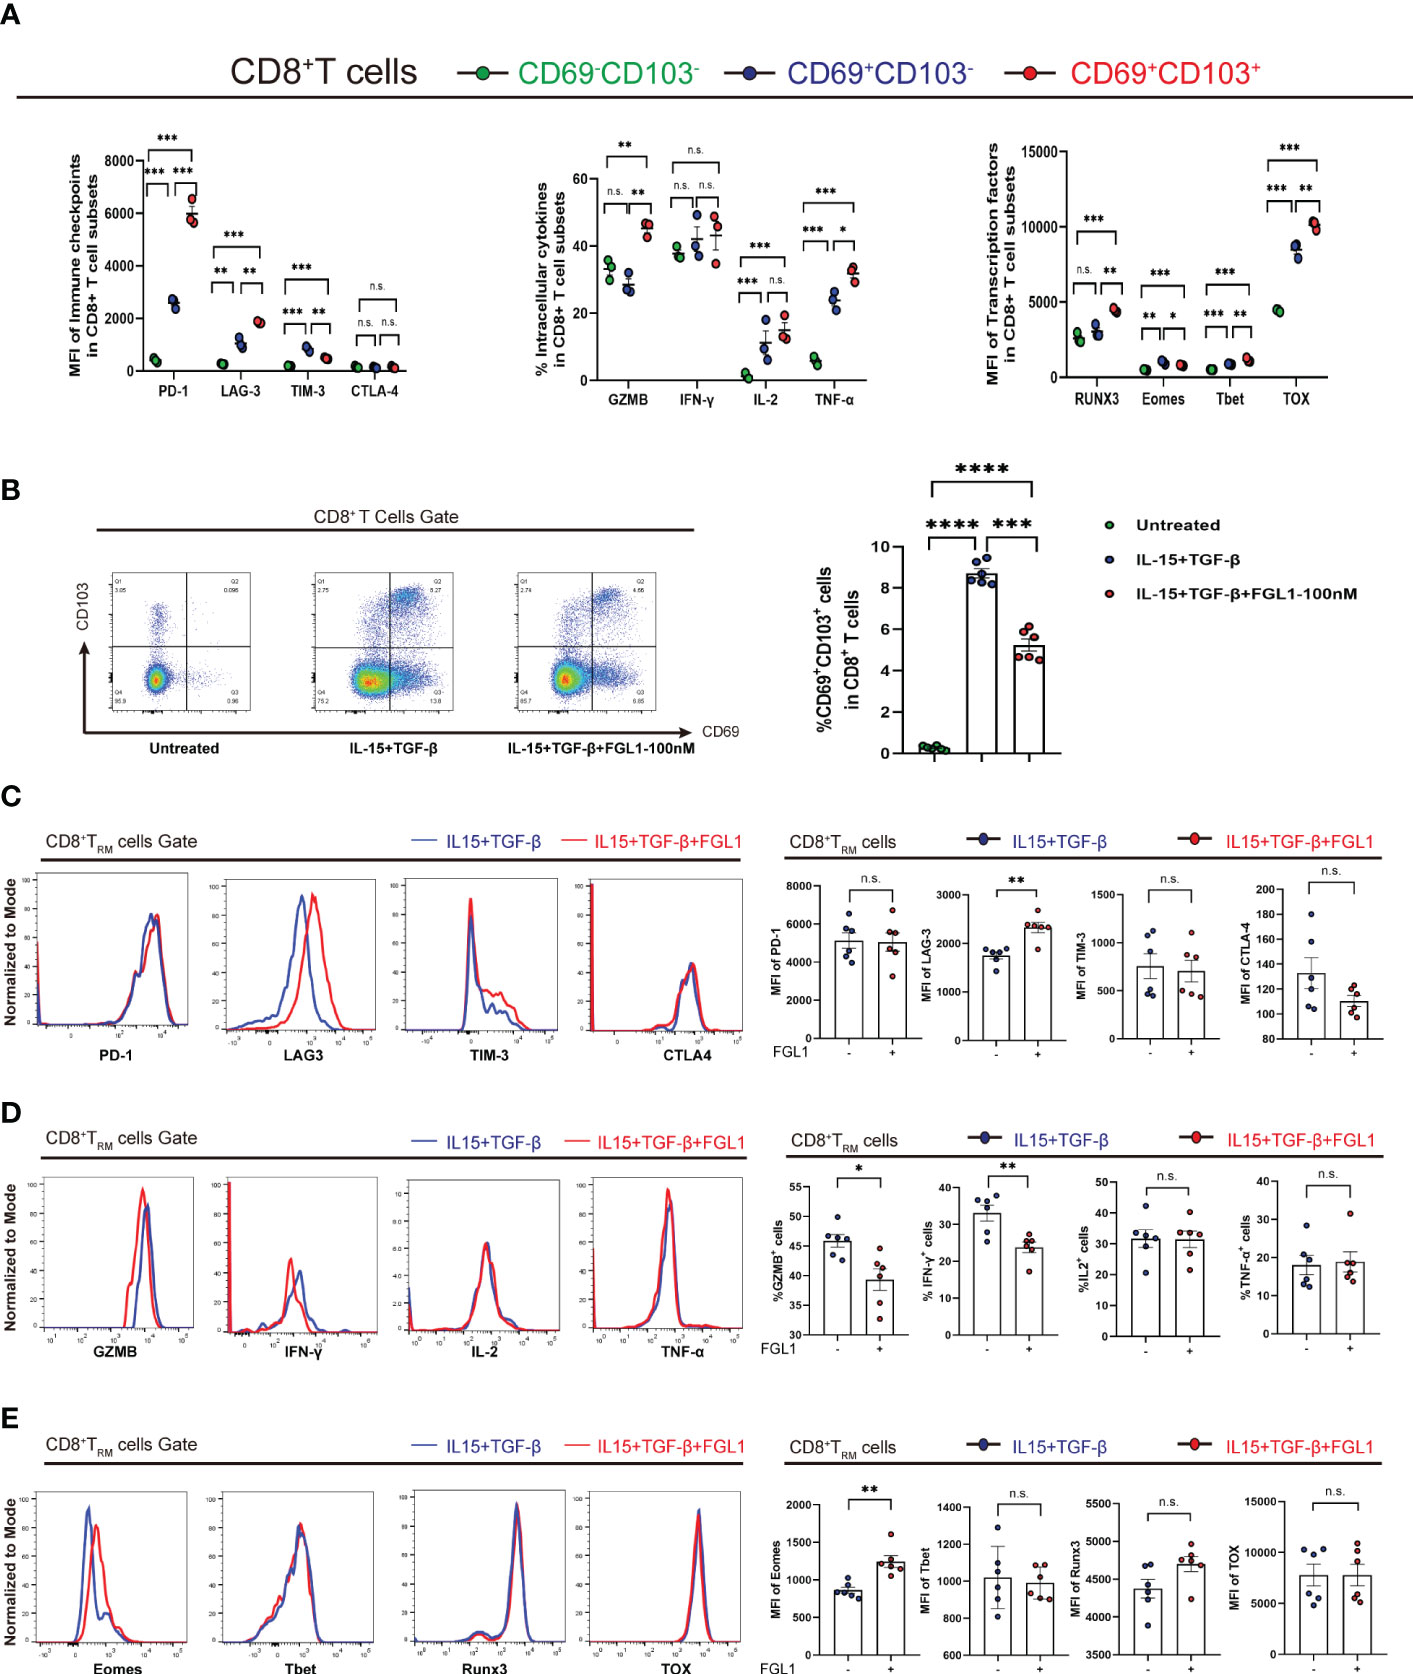
Figure 4 FGL1 expression inhibits the proliferation of CD8+ TRM cells in vitro (A) PBMCs were cultured in the presence of IL-15 (50 ng/mL) for 3 days and then with TGF-β (50 ng/mL) for an additional 3 days to activate CD8+ TRM cells. The expression of the markers of CD8+ TRM cells and other CD8+ T-cell subpopulations was determined. (B) FGL1 (100 nM) was added to the cultures, and the percentage of CD8+ TRM cells was detected after activation. (C) Expression of CD8+ TRM cell surface molecules, such as PD-1, LAG3, TIM-3, and CTLA-4, was detected after activation. (D) Expression of CD8+ TRM cell cytokines, such as IFN-γ, IL-2, and TNF-α, as well as GZMB, was detected after activation. (E) Expression of CD8+ TRM cell transcription factors, such as Runx3, Eomes, T-bet, and TOX, was detected after activation. (A–E) A paired t-test. Bars represent mean ± SEM. FGL1, fibrinogen-like protein 1; GZMB, granzyme B; PBMC, peripheral blood mononuclear cell. (*P< 0.05, **P< 0.01, ***P< 0.001, ****P< 0.0001). n.s. means not siginificant.
Knockdown of FGL1 does not significantly alter the proliferation of the mouse tumor hepa1-6 cell line
We constructed a Hepa1-6 mouse tumor cell line using lentivirus transfection and verified that shRNA-mediated Fgl1 knockdown was effective using WB (Figure S2A). Cell line proliferation was also examined using a clone formation assay. We found no significant change in the proliferation between FGL1-knockdown and control Hepa1-6 cell lines (Figure S2B). The results indicated that FGL1 did not directly affect the proliferation of tumor cells but possibly affected CD8+ TRM cells via FGL1-LAG-3 binding. The exact mechanism requires further verification using animal experiments.
Mice in the Fgl1-knockdown group have smaller tumors and improved prognosis
We used Fgl1-knockdown Hepa1-6 cell lines and control Hepa1-6 cell lines and constructed HCC models by inducing tumorigenesis in situ. Briefly, after anesthesia with isoflurane, the mice were injected in the left hepatic lobe with PBS (referred to as the sham-operation group), 5 × 10⁶ wildtype (WT) Hepa1-6 tumor cells (referred to as the control group), or 5 × 10⁶ Fgl1-KO Hepa1-6 tumor cells (referred to as the sh-Fgl1 group). The experimental groups were as follows: untreated group; sham-operation group; control group (sh-control); and knockdown group (sh-Fgl1). The knockdown of Fgl1 in Hepa1-6 cells inhibited tumor growth (Figure 5A). Heterotypic cells were found in the liver tissues of the control group in a nest-like arrangement with vacuolated nuclei and infiltrative growth. In the knockdown group, the size of the cancer nests was reduced, and the infiltrating area became smaller (Figure 5B). In the Fgl1-knockdown group, the expression of FGL1 in the mouse liver was substantially lower than that in the control group (Figure 5C). Further, the tumor volumes in mice were significantly reduced, and we observed a decrease in the number of cancer nodules (Figure 5D). The volumes were calculated via the equation as follows: Volume=length*(width)2*π/6. Mice treated as above mentioned were further used to estimate the influence of sh-Fgl1 on overall survival. For this, the survival of mice was assessed daily. Differences were also observed in survival curves, with mice in the sh-Fgl1 group having better survival. In the Fgl1-knockdown group, the serum biochemical parameters were reduced (Figure S2C).
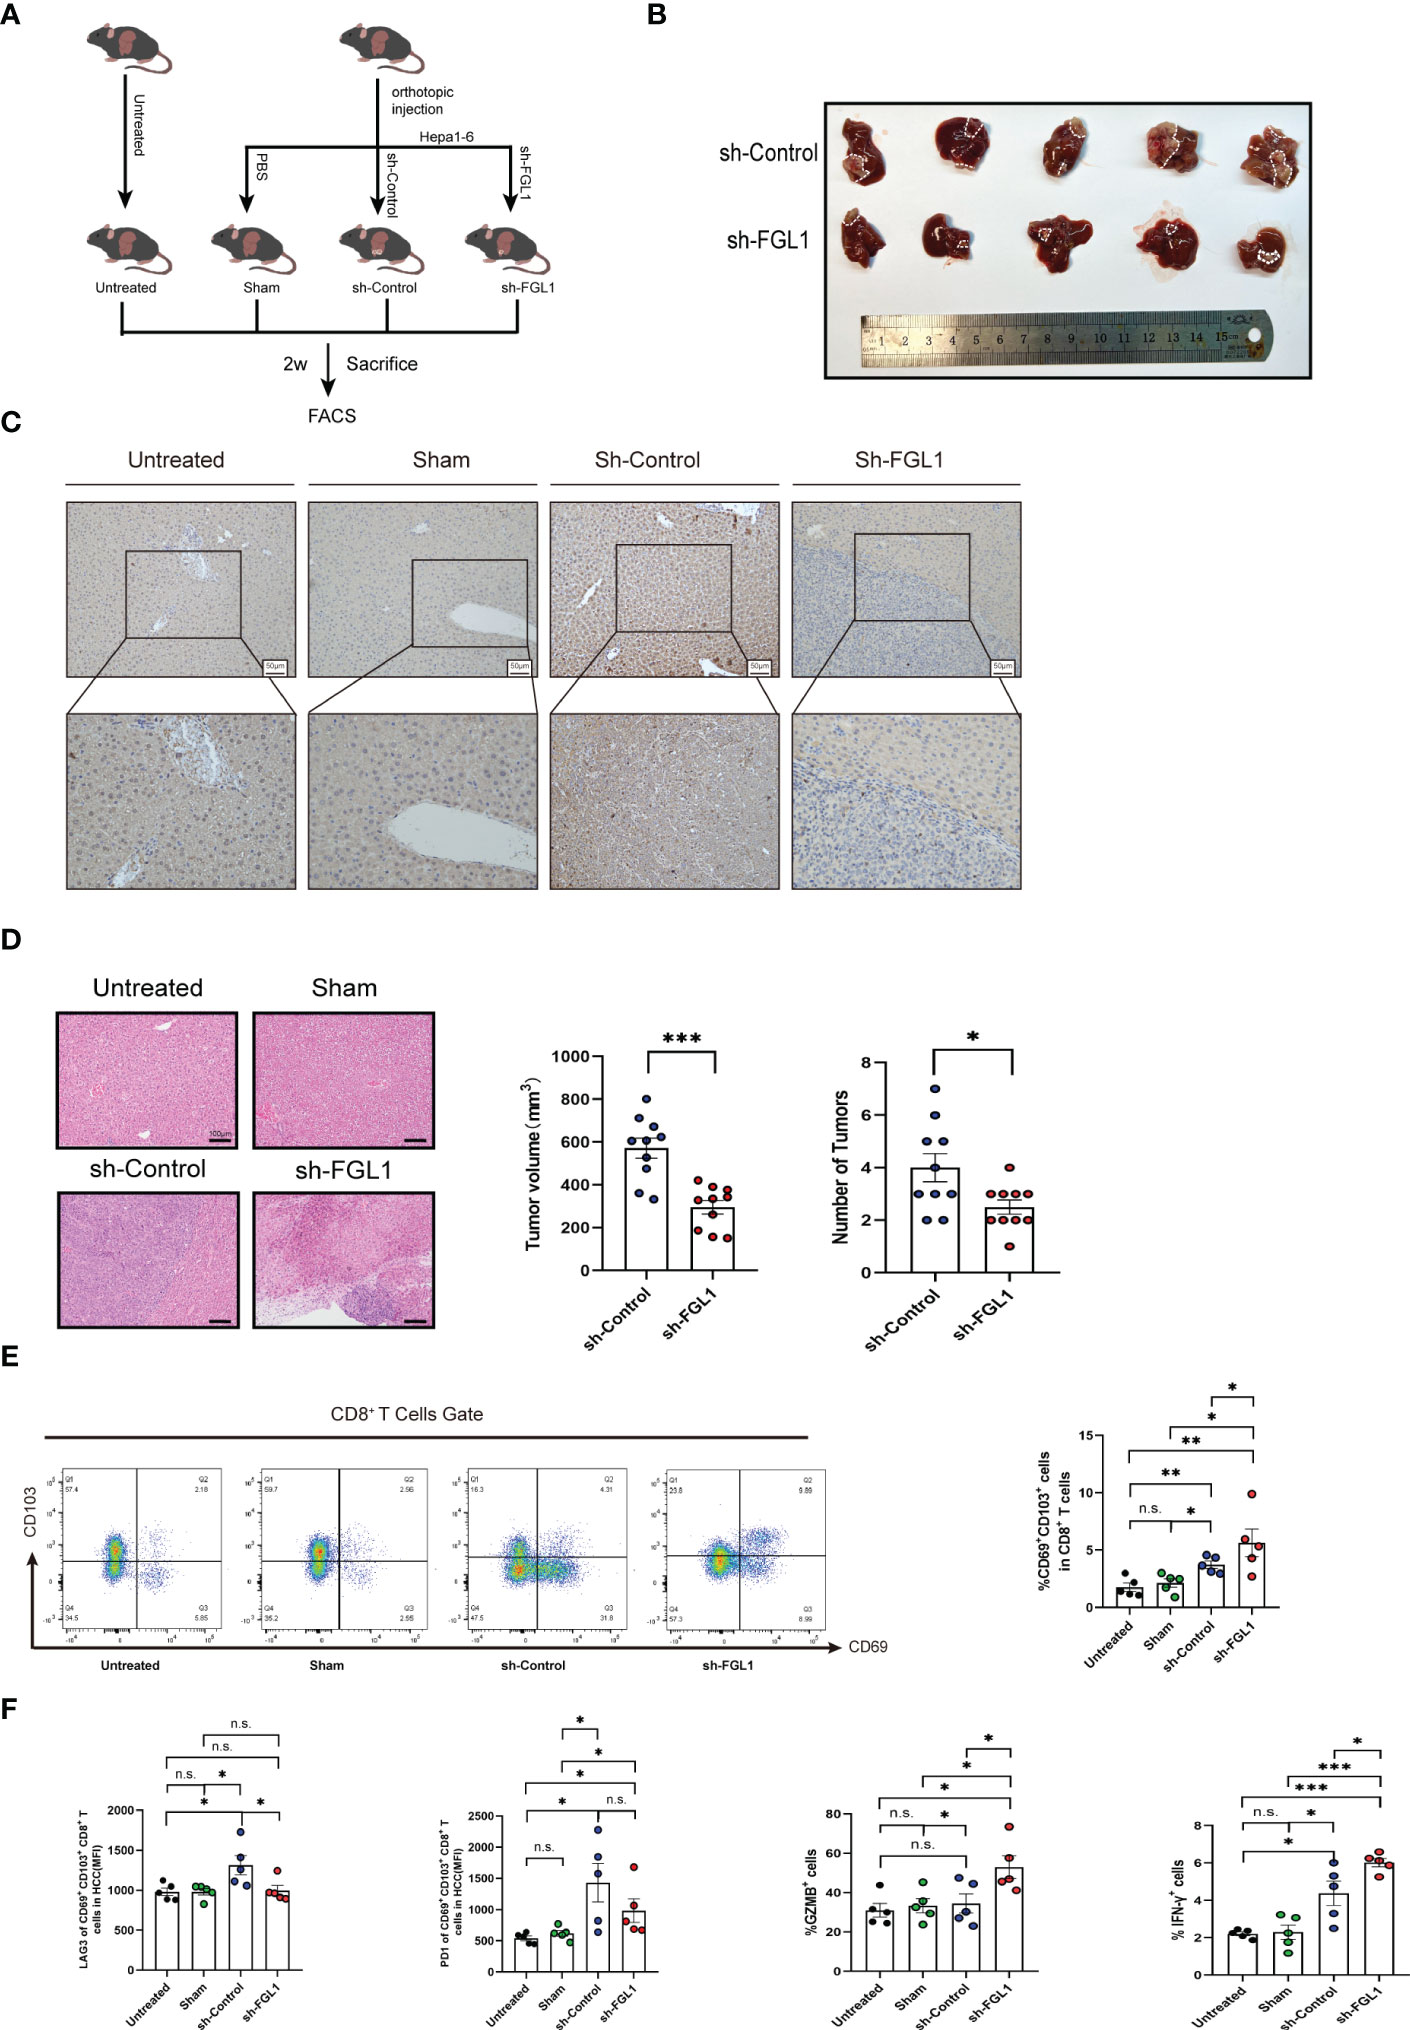
Figure 5 Fgl1 knockout restored CD8+ TRM cell functions and inhibited tumor expansion in vivo (A) C57BL/6J mice were classified into four groups and euthanized 14 days after orthotopic injection with PBS or Hepa1-6 cell line (transferred with sh-Control or sh-Fgl1, n=5). (B) Representative images of the tumors from the sh-Fgl1 and sh-Control groups. (C) Representative IHC staining of FGL1 (inverted microscope, 200×, 400×) in the livers of mice in each group. (D) Representative H&E-stained sections of each group. (E) Percentage of CD8+ TRM cells in each group. (F) Expression of the immune checkpoints PD-1 and LAG3 as well as GZMB and IFN-γ in CD8+ TRM cells. (A–F) n >5, a paired t-test. Bars represent mean ± SEM. FGL1, fibrinogen-like protein 1; H-E, hematoxylin-eosin; IHC, immunohistochemistry; sh, short hairpin (RNA). n.s. means not siginificant. *P < 0.05, **P < 0.01, ***P < 0.001.
Mice in Fgl1-knockdown group have more CD8+ TRM cells and lower LAG3 expression in HCC
To discover the regulatory effect of FGL1 on CD8+ TRM cells in vivo, we euthanized mice from four groups 2 weeks after orthotopic injection, obtained cancerous tissues from the control and Fgl1-knockdown groups, and extracted non-parenchymal cells from the liver for flow cytometric analysis. The results demonstrated no difference in the percentage of CD8+ TRM cells in the sham-operation and untreated groups, but increases in the control and knockdown groups, which is consistent with our previous finding of an increased proportion of CD8+ TRM cells in human HCC liver tissues. The increased number of CD8+ TRM cells in the Fgl1-knockdown group suggests that FGL1 affects CD8+ TRM cells by binding to LAG3, causing a decrease in the number of exhausted CD8+ TRM cells (which lead to immune escape) (Figure 5E). The Fgl1-knockdown group showed lower LAG3 expression but released more IFN-γ cytokines and GZMB than the control group (Figure 5F).
Discussion
With ICB therapy recognized as a robust clinical strategy for the pre-surgical treatment of cancers, a better understanding of early responder TRM cells is needed (14). For the optimal application of ICBs and the design of novel immunotherapeutic strategies for HCC patients, it is crucial to understand the tumor immune microenvironment. Herein, we discovered that most CD69+CD103+CD8+ TRM cells are terminally differentiated in HCC and can secrete GZMB. This unique immune microenvironment was found to contribute to TRM differentiation and accumulation in HCC. Additionally, we show that TRM cells residing in HCC highly express LAG3 and PD-1, both of which indicate TRM cell exhaustion. Furthermore, we found that FGL1, a primary ligand of LAG-3, is highly expressed in HCC. According to in vitro and in vivo experiments, FGL1 leads to TRM suppression in HCC, and blockade of the LAG3 and FGL1 pathways might restore the TRM-mediated anti-tumor response in liver cancer. These results suggest that TRM cells have anti-tumor potential for liver cancer and that FGL1-LAG3 binding could become a potential immune checkpoint for HCC therapy.
To study the specific immunological characteristics of CD8+ TRM cells, we compared CD69+CD103+CD8+ T cells with other CD8+ counterparts, which are more abundantly distributed in the liver, in terms of the levels of surface molecules, cytokines, and transcription factors. We found that CD8+ TRM cells expressed higher levels of PD-1 and LAG3 and lower levels of Eomes, IFN-γ, and GZMB in HCC than in paracancerous tissues. CD8+ TRM cells in HCC display unique immunological characteristics compared with other CD8+ T-cell subpopulations, such as high expression of immunosuppressive molecules. According to these findings, CD69+CD103+ T cells consist of heterogeneous populations, which retain a proportion of cells that have the potential to be reinvigorated and to further proliferate in response to therapeutic interventions.
LAG3, a marker of CD8+ T-cell exhaustion, is mainly expressed on the membrane of activated T cells (35). LAG3 was found to colocalize with CD8+ TRM cells in HCC. But the expression of its ligand FGL1 in hepatocellular liver cancer is controversial: a study in 2022 at Zhejiang Provincial People’s Hospital showed low expression of FGL1 in hepatocellular carcinoma, but high expression of FGL1 in hepatocellular carcinoma was reported in 2020 at Zhongshan Hospital (36), and in the same year a study from Youjiang Medical University for Nationalities reported that oxytocin could inhibit the growth of hepatocellular carcinoma by reducing FGL1 and sensitizing anti-LAG3 treatment and inhibiting hepatocellular carcinoma growth (37). We investigated the clinical relevance of FGL1 in HCC tissues using TMA IHC staining. Correlation analysis demonstrated that the proportion of FGL1+ cells negatively correlated with that of CD103+ cells in HCC. Thus, we hypothesized that FGL1 inhibits the expansion of CD8+ TRM cells in this disease.
In functional studies of liver CD8+ TRM cells, IL-15 and TGF-β have been sequentially used to activate CD8+ TRM cells in vitro (26). The activated CD69+CD103+CD8+ TRM cells had higher LAG3, PD-1, and Runx3 expression and reduced Eomes expression and GZMB secretion. These results are in accordance with the results of the phenotype of CD8+ TRM cells reported previously. These data confirm the feasibility of the activation protocol. We added FGL1 protein to the activation process of CD8+ TRM cells and found that FGL1 reduced the number of CD8+ TRM cells and GZMB secretion in vitro. Further, Eomes expression was upregulated under the influence of FGL1, while downregulation of the T-box family, including Eomes and T-bet combinations, is critical for TGF-β cytokine signaling (38). In addition, one study showed that Eomes suppresses the formation of precursor and mature TRM cells (39).
In vivo experiments were further conducted to investigate the inhibitory effects of FGL1 on CD8+ TRM cells. There was no significant change in the proliferation of liver cancer cell lines in the Fgl1-knockdown Hepa1-6 murine model compared with that in the sham group. However, the Fgl1-knockdown group showed a substantial reduction in tumor size, cancer nodules, and liver enzymes, as well as a longer survival time and more CD8+ TRM cells in HCC. Furthermore, the level of LAG3 in CD8+ TRM cells was lower in the Fgl1-knockdown group. FGL1 inhibited the proportion and function of CD8+ TRM in vivo, correlated with poor prognosis in HCC.
Our study had several limitations. First, we did not successfully sort CD8+ TRM cells using flow cytometry or isolate human primary tumor cells for co-culture; thus, further clarification of the anti-tumor function of CD8+ TRM cells is needed. Second, further studies are required to determine whether the suppression of CD8+ TRM cells by FGL1 could be antagonized by inhibition of Eomes; however, there is currently no verified inhibitor of Eomes. In summary, our results revealed that increased FGL1 expression in HCC affects the proportion and function of CD8+ TRM cells by binding to LAG3 on cell membranes, ultimately causing immune escape. These results provide a rationale to consider FGL1 as a new immunotherapeutic target.
Data availability statement
The original contributions presented in the study are included in the article. Further inquiries can be directed to the corresponding author XC.
Ethics statement
The studies involving human participants were reviewed and approved by Ethics Committee of Ren Ji Hospital. The patients/participants provided their written informed consent to participate in this study. The animal study was reviewed and approved by Institutional Animal Care and Use Committee at the Shanghai Institute of Materia Medica.
Author contributions
JZ, and XC designed the research. CY, QQ, YZ, and CW collected samples. CY, QQ, YZ, BH, and RC performed the research. CY, QQ, and QG analyzed data. CY and QQ wrote the manuscript. ZY, LX, JZ, and XC supervised the research and edited the manuscript. All authors contributed to the article and approved the submitted version.
Funding
This work was supported by National Natural Science Foundation of China (NSFC) grants (#8167030430 to XC and #81902366 to CW) and the Shanghai Yangfan Plan (19YF1429000 to CW).
Acknowledgments
We appreciate whole-heartedly all participants and providers who contributed to this study.
Conflict of interest
The authors declare that the research was conducted in the absence of any commercial or financial relationships that could be construed as a potential conflict of interest.
Publisher’s note
All claims expressed in this article are solely those of the authors and do not necessarily represent those of their affiliated organizations, or those of the publisher, the editors and the reviewers. Any product that may be evaluated in this article, or claim that may be made by its manufacturer, is not guaranteed or endorsed by the publisher.
Supplementary material
The Supplementary Material for this article can be found online at: https://www.frontiersin.org/articles/10.3389/fimmu.2023.1112672/full#supplementary-material
References
1. Sung H, Ferlay J, Siegel RL, Laversanne M, Soerjomataram I, Jemal A, et al. Global cancer statistics 2020: GLOBOCAN estimates of incidence and mortality worldwide for 36 cancers in 185 countries. CA: Cancer J For Clin (2021) 71:209–49. doi: 10.3322/caac.21660
2. Whiteside TL, Demaria S, Rodriguez-Ruiz ME, Zarour HM, Melero I. Emerging opportunities and challenges in cancer immunotherapy. Clin Cancer Res (2016) 22:1845–55. doi: 10.1158/1078-0432.CCR-16-0049
3. Qian W, Zhao M, Wang R, Li H. Fibrinogen-like protein 1 (FGL1): The next immune checkpoint target. J Hematol Oncol (2021) 14:147. doi: 10.1186/s13045-021-01161-8
4. Hoos A. Development of immuno-oncology drugs - from CTLA4 to PD1 to the next generations. Nat Rev Drug Discov (2016) 15:235–47. doi: 10.1038/nrd.2015.35
5. Xu M, Han Y, Liu G, Xu Y, Duan D, Liu H, et al. Preclinical study of a fully human anti-PD-L1 antibody as a theranostic agent for cancer immunotherapy. Mol Pharm (2018) 15:4426–33. doi: 10.1021/acs.molpharmaceut.8b00371
6. Park SL, Gebhardt T, Mackay LK. Tissue-resident memory T cells in cancer immunosurveillance. Trends In Immunol (2019) 40:735–47. doi: 10.1016/j.it.2019.06.002
7. Ganesan A-P, Clarke J, Wood O, Garrido-Martin EM, Chee SJ, Mellows T, et al. Tissue-resident memory features are linked to the magnitude of cytotoxic T cell responses in human lung cancer. Nat Immunol (2017) 18:940–50. doi: 10.1038/ni.3775
8. Amsen D, van Gisbergen KPJM, Hombrink P, van Lier RAW. Tissue-resident memory T cells at the center of immunity to solid tumors. Nat Immunol (2018) 19:538–46. doi: 10.1038/s41590-018-0114-2
9. Koda Y, Teratani T, Chu P-S, Hagihara Y, Mikami Y, Harada Y, et al. CD8 tissue-resident memory T cells promote liver fibrosis resolution by inducing apoptosis of hepatic stellate cells. Nat Commun (2021) 12:4474. doi: 10.1038/s41467-021-24734-0
10. Wang Z-Q, Milne K, Derocher H, Webb JR, Nelson BH, Watson PH. CD103 and intratumoral immune response in breast cancer. Clin Cancer Res (2016) 22:6290–7. doi: 10.1158/1078-0432.CCR-16-0732
11. Webb JR, Milne K, Watson P, Deleeuw RJ, Nelson BH. Tumor-infiltrating lymphocytes expressing the tissue resident memory marker CD103 are associated with increased survival in high-grade serous ovarian cancer. Clin Cancer Res (2014) 20:434–44. doi: 10.1158/1078-0432.CCR-13-1877
12. Workel HH, Komdeur FL, Wouters MCA, Plat A, Klip HG, Eggink FA, et al. CD103 defines intraepithelial CD8+ PD1+ tumour-infiltrating lymphocytes of prognostic significance in endometrial adenocarcinoma. Eur J Cancer (Oxford Engl 1990). (2016) 60:1–11. doi: 10.1016/j.ejca.2016.02.026
13. Barsch M, Salié H, Schlaak AE, Zhang Z, Hess M, Mayer LS, et al. T-Cell exhaustion and residency dynamics inform clinical outcomes in hepatocellular carcinoma. J Hepatol (2022) 77(2):397–409. doi: 10.1016/j.jhep.2022.02.032
14. Luoma AM, Suo S, Wang Y, Gunasti L, Porter CBM, Nabilsi N, et al. Tissue-resident memory and circulating T cells are early responders to pre-surgical cancer immunotherapy. Cell (2022) 185:2918–35 e29. doi: 10.1016/j.cell.2022.06.018
15. Huard B, Tournier M, Hercend T, Triebel F, Faure F. Lymphocyte-activation gene 3/major histocompatibility complex class II interaction modulates the antigenic response of CD4+ T lymphocytes. Eur J Immunol (1994) 24:3216–21. doi: 10.1002/eji.1830241246
16. Workman CJ, Dugger KJ, Vignali DAA. Cutting edge: Molecular analysis of the negative regulatory function of lymphocyte activation gene-3. J Immunol (Baltimore Md 1950). (2002) 169:5392–5. doi: 10.4049/jimmunol.169.10.5392
17. Andrews LP, Marciscano AE, Drake CG, Vignali DAA. LAG3 (CD223) as a cancer immunotherapy target. Immunol Rev (2017) 276:80–96. doi: 10.1111/imr.12519
18. Chihara N, Madi A, Kondo T, Zhang H, Acharya N, Singer M, et al. Induction and transcriptional regulation of the co-inhibitory gene module in T cells. Nature (2018) 558:454–9. doi: 10.1038/s41586-018-0206-z
19. Williams JB, Horton BL, Zheng Y, Duan Y, Powell JD, Gajewski TF. The EGR2 targets LAG-3 and 4-1BB describe and regulate dysfunctional antigen-specific CD8+ T cells in the tumor microenvironment. J Exp Med (2017) 214:381–400. doi: 10.1084/jem.20160485
20. Rotte A, Jin JY, Lemaire V. Mechanistic overview of immune checkpoints to support the rational design of their combinations in cancer immunotherapy. Ann Oncol (2018) 29:71–83. doi: 10.1093/annonc/mdx686
21. Roy S, Coulon PG, Prakash S, Srivastava R, Geertsema R, Dhanushkodi N, et al. Blockade of PD-1 and LAG-3 immune checkpoints combined with vaccination restores the function of antiviral tissue-resident CD8(+) TRM cells and reduces ocular herpes simplex infection and disease in HLA transgenic rabbits. J Virol (2019) 93. doi: 10.1128/JVI.00827-19
22. Yamamoto T, Gotoh M, Sasaki H, Terada M, Kitajima M, Hirohashi S. Molecular cloning and initial characterization of a novel fibrinogen-related gene, HFREP-1. Biochem Biophys Res Commun (1993) 193:681–7. doi: 10.1006/bbrc.1993.1678
23. Li CY, Cao CZ, Xu WX, Cao MM, Yang F, Dong L, et al. Recombinant human hepassocin stimulates proliferation of hepatocytes in vivo and improves survival in rats with fulminant hepatic failure. Gut (2010) 59:817–26. doi: 10.1136/gut.2008.171124
24. Wang J, Sanmamed MF, Datar I, Su TT, Ji L, Sun J, et al. Fibrinogen-like protein 1 is a major immune inhibitory ligand of LAG-3. Cell (2019) 176:334–347.e12. doi: 10.1016/j.cell.2018.11.010
25. Shi W, Wang Y, Zhang C, Jin H, Zeng Z, Wei L, et al. Isolation and purification of immune cells from the liver. Int Immunopharmacol (2020) 85:106632. doi: 10.1016/j.intimp.2020.106632
26. Pallett LJ, Davies J, Colbeck EJ, Robertson F, Hansi N, Easom NJW, et al. IL-2 tissue-resident T cells in the human liver: Sentinels for hepatotropic infection. J Exp Med (2017) 214:1567–80. doi: 10.1084/jem.20162115
27. You Z, Li Y, Wang Q, Zhao Z, Li Y, Qian Q, et al. The clinical significance of hepatic CD69(+) CD103(+) CD8(+) resident memory T cells in autoimmune hepatitis. Hepatology (2021) 74(2):847–63. doi: 10.1002/hep.31739
28. Benonisson H, Altintas I, Sluijter M, Verploegen S, Labrijn AF, Schuurhuis DH, et al. CD3-bispecific antibody therapy turns solid tumors into inflammatory sites but does not install protective memory. Mol Cancer Ther (2019) 18:312–22. doi: 10.1158/1535-7163.MCT-18-0679
29. Zhao Z, Gad H, Benitez-Buelga C, Sanjiv K, Xiangwei H, Kang H, et al. NEIL3 prevents senescence in hepatocellular carcinoma by repairing oxidative lesions at telomeres during mitosis. Cancer Res (2021) 81:4079–93. doi: 10.1158/0008-5472.CAN-20-1028
30. Lu Y-S, Kashida Y, Kulp SK, Wang Y-C, Wang D, Hung J-H, et al. Efficacy of a novel histone deacetylase inhibitor in murine models of hepatocellular carcinoma. Hepatol (Baltimore Md) (2007) 46:1119–30. doi: 10.1002/hep.21804
31. Anderson AC, Joller N, Kuchroo VK. Lag-3, Tim-3, and TIGIT: Co-inhibitory receptors with specialized functions in immune regulation. Immunity (2016) 44:989–1004. doi: 10.1016/j.immuni.2016.05.001
32. Lee BR, Chae S, Moon J, Kim MJ, Lee H, Ko HW, et al. Combination of PD-L1 and PVR determines sensitivity to PD-1 blockade. JCI Insight (2020) 5. doi: 10.1172/jci.insight.128633
33. Li T, Fan J, Wang B, Traugh N, Chen Q, Liu JS, et al. TIMER: A web server for comprehensive analysis of tumor-infiltrating immune cells. Cancer Res (2017) 77:e108–e10. doi: 10.1158/0008-5472.CAN-17-0307
34. Li B, Severson E, Pignon JC, Zhao H, Li T, Novak J, et al. Comprehensive analyses of tumor immunity: Implications for cancer immunotherapy. Genome Biol (2016) 17:174. doi: 10.1186/s13059-016-1028-7
35. Kurachi M. CD8 T cell exhaustion. Semin In Immunopathol (2019) 41:327–37. doi: 10.1007/s00281-019-00744-5
36. Guo M, Yuan F, Qi F, Sun J, Rao Q, Zhao Z, et al. Expression and clinical significance of LAG-3, FGL1, PD-L1 and CD8(+)T cells in hepatocellular carcinoma using multiplex quantitative analysis. J Transl Med (2020) 18:306. doi: 10.1186/s12967-020-02469-8
37. Wang J, Wei W, Tang Q, Lu L, Luo Z, Li W, et al. Oxysophocarpine suppresses hepatocellular carcinoma growth and sensitizes the therapeutic blockade of anti-Lag-3 via reducing FGL1 expression. Cancer Med (2020) 9:7125–36. doi: 10.1002/cam4.3151
38. Mackay LK, Wynne-Jones E, Freestone D, Pellicci DG, Mielke LA, Newman DM, et al. T-Box transcription factors combine with the cytokines TGF-beta and IL-15 to control tissue-resident memory T cell fate. Immunity (2015) 43:1101–11. doi: 10.1016/j.immuni.2015.11.008
Keywords: hepatocellular carcinoma, tissue-resident memory T cells, lymphocyte activation gene 3, exhaustion, granzyme B
Citation: Yang C, Qian Q, Zhao Y, Huang B, Chen R, Gong Q, Ji H, Wang C, Xia L, You Z, Zhang J and Chen X (2023) Fibrinogen-like protein 1 promotes liver-resident memory T-cell exhaustion in hepatocellular carcinoma. Front. Immunol. 14:1112672. doi: 10.3389/fimmu.2023.1112672
Received: 30 November 2022; Accepted: 02 March 2023;
Published: 13 March 2023.
Edited by:
Wenchao Zhou, University of Science and Technology of China, ChinaReviewed by:
Jiabei Wang, Anhui Provincial Hospital, ChinaHongye Wang, Nanjing Medical University, China
Copyright © 2023 Yang, Qian, Zhao, Huang, Chen, Gong, Ji, Wang, Xia, You, Zhang and Chen. This is an open-access article distributed under the terms of the Creative Commons Attribution License (CC BY). The use, distribution or reproduction in other forums is permitted, provided the original author(s) and the copyright owner(s) are credited and that the original publication in this journal is cited, in accordance with accepted academic practice. No use, distribution or reproduction is permitted which does not comply with these terms.
*Correspondence: Xiaosong Chen, Y2hlbnhpYW9zb25nQHJlbmppLmNvbQ==; Jianjun Zhang, emhhbmdqaWFuanVuMDIyMUAxMjYuY29t
†These authors have contributed equally to this work