 Yu Zhou1,2†§
 Xin Li3†§Liqi Ng4§Qing Zhao5§Wentao Guo6§Jinhua Hu6§Jinghong Zhong3§Wenlong Su6§Chaozong Liu4*‡§Songchuan Su2*‡§
- 1College of Traditional Chinese Medicine, Changchun University of Chinese Medicine, Changchun, China
- 2Foot & Ankle Surgery, Chongqing Orthopedic Hospital of Traditional Chinese Medicine, Chongqing, China
- 3Jilin Ginseng Academy, Changchun University of Chinese Medicine, Changchun, China
- 4Institute of Orthopaedic and Musculoskeletal Science, University College London, Royal National Orthopaedic Hospital, London, United Kingdom
- 5School of Health Management, Tianjin University of Chinese Medicine, Tianjin, China
- 6College of Pharmacy, Changchun University of Chinese Medicine, Changchun, China
Objective: An analysis of the relationship between rheumatoid arthritis (RA) and copper death-related genes (CRG) was explored based on the GEO dataset.
Methods: Based on the differential gene expression profiles in the GSE93272 dataset, their relationship to CRG and immune signature were analysed. Using 232 RA samples, molecular clusters with CRG were delineated and analysed for expression and immune infiltration. Genes specific to the CRGcluster were identified by the WGCNA algorithm. Four machine learning models were then built and validated after selecting the optimal model to obtain the significant predicted genes, and validated by constructing RA rat models.
Results: The location of the 13 CRGs on the chromosome was determined and, except for GCSH. LIPT1, FDX1, DLD, DBT, LIAS and ATP7A were expressed at significantly higher levels in RA samples than in non-RA, and DLST was significantly lower. RA samples were significantly expressed in immune cells such as B cells memory and differentially expressed genes such as LIPT1 were also strongly associated with the presence of immune infiltration. Two copper death-related molecular clusters were identified in RA samples. A higher level of immune infiltration and expression of CRGcluster C2 was found in the RA population. There were 314 crossover genes between the 2 molecular clusters, which were further divided into two molecular clusters. A significant difference in immune infiltration and expression levels was found between the two. Based on the five genes obtained from the RF model (AUC = 0.843), the Nomogram model, calibration curve and DCA also demonstrated their accuracy in predicting RA subtypes. The expression levels of the five genes were significantly higher in RA samples than in non-RA, and the ROC curves demonstrated their better predictive effect. Identification of predictive genes by RA animal model experiments was also confirmed.
Conclusion: This study provides some insight into the correlation between rheumatoid arthritis and copper mortality, as well as a predictive model that is expected to support the development of targeted treatment options in the future.
1 Introduction
Rheumatoid arthritis (RA) is a chronic inflammatory joint disease where patients usually exhibit symptoms such as synovitis and bone erosion induced by cartilage destruction and osteoclast activation. This eventually destroys the patient’s bone, cartilage and tendons, and in severe cases results in deformity and disability which seriously affects the patient’s quality of life (1–4). In addition, if patients do not receive timely and effective treatment after the onset of the disease, it may lead to a series of complications such as cardiovascular disease, making it more difficult to treat clinically (5, 6). Studies have shown that about 1% of the world’s population is affected by RA, which can occur in any age group and is about 2-3 times more common in women than in men (7). The pathogenesis of RA is still unclear, but it is clinically believed that there is a close relationship between genetic susceptibility, environmental factors and the development of the disease (8). Notably, RA is affected by the infiltration of multiple inflammatory cells and the release of abnormal cytokines. A range of immune cells, including macrophages, dendritic cells, mast cells, neutrophils, T cells and B cells are all closely associated with RA (9, 10).
The mitochondrion is a semi-autonomous organelle with a double membrane structure, which can provide cell energy through the tricarboxylic acid cycle (TCA) oxidative phosphorylation (11, 12). Previous studies have found that imbalances in mitochondrial homeostasis may contribute to the development of various autoimmune diseases including RA, scleroderma, desiccation syndrome and systemic lupus erythematosus (13, 14). Thus, there is a relationship between RA and mitochondria. Copper death is a new mode of cell death that is distinct from iron death and necroptosis, and its related genes include SLC31A1, PDHB, PDHA1, LIPT1, FDX1, DLD, DLST, DBT, LIAS, DLAT, GCSH, ATP7A and ATP7B (15, 16). The main mechanisms of copper death are the excessive accumulation of lipoylated mitochondrial enzymes and depletion of Fe-S cluster proteins (17, 18). Notably, copper ions (Cu2+) act as co-factors for the enzyme, and copper homeostasis is closely related to the presence of mitochondrial regulation (19). Copper is mainly present in the form of cytochrome C oxidase (COX) and superoxide dismutase (SOD1) in mitochondria and plays an important regulatory role in the TCA process, ultimately interfering with various biological processes such as redox homeostasis, iron utilisation, oxidative phosphorylation and cell growth (20, 21). An analysis of 1444 patients with RA showed that serum levels of copper were significantly higher in RA patients compared to the healthy population (22). It was also suggested that when the human synovial membrane is exposed to hypoxic conditions or excessive glycolysis in multiple cells, copper death may be inhibited, leading to excessive survival and proliferation of various immune cells such as fibroblast-like synoviocytes, effector T cells and macrophages, further leading to inflammatory responses and bone destruction in RA patients; Meanwhile, important regulatory genes of copper apoptosis such as PDHA1, DLAT, FDX1MTF1 and LIAS have been shown to be closely associated with the RA process (23). Therefore, we hypothesise that there may be a relationship between the onset and progression of rheumatoid arthritis and copper death.
The present study analysed for the first time the differential expression and immune profile of CRG between RA and non-RA individuals. We divided 232 RA patients into two copper death-related molecular clusters based on 13 CRG expression profiles, and further analysed expression differences and immune cell differences between the two. RA patients were further grouped according to the genes that subsequently intersected between molecular clusters and gene clusters, their expression profile and immune profile were analysed, along with their copper death-related scores. The differentially expressed genes (DEGs) in the GSE93272 data were obtained, the specific genes between CRGclusters were identified by the WGCNA algorithm, and an optimal prediction model was built using four machine learning methods. The performance of these prediction models was then validated by the Nomogram model, Calibration curve and DCA, and the expression profiles of five important genes obtained from the optimal prediction models were also demonstrated.
2 Methods
2.1 RA and copper death-related gene data collection and analysis
Retrieval of RA microarray data from Gene Expression Omnibus (GEO) (www.ncbi.nlm.nih.gov/geo) (24, 25). The test set GSE93272 was reported by Tasaki S (15) et al. which provides transcriptomic data from whole blood obtained from a population of RA patients (n = 232) and healthy controls (n = 43) from the GPL570 ([HG-U133_Plus_2] Affymetrix Human Genome U133 Plus 2.0 Array). The expression matrix of the experimental and control samples in GSE93272 was obtained using a Perl (V5.35.0), and the differential genes between samples in the dataset were obtained using the R language. The source of copper death-related genes was Tsvetkov et al (15). A total of 13 CRGs were obtained.
2.2 Correlation between CRG and immune cells and chromosomal analysis
To further demonstrate the association between CRG and RA-related immune cell properties, we analysed the correlation coefficient between CRG expression and the relative percentage of immune cells using the “corrplot” R package. The location of the CRG on the chromosome was obtained using the perl program, the “RCircos” package in the R language.
2.3 Assessment of immune cell infiltration
The relative abundance of each sample in 22 immune cells was assessed based on the gene expression data of GSE93272 using the CIBERSORT algorithm (26). p<0.05 represents a significant difference.
2.4 Unsupervised clustering and gene set variance analysis of RA patients
The “ConsensusClusterPlus” package (27) was used to perform unsupervised cluster analysis by classifying 232 RA samples into different clusters using the k-means algorithm for 1000 iterations. The maximum number of clusters k = 9 and the optimal number of clusters were synthesised based on the cumulative distribution function (CDF) curve, consensus matrix, and consistent cluster score. PCA was then used in conjunction with t-distributed stochastic neighbour embedding (tSNE) to determine whether these genes could be used to distinguish samples (28, 29).
2.5 Re-consensus clustering based on CRGcluster intersection genes
Based on the intersecting genes obtained from the unsupervised clustering of RA patients, we used the ConsensusClusterPlus and limma packages to reclassify the RA patients and identify different subgroups (30). Cluster-to-cluster expression and immune profiles were analysed. The expression of CRG between CRGcluster and genecluster clusters was analysed using the “ggpubr” and “reshape2” packages.
2.6 Differential gene enrichment analysis and weighted gene co-expression network analysis
We used the R language to screen the DEGs in the GSE93272 dataset according to Padj < 0.05 and ∣logFC∣ > 0.5, and the results are presented in the form of volcano plots and heat maps. In addition, we performed GO and KEGG enrichment analysis on the above 276 DEGs using the R language. We used the ‘WGCNA’ package (31) in the R language to identify co-expression modules. The top 25% of genes with the highest variability were applied to the subsequent WGCNA analysis to ensure the accuracy of high quality results. We selected the best soft threshold to construct a weighted neighbour-joining matrix and further converted it into a topological overlap matrix (TOM). Modules were obtained using a TOM dissimilarity measure (1-TOM) based on a hierarchical clustering tree algorithm when the minimum module size was set to 100. Each module is assigned a random colour. The module signature genes represent the global gene expression profile in each module. The relationship between module and disease state is expressed through modular significance (MS), and gene significance (GS) is described as the correlation between a gene and a clinical phenotype (32).
2.7 Building predictive models based on multiple machine learning methods
The Random forest model (RF) is an integrated machine learning method that can use multiple independent decision trees for classification or regression (33, 34). The support vector machine model (SVM) can generate hyperplanes with maximum margins in the feature space to effectively differentiate data points (35). The generalised linear model (GLM) is based on and extends the multiple linear regression model to provide a more efficient and flexible assessment of the relationship between normally distributed dependent features and categorical or continuous independent features (36). eXtreme Gradient Boosting (XGB) is a collection of boosted trees based on gradient boosting, which is an effective algorithm to compare classification error and model complexity (37). We’ve used the ‘caret’ package in R to build a machine learning model based on 2 different CRG clusters (including RD, SVM, GLM and XGB). The 232 RA samples were randomly divided into training set (70%, N = 163) and validation set (30%, N = 49). All machine learning models were executed according to default parameters and evaluated in a comprehensive manner using 5-fold cross-validation. The four machine learning models are interpreted and their residual distribution and feature importance are visualised using the ‘DALEX’ package in R. The “pROC” R package was used to visualise the area under the ROC (receiver operating characteristic) curve (Area Under Curve, AUC). The best machine learning model was determined, and the top five genes included were used as predictors for RA.
2.8 Construction and validation of the nomogram model
A Nomogram model was constructed based on the predictor genes obtained from the RF, and the RA cluster was evaluated using the “rms” R package (38). Each predictor variable is assigned a score and the ‘total score’ represents the sum of the scores of the above predictors. The calibration curve and DCA were used to assess the predictive power of the Nomo model.
2.9 RF candidate gene expression diagnostic analysis
ROC curves were constructed to assess the diagnostic specificity and sensitivity of RF candidate genes, and the expression of each gene in non-RA samples and RA samples were analysed in the form of box plots.
2.10 Verification of the animal experiment
2.10.1 Animals and models
10 male SD (6 weeks old, 140g each, SPF class) rats (n = 5 in each group) were obtained from Liaoning Changsheng Biotechnology Co. The experimental animal certificate number is SCXK (Liaoning) 2020-0001. The Institutional Animal Care and Use Committee of Changchun University of Traditional Chinese Medicine approved all experimental protocols and all experiments were conducted in accordance with relevant guidelines and regulations (No. ccucm-2017-0015). Animals were given one week to acclimatise to their new environment prior to the experiments. Each rat was randomly assigned to one of two groups with ten rats in each: the control group and the RA model group. The RA model group used a bovine type II collagen solution (concentration 2 mg/ml) added dropwise to an equal volume of incomplete Freund’s adjuvant to a final concentration of 1 mg/ml. The mixture was emulsified in an ice bath with a homogeniser and injected intradermally into the tail root at 0.2 mL per rat, followed by a booster immunisation at 0.1 mL per rat 7 days later. During the moulding period, the rats were subjected to wind, cold and humidity stimulation (wind speed 5m/s, humidity 90%-95%, temperature 0-2°C) for 14 days, once a day for 4 hours. The control group was injected intradermally with an equal volume of saline (39, 40). At the end of 14 days of moulding, the right ankle joint of the rat was taken for follow-up experiments.
2.10.2 Quantitative reverse transcription-polymerase chain reaction
The expression levels of the DEGs were further verified by qRT-PCR (Applied biosystems, USA). Relative gene expression levels were normalised to Actin according to the 2-ΔΔCT method. the primer sequences used are shown in Table 1.
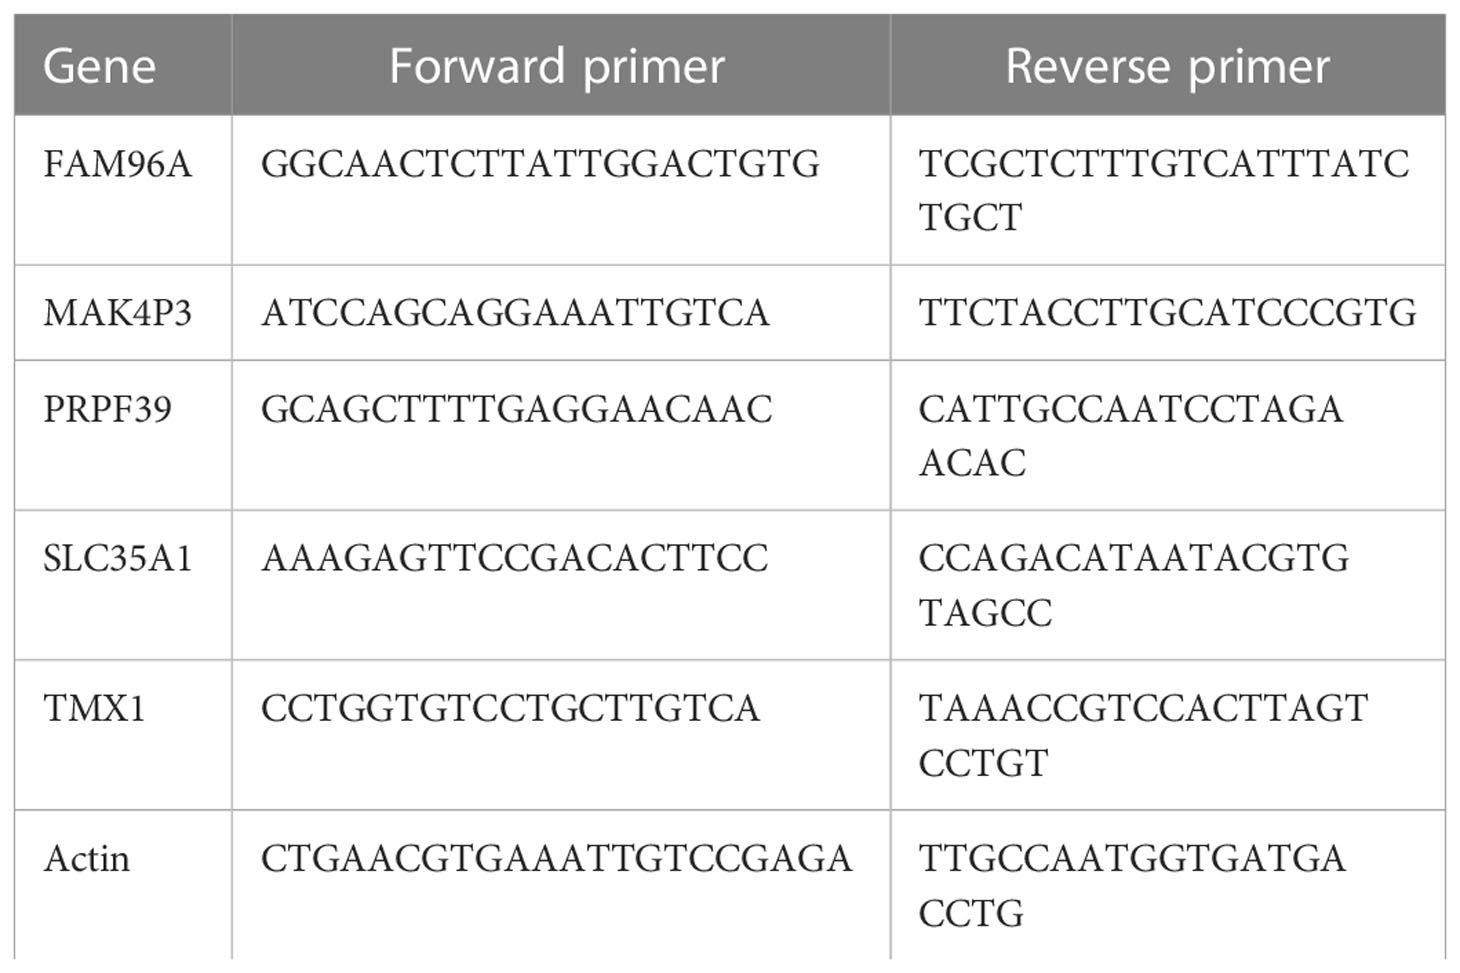
Table 1 The primers used in this study.
3 Results
3.1 CRG identification and immunoassay
We analysed the expression of 13 CRGs between RA and non-RA controls through the GSE93272 dataset (of which GCSH was not present in this dataset, thus leaving 12 CRGs). The results identified seven CRGs as differentially expressed copper death genes. Of these, LIPT1, FDX1, DLD, DBT, LIAS and ATP7A were expressed at significantly higher levels in RA than non-RA levels, while DLST expression levels were significantly lower in RA than non-RA levels (Figures 1A, B). Subsequently, we analysed the location of the 12 CRGs on the chromosome (Figure 1C). We analysed the correlation between CRGs with differential expression to explore whether copper death genes play a role in the development of RA disease (Figure 1D). In addition, we performed an immune infiltration analysis between RA and non-RA samples (Figure 1E). The results showed that RA patients showed higher levels of infiltration in B cells memory, T cells CD8, T cells gamma delta, Macrophages M0, Macrophages M1, Macrophages M2, Dendritic cells activated, Neutrophils showed high levels of infiltration (Figure 1F). This suggests a close association between the development of RA and the immune system. Subsequently, we performed immune infiltration analysis on seven differentially expressed CRGs (Figure 1G). The results showed that there were significant positive correlations between LIPT1, FDX1, DLD and T cells gamma delta; LIAS, DLST, LIPT1, FDX1 and B cells naive; LIAS, LIPT1, DBT, DLST and T cells CD4 naive also had significant positive correlations and so on. It can be seen that CRG may play a key role in the regulation of RA and immune infiltration.
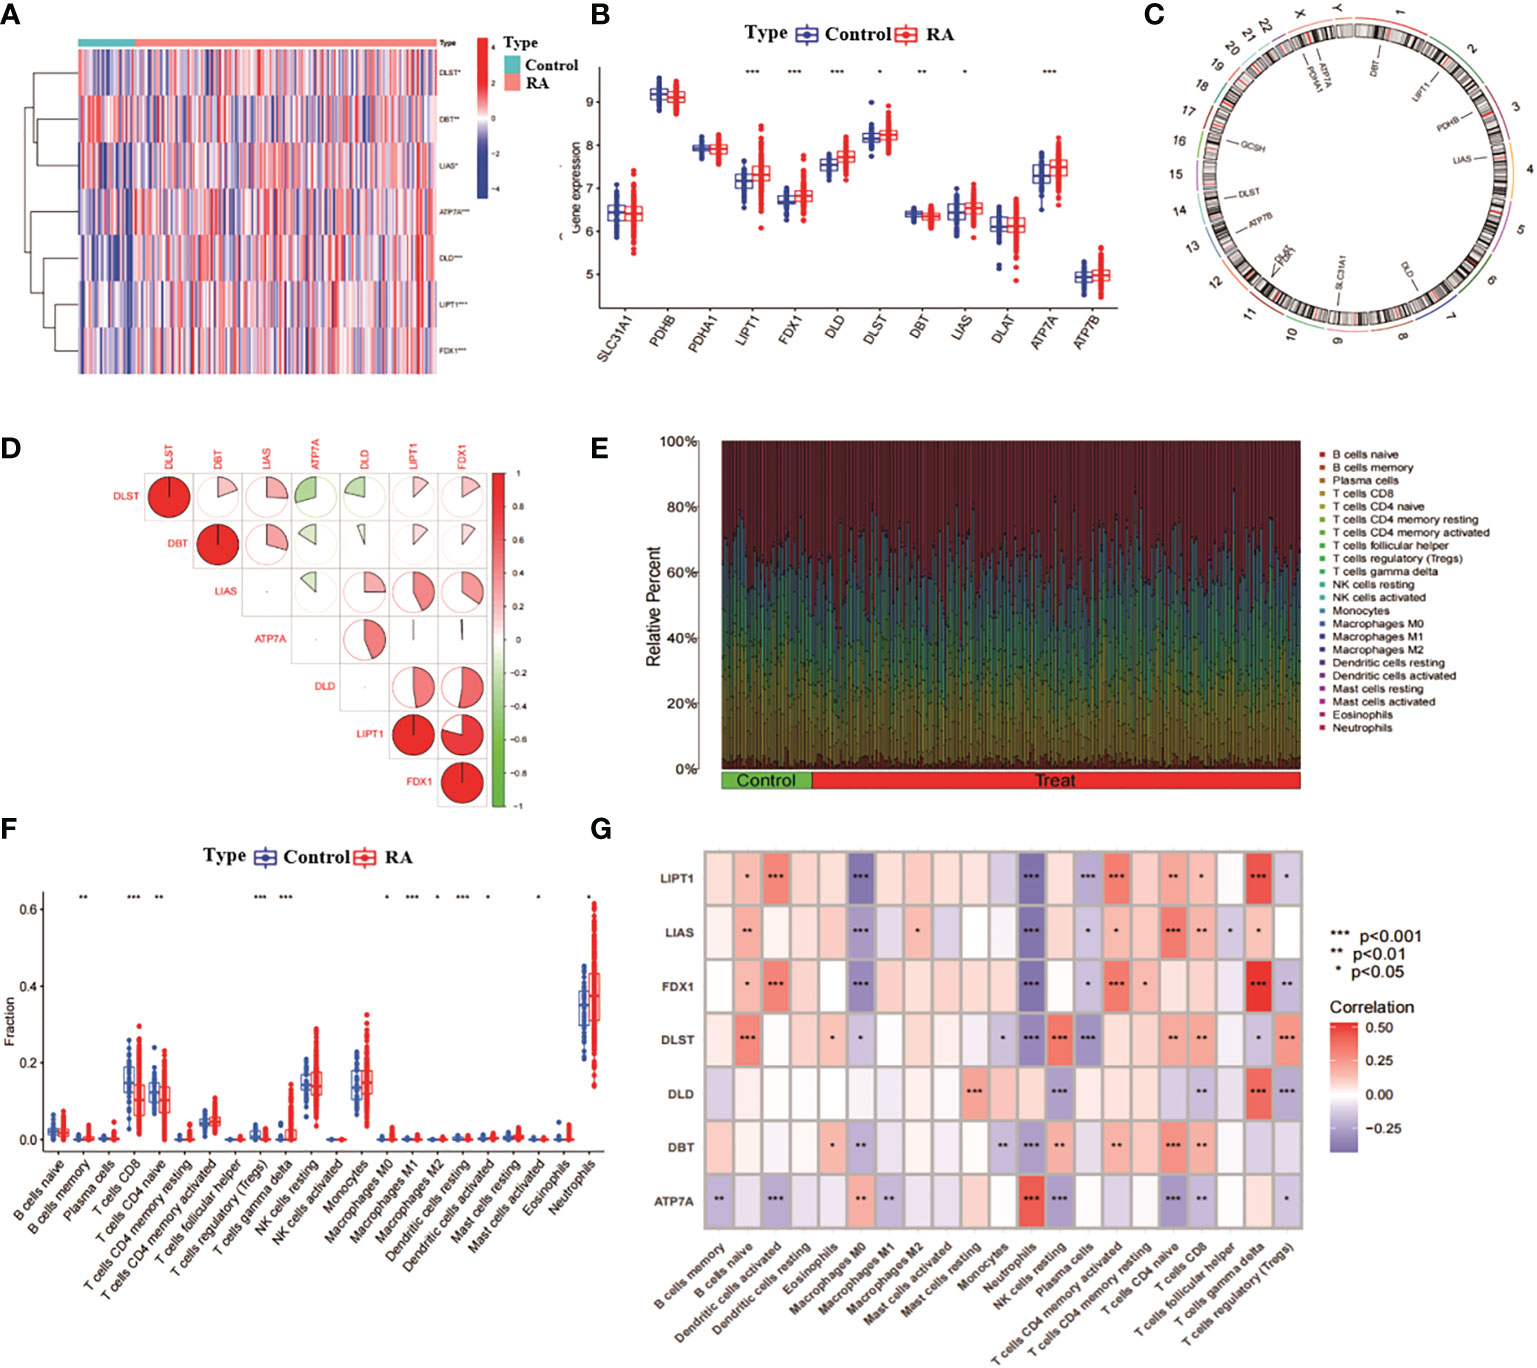
Figure 1 Correlation analysis of RA and CRG. (A) Heat map of 7 CRGs with differential expression. (B) Box line plot of expression of 12 CRGs in RA and non-RA. ***p< 0.0001, **p< 0.001, *p< 0.01, ns, not significant. (C) position of the 12 CRGs on the chromosome. (D) correlation analysis of the 7 differentially expressed CRGs, red and blue represent positive and negative correlations, respectively. The area of the pie chart indicates the correlation coefficient. (E) relative abundance of RA and non-RA among 22 infiltrating immune cells. (F) box plot of the differences in immune infiltration between RA and non-RA. (G) correlation analysis between 7 differentially expressed CRGs and infiltrating immune cells.
3.2 RA unsupervised clustering identification and analysis
To analyse the expression of RA and CRG, we used a consensus clustering algorithm to identify 232 RA samples in groups with the expression profile of seven CRGs, with the best number of clusters when k = 2 (Figure 2A). The CDF values gradually increased when k = 2, 3 and 4, and became smaller when k = 4 (Figures 2B–D). We divided the 232 RA samples into two groups, including cluster 1 (n = 153) and cluster 2 (n = 79). PCA analysis of the two clusters showed significant differences between the two (Figure 2E).
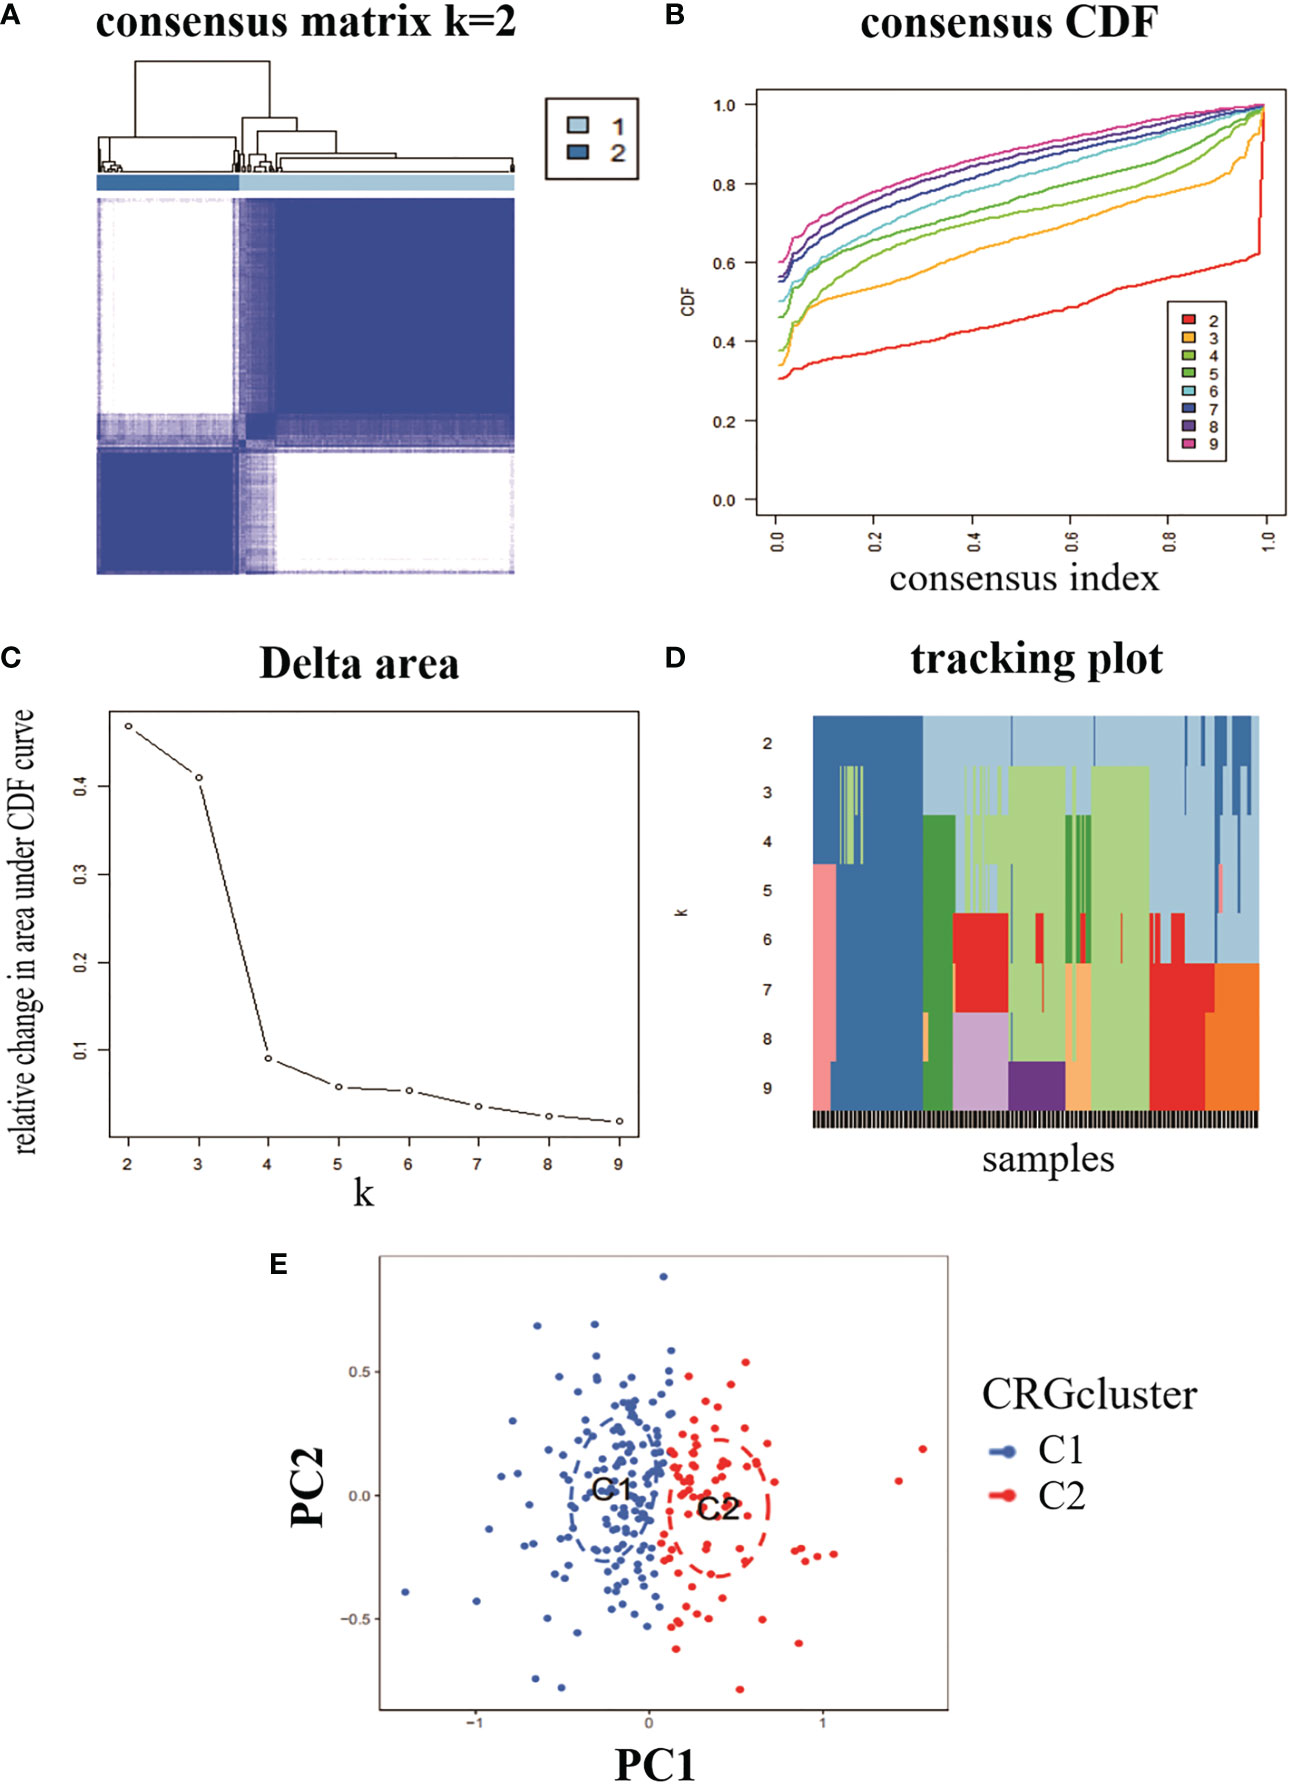
Figure 2 Identification of molecular clusters of genes associated with copper death in RA. (A) consensus clustering matrix at k = 2. (B-D) representative cumulative distribution function (CDF) curves, CDF incremental area curves, consensus clustering scores. (E) visual analysis of the two clustering distributions.
3.3 Expression profile and immune infiltration characteristics of CRGcluster
To explore the characteristics among CRGclusters, we analysed the expression differences of seven CRGs between CRGcluster C1, and CRGcluster C2 (Figure 3A). CRGcluster C2 showed significant high expression levels of FDX1, DLD, LIPT1, and LIAS (Figure 3B). In addition, the immune infiltration of CRGcluster C1 and CRGcluster C2 was analysed (Figure 3C). The results showed that CRGcluster C2 showed higher levels in T cells CD8, T cells CD4 memory activated, and T cells gamma delta. CRGcluster C1 showed higher levels in T cells regulatory (Tregs), Macrophages M0, Macrophages M2, Dendritic cells activated, and Neutrophils had higher expression levels (Figure 3D). Taken together, this suggests that CRGcluster C2 may be more closely associated with the development of RA.
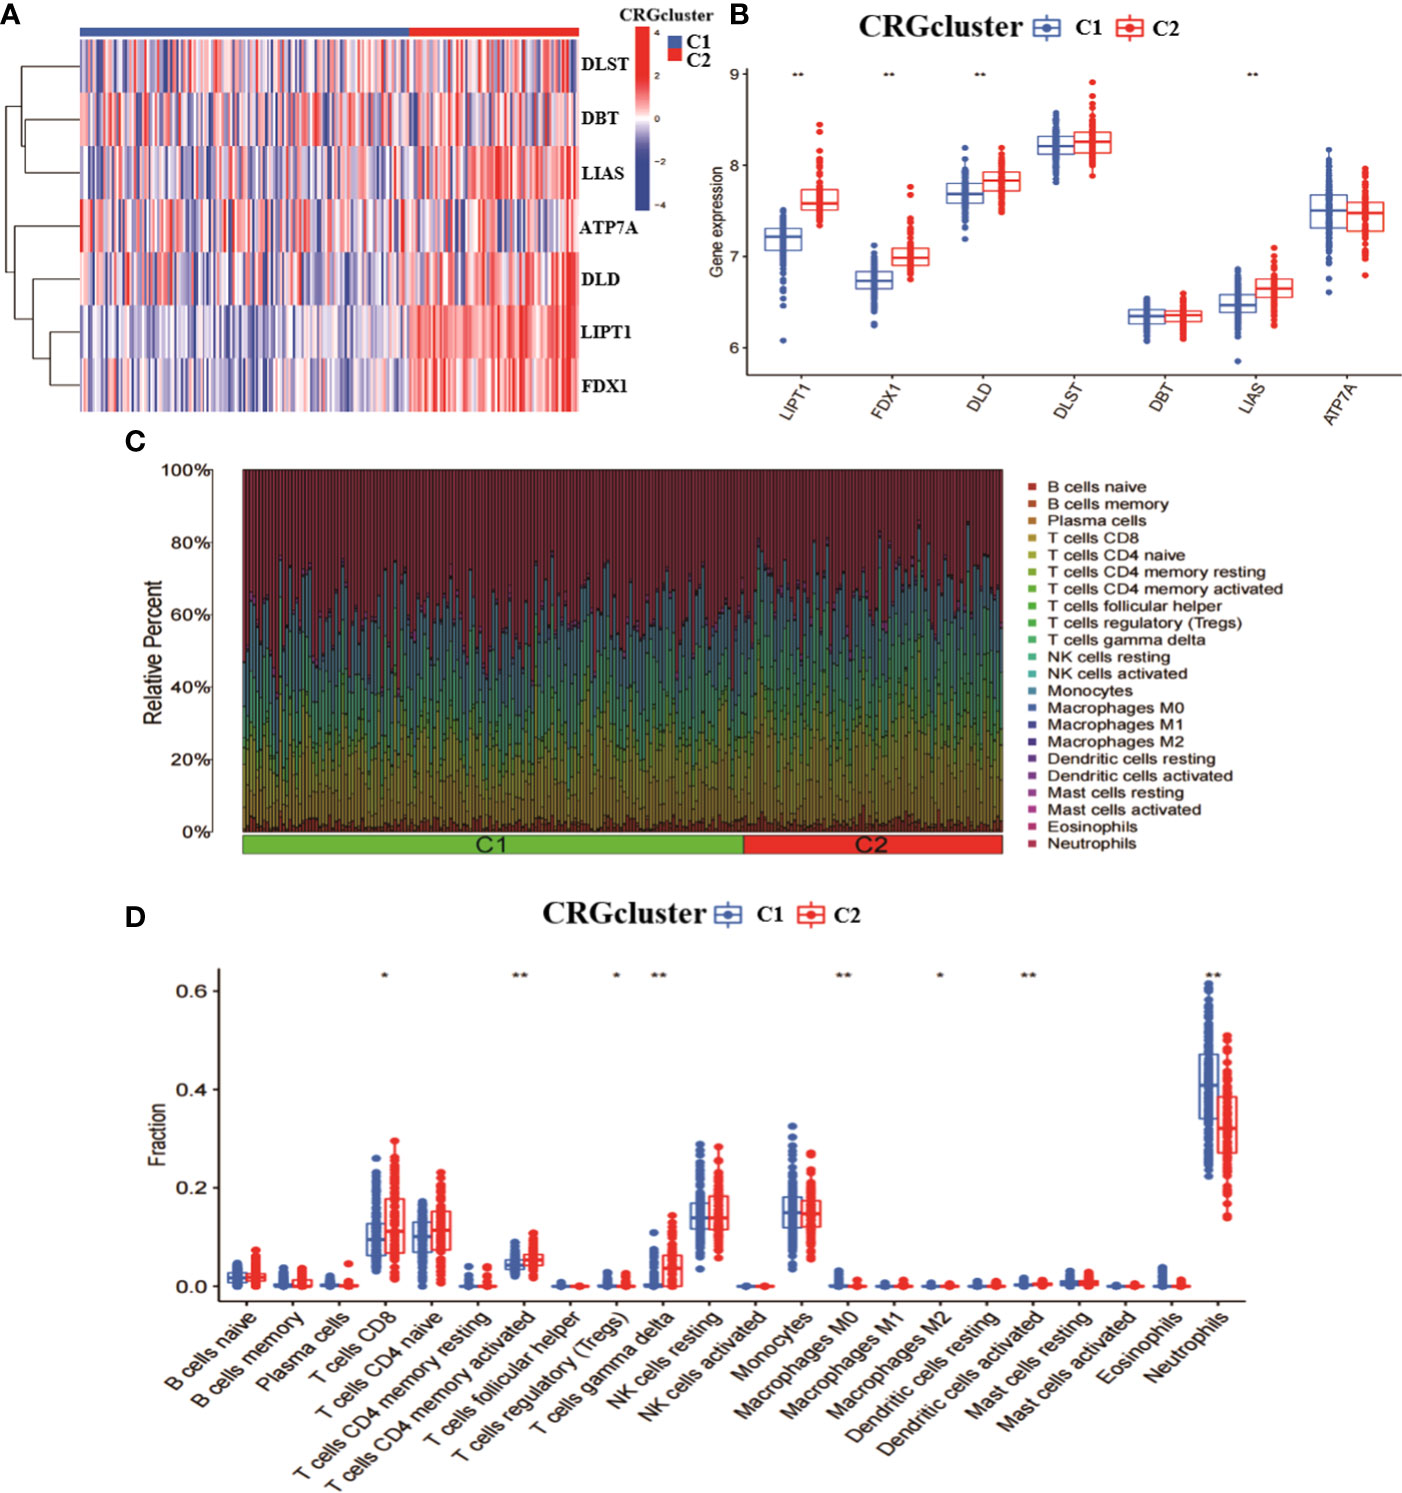
Figure 3 Analysis of the expression and immunological profile between the two molecular clusters. (A) Heat map of the expression of 7 CRGs between two molecular clusters. (B) Box line plot of the expression of 7 CRGs between two molecular clusters. (C) relative abundance between two molecular clusters in 22 infiltrating immune cells. (D) box line plot of immune infiltration between two molecular clusters. **p < 0.0001, *p < 0.01, ns, not significant.
3.4 Consensus clustering analysis of CRGcluster intersection genes
We analysed the role of the 314 intersecting genes in RA by re-clustering the intersecting genes obtained from CRGcluster C1 and CRGcluster C2 using “ConsensusClusterPlus” and further classifying RA patients into different subgroups. The number of clusters was optimal when k = 2 (Figure 4A). When k = 4, the CDF values became smaller (Figures 4B–D). We reclassified the 232 RA samples into two groups: genecluster 1 (n = 146) and genecluster 2 (n = 86).
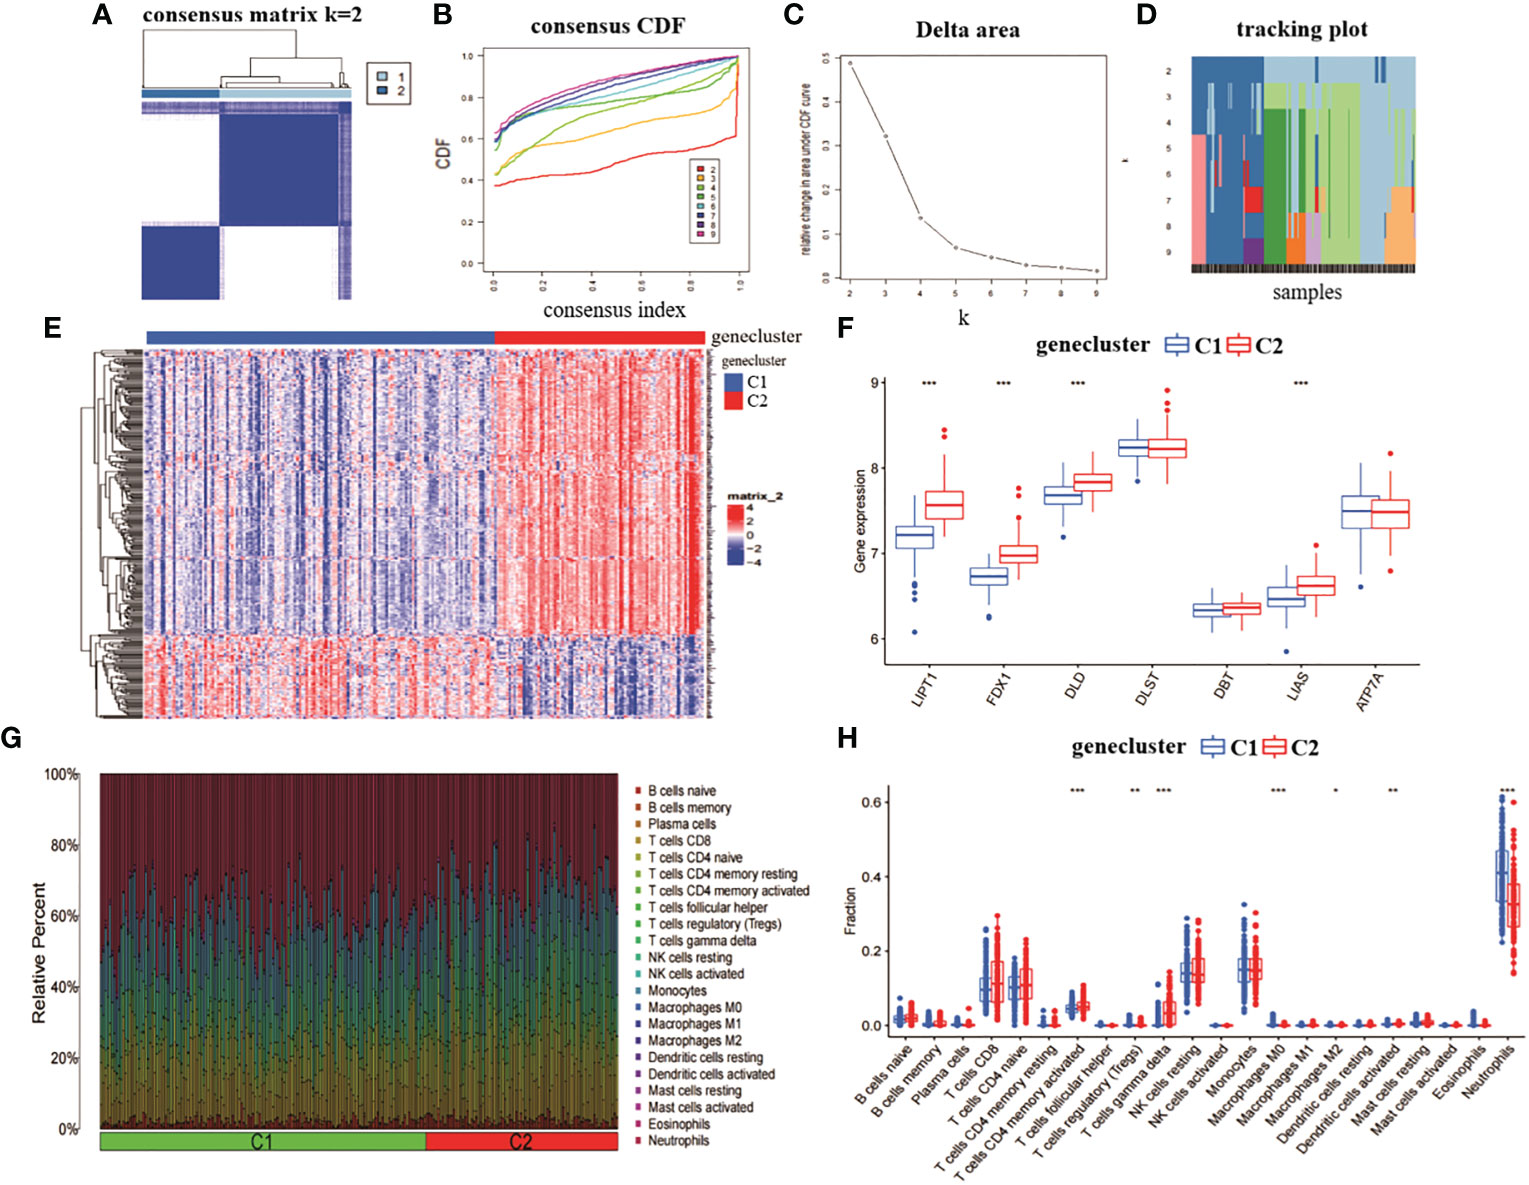
Figure 4 Identification of gene clusters and expression immunoassays in RA. (A) consensus clustering matrix at k = 2. (B-D) representative CDF curves, CDF incremental area curves, consensus clustering scores. (E) heat map of expression levels between two gene clusters. (F) box line plot of expression of 7 CRGs between two gene clusters. ***p< 0.0001, **p< 0.001, *p< 0.01, ns, not significant. (G) relative abundance between two molecular clusters in 22 infiltrating immune cells. (H) box line plot of immune infiltration between two gene clusters.
We also analysed the expression differences of the seven CRGs between genecluster C1 and CRGcluster C2 (Figure 4E). genecluster C2 showed significantly higher expression levels of LIPT1, FDX1, DLD, and LIAS than genecluster C1 (Figure 4F). In addition, we analysed the immune infiltration of genecluster C1 and genecluster C2 (Figure 4G). The results showed that genecluster C2 had higher levels of T cells CD4 memory activated, T cells gamma delta. genecluster C1 had higher levels of T cells regulatory (Tregs), Macrophages M0, Macrophages M2, Dendritic cells activated, and Neutrophils (Figure 4H). Taken together, the correlation between genecluster C2 and RA may be higher than that between genecluster C1.
We plotted the alluvial distribution of copper death-related score subtypes for CRGcluster C1, C2 and genecluster C1, C2 (Figure 5A). We compared the copper death-related scores between genecluster C1 and C2. The results showed that genecluster C2 had a significantly higher copper death-related score than genecluster C1 (Figure 5B). In addition, we also analysed the copper mortality-related scores between CRGcluster C1 and C2. The results showed that CRGcluster C2 had a significantly higher copper death-related score than CRGcluster C1 (Figure 5C). It can be seen that genecluster C2 and CRGcluster C2 correlated more significantly with copper death-related genes. We also compared the expression of 12 CRGs between CRGcluster C1, and C2 and genecluster C1, and C2. The results showed that PDHB, PDHA1, LIPT1, FDX1, DLD, LIAS and DLAT were significantly more expressed in CRGcluster C2 and genecluster C2 than in CRGcluster C1 and genecluster C1; while SLC31A1 and ATP7B were significantly more expressed in CRGcluster C1 and genecluster C1 than in CRGcluster C2 and genecluster C2 (Figures 5D, E).
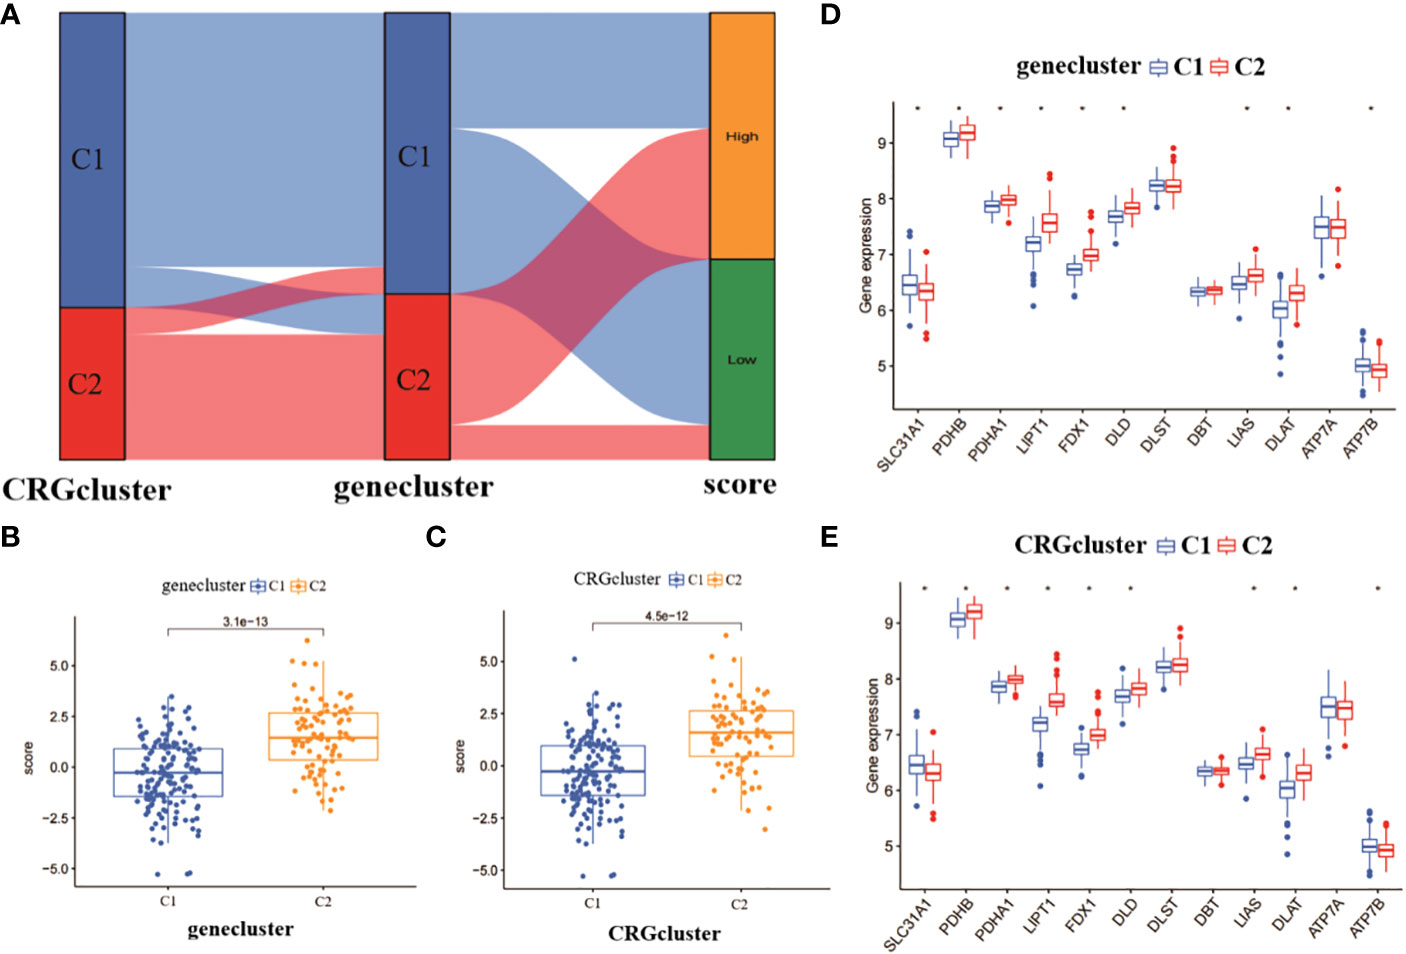
Figure 5 Analysis of copper mortality-related scores and expression differences. (A) Analysis of copper death correlation scores for molecular clusters and gene clusters. (B) Comparison of copper death scores between gene clusters. (C) Comparison of copper death scores between molecular clusters. (D) Differences in expression levels of 12 CRGs between gene clusters. (E) Differences in expression levels of 12 CRGs between molecular clusters *p< 0.0001.
3.5 Gene module screening and co-expression network construction
The 276 DEGs in GSE93272 were screened according to the criteria of Padj < 0.05 and ∣logFC∣ > 0.5 and are presented as volcano and heat maps (Figures 6A, B). In addition, we performed GO and KEGG enrichment analysis on the above 276 DEGs using R language (Figures 7A, B). The enrichment results showed that the 276 DEGs were mainly enriched in response to the virus, defence response to the virus and other pathways involved in Ribosome and Parkinson’s disease.
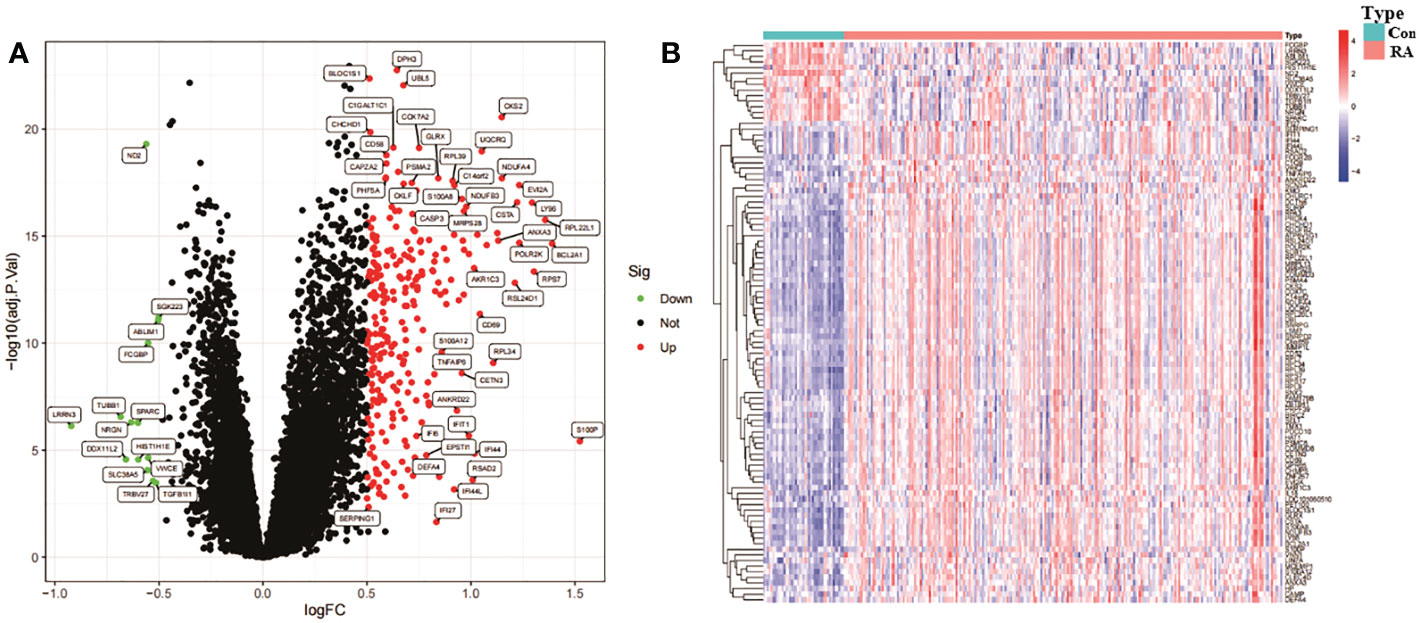
Figure 6 Identification analysis of DEGs. (A) DEGs volcano map. (B) DEGs heat map.
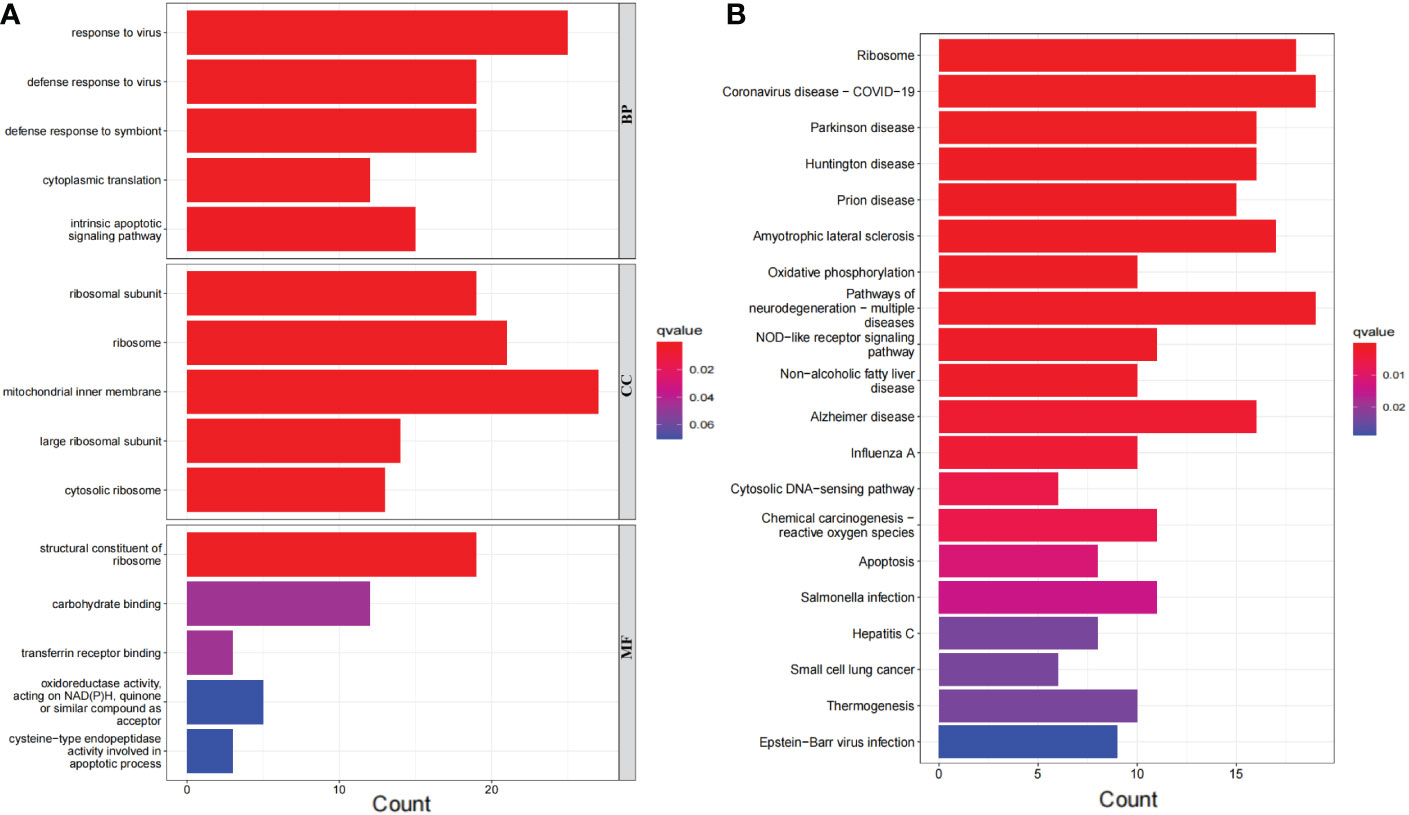
Figure 7 Bar graph of DEGs enrichment. (A) Bar chart of DEGs GO enrichment analysis. (B) Bar chart of DEGs KEGG enrichment analysis.
In addition, we analysed key gene modules closely associated with the CRGcluster using the WGCNA algorithm. We constructed a scale-free network using β = 13, R2 = 0.9 as a criterion (Figure 8A). 5413 genes were classified into 10 key modules and the heat map depicted the TOM of all module-associated genes (Figures 8B–D). Analysis of module-clinical characteristics (Cluster1 and Cluster2) relationships showed that the MEturquoise module (931 genes) had the highest correlation with Cluster2 (0.65) and high intra-module gene significance (Figure 8E). The MEturquoise module gene correlation analysis with Cluster 2 is shown in Figure 8F.
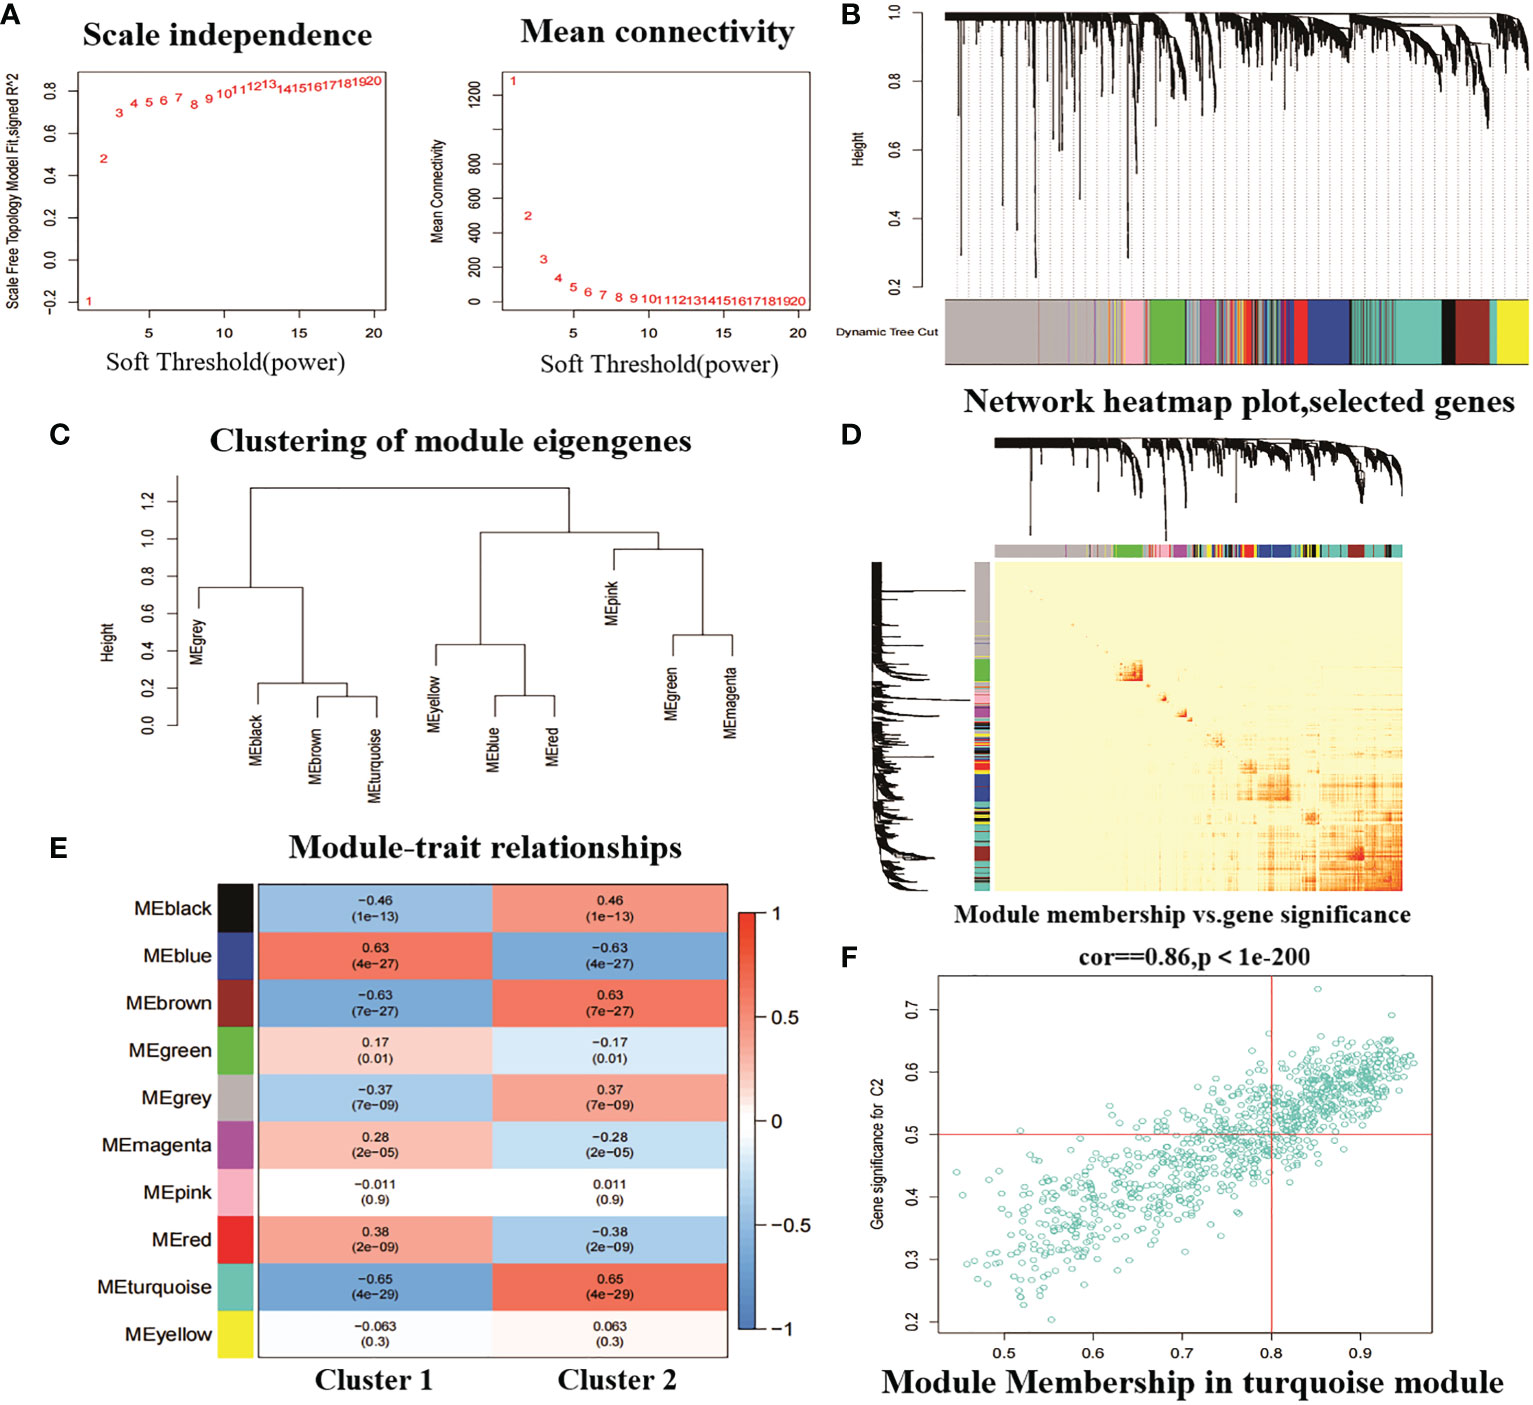
Figure 8 Weighted network analysis between two molecular clusters. (A) Determination of soft threshold power. (B) Cluster tree dendrogram of co-expression modules. Different colours indicate different co-expression modules. (C) representation of clusters of module signature genes. (D) representative heat map of correlations between the 10 modules. (E) correlation analysis between module signature genes and clinical status. (F) scatter plot between MEturquoise module genes and Cluster 2 significantly different genes.
3.6 Construction and evaluation of machine learning models
To further identify specific genes with high diagnostic value, we built four machine learning models, namely RF, SVM, GLM and XGB, based on the 276 DEGs in GSE93272 with crossover genes in the MEturquoise module hub gene. using the “DALEX “ package was used to compare the above four models and to analyse the residual distribution of each model. The results show that the RF model has the relatively lowest residuals (Figures 9A, B). We ranked the top 10 significant genes of each model based on Root mean square error (RMSE) (Figure 9C). The ROC curves of the four models were then plotted based on the 5-fold cross-validation to comprehensively assess their discrimination performance. The AUCs of the four models were, in order, RF: AUC = 0.843; SVM, AUC = 0.746; XGB, AUC = 0.710; and GLM, AUC = 0.773 (Figure 9D). Taken together, we concluded that the RF model was able to better differentiate between the different clusters of patients. the RF model ultimately obtained five significant genes (SLC35A1, PRPF39, MAP4K3, TMX1 and FAM96A), which were used as predictive genes for subsequent analysis.
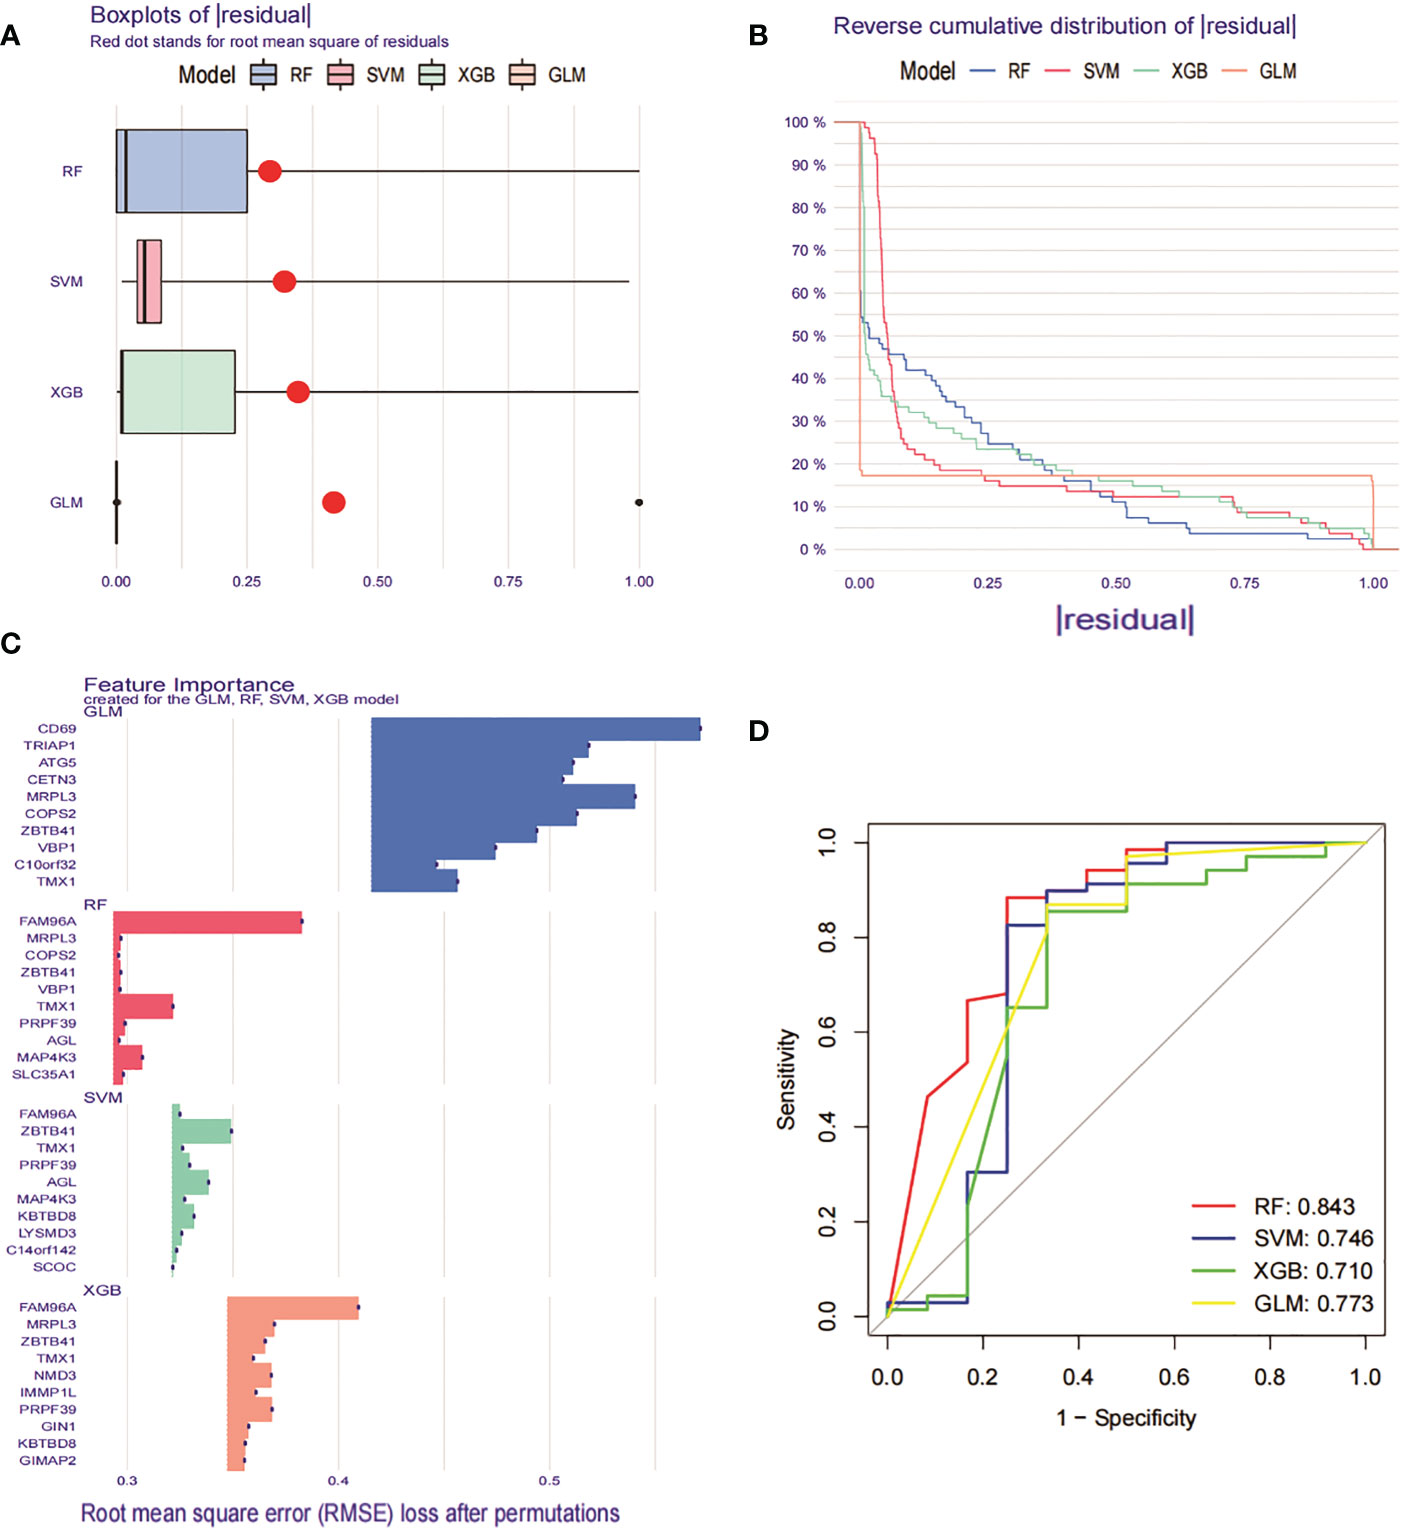
Figure 9 Construction and evaluation of RF, SVM, GLM and XGB machine models. (A) Box plot of residuals for the four machine learning models. The red dots represent the root mean square of residuals (RMSE). (B) Cumulative residual distribution of the 4 machine learning models. (C) Significant functions of the 4 machine learning models. (D) ROC curves of the 4 machine learning models plotted based on a 5-fold cross-validation of the test set.
We constructed column line plots to further evaluate the predictive effectiveness of the RF model (Figure 10A). The predictive efficiency of the constructed line plot model was evaluated using a combination of the calibration curve and DCA, with the calibration curve showing a small margin of error between the actual and predicted risk of RA clustering (Figure 10B), and the DCA results indicating that the line plot is highly accurate and can provide some reference and basis for clinical treatment decisions (Figure 10C).
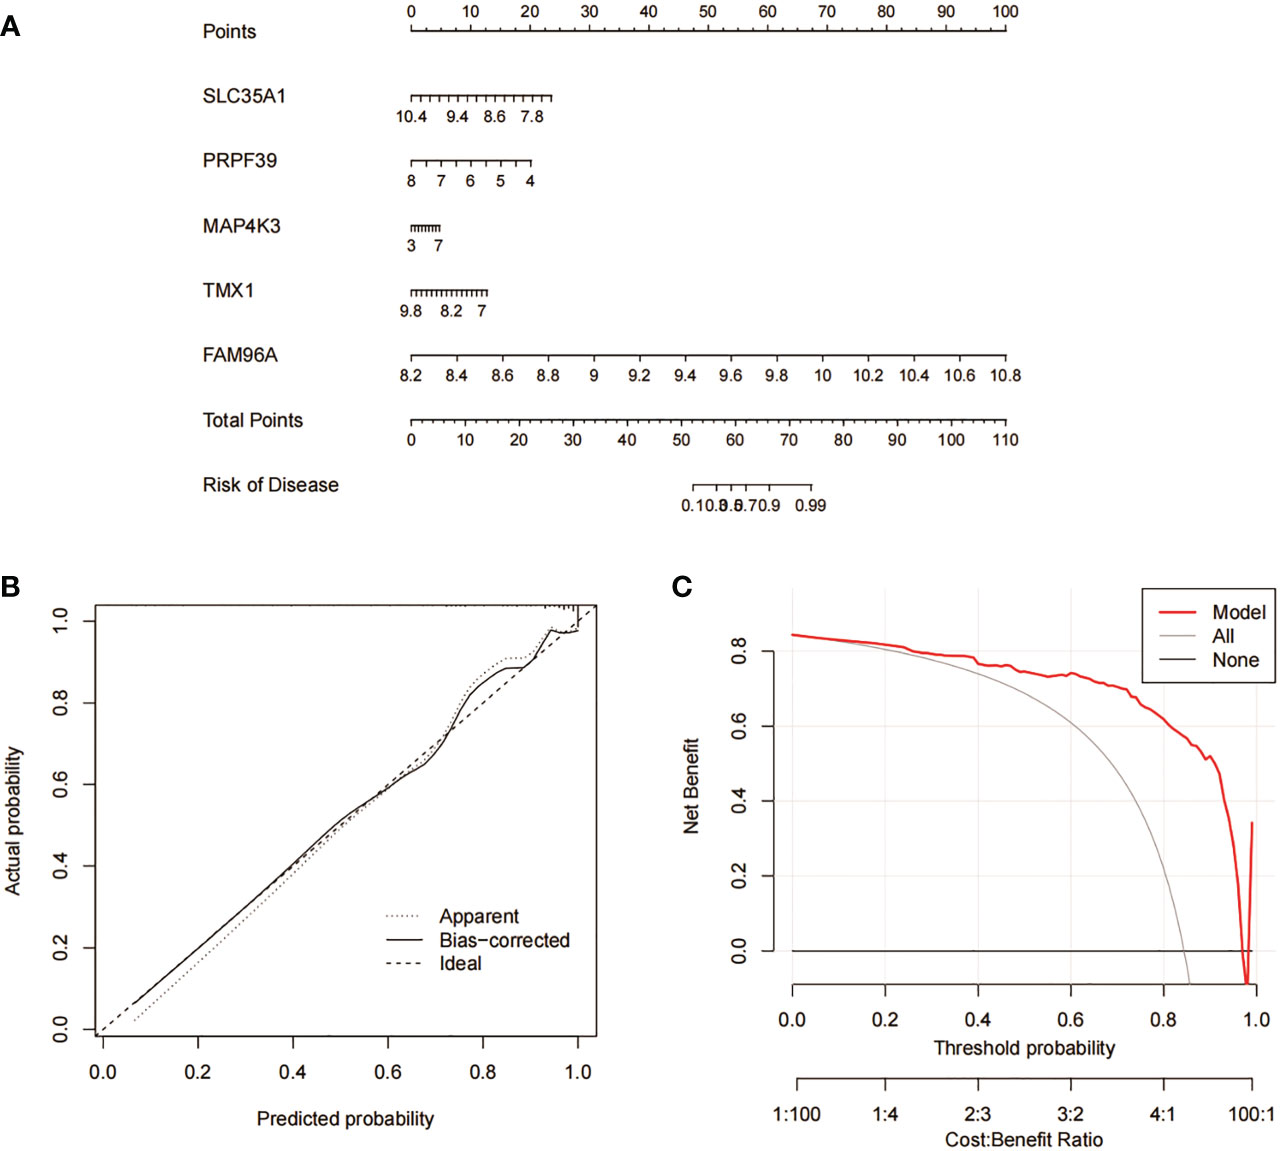
Figure 10 Validation analysis of RF predicted genes. (A) Nomogram model for predicting RA risk based on 5 genes in RF. (B) Construction of calibration curve. (C) Construction of DCA.
3.7 RF candidate gene evaluation analysis
In addition, we analysed the ROC curves of five genes, SLC35A1, PRPF39, MAP4K3, TMX1 and FAM96A, between RA and non-RA patient samples, and also compared their differential expression levels in different samples. the results of the ROC curves showed that FAM96A had the highest diagnostic value (AUC=0.902), while the other four genes had AUC all over 0.750, which was a more satisfactory prediction (Figures 11A–E). In addition, by performing a differential analysis of their expression levels, the results showed that all five genes were significantly more expressed among RA patients than in the non-RA patient group (Figures 11F–J).
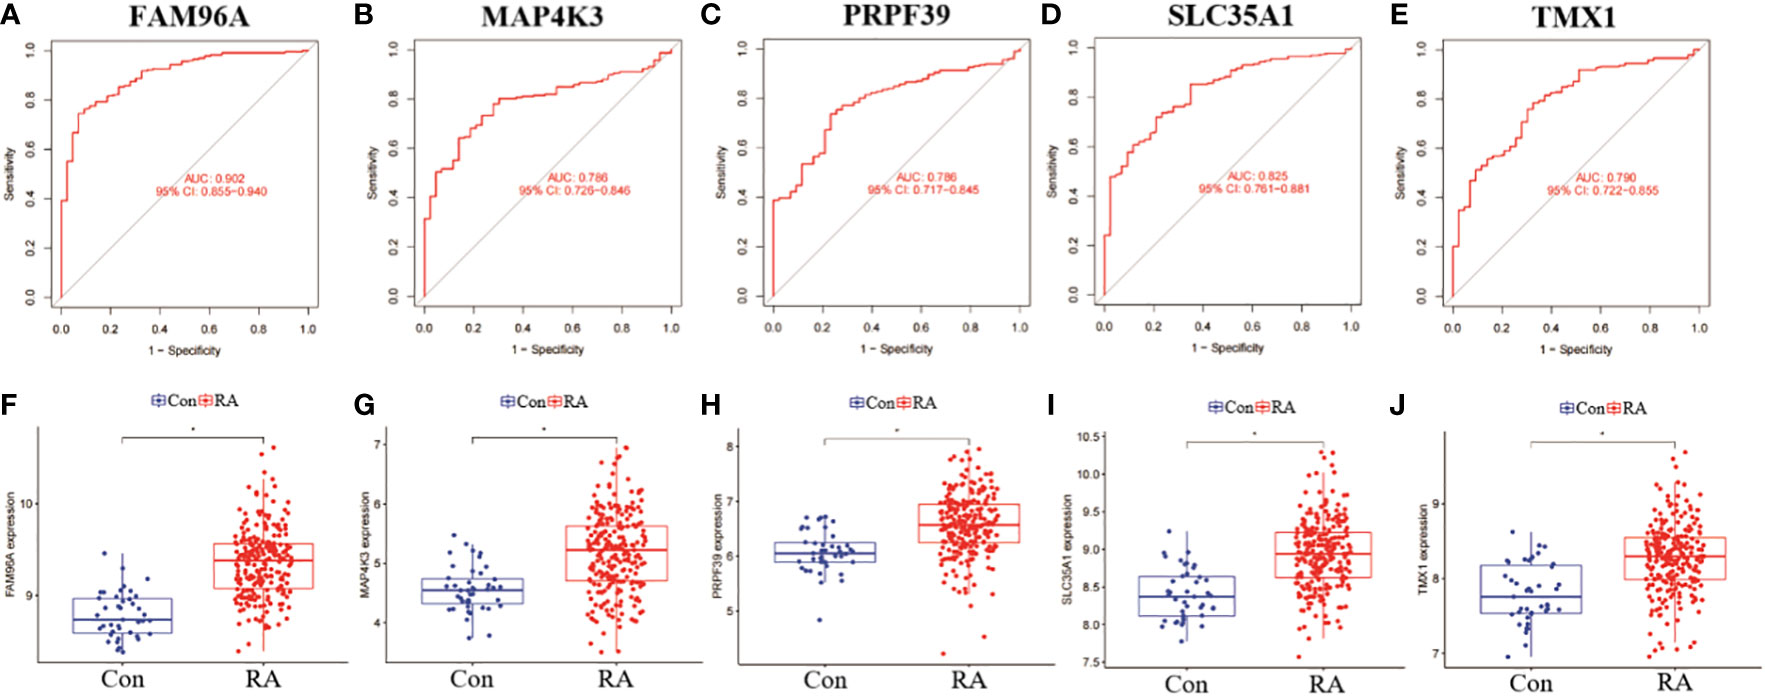
Figure 11 Validation and expression analysis of RF predicted genes. (A-E) ROC plots of RF 5 genes. (B-J) Differences in expression levels of RF 5 genes between RA and non-RA. *p< 0.0001.
3.8 Predictive gene validation by qRT-PCR in experimental RA animal models
qRT-PCR was used to detect and compare the expression of identified genes in the ankle tissue of the RA model and control rats (Figure 12). Compared with normal controls, five genes were significantly increased in the ankle RA rat model, including FAM96A, MAK4P3, PRPF39, SLC35A1, and TMX1(P<0.05).
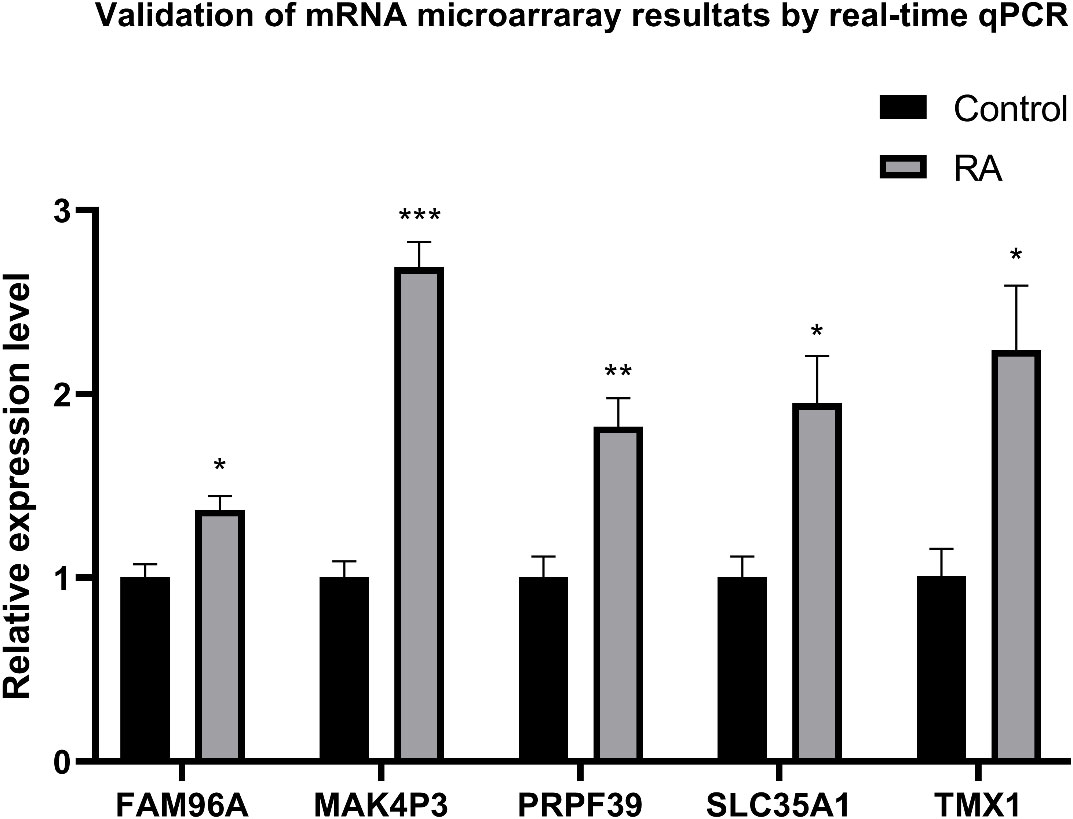
Figure 12 qRT-PCR was used to express ankle genes in RA models and controls. The expressions of 9 genes in the ankle joint of the RA model, including FAM96A, MAK4P3, PRPF39, SLC35A1 and TMX1, were significantly increased. *P<0.05, **P<0.01, ***P<0.001.
4 Discussion
Because the complex pathophysiological mechanisms of RA are not fully understood, early and accurate diagnosis as well as treatment and management of RA is essential (41). Over the past few decades, there have been increasing advances in the symptomatic treatment of RA (NSAIDs and GCs) and the management of disease remission (DMARDs) (4). The identification of more appropriate molecular clusters is therefore essential to guide the individualised treatment of RA. The recently reported copper-dependent form of cell death is mainly caused by aggregation of lipid acylation-related proteins, loss of iron-sulfur cluster proteins and a series of other stress responses culminating in cell death, and the association with RA is multifaceted (15, 23). However, the specific mechanisms and roles of copper death regulation in various diseases have not been further investigated. Therefore, this study attempts to elucidate the relationship between copper death-associated genes and RA phenotypes, as well as to analyse their specific role in the immune microenvironment, and we also use copper death-associated genes to predict subtypes of RA. Finally, the expression of the identified predicted genes was detected and compared in the ankle tissue of the RA model and control rats by qRT-PCR. Five genes were significantly increased in the ankle RA rat model compared to the normal control group.
In the present study, we conducted the first comprehensive analysis of the differential expression of CRGs between healthy and RA patients. The results showed that 7 out of 12 CRGs were differentially expressed between RA and healthy individuals and that the expression of 7 CRGs was significantly higher in RA patients than in normal individuals, suggesting that CRGs may be closely associated with the development of RA. Subsequently, we analysed the correlation between CRGs to elaborate on the association between CRGs and RA. In contrast, RA patients had significant infiltration of B cells memory, T cells CD8, T cells gamma delta, Macrophages M0, Macrophages M1, Macrophages M2, Dendritic cells activated, Neutrophils. In addition, we performed an unsupervised clustering analysis based on CRG expression levels and identified two clusters of copper death-related gene molecules. Four differentially expressed CRGs, namely FDX1, DLD, LIPT1, and LIAS were expressed at significantly higher levels in CRGcluster C2 than in CRGcluster C1 and had higher levels of immune infiltration in T cells CD8, T cells CD4 memory activated, and T cells gamma delta. We further grouped RA patients by re-clustering the intersecting genes between CRGcluster C1 and CRGcluster C2 and obtained two different subgroups: genecluster C1 and genecluster C2. genecluster C2 showed that the expression levels of LIPT1, FDX1, DLD, LIAS genecluster C2 showed significantly higher levels of LIPT1, FDX1, DLD and LIAS than genecluster C1. genecluster C2 showed higher levels of T cell CD4 memory activated and T cell gamma delta. The correlation between genecluster C2 and RA may be higher than that between genecluster C1. copper death-related scores showed that CRGcluster 2 and genecluster C2 had higher scores than CRGcluster C1 and genecluster C1, respectively, and the expression levels of 12 CRGs were also higher than those of CRGcluster C1, and genecluster C1.
In recent years, machine learning (ML) has been widely used in the clinical field and is considered an important tool in healthcare (42, 43). ML has also contributed to the prediction of biomarkers for RA disease, prognostic modelling, and drug screening. And ML has also contributed to the prediction of RA disease biomarkers, the development of prognostic models, and drug screening (44, 45). In comparison with the traditional statistical model, the comprehensive analysis of ML ensures the robustness of the model and improves the prediction accuracy through iterative algorithm (46, 47). In the current study, we compared the predictive performance of four machine learning models (RF, SVM, GLM and XGB). These models are based on 276 cross genes in MEturquoise modules closely related to DEGs and CRGclusters in GSE93272 and established a predictive model based on RF, which gives the best prediction (AUC = 0.843). We subsequently identified five significant predictive genes (SLC35A1, PRPF39, MAP4K3, TMX1 and FAM96A) based on RF. Solute carrier family 35 member A1 (Slc35a1) is a specific transporter protein. In sialic acid (SA) metabolism, the transfer of cytidine-5’-monophosphate-SA to the medial and trans-Golgi is a substrate for the sialylation of proteins by various sialic acid transferases (48). SA is a highly diverse family of acidic glycans, whose functions are to stabilize cell membranes, facilitate interactions with the environment, enhance intercellular adhesion and signalling, and regulate the affinity of ligands for receptors (49, 50). Previous studies have found that Slc35a1 is a key step in all SA synthesis pathways, and that ablation of Slc35a1 decreases SA translocation to the cell surface and thus reduces expression (51–53). On the other hand, SA-modified liposomal formulation, based on the high expression of L-selectin in peripheral blood neutrophils and SA as its targeting ligand have been proved to be an effective neutrophil-mediated drug delivery system targeting RA (54).
Pre-mRNA splicing factor 39 (PRPF39) is an alternative splicing factor. It is a homolog of the yeast Prp39 and Prp42 paralogs, that is tightly coupled to gene transcription and subsequent splicing processes (55, 56). Previous studies have found that PRPF39 expression levels strongly influence in vitro splicing (57), particularly in immune cell differentiation and activation, for which regulated intron retention has been shown to play an important role in controlling gene expression and function (58). On the other hand, it was found that RA was closely related to splicing variants (59, 60), and by examining the altered levels of splicing mechanism components and inflammatory mediators, it was found that the dysregulation of splicing mechanism components, such as SNRNP70, SNRNP200 and U2AF2, could be reversed when TNFi was intervened in vivo (61). Previous studies have identified an alternatively spliced TNRF2 isoform, a soluble receptor. The alternatively spliced absence of exons 7 and 8 (DS-TNFR2), which encode transmembrane and cytoplasmic structural domains, constitutes the majority of sTNFR2 in RA patients and serum sTNFR2 is strongly associated with RA activity and severity (62–64).
Mitogen-activated Protein kinase kinases (Also called Germinal center kinase-like kinase, GLK/MAP4Ks), belong to the mammalian Ste20-like family of serine/threonine kinases (65). Previous studies have found that MAP4K3 is involved in extracellular signalling to regulate gene transcription, apoptosis and immune inflammation (66–68); On the other hand, MAP4K3 also activates mTOR signalling in epithelial cell lines after sensing cellular nutrient and energy levels and plays a key role in activating NF-κb signalling in T cells after antigen stimulation (69). Previous studies have demonstrated that MAP4K3 expression levels are significantly increased in peripheral blood T cells from patients with autoimmune diseases such as RA (70), SLE (71) and adult-onset Still’s disease (66). In a study by Chen et al., it was found that the frequency of overexpression of MAK4P3 by circulating T cells was significantly increased, and the production of MAK4P3 was found to decrease in parallel with disease remission in these patients, thus suggesting that MAK4P3 is closely related to immune like disease activities (66, 71). These enrich the evidence that overexpression of MAK4P3 is associated with a series of inflammatory diseases. In conclusion, MAP4K3 plays an important role in immune cell signalling, immune response and inflammation.
ER is known to be the site of biosynthesis of all secreted and membrane proteins. Its inner lumen is a unique environment that is critical for the correct folding of proteins secreted or displayed on the cell surfacee (72). ER stress, in turn, results from the accumulation of unfolded proteins (UPR) in the ER and can cause a range of pathologies such as chronic autoimmune inflammation (73). Previous studies have found that RA inflammation and ER stress work in parallel by driving inflammatory cells to release cytokines that induce chronic ER stress pathways, and synovial cells promote inflammation by continuously producing large amounts of proteins and that ERAD may be a necessary processing system for ER homeostasis in order to prevent further development (74, 75); Another study has shown that enhanced ERAD can effectively remove unfolded proteins from the ER, thereby indirectly inhibiting UPR activation (76). This suggests that a dysregulated ER response is closely linked to the development of synovial hyperplasia and chronic arthritis. TMX1 is a topology-specific endoplasmic reticulum-resident reductase, the most characteristic member of the TMX family, whose main biological functions are protein folding and ER-associated degradation Ca2+ flux regulation (77, 78). Thus TMX1 may be closely associated with RA by promoting misfolded polypeptide mismatches across the ER membrane for ER-related degradation.
Family with sequence similarity 96 member A (FAM96A), also known as Cytosolic iron-sulphur (Fe/S) assembly component 2A (CIAO2A), is an evolutionarily conserved protein highly expressed in the immune system, associated with cytosolic iron assembly and tumour suppression, and is widely expressed in many tissues (79, 80). Yin et al. found that the release of relevant pro-inflammatory factors was significantly slowed in FAM96A knockout mice and that sepsis could be slowed by the action of macrophages (79). Probably due to the important role of macrophages in immune homeostasis and inflammatory processes (81, 82), FAM96A may regulate RA by controlling the secretion of multiple inflammatory factors as well as multiple metabolisms of macrophages.
However, there are still some limitations in this study. First, our current study is based on bioinformatic analysis and simple experimental validation. In the future, more comprehensive clinical or experimental studies are needed to validate the relationship between copper death-related candidate genes and RA. In addition, more detailed clinical characterisation is needed to test the performance of the prediction model, and more RA samples are needed to assess the accuracy of copper death-related candidate genes.
5 Conclusion
In this study, we constructed column line plots based on 5 genes, SLC35A1, PRPF39, MAP4K3, TMX1 and FAM96A, and the results showed that the predictive effect of the model was more obvious. In addition, we analysed the expression differences of the above five genes between RA and non-RA patients, and the results showed that the expression levels of all five genes were significantly higher among RA patients than the non-RA patient group; and the ROC curve results showed that FAM96A had the highest diagnostic value (AUC=0.902). Finally, validation was performed by qRT-PCR assay. In conclusion, the five important candidate genes obtained based on the RF model have more satisfactory results in assessing the pathological outcomes and subtypes in RA patients.
Data availability statement
The datasets presented in this study can be found in online repositories. The names of the repository/repositories and accession number(s) can be found in the article/supplementary material.
Ethics statement
The animal study was reviewed and approved by Changchun University of Chinese Medicine Scientific Research Ethics Review Committee No. ccucm-2017-0015.
Author contributions
YZ, XL, SS and CL designed the study. XL, LN, QZ and JH collected the literature and WS, JZ verified the results through experiments. YZ wrote the article. CL and SS reviewed and edited the manuscript. CL and SS contributed equally to this work. All authors have read and approved the final manuscript. All authors contributed toward data analysis, drafting and critically revising the paper and agree to be accountable for all aspects of the work.
Conflict of interest
The authors declare that the research was conducted in the absence of any commercial or financial relationships that could be construed as a potential conflict of interest.
Publisher’s note
All claims expressed in this article are solely those of the authors and do not necessarily represent those of their affiliated organizations, or those of the publisher, the editors and the reviewers. Any product that may be evaluated in this article, or claim that may be made by its manufacturer, is not guaranteed or endorsed by the publisher.
Supplementary material
The Supplementary Material for this article can be found online at: https://www.frontiersin.org/articles/10.3389/fimmu.2023.1103509/full#supplementary-material
References
1. Smolen JS, Aletaha D, McInnes IB. Rheumatoid arthritis. Lancet (London England) (2016) 388:2023–38. doi: 10.1016/s0140-6736(16)30173-8
2. Lin YJ, Anzaghe M, Schülke S. Update on the pathomechanism, diagnosis, and treatment options for rheumatoid arthritis. Cells (2020) 9(4):880. doi: 10.3390/cells9040880
3. Scott DL, Wolfe F, Huizinga TW. Rheumatoid arthritis. Lancet (London England) (2010) 376:1094–108. doi: 10.1016/s0140-6736(10)60826-4
4. Radu AF, Bungau SG. Management of rheumatoid arthritis: An overview. Cells (2021) 10(11):2857. doi: 10.3390/cells10112857
5. Løgstrup BB, Ellingsen T, Pedersen AB., Darvalics B, Olesen KKW, Bøtker HE, Maeng M, et al. Cardiovascular risk and mortality in rheumatoid arthritis compared with diabetes mellitus and the general population. Rheumatol (Oxford England) (2021) 60:1400–9. doi: 10.1093/rheumatology/keaa374
6. Wen P, Luo P, Zhang B, Wang Y, Hao L, Wang J, Guo J, et al. Hotspots and future directions in rheumatoid arthritis-related cardiovascular disease: A scientometric and visualization study from 2001 to 2021 based on web of science. Front Med (2022) 9:931626. doi: 10.3389/fmed.2022.931626
7. Yan S, Kotschenreuther K, Deng S, Kofler DM. Regulatory T cells in rheumatoid arthritis: Functions, development, regulation, and therapeutic potential. Cell Mol Life Sci CMLS (2022) 79:533. doi: 10.1007/s00018-022-04563-0
8. Kroos S, Kampstra ASB, Toes REM, Slot LM, Scherer HU. Absence of Epstein-Barr virus DNA in anti-citrullinated protein antibody-expressing b cells of patients with rheumatoid arthritis. Arthritis Res Ther (2022) 24:230. doi: 10.1186/s13075-022-02919-2
9. Prieto-Potin I, Largo R, Roman-Blas JA, Herrero-Beaumont G, Walsh DA. Characterization of multinucleated giant cells in synovium and subchondral bone in knee osteoarthritis and rheumatoid arthritis. BMC Musculoskelet Disord (2015) 16:226. doi: 10.1186/s12891-015-0664-5
10. Qiu J, Wu B, Goodman SB, Berry GJ, Goronzy JJ, Weyand CM. Metabolic control of autoimmunity and tissue inflammation in rheumatoid arthritis. Front Immunol (2021) 12:652771. doi: 10.3389/fimmu.2021.652771
11. Oyewole AO, Birch-Machin MA. Mitochondria-targeted antioxidants. FASEB J Off Publ Fed Am Soc Exp Biol (2015) 29:4766–71. doi: 10.1096/fj.15-275404
12. Cui L, Weiyao J, Chenghong S, Limei L, Xinghua Z, Bo Y, et al. Rheumatoid arthritis and mitochondrial homeostasis: The crossroads of metabolism and immunity. Front Med (2022) 9:1017650. doi: 10.3389/fmed.2022.1017650
13. Leishangthem BD, Sharma A, Bhatnagar A. Role of altered mitochondria functions in the pathogenesis of systemic lupus erythematosus. Lupus (2016) 25:272–81. doi: 10.1177/0961203315605370
14. Ryu C, Walia A, Ortiz V, Perry C, Woo S, Reeves BC, et al. Bioactive plasma mitochondrial DNA is associated with disease progression in scleroderma-associated interstitial lung disease. Arthritis Rheumatol (Hoboken N.J.) (2020) 72:1905–15. doi: 10.1002/art.41418
15. Tsvetkov P, Coy S, Petrova B, Dreishpoon M, Verma A, Abdusamad M, et al. Copper induces cell death by targeting lipoylated TCA cycle proteins. Sci (New York N.Y.) (2022) 375:1254–61. doi: 10.1126/science.abf0529
16. Cui X, Wang Y, Liu H, Shi M, Wang J, Wang Y. The molecular mechanisms of defective copper metabolism in diabetic cardiomyopathy. Oxid Med Cell Longevity (2022) 2022:5418376. doi: 10.1155/2022/5418376
17. Oliveri V. Selective targeting of cancer cells by copper ionophores: An overview. Front Mol Biosci (2022) 9:841814. doi: 10.3389/fmolb.2022.841814
18. Wang Y, Zhang L, Zhou F. Cuproptosis: A new form of programmed cell death. Cell Mol Immunol (2022) 19:867–8. doi: 10.1038/s41423-022-00866-1
19. Baker ZN, Cobine PA, Leary SC. The mitochondrion: A central architect of copper homeostasis. Metallomics Integrated Biometal Sci (2017) 9:1501–12. doi: 10.1039/c7mt00221a
20. Soto IC, Fontanesi F, Liu J, Barrientos A. Biogenesis and assembly of eukaryotic cytochrome c oxidase catalytic core. Biochim Biophys Acta (2012) 1817:883–97. doi: 10.1016/j.bbabio.2011.09.005
21. Dennerlein S, Rehling P. Human mitochondrial COX1 assembly into cytochrome c oxidase at a glance. J Cell Sci (2015) 128:833–7. doi: 10.1242/jcs.161729
22. Xin L, Yang X, Cai G, Fan D, Xia Q, Liu L, et al. Serum levels of copper and zinc in patients with rheumatoid arthritis: A meta-analysis. Biol Trace Element Res (2015) 168:1–10. doi: 10.1007/s12011-015-0325-4
23. Zhao J, Guo S, Schrodi SJ, He D. Cuproptosis and cuproptosis-related genes in rheumatoid arthritis: Implication, prospects, and perspectives. Front Immunol (2022) 13:930278. doi: 10.3389/fimmu.2022.930278
24. Zou Y, et al. Leveraging diverse cell-death patterns to predict the prognosis and drug sensitivity of triple-negative breast cancer patients after surgery. Int J Surg (London England) (2022) 107:106936. doi: 10.1016/j.ijsu.2022.106936
25. Gracey E, et al. Sexual dimorphism in the Th17 signature of ankylosing spondylitis. Arthritis Rheumatol (Hoboken N.J.) (2016) 68:679–89. doi: 10.1002/art.39464
26. Newman AM, et al. Determining cell type abundance and expression from bulk tissues with digital cytometry. Nat Biotechnol (2019) 37:773–82. doi: 10.1038/s41587-019-0114-2
27. Wilkerson MD, Hayes DN. ConsensusClusterPlus: A class discovery tool with confidence assessments and item tracking. Bioinf (Oxford England) (2010) 26:1572–3. doi: 10.1093/bioinformatics/btq170
28. Nguyen TS, Fernando B. Effective multimodal encoding for image paragraph captioning. IEEE Trans Image Process Publ IEEE Signal Process Soc (2022) 31:6381–95. doi: 10.1109/tip.2022.3211467
29. Jiang Z, Luo Y, Zhang L, Li H, Pan C, Yang H, et al. A novel risk score model of lactate metabolism for predicting over survival and immune signature in lung adenocarcinoma. Cancers (2022) 14(15):3727. doi: 10.3390/cancers14153727
30. Hu Y, Han J, Ding S, Liu S, Wang H. Identification of ferroptosis-associated biomarkers for the potential diagnosis and treatment of postmenopausal osteoporosis. Front Endocrinol (2022) 13:986384. doi: 10.3389/fendo.2022.986384
31. Langfelder P, Horvath S. WGCNA: An r package for weighted correlation network analysis. BMC Bioinf (2008) 9:559. doi: 10.1186/1471-2105-9-559
32. Lai Y, Lin C, Lin X, Wu L, Zhao Y, Lin F. Identification and immunological characterization of cuproptosis-related molecular clusters in alzheimer's disease. Front Aging Neurosci (2022) 14:932676. doi: 10.3389/fnagi.2022.932676
33. Rigatti SJ. Random forest. J Insurance Med (New York N.Y.) (2017) 47:31–9. doi: 10.17849/insm-47-01-31-39.1
34. Li W, Liu Y, Liu W, Tang ZR, Dong S, Li W, Zhang K, et al. Machine learning-based prediction of lymph node metastasis among osteosarcoma patients. Front Oncol (2022) 12:797103. doi: 10.3389/fonc.2022.797103
35. Lee YW, Choi JW, Shin EH. Machine learning model for predicting malaria using clinical information. Comput Biol Med (2021) 129:104151. doi: 10.1016/j.compbiomed.2020.104151
36. Nelder JA, Wedderburn RWM. Generalized linear models. J R Stat Soc Ser A (General) (1972) 135:370–84. doi: 10.2307/2344614
37. Li W, Liu W, Hussain Memon F, Wang B, Xu C, Dong S, Wang H, et al. An external-validated prediction model to predict lung metastasis among osteosarcoma: A multicenter analysis based on machine learning. Comput Intell Neurosci (2022) 2022:2220527. doi: 10.1155/2022/2220527
38. Kong D, Zhao J, Tang S, Shen W, Lee HK. Logarithmic data processing can be used justifiably in the plotting of a calibration curve. Anal Chem (2021) 93:12156–61. doi: 10.1021/acs.analchem.1c02011
39. Stuart JM, Cremer MA, Townes AS, Kang AH. Type II collagen-induced arthritis in rats. passive transfer with serum and evidence that IgG anticollagen antibodies can cause arthritis. J Exp Med (1982) 155:1–16. doi: 10.1084/jem.155.1.1
40. Xiong Y PY, Zhu Y. The expression of CD 3,CD 21,CD 68 in synovial membrane of rheumatic cold symptoms type of RA rat models. J North China Univ Sci Technology(Health Sci Edition) (2016) 18:259–63.
41. Wasserman AM. Diagnosis and management of rheumatoid arthritis. Am Family Phys (2011) 84:1245–52.
42. Dong S, Li W, Tang ZR, Wang H, Pei H, Yuan B. Development and validation of a novel predictive model and web calculator for evaluating transfusion risk after spinal fusion for spinal tuberculosis: A retrospective cohort study. BMC Musculoskelet Disord (2021) 22:825. doi: 10.1186/s12891-021-04715-6
43. Chen R, Huang Q, Chen L. Development and validation of machine learning models for prediction of fracture risk in patients with elderly-onset rheumatoid arthritis. Int J Gen Med (2022) 15:7817–29. doi: 10.2147/ijgm.S380197
44. Li Z, Chen Y, Zulipikaer M, Xu C, Fu J, Deng T, et al. Identification of PSMB9 and CXCL13 as immune-related diagnostic markers for rheumatoid arthritis by machine learning. Curr Pharm Design (2022) 28:2842–54. doi: 10.2174/1381612828666220831085608
45. Koo BS, Eun S, Shin K, Hong S, Kim YG, Lee CK, et al. Differences in trajectory of disease activity according to biologic and targeted synthetic disease-modifying anti-rheumatic drug treatment in patients with rheumatoid arthritis. Arthritis Res Ther (2022) 24:233. doi: 10.1186/s13075-022-02918-3
46. Peiffer-Smadja N, Rawson TM, Ahmad R, Buchard A, Georgiou P, Lescure FX, et al. Machine learning for clinical decision support in infectious diseases: A narrative review of current applications. Clin Microbiol Infect Off Publ Eur Soc Clin Microbiol Infect Dis (2020) 26:584–95. doi: 10.1016/j.cmi.2019.09.009
47. Choy G, Khalilzadeh O, Michalski M, Do S, Samir AE, Pianykh OS, et al. Current applications and future impact of machine learning in radiology. Radiology (2018) 288:318–28. doi: 10.1148/radiol.2018171820
48. Paulson JC, Colley KJ. Glycosyltransferases. structure, localization, and control of cell type-specific glycosylation. J Biol Chem (1989) 264:17615–8. doi: 10.1016/S0021-9258(19)84610-0
49. Schauer R, Kamerling JP. Exploration of the sialic acid world. Adv Carbohydr Chem Biochem (2018) 75:1–213. doi: 10.1016/bs.accb.2018.09.001
50. Hadley B, Litfin T, Day CJ, Haselhorst T, Zhou Y, Tiralongo J. Nucleotide sugar transporter SLC35 family structure and function. Comput Struct Biotechnol J (2019) 17:1123–34. doi: 10.1016/j.csbj.2019.08.002
51. Varki A, Cummings RD, Esko JD, Freeze HH, Stanley P, Bertozzi CR, et al ed. Essentials of glycobiology. The Consortium of Glycobiology Editors, La Jolla, California.: Cold Spring Harbor Laboratory Press (2009).
52. Kauskot A, Pascreau T, Adam F, Bruneel A, Reperant C, Lourenco-Rodrigues MD, et al. A mutation in the gene coding for the sialic acid transporter SLC35A1 is required for platelet life span but not proplatelet formation. Haematologica (2018) 103:e613–7. doi: 10.3324/haematol.2018.198028
53. Urbanek K, Sutherland DM, Orchard RC, Wilen CB, Knowlton JJ, Aravamudhan P, et al. Cytidine monophosphate n-acetylneuraminic acid synthetase and solute carrier family 35 member A1 are required for reovirus binding and infection. J Virol (2020) 95(2):e01571-20. doi: 10.1128/jvi.01571-20
54. Wang S, Yang S, Lai X, Song Y, Hu L, Li C, et al. Sialic acid conjugate-modified liposomal dexamethasone palmitate targeting neutrophils for rheumatoid arthritis therapy: Influence of particle size. AAPS PharmSciTech (2021) 22:16. doi: 10.1208/s12249-020-01870-2
55. Espinosa S, De Bortoli F, Li X, Rossi J, Wagley ME, Lo HG, et al. Human PRPF39 is an alternative splicing factor recruiting U1 snRNP to weak 5' splice sites. RNA (New York N.Y.) (2022) 29(1):97–110. doi: 10.1261/rna.079320.122
56. Matera AG, Wang Z. A day in the life of the spliceosome. Nat Rev Mol Cell Biol (2014) 15:108–21. doi: 10.1038/nrm3742
57. De Bortoli F, Neumann A, Kotte A, Timmermann B, Schüler T, Wahl MC, et al. Increased versatility despite reduced molecular complexity: evolution, structure and function of metazoan splicing factor PRPF39. Nucleic Acids Res (2019) 47:5867–79. doi: 10.1093/nar/gkz243
58. Ni T, Yang W, Han M, Zhang Y, Shen T, Nie H, et al. Global intron retention mediated gene regulation during CD4+ T cell activation. Nucleic Acids Res (2016) 44:6817–29. doi: 10.1093/nar/gkw591
59. Turkkila M, Andersson KM, Amu S, Brisslert M, Erlandsson MC, Silfverswärd S, et al. Suppressed diversity of survivin splicing in active rheumatoid arthritis. Arthritis Res Ther (2015) 17:175. doi: 10.1186/s13075-015-0689-z
60. Ren P, Lu L, Cai S, Chen J, Lin W, Han F. Alternative splicing: A new cause and potential therapeutic target in autoimmune disease. Front Immunol (2021) 12:713540. doi: 10.3389/fimmu.2021.713540
61. Ibáñez-Costa A, Perez-Sanchez C, Patiño-Trives AM, Luque-Tevar M, Font P, Arias de la Rosa I, et al. Splicing machinery is impaired in rheumatoid arthritis, associated with disease activity and modulated by anti-TNF therapy. Ann Rheum Dis (2022) 81:56–67. doi: 10.1136/annrheumdis-2021-220308
62. Lainez B, Fernandez-Real JM, Romero X, Esplugues E, Cañete JD, Ricart W, et al. Identification and characterization of a novel spliced variant that encodes human soluble tumor necrosis factor receptor 2. Int Immunol (2004) 16:169–77. doi: 10.1093/intimm/dxh014
63. Cañete JD, Albaladejo C, Hernández MV, Laínez B, Pinto JA, Ramírez J, et al. Clinical significance of high levels of soluble tumour necrosis factor-α receptor-2 produced by alternative splicing in rheumatoid arthritis: A longitudinal prospective cohort study. Rheumatol (Oxford England) (2011) 50:721–8. doi: 10.1093/rheumatology/keq381
64. Cope AP, Aderka D, Doherty M, Engelmann H, Gibbons D, Jones AC, et al. Increased levels of soluble tumor necrosis factor receptors in the sera and synovial fluid of patients with rheumatic diseases. Arthritis Rheum (1992) 35:1160–9. doi: 10.1002/art.1780351008
65. Raman M, Chen W, Cobb MH. Differential regulation and properties of MAPKs. Oncogene (2007) 26:3100–12. doi: 10.1038/sj.onc.1210392
66. Chen DY, Chuang HC, Lan JL, Chen YM, Hung WT, Lai KL, et al. Germinal center kinase-like kinase (GLK/MAP4K3) expression is increased in adult-onset still's disease and may act as an activity marker. BMC Med (2012) 10:84. doi: 10.1186/1741-7015-10-84
67. Findlay GM, Yan L, Procter J, Mieulet V. & lamb, r. f. a MAP4 kinase related to Ste20 is a nutrient-sensitive regulator of mTOR signalling. Biochem J (2007) 403:13–20. doi: 10.1042/bj20061881
68. Diener K, Wang XS, Chen C, Meyer CF, Keesler G, Zukowski M, et al. Activation of the c-jun n-terminal kinase pathway by a novel protein kinase related to human germinal center kinase. Proc Natl Acad Sci United States America (1997) 94:9687–92. doi: 10.1073/pnas.94.18.9687
69. Chuang HC, Wang X, Tan TH. MAP4K family kinases in immunity and inflammation. Adv Immunol (2016) 129:277–314. doi: 10.1016/bs.ai.2015.09.006
70. Chen YM, Chuang HC, Lin WC, Tsai CY, Wu CW, Gong NR, et al. Germinal center kinase-like kinase overexpression in T cells as a novel biomarker in rheumatoid arthritis. Arthritis Rheum (2013) 65:2573–82. doi: 10.1002/art.38067
71. Chuang HC, Lan JL, Chen DY, Yang CY, Chen YM, Li JP, et al. The kinase GLK controls autoimmunity and NF-κB signaling by activating the kinase PKC-θ in T cells. Nat Immunol (2011) 12:1113–8. doi: 10.1038/ni.2121
72. Xu C, Bailly-Maitre B, Reed JC. Endoplasmic reticulum stress: Cell life and death decisions. J Clin Invest (2005) 115:2656–64. doi: 10.1172/jci26373
73. Park YJ, Yoo SA, Kim WU. Role of endoplasmic reticulum stress in rheumatoid arthritis pathogenesis. J Korean Med Sci (2014) 29:2–11. doi: 10.3346/jkms.2014.29.1.2
74. Hampton RY. ER-associated degradation in protein quality control and cellular regulation. Curr Opin Cell Biol (2002) 14:476–82. doi: 10.1016/s0955-0674(02)00358-7
75. Rahmati M, Moosavi MA, McDermott MF. ER stress: A therapeutic target in rheumatoid arthritis? Trends Pharmacol Sci (2018) 39:610–23. doi: 10.1016/j.tips.2018.03.010
76. Yamasaki S, Yagishita N, Tsuchimochi K, Nishioka K, Nakajima T. Rheumatoid arthritis as a hyper-endoplasmic-reticulum-associated degradation disease. Arthritis Res Ther (2005) 7:181–6. doi: 10.1186/ar1808
77. Guerra C, Brambilla Pisoni G, Soldà T, Molinari M. The reductase TMX1 contributes to ERAD by preferentially acting on membrane-associated folding-defective polypeptides. Biochem Biophys Res Commun (2018) 503:938–43. doi: 10.1016/j.bbrc.2018.06.099
78. Pisoni GB, Ruddock LW, Bulleid N, Molinari M. Division of labor among oxidoreductases: TMX1 preferentially acts on transmembrane polypeptides. Mol Biol Cell (2015) 26:3390–400. doi: 10.1091/mbc.E15-05-0321
79. Yin A, Chen W, Cao L, Li Q, Zhu X, Wang L. FAM96A knock-out promotes alternative macrophage polarization and protects mice against sepsis. Clin Exp Immunol (2021) 203:433–47. doi: 10.1111/cei.13555
80. Stehling O, Mascarenhas J, Vashisht AA, Sheftel AD, Niggemeyer B, Rösser R, et al. Human CIA2A-FAM96A and CIA2B-FAM96B integrate iron homeostasis and maturation of different subsets of cytosolic-nuclear iron-sulfur proteins. Cell Metab (2013) 18:187–98. doi: 10.1016/j.cmet.2013.06.015
81. Kumar V. Targeting macrophage immunometabolism: Dawn in the darkness of sepsis. Int Immunopharmacol (2018) 58:173–85. doi: 10.1016/j.intimp.2018.03.005
Keywords: rheumatoid arthritis, copper death, machine learning, immune infiltration, predictive models
Citation: Zhou Y, Li X, Ng L, Zhao Q, Guo W, Hu J, Zhong J, Su W, Liu C and Su S (2023) Identification of copper death-associated molecular clusters and immunological profiles in rheumatoid arthritis. Front. Immunol. 14:1103509. doi: 10.3389/fimmu.2023.1103509
Received: 20 November 2022; Accepted: 30 January 2023;
Published: 20 February 2023.
Edited by:
Maurizio Cutolo, Università degli Studi di Genova, ItalyReviewed by:
Jindong Xie, Sun Yat-sen University Cancer Center (SYSUCC), ChinaWenle Li, Xiamen University, China
Ruiqin Han, Chinese Academy of Medical Sciences, China
Yanlong Shi, The Second Affiliated Hospital of Nanjing Medical University, China
Rahim Alhamzawi, University of Al-Qadisiyah, Iraq
Copyright © 2023 Zhou, Li, Ng, Zhao, Guo, Hu, Zhong, Su, Liu and Su. This is an open-access article distributed under the terms of the Creative Commons Attribution License (CC BY). The use, distribution or reproduction in other forums is permitted, provided the original author(s) and the copyright owner(s) are credited and that the original publication in this journal is cited, in accordance with accepted academic practice. No use, distribution or reproduction is permitted which does not comply with these terms.
*Correspondence: Chaozong Liu, Y2hhb3pvbmcubGl1QHVjbC5hYy51aw==; Songchuan Su, c3Vfc29uZ2NodWFuQHNvaHUuY29t
ORCID: Yu Zhou, orcid.org/0000-0002-3065-4625
Xin Li, orcid.org/0000-0003-0553-0767
Liqi Ng, orcid.org/0000-0002-7049-0012
Qing Zhao, orcid.org/0000-0002-4658-5222
Wentao Guo, orcid.org/0000-0001-8066-6520
Jinhua Hu, orcid.org/0000-0003-3736-0790
Jinghong Zhong, orcid.org/0000-0003-2473-903X
Wenlong Su, orcid.org/0000-0002-2477-8859
Chaozong Liu, orcid.org/0000-0002-9854-4043
Songchuan Su, orcid.org/0000-0002-2349-3165
†These authors have contributed equally to this work and share first authorship
‡These authors have contributed equally to this work