 Ankit Tanwar
 Pamela Stanley
- Department of Cell Biology, Albert Einstein College of Medicine, New York, NY, United States
Glycosylation of Notch receptors by O-fucose glycans regulates Notch ligand binding and Notch signaling during hematopoiesis. However, roles in hematopoiesis for other O-glycans that modify Notch receptors have not been determined. Here we show that the EGF domain specific GlcNAc transferase EOGT is required in mice for the optimal production of lymphoid and myeloid cells. The phenotype of Eogt null mice was largely cell-autonomous, and Notch target gene expression was reduced in T cell progenitors. Moreover, EOGT supported residual Notch signaling following conditional deletion of Pofut1 in hematopoietic stem cells (HSC). Eogt : Pofut1 double mutant HSC had more severe defects in bone marrow and in T and B cell development in thymus and spleen, compared to deletion of Pofut1 alone. The combined results show that EOGT and O-GlcNAc glycans are required for optimal hematopoiesis and T and B cell development, and that they act synergistically with POFUT1 and O-fucose glycans to promote Notch signaling in lymphoid and myeloid differentiation.
Highlights
● O-GlcNAc glycans and EOGT promote lymphopoiesis and myelopoiesis.
● EOGT supports Notch signaling in the absence of POFUT1 and O-fucose glycans.
Introduction
Notch signaling is highly conserved and plays crucial roles in cell fate determination and tissue development (1). There are four Notch receptors (NOTCH1 to NOTCH4) that can be activated by canonical Notch ligands (DLL1, DLL3, DLL4, JAG1 and JAG2) to induce Notch signaling in mammals. Notch ligand binding and Notch signaling are regulated by glycosylation of the extracellular domain (ECD) of Notch receptors (2, 3). Structural studies reveal direct interactions between Notch ligands and O-fucose in specific epidermal growth factor-like (EGF) repeats of NOTCH1 (4, 5). Following Notch ligand engagement, an ADAM metalloprotease cleaves NECD, followed by a second cleavage by the γ-secretase complex. Notch intracellular domain (NICD) complexes in the nucleus with the transcriptional repressor RBP-Jk, and co-activators including Mastermind-like-1 (MAML1), to induce the expression of Notch target genes, including Hairy enhancer-of-split (Hes) and Hairy-related gene families, which regulate the expression of many other genes (6, 7).
Within the hematopoietic system, Notch signaling plays important roles in regulating different stages of lymphoid and myeloid development (8, 9). DLL4-induced NOTCH1 signaling is indispensable for T cell development in the thymus. Thus, conditional inactivation of Notch1 or Dll4 using Mx1-Cre is sufficient to block T cell development (10, 11). However, Notch2 is also required for optimal development of early T cell progenitors (12). DLL1-induced NOTCH2 signaling is essential for the generation of marginal zone B cells (MZ-B) in the spleen (13, 14). O-fucose glycans extended by LFNG and MFNG promote the formation of MZ-B cells (15) and all three FNG genes contribute to T and B cell development (16).
Consensus sites within EGF repeats in the NECD of Notch receptors carry O-fucose, O-glucose and O-GlcNAc glycans (17) (Figure 1). EGF repeats with appropriate consensus sites occur in ~50 proteins of the proteome, including Notch receptors and Notch ligands (19, 20). O-fucose is transferred by protein O-fucosyltransferase 1 (POFUT1), which is further extended by the Fringe family of glycosyltransferases (LFNG, MFNG and RFNG). Misexpression of Lfng in thymus disrupts T cell development (21–23). Conditional deletion of Pofut1 in the bone marrow leads to the disruption of hematopoiesis with an increase in granulocyte-monocyte progenitors (GMP), and a reduction in common myeloid progenitors (CMP) (24). This causes a block in T cell production in thymus and MZ-B cell production in spleen, accompanied by an increase in granulocytes in spleen. Notch ligand binding and Notch signaling are markedly reduced in hematopoietic stem cells (HSC) following conditional deletion of Pofut1. However, Pofut1 deletion by Mx1-Cre gives a milder reduction in thymic T cells than deletion of RBP-Jk (25), whereas global deletion of Pofut1 (26, 27) or RBP-Jk (28) causes similarly severe Notch signaling defects, and embryonic lethality. Thus, loss of O-fucose glycans in HSC does not fully abrogate Notch signaling, suggesting that other O-glycans may support Notch signaling in the absence of POFUT1. POGLUT1 adds O-glucose glycans to Notch receptors. Initially cloned from CD34+ human stem cells (29), POGLUT1 promotes Notch signaling via ligand-dependent and -independent mechanisms (30, 31). Synergism between O-fucose and O-glucose glycans on Notch observed in Drosophila (32) and in mammalian cells (33) appears to be due to reduced expression of Notch receptors at the cell surface. By contrast, the absence of O-fucose glycans from Notch receptors in CHO and mouse embryonic stem cells only slightly reduces NOTCH1 cell surface levels (34, 35).
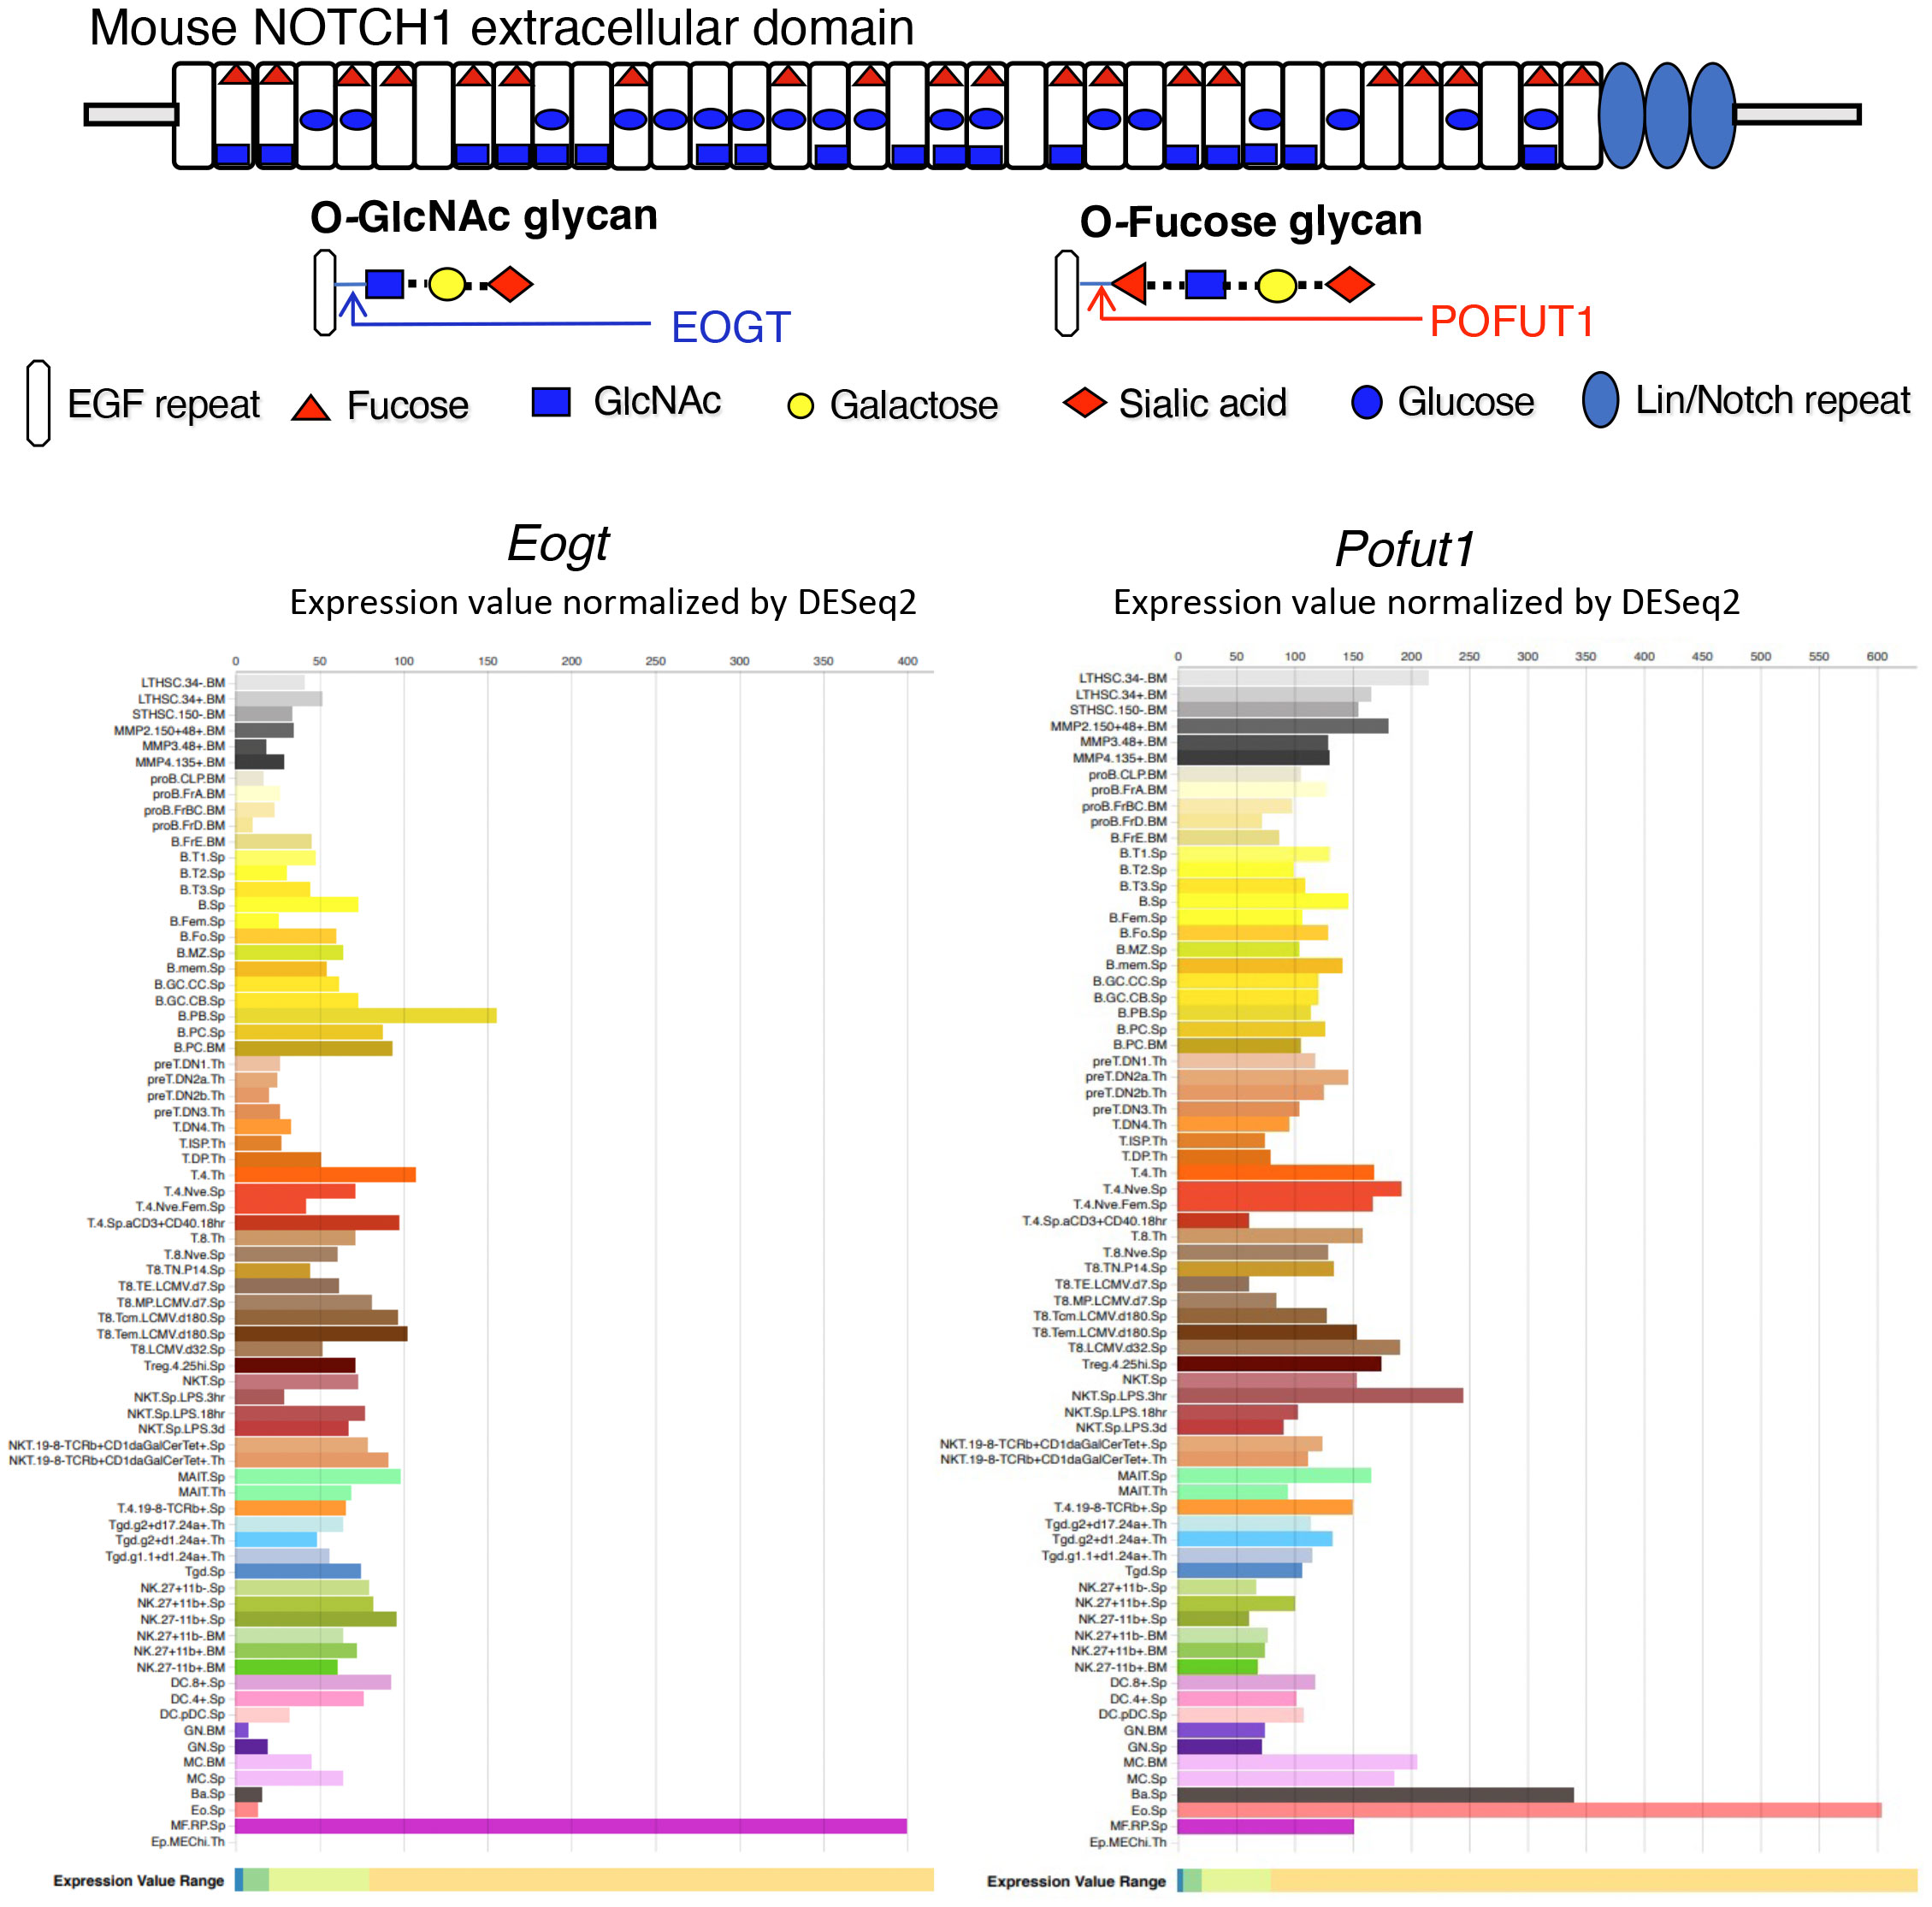
Figure 1 Expression of Eogt and Pofut1 in immune cell subsets. The diagram depicts the ECD of mouse NOTCH1 showing the O-glycans attached at respective consensus sites in the 36 EGF repeats. The sugar that initiates each O-glycan is shown in the key. The potential sugar extensions from O-fucose and O-GlcNAc glycans are also shown. The expression of Eogt and Pofut1 in a number of immune cells is taken from ImmGen Gene Skyline ULI RNASeq data group for Eogt and Pofut1 gene expression (18) (http://rstats.immgen.org/Skyline/skyline.html). The definition of each immune cell type is given at the link. Expression of Eogt and Pofut1 vary inversely in certain immune cell subsets.
The addition of O-GlcNAc to EGF repeats was first identified in Drosophila (36), and the EGF domain specific O-GlcNAc transferase EOGT was subsequently revealed (37, 38). Eogt null mice exhibit defective perinatal retinal angiogenesis, similar to that observed in mice with disrupted Notch signaling (39). Cell-based experiments showed that EOGT promotes the binding of DLL Notch ligands and Notch signaling (39). Eogt is expressed with Pofut1 in many cells of the immune system (Figure 1). However, their expression levels vary greatly and inversely in some immune cell types, indicating potentially different functional roles (Figure 1). In this paper, we identify roles for Eogt in the regulation of Notch signaling during hematopoiesis, lymphopoiesis and myelopoiesis. In addition, we show that Eogt supports Notch signaling in the absence of Pofut1 and O-fucose glycans.
Methods
Mice
Mice with an inactivating mutation in the Eogt gene were generated at Nagoya University and previously described (39). Pofut1[F/F] mice were also previously described (26). Transgenic mice expressing Vav1-iCre (B6.Cg-Commd10Tg(Vav1-icre)A2Kio/J Strain) were a kind gift from Britta Will and Paul Frenette at the Albert Einstein College of Medicine, NY, USA. Compound mutant mice termed Pof cKO and EPof dKO, with and without Vav1-iCre, were generated by intercrossing. C57Bl/6J male congenic mice expressing CD45.1 (B6.SJL-Ptprca Pepcb/BoyJ #002014) were obtained from the Jackson Laboratory (Bar Harbor). Genotyping was performed by PCR of genomic DNA using primers that distinguish wild-type and mutant alleles (Supplementary Table 1). Mice were housed in a barrier facility, allowed to eat and drink ad libitum, and used in experiments at 7–8 weeks of age. All experiments were performed with permission from the Albert Einstein Institutional Animal Care and Use Committee under approved protocol numbers 20170709 and 00001311. Euthanized mice were weighed, bone marrow from femurs, tibias, fibulae, & patullae was isolated, thymus and spleen were weighed before making single-cell suspensions.
Antibodies
Supplementary Table 2 has the full description and commercial source of each antibody used in this work.
Flow cytometry of immune cell subsets
Single-cell suspensions were prepared from bone marrow (BM) by crushing femurs, tibias, fibulae, and patullae in a mortar and rinsing vigorously with 20 ml cold FACS binding buffer (FBB: Hank’s balanced salt solution (HBSS) with glucose (Corning), 1 mM CaCl2, 2% bovine serum albumin (BSA, fraction V, Sigma) and 0.05% sodium azide, (pH 7.2–7.4). The BM cell suspension was passed through a 70-μm strainer. Thymus or spleen was weighed and squeezed through a 70 μm strainer in 1 ml FBB. Thymocytes were washed in 10 ml cold FBB twice. Bone marrow and splenocytes were centrifuged and incubated in 1 ml RBC lysis buffer (eBiosciences) for 3-5 min before adding 10 ml cold FBB. After centrifugation and resuspension in 5 ml cold FBB, single cell suspensions were counted in a Coulter counter. Cells were centrifuged at 4°C, resuspended in 2 ml cold PBS with 1 mM CaCl2 and 1 mM MgCl2, pH 7.2, centrifuged and resuspended in 100 μl Zombie NIR dye for live/dead assessment, according to the manufacturer’s protocol (Zombie NIR Fixable Viability Kit, BioLegend). After 30 min at 4°C in the dark, 2 ml cold FBB was added. Cells were centrifuged at 4°C, resuspended in 4% paraformaldehyde (PFA, Emsdiasum) in PBS pH 7.2, and incubated 15 min at 4°C in the dark. Cells were washed twice with 2 ml cold FBB, resuspended at 106 cells/ml in FBB and stored at 4°C for up to 3 months. For analysis by flow cytometry, ~106 cells were washed with 1 ml FBB, resuspended in 90 μl FBB containing 1 μl Fc block (rat-anti-mouse CD16/CD32), and incubated for 15 min on ice. Abs diluted in FBB (10 μl) were added and the reaction mix was incubated for 30 min at 4°C. Cells were washed twice in 1 ml FBB and resuspended in ~500 μl FBB. For all samples, immunofluorescence was analyzed using a Cytek™ Aurora or BD LSRII flow cytometer and data FCS files were analyzed using FlowJo software (Tree Star). Gating strategies shown in Supplementary Figures 1–3 were based on previous work (16, 40, 41) and include the Abs used in the analysis of BM, thymus or spleen immune cell subsets. Data on live cells were collected as frequency percent based on gating strategies. Absolute cell numbers in the different immune cell subsets were calculated from the starting number of live cells and the frequency percent of each subset. Significant differences between genotypes in either frequency percent or absolute cell number are highlighted in the main text while complementary data are presented in supplementary figures as described in the text.
Bone marrow transplantation
Cell suspensions from bone marrow of 7–8 week Eogt[+/-] and Eogt[-/-] males were prepared as described above. Approximately 3x10⁶ cells were resuspended in 50 μl sterile HBSS (Gibco) and injected using a 28-gauge insulin needle via the retro-orbital plexus into CD45.1+ C57BL/6 lethally irradiated recipients. A split dose of 550 rads γ-irradiation per recipient male was given twice, with a 16 h interval. After 7 weeks, recipients were euthanized, bone marrow, thymus, and spleen were analyzed for lymphoid and myeloid cell subsets by flow cytometry after gating on donor-derived cells positive for anti-CD45.2-Pacific Blue.
Isolation of CD4/CD8 double negative T cells
Fresh thymocytes were resuspended in isolation buffer (PBS lacking cations, pH 7.2-7.4, containing 0.1% BSA, 2 mM EDTA and 1 mg/ml glucose) on ice. For T cell depletion, ~3-5x10⁷ thymocytes were incubated with 20 μg anti-CD4 (rat IgG2b clone GK1.5, BioXCell) and 37.5 μg anti-CD8a (rat IgG2a clone 53-6.72; BioXCell) in 5 ml buffer for 20 min at 4°C with tilted rotation. After centrifugation, cells were resuspended in 5 ml buffer, and incubated with 250 μl sheep anti-rat IgG Dynabeads (Thermo Fisher Scientific) for 30 min at 4°C with tilted rotation. The tube was placed in a magnet for 2 min, unbound cells were centrifuged and resuspended in 250 μl Dynabeads for a second 30 min incubation at 4°C. After Dynabeads removal, unbound DN T cells were centrifuged, counted and RNA was extracted from the cell pellet with 1 ml TRIZOL (Ambion) as described below.
Quantitative RT-PCR
DN T cells from ~3-5x10⁷ thymocytes were pipetted vigorously in 1 ml TRIZOL and incubated for 5 min at RT before adding 200 μl chloroform. Tubes were vortexed for 15 sec, incubated at RT for 2–3 min, and centrifuged at 12,000 × g for 15 min at 4°C. The aqueous phase was transferred to a new tube, and 500 μl isopropanol was added. Samples were incubated for 10 min on ice and centrifuged at 12,000 × g for 10 min at 4°C and the supernatant discarded. The RNA pellet was washed once with 1 ml 70% ethanol. Samples were vortexed for 10 sec and centrifuged at 7,500 × g for 5 min at 4°C and the supernatant discarded. The RNA pellet was air-dried for 5–10 min and dissolved in 50 µl RNase-free water. Samples were placed in a 55-60°C water bath for 15-20 min and the RNA concentration determined by Nanodrop. cDNA was prepared from ~250 ng RNA using the ReverTra Ace® qPCR RT Master Mix with gDNA Remover (Dc. DiagnoCine) following the manufacturer’s protocol. Each sample was assayed in triplicate using a 384 well plate. Relative gene expression was calculated in relation to Hprt and Gapdh by the log2 dCCT method. Primer sequences used for qRT-PCR are in Supplementary Table 1.
Histopathology
Spleen was collected, weighed, washed and stored in 10% natural buffered formalin (NBF) at 4°C. The samples were processed for paraffin embedding and longitudinal tissue sections (5 μm) were stained with hematoxylin and eosin (H&E), scanned by the 3D Histech P250 High-Capacity Slide Scanner and analyzed using Case Viewer 2.4 software.
Notch ligand binding assay
Soluble Notch ligands DLL1-Fc (#10184-DL-050), JAG1-Fc (#1277-JG-050), and JAG2-Fc (#1726-JG-050) were purchased from R&D Systems, and DLL4-Fc (#DL4-H5259) was purchased from Acro-biosystems. Single-cell suspensions from thymus were washed in FBB at 4°C and fixed in PBS-buffered 4% PFA for 15 min at 4°C, washed twice with FBB and stored in FBB at 4°C. For analysis, ~0.5-1x10⁶ fixed thymocytes were washed with FBB, and incubated with 40 μl FBB and 1 μl FcR blocking solution (rat-anti-mouse CD16/CD32) on ice for 15 min. Thereafter, the cells were incubated in 60 μl FBB containing anti-CD4-FITC (1:400), anti-CD8a-PerCp-Cy5.5 (1:400), and 0.75 μg DLL4-Fc, or 1.5 μg of DLL1-Fc, JAG1-Fc, or JAG2-Fc. After incubation at 4°C for ~30 min, cells were washed with 1 ml FBB and incubated with anti-IgG-APC and anti-IgG-DyLight 405 (Fc-specific) Ab (1:100) at 4°C for 30 min. The cells were then washed with 1 ml FBB, resuspended in 500 μl FBB and analyzed in a flow cytometer (Cytek™, Aurora). For detection of NOTCH1 at the cell surface, fixed thymocytes cells were incubated with FcR-block rat-anti-mouse CD16/CD32 (1:100) followed by anti-CD4-FITC mAb (1:400), anti-CD8a-PerCp-Cy5.5 (1:400), sheep anti-mouse NOTCH1 Ab (1:50) at 4°C for 30 min, washed, and incubated with rhodamine Red-X-conjugated donkey anti-sheep IgG (1:100) at 4°C for 30 min. Cells were washed with 1 ml FBB, resuspended in 500 μl FBB and analyzed in a flow cytometer (Cytek™, Aurora).
Statistics
Comparisons are presented as mean ± SEM. Significance was determined by both two-tailed and one-tailed (denoted by parentheses) unpaired, parametric, Student t-test analysis (unless otherwise noted) using Prism software version 9.1.
Results
Loss of Eogt affects myelopoiesis and lymphopoiesis
Initial comparisons of Eogt[+/+] and Eogt[+/-] heterozygotes revealed no significant differences in T, B and myeloid subset populations in either absolute cell numbers or in the frequency % of different cell subsets (Supplementary Figure 4 and not shown). Therefore, data from Eogt[+/+] and Eogt[+/-] mice were combined as Control. Thymus and spleen weights, as well as bone marrow (BM) cellularity, were similar in Eogt null and Control mice (Supplementary Figure 5A). In bone marrow, the absolute numbers of CD19+/B220+ B cells, and CD11b+/Gr1+ granulocytes were significantly increased in the Eogt[-/-] population (Figure 2A). In Eogt[-/-] thymus, the frequency % of CD4/CD8 double negative 1 (DN1) T cell progenitors was reduced, although the absolute number of DN1 T cells was unchanged (Supplementary Figure 5B). The absolute number of DN2 T cell progenitors was strikingly reduced in Eogt null cells, while the absolute number of DN4 T cells was significantly increased (Figure 2B). By contrast, the numbers of early T cell progenitors (ETP) and DN3 T cells were unchanged (Supplementary Figure 5B). The proportion of double positive (DP) T cells was slightly decreased, while CD4+ and CD8+ single positive (SP) T cells were increased in Eogt[-/-] thymocytes (Figure 2B). These effects were also observed in mice lacking the three Fringe genes (Fng tKO) (16, 42). Consistent with inhibition of Notch signaling in the Eogt null thymus, there was a significant increase in thymic B cells (CD19+/B220+) and the frequency of myeloid cells (CD11b+) (Figure 2B), but no change in natural killer (NK) T cells (Supplementary Figure 5B). In spleen, no histopathological changes were observed in Control versus Eogt[-/-] sections (n=3 for each, not shown), and the absolute numbers of T cells, B cells, marginal zone progenitors (MZ-P) and myeloid cell subsets were similar in Control versus Eogt[-/-] mice (Supplementary Figure 5C). However, significant increases were observed in the absolute number of follicular B (Fo-B), MZ-B, CD19+ and B220+ B cells in Eogt[-/-] mice (Figure 2C). By contrast, a decrease in the frequency % of natural killer T cells (NK1.1+) and dendritic cells (CD11b/c+) was observed (Figure 2C). Thus, EOGT and O-GlcNAc glycans are required for the optimal generation of lymphoid and myeloid cells from HSC.
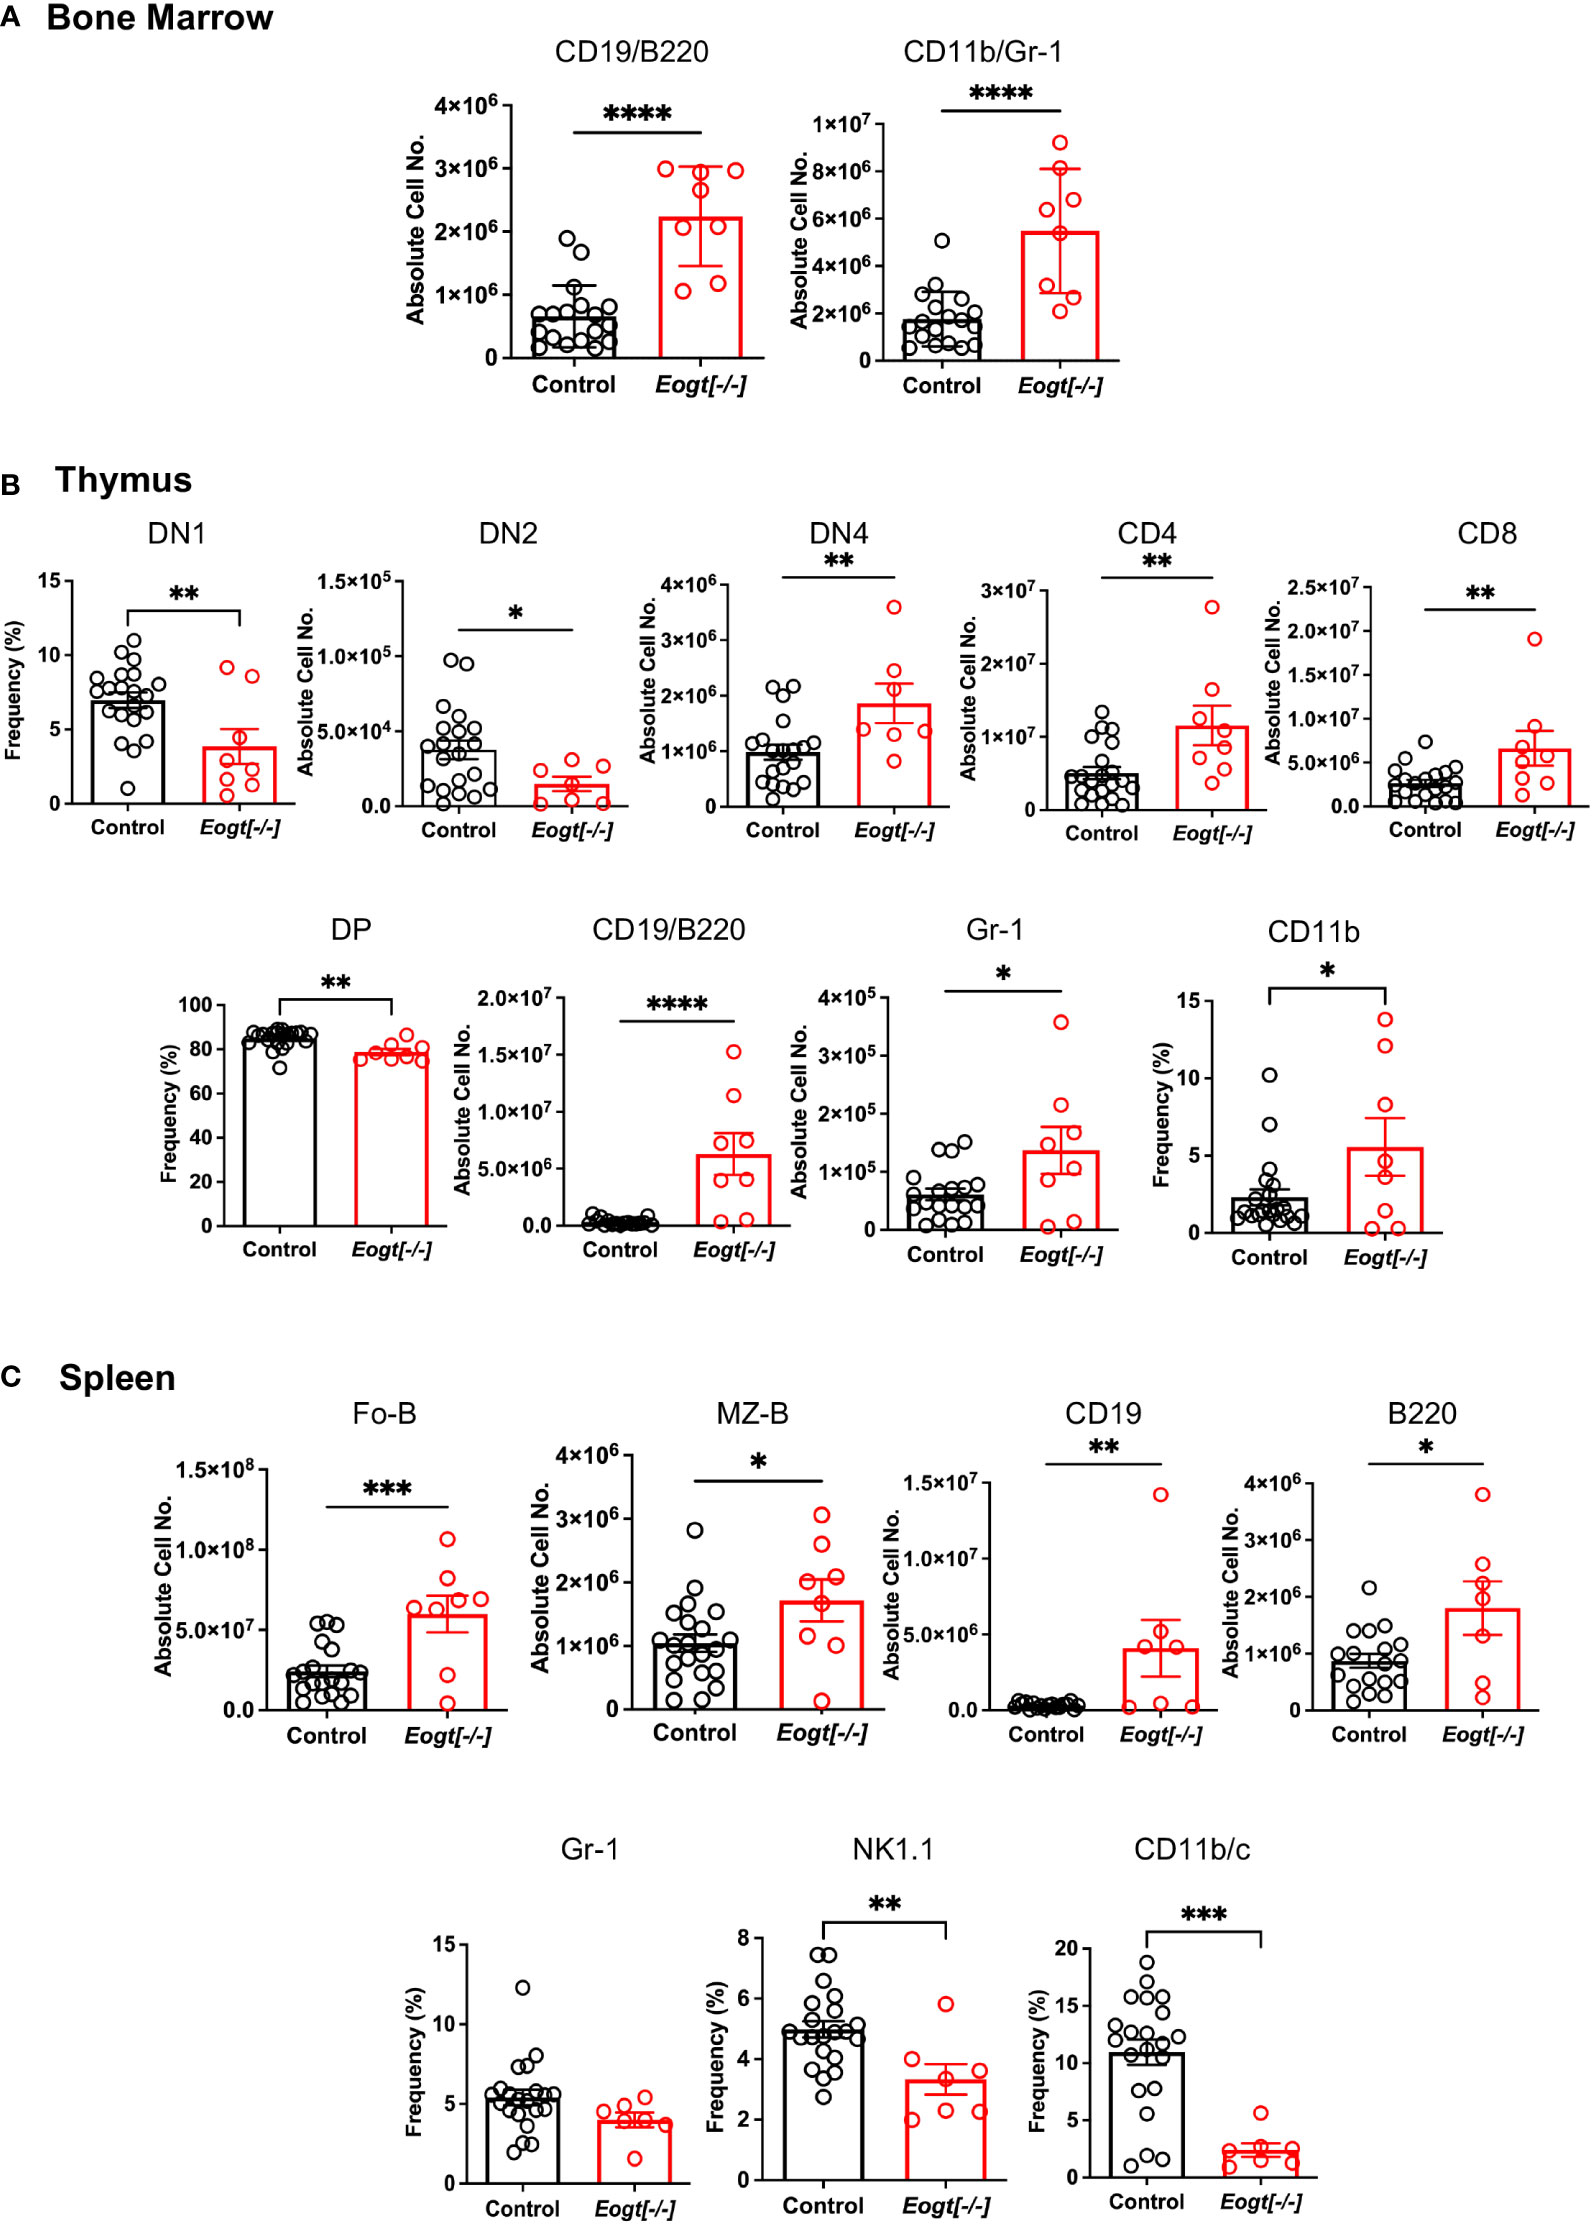
Figure 2 Altered lymphoid and myeloid subsets in mice lacking Eogt and O-GlcNAc glycans. (A) Absolute cell numbers or frequency % for lymphoid and myeloid cell subsets in bone marrow that differed between Control (Eogt[+/+] and Eogt[+/-]) and Eogt[-/-] mice. See Supplementary Figure 1 for gating, Supplementary Figure 4 for Eogt[+/+] versus Eogt[+/-] data and Supplementary Figure 5 for BM cellularity. (B) Absolute cell numbers or frequency % for lymphoid and myeloid cell subsets in thymus that differed between Control and Eogt[-/-] mice. See Supplementary Figure 2 for gating, Supplementary Figure 4 for Eogt[+/+] versus Eogt[+/-] data and Supplementary Figure 5 for subsets that did not differ significantly. (C) Absolute cell numbers or frequency % for lymphoid and myeloid cell subsets in spleen that differed between Control and Eogt[-/-] mice. See Supplementary Figure 3 for gating, Supplementary Figure 4 for Eogt[+/+] versus Eogt[+/-] data and Supplementary Figure 5 for subsets that did not differ significantly. Each symbol represents a mouse of 7-8 weeks. Data are presented as mean ± SEM. *p <0.05, **p<0.01,***p<0.001, ****p<0.0001 based on two-tailed Student’s t test.
The Eogt null phenotype is largely cell autonomous
To determine whether the Eogt null phenotype was cell intrinsic, bone marrow (BM) transplantation was performed from CD45.2+ Eogt[+/-] and Eogt[-/-] donor males into CD45.1+ male hosts. Eogt[-/-] CD45.2+ donor BM cells reconstituted CD45.1+ hosts to ~57% in bone marrow (Figure 3A), ~80% in thymus and ~64% in spleen (not shown). Thus, host-derived Eogt[+/+] cells contributed to each of these populations in recipients. In recipient bone marrow, no changes were seen in B cells (CD19+/B220+) or granulocytes (CD11b+/Gr-1+) from Eogt[-/-] donor BM compared to Eogt[+/-] BM (not shown); in recipient thymus, Eogt[-/-] donor BM generated significantly fewer DN2 and DN3 T cell progenitors compared to Eogt[+/-] donor BM (Figure 3B); and in spleen, Eogt[-/-] donor BM generated CD19+ cells and Gr-1+ granulocytes in significantly increased numbers compared to Eogt[+/-] donor BM (Figure 3C). Thus, the phenotype of Eogt[-/-] BM recipients was somewhat milder, than the Eogt null phenotype. This could reflect the presence of Eogt[+/+] host cells, and/or rescuing effects of the wild type host stroma. Nevertheless, key aspects of the Eogt null phenotype were transferred by Eogt[-/-] BM.
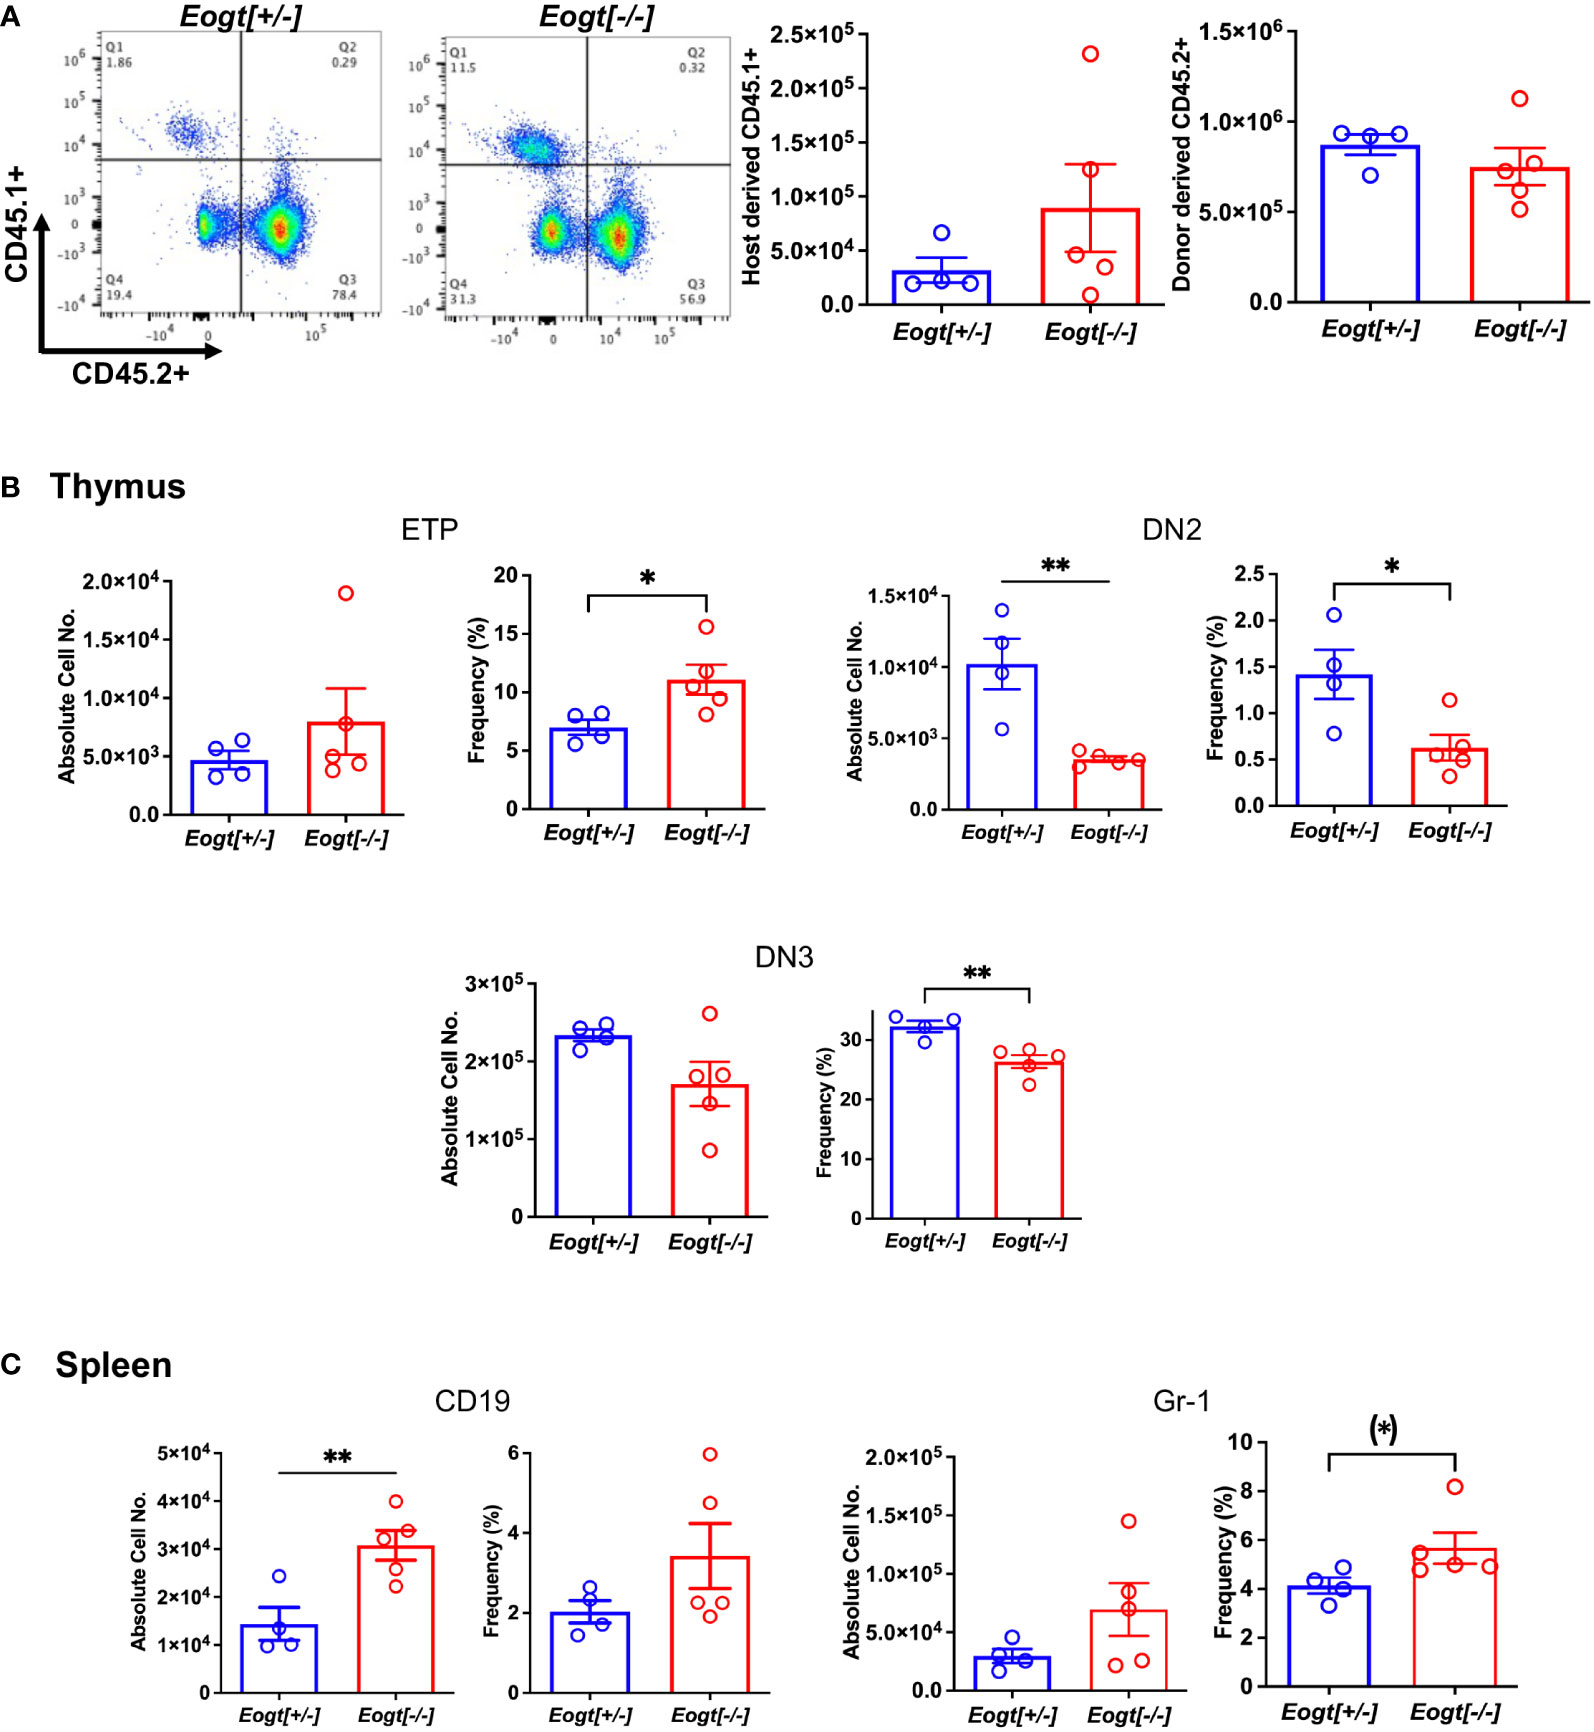
Figure 3 The Eogt null phenotype is largely cell autonomous. Bone marrow cells (3X10⁶) from Eogt[+/-] or Eogt[-/-] mice expressing CD45.2 were injected via the retro-orbital plexus into lethally-irradiated, wild-type recipient males expressing CD45.1. Recipient BM, thymus and spleen were analyzed 7 weeks after transplantation. (A) Flow cytometry profile and histograms of bone marrow from recipient mice (CD45.1+) that received BM from Eogt[+/-] or Eogt[-/-] mice. The approximate donor contribution was 78% for Eogt[+/-] and 57% for Eogt[-/-] of recipient BM. (B) Absolute cell number and frequency % of T cell progenitors in thymus that differed when derived from Eogt[+/-] versus Eogt[-/-] donor bone marrow. (C) Absolute cell number and frequency % of B cells and granulocyte subsets in spleen that differed when derived from Eogt[+/-] versus Eogt[-/-] donor bone marrow. Each symbol represents a mouse of 7-8 weeks. Data are presented as mean ± SEM. *p <0.05, **p<0.01 based on two-tailed Student’s t test. (*) p <0.05 based on one-tailed Student’s t test.
Notch signaling is reduced in Eogt[-/-] DN T cell progenitors
Notch ligand binding was examined using thymic DN T cell progenitors from 7-8 week Eogt[+/-] and Eogt[-/-] mice. No significant changes were observed in either NOTCH1 cell surface expression, or the binding of soluble ligands DLL1, DLL4, JAG1 or JAG2 between Eogt[+/-] and Eogt[-/-] DN T cell progenitors (Figure 4A). However, there were significant reductions in the expression of two Notch target genes, Hes1 and Il2ra, consistent with reduced Notch signaling (Figure 4B). The expression of Il2ra was also reduced in DN T cell progenitors from mice lacking the three Fringe genes, along with Dtx1, although not Hes1 (16). The reduction in Notch signaling target gene expression in Eogt null T cell progenitors, the changes in T cell subset numbers and frequencies, and the increased numbers of B and myeloid cells observed in Eogt[-/-] thymus, indicate that EOGT and O-GlcNAc glycans are necessary for optimal Notch signaling and T cell development. The altered B cell and myeloid subsets in spleen of Eogt[-/-] mice are also consistent with reduced Notch signaling. Finally, the B cell and myeloid hyperplasia in Eogt[-/-] BM indicate that Notch signaling is required for regulating the differentiation of certain progenitors during hematopoiesis.
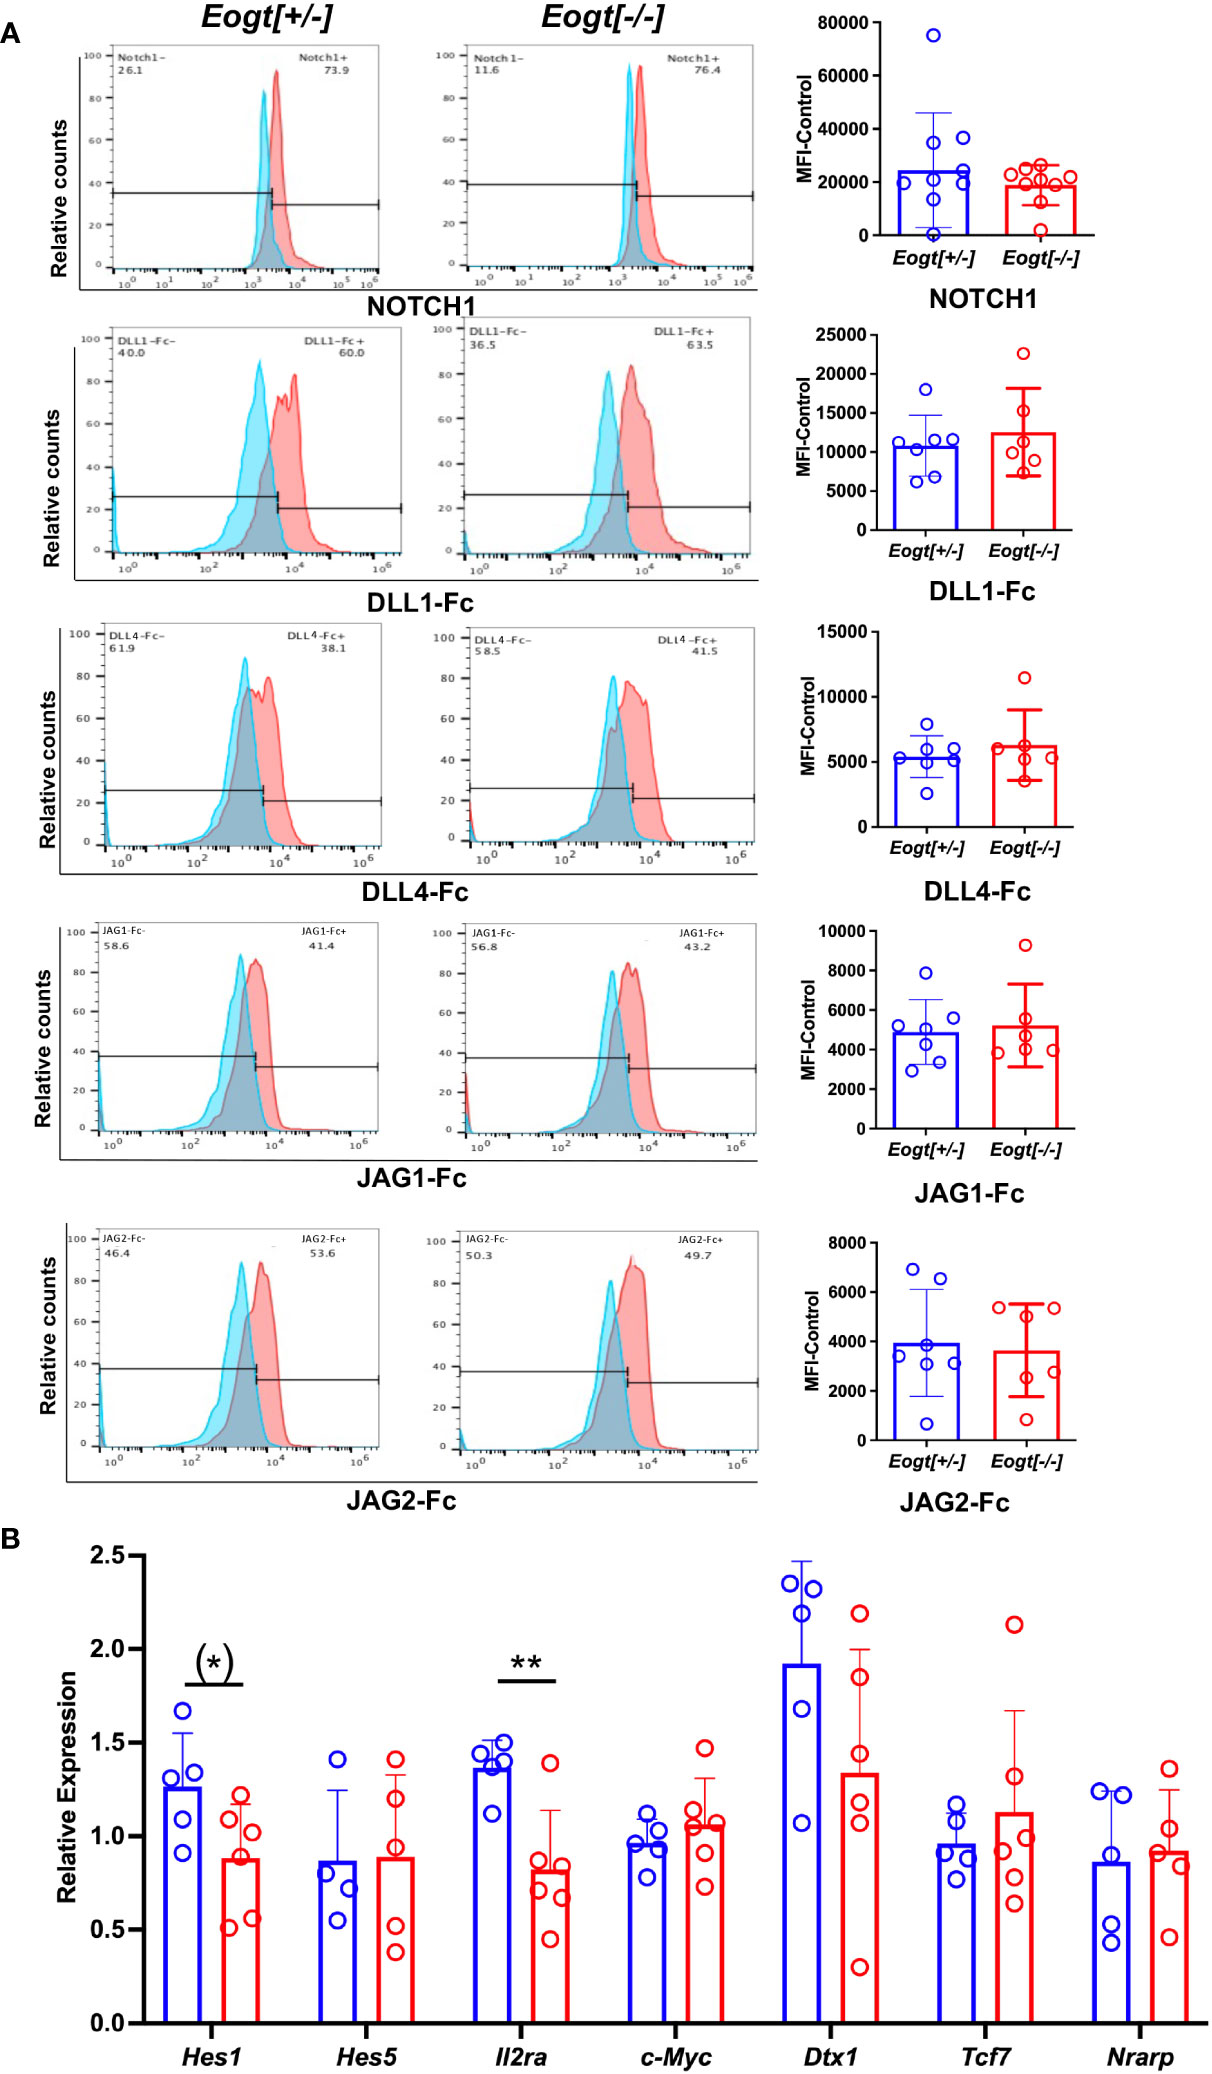
Figure 4 Notch signalling in Eogt null T cell progenitors. Representative flow cytometry profiles and histogram quantification of (A) Cell surface NOTCH1, or binding of DLL1-Fc, DLL4-Fc, JAG1-Fc and JAG2-FC to fixed CD4/CD8 DN T cell progenitors from Eogt[+/-] or Eogt[-/-] mice. Mean fluorescence index (MFI) for anti-Fc Ab was subtracted from MFI for Notch ligand or NOTCH1 Ab (MFI-control). Symbols represent Eogt[+/-] (blue circles) and Eogt[-/-] (red circles) DN T cells. Fixed cells had been stored for up to 3 months at 4°C. (B) Transcripts from DN T cell progenitors of Eogt[+/-] or Eogt[-/-] mice were subjected to qRT-PCR as described in Materials and Methods. Relative expression was determined based on the average delta Ct obtained for Gapdh and Hprt combined. Each symbol represents a mouse of 7-8 weeks. Data are presented as mean ± SEM. *p <0.05, **p<0.01 based on two-tailed Student’s t test or (*) p <0.05 based on one-tailed Student’s t test.
Eogt supports lymphoid and myeloid development in HSC lacking Pofut1
Previous work showed that inactivation of Pofut1 using Mx1-Cre causes a reduction in T lymphopoiesis in thymus and myeloid hyperplasia in bone marrow (24). In another study, conditional deletion of Pofut1 in bone marrow was shown to cause a milder T cell phenotype than deletion of RBP-Jk (25). To determine whether Eogt and O-GlcNAc glycans support Notch signaling and hematopoiesis in the absence of Pofut1, we used Vav1-iCre transgenic mice to generate conditional deletion (cKO) of Pofut1 (henceforth referred to as Pof cKO), and deletion of both Eogt and Pofut1 (henceforth referred to as EPof dKO), in hematopoietic stem cells. The absolute number of BM cells was significantly increased in both Pof cKO and EPof dKO mice (Figure 5). Gating strategies used to define HSC, HSPC, myeloid and lymphoid cell subsets in BM are shown in Supplementary Figure 6. Short-term (ST)-HSC, and LSK (Lineage-Sca1+cKit+) cell numbers were increased in both Pof cKO and EPof dKO mutants, but the frequency % of HSPCs was increased only in EPof dKO BM (Figure 5). By contrast, the frequency % of MPP subsets was reduced except for a small increase in the MPP3 population in EPof dKO BM (Figure 5). The frequency % of lymphoid primed multipotent progenitor cells (MPP4/LMPP) and common myeloid precursors (CMP) were reduced in Pof cKO and further reduced in EPof dKO BM, and megakaryocyte erythrocyte progenitors (MEP) were decreased in both single and double mutants (Figure 5). By contrast, the frequency % of granulocyte-monocyte progenitors (GMP) was increased in Pof cKO (as observed previously (24)), and further increased in EPof dKO BM (Figure 5 and Supplementary Figure 7). The proportion of CD11b+/Gr-1+ granulocytes was increased, but the proportion of common lymphoid progenitors (CLP) was reduced in EPof dKO BM (Figure 5). The frequency % of T- and B-cells in BM was also decreased in EPof dKO mice (Figure 5). NOTCH1 was expressed at the surface of Lin-Sca1+ cells which were increased in frequency in Pof cKO and EPof dKO BM (Supplementary Figure 8). Binding of DLL1 and DLL4 Notch ligands was low and similar in control and mutant Sca1+ cells (Supplementary Figure 8).
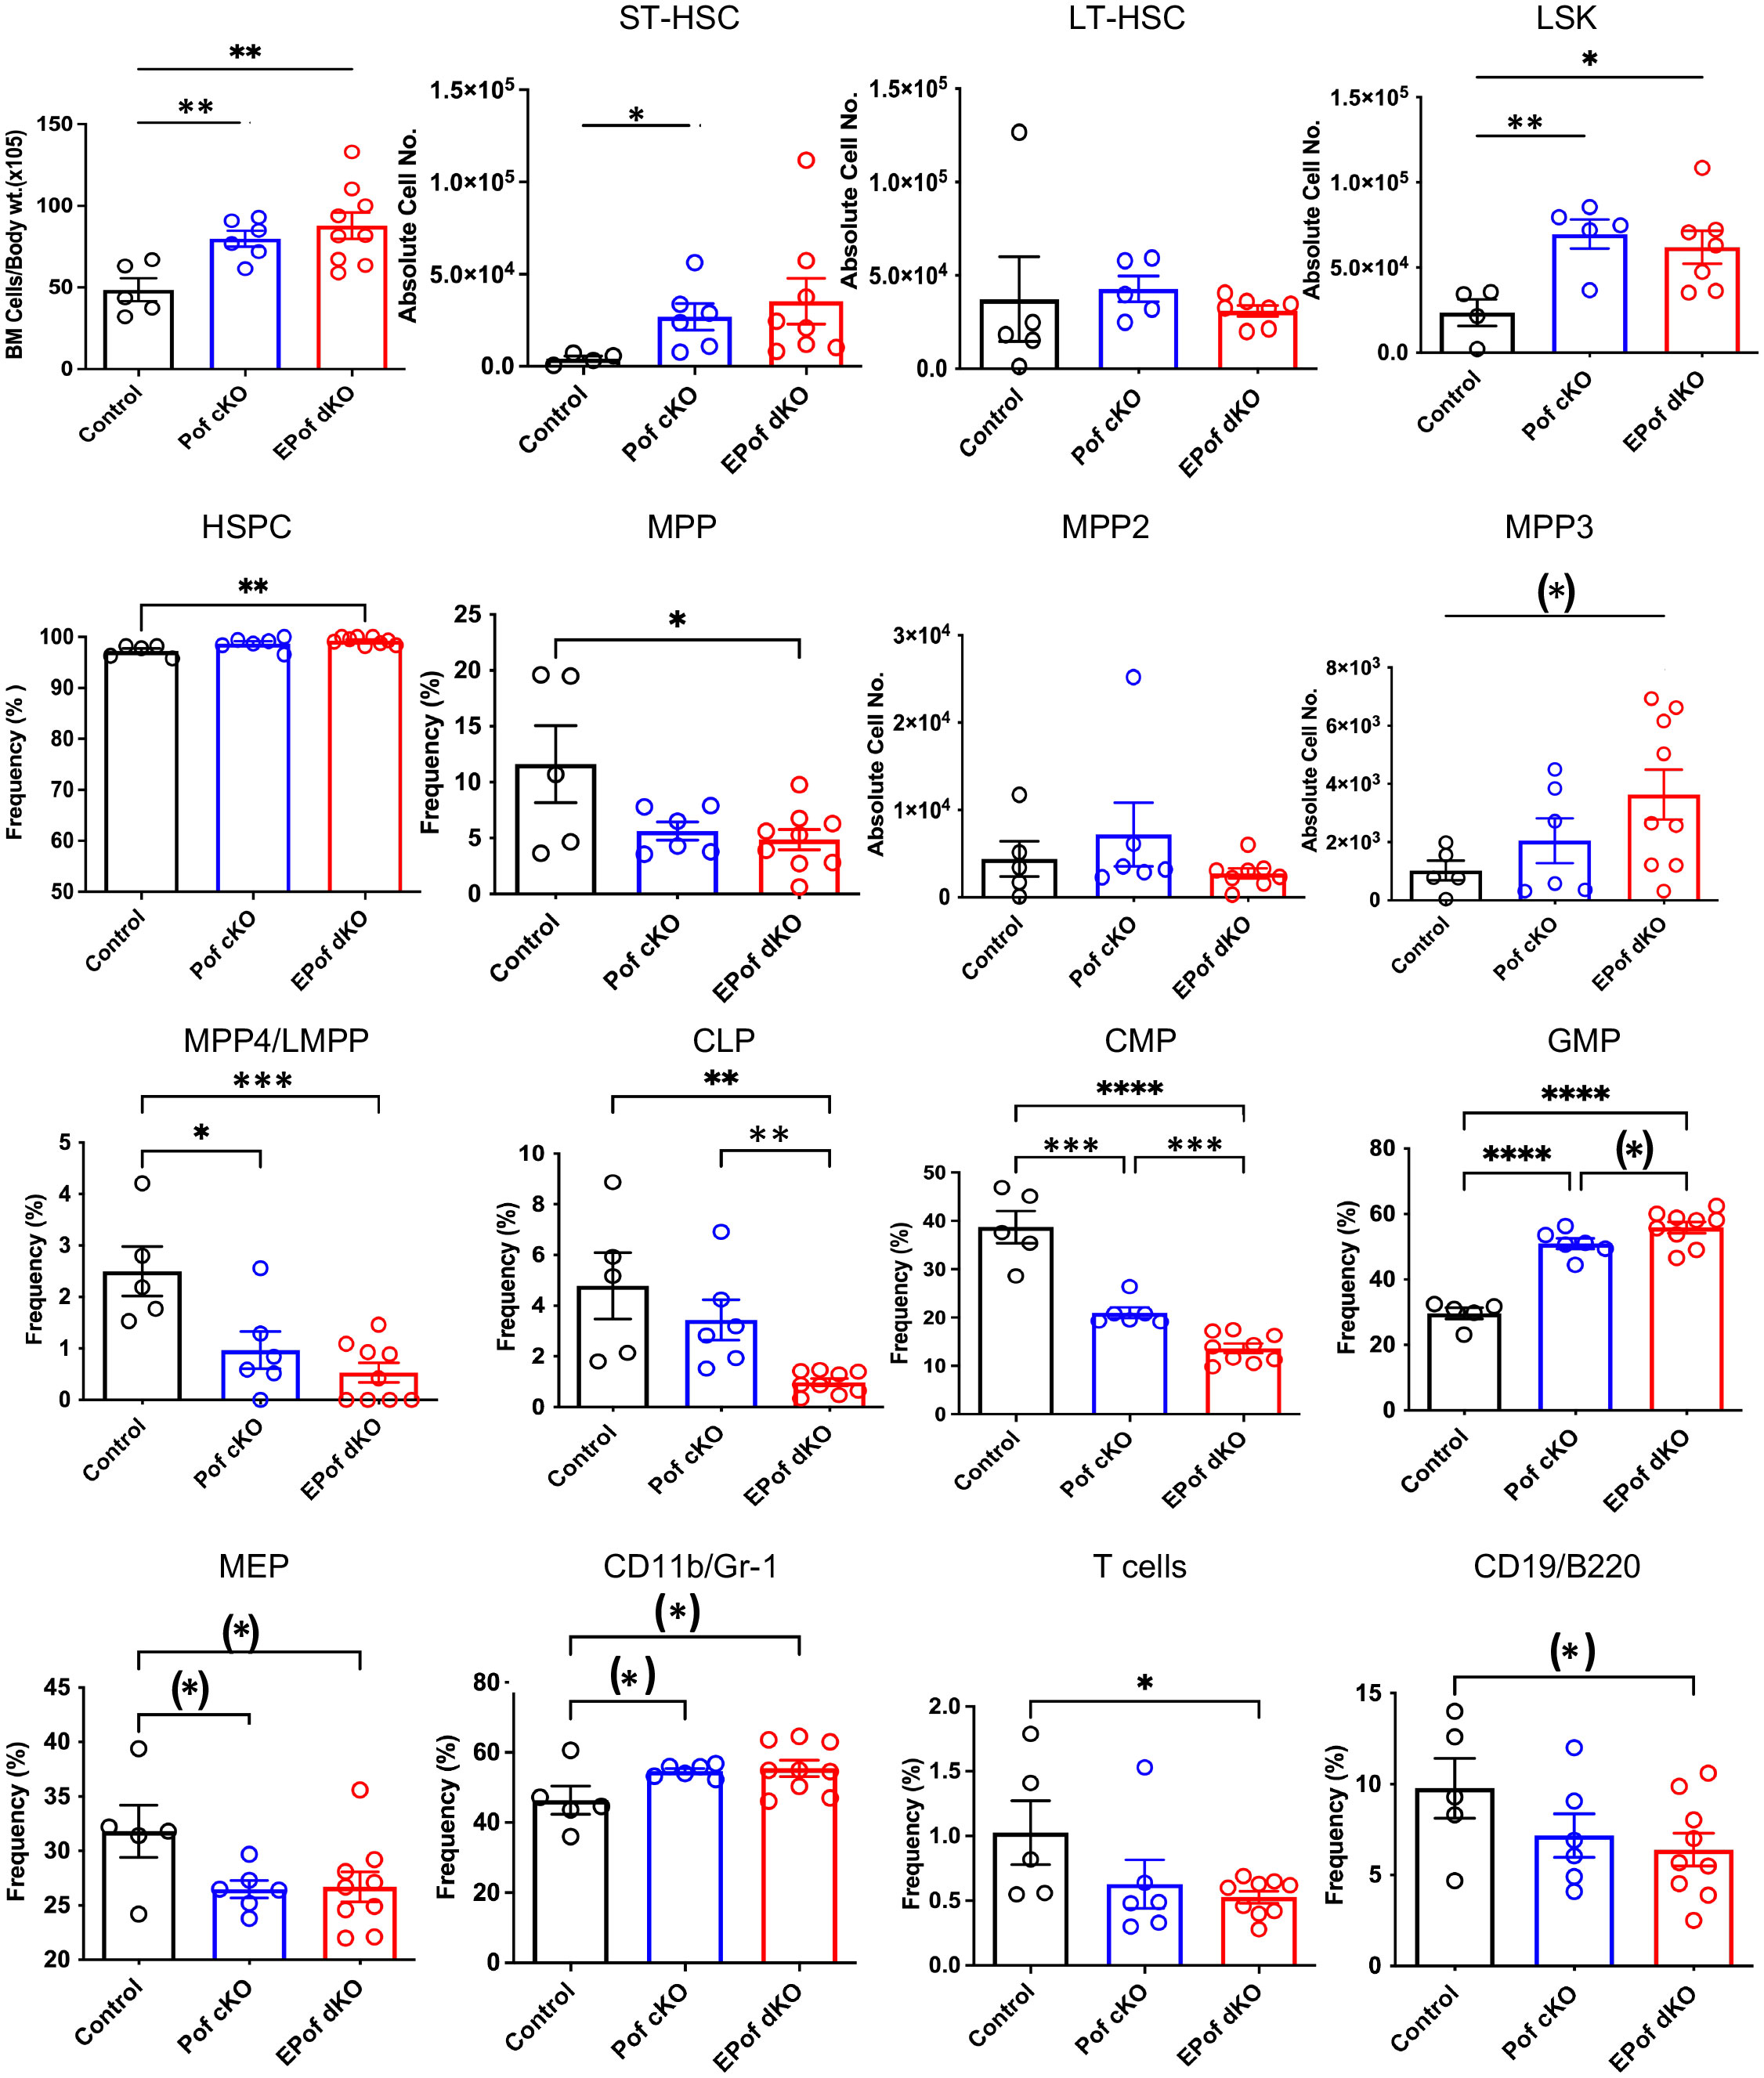
Figure 5 Hematopoiesis in EPof dKO bone marrow. Hematopoiesis was analyzed in bone marrow of Eogt[+/-]Pofut1[F/F] (Control), Pofut1[F/F] : Vav1-iCre (Pof cKO) and Eogt[-/-]Pofut1[F/F] : Vav1-iCre (EPof dKO) mice. Absolute numbers or frequency % of hemopoietic cell subsets in bone marrow are shown. Gating strategies are shown in Supplementary Figure 6 and additional data are shown in Supplementary Figure 7. Short term-hemopoietic stem cells (ST-HSC), long-term hemopoietic stem cells (LT-HSC), Lin-Sca1+c-Kit+ (LSK) cells, hematopoietic stem progenitor cells (HSPCs), multipotent progenitor-2, -3, -4 (MPP2, -3, -4), lymphoid primed multipotent progenitor cell (LMPP), common lymphoid progenitor (CLP), common myeloid progenitor (CMP), granulocyte monocyte progenitor (GMP), megakaryocyte erythrocyte progenitor (MEP), T cells, B cells and myeloid cells. Each symbol represents a mouse of 7-8 weeks. Data are presented as mean ± SEM. *p <0.05, **p<0.01, ***p<0.001, ****p<0.001 based on two-tailed Student’s t test or (*) p <0.05 based on one-tailed Student’s t test.
Highly disrupted development of T cells in EPof dKO thymus
Deletion of Pofut1 in HSC via Vav1-iCre led to a marked decrease in thymus weight and a similar reduction was observed in EPof dKO thymus (Figure 6A). The reduced size was accompanied by a dramatic change in T cell maturation (Figure 6B). Early thymic progenitors (ETP) were greatly decreased in absolute number, and each DN T cell progenitor population (DN1 to DN4) was also reduced in absolute cell number in Pof cKO, and even further reduced in EPof dKO thymocytes (Figure 6C and Supplementary Figure 9). Interestingly, however, the frequency % of DN4 T cells in both single and double mutant thymocytes was increased relative to control (Supplementary Figure 9), as observed in thymus lacking all Fringe activities (16). The DN T cell population, which includes few DN T cell progenitors and all the non-T cell populations, was greatly increased in Pof cKO and EPof dKO, as expected. This reflected loss of Notch signaling leading to the generation of B cell, myeloid and NK cell subsets in thymus (Figure 6D and Supplementary Figure 9). Notably, effects were more severe in EPof dKO than Pof cKO thymus, suggesting that the loss of Notch signaling was greater in EPof dKO thymus.
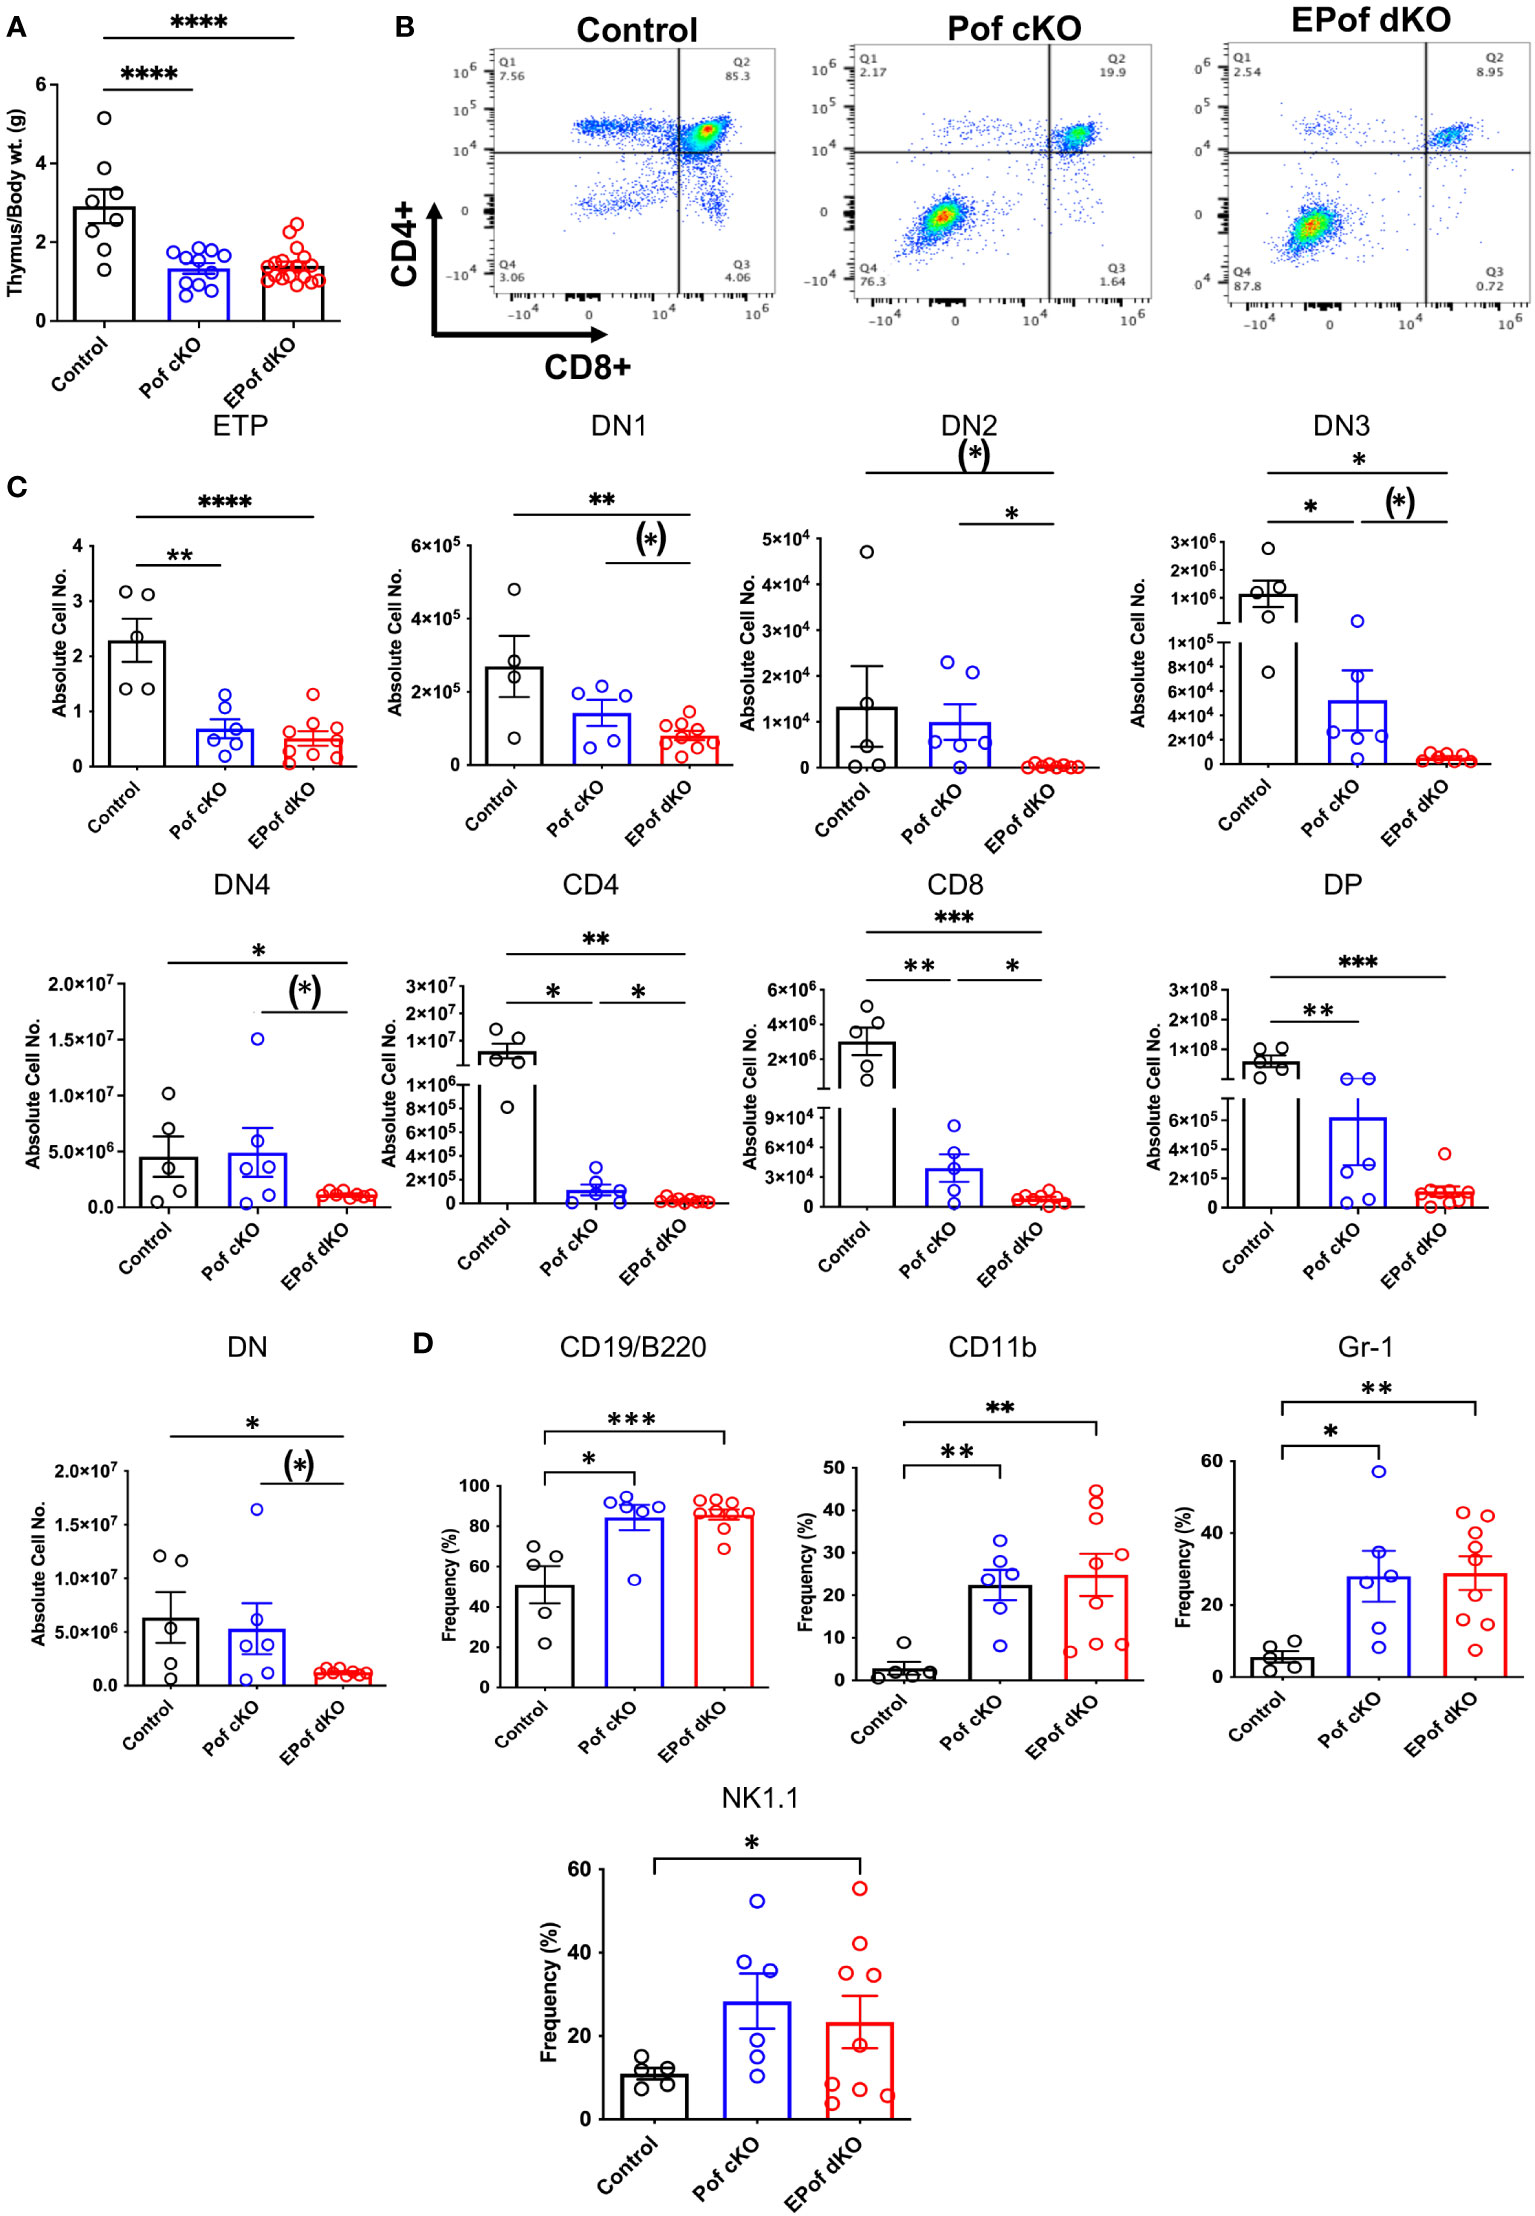
Figure 6 Impaired T cell development in Pof cKO thymus is worse in EPof dKO thymus. (A) Thymus weight compared to body weight. (B) Representative flow cytometry profiles of thymocytes using Abs to CD4 and CD8 cell surface markers after gating on live cells. (C) Absolute cell numbers or frequency % of T cell subsets that differed between Control and either mutant. ETP (DN1 cells that were cKit/CD117+), DN1 (CD44+CD25-), DN2 (CD44+CD25+), DN3 (CD44-CD25+), and DN4 (CD44-CD25-) T cell progenitors, DN (CD4 and CD8 double negative), DP (CD4 and CD8 double positive). (D) Absolute cell numbers or frequency % of B cell and myeloid cell subsets that differed from control are shown. Additional data are shown in Supplementary Figure 9. Each symbol represents a mouse of 7-8 weeks. Data are presented as mean ± SEM. *p <0.05, **p<0.01, ***p<0.001, ****p<0.001 based on two-tailed Student ‘st test or (*) p <0.05 based on one-tailed Student’s t test.
Defective B, T and myeloid cell development in EPof dKO spleen
Both Pof cKO and EPof dKO mice had an enlarged spleen (Figure 7A). Absolute numbers of splenocytes and spleen weight were increased in Pof cKO, and further increased in EPof dKO mice (Figure 7B). Histological analysis revealed extramedullary hematopoiesis in both Pof cKO and EPof dKO spleens, with larger areas of extramedullary hematopoiesis observed in EPof dKO spleen (Figure 7A).
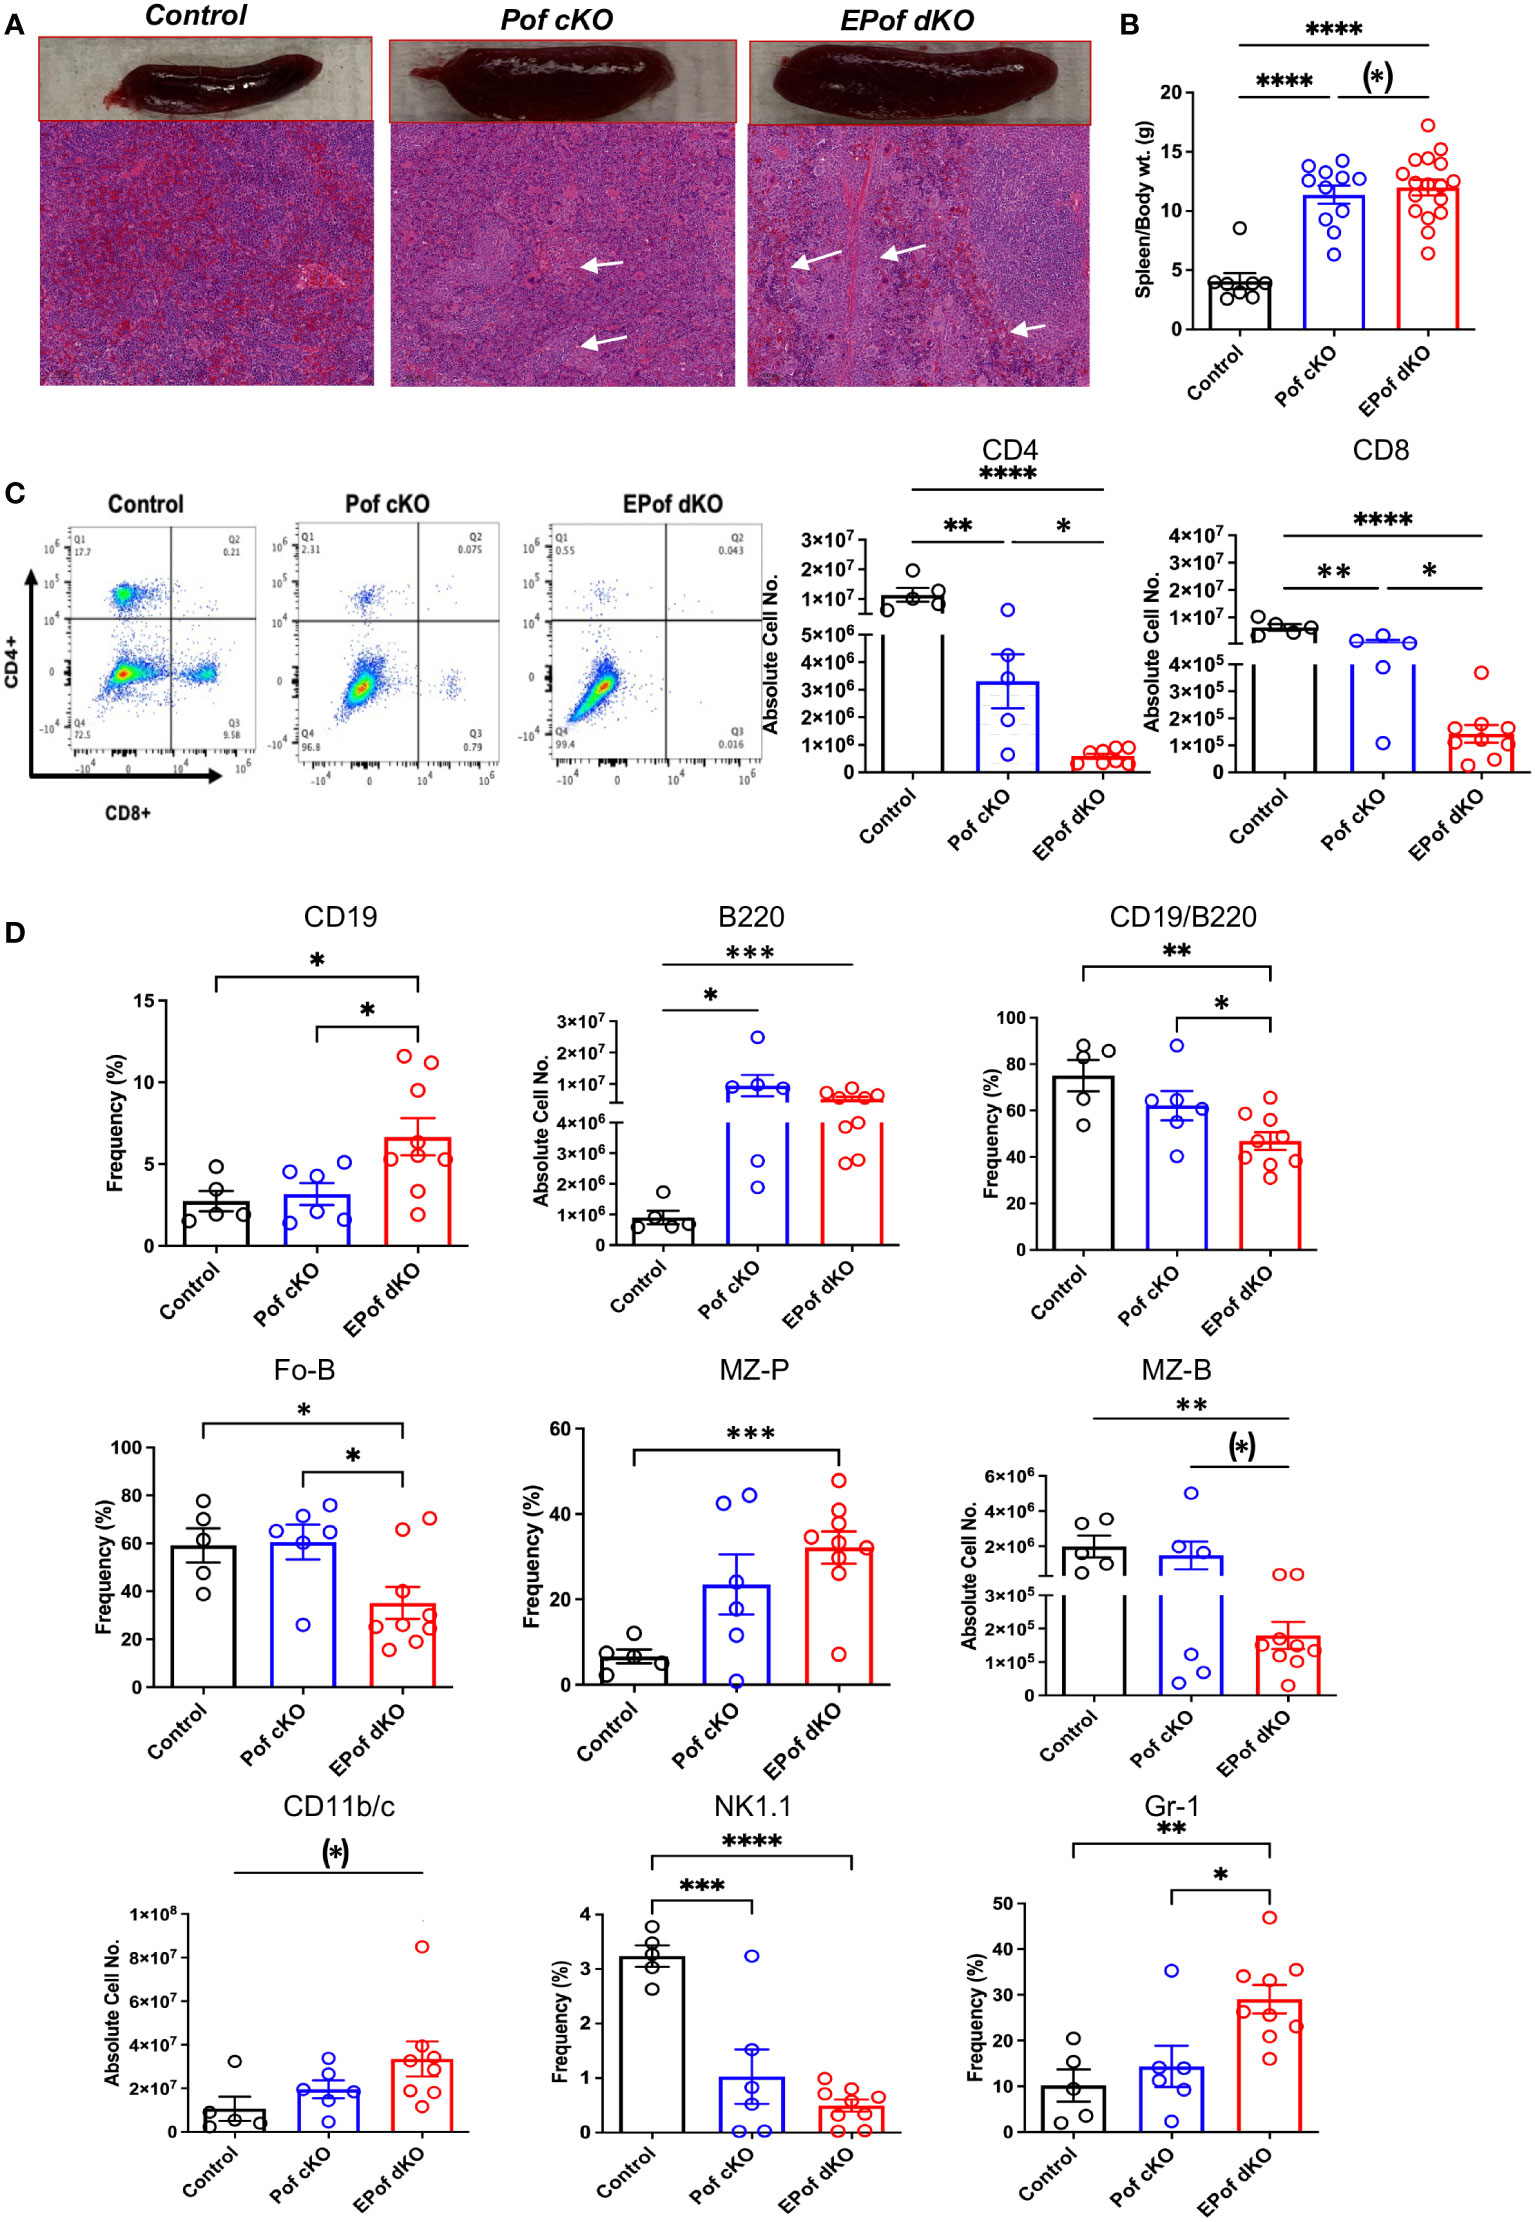
Figure 7 Impaired B and T cell development in Pof cKO spleen is worse in EPof dKO spleen. (A) Images of spleen sections stained by H&E revealing splenomegaly and extramedullary hematopoiesis (Bars represent 100 μm). (B) Spleen weight compared to body weight. (C) Flow cytometric profiles and histogram quantification for CD4 versus CD8 cell surface expression after gating on live cells. (D) Absolute cell numbers or frequency % of splenic lymphoid and myeloid cell subsets that differed from control are shown. CD19/B220 (B cells), Fo-B (follicular B cells), MZ-B (marginal zone-B cells), MZ-P (marginal zone precursors), CD11b/c (dendritic cells), NK1.1 (natural killer T cells) and Gr-1 (granulocytes). Additional data are shown in Supplementary Figure 10. Each symbol represents a mouse of 7-8 weeks. Data are presented as mean ± SEM. *p <0.05, **p<0.01, ***p<0.001, ****p<0.001 based on two-tailed Student’s t test or (*) p <0.05, based on one-tailed Student’s t test.
The absolute numbers of single positive CD4+ and CD8+ T cells were significantly reduced in Pof cKO, and further reduced in EPof dKO spleen (Figure 7C and Supplementary Figure 10). While CD19+ and B220+ B cells were proportionally increased in both Pof cKO and EPof dKO spleen, the frequency % of the CD19+/B220+ B cell population was reduced (Figure 7D). The frequency of Fo-B and the number of MZ-B cells were also reduced (Figure 7D and Supplementary Figure 10). While the absolute number of MZ-P cells did not change in the mutants, the frequency % of MZ-P precursors was increased in EPof dKO spleen (Figure 7 and Supplementary Figure 10). Myeloid cell subsets such as dendritic cells (CD11b/c+) and Gr-1+ granulocytes were increased in greater proportion in EPof dKO compared to Pof cKO spleens. Natural killer T cells were reduced in frequency in both Pof cKO and EPof dKO spleens (Figure 7D and Supplementary Figure 10).
Discussion
Defining specific roles for the glycans that regulate Notch signaling in lymphoid and myeloid development facilitates our understanding of cell fate decisions controlled by Notch signaling, and of potential consequences for people with congenital diseases that perturb Notch signaling (2, 43). Several congenital diseases inhibit the synthesis or extension of O-glycans that regulate Notch signaling and may induce immune cell defects. Mutations in EOGT cause Adams Oliver syndrome (44) and autosomal dominant mutations in POFUT1 cause Dowling Degos Disease 2 (DDD2) (45). Here we show that the generation of certain lymphoid and myeloid subsets in bone marrow, thymus and spleen was perturbed in mice lacking Eogt. In bone marrow, loss of EOGT caused increased numbers of B cells and granulocytes. In thymus, the phenotype of Eogt null mice was similar, but not identical to, mice which lack all three Fringe genes (Fng tKO) (16). T cell progenitors DN1 and DN2 were reduced in frequency or absolute number, whereas DN4 T cell progenitors were increased, DP T cells were slightly reduced in frequency, and CD4+ and CD8+ SP T cells were increased in absolute numbers. Inhibition of Notch signaling in thymus is well known to lead to the generation of B cells and myeloid cells in thymus (9, 11, 46, 47). Eogt null thymus contained significantly increased numbers of B cells and granulocytes, and an increased frequency of myeloid cells. In spleen, Eogt null splenocytes included increased numbers of several B cell subsets, although there were no effects on T cells, unlike in Fng tKO mice which had a reduced frequency of T cells in spleen (16). Deletion of RBP-Jk by Vav1-iCre results in an increased frequency of CD19+ B cells (48), also observed in Eogt null spleen. Eogt null mice showed increased absolute numbers of CD19+ B cells, increased Fo-B cells, and a decrease in natural killer T-cells and dendritic cells in the spleen. The overall Eogt null phenotype was largely cell autonomous following bone marrow transplantation. In addition, expression of Notch target genes Hes1 and Il2ra was reduced, similar to Fng tKO DN T cell progenitors that had reduced Il2ra and Dtx1 expression (16). The combined data provide strong evidence that EOGT and O-GlcNAc glycans are required for optimal Notch signaling in the development of lymphoid and myeloid cells from HSC.
Further evidence that EOGT and O-GlcNAc glycans support Notch signaling in lymphoid and myeloid development was obtained in compound mutant mice lacking Eogt and conditionally lacking Pofut1 in HSC. EPof dKO lymphoid and myeloid populations in BM, thymus and spleen were more affected compared to Pof cKO. We conclude that the loss of Eogt and O-GlcNAc glycans in EPof cKO HSC exacerbated the deficits in T, B and myeloid differentiation evident in Pof cKO mice. This result, and our findings that Eogt is required for optimal Notch signaling and the differentiation of HSC, provide an explanation for the observation that Pofut1:Mx1-Cre T cell deficiencies were not as severe as those obtained in RBP-Jk : Mx1-Cre thymus (25). In the absence of POFUT1 and O-fucose glycans, the O-GlcNAc glycans transferred by EOGT to Notch receptors can support a low but significant level of Notch signaling. Thus, as shown here and discussed in a recent review (49), the O-fucose and O-GlcNAc glycans on Notch act synergistically to provide optimal Notch signaling in lymphopoiesis and myelopoiesis.
The conclusions obtained from these experiments are necessarily limited by the difficulty of demonstrating structural changes in the O-glycans on Notch receptors predicted to change in the absence of relevant glycosyltransferase(s). For example, to obtain sufficient NOTCH1 from splenic T cells for analysis by mass spectrometry, it was necessary to activate the T cells in culture thereby increasing cell surface NOTCH1 by ~ 10-fold (50). Furthermore, the effects of conditional deletion of Eogt in HSC would allow us to define the contribution, if any, of Eogt null stroma to the Eogt null phenotype. It would also be important to determine Notch ligand binding and Notch target gene expression in cells from different HSPC lineages in Pof cKO and EPof dKO mice. Single cell RNA-seq of different mutant HSC and HSPCs would greatly expand our understanding of the pathways affected by altered Notch signaling due to loss of regulation by O-glycans in HSC. Moreover, it would be important to investigate roles for the O-glycans on Notch ligands by deleting Pofut1, Eogt and related glycosyltransferase genes in stromal cells. Another important question for future work is whether changes in immune subset cell numbers reflect apoptosis or proliferation of one or more populations. This question and changes in Notch target gene expression are difficult to determine because changes in Notch signaling lead to changes in cell fates. For example, thymus lacking POFUT1 or EOGT + POFUT1 has few, if any, T cell progenitors and largely comprises B cells, myeloid and NK cells making comparisons with wild type or Eogt null thymocytes meaningless in terms of underlying mechanisms. Thus, the major benefit of the experiments reported here is to pinpoint cell fate decisions regulated differently by the strength of Notch signaling which in turn is regulated by the O-glycans of Notch receptors. In addition, our findings contribute to the growing body of evidence that glycans are integral to the functions of all glycoproteins, glycolipids, glycophosphatidylinositol (GPI)-anchored proteins and proteoglycans. Glycans must be included as essential contributors to life, along with proteins, nucleic acids and lipids, to facilitate progress in the personalized medicines of the future (51).
Data availability statement
The raw data supporting the conclusions of this article will be made available by the authors, without undue reservation.
Ethics statement
The animal studies were approved by Institutional Animal Care and Use Committee. The studies were conducted in accordance with the local legislation and institutional requirements. Written informed consent was not obtained from the owners for the participation of their animals in this study because the mice were bred in my colony at Albert Einstein following approval of the IACUC. I am therefore the owner.
Author contributions
Conceptualization, PS; Methodology, PS and AT; Investigation, AT and PS; Visualization AT and PS; Funding acquisition, PS; Project administration, PS; Supervision, PS; Writing – original draft, AT; review and editing, PS and AT. All authors contributed to the article and approved the submitted version.
Funding
This work was supported by research funding from the National Institutes of Health grant RO1 GM-106417 (PS) and National Institutes of Health grant PO1 grant CA-13330 (partial support from core facilities).
Acknowledgments
We thank Dr. Jinghang Zhang and Aodengtuya of the Flow Cytometry Core Facility of the Albert Einstein Cancer Center for their assistance in discussing multi-color flow cytometry experimental strategies. We are also thankful to Subha Sundaram for her technical support and Swathi-Rao Narayanagari for her assistance in the bone marrow transplantation (BMT) study. We thank Hillary Guzik and Andrea Briceno from the Analytical Imaging Facility of the Einstein Cancer Center for slide scanning using a 3D Histech P250 High-Capacity Slide Scanner purchased with NIH SIG #1S10OD019961-01.
Conflict of interest
The authors declare that the research was conducted in the absence of any commercial or financial relationships that could be construed as a potential conflict of interest.
Publisher’s note
All claims expressed in this article are solely those of the authors and do not necessarily represent those of their affiliated organizations, or those of the publisher, the editors and the reviewers. Any product that may be evaluated in this article, or claim that may be made by its manufacturer, is not guaranteed or endorsed by the publisher.
Supplementary material
The Supplementary Material for this article can be found online at: https://www.frontiersin.org/articles/10.3389/fimmu.2023.1097332/full#supplementary-material
References
1. Kopan R. Notch signaling. In: Cold spring harbor perspectives in biology, vol. 4. (2012). p. a011213–a. doi: 10.1101/cshperspect.a011213
2. Varshney S, Stanley P. Multiple roles for O-glycans in Notch signaling. FEBS Lett (2018) 592(23):3819–34. doi: 10.1002/1873-3468.13251
3. Pandey A, Niknejad N, Jafar-Nejad H. Multifaceted regulation of Notch signaling by glycosylation. Glycobiology (2021) 31(1):8–28. doi: 10.1093/glycob/cwaa049
4. Luca VC, Jude KM, Pierce NW, Nachury MV, Fischer S, Garcia KC. Structural biology. Structural basis for Notch1 engagement of Delta-like 4. Science (2015) 347(6224):847–53. doi: 10.1126/science.1261093
5. Luca VC, Kim BC, Ge C, Kakuda S, Wu D, Roein-Peikar M, et al. Notch-Jagged complex structure implicates a catch bond in tuning ligand sensitivity. Science (2017) 355(6331):1320–4. doi: 10.1126/science.aaf9739
6. Kovall RA, Gebelein B, Sprinzak D, Kopan R. The canonical Notch signaling pathway: structural and biochemical insights into shape, sugar, and force. Dev Cell (2017) 41(3):228–41. doi: 10.1016/j.devcel.2017.04.001
7. Ho DM, Guruharsha KG, Artavanis-Tsakonas S. The Notch interactome: complexity in signaling circuitry. Adv Exp Med Biol (2018) 1066:125–40. doi: 10.1007/978-3-319-89512-3_7
8. Lampreia FP, Carmelo JG, Anjos-Afonso F. Notch signaling in the regulation of hematopoietic stem cell. Curr Stem Cell Rep (2017) 3(3):202–9. doi: 10.1007/s40778-017-0090-8
9. Vanderbeck A, Maillard I. Notch signaling at the crossroads of innate and adaptive immunity. J Leukoc Biol (2021) 109(3):535–48. doi: 10.1002/JLB.1RI0520-138R
10. Koch U, Fiorini E, Benedito R, Besseyrias V, Schuster-Gossler K, Pierres M, et al. Delta-like 4 is the essential, nonredundant ligand for Notch1 during thymic T cell lineage commitment. J Exp Med (2008) 205(11):2515–23. doi: 10.1084/jem.20080829
11. Feyerabend TB, Terszowski G, Tietz A, Blum C, Luche H, Gossler A, et al. Deletion of Notch1 converts pro-T cells to dendritic cells and promotes thymic B cells by cell-extrinsic and cell-intrinsic mechanisms. Immunity (2009) 30(1):67–79. doi: 10.1016/j.immuni.2008.10.016
12. Romero-Wolf M, Shin B, Zhou W, Koizumi M, Rothenberg EV, Hosokawa H. Notch2 complements Notch1 to mediate inductive signaling that initiates early T cell development. J Cell Biol (2020) 219(10):e202005093. doi: 10.1083/jcb.202005093
13. Saito T, Chiba S, Ichikawa M, Kunisato A, Asai T, Shimizu K, et al. Notch2 is preferentially expressed in mature B cells and indispensable for marginal zone B lineage development. Immunity (2003) 18(5):675–85. doi: 10.1016/s1074-7613(03)00111-0
14. Hozumi K, Negishi N, Suzuki D, Abe N, Sotomaru Y, Tamaoki N, et al. Delta-like 1 is necessary for the generation of marginal zone B cells but not T cells in vivo. Nat Immunol (2004) 5(6):638–44. doi: 10.1038/ni1075
15. Tan JB, Xu K, Cretegny K, Visan I, Yuan JS, Egan SE, et al. Lunatic and manic fringe cooperatively enhance marginal zone B cell precursor competition for Delta-like 1 in splenic endothelial niches. Immunity (2009) 30(2):254–63. doi: 10.1016/j.immuni.2008.12.016
16. Song Y, Kumar V, Wei H-X, Qiu J, Stanley P. Lunatic, manic, and radical fringe each promote T and B cell development. J Immunol (2016) 196(1):232–43. doi: 10.4049/jimmunol.1402421
17. Harvey BM, Haltiwanger RS. Regulation of Notch function by O-glycosylation. Adv Exp Med Biol (2018) 1066:59–78. doi: 10.1007/978-3-319-89512-3_4
18. Heng TS, Painter MW. Immunological genome project C. The immunological genome project: networks of gene expression in immune cells. Nat Immunol (2008) 9(10):1091–4. doi: 10.1038/ni1008-1091
19. Rampal R, Luther KB, Haltiwanger RS. Notch signaling in normal and disease states: possible therapies related to glycosylation. Curr Mol Med (2007) 7(4):427–45. doi: 10.2174/156652407780831593
20. Ogawa M, Okajima T. Structure and function of extracellular O-GlcNAc. Curr Opin Struct Biol (2019) 56:72–7. doi: 10.1016/j.sbi.2018.12.002
21. Yuan JS, Tan JB, Visan I, Matei IR, Urbanellis P, Xu K, et al. Lunatic fringe prolongs Delta/Notch-induced self-renewal of committed alphabeta T-cell progenitors. Blood (2011) 117(4):1184–95. doi: 10.1182/blood-2010-07-296616
22. Visan I, Yuan JS, Liu Y, Stanley P, Guidos CJ. Lunatic fringe enhances competition for delta-like notch ligands but does not overcome defective pre-tcr signaling during thymocyte beta-selection in vivo. J Immunol (2010) 185(8):4609–17. doi: 10.4049/jimmunol.1002008
23. Visan I, Tan JB, Yuan JS, Harper JA, Koch U, Guidos CJ. Regulation of T lymphopoiesis by Notch1 and Lunatic fringe-mediated competition for intrathymic niches. Nat Immunol (2006) 7(6):634–43. doi: 10.1038/ni1345
24. Yao D, Huang Y, Huang X, Wang W, Yan Q, Wei L, et al. Protein O-fucosyltransferase 1 (Pofut1) regulates lymphoid and myeloid homeostasis through modulation of Notch receptor ligand interactions. Blood (2011) 117(21):5652–62. doi: 10.1182/blood-2010-12-326074
25. Yu VWC, Saez B, Cook C, Lotinun S, Pardo-Saganta A, Wang Y-H, et al. Specific bone cells produce DLL4 to generate thymus-seeding progenitors from bone marrow. J Exp Med (2015) 212(5):759–74. doi: 10.1084/jem.20141843
26. Shi S, Stanley P. Protein O-fucosyltransferase 1 is an essential component of Notch signaling pathways. Proc Natl Acad Sci (2003) 100(9):5234–9. doi: 10.1073/pnas.0831126100
27. Okamura Y, Saga Y. Pofut1 is required for the proper localization of the Notch receptor during mouse development. Mech Dev (2008) 125(8):663–73. doi: 10.1016/j.mod.2008.04.007
28. Oka C, Nakano T, Wakeham A, de la Pompa JL, Mori C, Sakai T, et al. Disruption of the mouse RBP-J kappa gene results in early embryonic death. Development (1995) 121(10):3291–301. doi: 10.1242/dev.121.10.3291
29. Teng Y, Liu Q, Ma J, Liu F, Han Z, Wang Y, et al. Cloning, expression and characterization of a novel human cap10-like gene hclp46 from cd34(+) stem/progenitor cells. Gene (2006) 371(1):7–15. doi: 10.1016/j.gene.2005.08.027
30. Acar M, Jafar-Nejad H, Takeuchi H, Rajan A, Ibrani D, Rana NA, et al. Rumi is a cap10 domain glycosyltransferase that modifies Notch and is required for Notch signaling. Cell (2008) 132(2):247–58. doi: 10.1016/j.cell.2007.12.016
31. Fernandez-Valdivia R, Takeuchi H, Samarghandi A, Lopez M, Leonardi J, Haltiwanger RS, et al. Regulation of mammalian Notch signaling and embryonic development by the protein O-glucosyltransferase Rumi. Development (2011) 138(10):1925–34. doi: 10.1242/dev.060020
32. Matsumoto K, Ayukawa T, Ishio A, Sasamura T, Yamakawa T, Matsuno K. Dual roles of O-glucose glycans redundant with monosaccharide O-fucose on Notch in Notch signaling. J Biol Chem (2016) 291(26):13743–52. doi: 10.1074/jbc.M115.710483
33. Takeuchi H, Yu H, Hao H, Takeuchi M, Ito A, Li H, et al. O-glycosylation modulates the stability of epidermal growth factor-like repeats and thereby regulates Notch trafficking. J Biol Chem (2017) 292(38):15964–73. doi: 10.1074/jbc.M117.800102
34. Wang Y, Wu B, Lu P, Zhang D, Wu B, Varshney S, et al. Uncontrolled angiogenic precursor expansion causes coronary artery anomalies in mice lacking Pofut1. Nat Commun (2017) 8(1):578. doi: 10.1038/s41467-017-00654-w
35. Stahl M, Uemura K, Ge C, Shi S, Tashima Y, Stanley P. Roles of Pofut1 and O-fucose in mammalian Notch signaling. J Biol Chem (2008) 283(20):13638–51. doi: 10.1074/jbc.m802027200
36. Matsuura A, Ito M, Sakaidani Y, Kondo T, Murakami K, Furukawa K, et al. O-linked N-acetylglucosamine is present on the extracellular domain of Notch receptors. J Biol Chem (2008) 283(51):35486–95. doi: 10.1074/jbc.M806202200
37. Sakaidani Y, Nomura T, Matsuura A, Ito M, Suzuki E, Murakami K, et al. O-linked-N-acetylglucosamine on extracellular protein domains mediates epithelial cell-matrix interactions. Nat Commun (2011) 2:583. doi: 10.1038/ncomms1591
38. Müller R, Jenny A, Stanley P. The egf repeat-specific O-GlcNAc transferase and Eogt interacts with Notch signaling and pyrimidine metabolism pathways in drosophila. PloS One (2013) 8(5):e62835. doi: 10.1371/journal.pone.0062835
39. Sawaguchi S, Varshney S, Ogawa M, Sakaidani Y, Yagi H, Takeshita K, et al. O-GlcNAc on NOTCH1 EGF repeats regulates ligand-induced Notch signaling and vascular development in mammals. eLife (2017) 6. doi: 10.7554/elife.24419
40. Pietras EM, Reynaud D, Kang YA, Carlin D, Calero-Nieto FJ, Leavitt AD, et al. Functionally distinct subsets of lineage-biased multipotent progenitors control blood production in normal and regenerative conditions. Cell Stem Cell (2015) 17(1):35–46. doi: 10.1016/j.stem.2015.05.003
41. Chen ELY, Thompson PK, Zúñiga-Pflücker JC. RBP J-dependent Notch signaling initiates the T cell program in a subset of thymus-seeding progenitors. Nat Immunol (2019) 20(11):1456–68. doi: 10.1038/s41590-019-0518-7
42. Stanley P, Kumar V, Tanwar A. Roles of Notch glycoslation in signaling. FASEB J (2021) 35(S1). doi: 10.1096/fasebj.2021.35.S1.00061
43. Matsumoto K, Luther KB, Haltiwanger RS. Diseases related to Notch glycosylation. Mol Aspects Med (2021) 79:100938. doi: 10.1016/j.mam.2020.100938
44. Schröder KC, Duman D, Tekin M, Schanze D, Sukalo M, Meester J, et al. Adams–Oliver syndrome caused by mutations of the EOGT gene. Am J Med Genet Part A (2019) 179(11):2246–51. doi: 10.1002/ajmg.a.61313
45. Atzmony L, Zaki TD, Antaya RJ, Choate KA. Phenotypic expansion of POFUT1 loss of function mutations in a disorder featuring segmental dyspigmentation with eczematous and folliculo-centric lesions. Am J Med Genet A (2019) 179(12):2469–73. doi: 10.1002/ajmg.a.61362
46. Hozumi K, Mailhos C, Negishi N, Hirano K-I, Yahata T, Ando K, et al. Delta-like 4 is indispensable in thymic environment specific for T cell development. J Exp Med (2008) 205(11):2507–13. doi: 10.1084/jem.20080134
47. Stanley P, Guidos CJ. Regulation of Notch signaling during T- and B-cell development by O-fucose glycans. Immunol Rev (2009) 230(1):201–15. doi: 10.1111/j.1600-065x.2009.00791.x
48. Lakhan R, Rathinam CV. Deficiency of rbpj leads to defective stress-induced hematopoietic stem cell functions and hif mediated activation of non-canonical Notch signaling pathways. Front Cell Dev Biol (2021) 8:622190(1923). doi: 10.3389/fcell.2020.622190
49. Stanley P, Tanwar A. Regulation of myeloid and lymphoid cell development by O-glycans on Notch. Front Mol Biosci (2022) 9:979724(979724). doi: 10.3389/fmolb.2022.979724
50. Matsumoto K, Kumar V, Varshney S, Nairn AV, Ito A, Pennarubia F, et al. Fringe GlcNAc-transferases differentially extend O-fucose on endogenous NOTCH1 in mouse activated T cells. J Biol Chem (2022) 298:102064. doi: 10.1016/j.jbc.2022.102064
Keywords: Notch signaling, O-glycans, HSC, lymphoid, myeloid
Citation: Tanwar A and Stanley P (2023) Synergistic regulation of Notch signaling by different O-glycans promotes hematopoiesis. Front. Immunol. 14:1097332. doi: 10.3389/fimmu.2023.1097332
Received: 13 November 2022; Accepted: 01 September 2023;
Published: 19 September 2023.
Edited by:
Wei Wang, Edith Cowan University, AustraliaReviewed by:
Jyothi S. Prasanna, Manipal Academy of Higher Education, IndiaBorhane Guezguez, German Cancer Research Center (DKFZ), Germany
Copyright © 2023 Tanwar and Stanley. This is an open-access article distributed under the terms of the Creative Commons Attribution License (CC BY). The use, distribution or reproduction in other forums is permitted, provided the original author(s) and the copyright owner(s) are credited and that the original publication in this journal is cited, in accordance with accepted academic practice. No use, distribution or reproduction is permitted which does not comply with these terms.
*Correspondence: Pamela Stanley, cGFtZWxhLnN0YW5sZXlAZWluc3RlaW5tZWQuZWR1