 Xianxian Jia1†
 Hua Zhu1†Qinglian Jiang1,2Jia Gu1Shihan Yu1Xuyang Chi1Rui Wang1Yu Shan3Hong Jiang1
 Xiaoxue Ma1,4*
- 1Department of Pediatrics, The First Hospital of China Medical University, Shenyang, China
- 2Department of General Pediatrics, Zhongshan City People’s Hospital, Guangzhou, China
- 3First Department of Internal Medicine, School of Medicine, University of Occupational and Environmental Health, Kitakyushu, Japan
- 4Department of Microbiology & Immunology and Pediatrics, Dalhousie University, Halifax, NS, Canada
Background: IgAV, the most common systemic vasculitis in childhood, is an immunoglobulin A-associated immune complex-mediated disease and its underlying molecular mechanisms are not fully understood. This study attempted to identify differentially expressed genes (DEGs) and find dysregulated immune cell types in IgAV to find the underlying pathogenesis for IgAVN.
Methods: GSE102114 datasets were obtained from the Gene Expression Omnibus (GEO) database to identify DEGs. Then, the protein-protein interaction (PPI) network of the DEGs was constructed using the STRING database. And key hub genes were identified by cytoHubba plug-in, performed functional enrichment analyses and followed by verification using PCR based on patient samples. Finally, the abundance of 24 immune cells were detected by Immune Cell Abundance Identifier (ImmuCellAI) to estimate the proportions and dysregulation of immune cell types within IgAVN.
Result: A total of 4200 DEGs were screened in IgAVN patients compared to Health Donor, including 2004 upregulated and 2196 downregulated genes. Of the top 10 hub genes from PPI network, STAT1, TLR4, PTEN, UBB, HSPA8, ATP5B, UBA52, and CDC42 were verified significantly upregulated in more patients. Enrichment analyses indicated that hub genes were primarily enriched in Toll-like receptor (TLR) signaling pathway, nucleotide oligomerization domain (NOD)-like receptor signaling pathway, and Th17 signaling pathways. Moreover, we found a diversity of immune cells in IgAVN, consisting mainly of T cells. Finally, this study suggests that the overdifferentiation of Th2 cells, Th17 cells and Tfh cells may be involved in the occurrence and development of IgAVN.
Conclusion: We screened out the key genes, pathways and maladjusted immune cells and associated with the pathogenesis of IgAVN. The unique characteristics of IgAV-infiltrating immune cell subsets were confirmed, providing new insights for future molecular targeted therapy and a direction for immunological research on IgAVN.
1 Introduction
Immunoglobulin A associated vasculitis (IgAV), also known as Henoch-Schonlein purpura, is a common systemic vascular inflammatory disease that chiefly manifests as skin purpura, arthritis, abdominal pain, gastrointestinal bleeding, and kidney involvement (1, 2), with an annual incidence of 13-20/100,000 (3). It is characterized by immunoglobulin A-dominant immune deposition in small blood vessels, and the excessive production of various inflammatory molecules. Renal involvement occurs in up to 40% of cases, and approximately 3% of cases with IgAV nephritis (IgAVN) progress to end-stage renal disease (1). Thus, the severity of kidney involvement often directly affects the course and prognosis of the disease. Despite major research progress, the underlying molecular mechanisms of IgAVN remain elusive. Therefore, it is crucial to study the pathogenesis of IgAVN and identify the underlying molecular markers relevant to the personalized therapy of IgAVN.
Recently, rapidly evolving bioinformatic and functional analysis play an important role to define the fundamental mechanisms of disease pathogenesis. By integrative analysis of transcriptomics and proteomics, Xie et al. identified a cluster of serums mRNAs and proteins and four pathways including JAK-STAT, mTOR, SWI/SNF and Wnt closely related to IgAVN progression (4). By bioinformatic study of proteins identified by iTRAQ, Gao et al. revealed that differential genes were mainly enriched in lipid metabolism and adhesion connection pathways, among which CDC42 and CTNNB1 were potential candidates involved in the pathogenesis of IgAVN (5). Based on urinary proteomics analysis, Fang et al. assessed the development of IgAVN in children and discovered the signaling pathways involved, such as cell adhesion and PI3K-AKT signaling (6). These studies provided new insights into the pathogenesis of IgAVN. Indeed, IgAV is a systemic vasculitis, which involves systemic dysregulation of immunity. Abnormal expression of immune factors and imbalance of immune cell differentiation in general circulation may play crucial roles in the pathogenesis of IgAVN (7). However, up to now, the biomarkers of IgAVN immunological characteristics are still lacking. Therefore, it is necessary to identify key pathways and immune cells in vasculitis, and to assess the significance of the immune microenvironment in the pathogenesis of IgAVN.
In the present study, through bioinformatics analysis, validation of hub genes expression and assessment of peripheral blood lymphocyte phenotype from patients with IgAVN, we aimed to investigate the potential immune modulatory mechanisms of IgAVN to construct novel underlying candidate biomarkers for the effective prediction of therapeutic targets in the future.
2 Materials and methods
2.1 Data collection and identification of differentially expressed genes (DEGs)
The GSE102114 contained 10 peripheral blood samples including four healthy donors (HD) and six IgAVN patients submitted by Pang et al. (8) was acquired from the Gene Expression Omnibus (GEO) dataset (http://www.ncbi.nlm.nih.gov/geo/) (9, 10). The raw count data of GSE102114 was generated using the GPL11154 platform. As for the data processing, the raw count data was transformed into counts per million (cpm) data using the R package “edgeR” firstly (11–13). The “filterByExpr” function in the “edgeR” package was used to automatically select and exclude the genes with low-expression. Then, the “voom” function of the “limma” package was utilized to normalize the logCPM expression value of the total samples based on the quantile normalization method (14). Principal component analysis (PCA) and hierarchical cluster analysis were used to reflect the similarity and difference among different samples. Subsequently, the differentially expressed genes between IgAVN patients and HD were calculated using the edgeR package in R. The significantly differentially expressed genes (DEGs) were selected with the criteria of adjusted p-value <0.05 and |Log2Fold change| >2. Thereafter, ggplot2 and heatmap packages in R were used to draw the volcano and heatmap to visualize these DEGs.
2.2 Construction of the protein-protein interaction (PPI) network
Because proteins rarely work alone, it is necessary to investigate the interactions among proteins. To identify more important protein interactions, we selected DEGs with adjusted p-value <0.05 and |Log2Fold change| >2. In addition, PPI network of the DEGs was performed with a confidence score of >0.7 according to the Search Tool for the Retrieval of Interacting Genes (STRING, version 11.0, http://string-db.org) database (15, 16), a database of known and predicted PPIs according to the sources originating from computational predictions, high-throughput experiments, automated text mining, and co-expression networks (17). The STRING analysis results were entered into Cytoscape software (version 3.8.0) to construct the molecular interaction network diagrams.
2.3 Identification of hub genes
By computing the scores of the two ranked methods separately, including Betweenness and Bottleneck, the top 25 genes for each method were selected. A venn diagram was constructed to show the common hub genes according to these two approaches. Finally, the function of hub genes was analyzed using the clusterProfiler package in R.
2.4 Signaling pathway enrichment analysis
The Gene ontology (GO) analysis is usually applied to annotate genes and their products, while the Kyoto Encyclopedia of Genes and Genomes (KEGG) pathway database is used to identify functional and metabolic pathways. To determine the potential biofunctions of the hub genes, GO and KEGG pathway enrichment analyses were performed. Functional enrichment analysis of DEGs was conducted using the R package “clusterProfiler” (version 4.6.0) (18–20). Furthermore, the Gene Set Enrichment Analysis (GSEA) based on the DEGs using KEGG subset of canonical pathways, reactome pathway gene sets, and immunologic signature gene sets was utilized to identify the potentially immunological pathways associated with the disease (21, 22).
2.5 Characterization of infiltrating immune cells
The R package “ImmuCellAI” was employed to evaluate the proportion of infiltrating immune cells based on default parameters and FPKM format by RNA-seq data was used as input data. ImmuCellAI is an analytical tool that predicts the abundance of twenty-four immune cell types based on gene expression data according to a gene set signature approach, containing eighteen T-cell subtypes and six other immune cells: B cells, dendritic cells (DCs), natural killer (NK) cells, monocytes, macrophages, and neutrophils (23, 24). The Wilcox test was used to assess the difference in immune cell proportions between HD and IgAVN patients and p value less than 0.05 was considered as significantly different. Principal component analysis (PCA) was used to reflect the similarities and differences among different samples based on immune infiltration characteristics. The correlation heatmap was plotted using the R package “corrplot” to demonstrate the correlations between 24 types of infiltrated immune cells. The “pheatmap” package in R was used to create a heatmap of the degree of infiltration of 24 immune cells in all samples. The violin plots revealed that the differential expression of 24 types of immune cells was drawn by the vioplot package in R.
2.6 Subjects for validation
All patient experiments were approved by the Medical Science Research Ethics Committee of the First Affiliated Hospital of China Medical University (2016-210-2). IgAVN subjects that fulfill the European League Against Rheumatism/Pediatric Rheumatology International Trials Organization/Pediatric Rheumatology European Society criteria were included (25). IgAVN patients meeting any of the following criteria were excluded from this study: (1) Suffering from other autoimmune diseases, allergic diseases, chronic inflammatory diseases, acute or chronic infectious diseases, etc (2) hormonal and/or immunosuppressive drugs are being used. The age and sex of the HD group were matched with those of the IgAVN group. Peripheral blood mononuclear cells (PBMC) were extracted with a lymphocyte separator (Cytiva Sweden AB). For PCR experiments, IgAVN patients (n=28) and HD (n=35) were collected. For flow cytometry experiments, IgAVN patients (n=20 for assay of transcription factors/n=30 for determination of surface molecular markers) and HD (n=25 for assay of transcription factors/n=30 for determination of surface molecular markers) were collected. The baseline demographics and clinical characteristics of patients with IgAVN are summarized separately in Supplementary Tables S1, S2 and S8. The study protocol was reviewed and approved by the First Hospital of China Medical University.
2.7 Quantitative Reverse-Transcription PCR (qRT-PCR)
Total RNA was isolated from PBMC using TRIzol reagent (9108, Takara, Japan). Reverse transcription (RR047A, Takara) and amplification (RR820A, Takara) were performed on the Applied Biosystems™ Fluorescence Quantitative PCR instrument according to the instructions. All primer sequences are listed in Supplementary Table S3. The 2−ΔΔCt method was used to determine relative expression. qRT-PCR was performed using 28/35 biological replicates. GAPDH mRNA was used as the normalization standard.
2.8 Flow cytometry
PBMCs were stained at 4°C for 30 minutes for surface staining. Before intracellular staining, PBMCs were fixed at 4°C for 50 minutes with fixation and permeabilization buffer (eBioscience, Thermo Fisher Scientific). The antibodies and isotype controls used in this study are presented in Supplementary Table S4. The samples were examined with a FACSAria type flow cytometer (BD, United States). Data were analyzed using FlowJo 10.0 software.
2.9 Statistical analysis
All analyses were performed using the R language (version 3.6.1) and relevant packages. All data are shown as mean ± standard deviation (SD). Statistical analyses were performed using GraphPad Prism (version 8.0). A two-tailed Student’s t-test was used to evaluate the statistical significance. Statistical significance was set at p < 0.05.
3 Results
3.1 Identification of differential expressed mRNA between IgAVN patients and HD
The results after we processed the data are as follows. PCA was used to verify the biological differences among different samples (Figure 1A). The samples of IgAVN and HD were grouped separately, indicating a globally different expression profile. The hierarchical clustering of the samples divided the ten samples into two main clusters (Figure S1A). The density of gene expression for individual samples before (Figure S1B) and after (Figure S1C) filtering for low expression genes. Our results showed the expression distribution of unnormalized (Figure 1B) and normalized data (Figure 1C), in which the distribution of different samples is significantly different before normalization, but similar after normalization. The voom plot represents that experiments with large biological differences usually tend to be flat, and their variance values are stable at high expression. Before filtering for low expression genes and normalization, there will be a decreasing trend between mean and variance in the voom plot (Figure S1D). The voom chart shows a stable trend after data processing (Figure S1E). As can be seen from the figure, the variance is no longer correlated with the mean expression level. Diagrams such as PCA analysis, hierarchical clustering, and boxplots, were used to exhibit the process of data preprocessing.
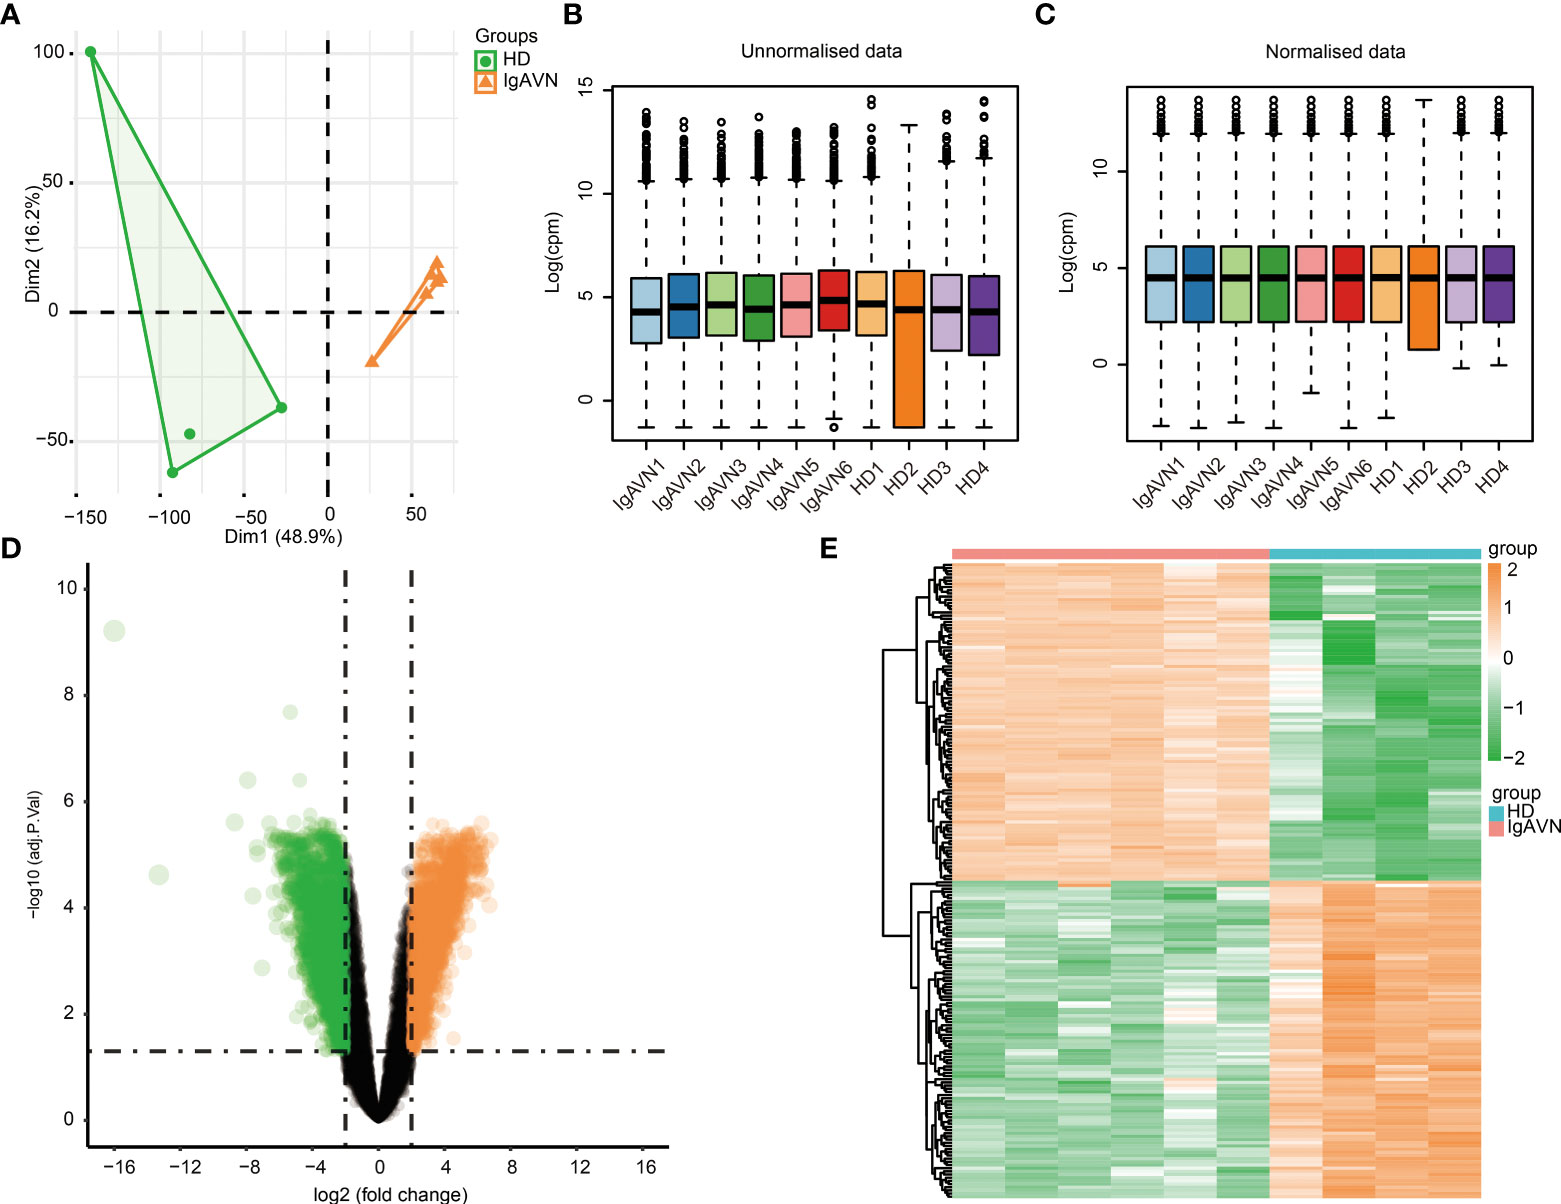
Figure 1 Identification of differentially expressed genes between four healthy donors (HD) and six Immunoglobulin A associated vasculitis nephritis (IgAVN) patients. (A) Principal component analysis (PCA) was used to cluster all the samples in the GSE102114 dataset. (B) The boxplot of gene expression before the normalization of GSE102114 dataset. (C) The boxplot of gene expression after the normalization of GSE102114 dataset. (D) Volcano plot used to demonstrate the differentially expressed genes. The orange points represent genes with upregulated expression screened based on log2fold change >2 and adjusted p <0.05. The green points represent the downregulation of the expression of genes screened based on log2fold change <-2 and adjusted p value <0.05. The black points represent genes with no significant difference. (E) Hierarchical clustering heatmap of DEGs. Orange represents higher expression and green represents lower expression.
A total of 4,200 DEGs were screened (|Log2fold change| > 2, adjusted p < 0.05) based on the analysis in IgAVN samples compared to HD samples, which contained 2,102 genes with upregulated and 2,098 with downregulated expression. In addition, a volcano plot of all DEGs was created using the ggplot2 package in R (Figure 1D). Subsequently, the expression levels of DEGs were hierarchically clustered, and the results were visualized in the form of heatmaps (Figure 1E). The top 20 upregulated and top 20 downregulated mRNA expressions in the IgAVN group are exhibited in Supplementary Table S5. These data suggest that the expression levels of mRNAs were distinguishable and variable between the two groups, implying underlying pathological changes in the IgAVN samples.
3.2 Identification of 20 overlapping hub genes and enriched pathways analysis
A PPI network was generated based on the STRING database to study further the underlying relationships between the proteins encoded by DEGs. After removing isolated and partially connected nodes, a complicated network of DEGs was created. Network analysis of the DEGs revealed 1,238 nodes and 15,046 edges in the PPI network (Figure S2A). The nodes correspond to genes, and the edges represent the links between genes. Orange represents genes with upregulated expression, and green represents genes with downregulated expression.
The top 25 genes were screened out by the two classification approaches in cytoHubba (Figures 2A, B). Finally, the venn diagram identified 20 overlapping hub genes according to these two approaches (Figure 2C and Supplementary Table S6), such as ATP5B, STAT1, HSPA8, UBB, PTEN, UBA52, ITGB1, TLR4, HIST2H2AC, and CDC42. The enriched GO terms and KEGG pathways analyzed via the R package are displayed in Figures 2D, E. Hub genes participating in GO terms included activation of mitogen-activated protein kinase (MAPK) activity, regulation of MAPK activity, positive regulation of MAPK activity, and regulation of protein stability. The most significant KEGG pathways of hub genes were the Toll-like receptor (TLR) signaling pathway, nucleotide oligomerization domain (NOD)-like receptor signaling pathway, T helper (Th) 17 cell differentiation. Finally, the GSEA analysis were utilized to further identify immunological signaling pathways based on the reference genesets including KEGG subset of canonical pathways (Figure 2F), reactome pathway (Figure 2G), and immunologic signature (Figure 2H). We identified that Th1, Th2, Th17, Tfh, JAK/STAT signaling pathway, TLR signaling pathway were significantly enriched, contributing to elucidate the potential mechanisms behind the occurrence of IgAVN.
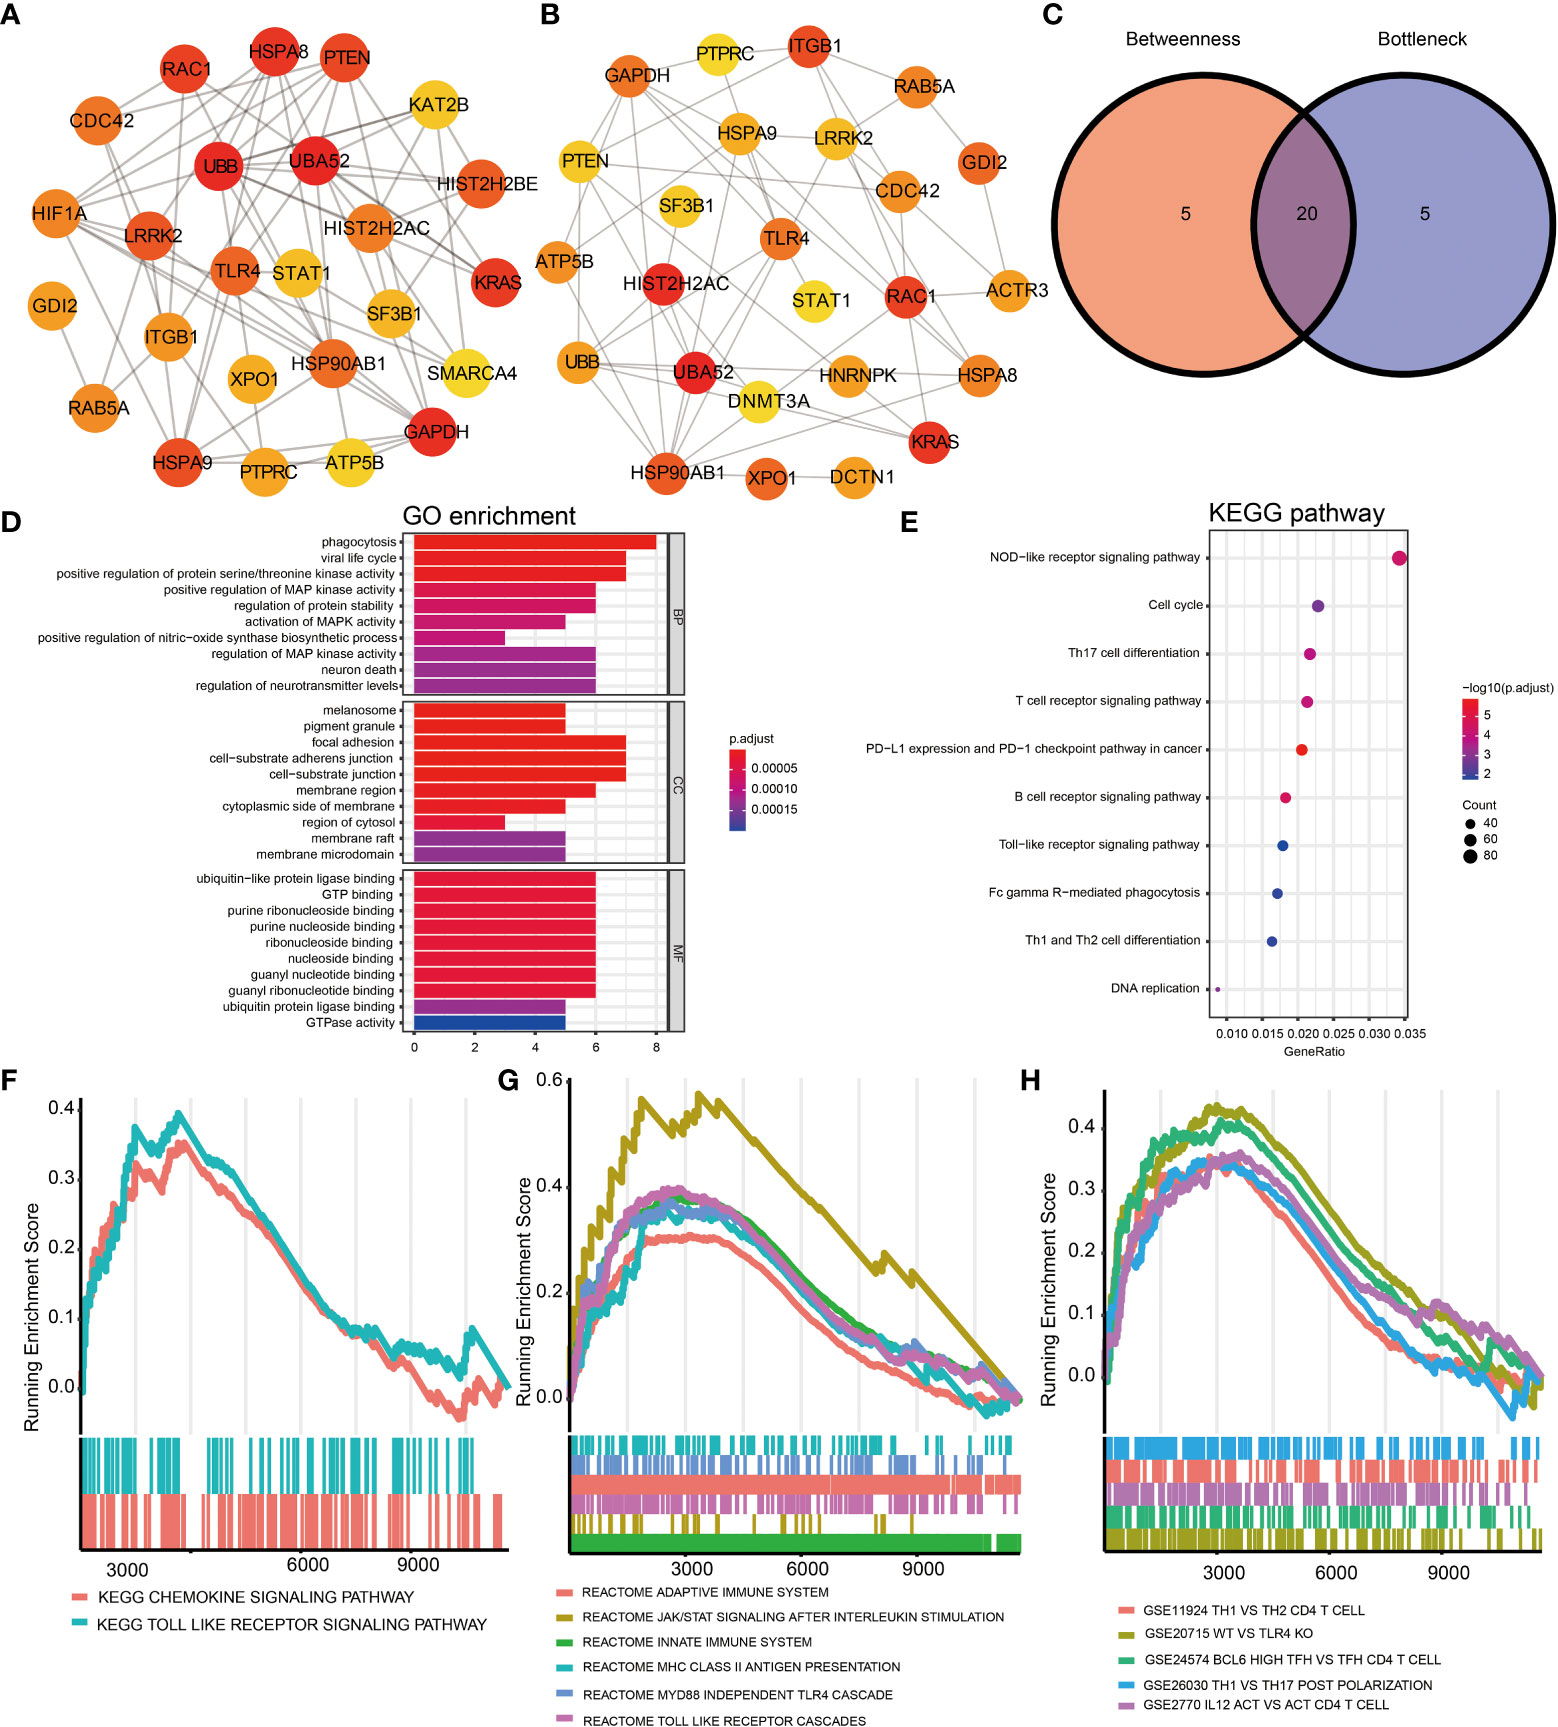
Figure 2 Identification of hub genes of DEGs based on the PPI network and signaling pathways enrichment using GO, KEGG, and GSEA analysis. (A) The top 25 hub genes obtained by Betweenness from the PPI network. (B) The top 25 hub genes obtained by Bottleneck. (C) 20 hub genes determined by intersection of the two methods. GO (D) and KEGG (E) analysis of 20 hub genes. Identification of immune-related signaling pathways using GSEA analysis based on the reference genesets including KEGG subset of canonical pathways (F), reactome pathway gene sets (G), and immunologic signature gene sets (H). DEGs, differentially expressed genes; GO, Gene Ontology; KEGG, Kyoto Encyclopedia of Genes and Genomes; BP, biological process; CC, cellular component; MF, molecular function; GSEA, gene set enrichment analysis; Protein-protein interaction, PPI.
3.3 Validation of the expression of top 10 of hub genes
To check the accuracy and credibility of the data and to lay the foundation for further research, top 10 of hub genes were selected for qRT-PCR analysis. Peripheral blood samples from IgAVN patients (n=28) and HD (n=35) were collected for validation. We found that eight out of 10 hub genes including STAT1, TLR4, PTEN, UBB, HSPA8, ATP5B, UBA52, and CDC42 were upregulated, which is consistent with previous sequencing analyses (Figures 3A–J). Therefore, the data of bioinformatic analysis were almost consistent with the expression levels verified by qRT-PCR.
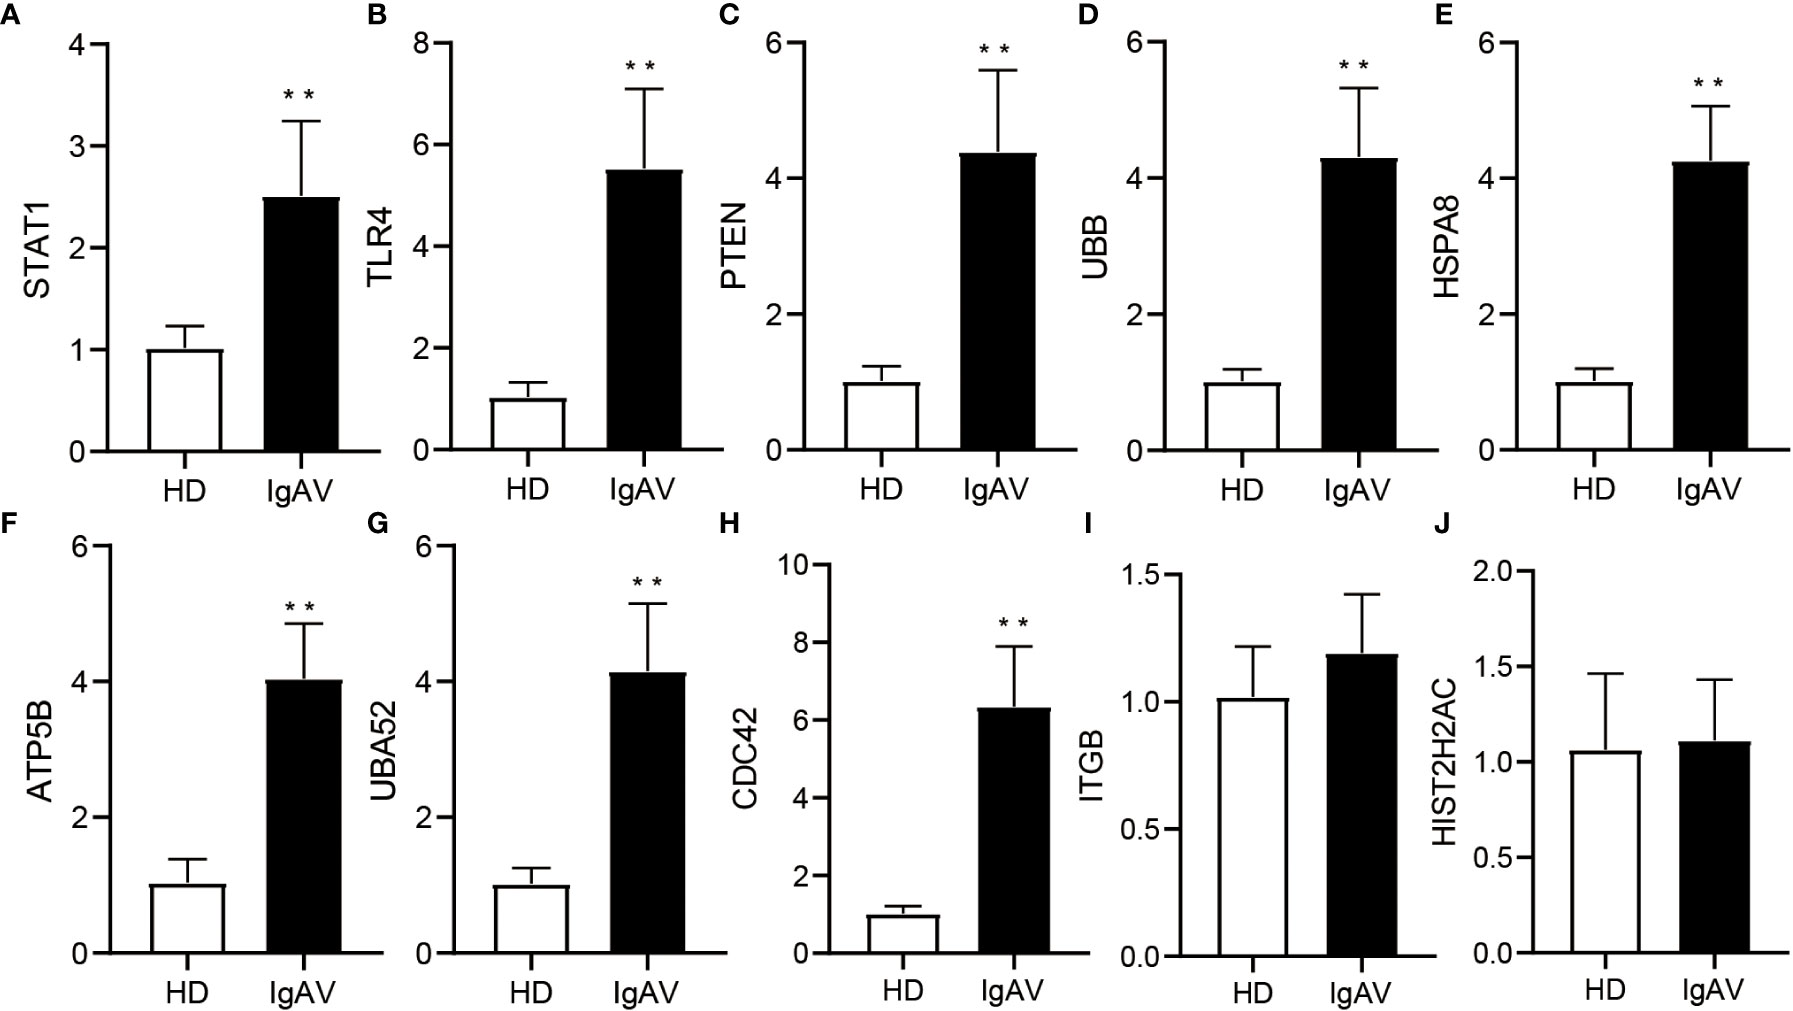
Figure 3 Validation of DE hub genes expression using qRT-PCR in IgAVN patients and HD from the pediatric ward. (A-J) Changes in mRNA expression were confirmed for select top 10 of hub genes in the IgAVN and HD groups by qRT-PCR. Data are given as the mean ± SD (n = 28/35); **P<0.01.
3.4 Higher immune cell infiltration in IgAVN compared with HD
Next, we intended to gain some insight into the immune cell infiltration nature of IgAVN peripheral blood samples using ImmuCellAI analysis. A total of 24 subpopulations of immune cells and its corresponding percentage of each samples are shown in Figure 4A. We discovered that T cells, especially Th2, mucosal-associated invariant T (MAIT) cells, Th1, Tfh, Th17 and exhausted T cell, dominated the peripheral blood. Because of the remarkable change in immune cells in IgAVN, we deduced that changes in the fractions of immune cells might be applied to show individual differences. The abundance of immune cells in the 10 samples revealed striking group-bias clustering in the PCA map (Figure 4B), indicating vast internal heterogeneity in the immune spectrum is exist between IgAVN and HD samples. Additionally, we investigated the internal correlations between different immune cell types which might assist in exploring immune cell-cell interactions in the future (Figure 4C). According to the hierarchical clustering of 24 immune cell subgroups (Figure 4D), we discovered some modules where specific styles of immune cells had a similar expression, which showed a cooperative effect in IgAVN. Compared with HD, IgAVN samples had higher infiltration scores, indicating a greater abundance of immune cells and altered fractions of immune cell subgroups (Figure 4E and Supplementary Table S7). Comparing the immune cell fractions of peripheral blood samples, 13 of the 24 immune cells were significantly different. Higher proportions of Th2, monocytes, mucosal associated invariant T (MAIT), macrophages, induced T regulatory (iTreg), T follicular helper (Tfh), and T regulatory 1 (Tr1) were identified in IgAVN. In comparison, lower proportions of naive CD4+T cells and effector memory were identified in IgAVN. In addtion, we performed correlation analysis between 10 hub genes and subtypes of CD4+T cell (Figure S3). We found a common correlation between T helped cell subsets and hub genes.
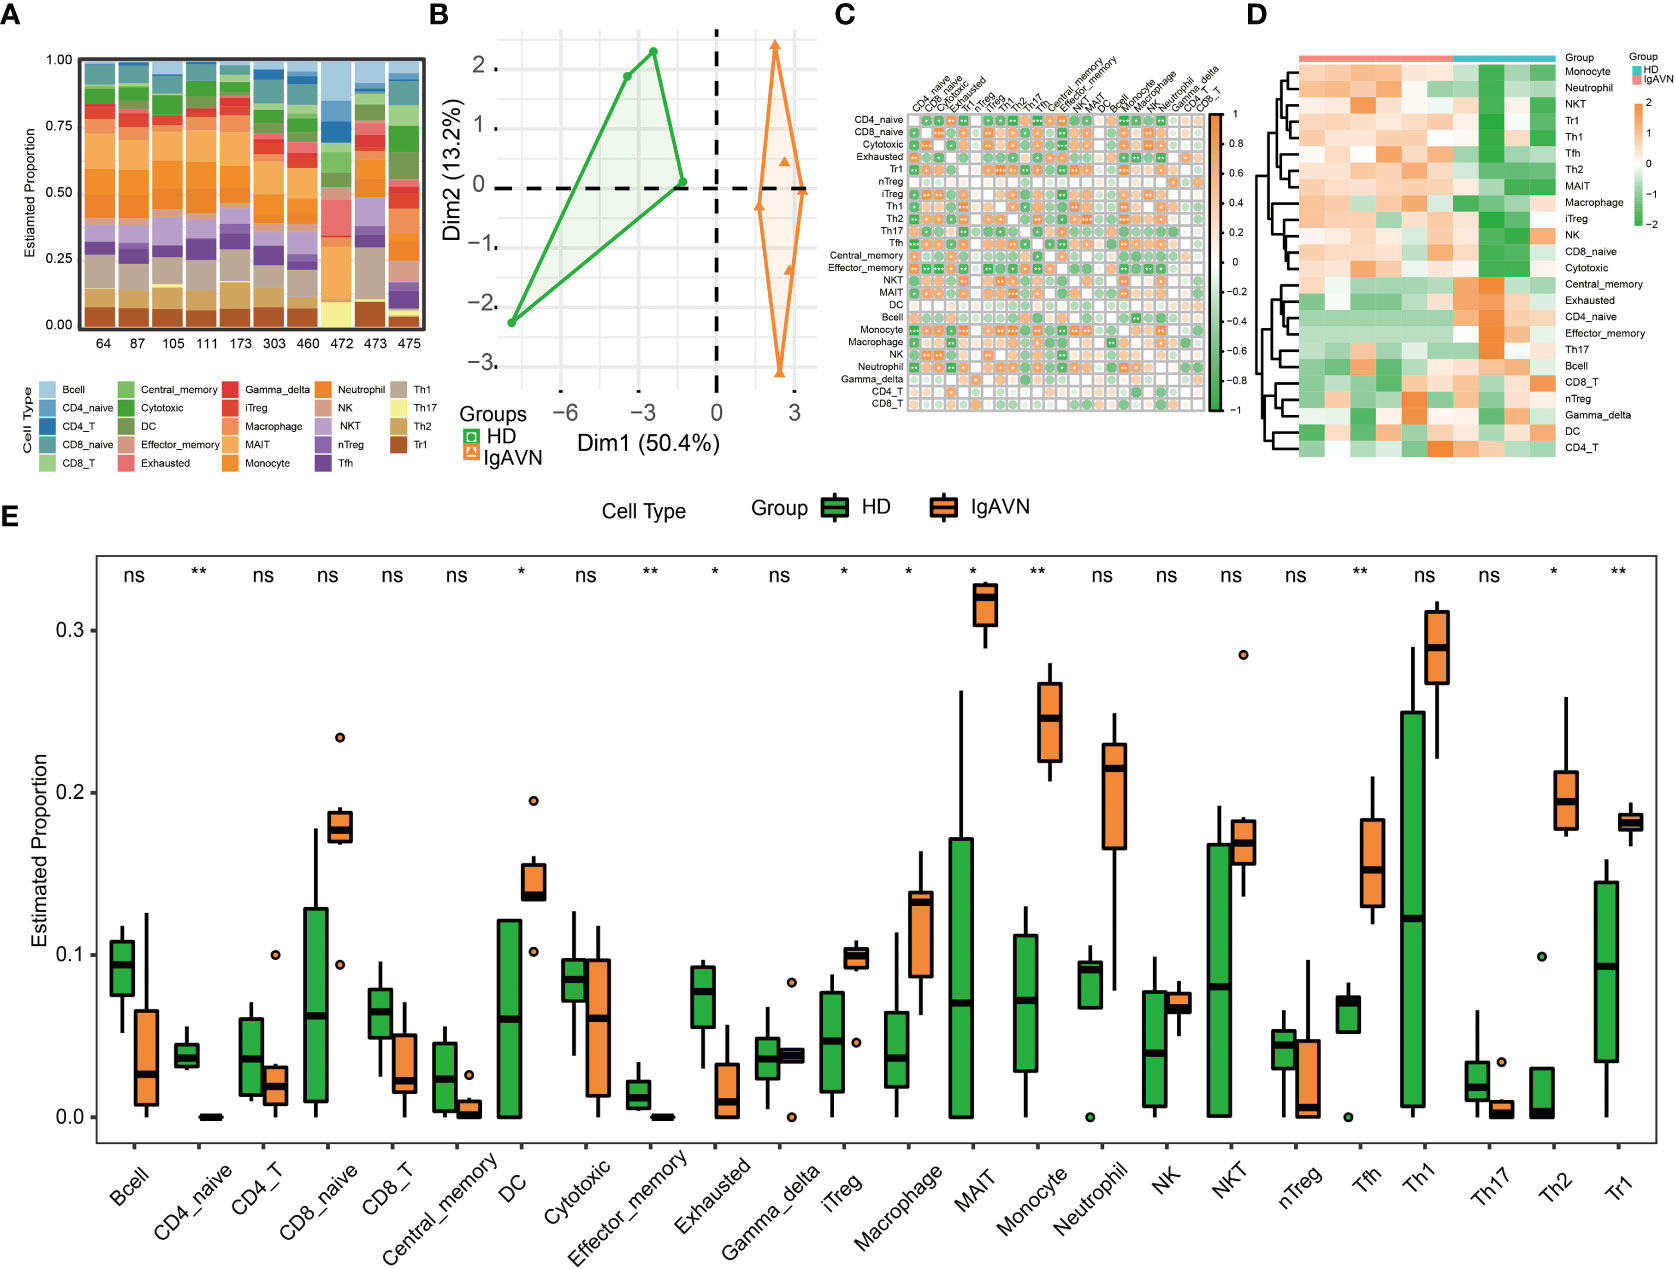
Figure 4 Profiles of Immune Cell Infiltration in Immunoglobulin A associated vasculitis nephritis (IgAVN) and healthy donors (HD) Based on Gene Expression Data. (A) Bar plot of infiltration level of 24 kinds of immune cell in HD and IgAVN samples. (B) Principal component analysis (PCA) analysis of HD and IgAVN groups based on the immune infiltration level of 24 kinds of immune cells. (C) The correlation matrix of immune cell proportions between HD and IgAVN patients. (D) Heatmap of the 24 kinds of immune cell proportions in the two groups. (E) Comparisons of the proportions of 24 immune cell types between the HD and IgAVN group. The HD group is marked in green, and the IgAVN group is marked in orange. Tc, cytotoxic T cell; Tex, exhausted T cell; Tcm, central memory T cell; Tem, effector memory T cell; Tgd, gamma delta T cell. ns, not significant *P <0.05; **P <0.01.
3.5 Validation of phenotype frequency of CD4+T cell subsets
Since both hub genes enrichment analysis and ImmuCellAI analysis displayed that there was significant difference in the development of Th cells between IgAVN and HD, a validation of phenotype frequency of CD4+T cell subsets was performed using flow cytometry. T box factor (T-bet), GATA binding protein 3 (GATA3), retineic-acid-receptor-related orphan nuclear receptor gamma (RORγt), B-cell lymphoma 6 (Bcl-6) and forkhead box protein 3 (Foxp3) are respectively the major transcription factor of Th1, Th2, Th17, Tfh, and T regulatory (Treg) cells. Meanwhile, chemokine C-X-C-Motif Receptor 3 (CXCR3), CC chemokine receptor 6 (CCR6), chemokine C-X-C-Motif Receptor 5 (CXCR5), CD25 is a molecular marker of Th1, Th17, Tfh and Treg cell surface, respectively (26). We found that frequencies of CD4+RORγt+Th17/CD4+CCR6+Th17, CD4+GATA3+Th2, and CD4+Bcl-6+Tfh/CD4+CXCR5+Tfh cells were significantly increased in IgAVN patients compared with HD (Figures 5A–D).
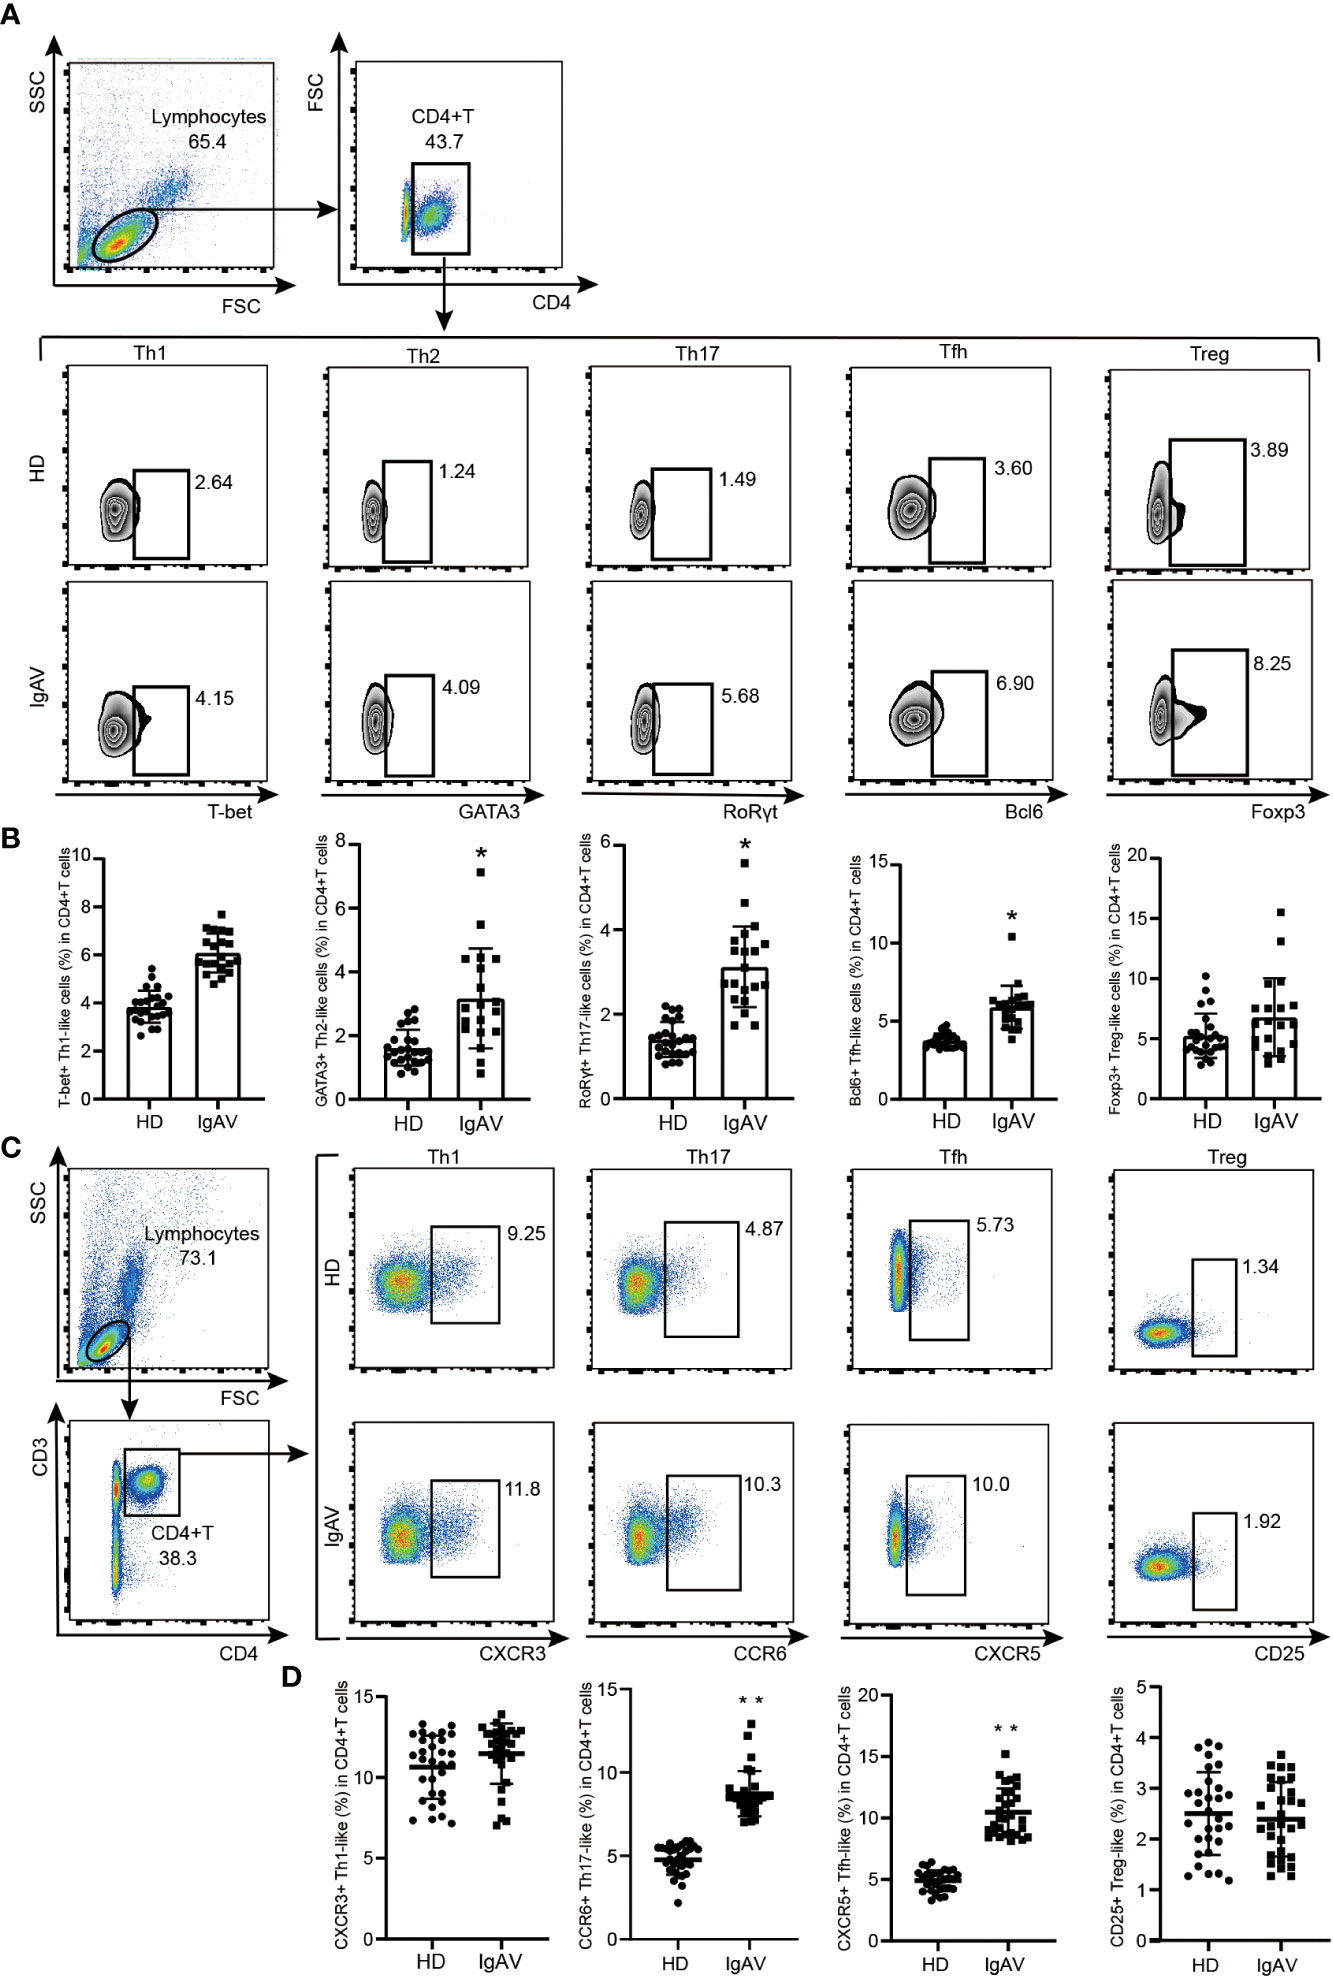
Figure 5 Validation of phenotype of CD4+T cell subsets in the IgAVN patients and HD from the pediatric ward. (A, B) Changes in the proportions of Th1, Th2, Th17, Tfh and Treg in the IgAVN and HD groups by flow cytometry. Data are given as the mean ± SD (n = 20/25) (C, D) Changes in the proportions of Th1, Th17, Tfh and Treg in the IgAVN and HD groups by flow cytometry. Data are given as the mean ± SD (n = 30); *P <0.05; **P <0.01.
4 Discussion
Although the pathogenesis of IgAVN remain unclear, it may involve the disruption of both cellular and humoral immunity, and the release of various cytokines and inflammatory mediators (27, 28). In our GO and KEGG enrichment analysis, hub genes were enriched in both the innate immune pathways (TLR signaling, NOD-like receptor signaling, and MAPK signaling) and the adaptive immune pathways (Th17 cell differentiation). In ImmuCellAI analysis, compared with HD, IgAVN samples had higher infiltration scores, implicating the altered abundance of innate immune cells (Macrophage, Monocyte, and Neutrophil) and adaptive immune cells (DC, B cell and multiple T cell subgroups).
It was shown by epidemiological statistics that infections are a major precipitating factor for IgAV. Almost 80% of children who have IgAV had an infection at the time of diagnosis (29). During prophase infection, pathogens activate innate immune response that leads to the production of immune-effector molecules. Our analysis showed that the most significant KEGG pathways of hub genes were TLR signaling pathway. TLRs are a group of important pattern recognition receptors participated in the innate immune system that can identify pathogen-associated molecular patterns to activate cell signaling mechanisms (30–33). Studies showed that TLR2 activation was correlated with the increased immunoproteasome switch in IgAV (34–36). TLR4 overproduction in IgAV patients provokes renal impairment (35, 36). In our study, TLR4 was one of overlapping hub genes. Validation of experiments also indicated that the transcription of TLR4 from IgAVN patients was significantly higher than HD. Therefore, we suggest that immune dysregulation mediated by TLR4 signaling is involved in the pathogenesis of IgAVN.
Besides innate immune, T-B cell-mediated adaptive immunity may play a crucial role in the pathogenesis of IgAV (37). Activation of TLR4 can promote the production of type I interferons (IFN-I), which is considered as the first step in the development of adaptive immunity from innate immunity (38). In the canonical pathway of IFN-I signalling mainly activated signal transducer and activator of transcription 1 (STAT1) (39). Interestingly, STAT1 was also contained in our overlapping hub genes and verified high expressed in IgAVN patients. Our previous research suggested that activated STAT1 directly induced the expression of BCL6, thus being considered as a key transcript factor for the differentiation of Tfh cells (40). Consistent with our inference, imbalance of T helper cell subgroups including Tfh cells was indeed observed in IgAVN. In ImmuCellAI analysis, the fractions of immune cell subgroups in Th2 and Tfh cells was increased in IgAVN. Validation of phenotypes of CD4+T cell using flow cytometry also indicated that proportions of CD4+GATA3+Th2 and CD4+Bcl-6+Tfh/CD4+CXCR5+Tfh cells were higher in IgAVN patients than HD. Increasing of Tfh cells may promote the synthesis of IgA and is closely related to the progression of IgAV (41). Th2 cell hyperactivity can increase immunoglobulin synthesis and release in patients with IgAV (42–45). It is noteworthy that since Tfh cell developed through Th17-source leads to isotype switching of B cell to induce IgA production (26), the raise of Th17 cell frequency in peripheral blood and serum IL-17 level may promote the occurrence of vascular inflammation to a certain extent in patients with IgAV (46). In our study, the pathway of Th17 cell differentiation was enriched in KEGG analysis. Although an increasing of Th17 cells in IgAV patients was not indicated in ImmuCellAI analysis, the expansion of CD4+RORγt+Th17/ CD4+CCR6+Th17 cells in patients with IgAV were observed in flow cytometry investigation. Taken together, our study suggests that the over-differentiation of T helper cells, including Tfh cells, Th2 cells and Th17 cells, may be involved in the occurrence and development of IgAVN.
In addition, Treg cells can regulate the immune system, maintain tolerance to autoantigens, and prevent autoimmune diseases (47). Previous studies proved that the insufficient immunosuppression caused by the reduction of Treg cells is one of the causes of IgAV (34). However, no significant difference in the number of Treg cells in peripheral blood between IgAVN patients and HD was found in our flow cytometry investigation. In ImmuCellAI analysis, it is iTreg, but not nature Treg (nTreg), significantly increased in patients with IgAV, which indicates that environmental factors can mediate the occurrence of IgAV by inducing immune cell differentiation disorder. However, because the source of data set and the number of samples are very limited, we cannot conduct comprehensive analysis on multiple data sets. The mechanisms of T helper cells and Treg cells participating in the pathogenesis of IgAV still need further study.
In summary, a series of bioinformatics analysis methods were used to identify 4200 DEGs and 20 hub genes that may participate in IgAV progression. Additionally, we determined the immune cell composition of patients with IgAVN and identified maladjusted immune cells. However, further studies are needed to elucidate the in-depth molecular mechanisms and biological functions of these genes in IgAVN. These data may offer helpful information and direction into potential biomarkers and biological mechanisms of IgAVN.
Data availability statement
The original contributions presented in the study are included in the article/Supplementary Material, Further inquiries can be directed to the corresponding author.
Ethics statement
The studies involving human participants were reviewed and approved by all patient experiments were approved by the Medical Science Research Ethics Committee of the First Affiliated Hospital of China Medical University (2016-210-2). Written informed consent to participate in this study was provided by the participants’ legal guardian/next of kin.
Author contributions
The study was designed by XM, XJ and HZ. XJ and HZ conducted research. QJ, JG, SY, XC, RW, HJ and YS helped analyze the data. The manuscript wrote and revised by XJ and HZ. All authors contributed to the article and approved the submitted version.
Funding
This work was supported by the National Natural Science Foundation of China (grant 81901658); Liaoning Province Natural Science Foundation (2022-BS-134); Infection, Immunity, Inflammation & Vaccinology (I3V) Dalhousie Medical Research Foundation (DMRF) Dr. David H. Hubel Program.
Acknowledgments
The author is very grateful to the teachers and classmates who helped her during the experiment
Conflict of interest
The authors declare that the research was conducted in the absence of any commercial or financial relationships that could be construed as a potential conflict of interest.
Publisher’s note
All claims expressed in this article are solely those of the authors and do not necessarily represent those of their affiliated organizations, or those of the publisher, the editors and the reviewers. Any product that may be evaluated in this article, or claim that may be made by its manufacturer, is not guaranteed or endorsed by the publisher.
Supplementary material
The Supplementary Material for this article can be found online at: https://www.frontiersin.org/articles/10.3389/fimmu.2023.1087293/full#supplementary-material
Supplementary Figure 1 | Removing low expressed genes and normalization of gene expression for the GSE102114 dataset. (A) The hierarchical clustering of the samples from GSE102114 dataset. (B) The density plot of logCounts per Million (CPM) values for raw pre-filtered gene expression data. (C) The density plot of logCPM values after filtering low expressed genes. (D) The relationship between means and variances of each gene before voom. (E) The relationship between means and variances of each gene after voom.
Supplementary Figure 2 | Construction of the protein-protein interaction (PPI) network (A) The PPI network of DEGs, according to the STRING online database, was constructed by Cytoscape.
Supplementary Figure 3 | Correlation analysis between 10 hub genes and subtypes of CD4+ T cell. The orange color represent positive correlation. The green color represent negative correlation. The size of the circle represent the degree of correlation ranging from 1 to -1. *P <0.05, **P <0.01, ***P <0.001.
References
1. Gedalia A. Henoch-schonlein purpura. Curr Rheumatol Rep (2004) 6(3):195–202. doi: 10.1007/s11926-004-0068-2
2. Kraft DM, McKee D, Scott C. Henoch-schonlein purpura: A review. Am Fam Physician (1998) 58(2):405–8.
3. Yang YH, Huang YH, Lin YL, Wang LC, Chuang YH, Yu HH, et al. Circulating IgA from acute stage of childhood henoch-schonlein purpura can enhance endothelial interleukin (IL)-8 production through MEK/ERK signalling pathway. Clin Exp Immunol (2006) 144(2):247–53. doi: 10.1111/j.1365-2249.2006.03076.x
4. Xie B, Zhang W, Zhang Q, Zhang Q, Wang Y, Sun L, et al. An integrated transcriptomic and proteomic analysis identifies significant novel pathways for henoch-schonlein purpura nephritis progression. BioMed Res Int (2020) 2020:2489175. doi: 10.1155/2020/2489175
5. Gao R, Niu X, Zhu L, Qi R, He L. iTRAQ quantitative proteomic analysis differentially expressed proteins and signal pathways in henoch-schonlein purpura nephritis. Am J Transl Res (2020) 12(12):7908–22.
6. Fang X, Wu H, Lu M, Cao Y, Wang R, Wang M, et al. Urinary proteomics of henoch-schonlein purpura nephritis in children using liquid chromatography-tandem mass spectrometry. Clin Proteomics (2020) 17:10. doi: 10.1186/s12014-020-09274-x
7. Pillebout E, Sunderkotter C. IgA vasculitis. Semin Immunopathol (2021) 43(5):729–38. doi: 10.1007/s00281-021-00874-9
8. Pang S, Lv J, Wang S, Yang G, Ding X, Zhang J. Differential expression of long non-coding RNA and mRNA in children with henoch-schonlein purpura nephritis. Exp Ther Med (2019) 17(1):621–32. doi: 10.3892/etm.2018.7038
9. Edgar R, Domrachev M, Lash AE. Gene expression omnibus: NCBI gene expression and hybridization array data repository. Nucleic Acids Res (2002) 30(1):207–10. doi: 10.1093/nar/30.1.207
10. Barrett T, Wilhite SE, Ledoux P, Evangelista C, Kim IF, Tomashevsky M, et al. NCBI GEO: Archive for functional genomics data sets–update. Nucleic Acids Res (2013) 41(Database issue):D991–5. doi: 10.1093/nar/gks1193
11. Robinson MD, McCarthy DJ, Smyth GK. edgeR: A bioconductor package for differential expression analysis of digital gene expression data. Bioinformatics (2010) 26(1):139–40. doi: 10.1093/bioinformatics/btp616
12. McCarthy DJ, Chen Y, Smyth GK. Differential expression analysis of multifactor RNA-seq experiments with respect to biological variation. Nucleic Acids Res (2012) 40(10):4288–97. doi: 10.1093/nar/gks042
13. Chen Y, Lun AT, Smyth GK. From reads to genes to pathways: differential expression analysis of RNA-seq experiments using rsubread and the edgeR quasi-likelihood pipeline. F1000Res (2016) 5:1438. doi: 10.12688/f1000research.8987.2
14. Ritchie ME, Phipson B, Wu D, Hu Y, Law CW, Shi W, et al. Limma powers differential expression analyses for RNA-sequencing and microarray studies. Nucleic Acids Res (2015) 43(7):e47. doi: 10.1093/nar/gkv007
15. Szklarczyk D, Gable AL, Lyon D, Junge A, Wyder S, Huerta-Cepas J, et al. STRING v11: Protein-protein association networks with increased coverage, supporting functional discovery in genome-wide experimental datasets. Nucleic Acids Res (2019) 47(D1):D607–D13. doi: 10.1093/nar/gky1131
16. Szklarczyk D, Morris JH, Cook H, Kuhn M, Wyder S, Simonovic M, et al. The STRING database in 2017: Quality-controlled protein-protein association networks, made broadly accessible. Nucleic Acids Res (2017) 45(D1):D362–D8. doi: 10.1093/nar/gkw937
17. Snel B, Lehmann G, Bork P, Huynen MA. STRING: A web-server to retrieve and display the repeatedly occurring neighbourhood of a gene. Nucleic Acids Res (2000) 28(18):3442–4. doi: 10.1093/nar/28.18.3442
18. Ashburner M, Ball CA, Blake JA, Botstein D, Butler H, Cherry JM, et al. Gene ontology: Tool for the unification of biology. the gene ontology consortium. Nat Genet (2000) 25(1):25–9. doi: 10.1038/75556
19. Wu T, Hu E, Xu S, Chen M, Guo P, Dai Z, et al. clusterProfiler 4.0: A universal enrichment tool for interpreting omics data. Innovation (Camb) (2021) 2(3):100141. doi: 10.1016/j.xinn.2021.100141
20. Yu G, Wang LG, Han Y, He QY. clusterProfiler: An r package for comparing biological themes among gene clusters. OMICS (2012) 16(5):284–7. doi: 10.1089/omi.2011.0118
21. Mootha VK, Lindgren CM, Eriksson KF, Subramanian A, Sihag S, Lehar J, et al. PGC-1alpha-responsive genes involved in oxidative phosphorylation are coordinately downregulated in human diabetes. Nat Genet (2003) 34(3):267–73. doi: 10.1038/ng1180
22. Subramanian A, Tamayo P, Mootha VK, Mukherjee S, Ebert BL, Gillette MA, et al. Gene set enrichment analysis: A knowledge-based approach for interpreting genome-wide expression profiles. Proc Natl Acad Sci U.S.A. (2005) 102(43):15545–50. doi: 10.1073/pnas.0506580102
23. Miao YR, Zhang Q, Lei Q, Luo M, Xie GY, Wang H, et al. ImmuCellAI: A unique method for comprehensive T-cell subsets abundance prediction and its application in cancer immunotherapy. Adv Sci (Weinh) (2020) 7(7):1902880. doi: 10.1002/advs.201902880
24. Miao YR, Xia M, Luo M, Luo T, Yang M, Guo AY. ImmuCellAI-mouse: a tool for comprehensive prediction of mouse immune cell abundance and immune microenvironment depiction. Bioinformatics (2021) 38(3):785–91. doi: 10.1093/bioinformatics/btab711
25. Ozen S, Pistorio A, Iusan SM, Bakkaloglu A, Herlin T, Brik R, et al. EULAR/PRINTO/PRES criteria for henoch-schonlein purpura, childhood polyarteritis nodosa, childhood wegener granulomatosis and childhood takayasu arteritis: Ankara 2008. part II: Final classification criteria. Ann Rheum Dis (2010) 69(5):798–806. doi: 10.1136/ard.2009.116657
26. Ma X, Nakayamada S. Multi-source pathways of T follicular helper cell differentiation. Front Immunol (2021) 12:621105. doi: 10.3389/fimmu.2021.621105
27. Lau KK, Suzuki H, Novak J, Wyatt RJ. Pathogenesis of henoch-schonlein purpura nephritis. Pediatr Nephrol (2010) 25(1):19–26. doi: 10.1007/s00467-009-1230-x
28. Lu D, Gao Y. Immune checkpoint inhibitor-related endocrinopathies. J Transl Int Med (2022) 10(1):9–14. doi: 10.2478/jtim-2022-0009
29. Jauhola O, Ronkainen J, Koskimies O, Ala-Houhala M, Arikoski P, Holtta T, et al. Clinical course of extrarenal symptoms in henoch-schonlein purpura: A 6-month prospective study. Arch Dis Child (2010) 95(11):871–6. doi: 10.1136/adc.2009.167874
30. Brown J, Wang H, Hajishengallis GN, Martin M. TLR-signaling networks: an integration of adaptor molecules, kinases, and cross-talk. J Dent Res (2011) 90(4):417–27. doi: 10.1177/0022034510381264
31. Jin B, Sun T, Yu XH, Yang YX, Yeo AE. The effects of TLR activation on T-cell development and differentiation. Clin Dev Immunol (2012) 2012:836485. doi: 10.1155/2012/836485
32. Qian C, Cao X. Regulation of toll-like receptor signaling pathways in innate immune responses. Ann N Y Acad Sci (2013) 1283:67–74. doi: 10.1111/j.1749-6632.2012.06786.x
33. Negishi H, Yanai H, Nakajima A, Koshiba R, Atarashi K, Matsuda A, et al. Cross-interference of RLR and TLR signaling pathways modulates antibacterial T cell responses. Nat Immunol (2012) 13(7):659–66. doi: 10.1038/ni.2307
34. Donadio ME, Loiacono E, Peruzzi L, Amore A, Camilla R, Chiale F, et al. Toll-like receptors, immunoproteasome and regulatory T cells in children with henoch-schonlein purpura and primary IgA nephropathy. Pediatr Nephrol (2014) 29(9):1545–51. doi: 10.1007/s00467-014-2807-6
35. Chang H, Yu DS, Liu XQ, Zhang QY, Cheng N, Zhang SQ, et al. Clinical significance of TLR3 and TLR4 in peripheral blood mononuclear cells from children with henoch-schonlein purpura nephritis. Exp Ther Med (2014) 7(6):1703–7. doi: 10.3892/etm.2014.1638
36. Chang H, Zhang QY, Lin Y, Cheng N, Zhang SQ. Correlation of TLR2 and TLR4 expressions in peripheral blood mononuclear cells to Th1- and Th2-type immune responses in children with henoch-schonlein purpura. Int J Clin Exp Med (2015) 8(8):13532–9.
37. Togashi R, Tamura Y, Arai S, Asakawa S, Yamazaki O, Uchida S, et al. Tubulointerstitial b-cell infiltration and tertiary lymphoid tissue in adult-onset immunoglobulin a vasculitis with nephritis. Int Urol Nephrol (2022) 55(3):749–58. doi: 10.1007/s11255-022-03373-4
38. Lin L, Hou J, Ma F, Wang P, Liu X, Li N, et al. Type I IFN inhibits innate IL-10 production in macrophages through histone deacetylase 11 by downregulating microRNA-145. J Immunol (2013) 191(7):3896–904. doi: 10.4049/jimmunol.1203450
39. Michalska A, Blaszczyk K, Wesoly J, Bluyssen HAR. A positive feedback amplifier circuit that regulates interferon (IFN)-stimulated gene expression and controls type I and type II IFN responses. Front Immunol (2018) 9:1135. doi: 10.3389/fimmu.2018.01135
40. Ma X, Nakayamada S, Kubo S, Sakata K, Yamagata K, Miyazaki Y, et al. Expansion of T follicular helper-T helper 1 like cells through epigenetic regulation by signal transducer and activator of transcription factors. Ann Rheum Dis (2018) 77(9):1354–61. doi: 10.1136/annrheumdis-2017-212652
41. Zhang Z, Zhao S, Zhang L, Crew R, Zhang N, Sun X, et al. A higher frequency of CD4(+)CXCR5(+) T follicular helper cells in patients with newly diagnosed henoch-schonlein purpura nephritis. Int Immunopharmacol (2016) 32:8–15. doi: 10.1016/j.intimp.2015.12.037
42. Pan YX, Ye Q, Shao WX, Shang SQ, Mao JH, Zhang T, et al. Relationship between immune parameters and organ involvement in children with henoch-schonlein purpura. PloS One (2014) 9(12):e115261. doi: 10.1371/journal.pone.0115261
43. Sakatsume M, Xie Y, Ueno M, Obayashi H, Goto S, Narita I, et al. Human glomerulonephritis accompanied by active cellular infiltrates shows effector T cells in urine. J Am Soc Nephrol (2001) 12(12):2636–44. doi: 10.1681/ASN.V12122636
44. Huang DL, Xu ZC, Dang XQ, Zeng XQ, He XJ, Yi ZW, et al. [Relationship between renal Th1/Th2 ratio and renal microvascular injury in children with henoch-sch-nlein purpura nephritis]. Zhongguo Dang Dai Er Ke Za Zhi (2011) 13(4):273–7.
45. Li YY, Li CR, Wang GB, Yang J, Zu Y. Investigation of the change in CD4(+) T cell subset in children with henoch-schonlein purpura. Rheumatol Int (2012) 32(12):3785–92. doi: 10.1007/s00296-011-2266-3
46. Jen HY, Chuang YH, Lin SC, Chiang BL, Yang YH. Increased serum interleukin-17 and peripheral Th17 cells in children with acute henoch-schonlein purpura. Pediatr Allergy Immunol (2011) 22(8):862–8. doi: 10.1111/j.1399-3038.2011.01198.x
Keywords: immunoglobulin A associated vasculitis nephritis, bioinformatics analysis, differentially expressed genes, hub genes, immune infiltration
Citation: Jia X, Zhu H, Jiang Q, Gu J, Yu S, Chi X, Wang R, Shan Y, Jiang H and Ma X (2023) Identification of key genes and imbalance of immune cell infiltration in immunoglobulin A associated vasculitis nephritis by integrated bioinformatic analysis. Front. Immunol. 14:1087293. doi: 10.3389/fimmu.2023.1087293
Received: 02 November 2022; Accepted: 02 March 2023;
Published: 21 March 2023.
Edited by:
Gaetano Isola, University of Catania, ItalyReviewed by:
Jie Wang, First Affiliated Hospital of Xinjiang Medical University, ChinaBiao Huang, Second Affiliated Hospital of Chengdu Medical College, China
Copyright © 2023 Jia, Zhu, Jiang, Gu, Yu, Chi, Wang, Shan, Jiang and Ma. This is an open-access article distributed under the terms of the Creative Commons Attribution License (CC BY). The use, distribution or reproduction in other forums is permitted, provided the original author(s) and the copyright owner(s) are credited and that the original publication in this journal is cited, in accordance with accepted academic practice. No use, distribution or reproduction is permitted which does not comply with these terms.
*Correspondence: Xiaoxue Ma, c25vdzE5OTk1MjFAMTI2LmNvbQ==
†These authors have contributed equally to this work