 Sapir Israeli
 Elizabeth F. Krakow
 Martin Maiers
 Corinne Summers
 Yoram Louzoun
94% of researchers rate our articles as excellent or good
Learn more about the work of our research integrity team to safeguard the quality of each article we publish.
Find out more
ORIGINAL RESEARCH article
Front. Immunol. , 05 May 2023
Sec. Cancer Immunity and Immunotherapy
Volume 14 - 2023 | https://doi.org/10.3389/fimmu.2023.1069749
This article is part of the Research Topic Mathematical Modeling and Systems Approaches to Study the Cancer Immune Response View all 6 articles
Background: Pre-clinical development and in-human trials of ‘off-the-shelf’ immune effector cell therapy (IECT) are burgeoning. IECT offers many potential advantages over autologous products. The relevant HLA matching criteria vary from product to product and depend on the strategies employed to reduce the risk of GvHD or to improve allo-IEC persistence, as warranted by different clinical indications, disease kinetics, on-target/off-tumor effects, and therapeutic cell type (T cell subtype, NK, etc.).
Objective: The optimal choice of candidate donors to maximize target patient population coverage and minimize cost and redundant effort in creating off-the-shelf IECT product banks is still an open problem. We propose here a solution to this problem, and test whether it would be more expensive to recruit additional donors or to prevent class I or class II HLA expression through gene editing.
Study design: We developed an optimal coverage problem, combined with a graph-based algorithm to solve the donor selection problem under different, clinically plausible scenarios (having different HLA matching priorities). We then compared the efficiency of different optimization algorithms – a greedy solution, a linear programming (LP) solution, and integer linear programming (ILP) -- as well as random donor selection (average of 5 random trials) to show that an optimization can be performed at the entire population level.
Results: The average additional population coverage per donor decrease with the number of donors, and varies with the scenario. The Greedy, LP and ILP algorithms consistently achieve the optimal coverage with far fewer donors than the random choice. In all cases, the number of randomly-selected donors required to achieve a desired coverage increases with increasing population. However, when optimal donors are selected, the number of donors required may counter-intuitively decrease with increasing population size. When comparing recruiting more donors vs gene editing, the latter was generally more expensive. When choosing donors and patients from different populations, the number of random donors required drastically increases, while the number of optimal donors does not change. Random donors fail to cover populations different from their original populations, while a small number of optimal donors from one population can cover a different population.
Discussion: Graph-based coverage optimization algorithms can flexibly handle various HLA matching criteria and accommodate additional information such as KIR genotype, when such information becomes routinely available. These algorithms offer a more efficient way to develop off-the-shelf IECT product banks compared to random donor selection and offer some possibility of improved transparency and standardization in product design.
Immune effector cell therapy (IECT) products are used for a variety of therapies for cancers and viral infection. “Off-the-shelf” refers to the ability to leverage healthy donors for on-demand or, more commonly, cryopreserved IECT products. A proliferation of published and ongoing trials attests to increasing interest in off-the-shelf allo-IECTs for anti-viral and anti-neoplastic indications. (See Tables 1, S1 for a detailed list of proposed therapies.) Far more allo-IECTs are in preclinical development, as reviewed by Depil et al. (42) and Perez et al. (43).
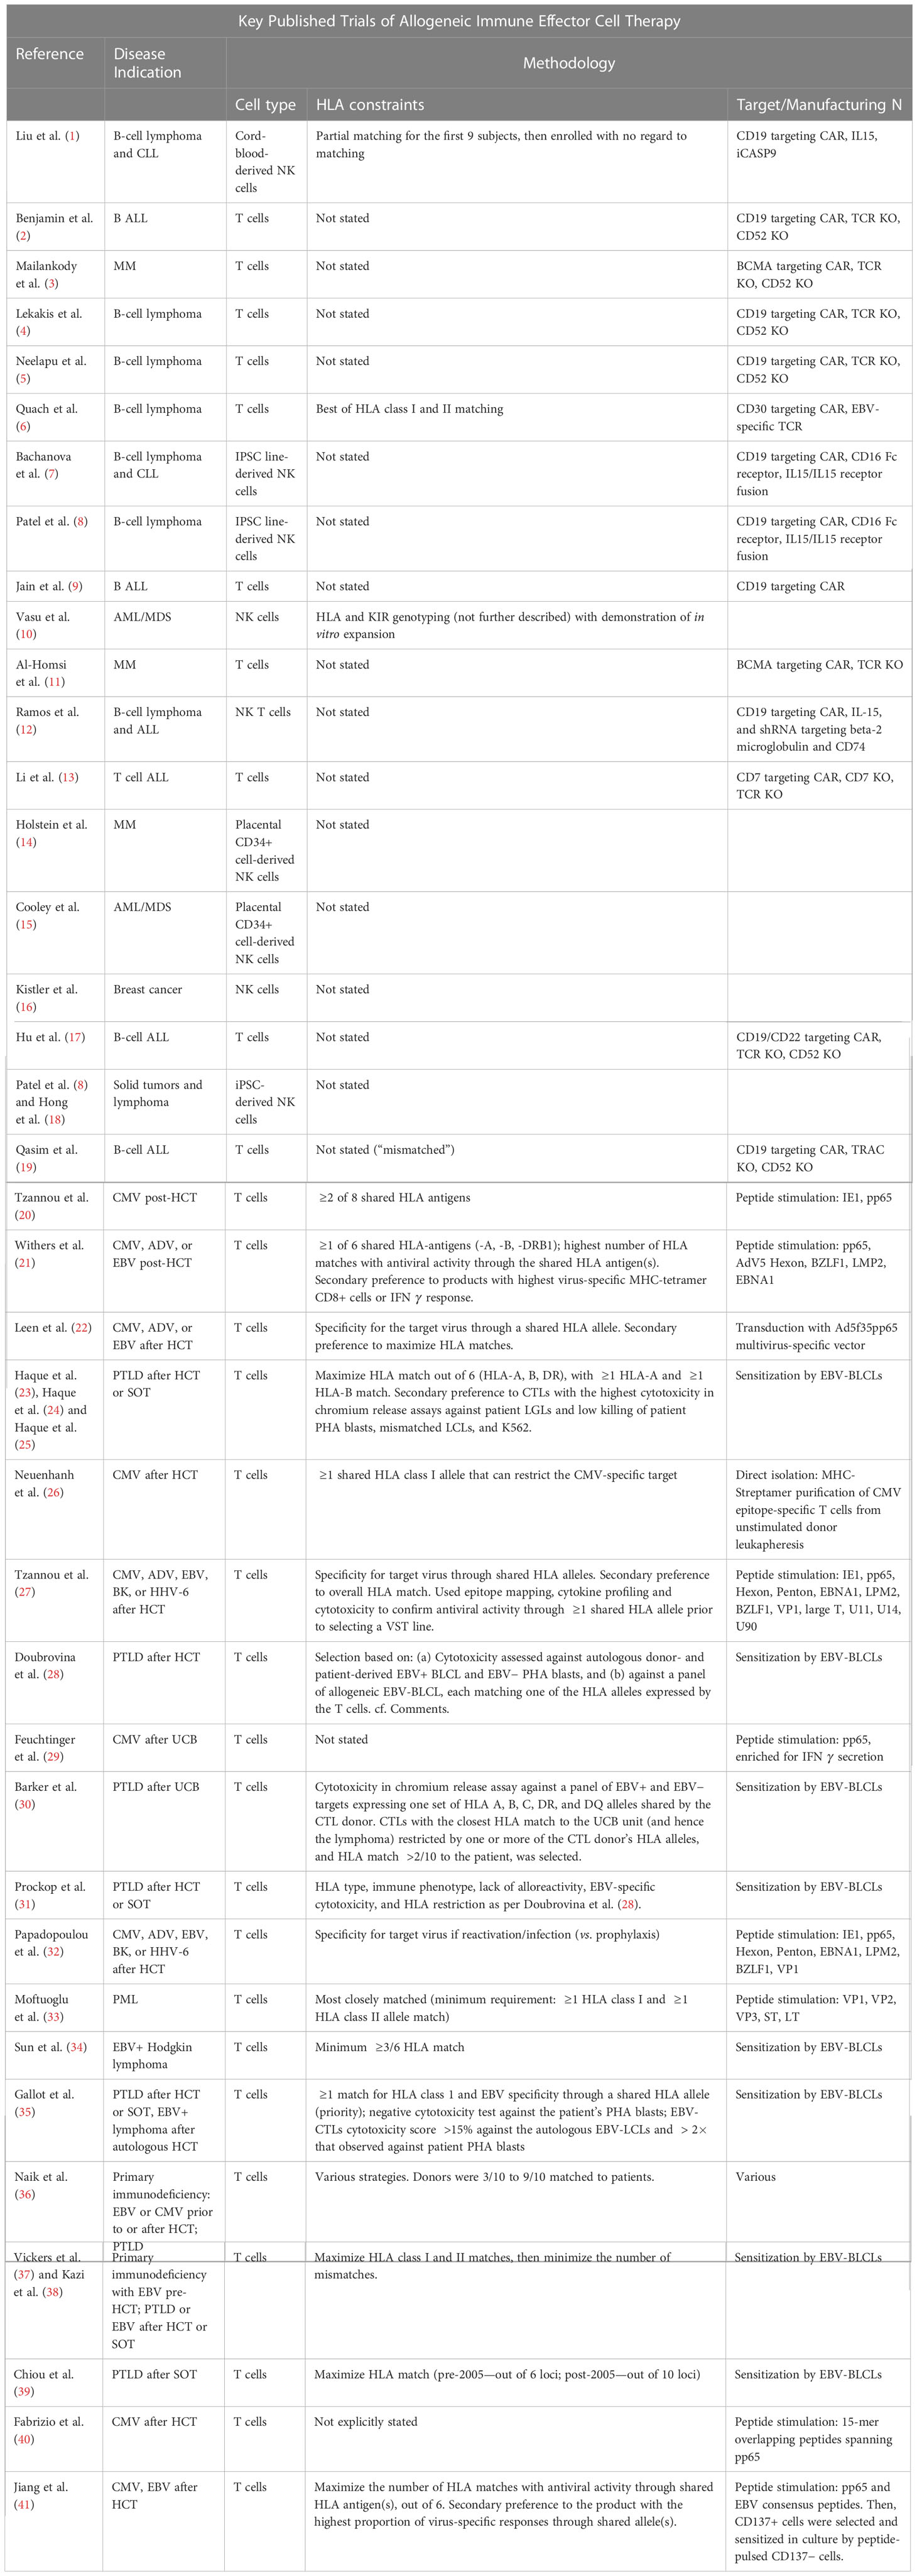
Table 1 List of clinical trials of alloreactive immune effector cellular therapies. We list for each trial its reference, the type of disease treated, the cell type, the HLA constraint, and the target cell surface antigen or virus. Additional details are given in the Supplementary Tables.
The potential advantages of allogeneic over autologous IECT approaches include (a) immediate availability of cryopreserved product; (b) avoiding inadequate collection of starting material from patient leukapheresis due to lymphopenia or autologous T or NK cell dysfunction (due to the immunosuppressive effects of cancer or the extent of prior chemotherapeutic and immunomodulatory treatments); (c) avoiding treatment delays introduced by complex logistics and manufacturing failures; (d) possible improvements to standardization and dose–response prediction; (e) time for additional cell modifications that could increase efficacy, safety, or persistence; (f) ease of repeat dosing; and (g) economies of scale that can reduce the cost burden on healthcare systems and may increase accessibility of IECT worldwide.
On the other hand, allo-IECT faces several challenges, including the risk of graft-vs-host disease (GvHD) and the rapid elimination of the cell product by recipient NK or T cells (Depil et al. (42). GvHD occurs when the donor-derived T cells attack the recipient’s healthy tissue. This donor cell reaction is associated with HLA molecules on the recipient tissue that are not expressed in the donor. Conversely, the host can reject the target cells, when foreign HLA molecules on the donor-derived cells trigger the recipient’s T cells to react against the donor-derived cells. Alternatively, recipient NK cells can react against donor cells that are missing an HLA molecule native to the recipient. These are reasons why IECTs with “HLA independent” mechanisms of anti-viral or anti-cancer efficacy may still benefit from consideration of HLA compatibility. Strategies for overcoming these challenges are described in the Supplementary Tables. For example, disrupting the TRAC locus to prevent TCR expression can eliminate the risk of GvHD in the context of donor T-cell therapies. Knocking out the beta2 microglobulin gene to prevent expression of class 1 HLA on donor T or NK cells may “hide” them from recipient T cells to increase persistence, but additional gene editing would be necessary to reduce the likelihood of lysis by recipient NK cells noticing a “missing self” ligand. A chimeric 4-1BB-specific alloimmune defense, proposed by Mo et al., enables CAR-T cells to evade alloreactive recipient T and NK cells, yet spares recipient resting T and NK cells. This avoided immunocompromise and promoted persistence and anti-tumor efficacy (44).
The optimization strategies for choosing a set of candidate donors consistent with the challenges described in Table S2 depend on the clinical context and the extent of genetic engineering deemed feasible. Foremost is the indication for therapy. For example, IECT may safely be rejected after clearance of an infection with no latent form but may need to persist for recurring infections. Similarly, if a tumor is rendered operable by neoadjuvant IECT debulking, long-term IEC persistence may be superfluous after successful tumor resection. However, IEC persistence may be essential in situations where sub-clinical malignancy may lead to relapse. We must also consider the anticipated adverse effects of IEC persistence due to on-target/off-tumor effects, such as B-cell aplasia for CD19+ ALL or myeloid aplasia for CD123-directed CAR-T cell therapy.
To support emerging efforts at product standardization and to maximize population coverage while minimizing costs associated with collecting redundant donors, we propose a solution to the maximal coverage problem for different scenarios and compare the optimal coverage with the one obtained from random donors. These algorithms could accommodate information beyond HLA typing, such as KIR genotyping or polymorphisms in other immune response genes.
The datasets obtained from the Ezer-Mizion Bone Marrow Donor Registry include 1,040,503 donors. The population HLA haplotype frequencies were estimated using a multi-race expectation-maximization algorithm (45). The HLA of each donor was imputed using GRIMM (46) and the most probable five locus (A, B, C, DQB1, and DRB1) genotypes were chosen.
Given two sets of genotypes, and , of donors and patients, respectively, each with 2 mismatch rates, a and b, we say that genotype () of donors matches genotype () of patients if it obeys some matching condition—for example, at most mismatches in class 1 and mismatches in class 2. The goal is to find the minimal set of donor genotypes that optimizes the patients’ coverage.
The method includes two stages.
1. Find for each donor genotype in the donor population () which patient genotypes it can match (further denoted as ).
2. Assuming a weight for each genotype in a patient population (), which represents the number of patients with the same genotype, the problem can be stated in two similar ways: (A) Given a maximal size of the set of donors , find the subset of donor genotypes that maximizes , or alternatively, (B) for a required coverage , find the minimal subset that produces a coverage of P.
For each genotype dj in the donor population (), create a node of the full unphased genotype (denoted UMUG—Unphased Multilocus Unambiguous Genotype) and then create edges from the genotype node to the appropriate class 1 and class 2 nodes, C1j and C2j. A Ckj node is composed of a pair of class k genotypes (e.g., for the appropriate set of genes ). Here, we use a two-field representation of the alleles (e.g., ).
First, merge all patient genotypes and save the number of occurrences. For , with alleles, create the combination of all alleles , and create edges from the full genotype (e.g., in the example above). Repeat the iterative process, starting from , until alleles for class 1 and alleles for class 2. For the patient genotypes, we create the same connection but with opposite edge direction (Figure 1). The weight of patient genotype vertex is the number of genotype occurrences.

Figure 1 Example of graph creation. Here, we allow one mismatch in both class 1 and class 2. For the donor genotype (dark blue) and the patient genotype (pink), a sub-node of class 1 and class 2 (gray-blue nodes) was created, and then the sub-node of class 1 minus 1 and class 2 minus 1 (white nodes) was created. Each sub-node was connected to the corresponding genotype nodes. The dashed gray edge shows that the white node is a sub-node of the gray-blue node, but those edges do not exist in the graph. If there exists a path between two nodes that passes through class 1 sub-nodes and through class 2 sub-nodes, then those nodes cover each other. Here exist two paths (the dashed path).
Given two sets of donor and patient genotypes, and of size and respectively, for each genotype from , define to be all the genotypes from (reachable from through the graph); the problem can be stated as the maximal coverage of by the union of the .
Linear programming: This problem can be formulated as an LP problem (47): is a binary flag that represents whether a donor with genotype was chosen in the cover (). represents whether patient genotype is covered by . We define a loss function
and minimize it subject to:
Integer linear programming: For ILP, replace the last two with:
if then is covered.
if then is selected for the cover.
Greedy algorithm: The greedy algorithm (48) at each iteration chooses set that contains the maximum weight of uncovered elements until the wanted percentage is covered.
To estimate the optimal population coverage for population that can be obtained using a set of donor cells from population (that can be the same or different populations), one can compute a coverage problem. Each person in population is characterized by an HLA genotype and a probability that represents the number of patients who may require treatment (or a preference) whose HLA genotype is . The goal is to find a minimal subset of donors from population , such that the fraction of the population in that can receive a treatment from them is maximal. We can define for each donor the set of all patients who can receive a treatment from this donor .
Formally, we try to find the subset that maximizes:
Note that the same person can receive treatments from different donors, such that different may overlap. The definition of is determined by the treatment proposed, and may differ drastically between treatments. We have tested three protocols, with large differences between the resulting optimal number of donors depending on the treatment.
1. The donor is KIR-Bw4 mismatched to the patient and requires a full match in class 2, while no match is required in class 1.
2. The donor and the patient have a maximal match at the HLA-A and HLA-B loci. The patient and the donor must both have A*02:01 and the donor must not be homozygote in any HLA allele shared with the patient.
3. All A, B, C, DRB1, and DQB1 alleles that appear in the donor should also be in the patient. The opposite does not have to happen. For example, the donor may be homozygous at a locus where the patient is heterozygote. In the case of mismatch, a knockout for one of the donor alleles can be performed, but at a high cost (which is equivalent to using more donors with no knockout). In this case, we aim at optimizing the cost and not the total number of donors.
To compute the optimal donor set for large populations, one must first compute efficiently the coverage of each donor () and then solve the optimization problem. We propose novel solutions for each stage. The computation is performed through an extension of the GRIMM graph matching Maiers et al. (46). The second is solved through a linear programming problem.
We developed a graph-based algorithm to solve the following problem: Given a set of patients, each with a genotype , a donor with a genotype , and 2 mismatch rates, a and b, we look for the set of patients who have at most mismatches in class 1 and mismatches in class 2. The genotypes covered can be obtained through a traversal in that graph (see Section 3.3 and Figure 1).
Given the coverage obtained by the graph, one can solve the optimization problem in Eq. 1 using four possible methods.
● A greedy solution, where, at each stage, the donor j provides the largest coverage of the remaining population.
● A linear programming (LP) solution, where a GPLK algorithm (49) is used. The LP provides partial fraction for each donor. As such, it cannot be used in practice (since one cannot take half a donor). This solution is an upper bound for the optimal solution. We further show that the greedy and ILP results are similar to the LP.
● Integer linear programming (ILP). We used the CBC algorithm (50). This is the best theoretical solution.
● The random choice of donor. We computed the average coverage of five random choices of N donors.
An off-the-shelf NK cell therapy is being developed to treat myeloid malignancies, as in Lamb et al. (51). It is hypothesized that if the patient is missing a ligand (HLA) for which the donor possesses the cognate KIR, some donor NK cells may be uninhibited upon contact with malignant cells, improving the donor-vs-leukemia effect. It is further hypothesized that maximizing the class 2 HLA matching will improve donor cell persistence. The limitations on the donors in this scenario are as follows:
1. Donor is KIR-ligand mismatched to the patient.
2. Full match in class 2.
3. Six mismatches can be allowed in class 1.
For the KIR mismatched limitation, we used Bw4 expressed on HLA A or B with 0–4 appearances. Two genotypes match in KIR if both have the same epitopes (regardless of the number of occurrences of each one). For class 2, we demanded no mismatch.
We computed the optimal coverage using a random choice, and compared it to the different optimizations (greedy algorithm, LP, and ILP) on a population of 100,000 patients and the same 100,000 donors, and required a coverage of at least 50% of the population. The greedy and ILP algorithm found similar minimal sets (Table 2), which are six times smaller than the random. We also compared how many genotypes are needed to cover different fractions of the population by the greedy and random choice (Figure 2A). We further compared the number of donors required to cover the population in the four algorithms for different populations sizes: 300, 1K, 3K, 10K, 30K, 100K, 300K, and 1M (Figure 2B). In large populations, the random solution requires more donors, whereas in the other algorithms, the number of donors required actually decreases with the patient population size. In a larger population, there is a greater chance of finding rare donors that match multiple patients, and thus fewer donors are actually needed. The patient population may be more heterogeneous, but we aimed to cover 50%, the algorithm. Thus, missing rare patients has a smaller effect than finding better donors. On the other hand, the number of donors required to cover an additional percent of the patient populations increases as more coverage is required. While 10 donors can cover 10% of the population, 40 donors are required to cover 40% (Figure 2C). For small populations, the runtimes of the greedy algorithms and ILP are similar. For large populations, ILP resolves faster, but for populations above 30,000, the ILP algorithm fails to converge following inherent limitations of the ILP algorithm (Figure 3A).
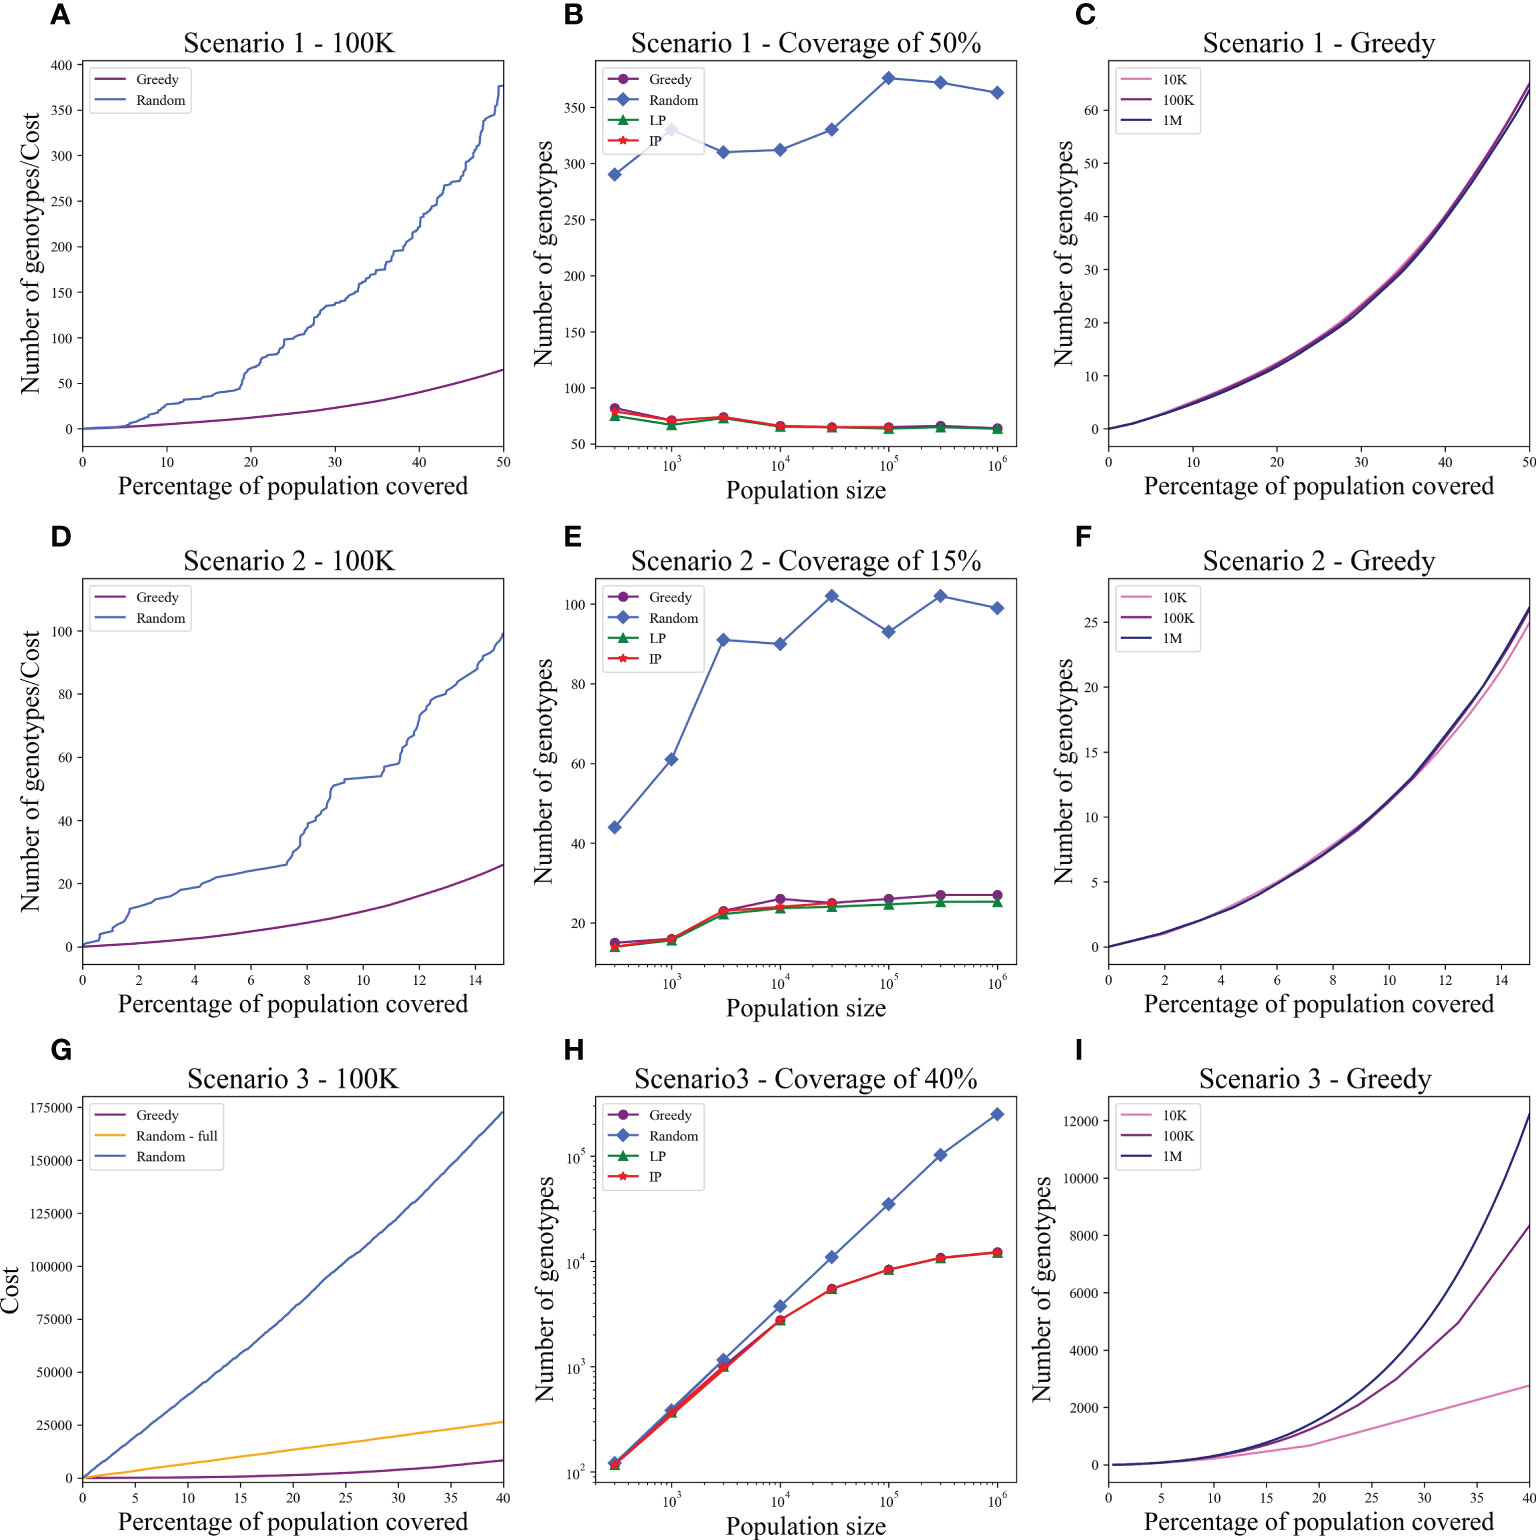
Figure 2 Coverage in different models. For each scenario described in the text, we checked how many donors are needed to cover the total population. Each row is a different scenario. (A, D, G) The cost to cover the given percentage from the population of size 100K (x-axis) using two algorithms: greedy and random choice. In G, options for random choice included the full genotype or knockout genotypes in each iteration (“Random”) or only full genotypes (“Random - full”). (B, E, H) How many genotypes are needed to cover 50% (B), 15% (E), and 40% (H) of differently sized populations represented on the x-axis on a log scale. The y-axis is on a log scale in (H). (C, F, I) The number of genotypes needed (y-axis) to cover × percentage of the population (x-axis) in three different population sizes: 10K, 100K, and 1M.
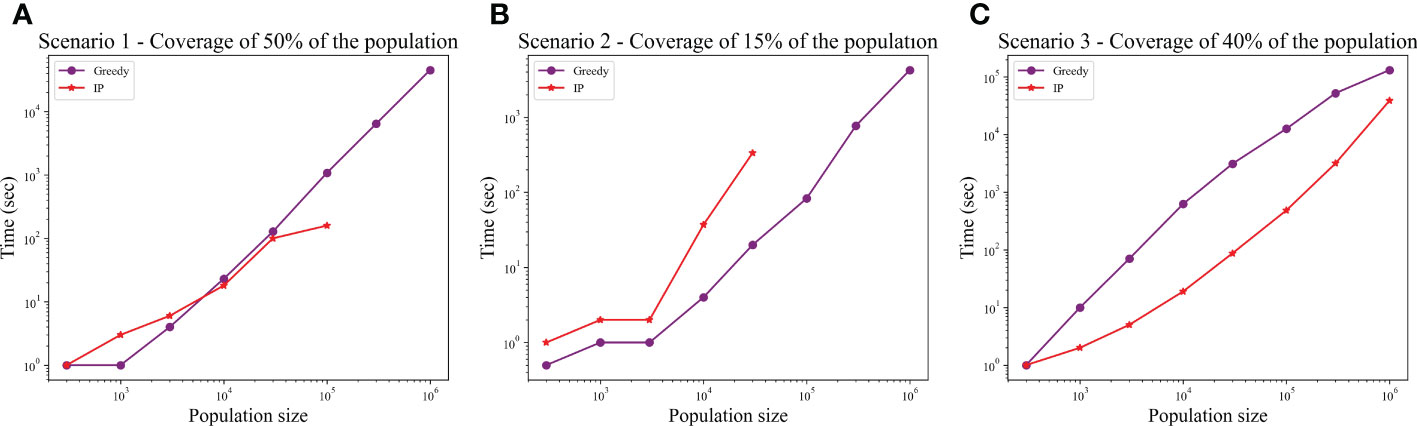
Figure 3 Comparison between runtime of IP and greedy algorithms. The graphs show the effect of the population size on the runtime, in each of the scenarios: (A) Scenario 1, (B) Scenario 2, (C) Scenario 3. In scenarios 1 and 2, the IP could not converge when populations were too large (the missing dots).
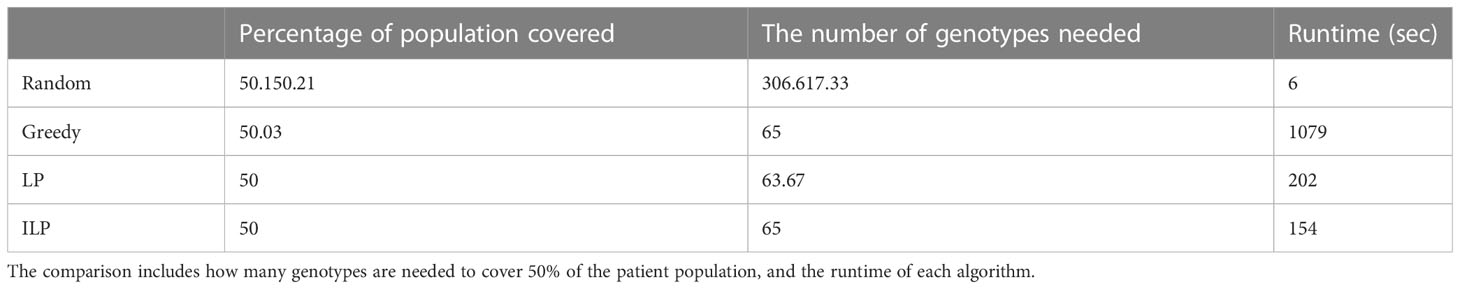
Table 2 Scenario 1. Comparison of four algorithms: random, greedy, LP, and ILP, to cover 50% from a population of 100K patients by 100K donors, where the patient population and the donor population are identical.
A clinical bridge-to-transplant trial is open for patients with relapsed acute leukemias. Following chemotherapy, patients will receive off-the-shelf transduced TCR T-cell products specific for immunogenic leukemia-associated epitopes presented on HLA-A*02:01, such as p53R175H (52) and WT37−45 (53). The limitations in this scenario are as follows:
1. The donor and the patient must both have HLA-A*02:01.
2. To minimize the risk of intractable GvHD, the TCR T-cell donor must not be homozygous at any HLA allele shared with the patient.
3. To minimize the risk of “too prompt” a rejection of the TCR T cells by patient NK cells, the donor and the patient should be matched as much as possible at HLA-A and HLA-B.
Only genotypes with HLA-A*02:01 were included in the graph. If is homozygote in any HLA allele, then we removed from all with those alleles. The graph was changed to contain sub-nodes of HLA-A and HLA-B instead of nodes of all class 1; sub-nodes of class 2 were removed.
For limitation 3, we implemented the greedy algorithm to find at least three matches with a priority to four, defined as a constant called . Assume patient genotypes of ; in each iteration, we want to choose the donor genotype that maximize:
If the number of matches between and in HLA-A and HLA-B is 4, then , else .
Since one of the requirements of this scenario is to maximize the matches at HLA-A and HLA-B between the donors and patients, we tested how many donors are required for a full match in A and B, or for a match of at least three out of four. We used again the greedy, random, LP, and ILP algorithms. Beyond that, we implemented the greedy algorithm to find at least three matches with different priorities to four, as a function of .
We tested the four algorithms on a population of 100,000 patients and the same 100,000 donors; 24.956% of the population had at least one copy of A*02:01. We thus looked for a more limited coverage of at least 15% of the total population. For a match of three, the ILP failed to find a solution. The performance of the greedy with the priority to four provided a better solution compared to the regular greedy, the addition of three genotypes to cover a greater number of four matches. For a required full match in A and B, the greedy performance is equal to the ILP and LP, but much more genotypes are needed (more than 50 time more) compared with the model with only three out of four matches required in A and B or with the softer model where a preference is given to four matches (Table 3).
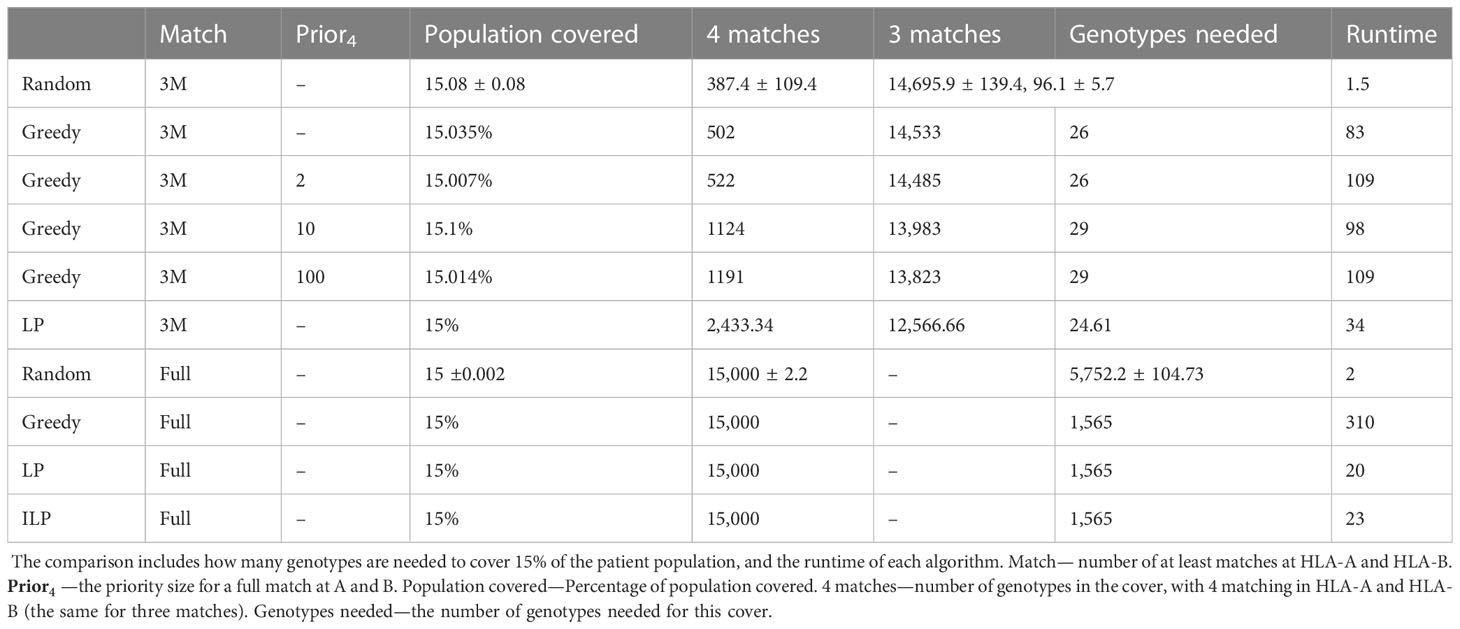
Table 3 Scenario 2. Comparison of four algorithms: random, greedy, LP, and ILP, to cover 15% from a population of 100K patients by 100K donors, where the patient population and the donor population are identical.
We also compared how many genotypes are needed to cover different fractions of the patient population by the greedy and random choices (Figure 2D). In addition, we compared all the algorithms for different populations sizes: 300, 1K, 3K, 10K, 30K, 100K, 300K, and 1M (Figure 2E). The greedy performances are close to ILP and LP. Except for the random model, in all models, the number of required donors stabilizes between 1,000 and 10,000 patients (at less than 30 donors). The number of required donors is not affected by the population size for all coverage fractions tested (Figure 2F). For the one mismatch case, the runtime of the greedy algorithm is lower than the ILP, since we require a low coverage of the patient population, and it converges using less iterations (Figure 3B).
A clinical trial of alpha/beta depleted T-cell therapy for various malignancies (not post-HCT) is planned, as in NCT05001451 and others reviewed in Saura-Esteller et al. (54), and the risk of clinically significant GvHD with this product is deemed to be low. However, the researchers seek to maximize HLA matching as they hypothesize that this will increase donor T-cell persistence and the ability to respond to the cross-presentation of tumor-associated antigens, and improve efficacy. They are able to knock out single HLA alleles using gene editing, but it is expensive. They seek to identify the most cost-efficient way to build the cell product bank: Recruit more donors or remove mismatched HLA loci? The limitations in this model are that all alleles that appear in the donor should also be in the patient, with two options:
1. Full 10/10 HLA match (A, B, C, DRB1, and DQB1).
2. Knockout for one of the donor alleles, and match between the nine other alleles between the donor and the patient. A knockout solution costs like regular donors ( is a constant parameter). Formally, we minimize
If represents a full genotype, then , else COSTj = CostKO + 1.
We want to minimize the total cost for a given coverage of the patient population.
In the graph, we added all nine allele combinations of each donor genotype and created nodes similar to the full genotype nodes, extended to the class 1 and 2 nodes similarly. In this graph, the set is larger than the number of donors (since we typically added 10 more nodes per donor). We thus improved the performance by connecting each node in directly to matched nodes from . In this scenario, the ILP is faster than the greedy and it always converges (Figure 3C).
In the greedy solution, at each iteration, we find the knockout genotype that covers the maximum number of patients (). Then, we find how many full donors () are needed to cover at least such a number of patients. The total number of patients covered by the donors is . If the average cost If the average cost of a patient coverage by a knockout () is smaller than the cost of a patient with a regular donor (), we choose the knockout solution for this iteration, else we choose the full genotype solution.
Using the greedy algorithm, we tested how many full genotypes and knockout genotypes are needed to cover 25% and 40% from populations in size 50K and 100K when the knockout price is 5- and 10-fold the full genotype. When the price is higher by 10-fold, the knockout does not pay off (Table 4). We compare the greedy and the random choice, when the random can choose full genotype or knockout genotype in each iteration, and when the random can choose only full genotypes. As mentioned, the greedy chose only full genotypes. Full genotypes are preferable when the cost is equal to 10-fold (Figure 2G). For a coverage of 40% of the population, the greedy always chooses full genotypes while the ILP chooses a few knockout genotypes that grew with the population size (Table 5), but in comparing the four algorithms, it can be seen that the greedy LP and ILP have a similar performance while the random choice is very expensive (Table 6). Also, as the population size increases, so does the number of genotypes needed (Figure 2H). The last also occurs for coverage of less than 40%. For cost equal to 10-fold, we check the number of genotypes needed to cover each percentage from the population for populations of size 10K, 100K, and 1M. It can be seen that for a small percentage of the population, one genotype can cover a greater number of genotypes and therefore the ratio between the number of genotypes that cover and genotypes successfully covered increases as the percentage of the population increases (Figure 2I). All the above-mentioned genotypes are for a donor population identical to the patient population, where, in general, the knockout yields less payoff, but when the populations are different, from a certain percentage of population coverage, full genotypes cannot be matched and the knockout solution must be used (Table 5).
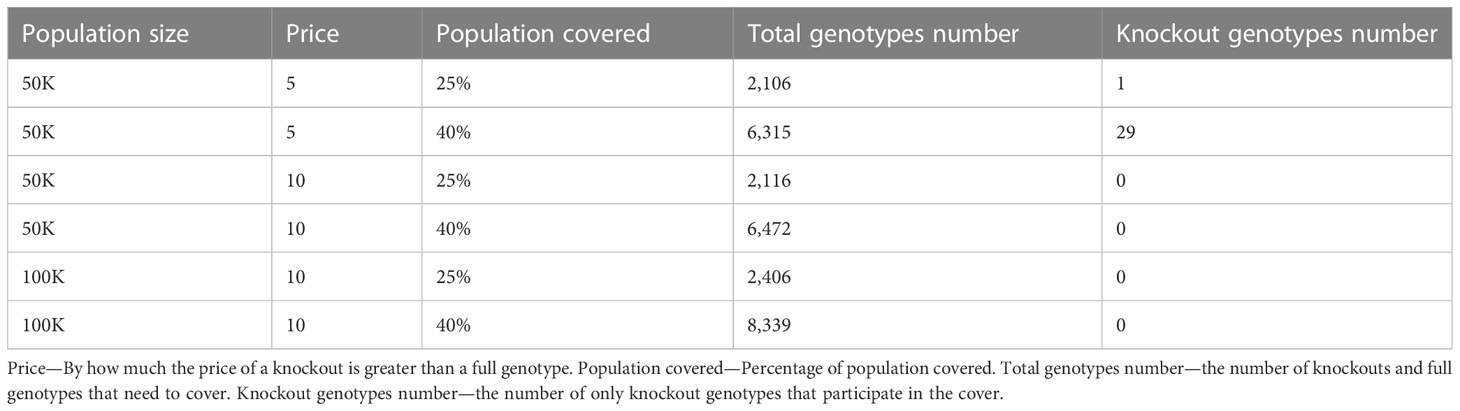
Table 4 Scenario 3. Greedy algorithm outcomes of different combinations of population size, price, and percentage of the population to cover.
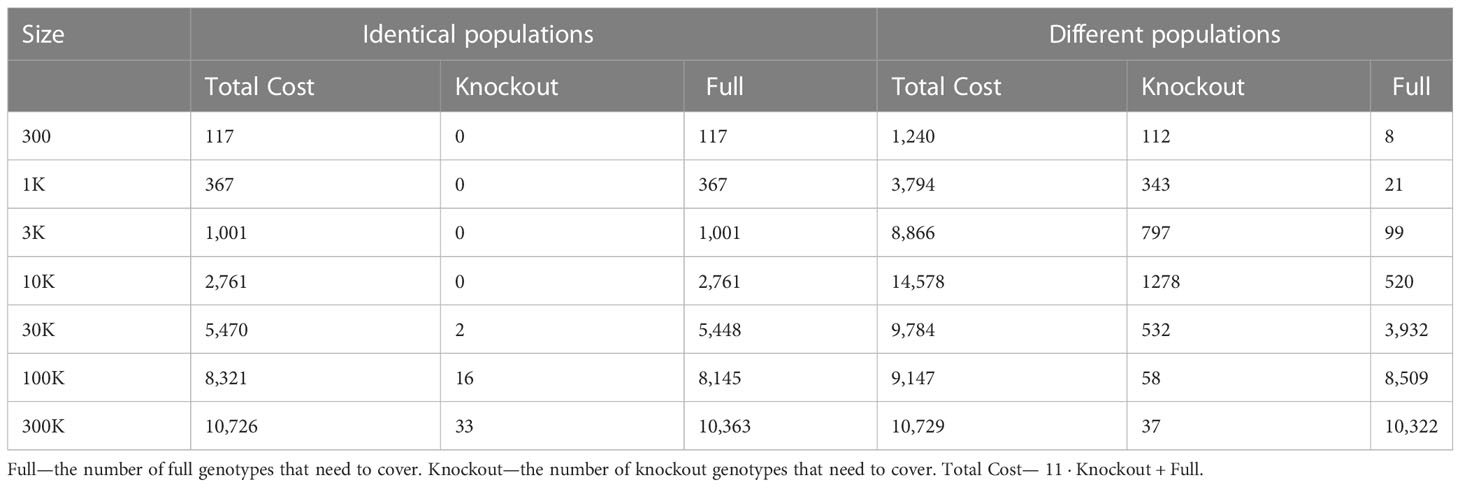
Table 5 Scenario 3. ILP outcomes of different population sizes to cover 40% of the patient population, for identical donor and patient populations, compared to different donor and patient populations. where the cost of full is 1 and knockout is equal 10 + 1.
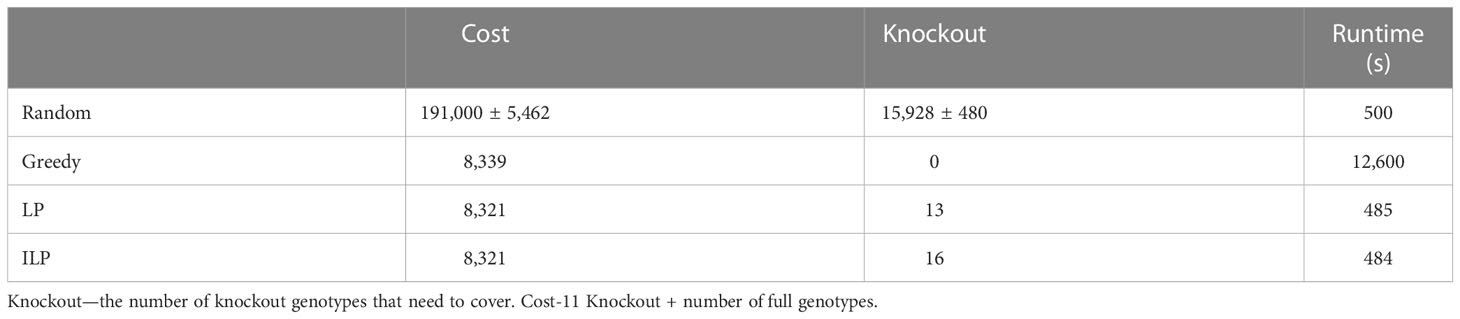
Table 6 Scenario 3. Comparison of four algorithms: random, greedy, LP, and ILP, to cover 40% from the population of 100K patients by the same 100K donors.
While there are differences between populations, the optimal donor group is a small group that may actually be shared between populations. To test for that, we examined the impact of using different populations for the donors and the patients. In all simulations, the donor population is a fixed 1 million donors from the US, and the patient populations are set in different sizes from the Israeli population (as described above). For random donor selection, donors and patients from different populations require many more donors to cover the same patient fraction. In contrast, optimal selection algorithms solve the coverage with a similar number of genotypes as required for donors and patients from the same population in all scenarios tested (Figure 4).
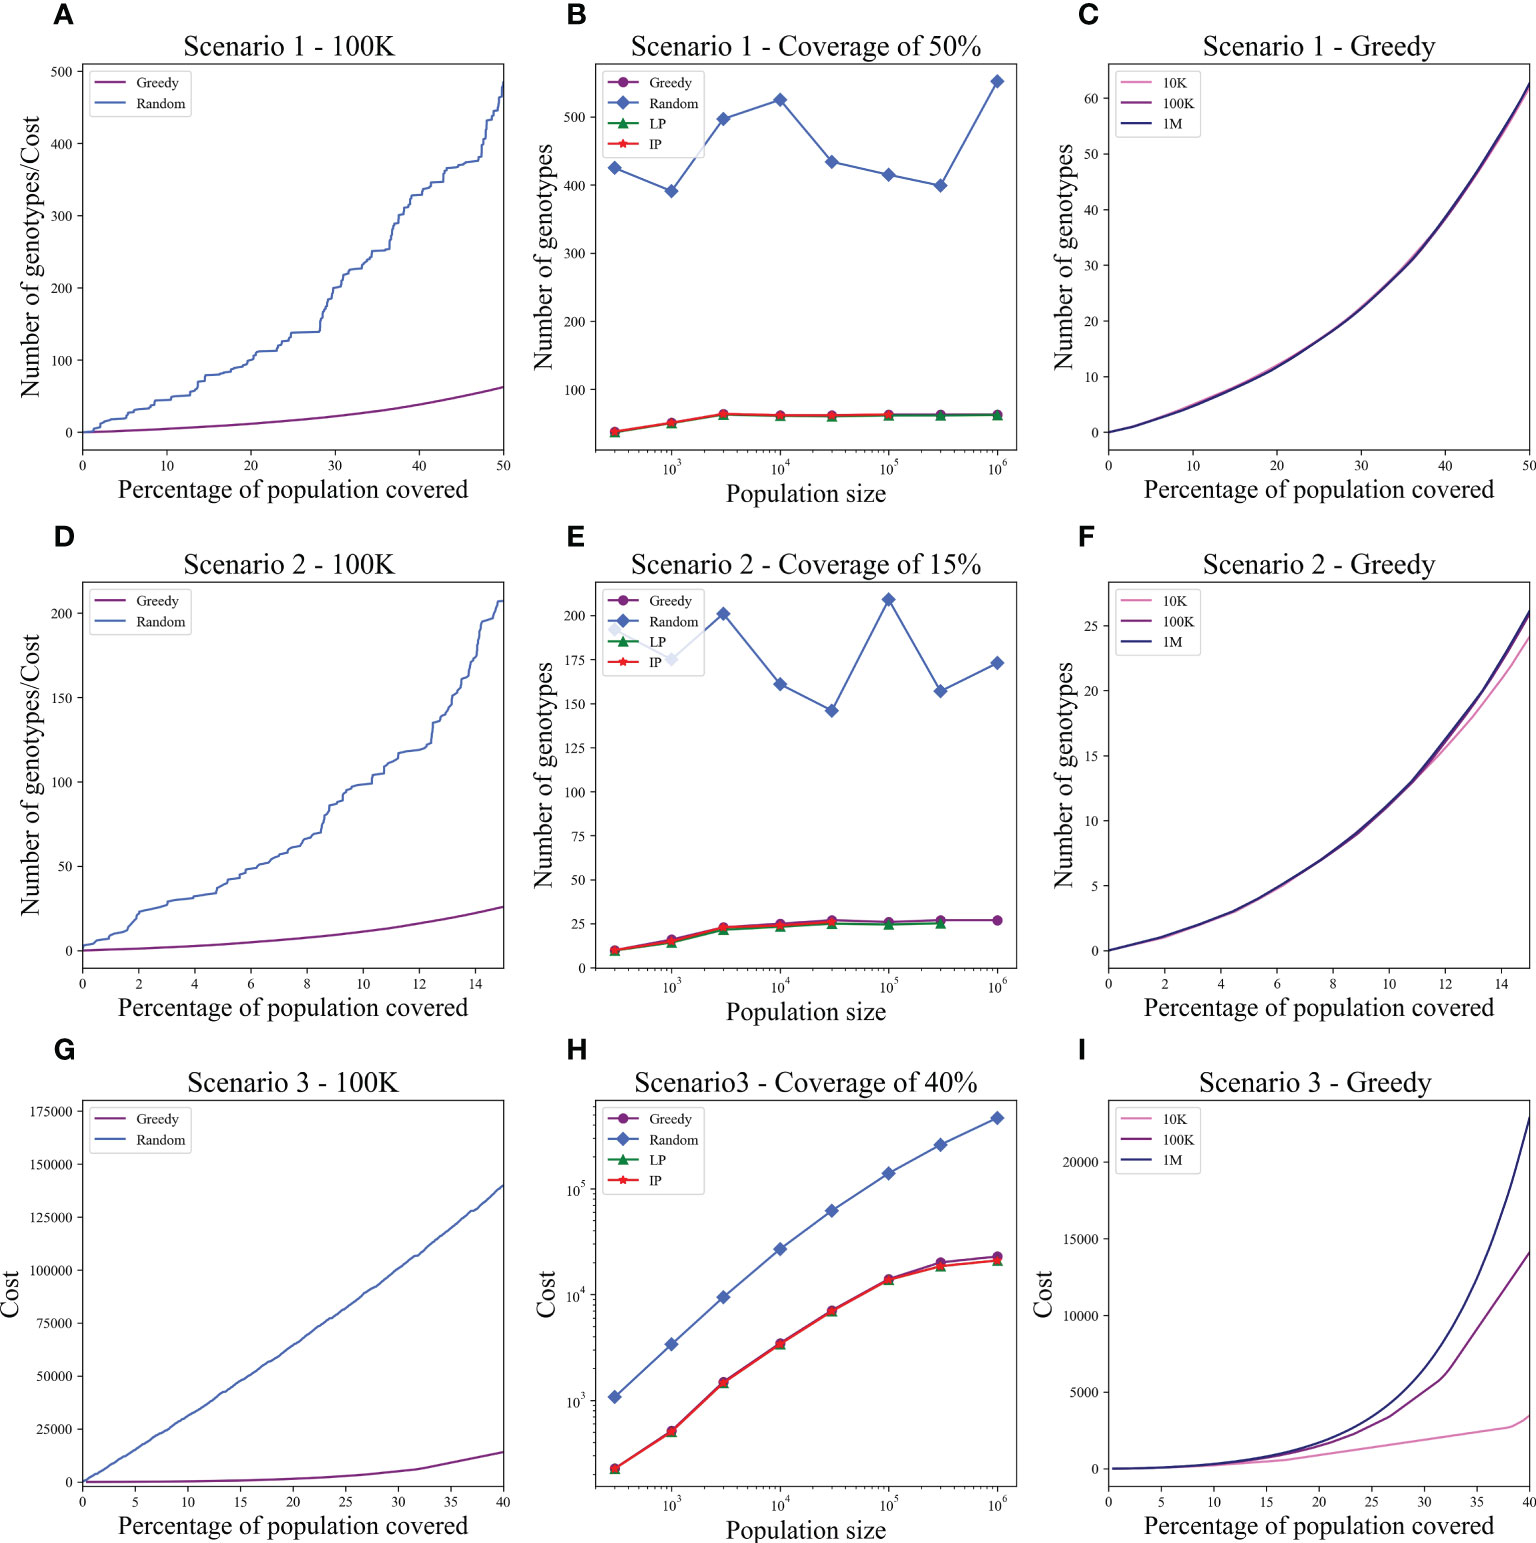
Figure 4 Optimal and random solutions when the donor population is 1 million US donors and the patients are from Israel. All plots are equivalent to Figure 2. Each row is a different scenario: upper row - Scenario 1, middle row - Scenario 2, and lower row - Scenario 3. (A, D, G) The cost to cover the given percentage from the population of size 100K (x-axis) using two algorithms: greedy and random choice. (B, E, H) How many genotypes are needed to cover 50% (B), 15% (E), and 40% (H) of differently sized populations represented on the x-axis on a log scale. The y-axis is on a log scale in (H). (C, F, I) The number of genotypes needed (y-axis) to cover × percentage of the population (x-axis) in three different population sizes: 10K, 100K, and 1M. While there is a large difference in the number of random donors required (much more here than in Figure 2), the number of optimal donors is practically the same. The difference is especially large in Scenario 3. Note that for 1M patients, LP and ILP failed due to memory problem, and for 100K and 300K patients, the ILP did not converge.
The optimal size of donor cell banks is a matter of practical interest. For example, the group at Baylor College of Medicine created a bank of 32 multivirus-specific cell products (transduced with the Ad5f35pp65 vector), of which 18 cell lines were used to treat 50 patients (22). Westmead Hospital created a bank of 31 multiantigen-expanded, multivirus-specific cell products, of which 15 were used to treat 30 patients (21). Memorial Sloan Kettering created a bank of 330 EBV-specific T-cell lines (stimulated with EBV-transformed B-lymphoblastoid cells) and 125 CMVpp65-specific T-cell lines (licensed to Atara Biotherapeutics) (31, 55). Donors for the EBV-specific cell bank were recruited to represent 40 common class 1 HLA alleles that can restrict EBV epitopes. The bank was estimated to cover 95% of the New York population. By contrast, to treat EBV-related post-transplant lymphoproliferative disorders, the Scottish National Blood Transfusion Service performed a simulation using HLA typing from 200 donors from Auckland targeting 304 patients from the East of Scotland renal transplant waiting list, aiming to maximize the number of HLA class 1 and 2 matches and minimize the number of mismatches. Fifteen donors could cover 57% of the patient population and 25 donors could cover 85%, but adding more donors did not significantly increase the coverage. Therefore, the panel size chosen was only 25 (37). In practice, among issued products, there was a median of 3 class 1 matches (range 0–6), 2 class 2 matches (range 0–4), and 5 overall matches (range 2–9) out of 10 loci considered. Clinical responses were positively correlated with number of HLA matches, with 100% of patients with matches at 8 to 10 (of 10) HLA loci responding (38).
These experiences show the wide variety of cell bank building approaches. Our approach facilitates transparency about donor selection and consequently might contribute to reproducibility of outcomes when the “same” products are used in different populations. We recognize that many factors impact the efficacy of off-the-shelf treatment—such as whether the patients are on immunosuppression, the tumor burden, tumor immunogenicity, the presence of particular T or NK cell subsets in the infused product, and the construct of synthetic components. Insofar as HLA match may also impact efficacy, we offer a tool for rationally sizing a bank. These algorithms can readily accommodate additional factors. For example, the bank size can be adjusted to account for the distribution of virus-specific activity in the donor population. For example, seropositivity for CMV (as indicated by CMV IgG) varies widely by age group and geography (56). If the manufacturer is seeking CMV+ donors and knows, for example, that the CMV seroprevalence in the donor pool is 60%, the model could be run with simulations where each potential donor has a 60% chance of being CMV+ and hence being eligible. Similar considerations apply to adjusting the bank size for the rate at which the fully manufactured product fails the release criteria.
An important aspect studied here is the difference between the donor and patient populations. We have shown that when the optimal donors are selected, the number of donors is not significantly affected by differences between the donor and patient populations. This is partly because the algorithms allow rapid identification of the “rarer” donors in the pool who meaningfully increase population coverage, whereas random selection of donors is more likely to select “redundant” donors. Another approach would be to run the algorithm separately for small populations of rare patient genotypes and thus ensure at least a partial coverage.
The algorithms led to a fairly constant number of donors necessary with a population size of about a 100K, even in scenario 3 where it took a somewhat larger population to reach a stabilized number of donors. However, with a random sample, it is much longer until a stable number of donors is reached, if ever.
The current solution is a coverage problem and is not sensitive to the details of the required coverage. We have recently extended the GRIMM, a matching algorithm (46), to allow multiple mismatches. We can use this algorithm to allow for such mismatches. Also, an interesting extension would be to solve the maximum with a constraint that a given sub-population is covered at some fraction.
One aspect of allogeneic cell therapies that we did not address is the possibility of antibody mediated rejection of cells by the patient. The patient may become alloimmunized to foreign HLA through pregnancy or blood transfusions (57). The effect of donor-specific antibodies in HCT (57) and in solid organ transplant (58) is well-studied, but humoral rejection of allo-IECT is not. If it is found to occur frequently or to undermine efficacy; in future work, we could incorporate models of patient alloimmunization that can differ by disease and other demographic factors.
We have simulated a small number of possible scenarios and compared different solutions for the same scenario. In the majority of reported studies, the number of treated individuals is small, and the protocol for choosing donors is not reported. The computational speed and flexibility of the approach presented here will enable better standardization of allo-IECT to elucidate the impact of HLA matching and additional donor-related factors, as both sets of variables can be taken into account in designing the composition of IECT banks. Our approach will enable scaling of current and future studies to the full population using the smallest number of donors, and enable registries like the NMDP to efficiently identify an optimal set of donors for each allo-IECT trial they support.
The code for this analysis is available at https://github.com/sapiris/CAR cells optimization.
The original contributions presented in the study are publicly available. This data can be found here: https://github.com/sapiris/CAR_cells_optimization.
SI performed the analysis and wrote a part of the paper. YL proposed the methodology and wrote a part of the paper. EK and MM developed the clinical scenarios. EK and CS helped with the literature review and with the writing. All authors contributed to the article and approved the submitted version.
The bioinformatics methods used for this analysis were developed through a research grant funded by the US Office of Naval Research (N00014-23-1-2057).
The authors declare that the research was conducted in the absence of any commercial or financial relationships that could be construed as a potential conflict of interest.
The reviewer BM declared a past co-authorship with the author MM to the handling editor.
All claims expressed in this article are solely those of the authors and do not necessarily represent those of their affiliated organizations, or those of the publisher, the editors and the reviewers. Any product that may be evaluated in this article, or claim that may be made by its manufacturer, is not guaranteed or endorsed by the publisher.
The Supplementary Material for this article can be found online at: https://www.frontiersin.org/articles/10.3389/fimmu.2023.1069749/full#supplementary-material
1. Liu E, Marin D, Banerjee P, Macapinlac HA, Thompson P, Basar R, et al. Use of car-transduced natural killer cells in cd19-positive lymphoid tumors. New Engl J Med (2020) 382:545–53. doi: 10.1056/NEJMoa1910607
2. Benjamin R, Graham C, Yallop D, Jozwik A, Mirci-Danicar OC, Lucchini G, et al. Genome-edited, donor-derived allogeneic anti-cd19 chimeric antigen receptor t cells in paediatric and adult b-cell acute lymphoblastic leukaemia: results of two phase 1 studies. Lancet (2020) 396:1885–94. doi: 10.1016/S0140-6736(20)32334-5
3. Mailankody S, Liedtke M, Sidana S, Matous JV, Chhabra S, Oluwole OO, et al. Universal updated phase 1 data validates the feasibility of allogeneic anti-bcma allo-715 therapy for relapsed/refractory multiple myeloma. Blood (2021) 138:651. doi: 10.1182/blood-2021-145572
4. Lekakis LJ, Locke FL, Tees M, Neelapu SS, Malik SA, Hamadani M, et al. Alpha2 study: Allo-501a allogeneic car t in lbcl, updated results continue to show encouraging safety and efficacy with consolidation dosing. Blood (2021) 138:649. doi: 10.1182/blood-2021-146045
5. Neelapu SS, Nath R, Munoz J, Tees M, Miklos DB, Frank MJ, et al. Alpha study: Allo-501 produced deep and durable responses in patients with relapsed/refractory non-hodgkin’s lymphoma comparable to autologous car t. Blood (2021) 138:3878. doi: 10.1182/blood-2021-146038
6. Quach DH, Ramos CA, Lulla PD, Sharma S, Ganesh HR, Hadidi YF, et al. Safety and efficacy of off-the-shelf cd30. car-modified epstein-barr virus-specific t cells in patients with cd30-positive lymphoma. Blood (2021) 138:1763. doi: 10.1182/blood-2021-153421
7. Bachanova V, Ghobadi A, Patel K, Park JH, Flinn IW, Shah P, et al. Safety and efficacy of ft596, a first-in-class, multi-antigen targeted, off-the-shelf, ipsc-derived cd19 car nk cell therapy in relapsed/refractory b-cell lymphoma. Blood (2021) 138:823. doi: 10.1182/blood-2021-151185
8. Patel K, Bachanova V, Goodman AM, Pagel JM, Griffis K, Anderson M, et al. Phase i study of ft516, an off-the-shelf ipsc-derived nk cell therapy, in combination with rituximab in patients with relapsed/refractory b-cell lymphoma. Blood (2021) 138:3873. doi: 10.1182/blood-2021-151520
9. Jain N, Kantarjian H, Solomon SR, He F, Sauter CS, Heery CR, et al. Preliminary safety and efficacy of pbcar0191, an allogeneic ‘off-the-shelf’cd19-directed car-t for patients with relapsed/refractory (r/r) cd19+ b-all. Blood (2021) 138:650. doi: 10.1182/blood-2021-153166
10. Vasu S, Sharma N, Walker AR, Wall SA, Blachly JS, Behbehani GK, et al. A phase i clinical trial testing the safety of il-21-expanded, universally alloreactive donor-derived natural killer cells for relapsed/refractory acute myeloid leukemia and myelodysplastic syndrome. Blood (2021) 138:1732. doi: 10.1182/blood-2021-150750
11. Al-Homsi A-S, Anguille S, Deeren D, Nishihori T, Meuleman N, Abdul-Hay M, et al. Immunicy-1: Targeting bcma with cyad-211 to establish proof of concept of an shrna-based allogeneic car t cell therapy platform. Blood (2021) 138:2817. doi: 10.1182/blood-2021-147738
12. Ramos CA, Courtney AN, Robinson SN, Dakhova O, Lulla PD, Kamble R, et al. Allogeneic nkt cells expressing a cd19-specific car in patients with relapsed or refractory b-cell malignancies: An interim analysis. Blood (2021) 138:2819. doi: 10.1182/blood-2021-149712
13. Li S, Gao L, Yuan Z, Wu K, Liu L, Luo L, et al. Updates on clinical safety and efficacy result of gc027, the first-in-human,” off-the-shelf” cd7 car-t stand-alone therapy for adult patients with relapsed/refractory t-cell lymphoblastic leukemia (r/r t-all). In: CANCER RESEARCH, vol. vol. 81. . PHILADELPHIA, PA: AMER ASSOC CANCER RESEARCH 615 CHESTNUT ST, 17TH FLOOR (2021).
14. Holstein S, Cooley S, Parameswaran H, Jagannath S, Balint C, van der Touw W, et al. A phase i study of pnk-007, allogeneic, off the shelf nk cell, post autologous transplant in multiple myeloma (nct02955550). Clin Lymphoma Myeloma Leukemia (2019) 19:e112–3. doi: 10.1016/j.clml.2019.09.187
15. Cooley S, Hari P, McCloskey J, Byrne M, Wang E, Hussein M, et al. Abstract ct079: a phase i study of pnk-007, allogeneic, off the shelf nk cell in relapsed/refractory aml (nct02781467). Cancer Research (2019) 79(13_Supplement):CT079–CT079. doi: 10.1158/1538-7445.AM2019-CT079
16. Kistler M, Nangia C, To C, Sender L, Lee J, Jones F, et al. Abstract p5-04-02: Safety and efficacy from first-in-human immunotherapy combining nk and t cell activation with off-the-shelf high-affinity cd16 nk cell line (hank) in patients with 2nd-line or greater metastatic triple-negative breast cancer (tnbc). Cancer Res (2020) 80 (4_Supplement): P5-04-02. doi: 10.1158/1538-7445.SABCS19-P5-04-02
17. Hu Y, Zhou Y, Zhang M, Ge W, Li Y, Yang L, et al. Crispr/cas9-engineered universal cd19/cd22 dual-targeted car-t cell therapy for relapsed/refractory b-cell acute lymphoblastic leukemia. Clin Cancer Res (2021) 27:2764–72. doi: 10.1158/1078-0432.CCR-20-3863
18. Hong D, Patel S, Patel M, Musni K, Anderson M, Cooley S, et al. 380 preliminary results of an ongoing phase i trial of ft500, a first-in-class, off-the-shelf, induced pluripotent stem cell (ipsc) derived natural killer (nk) cell therapy in advanced solid tumors. J ImmunoTherapy Cancer (2020) 8(Suppl 3):A405–A405. doi: 10.1136/jitc-2020-SITC2020.0380
19. Qasim W, Zhan H, Samarasinghe S, Adams S, Amrolia P, Stafford S, et al. Molecular remission of infant b-all after infusion of universal talen gene-edited car t cells. Sci Trans Med (2017) 9:eaaj2013. doi: 10.1126/scitranslmed.aaj2013
20. Tzannou I, Watanabe A, Naik S, Daum R, Kuvalekar M, Leung KS, et al. ‘Mini” bank of only 8 donors supplies cmv-directed t cells to diverse recipients. Blood Adv (2019) 3:2571–80. doi: 10.1182/bloodadvances.2019000371
21. Withers B, Blyth E, Clancy LE, Yong A, Fraser C, Burgess J, et al. Long-term control of recurrent or refractory viral infections after allogeneic hsct with third-party virus-specific t cells. Blood Adv (2017) 1:2193–205. doi: 10.1182/bloodadvances.2017010223
22. Leen AM, Bollard CM, Mendizabal AM, Shpall EJ, Szabolcs P, Antin JH, et al. Multicenter study of banked third-party virus-specific t cells to treat severe viral infections after hematopoietic stem cell transplantation. Blood J Am Soc Hematol (2013) 121:5113–23. doi: 10.1182/blood-2013-02-486324
23. Haque T, Wilkie GM, Taylor C, Amlot PL, Murad P, Iley A, et al. Treatment of epstein-barr-virus-positive post-transplantation lymphoproliferative disease with partly hla-matched allogeneic cytotoxic t cells. Lancet (2002) 360:436–42. doi: 10.1016/S0140-6736(02)09672-1
24. Haque T, Wilkie GM, Jones MM, Higgins CD, Urquhart G, Wingate P, et al. Allogeneic cytotoxic t-cell therapy for ebv-positive posttransplantation lymphoproliferative disease: results of a phase 2 multicenter clinical trial. Blood J Am Soc Hematol (2007) 110:1123–31. doi: 10.1182/blood-2006-12-063008
25. Haque T, McAulay KA, Kelly D, Crawford DH. Allogeneic t-cell therapy for epstein-barr virus-positive posttransplant lymphoproliferative disease: long-term follow-up. Transplantation (2010) 90:93–4. doi: 10.1097/TP.0b013e3181d7c424
26. Neuenhahn M, Albrecht J, Odendahl M, Schlott F, Doessinger G, Schiemann M, et al. Transfer of minimally manipulated cmv-specific t cells from stem cell or third-party donors to treat cmv infection after allo-hsct. Leukemia (2017) 31:2161–71. doi: 10.1038/leu.2017.16
27. Tzannou I, Papadopoulou A, Naik S, Leung K, Martinez CA, Ramos CA, et al. Off-the-shelf virus-specific t cells to treat bk virus, human herpesvirus 6, cytomegalovirus, epstein-barr virus, and adenovirus infections after allogeneic hematopoietic stem-cell transplantation. J Clin Oncol (2017) 35:3547. doi: 10.1200/JCO.2017.73.0655
28. Doubrovina E, Oflaz-Sozmen B, Prockop SE, Kernan NA, Abramson S, Teruya-Feldstein J, et al. Adoptive immunotherapy with unselected or ebv-specific t cells for biopsy-proven ebv+ lymphomas after allogeneic hematopoietic cell transplantation. Blood J Am Soc Hematol (2012) 119:2644–56. doi: 10.1182/blood-2011-08-371971
29. Feuchtinger T, Opherk K, Bethge WA, Topp MS, Schuster FR, Weissinger EM, et al. Adoptive transfer of pp65-specific t cells for the treatment of chemorefractory cytomegalovirus disease or reactivation after haploidentical and matched unrelated stem cell transplantation. Blood J Am Soc Hematol (2010) 116:4360–7. doi: 10.1182/blood-2010-01-262089
30. Barker JN, Doubrovina E, Sauter C, Jaroscak JJ, Perales MA, Doubrovin M, et al. Successful treatment of ebv-associated posttransplantation lymphoma after cord blood transplantation using third-party ebv-specific cytotoxic t lymphocytes. Blood J Am Soc Hematol (2010) 116:5045–9. doi: 10.1182/blood-2010-04-281873
31. Prockop S, Doubrovina E, Suser S, Heller G, Barker J, Dahi P, et al. Off-the-shelf ebv-specific t cell immunotherapy for rituximab-refractory ebv-associated lymphoma following transplantation. J Clin Invest (2020) 130:733–47. doi: 10.1172/JCI121127
32. Papadopoulou A, Gerdemann U, Katari UL, Tzannou I, Liu H, Martinez C, et al. Activity of broad-spectrum t cells as treatment for adv, ebv, cmv, bkv, and hhv6 infections after hsct. Sci Trans Med (2014) 6:242ra83–242ra83. doi: 10.1126/scitranslmed.3008825
33. Muftuoglu M, Olson A, Marin D, Ahmed S, Mulanovich V, Tummala S, et al. Allogeneic BK Virus-Specific T Cells for Progressive Multifocal Leukoencephalopathy. N Engl J Med (2018) 379:1443–51. doi: 10.1056/NEJMoa1801540
34. Sun Q, Burton R, Reddy V, Lucas KG. Safety of allogeneic epstein–barr virus (ebv)-specific cytotoxic t lymphocytes for patients with refractory ebv-related lymphoma. Br J haematology (2002) 118:799–808. doi: 10.1046/j.1365-2141.2002.03683.x
35. Gallot G, Vollant S, Saïagh S, Clémenceau B, Vivien R, Cerato E, et al. T-Cell therapy using a bank of ebv-specific cytotoxic t cells: lessons from a phase i/ii feasibility and safety study. J Immunotherapy (2014) 37:170–9. doi: 10.1097/CJI.0000000000000031
36. Naik S, Nicholas SK, Martinez CA, Leen AM, Hanley PJ, Gottschalk SM, et al. Adoptive immunotherapy for primary immunodeficiency disorders with virus-specific t lymphocytes. J Allergy Clin Immunol (2016) 137:1498–505. doi: 10.1016/j.jaci.2015.12.1311
37. Vickers MA, Wilkie GM, Robinson N, Rivera N, Haque T, Crawford DH, et al. Establishment and operation of a good manufacturing practice-compliant allogeneic epstein-barr virus (ebv)-specific cytotoxic cell bank for the treatment of ebv-associated lymphoproliferative disease. Br J haematology (2014) 167:402–10. doi: 10.1111/bjh.13051
38. Kazi S, Mathur A, Wilkie G, Cheal K, Battle R, McGowan N, et al. Long-term follow up after third-party viral-specific cytotoxic lymphocytes for immunosuppression-and epstein-barr virus-associated lymphoproliferative disease. Haematologica (2019) 104:e356. doi: 10.3324/haematol.2018.207548
39. Chiou FK, Beath SV, Wilkie GM, Vickers MA, Morland B, Gupte GL. Cytotoxic t-lymphocyte therapy for post-transplant lymphoproliferative disorder after solid organ transplantation in children. Pediatr Transplant (2018) 22:e13133. doi: 10.1111/petr.13133
40. Fabrizio VA, Rodriguez-Sanchez MI, Mauguen A, Dahi PB, Doubrovina E, O’Reilly RJ, et al. Adoptive therapy with cmv-specific cytotoxic t lymphocytes depends on baseline cd4+ immunity to mediate durable responses. Blood Adv (2021) 5:496–503. doi: 10.1182/bloodadvances.2020002735
41. Jiang W, Clancy LE, Avdic S, Sutrave G, Street J, Simms R, et al. Third-party cmv-and ebv-specific t-cells for first viral reactivation after allogeneic stem cell transplant. Blood Adv (2022) 6:4949–66. doi: 10.1182/bloodadvances.2022007103
42. Depil S, Duchateau P, Grupp S, Mufti G, Poirot L. ‘Off-the-shelf’allogeneic car t cells: development and challenges. Nat Rev Drug Discovery (2020) 19:185–99. doi: 10.1038/s41573-019-0051-2
43. Perez C, Gruber I, Arber C. Off-the-shelf allogeneic t cell therapies for cancer: opportunities and challenges using naturally occurring “universal” donor t cells. Front Immunol (2020) 11(583716):2499. doi: 10.3389/fimmu.2020.583716
44. Mo F, Watanabe N, McKenna MK, Hicks MJ, Srinivasan M, Gomes-Silva D, et al. Engineered off-the-shelf therapeutic t cells resist host immune rejection. Nat Biotechnol (2021) 39:56–63. doi: 10.1038/s41587-020-0601-5
45. Israeli S, Gragert L, Maiers M, Louzoun Y. Hla haplotype frequency estimation for heterogeneous populations using a graph-based imputation algorithm. Hum Immunol (2021) 82:746–57. doi: 10.1016/j.humimm.2021.07.001
46. Maiers M, Halagan M, Gragert L, Bashyal P, Brelsford J, Schneider J, et al. Grimm: Graph imputation and matching for hla genotypes. Bioinformatics (2019) 35:3520–3. doi: 10.1093/bioinformatics/btz050
48. Nemhauser GL, Wolsey LA, Fisher ML. An analysis of approximations for maximizing submodular set functions–i. Math programming (1978) 14:265–94. doi: 10.1007/BF01588971
49. Makhorin A. (2008). Glpk (gnu linear programming kit. Available at: http://www.gnu.org/s/glpk/glpk.html.
50. Forrest J, Lougee-Heimer R. Cbc user guide. In: Emerging theory, methods, and applications (INFORMS) (2005). p. 257–77.
51. Lamb MG, Rangarajan HG, Tullius BP, Lee DA. Natural killer cell therapy for hematologic malignancies: successes, challenges, and the future. Stem Cell Res Ther (2021) 12:1–19. doi: 10.1186/s13287-021-02277-x
52. Malekzadeh P, Yossef R, Cafri G, Paria BC, Lowery FJ, Jafferji M, et al. Antigen experienced t cells from peripheral blood recognize p53 neoantigenstp53-specific t cells from pbl. Clin Cancer Res (2020) 26:1267–76. doi: 10.1158/1078-0432.CCR-19-1874
53. Lahman MC, Schmitt TM, Paulson KG, Vigneron N, Buenrostro D, Wagener FD, et al. Targeting an alternate wilms’ tumor antigen 1 peptide bypasses immunoproteasome dependency. Sci Trans Med (2022) 14:eabg8070. doi: 10.1126/scitranslmed.abg8070
54. Saura-Esteller J, De Jong M, King LA, Ensing E, Winograd B, De Gruijl TD, et al. Gamma delta t-cell based cancer immunotherapy: Past-present-future. Front Immunol (2022) 13(915837):2649. doi: 10.3389/fimmu.2022.915837
55. O’Reilly RJ, Prockop S, Hasan AN, Koehne G, Doubrovina E. Virus-specific t-cell banks for’off the shelf’adoptive therapy of refractory infections. Bone marrow Transplant (2016) 51:1163–72. doi: 10.1038/bmt.2016.17
56. Fowler K, Mucha J, Neumann M, Lewandowski W, Kaczanowska M, Grys M, et al. A systematic literature review of the global seroprevalence of cytomegalovirus: possible implications for treatment, screening, and vaccine development. BMC Public Health (2022) 22:1–15. doi: 10.1186/s12889-022-13971-7
57. Xie Y, Parekh J, Tang Z, Wu D, Wu X. Donor-specific antibodies and primary graft failure in allogeneic hematopoietic stem cell transplantation: a systematic review and meta-analysis. Transplant Cell Ther (2021) 27:687–e1. doi: 10.1016/j.jtct.2021.04.030
Keywords: coverage, HLA, NK, T cell, model, therapies, frequencies, allogeneic
Citation: Israeli S, Krakow EF, Maiers M, Summers C and Louzoun Y (2023) Trans-population graph-based coverage optimization of allogeneic cellular therapy. Front. Immunol. 14:1069749. doi: 10.3389/fimmu.2023.1069749
Received: 14 October 2022; Accepted: 28 March 2023;
Published: 05 May 2023.
Edited by:
Raluca Eftimie, University of Franche-Comté, FranceReviewed by:
Enrico Maffini, University of Bologna, ItalyCopyright © 2023 Israeli, Krakow, Maiers, Summers and Louzoun. This is an open-access article distributed under the terms of the Creative Commons Attribution License (CC BY). The use, distribution or reproduction in other forums is permitted, provided the original author(s) and the copyright owner(s) are credited and that the original publication in this journal is cited, in accordance with accepted academic practice. No use, distribution or reproduction is permitted which does not comply with these terms.
*Correspondence: Yoram Louzoun, bG91em91eUBtYXRoLmJpdS5hYy5pbA==
†These authors have contributed equally to this work
Disclaimer: All claims expressed in this article are solely those of the authors and do not necessarily represent those of their affiliated organizations, or those of the publisher, the editors and the reviewers. Any product that may be evaluated in this article or claim that may be made by its manufacturer is not guaranteed or endorsed by the publisher.
Research integrity at Frontiers
Learn more about the work of our research integrity team to safeguard the quality of each article we publish.