 Yao Zhi
 Mingqian Li
 Guoyue Lv
94% of researchers rate our articles as excellent or good
Learn more about the work of our research integrity team to safeguard the quality of each article we publish.
Find out more
REVIEW article
Front. Immunol., 31 January 2023
Sec. Alloimmunity and Transplantation
Volume 14 - 2023 | https://doi.org/10.3389/fimmu.2023.1058296
This article is part of the Research TopicRising Stars in Alloimmunity and Transplantation 2021View all 7 articles
T cells are the common type of lymphocyte to mediate allograft rejection, remaining long-term allograft survival impeditive. However, the heterogeneity of T cells, in terms of differentiation and activation status, the effector function, and highly diverse T cell receptors (TCRs) have thus precluded us from tracking these T cells and thereby comprehending their fate in recipients due to the limitations of traditional detection approaches. Recently, with the widespread development of single-cell techniques, the identification and characterization of T cells have been performed at single-cell resolution, which has contributed to a deeper comprehension of T cell heterogeneity by relevant detections in a single cell – such as gene expression, DNA methylation, chromatin accessibility, surface proteins, and TCR. Although these approaches can provide valuable insights into an individual cell independently, a comprehensive understanding can be obtained when applied joint analysis. Multi-omics techniques have been implemented in characterizing T cells in health and disease, including transplantation. This review focuses on the thesis, challenges, and advances in these technologies and highlights their application to the study of alloreactive T cells to improve the understanding of T cell heterogeneity in solid organ transplantation.
Transplantation is the most effective treatment for various types of end-stage organ failure (1–5). The primary barrier to successful transplantation is rejection. Alloreactive T cells are key mediators of allograft rejection (6–10). T cells possess high heterogeneity, which leads to distinct function and migration features, making it difficult to further dissect T cells’ cellular and molecular features in depth.
The heterogeneity of T cells stems from multiple molecular layers including DNA, RNA, and protein. Thus, the heterogeneity can be interpreted with epigenomic, transcriptomic, and proteomic data. And highly polymorphic TCRs represent a diverse antigen specificity of the T cell repertoire. Previous studies devoted to investigating these heterogenous T cells through traditional assays like flow cytometry but had limited success. Recently, with the advance of single-cell RNA sequencing (scRNA-seq), it is easy to measure the genes’ expression levels of each cell and unbiasedly characterize T cell types at the transcriptional level (11, 12). Based on transcriptome analyses, multi-omics methods have been extended from single-cell techniques, such as the combination of the transcriptome with epigenome, paring transcriptome with the proteome, and linking transcriptome with TCR. Besides, the advanced bioinformatics analysis algorithm for multi-omics datasets (13) enables the profiling of T cells’ heterogeneity from integrative data (14–18). Therefore, this review focuses on the high heterogeneity and diverse TCR of T cells and summarizes the advances of omics techniques in solid organ transplantation (SOT), and their combined application to dissect the heterogeneity of T cells. Furthermore, it discusses the promising future of multi-omics integration analysis and computational tools for complex omics data integration and analysis.
T cells possess phenotypic and functional heterogeneity. T cells expressing distinct surface markers indicate distinct subtypes and functions. The CD45RA, CD45RO, CD28, CD27, CD95 along with the homing and adhesion molecules CD62L, CCR7, CD69, CD103, CXCR5, CXCR3, CCR4, CCR6 expressions are well-established markers for T cell distinction. For example, CD45RA+CCR7+ cells, referred to naive T cells, representing not encounter any antigens. CD45RA+CCR7+CD27+CD95+ cells were termed TSCM, they have the potential to reconstitute the memory and effector subtypes as well as sustain longevity through self-renewal (19). The main function of central memory T (TCM) cells with a signature of CD45RA-CCR7+ is proliferation instead of the effector, they exhibit lymphoid homing profiles. CCR7- cells represent effector memory T (TEM) cells, exhibiting rapid effector functions. Tissue-resident memory T (TRM) cells express CD69, CD103, or CXCR6, parking within tissue instead of circulating. CD4+CXCR5+ T cells are termed T follicular helper (Tfh) cells, which are adept at providing help to the differentiation of B cells. The Th1 cells (CD4+CXCR3+) are considered the main driver of acute rejection. Th1 secrets IL-2 and IFN-γ to activate the CD8 cytotoxic T cell or B cells (20), or directly damage the graft through the Fas-FasL pathway (21). The Th1 and Th2 (CD4+CCR4+) are antagonistic, the cytokine IL-4 and IL-10 produced by the Th2 inhibit the Th1 differentiation. Enhance, Th2 cell has long been thought to have a prevention role on rejection, but recent studies evident a promotion role of the cell in the rejection (22–24). A large body of evidence demonstrates the Th17 cells (CD4+CCR4+CCR6+CXCR3-) are important in transplant rejection by secreting the IL-1 7 to recruit the neutrophils to cause graft damage (25–27). Intracellular genetic markers can also be utilized to dissect T cells’ heterogeneity and function. For transcriptome, resting cells have a signature of SELL, TCF7, and CCR7, which corresponds to TCM or naive T cells. The activated cells express cytotoxicity-associated genes, such as GZMB, GZMK, and CCL5, referred to as TEM or effector T cells (Teff). TRM cells express adhesion molecules like CXCR6 and ITGA, contributing to residence (28). RNA detections reveal the T cells’ current state, but epigenetic features demonstrate the T cells’ progenitor and potential to drive the expression of specific genes (29).
At the initial stage of activation, naive T cells possess plasticity, which means the capacity to produce different phenotypes initiated from an individual genome (30). In alloresponse, the plasticity of a naive T cell, mainly regulated by epigenetics, refers to the ability to differentiate to other T cell subsets in response to the alloantigen. This means naive T cells present unique chromatin landscape and gene expression patterns before alloantigen recognition, which can alter with activation. Upon interacting with external factors like dose and properties of alloantigen, effects of immunosuppressive regimens, and local microenvironment, activated naive T cells differentiate into multiple lineages and display distinct properties of longevity, proliferative ability, properties of tissue residency or migratory (31, 32) (Figure 1A). In the setting of alloresponse, a naive T cell activated by an alloantigen would differentiate into short-lived effectors and long-term survival of memory cells. The memory cells are located in the lymph node (TCM), in the peripheral (TEM), and in the peripheral non-lymphoid tissues (TRM). In kidney and liver transplantation, the memory T cell proportion increased in the blood, graft, and lymph node of the rejected recipient (33, 34). And the donor-reactive TRM clones dominated in the transplanted intestine correlated with graft rejection, and they re-express high levels of CD28 upon rejection (35), implying that a likely intermediate state between TRM and Teff cells is associated with rejection. A naive CD4 T cell differentiates into many lineages of T helper cells upon the TCR stimulation controlled by the respective transcription factors under unique cytokine-polarized milieus: IL-12 and IFN-γ promote the Th1 differentiation with the activation of the master regulator transcription factor T-bet through STAT4; the IL-4 and IL-33 promote the activation of STAT6 and GATA3, which induce Th2 cell differentiation; TGF-β and proinflammatory cytokines IL-6 and IL-23 drive the differentiation of Th17 cells through the activation of STAT3 and RORγt; TGF-β promotes the induction of Tregs, which are controlled by the transcription factor Foxp3 (20, 36, 37). The plasticity of the CD4 helper cell usually refers to the fate alterations between the Th1 and Th2, and the Th17 and Treg, which stems from the epigenetic modification of histones and DNA regulated by the lineage-restricted transcription factors (38).
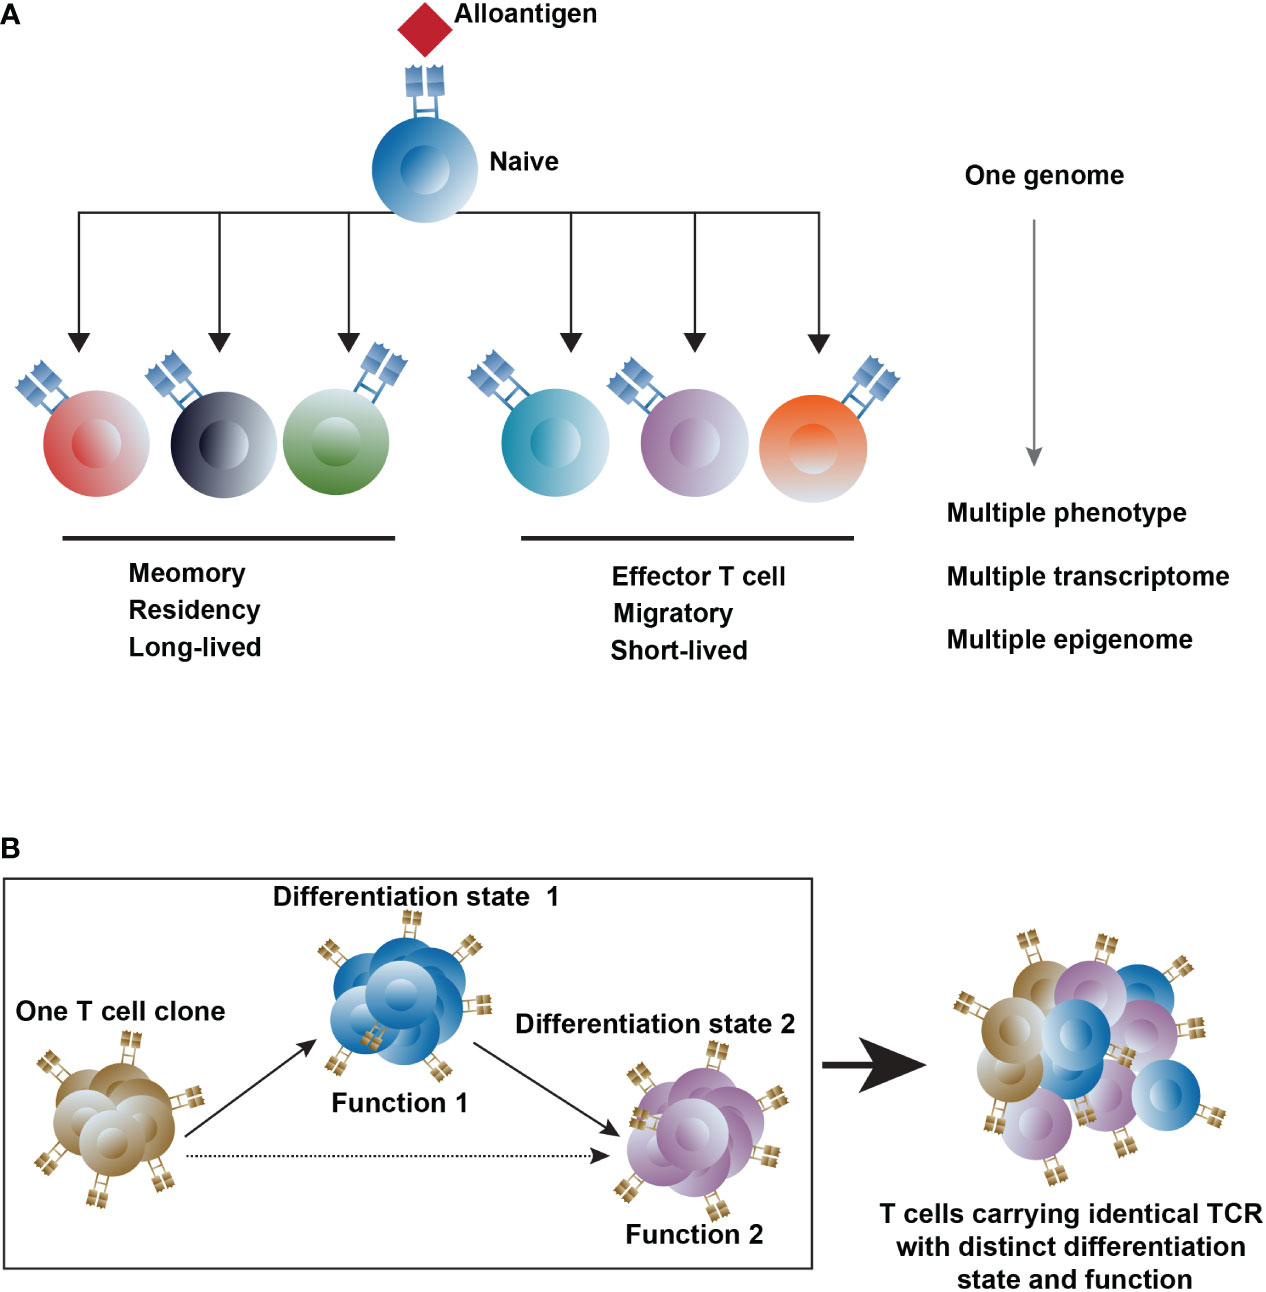
Figure 1 The heterogeneity of T cells. (A) T-cell differentiation states are regulated by epigenetics upon interacting with external factors (B) Trace the T cell clones with different differentiation states and functions after transplantation. Differentiation state1, 2 represents different differentiation states, and Function1, 2 represents T cells with a different function. The dashed line represents the potential differentiation pathway.
Another ingredient of heterogeneity within T cells is TCR diversity, which is yielded in different ways, including somatic rearrangements of V, (D), and J gene segments, random addition or deletion of nucleotides, and pairing of α and β TCR chains (39). In αβ T cells, both TCR α and TCR β chain contain a hypervariable complementary determining region 3 (CDR3) formed by somatic recombination and nucleotide insertions, leading to highly diverse TCR. Approximately 2 × 10¹⁹ unique TCR pairs can be generated theoretically (40–43), while only 2 × 10¹¹ T cells exist in an individual because of the positive and negative selection processes (44–46). A large repertoire of T cells with diverse antigen-specificity in organisms allows the immune defense to deal with pathogen infection through non-self-antigen recognition (47, 48). When stimulated by antigens, each T cell clone can expand into multiple progeny cells carrying the identical TCR but may with distinct differentiation states and functions (49, 50). Alloreactive T cells comprise about 10% of the blood-circulating T cell pool in healthy adults (51, 52). After transplantation, the recognition of alloantigen leads to the activation and clonal expansion of alloreactive T cells. Thus, the TCR is a meaningful proxy for tracking the T cells in alloresponse, and profiling the heterogeneity of T cell-mediated alloresponse (53–58) (Figure 1B).
T cells coordinate with each other exhibiting a complex effect in graft rejection. Alloantigen-specific T cells exhibited different effector mechanisms, including direct cytotoxicity to the allograft and indirect recruitment of graft-damaging inflammatory cells, and production of inflammatory cytokine (59). Resolving the complex process involving T cells with heterogeneity is not possible with the traditional bulk-seq approach, but the recently emerged scRNA-seq technique might be even better (60, 61). By profiling the cell with scRNA-seq technology, specific T cell clusters or genes related to the rejection in liver, kidney, lung, and intestinal transplantation have been reported (62, 63).
Heterogenous T cells with different functions in graft can be dissected by scRNA-seq. In chronic kidney transplantation, Zhao et al. (60). used scRNA-seq to study T cells from biopsy samples and four clusters were identified, including CD4+ T cells, CD8+ T cells, cytotoxic T lymphocytes (CTLs), and regulatory T cells (Tregs). Furthermore, they demonstrated that CD8+ T cells and cytotoxic T lymphocytes (CTLs), usually as a signature of immune activation, were more enriched in the chronic kidney transplant rejection biopsy samples. By ssGSEA analysis of the single cell transcriptomes, they revealed CD8+ and CTLs exhibited higher cytotoxic activities by enhanced interferon (IFN) secreting, antigen presentation, and producing cytokines and chemokine, while IFN was downregulated in Tregs. In this study, the memory T cell was not characterized separately from other T cells, and the cell origin from the donor or recipient was undefined.
Single-cell transcriptome profiling enables determining the function of T cells from the recipient and donor accurately. It is common knowledge that multilineage blood chimerism often develops and hematopoietic chimerism can serve as an approach to achieve immunological tolerance across HLA barriers in patients after transplantation (64–66). Previously, due to a lack of accessible approaches to distinguish recipient and donor cells at the individual level, the persistence of chimerism within recipients after transplantation and its role in allograft were investigated in limited depth. In kidney transplantation Malone et al. (67). accurately determined the cell origin based on expressed single nucleotide polymorphisms sequenced by whole exome sequence from the biopsy sample derived from the recipient and donor. Based on these results, they furtherly described the results of scRNA-seq analysis and revealed that donor T cells are predominantly quiescent, determined by a high correlation between donor-origin T cells in rejecting biopsies and non-rejecting T cell transcripts. Conversely, the T cell of recipient origin takes an effector role, especially those with acute cellular rejection.
A human lung TRM generation study employed scRNA-seq to analyze serial airway samples obtained longitudinally from human leukocyte antigen (HLA)–disparate lung transplant recipients. They distinguish the origin of T cells from donor and recipient, and found the donor-origin TRM replaced by recipient circulating T cell in lung-graft, the bronchoalveolar lavage T cells from the transplant lung revealed three different subsets: A) a donor mature TRM subset expressing CD69 and CD103 expressed high levels of TRM differentiation genes including ITGA1, CXCR6, ZNF683, and RUNX3, these cells exhibited effector function via expressing GZMA, NKG7, CCL5, KLRD1, PFN1, CD27, and IL32; B) a TRM-like subset comprising of mixed cells originating from donor and recipient retained expression of TRM signatures, the subpopulation was fewer in number compared with TRM subset, and expressed differentiation-associated genes SOX11 and CDH6 (68, 69); C) a non-TRM subpopulation absent of CD69 and CD103 expression constituted by recipient T cells reduced the expression of tissue resident and effector-associated genes, and increased the expression of regulation-associated with genes such as RPL13, PABPC1 and MLLT3, cell cycle (BTG1), and cytokine signaling (IL7R and JAK3) (70). It suggested that TRM in the lung is heterogeneous in phenotype, circulating ability, and effector function. Analysis of the longitudinal samples suggested that the TRM pool in the graft was supplied by the recipient circulating T cells over months, while the persistence of donor TRM is associated with fewer primary graft dysfunction and acute cellular rejection. But the exact role of TRM in alloresponse is unrevealed in this study.
As an important part of the memory T cell populations in organs, TRM participation in the alloresponse was elegantly described in intestine transplantation. Zuber et al. demonstrated a slow replacement of donor-derived graft-versus-host (GVH) TRM by recipient host-versus-graft (HVG) T cell correlated with the absence of rejection and the long-term presence of macrochimerism in the recipient’s blood by bulk RNA-seq (35). The result proposed that a balance between GVH and HVG reactivities is associated with tolerance induction, but the GVH TRM function in the graft was unable to be revealed by the method simply comparing the frequency of both clones. Later, by using scRNAseq, Fu et al. found the GVH T cell clones, originating from TRM in the transplanted intestine, displayed cytotoxic Teff transcriptional profile in the recipient’s bone marrow, indicating they mediated lymphohematopoietic GVH responses to promoted engraftment of graft-derived hematopoietic stem progenitor cells that maintain macrochimerism to facilitate tolerance (71).
T cells can acquire specialized functions after interacting with alloantigens despite emerging from the same genetic background, which is believed to be driven by epigenetic alterations. Thus, interpreting the epigenome specific to alloreactive T cells is crucial to comprehend the activation and differentiation of these T cells in SOT. The epigenome regulates gene transcription mainly by DNA methylation and modification of chromatin status.
DNA methylation, involved in establishing and sustaining chromatin structure and regulating gene transcription, is a covalent alteration of the DNA molecule which is stable and heritable. Many studies have emphasized the significance of DNA methylation in regulating intricate gene expression patterns in immune response (72, 73). Two methods have been achieved to explore intercellular heterogeneity of DNA methylation at single-cell resolution. One is single-cell bisulfite sequencing (scBS-seq) (74) which detects genome-wide DNA methylation. Another is single-cell reduced representation bisulfite sequencing (scRRBS-seq) (75) which enriches sites containing high CpG content. Based on the genome and transcriptome sequencing (G&T-seq) approach (76) allowing for physical isolation of DNA and RNA from single-cell lysates, Single-cell methylome and transcriptome sequencing (scM&T-seq) (77) enables joint analysis of the intricate relationship between DNA methylation and transcription in heterogenous cell subtypes. Recently, a tumor study observed that DNA methylation participates in shaping tumor-reactive and bystander CD8+ tumor-infiltrating lymphocytes which refers to a subpopulation of T cells recognizing and destroying tumor cells specifically and recognizing a wide range of epitopes unrelated to the tumor, respectively (78).
For the assessment of chromatin status, assays for transposase-accessible chromatin sequencing (ATAC-seq) could be used to measure the genomic sequences’ accessibility, which represents particular genes’ expression or sequences’ openness, such as the binding regions for transcription factors or enhancers, and is considered a hallmark of genomic activity. In the ATAC-seq, the open chromatin region can be labeled with sequencing adaptors via the Tn5 transposase, amplified via PCR, and then sequenced (79–81) (Figure 2A). Single-cell ATAC-seq (scATAC-seq) can be performed on several single-cell platforms, such as C1 and Chromium systems. The C1 platform is based on the microfluidic plate system and thus all library preparation steps including cell lysis and PCR amplification is automatic (80). However, the Chromium system is based on the microfluidic droplet, in which the isolation of nuclei and the tagmentation of Tn5 must be prepared manually before separation in droplets. ATAC-seq has higher throughput compatibility than other DNA methylation measurement approaches. Generally, high-throughput ATAC-seq approaches are dependent on the label of accessible chromatin when preparing nuclei in bulk before linking the labeled DNA and RNA with identical barcodes from the same cell, either by droplet-based or combinatorial indexing techniques which is a method to increase throughput by serial barcoding pools loaded with cells. For instance, single-cell combinatorial indexing-chromatin accessibility and RNA sequencing (sci-CAR) (Figure 2B) (82) used combinatorial indexing to measure > 11000 nuclei in each test. Lower throughput approaches, processing complete cells instead of nuclei, have been illustrated, such as scCAT-seq (83) and ASTAR-seq (84)). They have the potential to be more feasible for assays in which scarce cells are to be sequenced compared to high throughput assays.
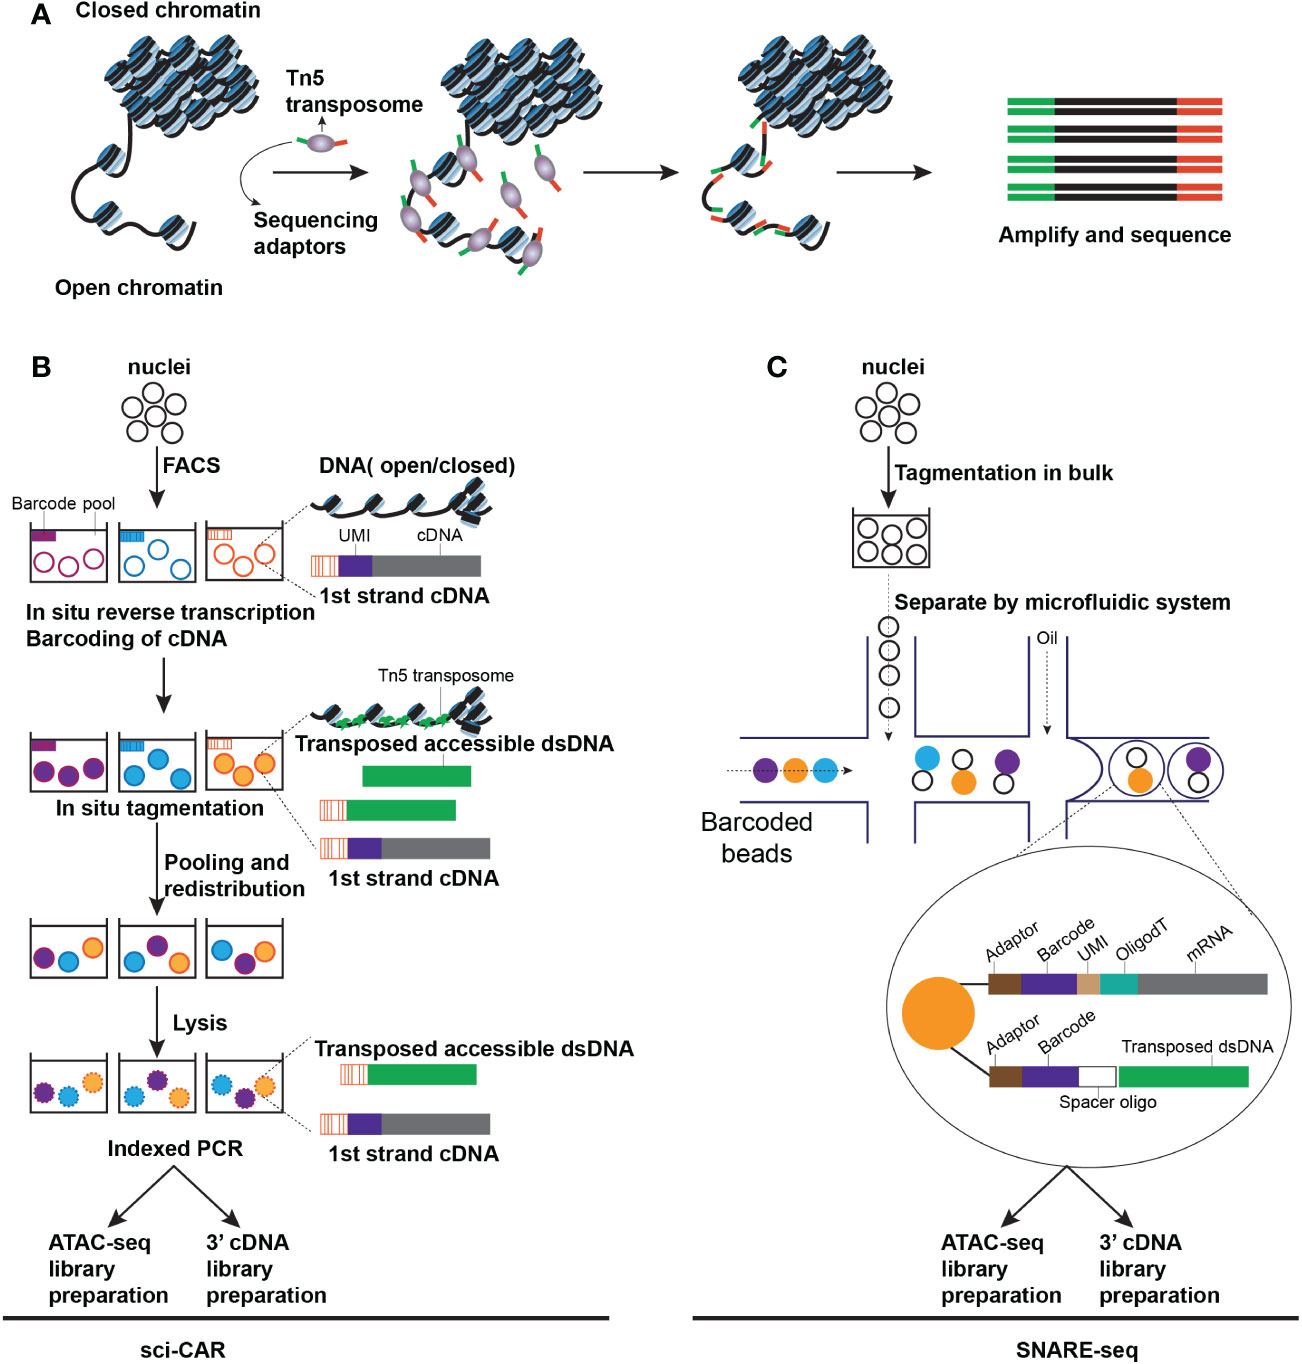
Figure 2 Techniques for capturing chromatin accessibility from an individual cell. (A) The schematic of ATAC-seq. Open chromatin regions can be inserted by transposome and generate fragments that can be amplified by PCR (B) The schematic of sci-CAR seq. All nuclei are extracted and distributed by Fluorescence-activated Cell Sorting (FACS) to each pool. A first cDNA sequence can be introduced by reverse transcription with a pool-specific Barcode and a unique molecular identifier (UMI). After barcoding cDNA, a first transposed dsDNA sequence is introduced by Tn5 transposase in situ tagmentation assay, bearing a pool-specific barcode. Then redistributed nuclei, each of them is lysed, and the lysate is split into two parts, one half prepares for the library of 3’ cDNA, another half prepares for the library of ATAC-seq (C). The schematic of SNARE-seq. A microfluidic system has been applied in SNARE-seq and enabled parallel capture of transcriptome and chromatin accessibility from a single cell.
Paired sequencing (Paired-seq) has promoted throughput by adopting a combinatorial indexing protocol based on ligation, which measures one million nuclei in each test. Based on paired-seq, the combinatorial indexing technique sensitivity was enhanced considerably with split-pool ligation-based transcriptome sequencing (SPLiT-seq) (85) and simultaneous high-throughput ATAC and RNA expression with sequencing (SHARE-seq) (86), designed to detect the chromatin potential from a single cell and investigate the predictive effect of chromatin accessibility on mRNA expression levels and lineage determination in a cell. Based on the microfluidic drop-sequencing technique, single-nucleus chromatin accessibility and mRNA-expression sequencing (SNARE-seq) can execute the parallel measurement of chromatin accessibility and gene expression from identical nuclei (Figure 2C) (87). 10X Genomics Chromium platform has adopted this technique using hydrogel beads carrying divided oligonucleotides capturing the labeled genome and mRNA. Recently, based on the sequencing HEteRO RNA-DNA-hYbrid (SHERRY) (88) technique and a similar technique, in situ sequencing hetero RNA-DNA-hybrid after assay for transposase-accessible chromatin-sequencing (ISSAAC-seq) (89), as an optional approach for multi-omics sequencing of a single nucleus, tags the accessible chromatin at the first round followed by reverse transcription and tags DNA-RNA hybrids at the second round. For this approach, single nuclei are separated by microfluidic apparatus, and DNA and RNA libraries are built separately through the difference between two-step adaptor configurations.
The αβ TCR interacting with intrathymic MHC determines the fate of double positive (DP) thymocytes which express both CD4 and CD8 molecules (90, 91). DP cells moderately affinitive for self-MHC peptides can survive positive selection and differentiate into CD4+ and CD8+ single positive (SP) cells (92, 93). On the contrary, DP cells highly affinitive for intrathymic ligands die of negative selection or part of them become “agonist-selected” cells, such as regulatory T cells (Treg) or precursors of CD8α+CD8β–(CD8αα) gut intra-epithelial lymphocytes (94–96). These heterogenous thymocyte populations are poorly characterized, in part because of an incomplete understanding of underlying differentiation programs. Combining scATAC-seq with scRNA-seq enables analyzing T cell transcriptional heterogeneity from the perspective of differentiation and development. Compared with traditional RNA-seq analysis (97, 98), single-cell analysis of transcriptional and chromatin accessibility delineates trajectories with minimal bias. Recently, a study focused on human and mouse αβ T cells in the thymus by examining their transcriptional expression and chromatin accessibility at the single-cell level. It depicted the transcriptomic and epigenomic landscape of αβ thymocytes in mouse and human thymus and delineated developmental trajectories of CD4+, CD8+ lineage, and “agonist-selected” thymocytes, which interprets the heterogeneity of thymocytes by integrating scRNA-seq and scATAC-seq (99).
In SOT, how epigenetics regulates the differentiation of alloreactive T cells remains unclear. A complete understanding of the development trajectory helps interpret T cells’ history and potential to express the specific gene. Thus, combining scATAC-seq with scRNA-seq is a potential way to help decode the heterogeneity of development and function dynamics of the alloreactive T cells after transplantation.
Determining the phenotype profile of T cells by measuring protein expression replenishes the scRNA-seq technique and defines T cell subpopulations more specifically because certain T cell type signatures are hardly measured with the transcriptome method. For example, solely with scRNA-seq, it is difficult to detect the surface proteins without an RNA analog (41), like CD45RO and CD45RA (the PTPRC gene’s isoforms) that distinguish T cell subsets with naive and memory T cells. It also provides little insight into markers that has high dropout at the RNA level by scRNA-seq alone, such as CD4 (100). Identifying CD4 T cells and distinguishing memory cells from naive cells by CD45RA and CD45RO are critical steps in cell subset determination. Thus, combining scRNA-seq with protein expression compensates for the transcriptomic shortcoming in immune cell phenotyping.
One approach termed proximity extension assay (PEA) (101) measures protein expression through antibodies tagged with oligonucleotides, which hybridize when in sufficient proximity. And unique sequence can be generated and can be further amplified and measured by qPCR. Hence, the measurement of protein in an individual cell is converted into the detection of nucleotide signals. In this approach, cell lysates were divided into two parts, one half is utilized to detect transcripts of interest by qPCR, and the other half is used to perform PEA (Figure 3). Furthermore, PEA is compatible with the current scRNA-seq platform and thus can be applied to produce proteomic and transcriptomic data even though the throughput is low. Proximity ligation assays (PLA) adopt a similar approach but are dependent on the ligation in which two antibody-conjugated oligonucleotides get into proximity on the same protein target, instead of hybridization. PLA enables simultaneous measurement of a single protein and corresponding transcript on a droplet digital PCR platform (102–104). The throughput of PLA has been increased by proximity ligation assay for RNA (PLAYR) by measuring transcripts and proteins using mass cytometry, capacitating the detection of > 40 distinct protein epitopes and transcripts from many cells simultaneously (105). Recently, a method named single-cell protein and RNA co-profiling (SPARC) can physically separate mRNA and protein solute (106), capacitating the parallel measurement of whole transcriptome and extracellular and intracellular proteins through PEA (107). The combination of oligonucleotides-conjugated antibodies with microfluidic platforms and micro-well systems, such as 10X Genomics and BD Rhapsody respectively, dramatically increased the throughput. Based on this approach, RNA expression and protein sequencing (REAP-seq) (100) and cellular indexing of transcriptomes and epitopes by sequencing (CITE-seq) (108) have emerged, in which cells are bonded with antibodies panel, each tagged with different barcode oligos enabling being simultaneously captured with mRNA from a single cell after lysis.
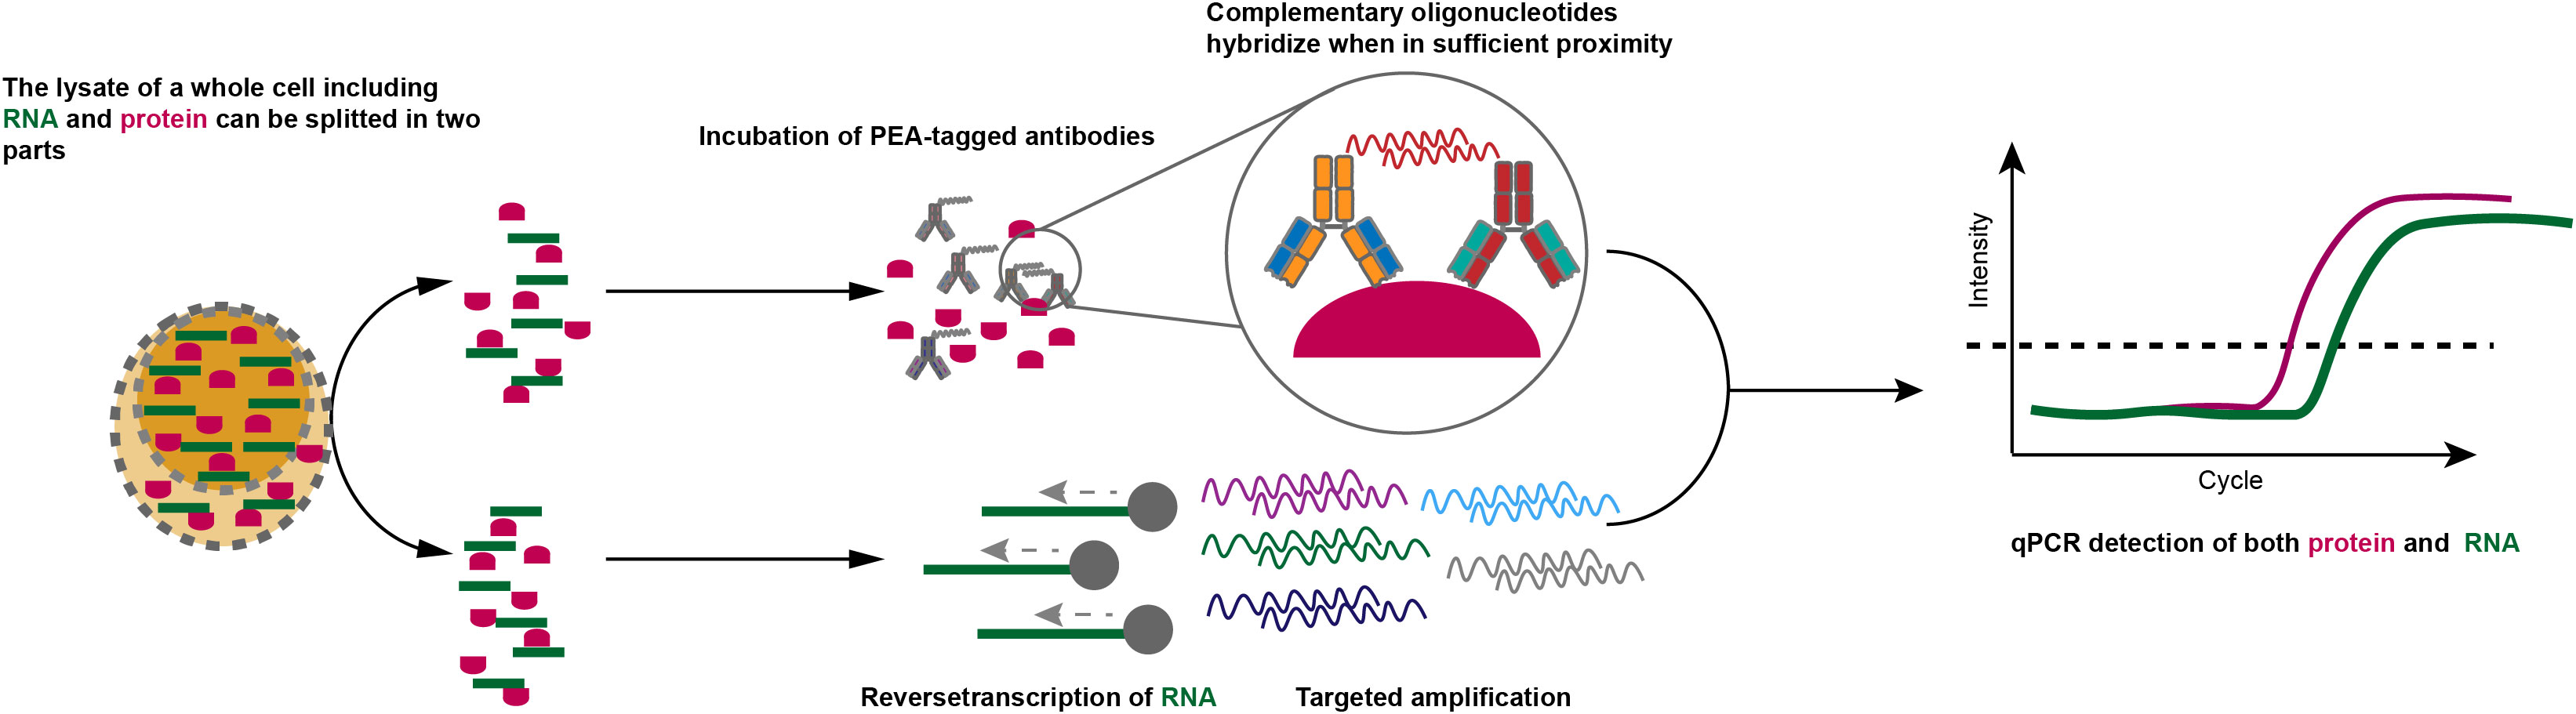
Figure 3 PEA approaches for transcriptome and proteome at single-cell resolution. The whole-cell lysis including RNA and protein can be separated into two parts: one is incubated with PEA antibodies for the measurement of specific proteins via qPCR and one is for quantification of cDNA by qPCR.
The limitation of antibody-based approaches is the feasibility of reagents specific to the antigen. Consequently, the number of detectable epitopes is extremely decreased as many antibodies specific to the antigen are required for its measurement. Thus, it is imperative to develop an antibody-independent approach to cover the cellular proteome extensively. Such an approach includes single-cell proteomics by mass spectrometry (SCoPE-MS) (109) and SCoPE2 (110), which can analyze several proteins and modify post-translation in an individual cell. However, they have not been integrated into the multi-omics technique. Most recently, antibodies used in those approaches discussed above have been replaced by the nanobody phage-display libraries in an optional method termed PHAGE-ATAC assay (111). It may provide a promising approach for measuring protein without needing antibodies.
By implementing high-throughput TCR sequencing (TCR-seq) techniques, the clonal frequencies and the diversity of alloresponse T cells’ repertoire were characterized and the alloresponse T cells’ repertoire is highly specific for a donor-recipient pair (51), and both the naïve and memory T cell clones lead to alloreactivity and can be detected in vitro (112, 113). Some pathogen-specific memory T cells possess the allogeneic function in a cross-react manner (114). In SOT cases, owing to the private property of the alloreactive clone repertoire in each donor-recipient pair, mixed lymphocyte reaction (MLR) assay, served as an approach to study donor-reactive T cells, giving an accessible way to identify and purify proliferating against alloantigen T cells labeled by CFSE, which can be sequenced by TCR-seq technique to identify the alloreactive clones (115). Combining MLR assay with the TCRβ-seq technique has been adopted to estimate alloresponse in various types of organ transplantation (116), including kidney transplantation (117), liver transplantation (118, 119), and intestinal transplantation (35, 71). The TCR-seq application in SOT has been recently reviewed (120).
Through TCR repertoire overlap analysis between pre-transplantation donor lymphoid tissue and post-transplantation peripheral blood monocular cells (PBMCs), circulating naive donor T cells derived from progenitors presented in the allograft could be proved to develop in the recipient thymus. Naive T cells’ repertoire is highly diverse, hindering the assessment of clonal overlap among various tissues within the same recipient (121); however, it is accessible to detect the clonal overlap of memory T cells. Based on this theory, in recipients receiving intestinal transplantation, Fu et al. (122) detected high enrichment of recent thymic emigrant (RTE) phenotypes and T cell receptor excision circles (TRECs) in donor-derived circulating CD45RA+CCR7+ T cells, which represents de novo generation of donor-derived T cells. Subsequently, they sorted donors’ naive and memory T-cells by Fluorescence-activated Cell Sorting (FACS) from the recipient following transplantation and donor lymphoid tissue from pre-transplantation and performed a high throughput CDR3 sequencing for these donor-derived T cells. They compared the TCR repertoire overlap of naive and memory T cells between pre- and post-transplantation and found post-transplantation T cell clones overlapping with those in pre-transplantation only among memory T cells. Thus, combing the lack of repertoire overlap with pre-transplantation naive T cells with the abundance of naive T cells’ RTEs and TRECs suggests that donor naive T cells originate from precursor cells in the allograft that develops de novo in the recipient after transplantation.
TCR repertoire analysis between the intragraft and the periphery reflects T cell migration and local expansion status. Intragraft and circulating T cell clonotypes differ substantially (123–125). In a liver graft and blood sample TCR comparison study, Elmar and his colleagues demonstrated that the TCR repertoires between the graft and the peripheral blood are different in non-rejected patients, while the correlation between rejected graft and blood was higher (126). A similar result was reported in cardiac transplantation, that a high degree of TCR repertoire overlap was found between cardiac allograft and the periphery in patients experiencing acute cellular graft rejection (112), these overlapped T cells were considered infiltrating T cells without apparent clonal expansion. Thus, the peripheral T cells massively infiltrating the graft cause rejection. As profiling, the entire peripheral blood TCR repertoire in patients with rejection or GVHD after liver transplant, the diversity and the N-addition length distribution of the CDR3 are associated with the diseases (118, 127, 128).
Defining a clone solely by the beta chain sequence with TCR-seq limits the accuracy of a clone definition. A study on cellular rejection after cardiac transplantation showed that a subset of T cell clones shared TCR repertoire between blood and tissues containing several public (present in unrelated healthy donors) clones suggesting their bystander status, and the study also showed that the shared TCR repertoire constituted by a subset of cross-reactive sequences (129), offering reasonable evidence for intragraft bystander T cell local response. However, the study just has the TCR beta chain sequenced and limit the capacity to track authentic clonality, discover antigen and determine the true alloreactivity. Thus, confirmation of appropriate TCR alpha and beta chain pairs at the single-cell level enables the confirmation of aiming peptides, either allo- or viral-reactive, or both.
The adoption of TCR sequencing in the context of scRNA-seq facilitates tracking the function of the alloreactive T cell at a single clone level among the total T cell pool. Indeed, approaches, including those sponsored by 10X Genomics and BD Biosciences, generate data on authentic clonality via pairing scRNA-seq with single-cell TCR-seq (scTCR-seq). The challenges of employing these techniques in distinguishing alloreactive TCR clones are the diversity of antigens and epitopes of the donor-recipient pairs. Using MLR to establish an alloreactive TCR library to distinguish the alloreactive clones and describe their function was performed in intestinal transplantation as mentioned in the above section (35, 71).
Additionally, to pair scTCR-seq with ATAC-seq, the method used is transcript-indexed ATAC-seq (T-ATAC-seq) (130). It accurately identifies TCR ligands and is a complementary approach to integrating the T cell epigenomic state with the TCR sequence (131, 132). Furthermore, it isolated single cells by the microfluidic approach after tagmentation of genomic DNA with Tn5. Next, it reverses transcribed the TCR mRNAs by exploiting primers aiming at the C region and underwent multiplex PCR amplification by inner primers specific for C and V sites. Simultaneously, it fragmented the ATAC-seq experience 5’ extension and amplified them through PCR. Furthermore, the T-ATAC-seq technique is capacitated to estimate the specificity mechanism and expanded T cells regulated by epigenetic elements, such as cis- and trans-acting factors. This joint analysis contributes to the discovery of alloantigens that drive T cell differentiation, or cis- and trans- regulators which regulate the expansion of a T cell clone. For instance, the epigenetic features of clonal T cells in malignant lymphoma were researched by this approach and it revealed that the epigenetic features have a potential to distinguish malignant T cell clonal expansion from benign (47, 130). This combined approach has not been employed in the SOT field. While simultaneous measurement of single-cell TCR sequence and epigenetic signatures is useful to interpret the alloreactive T cells’ differentiation and expansion kinetics regulated by epigenetics.
Multi-omics technologies at single-cell resolution were constructed to separate multiple molecules such as DNA, TCR, RNA, or protein in a single cell (133), and then sequence them in parallel. Because of the vast cellular heterogeneity of immune cells, a majority of multi-omics technologies with the single-cell resolution are supposed to be utilized to systematically analyze genome, transcriptome, proteome, epigenome, and ultimately, spatial transcriptome to measure the heterogeneity, thus offering more systematic and definite knowledge than mono-omics approaches (134). As an early example, ATAC with select antigen profiling by sequencing (ASAP-seq) (135) provides a method for performing ATAC- and CITE-seq in parallel on the microfluidic platforms. Additionally, a method referred to as DOGMA-seq was further expanded by incorporating RNA-seq measurements (135). A parallel method, TEA-seq (136), also has been demonstrated recently. From these studies, the data generated by different omics achieves high precision because they can validate mutually. Pairing different omics data, such as the data of scRNA-seq, scTCR-seq, and scATAC-seq can promote the interpretation of complicated regulatory mechanisms of diseases (137). Although few of these integration analyses have been used in the transplant immunology field, given the widespread use of these approaches in other realms such as cancer immunology, and biological development, multi-layers of omics will be a highly efficient tool in the study of organ transplantation.
The histologic information is missing in scRNA-seq. The emergence of spatial transcriptomics (ST) has made a breakthrough and it generates transcriptomic data on histological tissue sections. The greatest strength of the ST technique is that the spatial information of target cells can be acquired, such as T cells, and their cellular interactions can be investigated in their native location. Because scTNA-seq requires tissue to dissociate into a single cell suspension, limiting comprehension of cellular interactions, which is meaningful for T cells’ research. Combining ST with other omics, which matches the RNA profile of a cell with its spatial information within a tissue (138) is an optional way to make up for this shortcoming. Several approaches developed to integrate spatial heterogeneity with transcriptional heterogeneity in multicellular systems (139–142). In addition, the ST technique can match the transcriptomic data with its pathology report because it allows for the tissue slice stained by immunofluorescence or hematoxylin and eosin (H&E), which is before the determination of Banff criteria on the same slice. However, it has not been used in the transplant immunology field. Integrating ST approaches into multi-omics will locate the allogeneic T cells, and provide an intragraft immune landscape, to further allow a comprehensive understanding of the transcriptional and spatial regulation of T cells in the graft.
With the generation of various omics data, several methods have been developed to integrate these datasets. According to a recent review, these integration approaches can be grouped into three conceptual types: the first type can be termed “horizontal integration” (Figure 4A), integrating data generated from the same techniques across distinct samples. This integration method aims to remove technical noise, such as batch effects derived from different sample preparations, which ensures that the remaining variants originated from biology. For this step, many frequently-used methods, like Harmony (143), Scanorama (144), ComBat (145), LIGER (146), limma (147), scourge (148), and so on, have been developed and validated (149). The limitation in horizontal data integration is the difficulty to balance noise obliteration and biological signal retention, such as differential expression of the gene among cells. Because the extent of true biological signal from sample-to-sample variability and technical noise is hard to control. Too much removal of biological variation would result in a loss of information about cell type, but not enough removal of technical noise would result in a low biological signal-to-noise ratio.
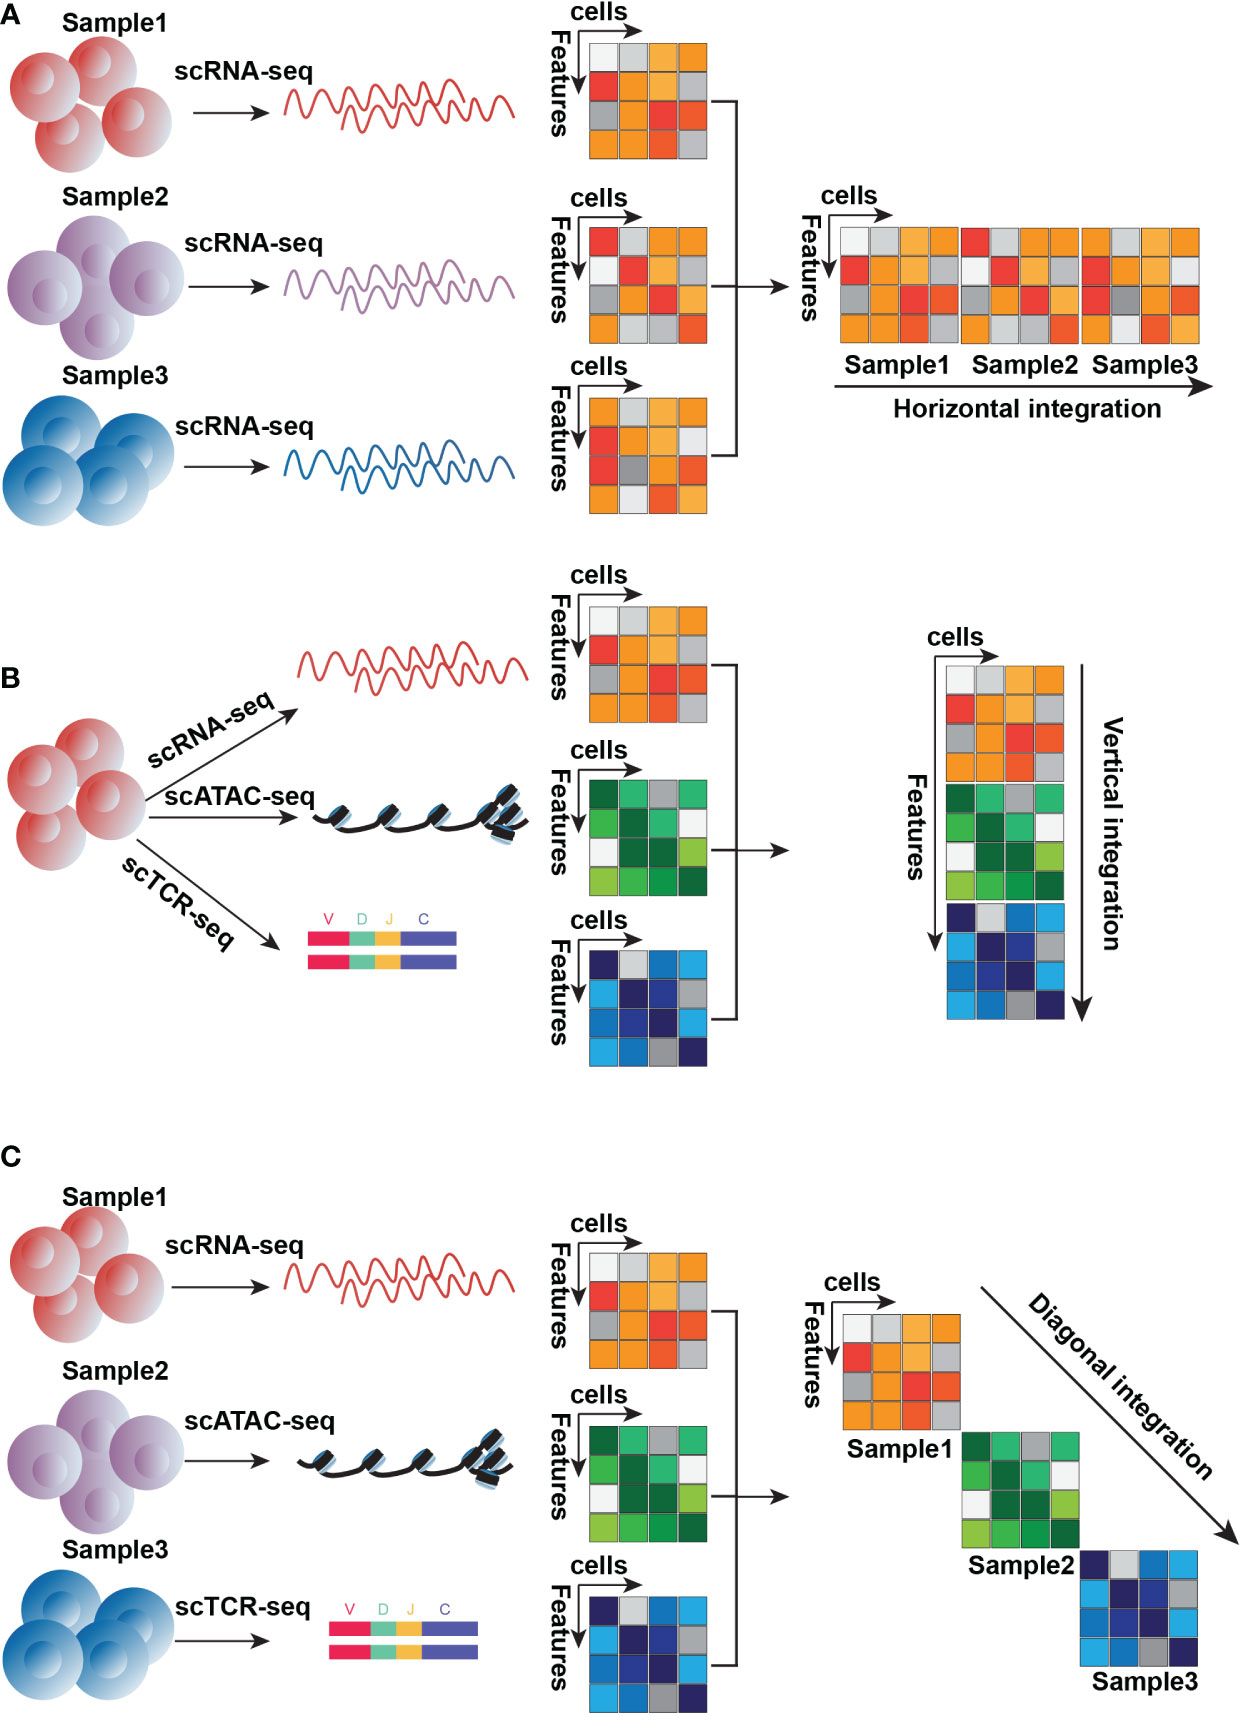
Figure 4 Three conceptual types of integration approaches. (A). The horizontal integration approach is designed for distinct samples detected by the same technique, here is an example of scRNA-seq (B). Vertical integration is suitable for subpopulations of the same sample detected by distinct techniques, here is an example of scRNA-seq, scATAC-seq, and scTCR-seq (C). Diagonal integration is designed to integrate different samples measured by different techniques, here is an example of scRNA-seq, scATAC-seq, and scTCR-seq.
The second type of integration approach is “vertical integration” (Figure 4B), which combines multi-omics data simultaneously profiled from an individual cell. This is exemplified by the abovementioned techniques such as scM&T-seq, CITE-seq, SNARE-seq, SHARE-seq, and scTCR-seq. Vertical data integration is to construct connections of different molecule layers and obtain knowledge from their relationship. For T cell research, the advantage of this integration method is to identify cell subtypes that might have one similar molecular layer but others different, such as cells that have similar transcriptional traits but distinct features from chromatin accessibility. For example, Buenrostro et al. used this integration strategy to analyze the alterations of transcriptomes and chromatin accessibility across stages of hematopoiesis, they identified a majority of cell subtypes based on transcriptomes but also epigenetic priming absent from the transcriptional level. Several methods originally developed for bulk data, can be applied for this integration, like canonical correlation analysis (CCA) (150), PLS (151), MF (152), MCIA (153), JIVE (154) and MOFA (152), which are based on the matrix factorization framework because of its concision, interpretability and low risk of overfitting.
The third type of integration method, “diagonal integration” (Figure 4C), is for joint analysis of multi-omics data generated by experiments where both cells and genomic traits are distinct. This integration is present in unmatched assays where distinct molecular layers are sequenced in distinct cell subtypes. Diagonal integration, from which biological views obtained have difficulty interpreting and validating, is more challenging compared to horizontal and vertical integration. Some methods have been developed to perform diagonal integration, such as MATCHER (155), MMD-MA (156), SCIM (157), and UnionCom (158)
At present, multi-omics profiling approaches at single-cell resolution continue to emerge at a horrendous pace. It generates different omics data in parallel for thousands of single cells by the latest approach termed “Omni-seq”, in which omics detections can be paired with spatial information and lineage-based knowledge to identify the T cells’ molecular state, localization in the microenvironment in a single readout (159). It is an important clue for studies of T cells’ development and migration biology in the context of transplantation. the T cell behavior and development and cell interaction networks will be uncovered to allow for the comprehensive understanding of the rejection and tolerance mechanism through multi-omic profiling technique.
However, several limitations exist in multi-omic profiling. The first is the imperfect analysis for each omics data due to noise, and especially, drop-out accompanied by single-cell measurements, which may lead to the lack of information about mutation, alteration, or subtle expression. The second is the concomitant loss of detail within each cell due to the development of methods by incorporating more than thousands of cells. With newer and newer omics measurements such as proteomic and metabolic sequencing being incorporated (160), details of each cell are lost. Therefore, it is imperative to refine these large number of already existing multi-omics methods to obtain higher resolution and accurately measure base-level events in the genome. The ongoing emergence of multi-omics profiling approaches enables the in-depth understanding of T cells in SOT.
YZ wrote the manuscript and designed the figures. GL and ML edited and revised the manuscript. All authors contributed to the article and approved the submitted version.
Grants from the Natural Science Foundation of China (grant numbers: 81901627 and U20A20360) will provide financial support for the open-access publication fees of this paper.
The authors declare that the research was conducted in the absence of any commercial or financial relationships that could be construed as a potential conflict of interest.
All claims expressed in this article are solely those of the authors and do not necessarily represent those of their affiliated organizations, or those of the publisher, the editors and the reviewers. Any product that may be evaluated in this article, or claim that may be made by its manufacturer, is not guaranteed or endorsed by the publisher.
1. Wang P, Jiang Z, Wang C, Liu X, Li H, Xu D, et al. Immune tolerance induction using cell-based strategies in liver transplantation: Clinical perspectives. Front Immunol (2020) 11:1723. doi: 10.3389/fimmu.2020.01723
2. George PM, Patterson CM, Reed AK, Thillai M. Lung transplantation for idiopathic pulmonary fibrosis. Lancet Respir Med (2019) 7(3):271–82. doi: 10.1016/S2213-2600(18)30502-2
3. Guglin M, Zucker MJ, Borlaug BA, Breen E, Cleveland J, Johnson MR, et al. Evaluation for heart transplantation and LVAD implantation: JACC council perspectives. J Am Coll Cardiol (2020) 75(12):1471–87. doi: 10.1016/j.jacc.2020.01.034
4. Courbage S, Canioni D, Talbotec C, Lambe C, Chardot C, Rabant M, et al. Beyond 10 years, with or without an intestinal graft: Present and future? Am J Transplant (2020) 20(10):2802–12. doi: 10.1111/ajt.15899
5. Alfaro R, Martinez-Banaclocha H, Llorente S, Jimenez-Coll V, Galian JA, Botella C, et al. Computational prediction of biomarkers, pathways, and new target drugs in the pathogenesis of immune-based diseases regarding kidney transplantation rejection. Front Immunol (2021) 12:800968. doi: 10.3389/fimmu.2021.800968
6. Kroger N. Preventing graft-Versus-Host disease without losing graft-Versus-Leukemia effect after allogeneic stem-cell transplantation. J Clin Oncol (2020) 38(29):3357–60. doi: 10.1200/JCO.20.01756
7. Marino J, Paster J, Benichou G. Allorecognition by T lymphocytes and allograft rejection. Front Immunol (2016) 7:582. doi: 10.3389/fimmu.2016.00582
8. Wood KJ, Goto R. Mechanisms of rejection: current perspectives. Transplantation (2012) 93(1):1–10. doi: 10.1097/TP.0b013e31823cab44
9. Hara M, Kingsley CI, Niimi M, Read S, Turvey SE, Bushell AR, et al. IL-10 is required for regulatory T cells to mediate tolerance to alloantigens in vivo. J Immunol (2001) 166(6):3789–96. doi: 10.4049/jimmunol.166.6.3789
10. Boix F, Trujillo C, Muro M. Cell-mediated immunity (CMI) as the instrument to assess the response against the allograft: Present and future. Curr Protein Pept Sci (2018) 19(11):1092–106. doi: 10.2174/1389203719666180730164542
11. Giladi A, Amit I. Immunology, one cell at a time. Nature (2017) 547(7661):27–9. doi: 10.1038/547027a
12. Linnarsson S, Teichmann SA. Single-cell genomics: coming of age. Genome Biol (2016) 17:97. doi: 10.1186/s13059-016-0960-x
13. Villani AC, Satija R, Reynolds G, Sarkizova S, Shekhar K, Fletcher J, et al. Single-cell RNA-seq reveals new types of human blood dendritic cells, monocytes, and progenitors. Science (2017) 356(6335):eaah4573. doi: 10.1126/science.aah4573
14. Trapnell C, Cacchiarelli D, Grimsby J, Pokharel P, Li S, Morse M, et al. The dynamics and regulators of cell fate decisions are revealed by pseudotemporal ordering of single cells. Nat Biotechnol (2014) 32(4):381–6. doi: 10.1038/nbt.2859
15. Paul F, Arkin Y, Giladi A, Jaitin DA, Kenigsberg E, Keren-Shaul H, et al. Transcriptional heterogeneity and lineage commitment in myeloid progenitors. Cell (2015) 163(7):1663–77. doi: 10.1016/j.cell.2015.11.013
16. Chu LF, Leng N, Zhang J, Hou Z, Mamott D, Vereide DT, et al. Single-cell RNA-seq reveals novel regulators of human embryonic stem cell differentiation to definitive endoderm. Genome Biol (2016) 17(1):173. doi: 10.1186/s13059-016-1033-x
17. Tirosh I, Venteicher AS, Hebert C, Escalante LE, Patel AP, Yizhak K, et al. Single-cell RNA-seq supports a developmental hierarchy in human oligodendroglioma. Nature (2016) 539(7628):309–13. doi: 10.1038/nature20123
18. Qiu X, Mao Q, Tang Y, Wang L, Chawla R, Pliner HA, et al. Reversed graph embedding resolves complex single-cell trajectories. Nat Methods (2017) 14(10):979–82. doi: 10.1038/nmeth.4402
19. Zhang Y, Joe G, Hexner E, Zhu J, Emerson SG. Host-reactive CD8+ memory stem cells in graft-versus-host disease. Nat Med (2005) 11(12):1299–305. doi: 10.1038/nm1326
20. Liu Z, Fan H, Jiang S. CD4(+) T-cell subsets in transplantation. Immunol Rev (2013) 252(1):183–91. doi: 10.1111/imr.12038
21. Jiang S, Herrera O, Lechler RI. New spectrum of allorecognition pathways: implications for graft rejection and transplantation tolerance. Curr Opin Immunol (2004) 16(5):550–7. doi: 10.1016/j.coi.2004.07.011
22. Chan SY, DeBruyne LA, Goodman RE, Eichwald EJ, Bishop DK. In vivo depletion of CD8+ T cells results in Th2 cytokine production and alternate mechanisms of allograft rejection. Transplantation (1995) 59(8):1155–61.
23. Zelenika D, Adams E, Mellor A, Simpson E, Chandler P, Stockinger B, et al. Rejection of h-y disparate skin grafts by monospecific CD4+ Th1 and Th2 cells: no requirement for CD8+ T cells or b cells. J Immunol (1998) 161(4):1868–74.
24. Barbara JA, Turvey SE, Kingsley CI, Spriewald BM, Hara M, Witzke O, et al. Islet allograft rejection can be mediated by CD4+, alloantigen experienced, direct pathway T cells of TH1 and TH2 cytokine phenotype. Transplantation (2000) 70(11):1641–9. doi: 10.1097/00007890-200012150-00017
25. Laan M, Cui ZH, Hoshino H, Lotvall J, Sjostrand M, Gruenert DC, et al. Neutrophil recruitment by human IL-17 via c-X-C chemokine release in the airways. J Immunol (1999) 162(4):2347–52.
26. Healy DG, Watson RW, O'Keane C, Egan JJ, McCarthy JF, Hurley J, et al. Neutrophil transendothelial migration potential predicts rejection severity in human cardiac transplantation. Eur J Cardiothorac Surg (2006) 29(5):760–6. doi: 10.1016/j.ejcts.2006.01.065
27. Rao DA, Eid RE, Qin L, Yi T, Kirkiles-Smith NC, Tellides G, et al. Interleukin (IL)-1 promotes allogeneic T cell intimal infiltration and IL-17 production in a model of human artery rejection. J Exp Med (2008) 205(13):3145–58. doi: 10.1084/jem.20081661
28. Szabo PA, Levitin HM, Miron M, Snyder ME, Senda T, Yuan J, et al. Single-cell transcriptomics of human T cells reveals tissue and activation signatures in health and disease. Nat Commun (2019) 10(1):4706. doi: 10.1038/s41467-019-12464-3
29. Hori S, Nomura T, Sakaguchi S. Control of regulatory T cell development by the transcription factor Foxp3. Science (2003) 299(5609):1057–61. doi: 10.1126/science.1079490
30. Pigliucci M, Murren CJ, Schlichting CD. Phenotypic plasticity and evolution by genetic assimilation. J Exp Biol (2006) 209(Pt 12):2362–7. doi: 10.1242/jeb.02070
31. Pace L. Temporal and epigenetic control of plasticity and fate decision during CD8(+) T-cell memory differentiation. Cold Spring Harb Perspect Biol (2021) 13(12):a037754. doi: 10.1101/cshperspect.a037754
32. Jameson SC, Masopust D. Understanding subset diversity in T cell memory. Immunity (2018) 48(2):214–26. doi: 10.1016/j.immuni.2018.02.010
33. Nadazdin O, Boskovic S, Murakami T, Tocco G, Smith RN, Colvin RB, et al. Host alloreactive memory T cells influence tolerance to kidney allografts in nonhuman primates. Sci Transl Med (2011) 3(86):86ra51. doi: 10.1126/scitranslmed.3002093
34. Kim H, Kim H, Lee SK, Jin XL, Kim TJ, Park C, et al. Memory T cells are significantly increased in rejected liver allografts of rhesus monkeys. Liver Transpl (2018) 24(2):256–68. doi: 10.1002/lt.24983
35. Zuber J, Shonts B, Lau SP, Obradovic A, Fu J, Yang S, et al. Bidirectional intragraft alloreactivity drives the repopulation of human intestinal allografts and correlates with clinical outcome. Sci Immunol (2016) 1(4):eaah3732. doi: 10.1126/sciimmunol.aah3732
36. Saravia J, Chapman NM, Chi H. Helper T cell differentiation. Cell Mol Immunol (2019) 16(7):634–43. doi: 10.1038/s41423-019-0220-6
37. Luckheeram RV, Zhou R, Verma AD, Xia B. CD4(+)T cells: differentiation and functions. Clin Dev Immunol (2012) 2012:925135. doi: 10.1155/2012/925135
38. Zhou L, Chong MM, Littman DR. Plasticity of CD4+ T cell lineage differentiation. Immunity (2009) 30(5):646–55. doi: 10.1016/j.immuni.2009.05.001
39. Clambey ET, Davenport B, Kappler JW, Marrack P, Homann D. Molecules in medicine mini review: the alphabeta T cell receptor. J Mol Med (Berl) (2014) 92(7):735–41. doi: 10.1007/s00109-014-1145-2
40. Mora T. WAM. How many different clonotypes do immune repertoires contain? Curr Opin Syst Biol (2019) 18:104–10. doi: 10.1016/j.coisb.2019.10.001
41. Davis MM, Bjorkman PJ. T-Cell antigen receptor genes and T-cell recognition. Nature (1988) 334(6181):395–402. doi: 10.1038/334395a0
42. Nikolich-Zugich J, Slifka MK, Messaoudi I. The many important facets of T-cell repertoire diversity. Nat Rev Immunol (2004) 4(2):123–32. doi: 10.1038/nri1292
43. Bradley P, Thomas PG. Using T cell receptor repertoires to understand the principles of adaptive immune recognition. Annu Rev Immunol (2019) 37:547–70. doi: 10.1146/annurev-immunol-042718-041757
44. Davis MM, Boyd SD. Recent progress in the analysis of alphabetaT cell and b cell receptor repertoires. Curr Opin Immunol (2019) 59:109–14. doi: 10.1016/j.coi.2019.05.012
45. Song Y, Zhu Y, Hu B, Liu Y, Lin D, Jin Z, et al. Donor gammadeltaT cells promote GVL effect and mitigate aGVHD in allogeneic hematopoietic stem cell transplantation. Front Immunol (2020) 11:558143. doi: 10.3389/fimmu.2020.558143
46. Qi Q, Liu Y, Cheng Y, Glanville J, Zhang D, Lee JY, et al. Diversity and clonal selection in the human T-cell repertoire. Proc Natl Acad Sci U.S.A. (2014) 111(36):13139–44. doi: 10.1073/pnas.1409155111
47. Pai JA, Satpathy AT. High-throughput and single-cell T cell receptor sequencing technologies. Nat Methods (2021) 18(8):881–92. doi: 10.1038/s41592-021-01201-8
48. Turner SJ, Doherty PC, McCluskey J, Rossjohn J. Structural determinants of T-cell receptor bias in immunity. Nat Rev Immunol (2006) 6(12):883–94. doi: 10.1038/nri1977
49. Taylor JJ, Pape KA, Steach HR, Jenkins MK. Humoral immunity. apoptosis and antigen affinity limit effector cell differentiation of a single naive b cell. Science (2015) 347(6223):784–7. doi: 10.1126/science.aaa1342
50. Tubo NJ, Pagan AJ, Taylor JJ, Nelson RW, Linehan JL, Ertelt JM, et al. Single naive CD4+ T cells from a diverse repertoire produce different effector cell types during infection. Cell (2013) 153(4):785–96. doi: 10.1016/j.cell.2013.04.007
51. DeWolf S, Grinshpun B, Savage T, Lau SP, Obradovic A, Shonts B, et al. Quantifying size and diversity of the human T cell alloresponse. JCI Insight (2018) 3(15):e121256. doi: 10.1172/jci.insight.121256
52. Suchin EJ, Langmuir PB, Palmer E, Sayegh MH, Wells AD, Turka LA. Quantifying the frequency of alloreactive T cells in vivo: new answers to an old question. J Immunol (2001) 166(2):973–81. doi: 10.4049/jimmunol.166.2.973
53. Dangi A, Yu S, Luo X. Emerging approaches and technologies in transplantation: the potential game changers. Cell Mol Immunol (2019) 16(4):334–42. doi: 10.1038/s41423-019-0207-3
54. Singh M, Al-Eryani G, Carswell S, Ferguson JM, Blackburn J, Barton K, et al. High-throughput targeted long-read single cell sequencing reveals the clonal and transcriptional landscape of lymphocytes. Nat Commun (2019) 10(1):3120. doi: 10.1038/s41467-019-11049-4
55. Perkel JM. Single-cell analysis enters the multiomics age. Nature (2021) 595(7868):614–6. doi: 10.1038/d41586-021-01994-w
56. Hao Y, Hao S, Andersen-Nissen E, Mauck WM, Zheng S, Butler A, et al. Satija: Integrated analysis of multimodal single-cell data. Cell (2021) 184(13):3573–87.e29. doi: 10.1016/j.cell.2021.04.048
57. Engel JA, Lee HJ, Williams CG, Kuns R, Olver S, Lansink LI, et al. Single-cell transcriptomics of alloreactive CD4+ T cells over time reveals divergent fates during gut graft-versus-host disease. JCI Insight (2020) 5(13):e137990. doi: 10.1172/jci.insight.137990
58. Zemmour D, Zilionis R, Kiner E, Klein AM, Mathis D, Benoist C. Single-cell gene expression reveals a landscape of regulatory T cell phenotypes shaped by the TCR. Nat Immunol (2018) 19(3):291–301. doi: 10.1038/s41590-018-0051-0
59. Ronca V, Wootton G, Milani C, Cain O. The immunological basis of liver allograft rejection. Front Immunol (2020) 11:2155. doi: 10.3389/fimmu.2020.02155
60. Liu Y, Hu J, Liu D, Zhou S, Liao J, Liao G, et al. Single-cell analysis reveals immune landscape in kidneys of patients with chronic transplant rejection. Theranostics (2020) 10(19):8851–62. doi: 10.7150/thno.48201
61. See P, Lum J, Chen J, Ginhoux F. A single-cell sequencing guide for immunologists. Front Immunol (2018) 9:2425. doi: 10.3389/fimmu.2018.02425
62. Babel N, Stervbo U, Reinke P, Volk HD. The identity card of T cells-clinical utility of T-cell receptor repertoire analysis in transplantation. Transplantation (2019) 103(8):1544–55. doi: 10.1097/TP.0000000000002776
63. Chen H, Ye F, Guo G. Revolutionizing immunology with single-cell RNA sequencing. Cell Mol Immunol (2019) 16(3):242–9. doi: 10.1038/s41423-019-0214-4
64. Scandling JD, Busque S, Dejbakhsh-Jones S, Benike C, Millan MT, Shizuru JA, et al. Tolerance and chimerism after renal and hematopoietic-cell transplantation. N Engl J Med (2008) 358(4):362–8. doi: 10.1056/NEJMoa074191
65. Zuber J, Sykes M. Mechanisms of mixed chimerism-based transplant tolerance. Trends Immunol (2017) 38(11):829–43. doi: 10.1016/j.it.2017.07.008
66. Kawai T, Leventhal J, Wood K, Strober S. Summary of the third international workshop on clinical tolerance. Am J Transplant (2019) 19(2):324–30. doi: 10.1111/ajt.15086
67. Malone AF, Wu H, Fronick C, Fulton R, Gaut JP, Humphreys BD. Harnessing expressed single nucleotide variation and single cell RNA sequencing to define immune cell chimerism in the rejecting kidney transplant. J Am Soc Nephrol (2020) 31(9):1977–86. doi: 10.1681/ASN.2020030326
68. Jiang Y, Ding Q, Xie X, Libby RT, Lefebvre V, Gan L. Transcription factors SOX4 and SOX11 function redundantly to regulate the development of mouse retinal ganglion cells. J Biol Chem (2013) 288(25):18429–38. doi: 10.1074/jbc.M113.478503
69. Gadi J, Jung SH, Lee MJ, Jami A, Ruthala K, Kim KM, et al. The transcription factor protein Sox11 enhances early osteoblast differentiation by facilitating proliferation and the survival of mesenchymal and osteoblast progenitors. J Biol Chem (2013) 288(35):25400–13. doi: 10.1074/jbc.M112.413377
70. Snyder ME, Finlayson MO, Connors TJ, Dogra P, Senda T, Bush E, et al. Generation and persistence of human tissue-resident memory T cells in lung transplantation. Sci Immunol (2019) 4(33):eaav5581. doi: 10.1126/sciimmunol.aav5581
71. Fu J, Zuber J, Shonts B, Obradovic A, Wang Z, Frangaj K, et al. Lymphohematopoietic graft-versus-host responses promote mixed chimerism in patients receiving intestinal transplantation. J Clin Invest (2021) 131(8):e141698. doi: 10.1172/JCI141698
72. Melvin AJ, McGurn ME, Bort SJ, Gibson C, Lewis DB. Hypomethylation of the interferon-gamma gene correlates with its expression by primary T-lineage cells. Eur J Immunol (1995) 25(2):426–30. doi: 10.1002/eji.1830250218
73. Komori HK, Hart T, LaMere SA, Chew PV, Salomon DR. Defining CD4 T cell memory by the epigenetic landscape of CpG DNA methylation. J Immunol (2015) 194(4):1565–79. doi: 10.4049/jimmunol.1401162
74. Smallwood SA, Lee HJ, Angermueller C, Krueger F, Saadeh H, Peat J, et al. Single-cell genome-wide bisulfite sequencing for assessing epigenetic heterogeneity. Nat Methods (2014) 11(8):817–20. doi: 10.1038/nmeth.3035
75. Guo H, Zhu P, Wu X, Li X, Wen L, Tang F. Single-cell methylome landscapes of mouse embryonic stem cells and early embryos analyzed using reduced representation bisulfite sequencing. Genome Res (2013) 23(12):2126–35. doi: 10.1101/gr.161679.113
76. Macaulay IC, Haerty W, Kumar P, Li YI, Hu TX, Teng MJ, et al. G&T-seq: parallel sequencing of single-cell genomes and transcriptomes. Nat Methods (2015) 12(6):519–22. doi: 10.1038/nmeth.3370
77. Angermueller C, Clark SJ, Lee HJ, Macaulay IC, Teng MJ, Hu TX, et al. Parallel single-cell sequencing links transcriptional and epigenetic heterogeneity. Nat Methods (2016) 13(3):229–32. doi: 10.1038/nmeth.3728
78. Yang R, Cheng S, Luo N, Gao R, Yu K, Kang B, et al. Distinct epigenetic features of tumor-reactive CD8+ T cells in colorectal cancer patients revealed by genome-wide DNA methylation analysis. Genome Biol (2019) 21(1):2. doi: 10.1186/s13059-019-1921-y
79. Buenrostro JD, Giresi PG, Zaba LC, Chang HY, Greenleaf WJ. Transposition of native chromatin for fast and sensitive epigenomic profiling of open chromatin, DNA-binding proteins and nucleosome position. Nat Methods (2013) 10(12):1213–8. doi: 10.1038/nmeth.2688
80. Buenrostro JD, Wu B, Litzenburger UM, Ruff D, Gonzales ML, Snyder MP, et al. Single-cell chromatin accessibility reveals principles of regulatory variation. Nature (2015) 523(7561):486–90. doi: 10.1038/nature14590
81. Corces MR, Buenrostro JD, Wu B, Greenside PG, Chan SM, Koenig JL, et al. Lineage-specific and single-cell chromatin accessibility charts human hematopoiesis and leukemia evolution. Nat Genet (2016) 48(10):1193–203. doi: 10.1038/ng.3646
82. Cao J, Cusanovich DA, Ramani V, Aghamirzaie D, Pliner HA, Hill AJ, et al. Joint profiling of chromatin accessibility and gene expression in thousands of single cells. Science (2018) 361(6409):1380–5. doi: 10.1126/science.aau0730
83. Liu L, Liu C, Quintero A, Wu L, Yuan Y, Wang M, et al. Deconvolution of single-cell multi-omics layers reveals regulatory heterogeneity. Nat Commun (2019) 10(1):470. doi: 10.1038/s41467-018-08205-7
84. Xing QR, Farran CAE, Zeng YY, Yi Y, Warrier T, Gautam P, et al. Parallel bimodal single-cell sequencing of transcriptome and chromatin accessibility. Genome Res (2020) 30(7):1027–39. doi: 10.1101/gr.257840.119
85. Rosenberg AB, Roco CM, Muscat RA, Kuchina A, Sample P, Yao Z, et al. Single-cell profiling of the developing mouse brain and spinal cord with split-pool barcoding. Science (2018) 360(6385):176–82. doi: 10.1126/science.aam8999
86. Ma S, Zhang B, LaFave LM, Earl AS, Chiang Z, Hu Y, et al. Chromatin potential identified by shared single-cell profiling of RNA and chromatin. Cell (2020) 183(4):1103–16.e20. doi: 10.1016/j.cell.2020.09.056
87. Macosko EZ, Basu A, Satija R, Nemesh J, Shekhar K, Goldman M, et al. Highly parallel genome-wide expression profiling of individual cells using nanoliter droplets. Cell (2015) 161(5):1202–14. doi: 10.1016/j.cell.2015.05.002
88. Lu B, Dong L, Yi D, Zhang M, Zhu C, Li X, et al. Transposase-assisted tagmentation of RNA/DNA hybrid duplexes. Elife (2020) 9:e54919. doi: 10.7554/eLife.54919
89. Xu W, Yang W, Zhang Y, Chen Y, Hong N, Zhang Q, et al. ISSAAC-seq enables sensitive and flexible multimodal profiling of chromatin accessibility and gene expression in single cells. Nat Methods (2022) 19(10):1243–9. doi: 10.1038/s41592-022-01601-4
90. Hogquist KA, Jameson SC. The self-obsession of T cells: how TCR signaling thresholds affect fate 'decisions' and effector function. Nat Immunol (2014) 15(9):815–23. doi: 10.1038/ni.2938
91. Stritesky GL, Jameson SC, Hogquist KA. Selection of self-reactive T cells in the thymus. Annu Rev Immunol (2012) 30:95–114. doi: 10.1146/annurev-immunol-020711-075035
92. Taniuchi I. CD4 helper and CD8 cytotoxic T cell differentiation. Annu Rev Immunol (2018) 36:579–601. doi: 10.1146/annurev-immunol-042617-053411
93. Xiong Y, Bosselut R. CD4-CD8 differentiation in the thymus: connecting circuits and building memories. Curr Opin Immunol (2012) 24(2):139–45. doi: 10.1016/j.coi.2012.02.002
94. McDonald BD, Jabri B, Bendelac A. Diverse developmental pathways of intestinal intraepithelial lymphocytes. Nat Rev Immunol (2018) 18(8):514–25. doi: 10.1038/s41577-018-0013-7
95. Ruscher R, Hogquist KA. Development, ontogeny, and maintenance of TCRalphabeta(+) CD8alphaalpha IEL. Curr Opin Immunol (2019) 58:83–8. doi: 10.1016/j.coi.2019.04.010
96. Li MO, Rudensky AY. T Cell receptor signalling in the control of regulatory T cell differentiation and function. Nat Rev Immunol (2016) 16(4):220–33. doi: 10.1038/nri.2016.26
97. Yoshida H, Lareau CA, Ramirez RN, Rose SA, Maier B, Wroblewska A, et al. The cis-regulatory atlas of the mouse immune system. Cell (2019) 176(4):897–912.e20. doi: 10.1016/j.cell.2018.12.036
98. Mingueneau M, Kreslavsky T, Gray D, Heng T, Cruse R, Ericson J, et al. The transcriptional landscape of alphabeta T cell differentiation. Nat Immunol (2013) 14(6):619–32. doi: 10.1038/ni.2590
99. Chopp LB, Gopalan V, Ciucci T, Ruchinskas A, Rae Z, Lagarde M, et al. An integrated epigenomic and transcriptomic map of mouse and human alphabeta T cell development. Immunity (2020) 53(6):1182–201.e8. doi: 10.1016/j.immuni.2020.10.024
100. Peterson VM, Zhang KX, Kumar N, Wong J, Li L, Wilson DC, et al. Multiplexed quantification of proteins and transcripts in single cells. Nat Biotechnol (2017) 35(10):936–9. doi: 10.1038/nbt.3973
101. Fredriksson S, Gullberg M, Jarvius J, Olsson C, Pietras K, Gustafsdottir SM, et al. Protein detection using proximity-dependent DNA ligation assays. Nat Biotechnol (2002) 20(5):473–7. doi: 10.1038/nbt0502-473
102. Darmanis S, Gallant CJ, Marinescu VD, Niklasson M, Segerman A, Flamourakis G, et al. Simultaneous multiplexed measurement of RNA and proteins in single cells. Cell Rep (2016) 14(2):380–9. doi: 10.1016/j.celrep.2015.12.021
103. Genshaft AS, Li S, Gallant CJ, Darmanis S, Prakadan SM, Ziegler CG, et al. Multiplexed, targeted profiling of single-cell proteomes and transcriptomes in a single reaction. Genome Biol (2016) 17(1):188. doi: 10.1186/s13059-016-1045-6
104. Stahlberg A, Thomsen C, Ruff D, Aman P. Quantitative PCR analysis of DNA, RNAs, and proteins in the same single cell. Clin Chem (2012) 58(12):1682–91. doi: 10.1373/clinchem.2012.191445
105. Frei AP, Bava FA, Zunder ER, Hsieh EW, Chen SY, Nolan GP, et al. Highly multiplexed simultaneous detection of RNAs and proteins in single cells. Nat Methods (2016) 13(3):269–75. doi: 10.1038/nmeth.3742
106. Ogbeide S, Giannese F, Mincarelli L, Macaulay IC. Into the multiverse: advances in single-cell multiomic profiling. Trends Genet (2022) 38(8):831–43. doi: 10.1016/j.tig.2022.03.015
107. Reimegard J, Tarbier M, Danielsson M, Schuster J, Baskaran S, Panagiotou S, et al. A combined approach for single-cell mRNA and intracellular protein expression analysis. Commun Biol (2021) 4(1):624. doi: 10.1038/s42003-021-02142-w
108. Stoeckius M, Hafemeister C, Stephenson W, Houck-Loomis B, Chattopadhyay PK, Swerdlow H, et al. Simultaneous epitope and transcriptome measurement in single cells. Nat Methods (2017) 14(9):865–8. doi: 10.1038/nmeth.4380
109. Budnik B, Levy E, Harmange G, Slavov N. SCoPE-MS: mass spectrometry of single mammalian cells quantifies proteome heterogeneity during cell differentiation. Genome Biol (2018) 19(1):161. doi: 10.1186/s13059-018-1547-5
110. Specht H, Emmott E, Petelski AA, Huffman RG, Perlman DH, Serra M, et al. Single-cell proteomic and transcriptomic analysis of macrophage heterogeneity using SCoPE2. Genome Biol (2021) 22(1):50. doi: 10.1186/s13059-021-02267-5
111. Fiskin E, Lareau CA, Ludwig LS, Eraslan G, Liu F, Ring AM, et al. Single-cell profiling of proteins and chromatin accessibility using PHAGE-ATAC. Nat Biotechnol (2022) 40(3):374–81. doi: 10.1038/s41587-021-01065-5
112. Macedo C, Orkis EA, Popescu I, Elinoff BD, Zeevi A, Shapiro R, et al. Contribution of naive and memory T-cell populations to the human alloimmune response. Am J Transplant (2009) 9(9):2057–66. doi: 10.1111/j.1600-6143.2009.02742.x
113. Golshayan D, Wyss JC, Buckland M, Hernandez-Fuentes M, Lechler RI. Differential role of naive and memory CD4 T-cell subsets in primary alloresponses. Am J Transplant (2010) 10(8):1749–59. doi: 10.1111/j.1600-6143.2010.03180.x
114. Oakes T, Heather JM, Best K, Byng-Maddick R, Husovsky C, Ismail M, et al. Quantitative characterization of the T cell receptor repertoire of naive and memory subsets using an integrated experimental and computational pipeline which is robust, economical, and versatile. Front Immunol (2017) 8:1267. doi: 10.3389/fimmu.2017.01267
115. Morris H, DeWolf S, Robins H, Sprangers B, LoCascio SA, Shonts BA, et al. Tracking donor-reactive T cells: Evidence for clonal deletion in tolerant kidney transplant patients. Sci Transl Med (2015) 7(272):272ra10. doi: 10.1126/scitranslmed.3010760
116. Obradovic A, Shen Y, Sykes M, Fu J. Integrated analysis toolset for defining and tracking alloreactive T-cell clones after human solid organ and hematopoietic stem cell transplantation. Softw Impacts (2021) 10:100142. doi: 10.1016/j.simpa.2021.100142
117. Aschauer C, Jelencsics K, Hu K, Heinzel A, Vetter J, Fraunhofer T, et al. Next generation sequencing based assessment of the alloreactive T cell receptor repertoire in kidney transplant patients during rejection: a prospective cohort study. BMC Nephrol (2019) 20(1):346. doi: 10.1186/s12882-019-1541-5
118. Savage TM, Shonts BA, Lau S, Obradovic A, Robins H, Shaked A, et al. Deletion of donor-reactive T cell clones after human liver transplant. Am J Transplant (2020) 20(2):538–45. doi: 10.1111/ajt.15592
119. Li M, Song S, Tian G, Zhi Y, Chen Y, Huang H, et al. Expansion kinetics of graft-versus-host T cell clones in patients with post-liver transplant graft-versus-host disease. Am J Transplant (2022) 22(11):2689–93. doi: 10.1111/ajt.17112
120. Tian G, Li M, Lv G. Analysis of T-cell receptor repertoire in transplantation: Fingerprint of T cell-mediated alloresponse. Front Immunol (2021) 12:778559. doi: 10.3389/fimmu.2021.778559
121. Thome JJ, Grinshpun B, Kumar BV, Kubota M, Ohmura Y, Lerner H, et al. Longterm maintenance of human naive T cells through in situ homeostasis in lymphoid tissue sites. Sci Immunol (2016) 1(6):eaah6506. doi: 10.1126/sciimmunol.aah6506
122. Fu J, Zuber J, Martinez M, Shonts B, Obradovic A, Wang H, et al. Human intestinal allografts contain functional hematopoietic stem and progenitor cells that are maintained by a circulating pool. Cell Stem Cell (2019) 24(2):227–39.e8. doi: 10.1016/j.stem.2018.11.007
123. Taubert R, Pischke S, Schlue J, Wedemeyer H, Noyan F, Heim A, et al. Enrichment of regulatory T cells in acutely rejected human liver allografts. Am J Transplant (2012) 12(12):3425–36. doi: 10.1111/j.1600-6143.2012.04264.x
124. Taubert R, Hardtke-Wolenski M, Noyan F, Wilms A, Baumann AK, Schlue J, et al. Intrahepatic regulatory T cells in autoimmune hepatitis are associated with treatment response and depleted with current therapies. J Hepatol (2014) 61(5):1106–14. doi: 10.1016/j.jhep.2014.05.034
125. Huibers MM, Gareau AJ, Vink A, Kruit R, Feringa H, Beerthuijzen JM, et al. The composition of ectopic lymphoid structures suggests involvement of a local immune response in cardiac allograft vasculopathy. J Heart Lung Transplant (2015) 34(5):734–45. doi: 10.1016/j.healun.2014.11.022
126. Mederacke YS, Nienen M, Jarek M, Geffers R, Hupa-Breier K, Babel N, et al. T Cell receptor repertoires within liver allografts are different to those in the peripheral blood. J Hepatol (2021) 74(5):1167–75. doi: 10.1016/j.jhep.2020.12.014
127. Yang G, Ou M, Chen H, Guo C, Chen J, Lin H, et al. Characteristic analysis of TCR beta-chain CDR3 repertoire for pre- and post-liver transplantation. Oncotarget (2018) 9(77):34506–19. doi: 10.18632/oncotarget.26138
128. Han FF, Fan H, Ren LL, Wang HG, Wang C, Ma X, et al. Profiling the pattern of human TRB/IGH-CDR3 repertoire in liver transplantation patients via high-throughput sequencing analysis. Scand J Immunol (2020) 92(2):e12912. doi: 10.1111/sji.12912
129. Habal MV, Miller AMI, Rao S, Lin S, Obradovic A, Khosravi-Maharlooei M, et al. T Cell repertoire analysis suggests a prominent bystander response in human cardiac allograft vasculopathy. Am J Transplant (2021) 21(4):1465–76. doi: 10.1111/ajt.16333
130. Satpathy AT, Saligrama N, Buenrostro JD, Wei Y, Wu B, Rubin AJ, et al. Transcript-indexed ATAC-seq for precision immune profiling. Nat Med (2018) 24(5):580–90. doi: 10.1038/s41591-018-0008-8
131. Birnbaum ME, Mendoza JL, Sethi DK, Dong S, Glanville J, Dobbins J, et al. Deconstructing the peptide-MHC specificity of T cell recognition. Cell (2014) 157(5):1073–87. doi: 10.1016/j.cell.2014.03.047
132. Newell EW, Davis MM. Beyond model antigens: high-dimensional methods for the analysis of antigen-specific T cells. Nat Biotechnol (2014) 32(2):149–57. doi: 10.1038/nbt.2783
133. Svensson V, Natarajan KN, Ly LH, Miragaia RJ, Labalette C, Macaulay IC, et al. Power analysis of single-cell RNA-sequencing experiments. Nat Methods (2017) 14(4):381–7. doi: 10.1038/nmeth.4220
134. Manzoni C, Kia DA, Vandrovcova J, Hardy J, Wood NW, Lewis PA, et al. Genome, transcriptome and proteome: the rise of omics data and their integration in biomedical sciences. Brief Bioinform (2018) 19(2):286–302. doi: 10.1093/bib/bbw114
135. Mimitou EP, Lareau CA, Chen KY, Zorzetto-Fernandes AL, Hao Y, Takeshima Y, et al. Scalable, multimodal profiling of chromatin accessibility, gene expression and protein levels in single cells. Nat Biotechnol (2021) 39(10):1246–58. doi: 10.1038/s41587-021-00927-2
136. Swanson E, Lord C, Reading J, Heubeck AT, Genge PC, Thomson Z, et al. Simultaneous trimodal single-cell measurement of transcripts, epitopes, and chromatin accessibility using TEA-seq. Elife (2021) 10:e63632 doi: 10.7554/eLife.63632
137. Mirza B, Wang W, Wang J, Choi H, Chung NC, Ping P. Machine learning and integrative analysis of biomedical big data. Genes (Basel) (2019) 10(2):87. doi: 10.3390/genes10020087
138. Saviano A, Henderson NC, Baumert TF. Single-cell genomics and spatial transcriptomics: Discovery of novel cell states and cellular interactions in liver physiology and disease biology. J Hepatol (2020) 73(5):1219–30. doi: 10.1016/j.jhep.2020.06.004
139. Hu KH, Eichorst JP, McGinnis CS, Patterson DM, Chow ED, Kersten K, et al. ZipSeq: barcoding for real-time mapping of single cell transcriptomes. Nat Methods (2020) 17(8):833–43. doi: 10.1038/s41592-020-0880-2
140. Stahl PL, Salmen F, Vickovic S, Lundmark A, Navarro JF, Magnusson J, et al. Visualization and analysis of gene expression in tissue sections by spatial transcriptomics. Science (2016) 353(6294):78–82. doi: 10.1126/science.aaf2403
141. Rodriques SG, Stickels RR, Goeva A, Martin CA, Murray E, Vanderburg CR, et al. Slide-seq: A scalable technology for measuring genome-wide expression at high spatial resolution. Science (2019) 363(6434):1463–7. doi: 10.1126/science.aaw1219
142. Vickovic S, Eraslan G, Salmen F, Klughammer J, Stenbeck L, Schapiro D, et al. High-definition spatial transcriptomics for in situ tissue profiling. Nat Methods (2019) 16(10):987–90. doi: 10.1038/s41592-019-0548-y
143. Korsunsky I, Millard N, Fan J, Slowikowski K, Zhang F, Wei K, et al. Fast, sensitive and accurate integration of single-cell data with harmony. Nat Methods (2019) 16(12):1289–96. doi: 10.1038/s41592-019-0619-0
144. Hie B, Bryson B, Berger B. Efficient integration of heterogeneous single-cell transcriptomes using scanorama. Nat Biotechnol (2019) 37(6):685–91. doi: 10.1038/s41587-019-0113-3
145. Johnson WE, Li C, Rabinovic A. Adjusting batch effects in microarray expression data using empirical bayes methods. Biostatistics (2007) 8(1):118–27. doi: 10.1093/biostatistics/kxj037
146. Welch JD, Kozareva V, Ferreira A, Vanderburg C, Martin C, Macosko EZ. Single-cell multi-omic integration compares and contrasts features of brain cell identity. Cell (2019) 177(7):1873–87.e17. doi: 10.1016/j.cell.2019.05.006
147. Kharchenko PV, Silberstein L, Scadden DT. Bayesian Approach to single-cell differential expression analysis. Nat Methods (2014) 11(7):740–2. doi: 10.1038/nmeth.2967
148. Lin Y, Ghazanfar S, Wang KYX, Gagnon-Bartsch JA, Lo KK, Su X, et al. scMerge leverages factor analysis, stable expression, and pseudoreplication to merge multiple single-cell RNA-seq datasets. Proc Natl Acad Sci U.S.A. (2019) 116(20):9775–84. doi: 10.1073/pnas.1820006116
149. Tran HTN, Ang KS, Chevrier M, Zhang X, Lee NYS, Goh M, et al. A benchmark of batch-effect correction methods for single-cell RNA sequencing data. Genome Biol (2020) 21(1):12. doi: 10.1186/s13059-019-1850-9
150. Stuart T, Butler A, Hoffman P, Hafemeister C, Papalexi E, Mauck WM, et al. Satija: Comprehensive integration of single-cell data. Cell (2019) 177(7):1888–902.e21. doi: 10.1016/j.cell.2019.05.031
151. Singh A, Shannon CP, Gautier B, Rohart F, Vacher M, Tebbutt SJ, et al. DIABLO: an integrative approach for identifying key molecular drivers from multi-omics assays. Bioinformatics (2019) 35(17):3055–62. doi: 10.1093/bioinformatics/bty1054
152. Gasperini M, Hill AJ, McFaline-Figueroa JL, Martin B, Kim S, Zhang MD, et al. A genome-wide framework for mapping gene regulation via cellular genetic screens. Cell (2019) 176(1-2):377–90.e19. doi: 10.1016/j.cell.2018.11.029
153. Meng C, Kuster B, Culhane AC, Gholami AM. A multivariate approach to the integration of multi-omics datasets. BMC Bioinf (2014) 15:162. doi: 10.1186/1471-2105-15-162
154. Lock EF, Hoadley KA, Marron JS, Nobel AB. Joint and individual variation explained (Jive) for integrated analysis of multiple data types. Ann Appl Stat (2013) 7(1):523–42. doi: 10.1214/12-AOAS597
155. Welch JD, Hartemink AJ, Prins JF. MATCHER: manifold alignment reveals correspondence between single cell transcriptome and epigenome dynamics. Genome Biol (2017) 18(1):138. doi: 10.1186/s13059-017-1269-0
156. Liu J, Huang Y, Singh R, Vert JP, Noble WS. Jointly embedding multiple single-cell omics measurements. Algorithms Bioinform 143 (2019) 143:10. doi: 10.4230/LIPIcs.WABI.2019.10
157. Schep AN, Wu B, Buenrostro JD, Greenleaf WJ. chromVAR: inferring transcription-factor-associated accessibility from single-cell epigenomic data. Nat Methods (2017) 14(10):975–8. doi: 10.1038/nmeth.4401
158. Xu C, Tao D, Xu C. A survey on multi-view learning (2013). Available at: https://arxiv.org/abs/1304.5634.
159. Macaulay IC, Ponting CP, Voet T. Single-cell multiomics: Multiple measurements from single cells. Trends Genet (2017) 33(2):155–68. doi: 10.1016/j.tig.2016.12.003
Keywords: T cells, Single Cell RNA sequencing, TCR repertoire, allograft rejection, solid organ transplantation, allograft survival, alloantigens
Citation: Zhi Y, Li M and Lv G (2023) Into the multi-omics era: Progress of T cells profiling in the context of solid organ transplantation. Front. Immunol. 14:1058296. doi: 10.3389/fimmu.2023.1058296
Received: 30 September 2022; Accepted: 20 January 2023;
Published: 31 January 2023.
Edited by:
Mahzad Akbarpour, University of Chicago Medicine, United StatesReviewed by:
Manuel Muro, Hospital Universitario Virgen de la Arrixaca, SpainCopyright © 2023 Zhi, Li and Lv. This is an open-access article distributed under the terms of the Creative Commons Attribution License (CC BY). The use, distribution or reproduction in other forums is permitted, provided the original author(s) and the copyright owner(s) are credited and that the original publication in this journal is cited, in accordance with accepted academic practice. No use, distribution or reproduction is permitted which does not comply with these terms.
*Correspondence: Guoyue Lv, bHZneUBqbHUuZWR1LmNu; Mingqian Li, bWluZ3FpYW5saUBqbHUuZWR1LmNu
Disclaimer: All claims expressed in this article are solely those of the authors and do not necessarily represent those of their affiliated organizations, or those of the publisher, the editors and the reviewers. Any product that may be evaluated in this article or claim that may be made by its manufacturer is not guaranteed or endorsed by the publisher.
Research integrity at Frontiers
Learn more about the work of our research integrity team to safeguard the quality of each article we publish.