
95% of researchers rate our articles as excellent or good
Learn more about the work of our research integrity team to safeguard the quality of each article we publish.
Find out more
ORIGINAL RESEARCH article
Front. Immunol. , 20 February 2023
Sec. Molecular Innate Immunity
Volume 14 - 2023 | https://doi.org/10.3389/fimmu.2023.1038689
This article is part of the Research Topic Microbiota in Skin Inflammatory Diseases View all 14 articles
 Agatha Schwarz1
 Rebecca Philippsen1Serena G. Piticchio2,3
 Jan N. Hartmann1
 Robert Häsler1
 Stefan Rose-John4
 Thomas Schwarz1*
The organ-specific microbiome plays a crucial role in tissue homeostasis, among other things by inducing regulatory T cells (Treg). This applies also to the skin and in this setting short chain fatty acids (SCFA) are relevant. It was demonstrated that topical application of SCFA controls the inflammatory response in the psoriasis-like imiquimod (IMQ)-induced murine skin inflammation model. Since SCFA signal via HCA2, a G-protein coupled receptor, and HCA2 expression is reduced in human lesional psoriatic skin, we studied the effect of HCA2 in this model. HCA2 knock-out (HCA2-KO) mice reacted to IMQ with stronger inflammation, presumably due to an impaired function of Treg. Surprisingly, injection of Treg from HCA2-KO mice even enhanced the IMQ reaction, suggesting that in the absence of HCA2 Treg switch from a suppressive into a proinflammatory type. HCA2-KO mice differed in the composition of the skin microbiome from wild type mice. Co-housing reversed the exaggerated response to IMQ and prevented the alteration of Treg, implying that the microbiome dictates the outcome of the inflammatory reaction. The switch of Treg into a proinflammatory type in HCA2-KO mice could be a downstream phenomenon. This opens the opportunity to reduce the inflammatory tendency in psoriasis by altering the skin microbiome.
Psoriasis is a chronic inflammatory dermatosis, with an increasing prevalence, ranging at 0.84% of the population in 2017 (1). The pathogenesis is complex involving several pathways (2). Although psoriasis is assigned to the family of autoimmune dermatoses, a definite autoantigen such as for bullous autoimmune dermatoses has not been detected (3). One pathomechanism involved appears to be a downregulation of regulatory T cells (Treg) which under normal conditions control inflammatory and immune reactions (4–6). The mechanisms responsible for this alteration of Treg are still unclear.
There is increasing evidence that the microbiome exerts profound effects on Treg, first discovered in the gut. The intestinal microbiome is able to activate Treg (7–10). These effects are partially mediated via short chain fatty acids (SCFA), microbiota-derived bacterial fermentation products including butyrate, propionate, and acetate (11, 12). Accordingly, certain alterations of the intestinal microbiome are associated with inflammatory bowel diseases (13–15), It is known that the intestinal microbiome can also modulate inflammatory processes of other organs like the airway system, the central nervous system and even the skin (10, 16, 17),.
Meanwhile it is clear that also other organs including the respiratory and urogenital tract and the oral cavity harbor a certain microbiome milieu which contributes to tissue homeostasis. This applies also to the skin. We demonstrated that topical application of the SCFA sodium butyrate (SB) reduced inflammation in the skin, suggesting that resident skin microbes prevent exaggerated inflammatory responses by exerting a downregulatory function and thereby maintain a stable state under physiologic conditions (18).
Furthermore, we observed that SB exerts a mitigating effect in psoriasis (19). This was primarily demonstrated in the imiquimod (IMQ)-induced inflammation model, an established murine model of psoriasis-like skin inflammation (20). Topically applied SB reduced IMQ-induced inflammation. Treg were definitely involved in this process since the mitigating effect was lost upon depletion of Treg. Furthermore, Treg isolated from the blood of psoriatic patients were reduced in their suppressive activity, which was restored by SB. Additionally, SB restored the fewer numbers of Treg in biopsies of psoriatic lesions and normalized the enhanced expression of IL-17 and IL-6 and the reduced expression of IL-10 and of Foxp3 (19).
SCFA signal via G-protein-coupled receptors, including GPR109a/HCA2/NIACR1 (21, 22) and GPR43 (23, 24). SB utilizes primarily HCA2 to mediate its effects. HCA2-activation in the gut exerted antiinflammatory effects, finally inducing Treg and IL-10-producing T cells (8). Accordingly, HCA2-knockout (HCA2-KO) mice showed enhanced susceptibility to colitis (21).
Due to the potential beneficial effect of SB in psoriasis, we quantified the expression of HCA2 in psoriatic skin. Lesional and non-lesional psoriatic skin revealed a decreased expression of HCA2 on keratinocytes in comparison to control skin. Topical application of SB was able to increase the low-level expression of HCA2 (25).
To get more insight into the role of HCA2 in psoriasis, we utilized the IMQ-model and HCA2-KO mice. Here, we show that HCA2-KO mice present with a remarkably increased inflammatory response to IMQ. Adoptive transfer experiments revealed that Treg in HCA2-KO mice were not only impaired in their suppressive activity, but even enhanced the inflammatory response. Obviously, Treg in the absence of HCA2 switch from a regulatory into a proinflammatory type. All these changes appear to be dictated by an altered skin microbiome as a consequence of HCA2-deficiency.
Eight to nine week old female C57BL/6J mice (WT) (Janvier Labs, stock #U03, Le Genest Saint Isle, France) and HCA2-KO (Gpr109a-/-) (26) mice were housed in the animal facilities of the University Clinics Schleswig-Holstein. Mice were kept under SPF conditions (individually ventilated cage, IVC, to keep an animal separated from other animals and possible exposures, including exposure by air). Water and food were autoclaved. Expert personnel in compliance with relevant laws and institutional guidelines utilized animal care. Experiments were approved by the Animal Welfare Commission of Ministry of Energy, Agriculture, the Environment, Nature and Digitalization of the Federal State Schleswig-Holstein. Animals were treated with IMQ-cream (Aldara®) and received 62.5 mg on the shaved backs for 7 days. For all experiments, at least 5 mice per group were used. The clinical response was quantified according to a modified psoriasis area and severity index (PASI) score (27). Skin thickness was quantified with a spring-loaded micrometer. Biopsies were paraffin embedded and sections stained with H&E. Acanthosis was semiquantitatively scored as: - <40 µm; + >40 - <60 µm; ++ >60 - <130 µm; +++ >130 µm; the inflammatory infiltrate was semiquantitatively scored as: sparse: <15 cells/10,000 µm²; moderate: >15 - <35 cells/10,000 µm²; dense: >35 cells/10,000 µm².
Lymph nodes (LN) and spleens were isolated from donor animals and pooled; single cell suspensions were prepared. The proportion of CD4+CD25+ cells was more or less the same in the spleens and the LN (Supplementary Figure 1). CD4+CD25+ T cells were collected with a magnet-activated cell sorter (Miltenyi Biotec, Bergisch Gladbach, Germany) by using the MojoSort™ Mouse CD4+CD25+ Regulatory T Cell Isolation Kit (BioLegend, Fell, Germany, Cat #480137). CD4+CD25+ T cells were isolated in a two-step separation process. The cells were first incubated with the biotin conjugated antibody cocktail, followed by the streptavidin nanobeads, to isolate total CD4+ T cells. The second step consisted of a positive enrichment of CD25+ cells using allophycocyanin (APC) conjugated anti-mouse-CD25-antibody and anti-APC nanobeads. The purity of CD4+CD25+ cells was determined by flow analysis using rat anti-mouse-CD4 conjugated with fluorescein isothiocyanate (FITC; BioLegend; Cat #130308, RRID: AB_1279237) and rat anti-mouse-CD25 labeled with APC (Miltenyi Biotec, Cat #130-102-550, RRID: AB_2660261) and was usually more than 95%. As immunoglobulin controls rat IgG2b FITC and rat IgM APC (both from Santa Cruz Biotechnology, Dallas, USA, Cat #sc-2835, RRID: AB_737268; Cat #sc-2896, RRID: AB_737296) were used. In general, we gained up to 3% Foxp3+ cells of all bulk cells obtained from lymph nodes and spleens which is in accordance with the literature (28). In some experiments Treg were stained with 10 μM carboxyfluorescein succinimidylester (CFSE) (Vybrant® CFDA SE Cell Tracer Kit, Molecular Probes, Oregon; Cat #V12883). After washing Treg were injected intravenously (i.v.) (1x10⁶) into recipient animals.
1x10⁶ cells/ml CD4+CD25- responder T cells obtained from WT mice were seeded into 96-well plates and mixed with CD4+CD25+ Treg obtained from WT or HCA2-KO mice at the ratios of 1:1, 2:1 and 4:1. Responder T cells were activated using anti-CD3 and anti-CD28-bound Dynabeads (Dynabeads Mouse T-Activator CD3/CD28, Life technologies, Carlsbad, USA). After 4 days, cell proliferation was measured using Cell Counting Kit-8 (Sigma-Aldrich, Taufkirchen, Germany). Data are presented as percentage of suppression.
HCA2-KO mice were injected intraperitonealy (i.p.) once with a rat monoclonal anti-IL-6-antibody (clone MP5-20F3; 270 µg; Abcam, Cambridge, England; Cat #ab191194). On day 7 after injection, Treg were isolated from untreated or anti-IL-6-treated HCA2-KO mice and injected i.v. into WT mice.
WT mice were injected i.p. daily for 7 days with 1 µg human recombinant IL-6 expressed in E. coli and purified to homogeneity as described (29). We used human IL-6, since it acts both on human and murine cells (30). On day 8 Treg were isolated and injected i.v. into WT animals.
The serum from WT and HCA2-KO mice was collected and the amount of IL-6 was measured using the LEGEND MAX Mouse IL-6 ELISA Kit (BioLegend; #Cat 431307) according to the manufacturer’s instructions. Serum samples were assayed in triplicates and absorbance read using the TECAN Infinite M Plex (TECAN, Männedorf, Switzerland) microplate reader at 450 nm and 560 nm.
For intracellular cytokine staining, cell suspension was prepared from pooled LN and spleens and stimulated with PMA and Ionomycin in the presence of Brefeldin A (Cell Activation Cocktail with Brefeldin A; BioLegend; Cat #423303) for 3 hours. After stimulation cells were fixed and permeabilized (Tru-Nuclear Transcription Factor, BioLegend, Cat #424401). Cells were stained for APC-conjugated anti-mouse-Foxp3 (eBioscience, San Diego, USA; Cat #17-5773-82, RRID: AB_469457) and phycoerythrin (PE) conjugated anti-mouse-IL-10 (Cat #505007, RRID: AB_315361, -GARP (Cat #142904, RRID: AB_10962944), -CD25 (Cat #102007, RRID: AB_312857) and -IL-6-antibodies (Cat #504503, RRID: AB_315337; (BioLegend). Furthermore, the following antibodies were used: PE-conjugated anti-mouse CTLA-4 (Cat #106305, RRID: AB_313254, Ki-67 (Cat #151209, RRID: AB_2716014), PD-1 (Cat #109103, RRID: AB_313420), CD73 (Cat #127205, RRID: AB_1089065), FR4 (Cat #125007, RRID: AB_1134202), IL-17A (Cat #506903, RRID: AB_315463), IL-23 (Cat #505203, RRID: AB_315367) and Alexa-488 conjugated anti-mouse Helios (Cat #137213, RRID: AB_10645334; all from BioLegend).
FACS analysis of CFSE-negative and positive cells was conducted using APC-conjugated anti-mouse-IL-6- (Cat # 504507, RRID: AB_10694094), -IL-17A- (Cat #506915, RRID: AB_536017), -IL-23- (Cat # 505205, RRID: AB_315369) and -IL-10- antibodies (Cat # 505009, RRID: AB_315363; all from BioLegend).
Flow analysis after co-housing experiments was performed using rat anti mouse CD4-APC (Miltenyi Biotec, Cat #130-102-597, RRID: AB_2659906) and rat anti mouse Foxp3-PE (eBioscience, Cat #12-5773-80, RRID: AB_465935). As isotype controls the following immunoglobulins: rat IgG2a-APC (Cat #sc-2894, RRID: AB_737246) as control for Foxp3-APC; rat IgG2b-APC (Cat #sc-2895, RRID: AB_737266) as control for IL-10-APC and CD4-APC (both from Santa Cruz); rat IgG2a-PE (Becton Dickinson; Cat #553930, RRID: AB_479719) as control for GARP-PE and Foxp3-PE; rat IgG2b-PE (Cat #556925, RRID: AB_479625) as control for IL-10-PE; rat IgG1-APC (Cat #400411, RRID: AB_326517) as control for IL-6-, IL-17-, IL-23-APC; rat IgG1-PE (Cat #400407, RRID: AB_326513) as control for IL-6-, CD25-, IL-17- and IL-23-PE (both from BioLegend); rat IgG2b-PE (Cat # 556925, RRID: AB_479625) as control for PD-1 and Ki-67-PE (Becton Dickinson); armenian hamster IgG1-PE (Becton Dickinson; Cat #553972, RRID: AB_395172) and Alexa-488 conjugated (BioLegend; Cat #400923; RRID: AB_2814703) as control for CTLA-4-PE, and Helios-A488; rat IgG1-PE (Miltenyi Biotec, Cat # 130-123-746, RRID: AB_2857627) as control for CD73- and FR4-PE. Analysis was performed with a CytoFlex (Beckman Coulter).
Animals were wiped off with wet swabs in both directions (head to tail and tail to head). To generate representative bacteria based on relative abundancies, 16S sequencing was performed as previously described (31). DNA was extracted using the QIAamp UCP Pathogen Mini Kit automated on the QIAcube (Qiagen, Hilden, Germany) following the manufacturer’s guidelines.
16S rRNA gene libraries were generated by PCR from purified genomic DNA with primers 27F and 338R, targeting the hypervariable regions V1 and V2 of the 16S rRNA. Amplification and sequencing were performed using a dual-indexing approach (8-nt on forward- and reverse primer) as described by Kozich et al. (32) on the Illumina MiSeq platform (Illumina Inc., San Diego, USA) generating 2x300 bp reads. Demultiplexing after sequencing was based on no mismatches in the indices.
Data processing was performed using the DADA2 version 1.10 workflow for big data sets (33) resulting in abundance tables of amplicon sequence variants (ASVs) according to a workflow adjusted for V1-V2 region, which can be found here: https://github.com/mruehlemann/ikmb_amplicon_processing/blob/master/dada2_16S_workflow_with_AR.R. Resulting ASVs underwent taxonomic annotation using the Bayesian classifier provided in DADA2 and using the Ribosomal Database Project (RDP) version 16 release. One sample with less than 10,000 sequences was not considered for further analysis. ASVs classified as “Chloroplast” were removed. Alpha diversity was estimated with Shannon index and Beta diversity was estimated from Bray-Curtis dissimilarity (phyloseq R package). Differential abundance analysis was performed with the linear model function LinDA (34) in the MicrobiomeStat package, which can be found at https://CRAN.R-project.org/package=MicrobiomeStat.
In all experiments except FACS analysis and 16S rRNA sequencing results were analyzed by using the Student t test. For FACS analysis t test with Welch’s correction was performed. For multiple comparisons we carried out one-way ANOVA in order to assess whether at least two groups significantly differ. Differences between groups were determined with unpaired two-samples Wilcoxon test for alpha diversity, and PERMANOVA (adonis2 function of vegan R package) for beta diversity. Linear models included confounders (housing, genotype) where applicable. For all analysis p-values <0.05 were considered significant.
To study the role of HCA2 in psoriasis and its impact on Treg, we utilized the IMQ-induced inflammation model and mice which are deficient in the expression of HCA2. C57BL/6J wild type (WT) and HCA2-KO mice received IMQ-cream on the shaved backs daily for 7 days. As described previously (19), IMQ-treated mice developed thickening of the skin, erythema and scales. In HCA2-KO animals the inflammatory response was remarkably stronger (Figure 1A). The clinical response was quantified for this and all following experiments according to a modified PASI score (27). The data of all experiments are summarized in Supplementary Figure 2. Accordingly, measurement of skin thickness revealed swollen skin upon administration of IMQ which was maximally pronounced in IMQ-treated HCA2-KO mice (Figure 1C).
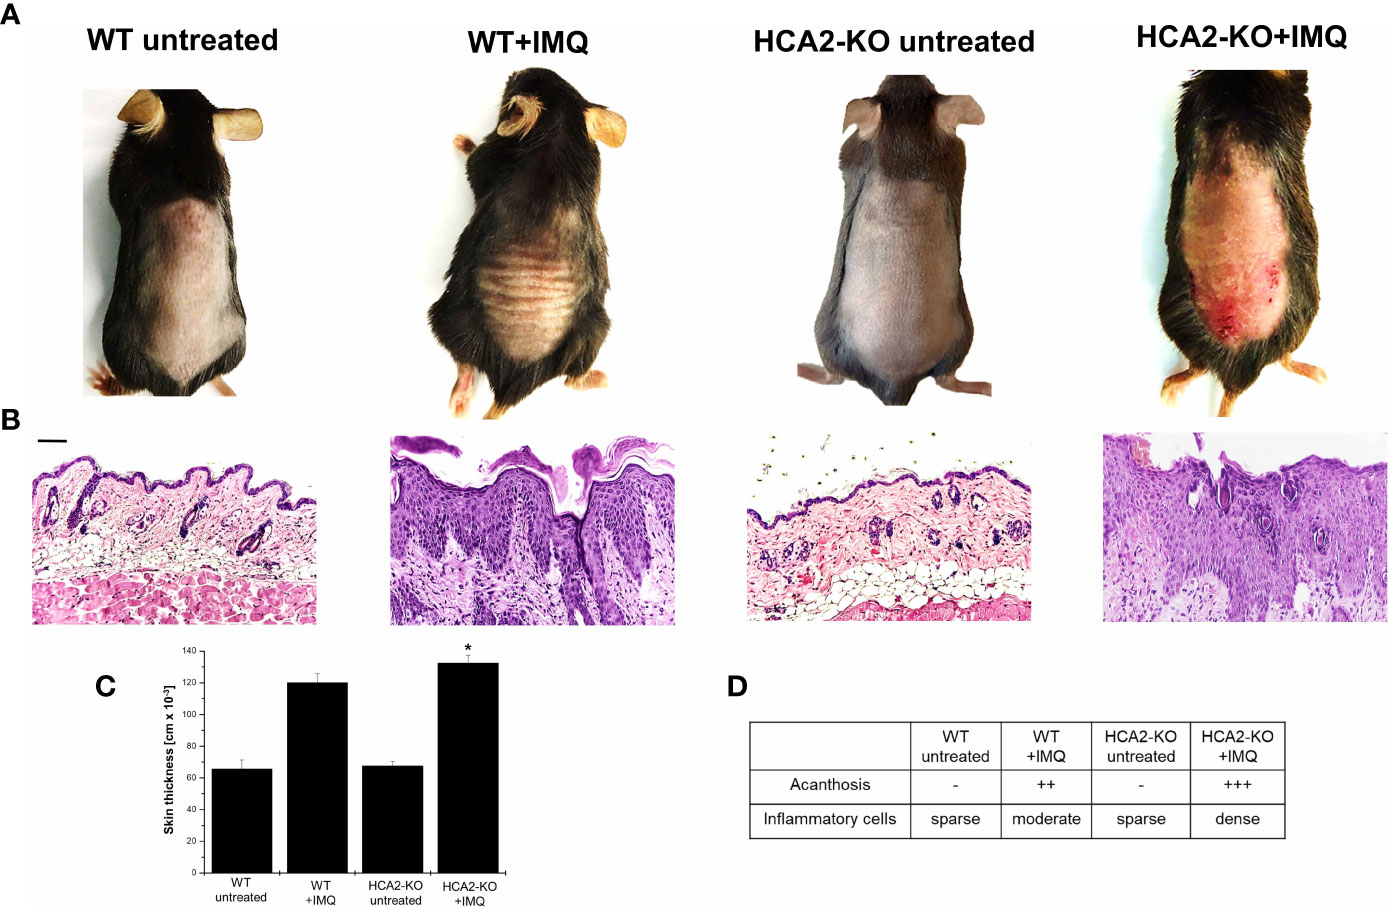
Figure 1 HCA2 deficiency enhances the susceptibility to psoriasis-like skin inflammation. (A) WT and HCA2-KO mice were treated topically with 5% IMQ cream on the shaved backs for 7 (d) (B) Biopsies were taken, paraffin embedded sections were stained with H&E and analyzed histopathologically. Each group contained 7 animals. Scale bar = 100 µm (C) Skin thickness was measured using a spring-loaded micrometer. Student t test and one-way ANOVA was performed. *P < 0.02 WT+IMQ vs HCA2-KO+IMQ; PANOVA = 1.9 x10⁻¹⁰ (D) Acanthosis and density of inflammatory infiltrate were scored. Data are presented from one of three independent experiments (n=3).
Biopsies were taken and sections stained with H&E. IMQ-treatment induced acanthosis, hyperkeratosis and an inflammatory infiltrate. These changes were stronger pronounced in HCA2-KO mice in comparison to WT animals (Figures 1B, D). Since IMQ, though only topically applied, induces also systemic alterations (20), mice were sacrificed 7 days after initiation of IMQ treatment and spleens were obtained. Spleens of IMQ-treated animals were enlarged and heavier (19). Splenomegaly was stronger pronounced in HCA2-KO mice upon application of IMQ (data not shown).
We previously observed that IMQ-induced inflammation is associated with a decrease/suppression of Treg (19). To analyze whether the enhanced susceptibility of HCA-KO mice to IMQ is due to an impairment of Treg, adoptive transfer experiments were performed. Spleens and LN were isolated from HCA2-KO or WT mice and pooled. Cell suspensions from pooled organs were subjected to FACS analysis. HCA2-KO mice harbored reduced percentage of CD4+CD25+Foxp3+ cells (Figure 2A) and also the expression of CD25 on Foxp3+ cells was impaired (Figure 2B). Foxp3+ cells from HCA-KO mice expressed lower levels of IL-10 and glycoprotein A repetitions predominant (GARP), which is specifically expressed on activated Treg (35) (Figure 2B).
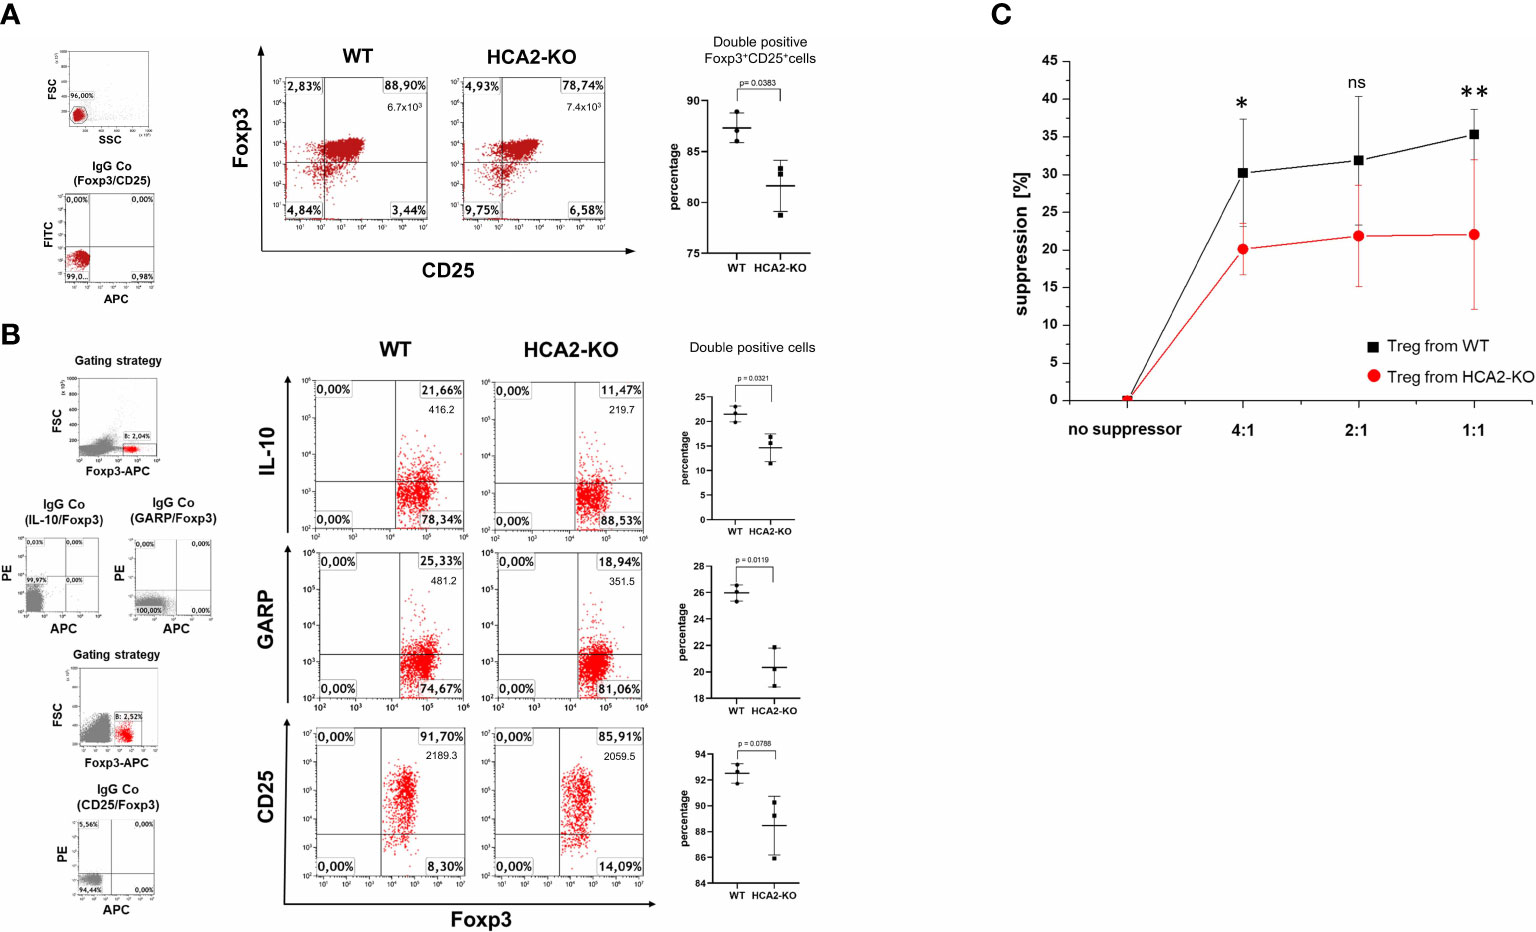
Figure 2 HCA2 signaling regulates the suppressive activity in vitro and the phenotype of Treg. (A) CD4+CD25+ (Treg) cells were isolated from pooled spleens and lymph nodes (LN) of 7 mice and subjected to FACS analysis. The cell population from both strains was analyzed for double positive CD25/Foxp3 cells and is demonstrated as percentage and total number of double positive cells. As negative control served isotype (IgG Co). FACS analysis is also shown as a scatter graph with mean ± SD. Y axes show percentage of double positive cells. Data were analyzed by using the t test with Welch´s correction. n = 3 (B) Pooled LN cells and splenocytes of 4 mice, obtained from both strains were analyzed for double positive Foxp3/IL-10, Foxp3/GARP and Foxp3/CD25 cells and is demonstrated as percentage and total number of double positive cells. FACS analysis is also shown as a scatter graph with mean ± SD. Y axes show percentage of double positive cells. Data were analyzed by using the t test with Welch´s correction. n = 3 Data are presented from one of three independent experiments. (C) Pooled LN and spleen cells obtained from WT and HCA2-KO mice (4 for each group) were separated into CD4+CD25- (responder cells) and CD4+CD25+ cells (Treg). Treg and responder cells were mixed at the ratios 1:1, 1:2 and 1:4. Responder cells were activated and after 4 days, cell proliferation was measured using Cell Counting Kit-8. Data are presented as percent suppression from one of three independent experiments. Student t test and one-way ANOVA was performed. *P < 0.03 WT vs HCA2-KO 4:1; P = 0.11504 WT vs HCA2-KO 2:1; ns, not significant; **P < 0.04 WT vs HCA2-KO 1:1; PANOVA = 0.016; n = 4.
To better define Treg obtained from HCA2-KO mice, more markers which are associated with the suppressive activity of Treg were analyzed. Foxp3+Helios+Treg exert more suppressive characteristics compared to Foxp3+Helios- Treg (36). Ki-67 is an activating marker for Treg (37). The ecto-5’-nucleosidase (CD73) contributes to the inhibitory function of Treg by generating adenosine (38). The folate receptor 4 (FR4) is required for the activity of Treg (39). The expression of CTLA-4, CD73, FR4, Helios, Ki-67 was reduced on Foxp3+ cells obtained from HCA2-KO mice in comparison to WT cells (Supplementary Figure 3). Furthermore, the expression of PD-1 which inhibits activation and suppressive capacity of Treg (40, 41) was upregulated in Foxp3+ cells from HCA2-KO mice (Supplementary Figure 3).
To analyze whether this phenotypic alteration is also associated with a functional impact, the suppressive activity of Treg obtained from WT and HCA2-KO mice was evaluated in a suppression assay. CD4+CD25- responder cells were coincubated at different ratios with Treg obtained either from WT or HCA2-KO mice and proliferation was measured. The proliferation of CD4+CD25– responder cells was reduced upon coincubation with Treg obtained from WT mice. This effect was reduced upon coincubation with Treg obtained from HCA2-KO mice (Figure 2C).
To examine whether the altered phenotype of HCA2-KO Treg also influences their suppressive potency in vivo, CD4+CD25+ cells were isolated from pooled spleens and LN of WT and HCA2-KO mice, respectively. The purity was in the range at least of 95%. Cells were injected i.v. into WT animals which subsequently were treated with IMQ. Injection of Treg obtained from WT mice mitigated IMQ-induced inflammation in WT recipients (Figure 3A). Down-modulation of inflammation by Treg was confirmed histopathologically (Figures 3B, D). Surprisingly, the inflammatory response to IMQ in mice which received Treg from HCA-KO mice was not at all reduced but even remarkably enhanced (Figure 3A). Skin thickness analysis confirmed this observation (Figure 3C). This suggests that HCA2-deficient Treg are not only impaired in their suppressive activity but even enhance inflammation. This phenomenon may contribute to the enhancement of the “psoriatic” response in the absence of HCA2.
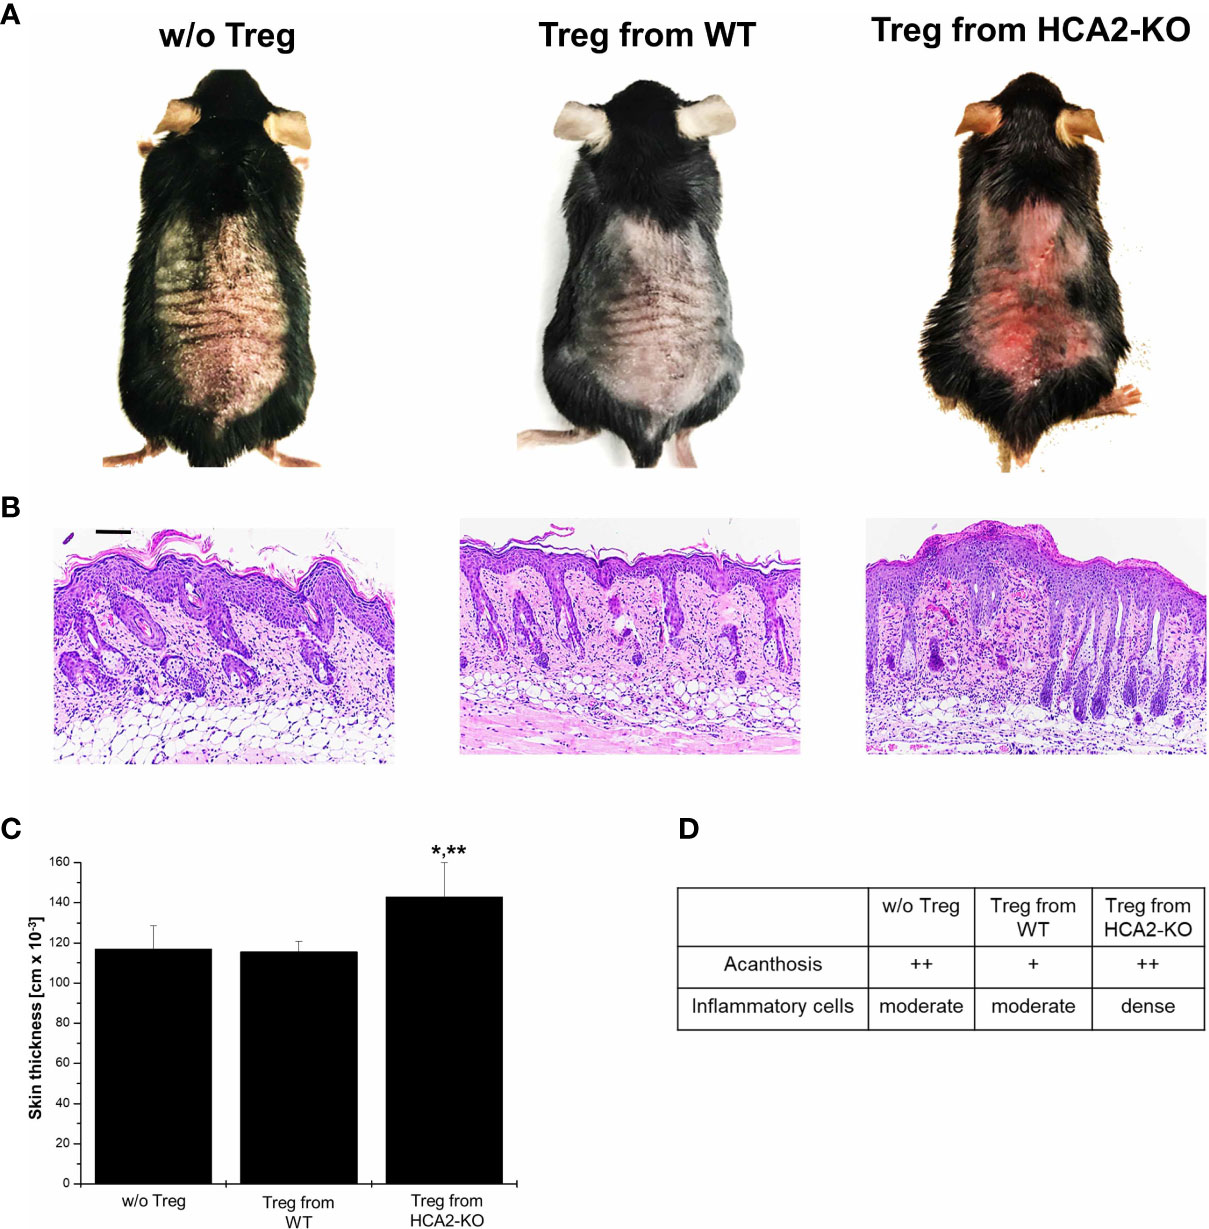
Figure 3 HCA2 signaling regulates the suppressive activity in vivo (A) Treg were isolated from pooled spleens and LN of WT or HCA2-KO mice and injected i.v. into IMQ-treated WT animals. (B) Biopsies obtained from IMQ-treated animals were taken. The paraffin embedded sections were stained with H&E and analyzed histopathologically. Each group contained 7 animals. Scale bar = 100 µm (C) The skin thickness was measured using a spring-loaded micrometer. Student t test and one-way ANOVA was performed. *P < 0.02 Treg from WT vs Treg from HCA2-KO, **P < 0.02 Treg from HCA2-KO vs w/o Treg; PANOVA = 0.00872. (D) Acanthosis and density of inflammatory infiltrate were scored. Data are presented from one of three independent experiments.
Under normal conditions, Treg suppress inflammation, but several publications demonstrated a dysfunction of Treg, particularly in autoimmune diseases (42). To study whether this might also apply for IMQ-induced psoriasis-like inflammation, we stained Treg obtained from WT and HCA2-KO mice with CFSE. Fluorescent Treg were injected i.v. into IMQ-treated WT animals. After 48 hours LN and spleens were obtained from the recipients and FACS analysis of CFSE-negative cells was conducted. This strategy allows to detect the inflammatory status of host cells after injection of Treg. IMQ upregulated the proinflammatory cytokines IL-6, IL-17, and IL-23 in comparison to untreated WT mice (Supplementary Figure 4). The expression of these cytokines was reduced in host cells (CFSE-negative) upon injection of WT-Treg. In contrast, such an effect was not observed upon injection of Treg from HCA2-KO mice. In this case, the expression of the proinflammatory cytokines was even enhanced in the host cells. In turn, the expression of the “suppressive” cytokine IL-10 was induced upon injection of Treg from WT mice in the host cells, but impaired upon injection of Treg from HCA2-KO mice (Figure 4; overlay of red histograms). Statistical analysis was performed after having pooled the data from 3 experiments (Figure 4B).
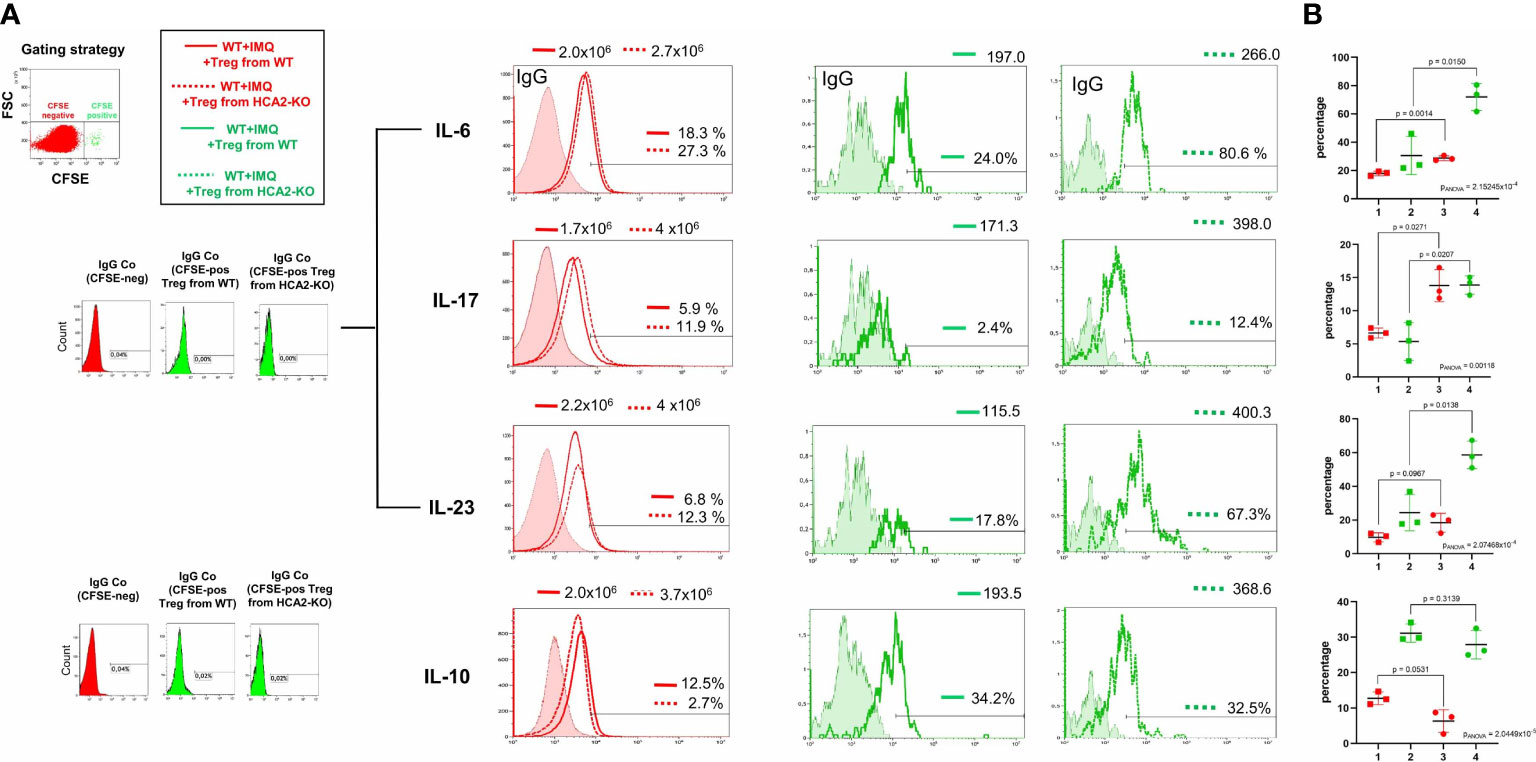
Figure 4 HCA2 deficiency causes defects of Treg at the site of inflammation. (A) Treg obtained from 7 HCA2-KO and 7 WT mice were stained with CFSE and injected i.v. into IMQ-treated WT animals. After 48 h LN and spleens were obtained from the recipient mice and FACS analysis of CFSE-negative (overlay of red histograms) or CFSE-positive cells (overlay of green histograms) was conducted. The expression of IL-6, IL-17, IL-23 and IL-10 was standardized on isotype controls. For green histograms (Treg from WT and HCA2-KO) two isotype controls were used. For IL-6, IL-17 and IL-23 the same IgG (rat IgG1) control was used. Histograms show fluorescence intensity (x axis) versus cell count (y-axis). The number of cells is displayed in the histograms. (B) FACS analysis is also shown as scatter graph with mean ± SD. Y axes show percentage of positive cells. Data were analyzed by using the t test with Welch´s correction. For multiple comparisons we carried out one-way ANOVA in order to assess whether at least two groups significantly differ. 1 WT +IMQ + Treg from WT (red); 2 WT +IMQ + Treg from WT (green); 3 WT +IMQ + Treg from HCA2-KO (red); 4 WT +IMQ + Treg from HCA2-KO (green) n=3.
To gain insight into the production of cytokines by the adoptively transferred cells (CFSE-positive), flow analysis was performed by gating on CFSE+ cells. FACS analysis revealed that injected Treg obtained from HCA2-KO animals expressed enhanced levels of IL-6, IL-17, and IL-23 in comparison to the expression of these cytokines in WT-Treg (Figure 4A; overlay of green histograms). IL-10 was only slightly downregulated in injected Treg from HCA2-KO mice compared to WT Treg. However, those differences were statistically not significant. Statistical analysis was performed after having pooled the data from 3 experiments (Figure 4B). A limitation of this experiment is the low cell number recovered from the recipients. However, this was the maximum yield achieved when injecting 1x10⁶ cells per mouse. Nevertheless, the alteration of the cytokine expression pattern in the recipients upon injection of Treg from different donors appears to correspond to the clinical phenotype (Figure 3A).
Since IL-6 participates in the pathogenesis of inflammatory and autoimmune diseases by downregulating Treg (43, 44), we studied whether IL-6 plays a role in the alteration of Treg in the absence of HCA2. FACS analysis of Treg revealed higher expression of IL-6 in HCA2-KO than in WT cells (Figure 5A). Epicutaneous application of IMQ induced the expression of IL-6 in Treg in both groups but to a much higher extent in HCA2-KO mice (Figure 5B). To address whether IL-6 is relevant for the functional alteration of Treg, HCA2-KO donors were injected i.p. with a neutralizing monoclonal anti-IL-6-antibody or left untreated. Treg were isolated from both groups and injected i.v. into IMQ-treated WT mice. The inflammatory response was significantly mitigated in the recipients of Treg obtained from anti-IL-6-treated HCA2-KO mice compared to recipients of Treg from untreated HCA2-KO donors (Figure 5C). Histopathological analysis revealed reduced inflammatory and epidermal effects in the skin of recipients of cells from anti-IL-6-treated HCA2-KO donors. We have not yet analyzed the phenotypic alteration of Treg obtained from HCA2-KO mice upon anti-IL-6 treatment. Preliminary data indicate that in the recipients of cells of anti-IL-6-treated donors Treg express enhanced levels of IL-10 and GARP which may contribute to the mitigation of the IMQ-induced inflammatory response (Supplementary Figure 5). In turn, WT Treg lost their suppressive activity upon injection of IL-6 into the donors. In this case the inflammatory IMQ-response was not at all reduced in the recipients upon adoptive transfer of Treg (Figure 5D). In addition, IL-6 serum levels were increased upon IMQ administration, this increase was much more pronounced in HCA2-KO than WT mice (Figure 5E).
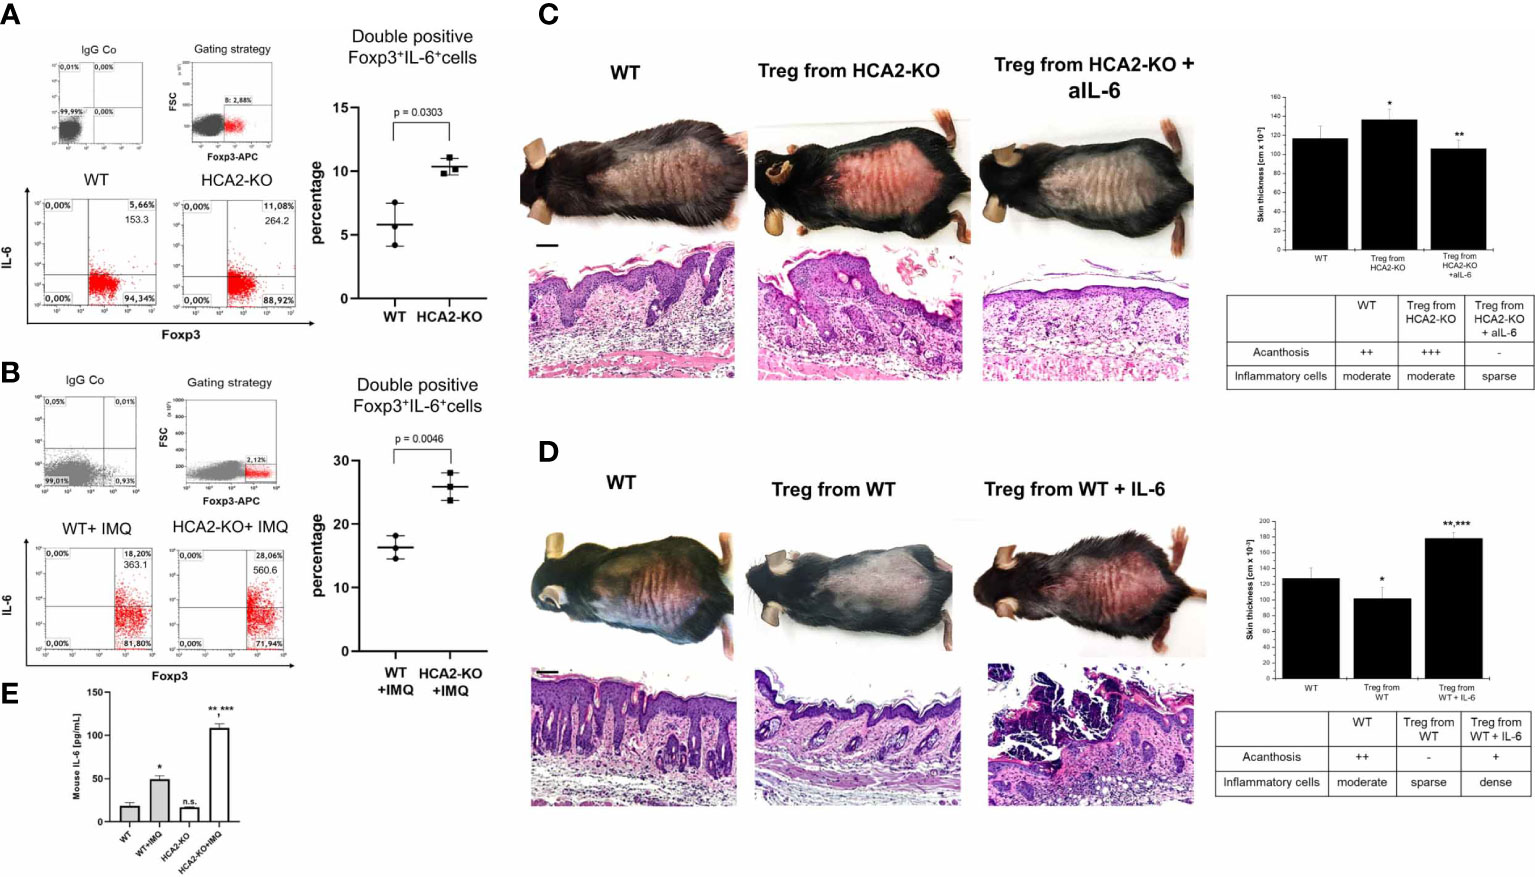
Figure 5 IL-6 appears to be involved in the alteration of Treg in the absence of HCA2. Pooled LN cells and splenocytes obtained from 4 naïve mice (A) or 4 IMQ-treated (B) WT and HCA2-KO mice were analyzed for double positive Foxp3/IL-6 cells and is demonstrated as percentage and total number of double positive cells. FACS analysis is also shown as a scatter graph with mean ± SD. Y axes show percentage of double positive cells. Data were analyzed by using the t test with Welch´s correction. n = 3 (C) Treg were obtained from naïve HCA2-KO or from HCA2-KO mice injected i.p. with a rat monoclonal anti-IL-6 antibody. The isolated Treg cells were injected i.v. into IMQ-treated WT mice. Biopsies from IMQ-treated recipients were taken; paraffin embedded sections were stained with H&E and analyzed histopathologically. Scale bar = 100µm. Skin thickness was measured using a spring-loaded micrometer. Student t test and one-way ANOVA was performed. *P < 0.025 WT vs Treg from HCA2-KO, **P < 0.0003 Treg from HCA2-KO vs Treg from HCA2-KO+anti IL-6; PANOVA = 9.9x10⁻⁴. Acanthosis and density of inflammatory infiltrate were scored. Each group contained 7 animals. (D) Treg were obtained from naïve WT mice or WT mice injected i.p. with IL-6. The isolated Treg cells were injected i.v. into IMQ-treated WT mice. Biopsies from IMQ-treated recipients were taken; paraffin embedded sections were stained with H&E and analyzed histopathologically. Macroscopical and histopathologic pictures of untreated WT mice are not shown for the sake of space. Scale bar = 100 µm. Skin thickness was measured using a spring-loaded micrometer. Student t test and one-way ANOVA was performed. *P < 0.02 WT vs Treg from WT, **P < 0.0002 WT vs Treg from WT+IL-6, ***P < 0.002 Treg from WT vs Treg from WT+IL-6; PANOVA = 3.2x10⁻⁵. Acanthosis and density of inflammatory infiltrate were scored. Each group contained 7 animals. Data are presented from one of three independent experiments. (E) Serum was obtained from untreated or IMQ-treated WT and HCA2-KO mice, respectively, and IL-6 serum levels were measured using an ELISA. Data were analyzed by using the t test with Welch´s correction and one-way ANOVA. *P = 0.0004 WT vs WT+IMQ; **P = 0.0008 HCA2-KO vs HCA2-KO+IMQ; ***P = 0.0001 WT+IMQ vs HCA2-KO+IMQ; n.s. = 0.4098 WT vs HCA2-KO; PANOVA = 3.05815x10⁻¹¹; n = 3.
The skin and mucosal surfaces are colonized by large numbers of microorganisms commonly referred to as the microbiota. A complex interplay between the host immune system and the microbiota is necessary to maintain homeostasis in the gut and the skin (45, 46). Accordingly, interruptions of the relationship between the host and the microbiota can cause autoimmune reactions (47). Since there is a crosstalk between HCAs and the microbiota which involves also SCFA, we studied whether HCA2-KO mice differed in their skin microbiota from WT mice. Skin swab sampling of the back skin was performed. The microbiome of HCA2-KO mice housed under regular conditions in our animal facility was characterized by 16S rRNA sequencing and compared to that of WT mice. We hypothesized that the impaired activity of Treg and the thereby caused enhanced susceptibility to psoriasis-like inflammation upon IMQ-treatment could be explained by the transmission of a disease-predisposing bacterial community. Therefore, we performed co-housing experiments with WT and HCA2-KO mice. WT mice were co-housed with HCA2-KO mice for 1 month. For control purposes strains were housed in a single setting.
The skin microbiome of mice, as a key immunomodulatory player, was analyzed based on swab samples, assessing composition and diversity employing 16S rRNA sequencing methods. A decrease in alpha diversity (Shannon index, quantifying within sample variation) was observed upon co-housing the animals. This effect was more pronounced in WT mice (P = 0.038), while in HCA2-KO mice the observed trend was not significant (Figure 6A). Similarly, assessing the beta diversity (Bray-Curtis dissimilarity, quantifying between sample variation) documented that WT animals and HCA2-KO mice represent to separate groups based on their microbiome when single-housed (P = 0.001), while their differences were reduced when co-housed (Figure 6B). Analysis of the relative abundance of the phyla revealed a higher proportion of Bacteroidetes and Verrucomicrobia in WT animals than in HCA2-KO mice when single-housed.
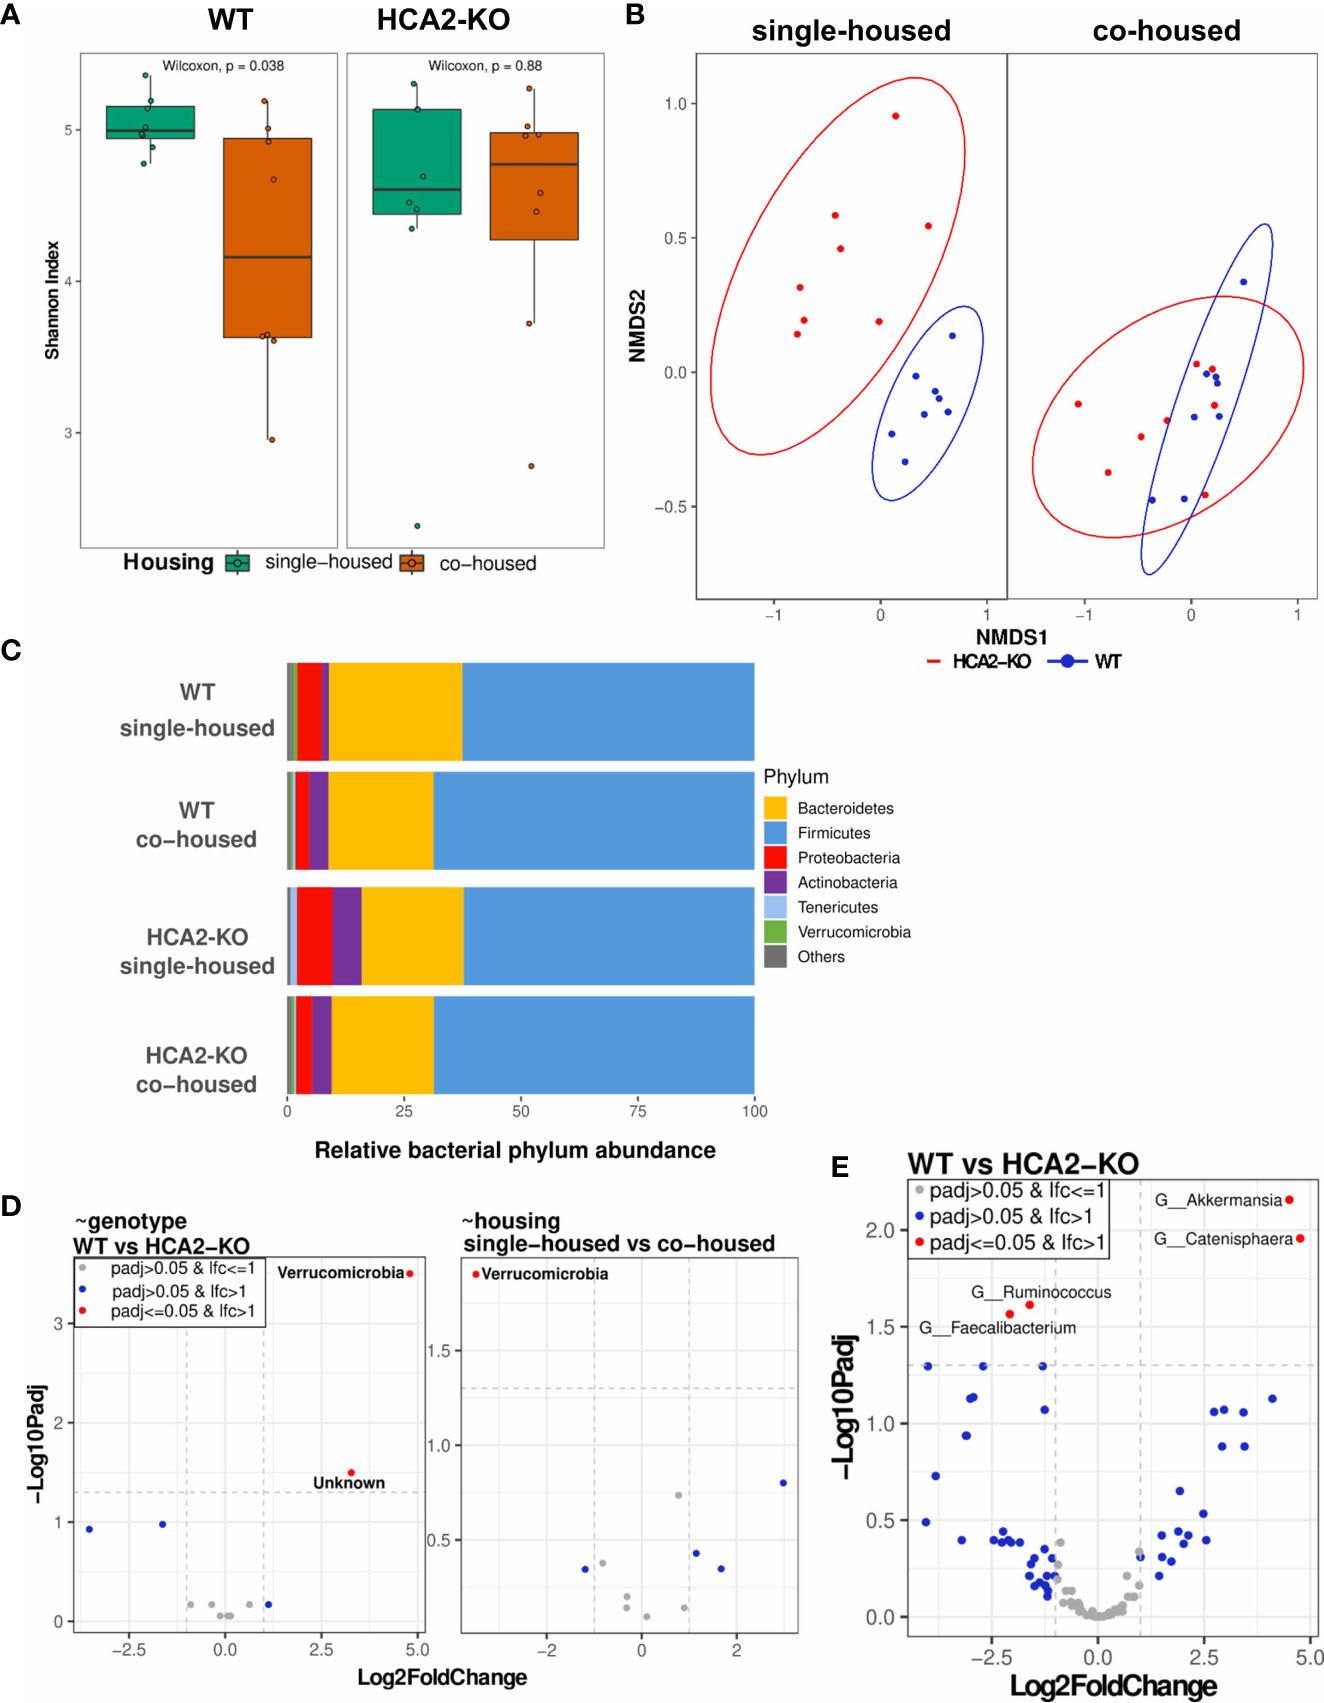
Figure 6 Skin dysbiosis in the absence of HCA2 predisposes mice to psoriasis-like inflammation. WT mice were co-housed with HCA2-KO mice for 1 month. 16S rRNA sequencing was performed. (A) Alpha diversity (Shannon Index) between WT and HCA2-KO mice, while colors indicate housing conditions. (B) Beta diversity calculated with Bray-Curtis dissimilarity and displayed by non-metric multidimensional scaling (NMDS) between single- and co-housed mice, while colors indicate genotype. (C) Relative bacterial abundance at phylum level split for the different genotype and housing conditions. (D) Differential abundance at phylum level based on linear models by genotype (left) and by housing (right). Volcano plot visualizes –Log10 Benjamini-Hochberg adjusted p-value over Log2FoldChange (LFC). LFC is depicted as relative to HCA2-KO (left) and co-housed (right), i.e. a negative LFC displaying a reduced abundance in WT compared to HCA-KO mice in the left graph and a reduced abundance in single-housed compared to co-housed mice in the right graph. (E) Differential abundance at genus level based on linear models by genotype. Volcano plot visualizes –Log10 Benjamini-Hochberg adjusted p-value over Log2FoldChange. A negative LFC shows genera with reduced abundance in WT mice, whereas a positive LFC shows genera more abundant in WT mice. No genus was significantly differentially abundant by housing (data not shown). Each group contained 8 animals. Data are presented from one of three independent experiments.
In contrast to that, single-housed HCA2-KO mice showed higher proportions of Proteobacteria, Actinobacteria and Tenericutes than WT animals (Figure 6C). In co-housed conditions, these differences were diminished. A detailed differential abundance analysis based on linear models uncovered Verrucomicrobia as the only significantly regulated phylum, showing a higher abundance when comparing WT animals versus HCA2-KO mice (p-value (P) = 0.003, Log2FoldChange (LFC) = 4.8) as well as when comparing co-housed vs. single housed scenarios (P = 0.013, LFC = 3.5; Figure 6D). As part of this, Verrucomicrobia could not be detected in any of the single housed HCA2-KO mice. Further characterization of differentially abundant genera revealed significantly reduced Ruminococcus (P = 0.024, LFC –1,6) and Faecalibacterium (P = 0.027, LFC -2.1) genus abundances in WT compared to HCA2-KO mice, whereas Akkermansia (P = 0.007, LFC 4.5) and Catenisphaera (P = 0.011, LFC 4.8) genus abundances were significantly elevated in WT compared to HCA2-KO mice (Figure 6E).
These changes gave rise to the speculation that the susceptibility to IMQ-induced psoriasis-like inflammation in HCA2-KO mice may be due to a dysbiotic bacterial flora which ultimately alters the function of Treg. Thus, we studied whether the altered skin microbiota is associated with the outcome of IMQ-induced inflammation in single- and co-housed mice. Therefore, animals were treated for 7 days with IMQ after 1 month of co-housing. As described above, the psoriasis-like skin inflammation was enhanced in single-housed HCA2-KO animals, when compared to single-housed WT mice. The morbidity (skin redness, scaling, hemorrhage and thickness) was significantly enhanced in WT mice upon co-housing with HCA2-KO animals (Figure 7A). This was also observed histopathologically. In contrast, the exaggerated inflammatory response of IMQ-treated HCA2-KO animals co-housed with WT mice was remarkably mitigated (Figure 7A). Together, these changes of the skin microbiota might be responsible for increased susceptibility to psoriasis-like skin inflammation in HCA2-KO animals.
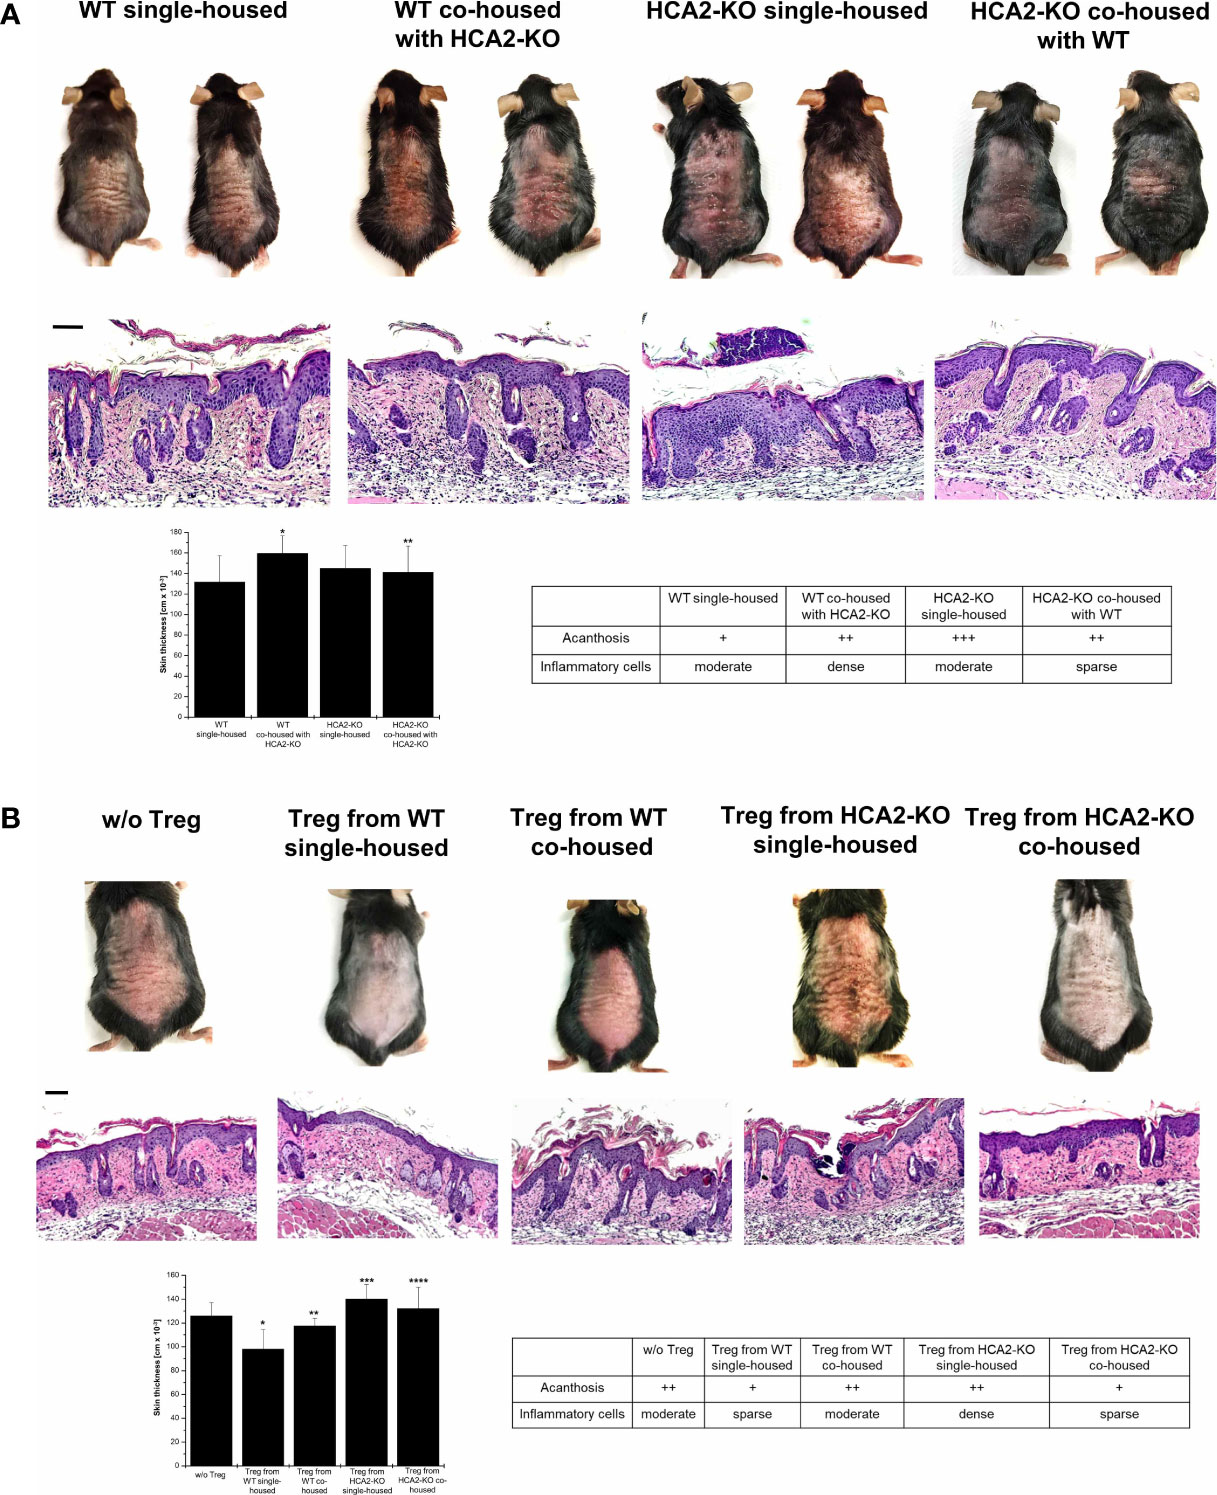
Figure 7 The skin microbiota determines the suppressive activity and function of Treg in HCA2-KO mice. (A) WT mice were co-housed with HCA2-KO mice for 1 month (each group contained 6 animals). Mice were treated topically with 5% IMQ cream on the shaved backs for 7 days. Biopsies were taken, paraffin embedded sections stained with H&E and analyzed histopathologically. Single housed HCA2-KO and WT mice served as controls. Scale bar = 100 µm. The skin thickness was measured using a spring-loaded micrometer. Student t test and one-way ANOVA was performed. *P < 0.015 WT single-housed vs WT co-housed, **P < 0.04 HCA2-KO single-housed vs HCA2-KO co-housed; PANOVA = 0.00758. The acanthosis and space of inflammatory cells was scored. Data are presented from one of three independent experiments. (B) WT mice were co-housed with HCA2-KO mice for 1 month. Treg were obtained either from 6 co-housed HCA2-KO or 6 co-housed WT mice and injected i.v. into IMQ-treated WT mice. As controls, Treg from 6 single-housed HCA2-KO or 6 single-housed WT mice were injected in the same fashion. Biopsies were taken, paraffin embedded sections stained with H&E and analyzed histopathologically. Scale bar = 100 µm. Skin thickness was measured using a spring-loaded micrometer. Student t test and one-way ANOVA were performed. *P < 0.009 w/o Treg vs Treg from WT single-housed, **P < 0.015 Treg from WT single-housed vs Treg from WT co-housed, ***P < 0.0025 Treg WT single-housed vs Treg from HCA2-KO single-housed, ****P < 0.05 Treg from HCA2-KO single-housed vs from HCA2-KO co-housed; PANOVA = 0.00113. Acanthosis and density of inflammatory infiltrate were scored. Data are presented from one of three independent experiments.
Given that the transmissible, modified composition of skin microbiota might be responsible for the increased susceptibility to psoriasis-like skin inflammation in HCA2-KO mice, we hypothesized that a further consequence of the microbiota shift might be an altered activity of Treg. This was addressed by adoptive transfer experiments under co-housing conditions. After 1 month of co-housing Treg were isolated from all groups and injected into WT mice which were treated with IMQ. Treg obtained from single-housed WT mice reduced IMQ-induced inflammation. In contrast, Treg from WT mice co-housed with HCA2-KO mice did not mitigate the IMQ-induced inflammatory response (Figure 7B). The reverse was observed for HCA2-KO mice. As described above, the inflammatory response was significantly stronger pronounced in animals injected with Treg from single-housed HCA2-KO mice. Upon injection of Treg from co-housed HCA2-KO mice, the inflammatory response was not enhanced, as observed upon injection of Treg from single housed HCA2-KO donors, but even reduced. The macroscopic alterations were also reflected by histopathologic analysis of representative skin samples (Figure 7B).
While the impact of the microbiome on the pathophysiology of psoriasis has been demonstrated in several studies (48), the mechanism by which the microbiome can modulate inflammatory responses in psoriasis remains mostly unclear. Here, we suggest how alteration of the microbiome can impact the inflammatory response in psoriasis. Dysbiosis of the skin microbiome may shift Treg from a suppressive into a proinflammatory type. Expression and signaling, respectively, of the G-protein-coupled receptor HCA2 appears to be crucially involved.
The rationale for this study was several-fold. It was primarily based on the observation that the SCFA SB can mitigate the inflammatory response in the IMQ-model which is accepted as a suitable model for psoriasis-like skin inflammation (20). There is also evidence that the mitigating effect of SB might also apply to the human system (19). Since SB signals via the G-protein-coupled receptor HCA2 and HCA2 expression is reduced in lesional psoriatic skin (25), we were interested to study the effect of HCA2 deficiency in the IMQ-model.
The inflammatory response to IMQ was much stronger pronounced in HCA2-KO mice. This exaggeration was not only confined to the skin but appeared to be also systemic as IMQ-induced splenomegaly was much stronger pronounced in HCA2-KO than in WT mice (data not shown). Since one pathogenetic mechanism in psoriasis is a reduced activity of Treg (4–6), we analyzed whether the same applies to HCA2 deficiency. Adoptive transfer experiments, however, yielded the surprising result that Treg from HCA2-KO mice were not only impaired in their suppressive activity but even enhanced the inflammatory response. Preliminary in situ double immunofluorescence analysis for Foxp3 and CD25 revealed a lower number of double positive cells in the skin of mice which had received Treg from HCA2-KO mice in comparison to recipients from Treg of WT donors. Upon injection of Treg from HCA2-KO mice, IMQ-treated WT recipients expressed higher levels of IL-17, IL-23 and IL-6 in comparison to the expression of these cytokines in WT-recipients of Treg from WT mice. In contrast, the expression of IL-10 was reduced upon injection of Treg from HCA2–KO mice. We have not analyzed whether the Treg express skin-homing receptors and thus cannot dissect at this stage the contribution of resident Treg versus into the skin immigrating Treg to the modulation of the cutaneous inflammation.
A similar alteration was previously described for several autoimmune disorders which were associated with pathogenic T helper-17 (Th17) cells (49) as well as with dysfunctional Treg (50). Bovenschen et al. (51) demonstrated that psoriatic Treg exhibit a tendency to decrease the expression of the master regulator Foxp3 and develop towards IL-17-producing Treg. Thus, our results imply that Treg in the absence of HCA2 might switch from a regulatory into a proinflammatory type. Soler et al. (52) identified IL-23 as the cytokine primarily responsible for this conversion (51). In concordance with this, we observed that upon inflammatory condition the expression of IL-17 and IL-23 was increased in HCA2-KO mice (Supplementary Figure 6). Furthermore, upon injection of HCA2-KO Treg, the recipients expressed higher levels of IL-23 in comparison to recipients of WT-Treg (Figure 4). The purity of CD4+CD25+ cells after positive selection was around 95%. This population, however, contained also a minor fraction of Foxp3-negative cells. Due to the intracellular expression, selection of Foxp3-positive cells for further functional analysis is not possible; which is a limitation of the method. However, since the proinflammatory shift was associated with a decrease of Foxp3 expression, we assume that the CD4+CD25+Foxp3+ cells are mostly responsible for this alteration.
This shift appears to be mediated via IL-6 since injection of a neutralizing anti-IL-6-antibody into HCA2-KO donors prevented such an alteration of Treg. In turn, a similar modification of Treg was observed when IL-6 was injected into WT donors. In this case, Treg enhanced the IMQ-response upon adoptive transfer. The mechanism for the enhanced expression of IL-6 in the absence of HCA2 remain to be determined as well as the mechanism by which IL-6 alters the status of Treg. In the latter scenario, histone deacetylation appears to play a role. Bovenschen et al. (51) demonstrated that in psoriasis Foxp3+ Treg convert into IL-17-Treg. The histone deacetylase inhibitor trichostatin-A blocked this conversion. Accordingly, we observed that histone acetylation in Treg obtained from psoriasis patients was decreased compared to H3 histones from healthy controls (19). SB upregulated histone acetylation, implying that SB acts as a histone deacetylation inhibitor (18). Whether IL-6 acts as a histone deacetylation inhibitor remains to be determined. Furthermore, IL-6 serum levels were increased upon IMQ administration. This increase was much more pronounced in HCA2-KO than WT mice.
The modification of Treg in the absence of HCA2 could be influenced by the skin microbiome. Since there is a crosstalk between HCAs and the microbiota which involves also SCFA (12, 21, 25, 53–57), we studied the impact of HCA2 on the skin microbiota by comparing WT animals to HCA2-KO mice employing 16S rRNA sequencing of skin swab samples.
Primarily, we observed a microbiome dysbiosis in susceptible animals, similar to what has been described previously for psoriasis as well as for other inflammatory diseases affecting epithelia in humans (58). The exact nature of this dysbiosis is difficult to disentangle, as the bacterial communities often consist of hundreds of species. Nevertheless, in the present scenario, we observed a substantially elevated relative abundance of the genus Akkermansia, from the phylum Verrucomicrobia in WT mice when compared to the HCA2-KO animals (Figure 6E). Of note, it is known that Akkermansia (A.) muciniphila has a protective effect against inflammation because A. muciniphila ameliorates chronic colitis of mice through the cross-talk of microbe-derived SCFAs and Foxp3+ Treg (59, 60). Furthermore, A. muciniphila supplementation suppressed colon inflammation and increased the frequency of colonic Treg (61). Additionally, previous studies reported that p.Verrucomicrobia is negatively correlated with obesity, since reduced abundance of p.Verrucomicrobia in the gut resulted in obesity in humans and animals (62, 63). HCA2-KO mice also tend to obesity. Interestingly, the majority of publications analyzed the role of p.Verrucomicrobia only in the gut. One of the reasons seems to be that Akkermansia was initially described as a strict anaerobe. However, more recently, it was reported that Akkermansia tolerates small amounts of oxygen and even benefits from low levels of oxygen (64). Along this line, Verrucomicrobia was also detected on the skin. Stehlikova et al. (65) analyzed the microbiota of the skin and of the intestine in Balb/c and C57BL/6 mice and detected also a low amount of Verrucomicrobia on the skin. It might be possible that the skin microbiota was not very often searched for Verrucomicrobia, because it was anticipated that this phylum is strictly anaerobe.
In our experiments, the microbiome displayed at least partially a causative component. When mice interacted, e.g. by being co-housed, their microbiome was transferred between each other. In the experimental setup presented here, this resulted in the microbiomes becoming more similar to each other. This microbial transfer resulted in transferring phenotypic features. We observed that co-housed HCA2-KO mice showed slightly less inflammation in the IMQ-model than single-housed HCA2-KO mice. This difference seems to be maintained when administering the respective Treg. While we observed that WT mice have an increased inflammatory phenotype in the IMQ-model when co-housed with HCA2-KO mice, our experimental setup does not allow to identify the specific species responsible for this difference. Besides this limitation, it is probable that this is due to the ensemble of additional species that populate WT animals when co-housed with HCA2-KO mice, as observed in the analysis of alpha and beta diversity. This dysbiosis could cause a hyperstimulation of the immune system resulting in increased inflammation. In this context, it has to be noted that our data does not allow to pinpoint a direct molecular effect on the host, such as correlations between alpha diversity and molecular markers (e.g., SCFA receptor mRNA expression). Following this up would require a separate study with an experimental design that specifically aims to elucidate host-microbiome interactions. Couturier-Maillard et al. (66) reported that disturbances of balance state of commensals in the gut directly or indirectly contribute to the pathogenesis of several immune-mediated intestinal illnesses such a Crohn’s disease and colitis. They observed that WT mice that were transiently co-housed with Nod2-KO mice, which are more susceptible to an induced colitis, developed an increased susceptibility to colitis. In concordance with this, we demonstrated similar effects in the IMQ-induced psoriasis-like skin inflammation model. We extended co-housing for up to two months. At this point, the phenotypic alterations remained more or less the same. The same seems to apply to the microbiota.
As a final point, it should be mentioned that A. muciniphila represents a gut microbiota signature in psoriasis (67). 16S rRNA sequencing revealed that the abundance of A. muciniphila was significantly reduced in patients with psoriasis. A. muciniphila is believed to have an important function in the pathogenesis of inflammatory bowel diseases and obesity. The authors reported that beside an alteration in the total diversity of microbiota between psoriasis and healthy control, the abundance of A. muciniphila is remarkably reduced in patients with psoriasis. This does not only support the validity of the model employed here, but also indicates a potential key-role of Akkermansia in this crosstalk, which still requires further studies. These should be focusing on species level classification by advanced methods like metagenomics, additional PCR screening and metabolomics studies to infer causality on molecular level.
Keeping this in mind, our data still illustrates changes in the relative composition of the HCA2-KO skin microbiome. While little is known about skin microbiota producing SCFA, our data cannot exclude either origin of the SCFA. Further studies will be needed to determine whether SCFA are produced in the skin at significant levels to alter an immune response. Nevertheless, topical application of SB was found to tone down inflammatory responses (18). However, we have not yet tested whether topically applied SB reduces the exaggerated IMQ response in HCA2-KO mice.
The data so far demonstrated the consequences of HCA2-deficiency several-fold: (i) the psoriasis-like inflammation response to IMQ is remarkably enhanced; (ii) Treg may switch from a regulatory into a proinflammatory type; (iii) IL-6 expression is enhanced; (iv) the skin microbiome is altered, which appears to be the most upstream phenomenon in this cascade (Figure 8). This was supported by co-housing experiments. The regulatory activity of Treg in WT mice could be impaired by co-housing of WT mice with HCA2-KO mice, and in turn the proinflammatory activity of Treg in HCA2-KO mice could be reversed by co-housing with WT mice. We have not yet performed detailed phenotypic analysis of the Treg within the co-housing experiments, preliminary data indicate that the enhanced proinflammatory activity appears to be associated with a decreased expression of Foxp3 and vice versa. Since the co-housing was associated with an alteration of the skin microbiome, we surmise that this could be the most upstream event. The in vivo response to IMQ was changed accordingly upon co-housing. However, our co-housing experiments cannot rule out changes in the microbiome of the gut or any other organ as well which is a limitation of this in vivo model.
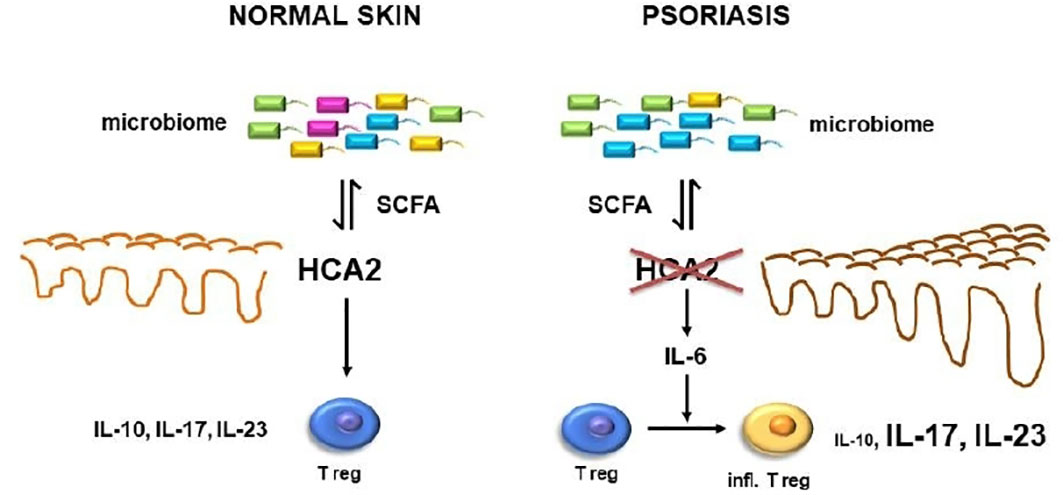
Figure 8 In psoriasis, reduced expression of HCA2 which may be mutually influenced by an altered skin microbiome may result in enhanced expression of IL-6 which may switch Treg into a proinflammatory cell type. This appears to be associated with a reduced expression of IL-10 and an enhanced expression of IL-17 and IL-23.
While causality of the microbiome and the corresponding molecular effects on the host site are difficult to demonstrate, our findings provide further support for the hypothesis that the microbiome may play a key role in modulating the host’s immune response via HCA2 and Treg in the murine psoriasis-like inflammation model. These findings may have implications for the development of future strategies to treat psoriasis. Firstly, the altered skin microbiome could be changed with the ultimate aim to modulate the inflammatory psoriatic response, as it has been already demonstrated successfully for atopic dermatitis (68, 69). A second option would be topical application of SB. The effect may be several-fold, firstly a direct modulation of Treg, as demonstrated previously (16), and secondly via restoration of the expression of HCA2 (25) which ultimately influences the skin microbiome.
The datasets presented in this study can be found in online repositories. The names of the repository/repositories and accession number(s) can be found below: https://www.ncbi.nlm.nih.gov/, PRJNA836403.
The animal study was reviewed and approved by Animal Welfare Commission of Ministry of Energy, Agriculture, the Environment, Nature and Digitalization of the Federal State Schleswig-Holstein.
Conceptualization: AS and TS; Formal Analysis: AS, RH, SR-J, JH, and SP; Funding Acquisition: AS and TS; Investigation: AS and RP; Methodology: AS, RH, SR-J, JH, and SP; Resources: TS and SR-J; Supervision: AS and TS; Validation: AS, RH, SP, and JH; Visualization: AS, RP, and JH; Writing - Original Draft Preparation: AS, RH, and TS; Writing - Review and Editing: TS. All authors contributed to the article and approved the submitted version.
This study was supported by a grant from the Deutsche Forschungsgemeinschaft (SCHW 625/10-1). Sequencing, NGS data management and data processing were supported by the CCGA (DFG, INST 257/605-1) as well as by the Cluster of Excellence ExC PMI 2167. RH is supported by Immuniverse (853995), BIOMAP (821511), E:med sysINFLAME (01ZX1306), miTarget (DFG, FOR 5042, P4), and the CRC1182 (DFG, Z3). SP was supported by the “Margarita Salas Grant for the Requalification of the Spanish University System (2021-2023)”. The authors are grateful to Corinna Bang for help in processing the raw data of the skin microbiome.
SR-J has acted as a consultant and speaker for AbbVie, Chugai, Genentech Roche, Pfizer and Sanofi. He also declares that he is an inventor on patents owned by CONARIS Research Institute, which develops the sgp130Fc protein Olamkicept together with the companies Ferring and I-Mab. He has stock ownership in CONARIS. The remaining authors declare that the research was conducted in the absence of any commercial or financial relationships that could be construed as a potential conflict of interest.
All claims expressed in this article are solely those of the authors and do not necessarily represent those of their affiliated organizations, or those of the publisher, the editors and the reviewers. Any product that may be evaluated in this article, or claim that may be made by its manufacturer, is not guaranteed or endorsed by the publisher.
The Supplementary Material for this article can be found online at: https://www.frontiersin.org/articles/10.3389/fimmu.2023.1038689/full#supplementary-material
Supplementary Figure 1 | Cells from LN and spleens obtained from 4 WT and 4 HCA2-KO mice were isolated separately and subjected to FACS analysis. Cells were gated for Foxp3 and double positive cells (Foxp3/CD25) were analyzed. The number of double positive cells is displayed in the histograms. FACS analysis is also shown as scatter graph with mean ± SD. Y axes show percentage of double positive cells. Data were analyzed by using the t test with Welch´s correction (n = 3).
Supplementary Figure 2 | The clinical response to IMQ was quantified according to a modified PASI score by Wang et al. (24). The data for Figures 1A, 3A, 5C, D, 7A, B are shown.
Supplementary Figure 3 | Pooled lymph node cells and splenocytes obtained from 4 WT and 4 HCA2-KO mice were gated for Foxp3 and analyzed for the expression of CTLA-4, Helios, Ki-67, PD-1, CD73, FR4. The total cell number of double positive cells is displayed in the histograms. FACS analysis is also shown as scatter graph with mean ± SD. Y axes show percentage of double positive cells. Data were analyzed by using the t test with Welch´s correction (n = 3).
Supplementary Figure 4 | (A) Treg obtained from 7 HCA2-KO and 7 WT mice were stained with CFSE and injected i.v. into IMQ-treated WT animals. After 48 h LN and spleens were obtained from the recipient mice and FACS analysis of CFSE-negative (overlay of red histograms) was conducted. The expression of IL-6, IL-17, IL-23 and IL-10 was standardized to isotype controls. For IL-6, IL-17 and IL-23 the same IgG (rat IgG1) control was used. Histograms show fluorescence intensity (x axis) versus cell count (y-axis). The number of total cells is displayed in the histograms. (B) FACS analysis is also shown as scatter graph with mean ± SD. Y axes show percentage of double positive cells. Data were analyzed by using the t test with Welch´s correction. 1 WT untreated; 2 WT +IMQ + w/o Treg (n = 3).
Supplementary Figure 5 | Treg were obtained from naïve HCA2-KO or from HCA2-KO mice injected i.p. with a rat monoclonal anti-IL-6 antibody. The isolated Treg were injected i.v. into IMQ-treated WT recipient mice. LN and spleen cells from these recipients were analyzed for double positive Foxp3/IL-10, Foxp3/GARP and Foxp3/CD25 cells and demonstrated as percentage and total number of double positive cells.
Supplementary Figure 6 | Pooled lymph node cells and splenocytes were obtained from 4 IMQ-treated WT and 4 HCA2-KO mice. Cells were gated for Foxp3 and FACS analysis performed for CD25, IL-17 and IL-23. The number of double positive cells is displayed in the histograms. FACS analysis is also shown as scatter graph with mean ± SD. Y axes show percentage of double positive cells. Data were analyzed by using the t test with Welch´s correction (n = 3).
1. AlQassimi S, AlBrashdi S, Galadari H, Hashim MJ. Global burden of psoriasis - comparison of regional and global epidemiology, 1990 to 2017. Int J Dermatol (2020) 59:566–71. doi: 10.1111/ijd.14864
2. Rendon A, Schäkel K. Psoriasis pathogenesis and treatment. Int J Mol Sci (2019) 20:1475. doi: 10.3390/ijms20061475
3. Prinz JC. Autoimmune aspects of psoriasis: Heritability and autoantigens. Autoimmun Rev (2017) 16:970–9. doi: 10.1016/j.autrev.2017.07.011
4. Kanda N, Hoashi T, Saeki H. The defect in regulatory T cells in psoriasis and therapeutic approaches. J Clin Med (2021) 10:3880. doi: 10.3390/jcm10173880
5. Owczarczyk-Saczonek A, Czerwińska J, Placek W. The role of regulatory T cells and anti-inflammatory cytokines in psoriasis. Acta Dermatovenerol Alp Pannonica Adriat (2018) 27:17–23. doi: 10.15570/actaapa.2018.4
6. Stockenhuber K, Hegazy AN, West NR, Ilott NE, Stockenhuber A, Bullers SJ, et al. Foxp3+ T reg cells control psoriasiform inflammation by restraining an IFN-i-driven CD8+ T cell response. J Exp Med (2018) 215:1987–98. doi: 10.1084/jem.20172094
7. Arpaia N, Campbell C, Fan X, Dikiy S, van der Veeken J, deRoos P, et al. Metabolites produced by commensal bacteria promote peripheral regulatory T-cell generation. Nature (2013) 504:451–5. doi: 10.1038/nature12726
8. Furusawa Y, Obata Y, Fukuda S, Endo TA, Nakato G, Takahashi D, et al. Commensal microbe-derived butyrate induces the differentiation of colonic regulatory T cells. Nature (2013) 504:446–50. doi: 10.1038/nature12721
9. Nagano Y, Itoh K, Honda K. The induction of treg cells by gut-indigenous clostridium. Curr Opin Immunol (2012) 24:392–7. doi: 10.1016/j.coi.2012.05.007
10. Trompette A, Gollwitzer ES, Yadava K, Sichelstiel AK, Sprenger N, Ngom-Bru C, et al. Gut microbiota metabolism of dietary fiber influences allergic airway disease and hematopoiesis. Nat Med (2014) 20:159–66. doi: 10.1038/nm.3444
11. Maslowski KM, Vieira AT, Ng A, Kranich J, Sierro F, Yu D, et al. Regulation of inflammatory responses by gut microbiota and chemoattractant receptor GPR43. Nature (2009) 461:1282–6. doi: 10.1038/nature08530
12. Smith PM, Howitt MR, Panikov N, Michaud M, Gallini CA, Bohlooly-Y M, et al. The microbial metabolites, short-chain fatty acids, regulate colonic treg cell homeostasis. Science (2013) 341:569–73. doi: 10.1126/science.1241165
13. Liu YJ, Tang B, Wang FC, Tang L, Lei YY, Luo Y, et al. Parthenolide ameliorates colon inflammation through regulating Treg/Th17 balance in a gut microbiota-dependent manner. Theranostics (2020) 10:5225–41. doi: 10.7150/thno.43716
14. Nishida A, Nishino K, Ohno M, Sakai K, Owaki Y, Noda Y, et al. Update on gut microbiota in gastrointestinal diseases. World J Clin cases (2022) 10:7653–64. doi: 10.12998/wjcc.v10.i22.7653
15. Zhang Y, Si X, Yang L, Wang H, Sun Y, Liu N. Association between intestinal microbiota and inflammatory bowel disease. Anim Model Exp Med (2022) 5:311–22. doi: 10.1002/ame2.12255
16. Belkaid Y, Naik S. Compartmentalized and systemic control of tissue immunity by commensals. Nat Immunol (2013) 14:646–53. doi: 10.1038/ni.2604
17. Ochoa-Repáraz J, Mielcarz DW, Ditrio LE, Burroughs AR, Foureau DM, Haque-Begum S, et al. Role of gut commensal microflora in the development of experimental autoimmune encephalomyelitis. J Immunol (2009) 183:6041–50. doi: 10.4049/jimmunol.0900747
18. Schwarz A, Bruhs A, Schwarz T. The short-chain fatty acid sodium butyrate functions as a regulator of the skin immune system. J Invest Dermatol (2017) 137:855–64. doi: 10.1016/j.jid.2016.11.014
19. Schwarz A, Philippsen R, Schwarz T. Induction of regulatory T cells and correction of cytokine disbalance by short-chain fatty acids: Implications for psoriasis therapy. J Invest Dermatol (2021) 141:95–104. doi: 10.1016/j.jid.2020.04.031
20. van der Fits L, Mourits S, Voerman JS, Kant M, Boon L, Laman JD, et al. Imiquimod-induced psoriasis-like skin inflammation in mice is mediated via the IL-23/IL-17 axis. J Immunol (2009) 182:5836–45. doi: 10.4049/jimmunol.0802999
21. Singh N, Gurav A, Sivaprakasam S, Brady E, Padia R, Shi H, et al. Activation of Gpr109a, receptor for niacin and the commensal metabolite butyrate, suppresses colonic inflammation and carcinogenesis. Immunity (2014) 40:128–39. doi: 10.1016/j.immuni.2013.12.007
22. Jobin C. GPR109a: the missing link between microbiome and good health? Immunity (2014) 40:8–10. doi: 10.1016/j.immuni.2013.12.009
23. Sivaprakasam S, Gurav A, Paschall AV, Coe GL, Chaudhary K, Cai Y, et al. An essential role of Ffar2 (Gpr43) in dietary fibre-mediated promotion of healthy composition of gut microbiota and suppression of intestinal carcinogenesis. Oncogenesis (2016) 5:e238. doi: 10.1038/oncsis.2016.38
24. Tan J, McKenzie C, Potamitis M, Thorburn AN, Mackay CR, Macia L. The role of short-chain fatty acids in health and disease. Adv Immunol (2014) 121:91–119. doi: 10.1016/B978-0-12-800100-4.00003-9
25. Krejner A, Bruhs A, Mrowietz U, Wehkamp U, Schwarz T, Schwarz A. Decreased expression of G-protein-coupled receptors GPR43 and GPR109a in psoriatic skin can be restored by topical application of sodium butyrate. Arch Dermatol Res (2018) 310:751–8. doi: 10.1007/s00403-018-1865-1
26. Tunaru S, Kero J, Schaub A, Wufka C, Blaukat A, Pfeffer K, et al. PUMA-G and HM74 are receptors for nicotinic acid and mediate its anti-lipolytic effect. Nat Med (2003) 9:352–5. doi: 10.1038/nm824
27. Wang Y, Zhao J, Zhang L, Liu X, Lin Y, Di T, et al. Suppressive effect of beta, beta-dimethylacryloyl alkannin on activated dendritic cells in an imiquimod-induced psoriasis mouse model. Int J Clin Exp Pathol (2015) 8:6665–73.
28. Rodríguez-Perea AL, Arcia ED, Rueda CM, Velilla PA. Phenotypical characterization of regulatory T cells in humans and rodents. Clin Exp Immunol (2016) 185:281–91. doi: 10.1111/cei.12804
29. Ehlers M, Grötzinger J, deHon FD, Müllberg J, Brakenhoff JP, Liu J, et al. Identification of two novel regions of human IL-6 responsible for receptor binding and signal transduction. J Immunol (1994) 153:1744–53. doi: 10.4049/jimmunol.153.4.1744
30. Coulie PG, Stevens M, Van Snick J. High- and low-affinity receptors for murine interleukin 6. distinct distribution on b and T cells. Eur J Immunol (1989) 19:2107–14. doi: 10.1002/eji.1830191121
31. Thingholm LB, Bang C, Rühlemann MC, Starke A, Sicks F, Kaspari V, et al. Ecology impacts the decrease of spirochaetes and prevotella in the fecal gut microbiota of urban humans. BMC Microbiol (2021) 21:276. doi: 10.1186/s12866-021-02337-5
32. Kozich JJ, Westcott SL, Baxter NT, Highlander SK, Schloss PD. Development of a dual-index sequencing strategy and curation pipeline for analyzing amplicon sequence data on the MiSeq illumina sequencing platform. Appl Environ Microbiol (2013) 79:5112–20. doi: 10.1128/AEM.01043-13
33. Callahan BJ, McMurdie PJ, Rosen MJ, Han AW, Johnson AJ, Holmes SP. DADA2: High-resolution sample inference from illumina amplicon data. Nat Methods (2016) 13:581–3. doi: 10.1038/nmeth.3869
34. Zhou H, He K, Chen J, Zhang X. LinDA: Linear models for differential abundance analysis of microbiome compositional data. Genome Biol (2022) 23:95. doi: 10.1186/s13059-022-02655-5
35. Tran DQ, Andersson J, Wang R, Ramsey H, Unutmaz D, Shevach EM. GARP (LRRC32) is essential for the surface expression of latent TGF-beta on platelets and activated FOXP3+ regulatory T cells. Proc Natl Acad Sci U.S.A. (2009) 106:13445–50. doi: 10.1073/pnas.0901944106
36. Elkord E, Abd Al Samid M, Chaudhary B. Helios, And not FoxP3, is the marker of activated tregs expressing GARP/LAP. Oncotarget (2015) 6:20026–36. doi: 10.18632/oncotarget.4771
37. Santegoets SJ, Dijkgraaf EM, Battaglia A, Beckhove P, Britten CM, Gallimore A, et al. Monitoring regulatory T cells in clinical samples: Consensus on an essential marker set and gating strategy for regulatory T cell analysis by flow cytometry. Cancer Immunol Immunother (2015) 64:1271–86. doi: 10.1007/s00262-015-1729-x
38. Ring S, Enk AH, Mahnke K. Regulatory T cells from IL-10-deficient mice fail to suppress contact hypersensitivity reactions due to lack of adenosine production. J Invest Dermatol (2011) 131:1494–502. doi: 10.1038/jid.2011.50
39. Kinoshita M, Kayama H, Kusu T, Yamaguchi T, Kunisawa J, Kiyono H, et al. Dietary folic acid promotes survival of Foxp3+ regulatory T cells in the colon. J Immunol (2012) 189:2869–78. doi: 10.4049/jimmunol.1200420
40. Kamada T, Togashi Y, Tay C, Ha D, Sasaki A, Nakamura Y, et al. PD-1+ regulatory T cells amplified by PD-1 blockade promote hyperprogression of cancer. Proc Natl Acad Sci U.S.A. (2019) 116:9999–10008. doi: 10.1073/pnas.1822001116
41. Tan CL, Kuchroo JR, Sage PT, Liang D, Francisco LM, Buck J, et al. PD-1 restraint of regulatory T cell suppressive activity is critical for immune tolerance. J Exp Med (2021) 218:e20182232. doi: 10.1084/jem.20182232
42. Bettini M, Vignali DA. Regulatory T cells and inhibitory cytokines in autoimmunity. Curr Opin Immunol (2009) 21:612–8. doi: 10.1016/j.coi.2009.09.011
43. Bettelli E, Carrier Y, Gao W, Korn T, Strom TB, Oukka M, et al. Reciprocal developmental pathways for the generation of pathogenic effector TH17 and regulatory T cells. Nature (2006) 441:235–8. doi: 10.1038/nature04753
44. Dominitzki S, Fantini MC, Neufert C, Nikolaev A, Galle PR, Scheller J, et al. Cutting edge: Trans-signaling via the soluble IL-6R abrogates the induction of FoxP3 in naive CD4+CD25 T cells. J Immunol (2007) 179:2041–5. doi: 10.4049/jimmunol.179.4.2041
45. Coates M, Lee MJ, Norton D, MacLeod AS. The skin and intestinal microbiota and their specific innate immune systems. Front Immunol (2019) 10:2950. doi: 10.3389/fimmu.2019.02950
46. Santacroce L, Man A, Charitos IA, Haxhirexha K, Topi S. Current knowledge about the connection between health status and gut microbiota from birth to elderly. A narrative review. Front Biosci (Landmark Ed) (2021) 26:135–48. doi: 10.52586/4930
47. Polkowska-Pruszyńska B, Gerkowicz A, Krasowska D. The gut microbiome alterations in allergic and inflammatory skin diseases - an update. J Eur Acad Dermatol Venereol (2020) 34:455–64. doi: 10.1111/jdv.15951
48. Liang X, Ou C, Zhuang J, Li J, Zhang F, Zhong Y, et al. Interplay between skin microbiota dysbiosis and the host immune system in psoriasis: Potential pathogenesis. Front Immunol (2021) 12:764384. doi: 10.3389/fimmu.2021.764384
49. Tesmer LA, Lundy SK, Sarkar S, Fox DA. Th17 cells in human disease. Immunol Rev (2008) 223:87–113. doi: 10.1111/j.1600-065X.2008.00628.x
50. Brusko TM, Putnam AL, Bluestone JA. Human regulatory T cells: role in autoimmune disease and therapeutic opportunities. Immunol Rev (2008) 223:371–90. doi: 10.1111/j.1600-065X.2008.00637.x
51. Bovenschen HJ, van de Kerkhof PC, van Erp PE, Woestenenk R, Joosten I, Koenen HJ. Foxp3+ regulatory T cells of psoriasis patients easily differentiate into IL-17A-producing cells and are found in lesional skin. J Invest Dermatol (2011) 131:1853–60. doi: 10.1038/jid.2011.139
52. Soler DC, McCormick TS. The dark side of regulatory T cells in psoriasis. J Invest Dermatol (2011) 131:1785–6. doi: 10.1038/jid.2011.200
53. Kim MH, Kang SG, Park JH, Yanagisawa M, Kim CH. Short-chain fatty acids activate GPR41 and GPR43 on intestinal epithelial cells to promote inflammatory responses in mice. Gastroenterology (2013) 145:396–406.e1-10. doi: 10.1053/j.gastro.2013.04.056
54. Sivaprakasam S, Prasad PD, Singh N. Benefits of short-chain fatty acids and their receptors in inflammation and carcinogenesis. Pharmacol Ther (2016) 164:144–51. doi: 10.1016/j.pharmthera.2016.04.007
55. Sun M, Wu W, Liu Z, Cong Y. Microbiota metabolite short chain fatty acids, GPCR, and inflammatory bowel diseases. J Gastroenterol (2017) 52:1–8. doi: 10.1007/s00535-016-1242-9
56. Alarcon P, Manosalva C, Carretta MD, Hidalgo AI, Figueroa CD, Taubert A, et al. Fatty and hydroxycarboxylic acid receptors: The missing link of immune response and metabolism in cattle. Vet Immunol Immunopathol (2018) 201:77–87. doi: 10.1016/j.vetimm.2018.05.009
57. Carretta MD, Quiroga J, López R, Hidalgo MA, Burgos RA. Participation of short-chain fatty acids and their receptors in gut inflammation and colon cancer. Front Physiol (2021) 12:662739. doi: 10.3389/fphys.2021.662739
58. Kapoor B, Gulati M, Rani P, Gupta R. Psoriasis: Interplay between dysbiosis and host immune system. Autoimmun Rev (2022) 21:103169. doi: 10.1016/j.autrev.2022.103169
59. Bian X, Wu W, Yang L, Lv L, Wang Q, Li Y, et al. Administration of akkermansia muciniphila ameliorates dextran sulfate sodium-induced ulcerative colitis in mice. Front Microbiol (2019) 10:2259. doi: 10.3389/fmicb.2019.02259
60. Hänninen A, Toivonen R, Pöysti S, Belzer C, Plovier H, Ouwerkerk JP, et al. Akkermansia muciniphila induces gut microbiota remodelling and controls islet autoimmunity in NOD mice. Gut (2018) 67:1445–53. doi: 10.1136/gutjnl-2017-314508
61. Liu Y, Yang M, Tang L, Wang F, Huang S, Liu S, et al. TLR4 regulates RORγt+ regulatory T-cell responses and susceptibility to colon inflammation through interaction with akkermansia muciniphila. Microbiome (2022) 10:98. doi: 10.1186/s40168-022-01296-x
62. Zhong Y, Nyman M, Fåk F. Modulation of gut microbiota in rats fed high-fat diets by processing whole-grain barley to barley malt. Mol Nutr Food Res (2015) 59:2066–76. doi: 10.1002/mnfr.201500187
63. Cani PD, Depommier C, Derrien M, Everard A, de Vos WM. Akkermansia muciniphila: paradigm for next-generation beneficial microorganisms. Nat Rev Gastroenterol Hepatol (2022) 19:625–37. doi: 10.1038/s41575-022-00631-9
64. Ouwerkerk JP, van der Ark KCH, Davids M, Claassens NJ, Finestra TR, de Vos WM, et al. Adaptation of akkermansia muciniphila to the oxic-anoxic interface of the mucus layer. Appl Environ Microbiol (2016) 82:6983–93. doi: 10.1128/AEM.01641-16
65. Stehlikova Z, Kostovcikova K, Kverka M, Rossmann P, Dvorak J, Novosadova I, et al. Crucial role of microbiota in experimental psoriasis revealed by a gnotobiotic mouse model. Front Microbiol (2019) 10:236. doi: 10.3389/fmicb.2019.00236
66. Couturier-Maillard A, Secher T, Rehman A, Normand S, De Arcangelis A, Haesler R, et al. NOD2-mediated dysbiosis predisposes mice to transmissible colitis and colorectal cancer. J Clin Invest (2013) 123:700–11. doi: 10.1172/JCI62236
67. Tan L, Zhao S, Zhu W, Wu L, Li J, Shen M, et al. The akkermansia muciniphila is a gut microbiota signature in psoriasis. Exp Dermatol (2018) 27:144–9. doi: 10.1111/exd.13463
68. Nakatsuji T, Gallo RL, Shafiq F, Tong Y, Chun K, Butcher AM, et al. Use of autologous bacteriotherapy to treat staphylococcus aureus in patients with atopic dermatitis: A randomized double-blind clinical trial. JAMA Dermatol (2021) 157:978–82. doi: 10.1001/jamadermatol.2021.1311
Keywords: G-protein-coupled receptors, imiquimod, interleukins, microbiome, psoriasis, regulatory T cells, short chain fatty acids
Citation: Schwarz A, Philippsen R, Piticchio SG, Hartmann JN, Häsler R, Rose-John S and Schwarz T (2023) Crosstalk between microbiome, regulatory T cells and HCA2 orchestrates the inflammatory response in a murine psoriasis model. Front. Immunol. 14:1038689. doi: 10.3389/fimmu.2023.1038689
Received: 07 September 2022; Accepted: 02 February 2023;
Published: 20 February 2023.
Edited by:
Francesca Granucci, University of Milano-Bicocca, ItalyReviewed by:
Liliane Martins Dos Santos, Federal University of Minas Gerais, BrazilCopyright © 2023 Schwarz, Philippsen, Piticchio, Hartmann, Häsler, Rose-John and Schwarz. This is an open-access article distributed under the terms of the Creative Commons Attribution License (CC BY). The use, distribution or reproduction in other forums is permitted, provided the original author(s) and the copyright owner(s) are credited and that the original publication in this journal is cited, in accordance with accepted academic practice. No use, distribution or reproduction is permitted which does not comply with these terms.
*Correspondence: Thomas Schwarz, dHNjaHdhcnpAZGVybWF0b2xvZ3kudW5pLWtpZWwuZGU=
Disclaimer: All claims expressed in this article are solely those of the authors and do not necessarily represent those of their affiliated organizations, or those of the publisher, the editors and the reviewers. Any product that may be evaluated in this article or claim that may be made by its manufacturer is not guaranteed or endorsed by the publisher.
Research integrity at Frontiers
Learn more about the work of our research integrity team to safeguard the quality of each article we publish.