 Yafang Zhong1†
 Wei Zhang1,2,3†
 Dongzhou Liu4
 Zhipeng Zeng1
 Shengyou Liao1
 Wanxia Cai1Jiayi Liu1Lian Li1Xiaoping Hong4*
 Donge Tang1*
 Yong Dai1*
- 1Clinical Medical Research Center, Guangdong Provincial Engineering Research Center of Autoimmune Disease Precision Medicine, Shenzhen Engineering Research Center of Autoimmune Disease, The Second Clinical Medical College of Jinan University, Shenzhen People’s Hospital, Shenzhen, China
- 2South China Hospital, Health Science Center, Shenzhen University, Shenzhen, China
- 3Innovative Markers Department, Fapon Biotech Inc., Dongguan, China
- 4Department of Rheumatology and Immunology, Shenzhen People’s Hospital, The Second Clinical Medical College, Jinan University, The First Affiliated Hospital, Southern University of Science and Technology, Shenzhen, China
Background: Sjögren’s syndrome (SS) is a systemic autoimmune disease that affects about 0.04-0.1% of the general population. SS diagnosis depends on symptoms, clinical signs, autoimmune serology, and even invasive histopathological examination. This study explored biomarkers for SS diagnosis.
Methods: We downloaded three datasets of SS patients’ and healthy pepole’s whole blood (GSE51092, GSE66795, and GSE140161) from the Gene Expression Omnibus (GEO) database. We used machine learning algorithm to mine possible diagnostic biomarkers for SS patients. Additionally, we assessed the biomarkers’ diagnostic value using the receiver operating characteristic (ROC) curve. Moreover, we confirmed the expression of the biomarkers through the reverse transcription quantitative polymerase chain reaction (RT-qPCR) using our own Chinese cohort. Eventually, the proportions of 22 immune cells in SS patients were calculated by CIBERSORT, and connections between the expression of the biomarkers and immune cell ratios were studied.
Results: We obtained 43 DEGs that were mainly involved in immune-related pathways. Next, 11 candidate biomarkers were selected and validated by the validation cohort data set. Besides, the area under curves (AUC) of XAF1, STAT1, IFI27, HES4, TTC21A, and OTOF in the discovery and validation datasets were 0.903 and 0.877, respectively. Subsequently, eight genes, including HES4, IFI27, LY6E, OTOF, STAT1, TTC21A, XAF1, and ZCCHC2, were selected as prospective biomarkers and verified by RT-qPCR. Finally, we revealed the most relevant immune cells with the expression of HES4, IFI27, LY6E, OTOF, TTC21A, XAF1, and ZCCHC2.
Conclusion: In this paper, we identified seven key biomarkers that have potential value for diagnosing Chinese SS patients.
1 Introduction
Sjögren’s syndrome (SS) is a systemic autoimmune disease that causes inflammation in exocrine glands, such as salivary and lacrimal glands (1, 2). It may also induce fatigue, musculoskeletal discomfort, disturbance of liver, lung, kidney, nervous system, and lymphoma (3, 4). Studies imply that genetic and environmental variables may be important, even if the pathophysiology of SS is yet unknown (5). The prevalence of SS in different countries is 0.03%-5%, and in China, the prevalence of SS is about 0.33%-0.77% (6, 7). The standard mortality ratio (SMR) of patients with SS ranged from 1.61 to 4.66 in reports from other countries (8–10), and in a previous report, the SMR of patients with SS in China was 3.63 (11). According to the 2016 American College of Rheumatology - European League Against Rheumatism (ACR-EULAR) classification criteria, patients who satisfy the criteria may undergo an invasive procedure—labial gland biopsy (12), which is an arduous and time-consuming invasive examination. In order to reduce the patients’ pain, it is necessary to search for novel non-invasive biomarkers for SS. Taking into account ethnic heterogeneity (13), we would validate the diagnostic value of biomarkers in the Chinese population.
Currently, the diagnosis of SS is a combination of symptoms, clinical signs, histopathology, and autoimmune serology (14, 15). Common diagnostic markers of SS include anti-Ro/SSA and anti-La/SSB antibodies, antinuclear antibodies, and rheumatoid factor, etc. (16, 17). Previous studies have provided a number of new putative serum, salivary and histological biomarkers, such as CXCL13, cathepsin S, IL-4, IL-5, and some type-I and type-II IFN-inducible genes (16, 17). Nevertheless, there is no single clinical, laboratory, pathological, or radiological characteristic that can be considered the “gold standard” for diagnosing SS (18). Researchers are still looking for new disease biomarkers in order to develop simpler, faster methods of diagnosing SS.
As is well known, the immunopathogenesis of SS involves the activation of T and B lymphocytes (19, 20). Many studies reported that dendritic cells, T-helper cells, natural killer (NK) cells showed changes during the development of SS (18, 19, 21). Finding disordered cell subsets associated with pathogenesis can help us better understand the pathogenesis of SS and develop an appropriate therapeutic strategy.
Herein, we downloaded three expression matrix files of SS patients’ and healthy people’s blood samples from the Gene Expression Omnibus (GEO) database. Then, we merged the three expression matrix files into one metadata, and took about 80% of the samples as the discovery cohort (nSS = 522, nnormal = 46). Next, we identified the differentially expressed genes (DEGs) between SS and controls. Subsequently, we screened the diagnostic biomarkers of SS through three machine learning algorithms. Following that, we validated the expression of the identified diagnostic biomarkers by using the validation data (about 20% of the metadata cohort, nSS = 150, nnormal = 15), and investigated the logistic regression model by the receiver operating characteristic (ROC) curve. Beyond that, we used our own Chinese cohort (nSS = 14, nnormal = 10) to validate the expression of the candidate biomarkers. Furthermore, we applied the algorithm of CIBERSORT to calculate the ratio of 22 immune cells in blood samples of SS patients and healthy people. Finally, we investigated the connection between the expression of the identified biomarkers and the ratios of immune cells in blood samples of SS patients. A workflow chart summarizing our work is shown in Figure 1.
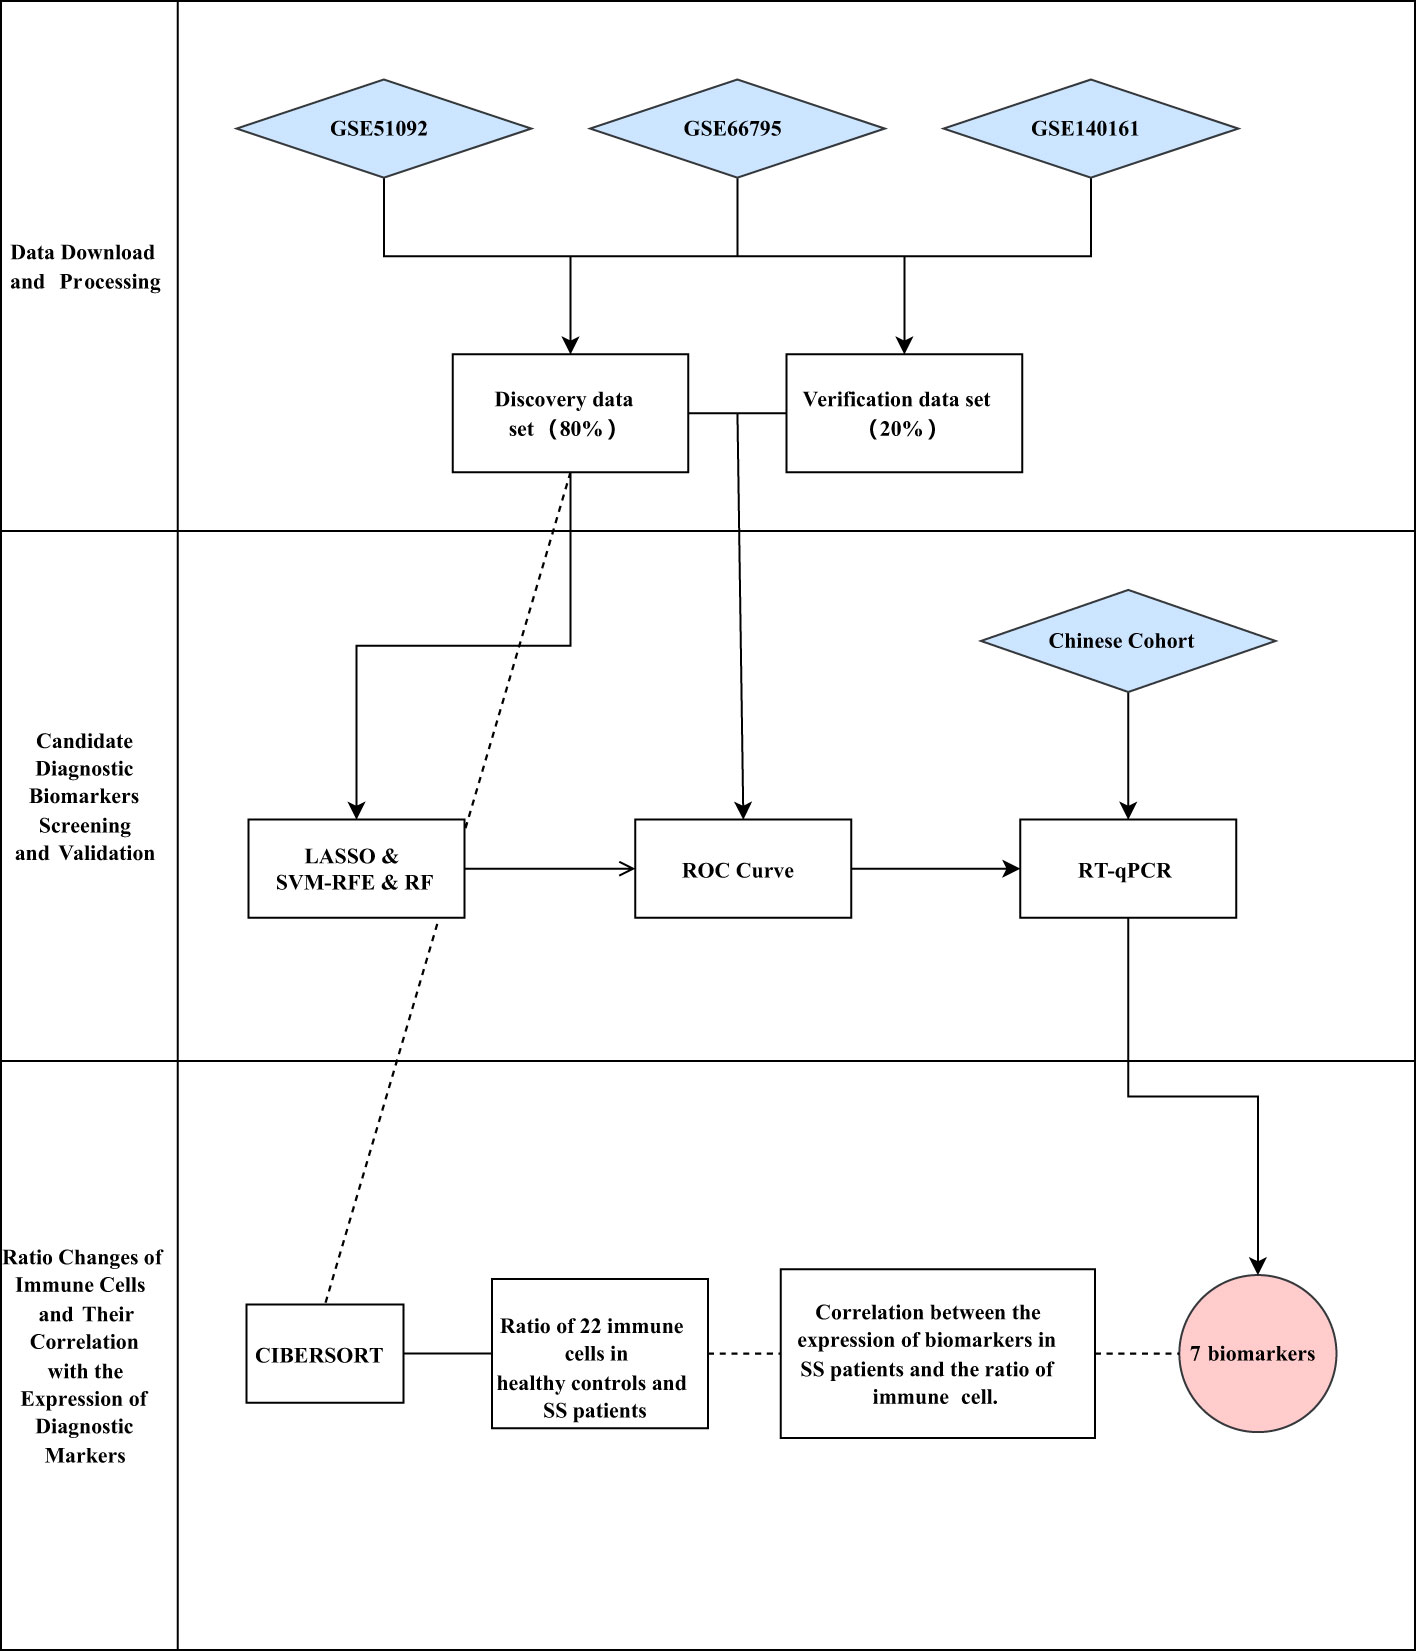
Figure 1 Workflow of the study.
2 Materials and methods
2.1 GEO datasets download and data processing
Three expression matrix files (GSE51092, GSE66795, and GSE140161) of SS blood samples were obtained from GEO database. The GSE51092 data set contained 190 SS and 32 healthy controls, the GSE66795 data set contained 131 SS and 29 healthy controls, and the GSE140161 data set contained 351 SS. After batch corrections using the R package “SVA”, the three files GSE51092, GSE66795, and GSE140161 were performed principal component analysis (PCA), which contained the SS patients and healthy controls. Then, the three files were combined into a metadata cohort (nSS = 672, nnormal = 61), in which about 80% of the samples were used as the discovery data set (nSS = 522, nnormal = 46) and the rest as the verification data set (nSS = 150, nnormal = 15).
2.2 Identification and functional enrichment analysis of DEGs
The DEGs were identified from the discovery data set using the R package “limma”, and displayed with a volcano plot. The heat map was drawn using the R package to show the expression of DEGs. Then, gene ontology (GO) and Kyoto Encyclopedia of Genes and Genomes (KEGG) pathway were conducted to analyze the functions of the DEGs in the DAVID database online. The gene set enrichment analysis (GSEA) was used to pick the most important pathway between SS and controls. The gene set “c2.cp.kegg.v7.0.symbols.gmt” was selected as the reference gene set from the Molecular Signatures Database (MSigDB).
2.3 Screening of the candidate diagnostic biomarkers
The least absolute shrinkage and selection operator (LASSO) logistic regression, support vector machine-recursive feature elimination (SVM-RFE), and random forest (RF) were used to screen the potential SS diagnostic markers. To prevent overfitting the data set, the LASSO analysis was performed using the R package “glmnet”, and based on support vector machine, the SVM-RFE was used to find the optimum variables. The candidate diagnostic markers selected by the three algorithms were overlapped, and the resulting intersection genes were further studied. Then, the candidate diagnostic biomarkers’ expressions were verified in the verification data set.
2.4 The ROC curve for diagnostic capability of biomarkers in SS
To investigate the diagnostic capability of the candidate markers, ROC curves were plotted according to the discovery data set and the validation data set. Combined ROC curves were also produced to assess the combined diagnostic utility of candidate markers.
2.5 Sample collection and reverse transcription quantitative polymerase chain reaction validation
In total, the whole blood of 14 SS samples and 10 control samples was obtained from Shenzhen People’s Hospital. All participants volunteered to enter this research. Patients who were included in the study were confirmed SS patients according to ACR-EULAR classification criteria, and the clinical manifestations of them were sorted out in Table 1. The age of the patients ranged from 29 to 66, and the control group ranged from 26 to 37. The anti-SSA antibodies were positive in 92.9% of the patients, and the anti-SSB antibodies were positive in 57.1% of the patients. 78.6% and 85.7% of the patients had xerostomia and xerophthalmia, respectively. Five patients met the criteria of Schirer’s test ≤ 5mm/5 min in at least 1 eye. This study was approved by the Ethics Committee of Shenzhen People’s Hospital (LL-KY-2019514).
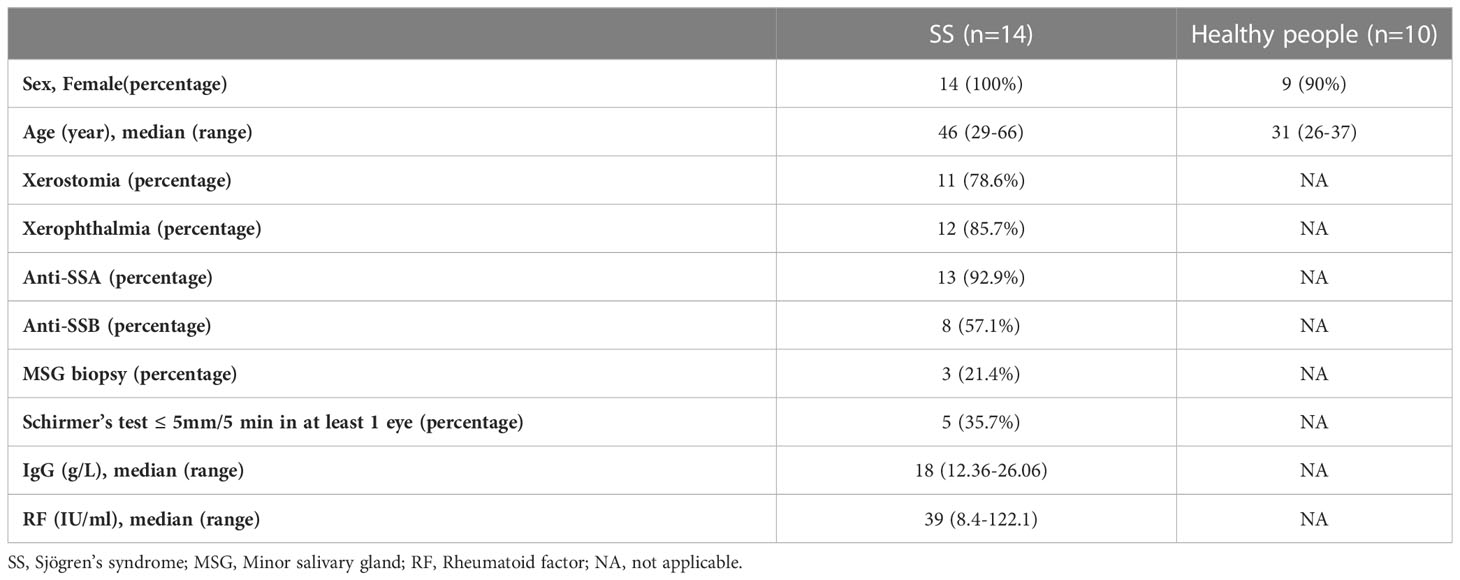
Table 1 The clinical manifestations of the 14 SS patients and 10 healthy people in our study.
When the whole blood samples were obtained, the peripheral blood mononuclear cells (PBMCs) were collected after being diluted with an equal volume of phosphate-buffered saline (PBS) and Ficoll and centrifuged at 2000 rpm for 20 min, and the red blood cell was lysed with red blood cell lysis buffer (Beyotime, C3702). Finally, the PBMCs were mixed with 1mL Trizol (Beyotime, R0016) and stored at -80 °C.
According to the manufacturer’s instructions, total RNA was extracted from PBMCs. The transScript all-in-one first-strand cDNA synthesis superMix for qPCR (One-step gDNA removal) kit (TransGen Biotech, AT341-02) was utilized for the reverse transcription of mRNA. Following that, the RT-qPCR tests were undertaken by the PerfectStart Green qPCR SuperMix kit (TransGen Biotech, AQ601-02). The list of primers is showed in Table 2. All of the primers used in our study were synthesized by the Sangon Biotech Company. The housekeeping gene GAPDH was used as an internal reference gene. The relative expressions of genes were analyzed by the 2-ΔΔCT method. A combined ROC curve was made to predict the combined diagnostic capacity of the biomarkers.
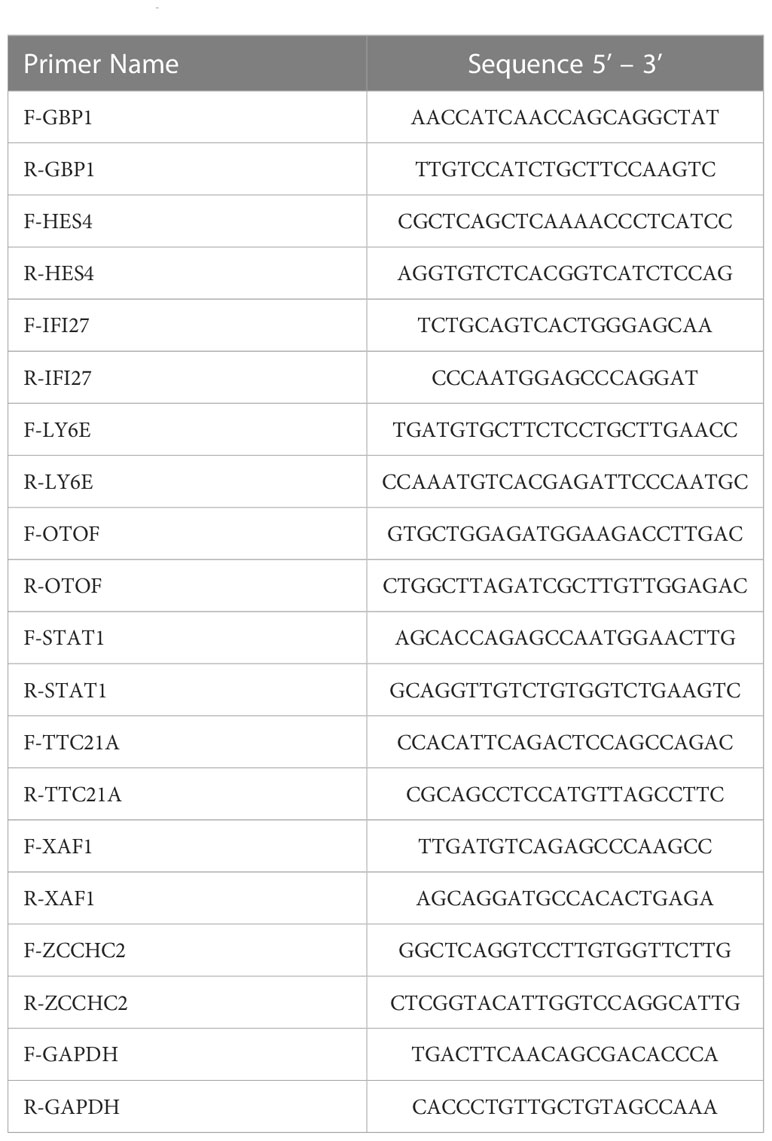
Table 2 The primers’ list.
After the RT-qPCR validation, SLE biomarkers screened from the public database that we have previously published were compared, in order to further confirm the diagnostic value and specificity of the diagnostic markers we screened in SS patients.
2.6 Immune cell composition and immune cell analysis of diagnostic markers
The CIBERSORT algorithm was used for the immune cell analysis of the expression matrix of SS patients and healthy people. We edited an R language script to run CIBERSORT. CIBERSORT is used to estimate the cell composition of a single sample. The script reads the mixed gene expression data to be analyzed from the file system, normalizes and fits the mixed expression data using support vector machine, and then outputs the estimated relative content of each cell subset in the mixture after loading the necessary packages and functions. The script includes three functions: CoreAlg, doPerm, and CIBERSORT. The CoreAlg function defines the core algorithm, which accepts one cell type gene expression data and one mixed gene expression data, uses the support vector machine model to train and normalize the mixed data, and returns the relative content of each cell subset based on the model in the mixed cells. The main function is CIBERSORT, which accepts two file locations (unit-type gene expression data and mixed gene expression data), the number of permutations, and a Boolean value indicating whether quantization normalization is applied. The R package “vioplot” was adapted to visualize the ratios of 22 immune cells in SS and control groups (The ratio of cell represented the proportion of the number of a specific subtype immune cells in the blood cells of SS patients or healthy controls). The “corrplot” package was used to draw the heat map, which presented the quantitative correlation between different immune cells in SS patients. Additionally, the R package “ggplot2” was applied to investigate the relationship between the expression of the diagnostic markers and the ratios of immune cells using the Pearson method.
3 Results
3.1 PCA and DEGs screening
After batch corrections using the R package “SVA”, we performed PCA on three datasets (GSE51092, GSE66795, and GSE140161) from GEO (Figure 2A). The result showed that each sample of the data set presented a uniform distribution, indicating that the normalization was performed appropriately. Then, we combined these three data sets into one data set (672 SS patients and 61 healthy people), and took about 80% of the samples from this data set as the discovery set. As a consequence, we obtained a total of 43 DEGs (Figure 2B) by comparing SS patients with healthy people (P < 0.0001, fold change > 1.5), and showed the expression of the DEGs in each healthy person and SS patient by a heat map (Supplementary Figure S1). Then, we discovered enrichment of response to type I interferon signaling pathway, innate immune response, and Epstein-Barr virus infection through the enrichment analysis of the DEGs (Figures 2C–F). Moreover, GSEA analysis revealed that pathways including cytoplasmic DNA sensing pathway, JAK STAT signaling pathway, proteasome, RIG-I-like receptor signaling pathway, and systemic lupus erythematosus were enriched in SS group compared to healthy group. Furthermore, compared with the healthy group, the SS group’s core genes are up-regulated (Figures 2G, H).
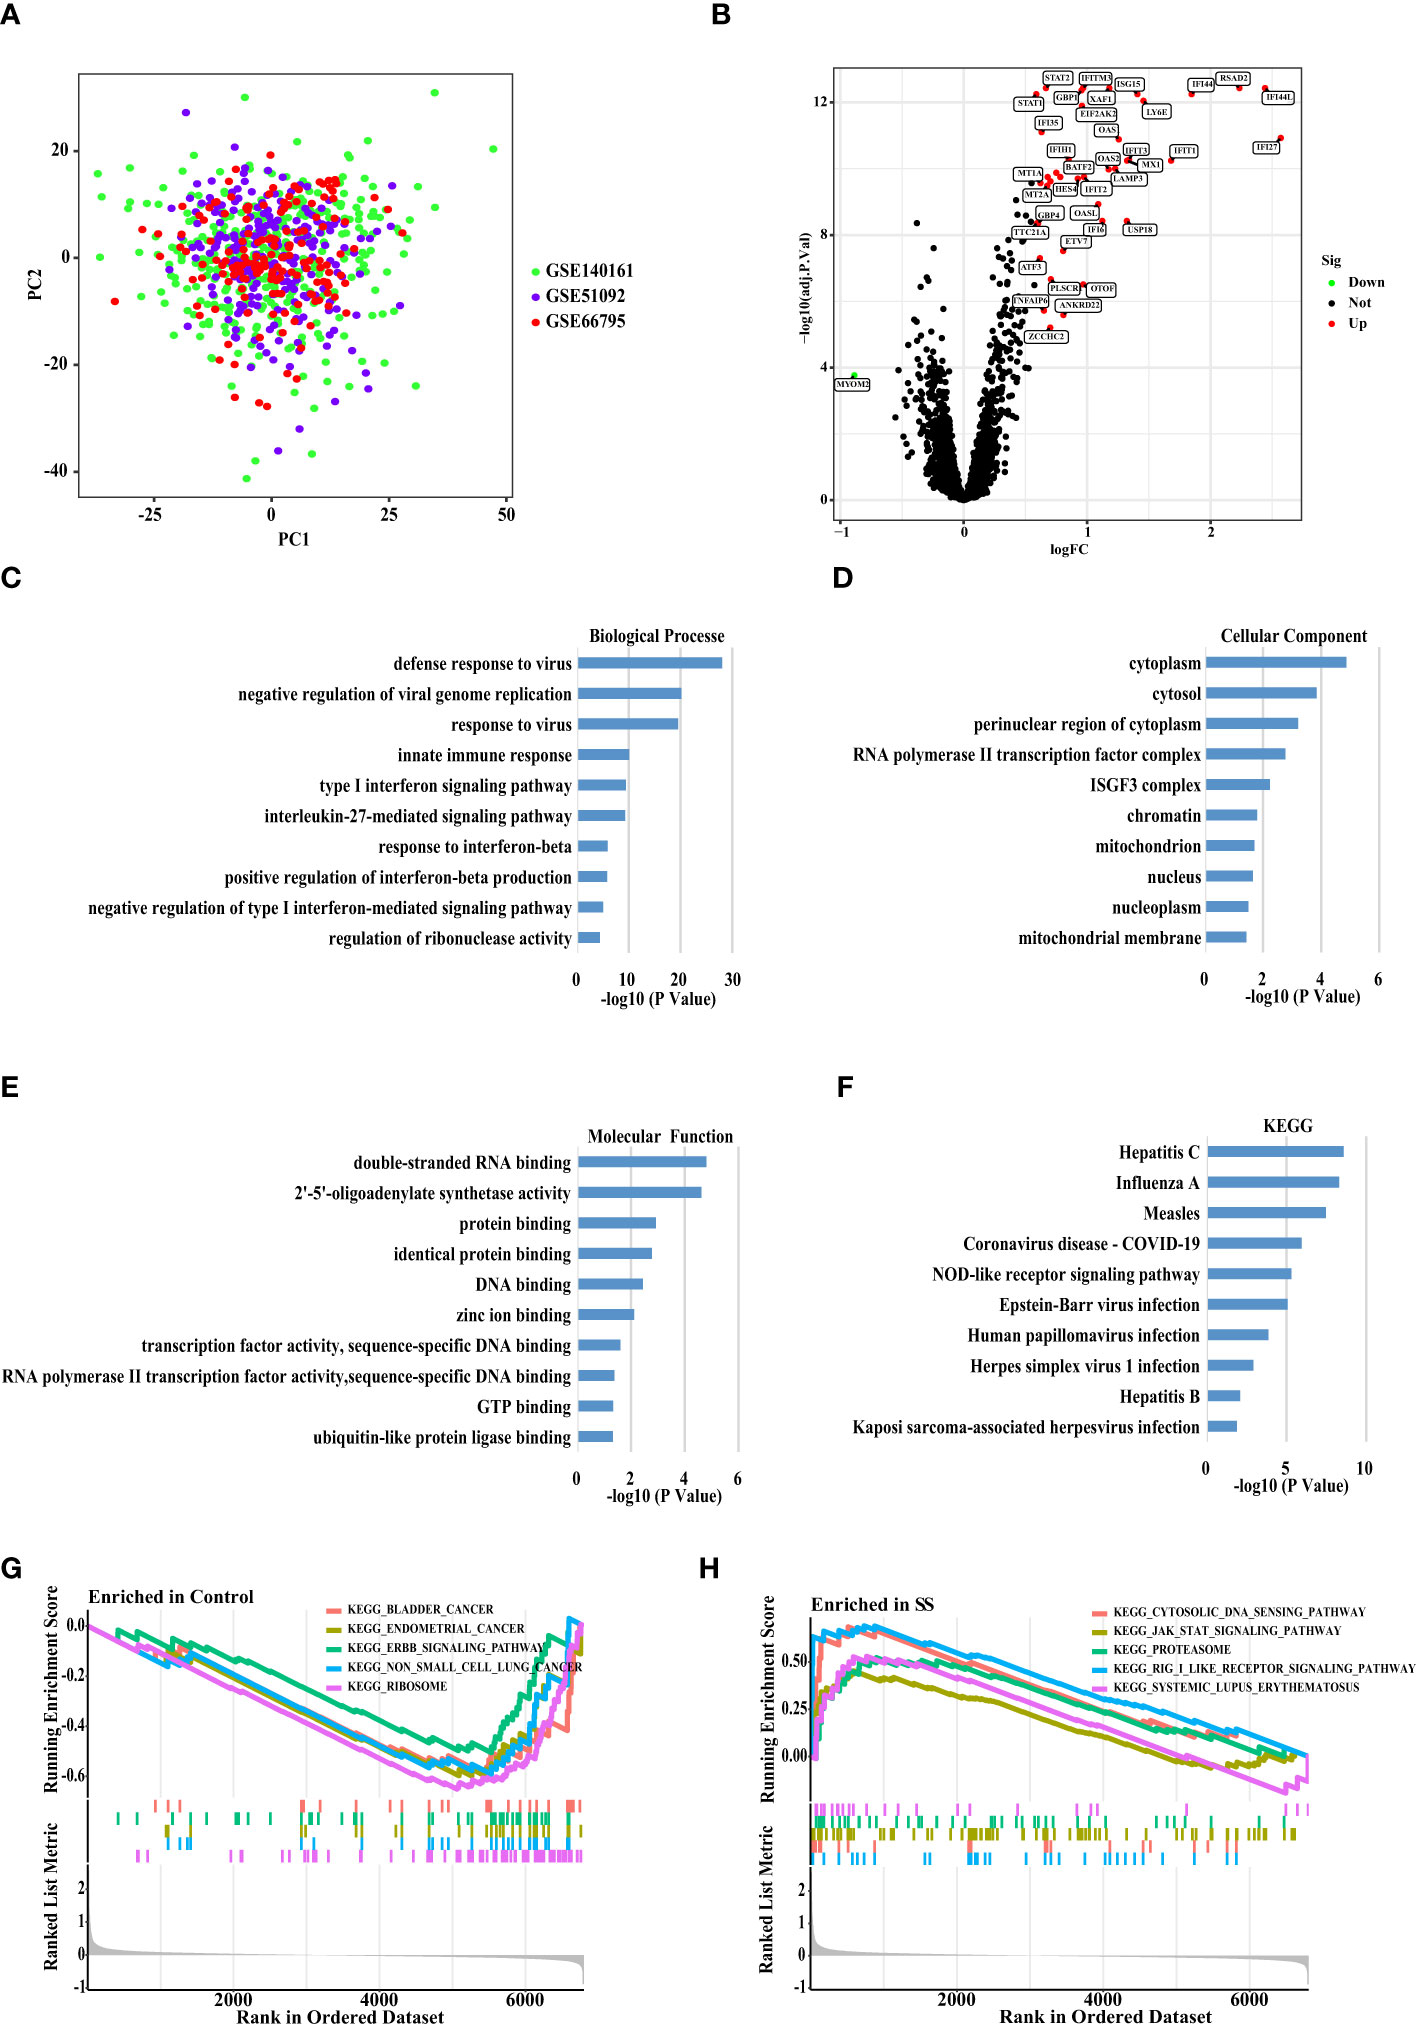
Figure 2 Principal Component Analysis and DEGs Screening between The SS versus Controls. (A) Principal component analysis (PCA) plot shows the distribution of each corrected sample. (B) Volcano map of DEGs between the whole blood of SS and control samples based on the discovery data set. P <0.0001 and Fold Change >1.5 considered significant. Green and red represented down-regulation and up-regulation, respectively (SS/Control). (C) The biological processes, (D) cellular components, and (E) molecular functions, (F) KEGG enrichment analysis of the DEGs. (G, H) The GSEA analysis of the SS and control samples.
3.2 Identification and validation of diagnostic biomarkers for SS
To explore the biomarkers of SS, we applied the LASSO regression, the SVM-RFE algorithm and RF algorithm. As a result, 20 probable biomarkers were picked out by the LASSO regression algorithm, 22 by the SVM-RFE algorithm, and 21 by the RF algorithm (Figures 3A–C). Subsequently, we overlapped the 20, 22 and 21 probable biomarkers to obtain 11 genes, including BATF2, HES4, IFI27, IFITM3, LY6E, OTOF, STAT1, TTC21A, XAF1, ZCCHC2, and MYOM2 (Figure 3D). To verify the accuracy of the results, we conducted validation of the 11 genes using the verification data set. As seen in Figures 3E–O, the expression trend of the 11 genes was found to be consistent in both discovery and validation data sets, while MYOM2 had no statistical significance. On this account, we chose BATF2, HES4, IFI27, IFITM3, LY6E, OTOF, STAT1, TTC21A, XAF1, and ZCCHC2 for the following analysis.
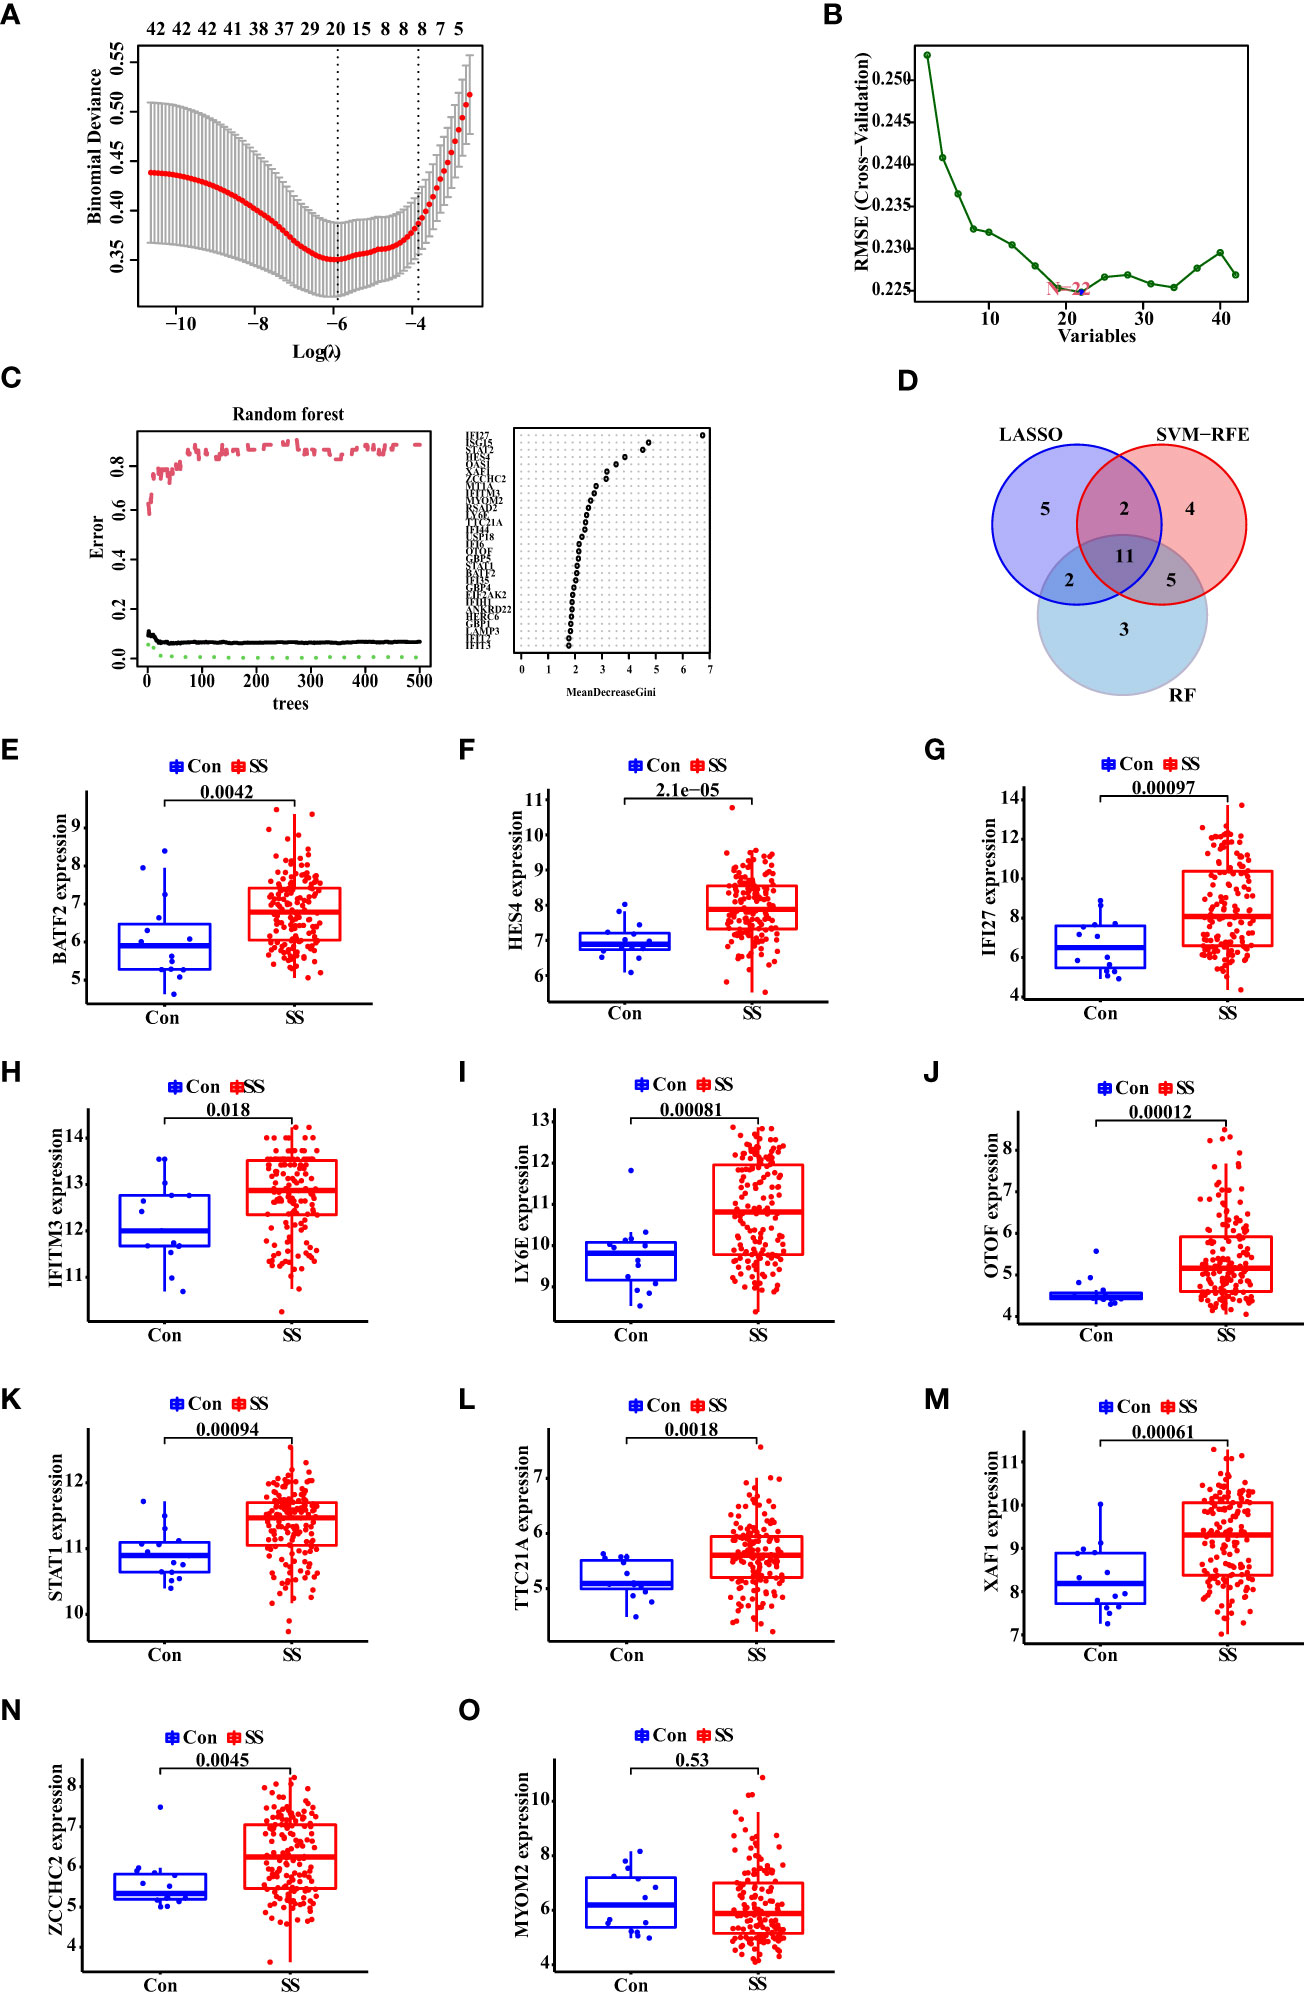
Figure 3 Identification and Validation of Diagnostic Biomarkers for SS. (A) The LASSO logistic regression, (B) SVM-RFE algorithm, and (C) RF algorithm of SS biomarker screening. (D) Venn diagram of the diagnostic biomarkers extracted by the three algorithms. (E–O) The expression of diagnostic biomarkers based on the validation data set. “Con” represented the control samples, and “SS” represented the SS patients.
3.3 The diagnostic capability of 12 biomarkers for SS
Thereafter, we showed the ROC curves of 10 biomarkers, from which we could see the AUC values of BATF2, HES4, IFI27, IFITM3, LY6E, OTOF, STAT1, TTC21A, XAF1, and ZCCHC2 in the discovery data set. In Figures 4A–J, we observed these genes with the AUC value of 0.820, 0.807, 0.856, 0.827, 0.828, 0.818, 0.832, 0.783, 0.849, and 0.730, respectively. Then, we combined these genes into one signature and found that the combination of XAF1, STAT1, IFI27, HES4, TTC21A, and OTOF resulted in a relatively high AUC value of 0.903 (Figure 4K).
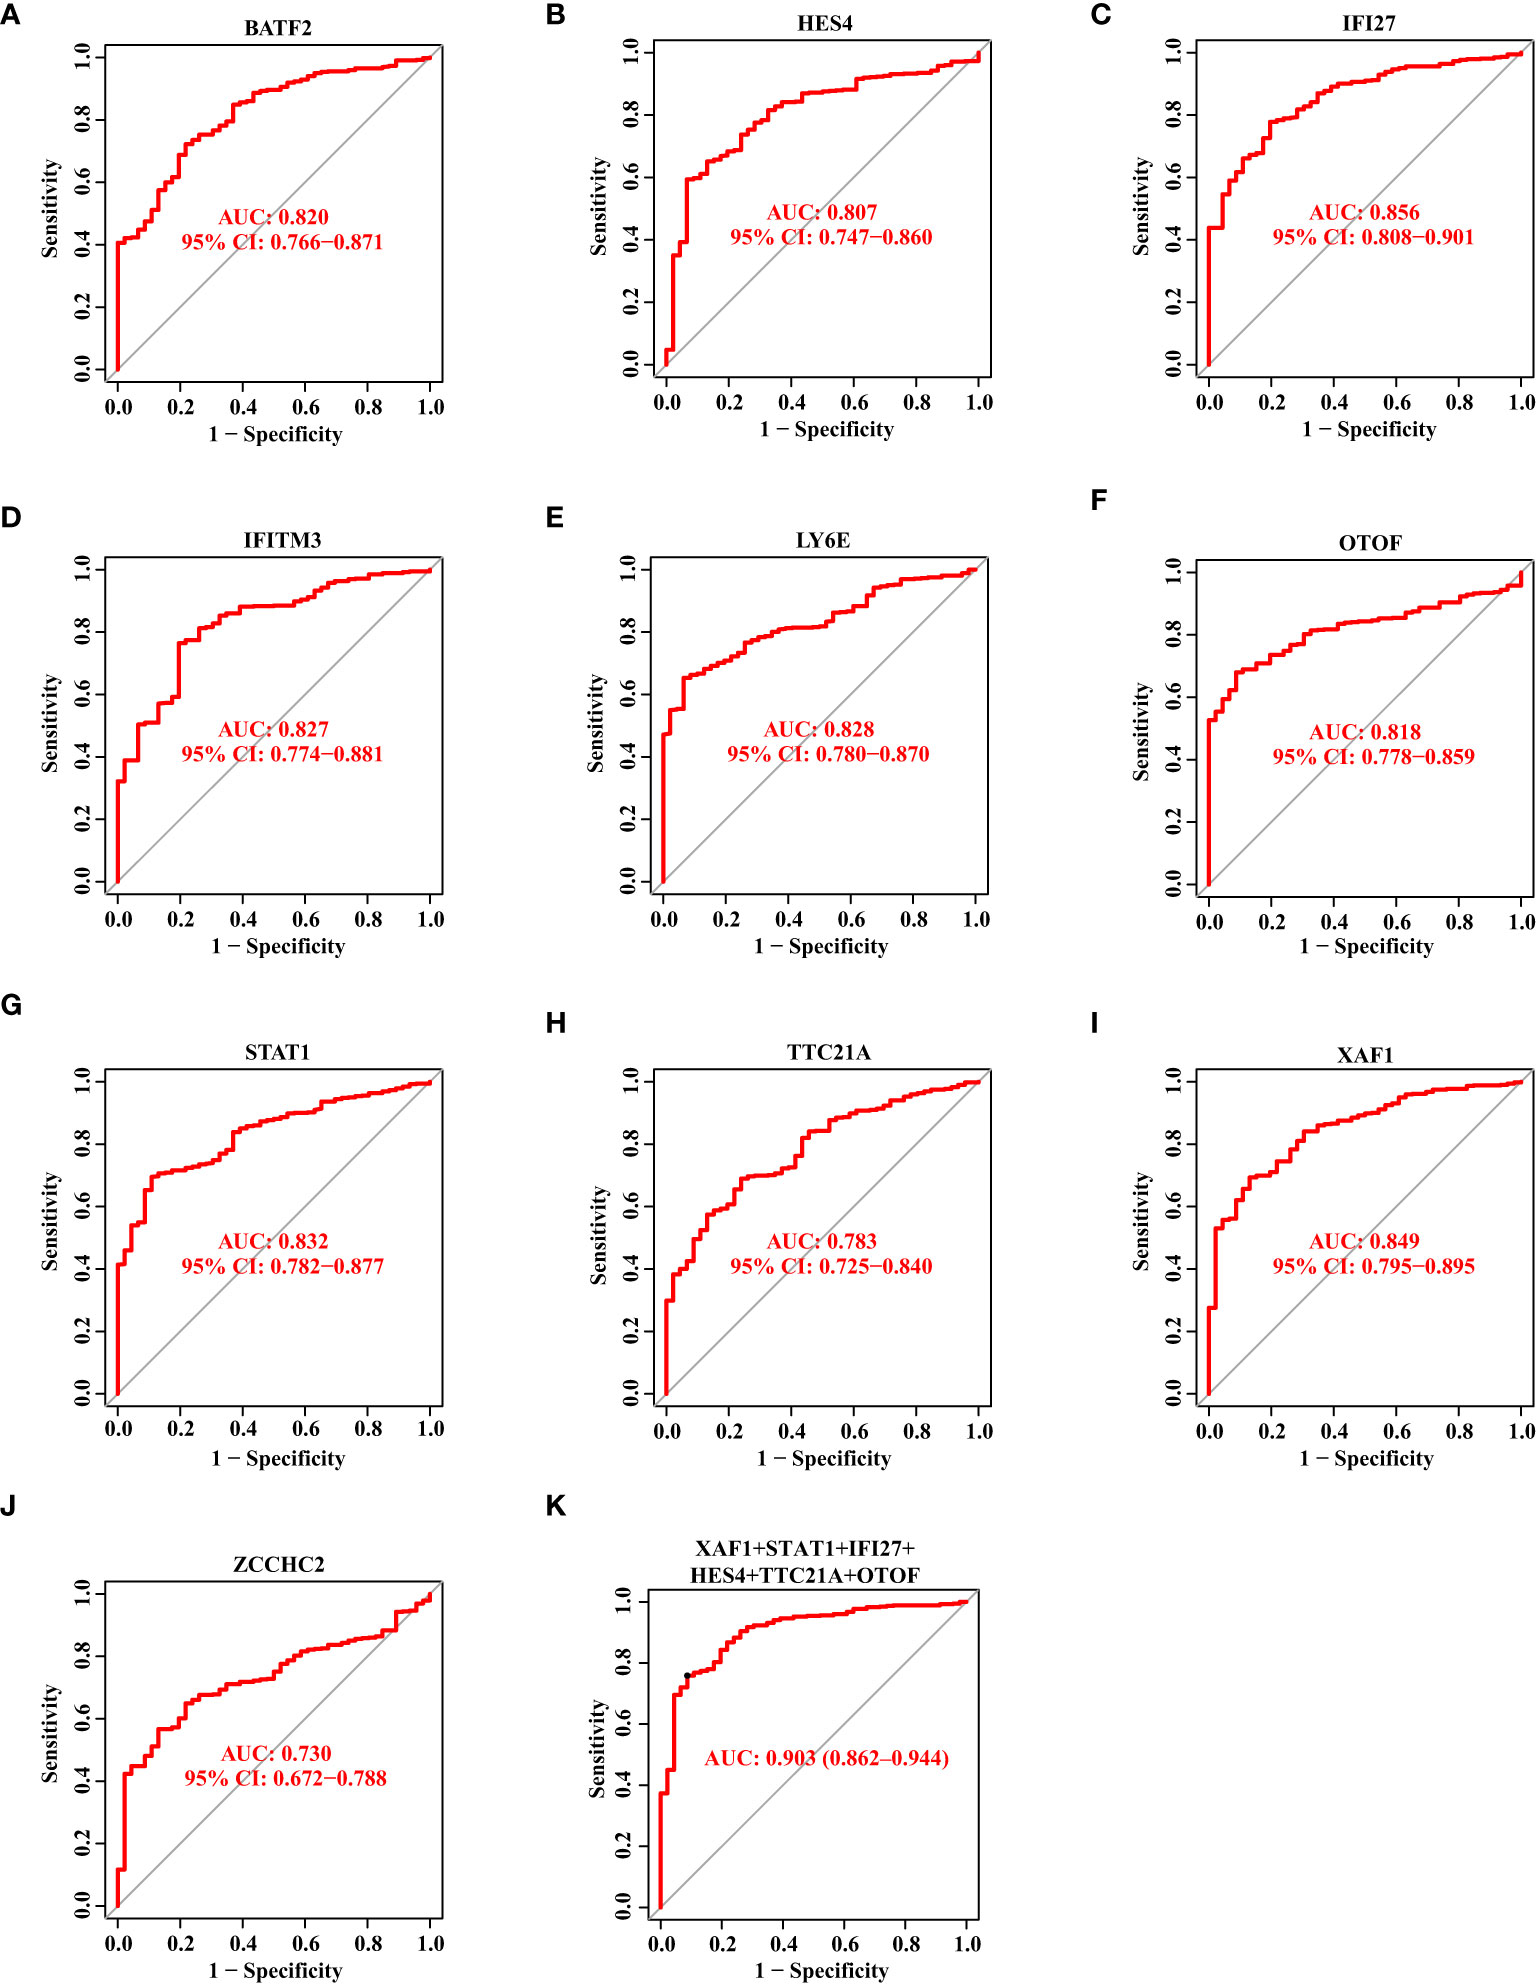
Figure 4 The Diagnostic Capability of Potential Biomarkers for SS Based on The Discovery Data Set. (A–J) The ROC curve of BATF2, HES4, IFI27, IFITM3, LY6E, OTOF, STAT1, TTC21A, XAF1, and ZCCHC2 based on the discovery data set. (K) The ROC curve showing the AUC value of XAF1, STAT1, IFI27, HES4, TTC21A, and OTOF based on the discovery data set.
Likewise, we drew the ROC curves of 10 biomarkers based on the validation data set. The AUC value of BATF2, HES4, IFI27, IFITM3, LY6E, OTOF, STAT1, TTC21A, XAF1, and ZCCHC2 was 0.725, 0.834, 0.759, 0.685, 0.763, 0.802, 0.760, 0.745, 0.769, and 0.723, respectively (Figures 5A–J). When we combined XAF1, STAT1, IFI27, HES4, TTC21A, and OTOF as one signature, the AUC value reached 0.877 (Figure 5K).
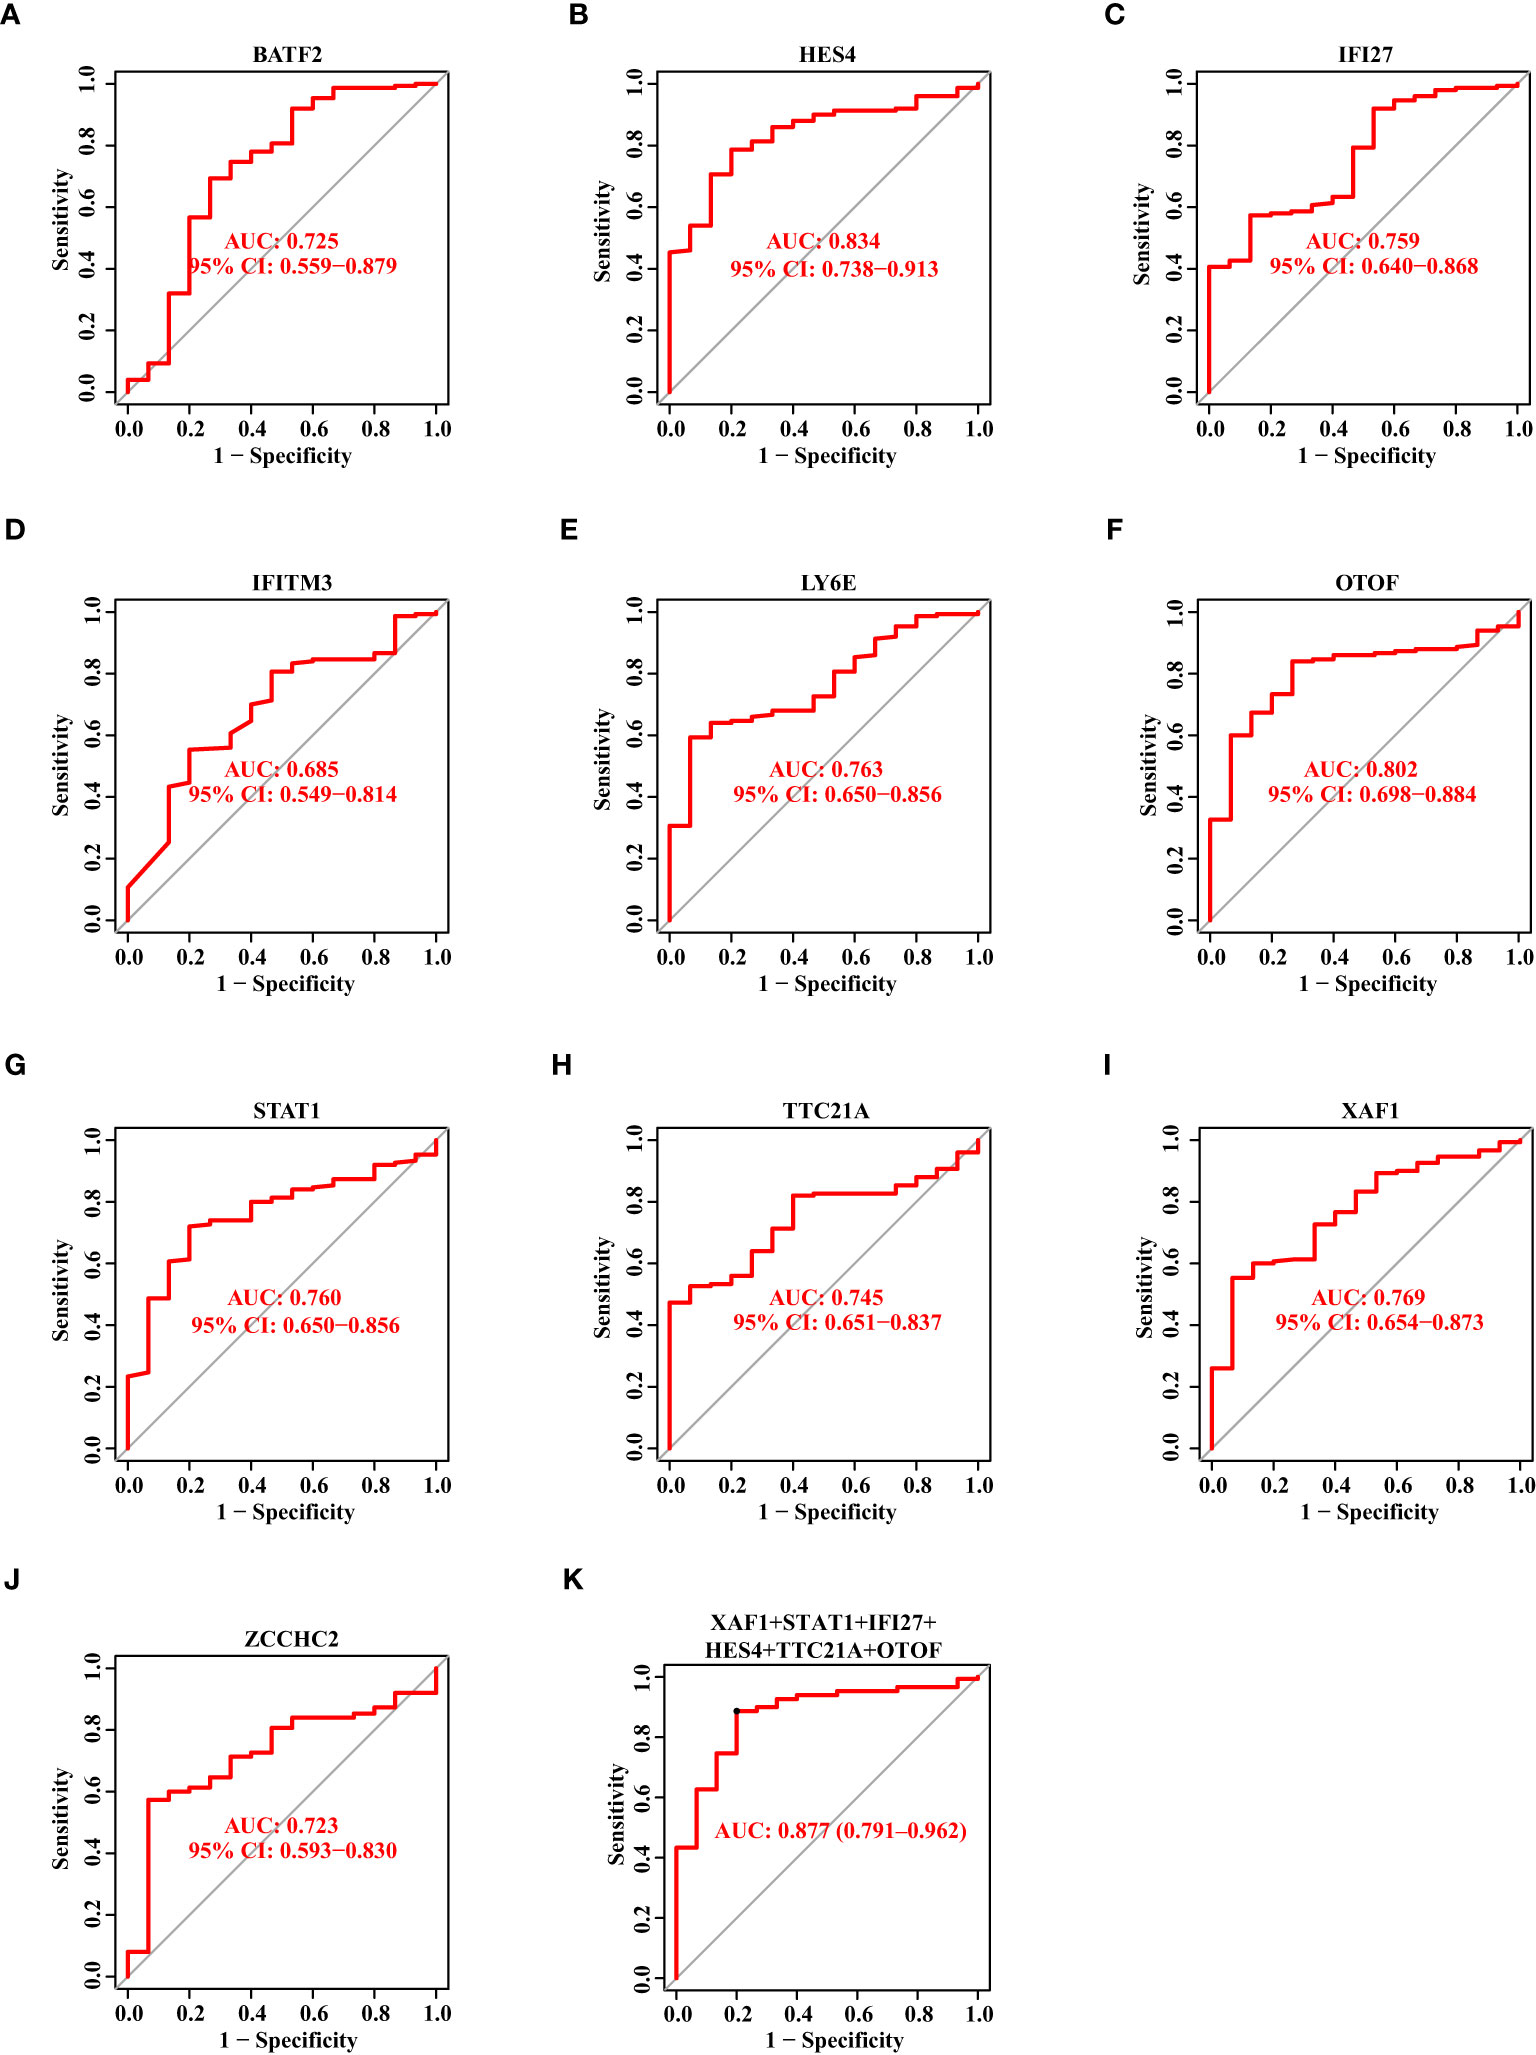
Figure 5 The Diagnostic Capability of Potential Biomarkers for SS Based on The Verification Data Set. (A–J) The ROC curve of BATF2, HES4, IFI27, IFITM3, LY6E, OTOF, STAT1, TTC21A, XAF1, and ZCCHC2 based on the verification data set. (K) The ROC curve showing the AUC value of XAF1, STAT1, IFI27, HES4, TTC21A, and OTOF based on the verification data set.
3.4 The validation of the potential diagnostic markers using our own Chinese cohort
Based on the above results in the discovery data set and validation data set, we selected eight candidate biomarkers for RT-qPCR validation in 14 Chinese SS patients and 10 Chinese healthy controls (the result of the Ct values was shown in Supplementary Table S1). After analysis, we found that the mRNA expression levels of HES4, IFI27, LY6E, OTOF, STAT1, TTC21A, XAF1, and ZCCHC2 were consistently higher in SS patients than in healthy controls (Figures 6A–H). However, STAT1 did not show statistical significance. The AUC value of the combined ROC curve of HES4, IFI27, LY6E, OTOF, TTC21A, and XAF1 of the validation cohort reached 1 (Figure 6I), which showed an outstanding diagnostic effects to predict SS from HCs.
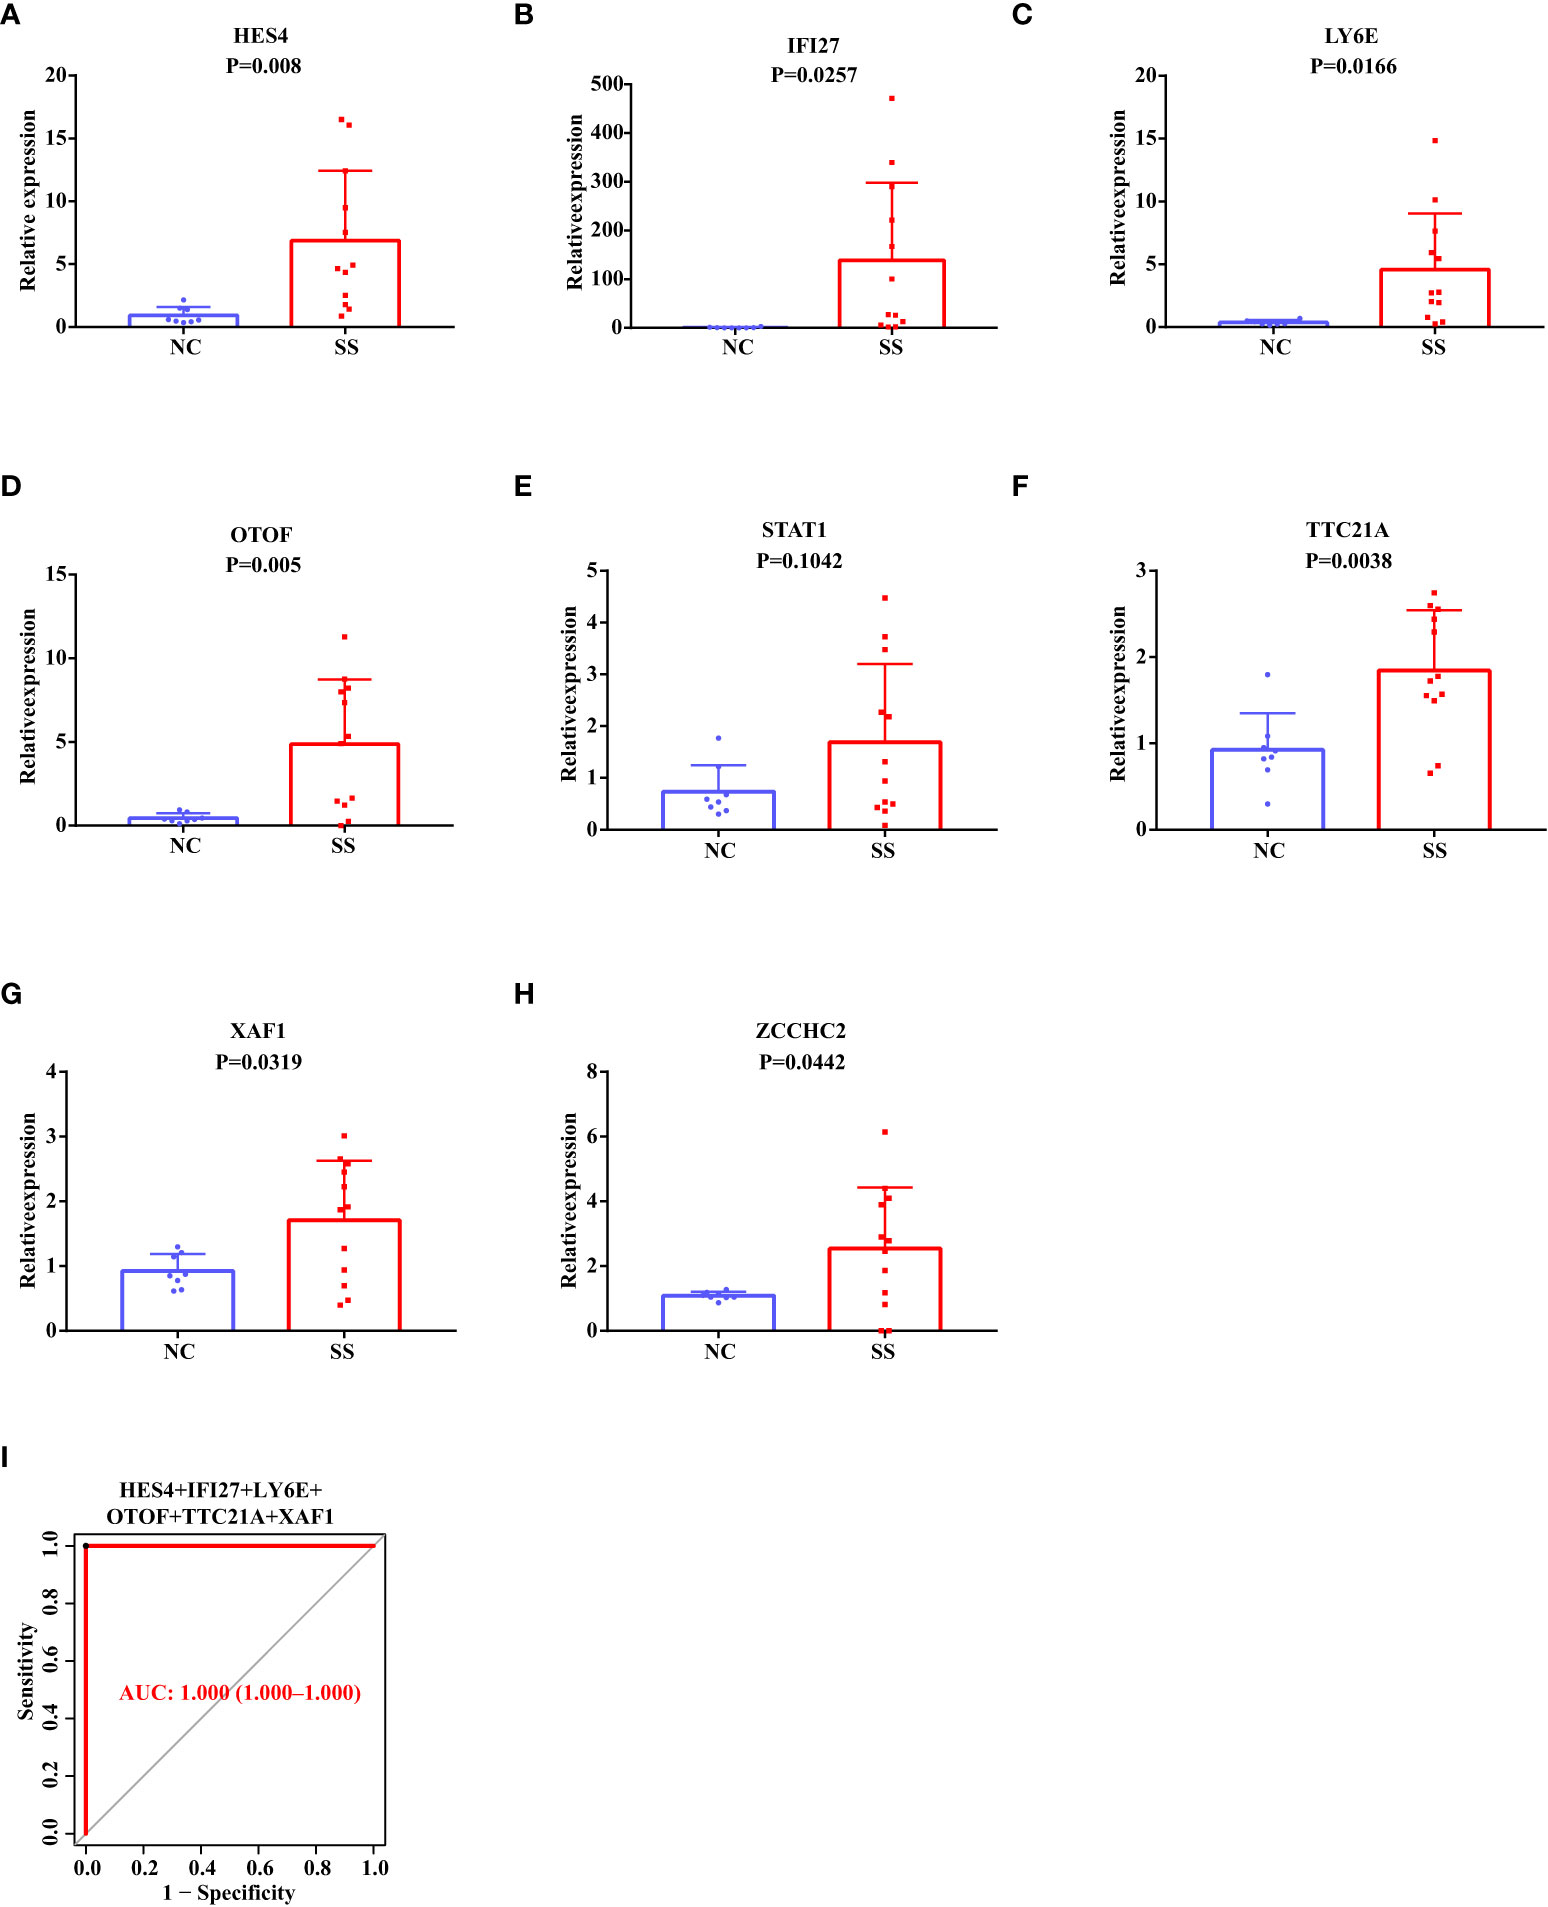
Figure 6 RT-qPCR Validation of The Potential Diagnostic Markers using Our Own Chinese Cohort. (A–H) The relative mRNA expression levels of HES4, IFI27, LY6E, OTOF, STAT1, TTC21A, XAF1, and ZCCHC2 in the PBMC of SS patients and healthy people. (I) The ROC curve showing the AUC value of HES4, IFI27, LY6E, OTOF, TTC21A, and XAF1 based on the Chinese cohort.
As a result, among the Chinese population, HES4, IFI27, LY6E, OTOF, TTC21A, XAF1, and ZCCHC2 are more likely to be SS biomarkers. Remarkably, HES4, OTOF, TTC21A, and ZCCHC2 are novel discovered biomarkers for SS that have not been reported in published articles.
In our previous article on SLE biomarkers (22), we downloaded the SLE gene expression matrix from the public database. After screening and validation, six markers (ABCB1, EIF2AK2, HERC6, ID3, IFI27, and PLSCR1) were obtained that had diagnostic value for SLE (the SLE biomarkers were shown Supplementary Table S1). By comparing with the seven biomarkers we screened in SS (HES4, IFI27, LY6E, OTOF, TTC21A, XAF1, and ZCCHC2), we found that IFI27 had diagnostic value in both diseases. Additionally, LY6E and XAF1 are also potential biomarkers in SLE reported by others (23, 24). As a result, HES4, OTOF, TTC21A, and ZCCHC2 were more likely to be considered as specific diagnostic biomarkers of SS.
3.5 The ratio changes of immune cells in SS Patients, and their correlation with the expression of diagnostic markers
First, we used the CIBERSORT algorithm to examine the ratio of 22 immune cells in healthy controls and SS patients of the discovery data set. The finding revealed that the proportions of CD4 memory resting T cells and activated NK cells in SS were considerably lower than those in the control group, while CD4 memory active T cells, follicular helper T cells, macrophages M1, and activated dendritic cells were higher in SS (Figure 7A). Subsequently, we explored the relationships between the ratios of the 22 different immune cell types in SS patients. From the heat map, we found that the proportions of memory B cells and CD4 naïve T cells, the levels of activated dendritic cells and macrophages M2, had a moderate positive link, respectively. Besides, the ratio of neutrophils and CD8 T cells, the levels of memory B cells and naïve B cells, the degrees of monocytes and CD4 naïve T cells, macrophages M2, and activated dendritic cells had a negative link (Figure 7B).
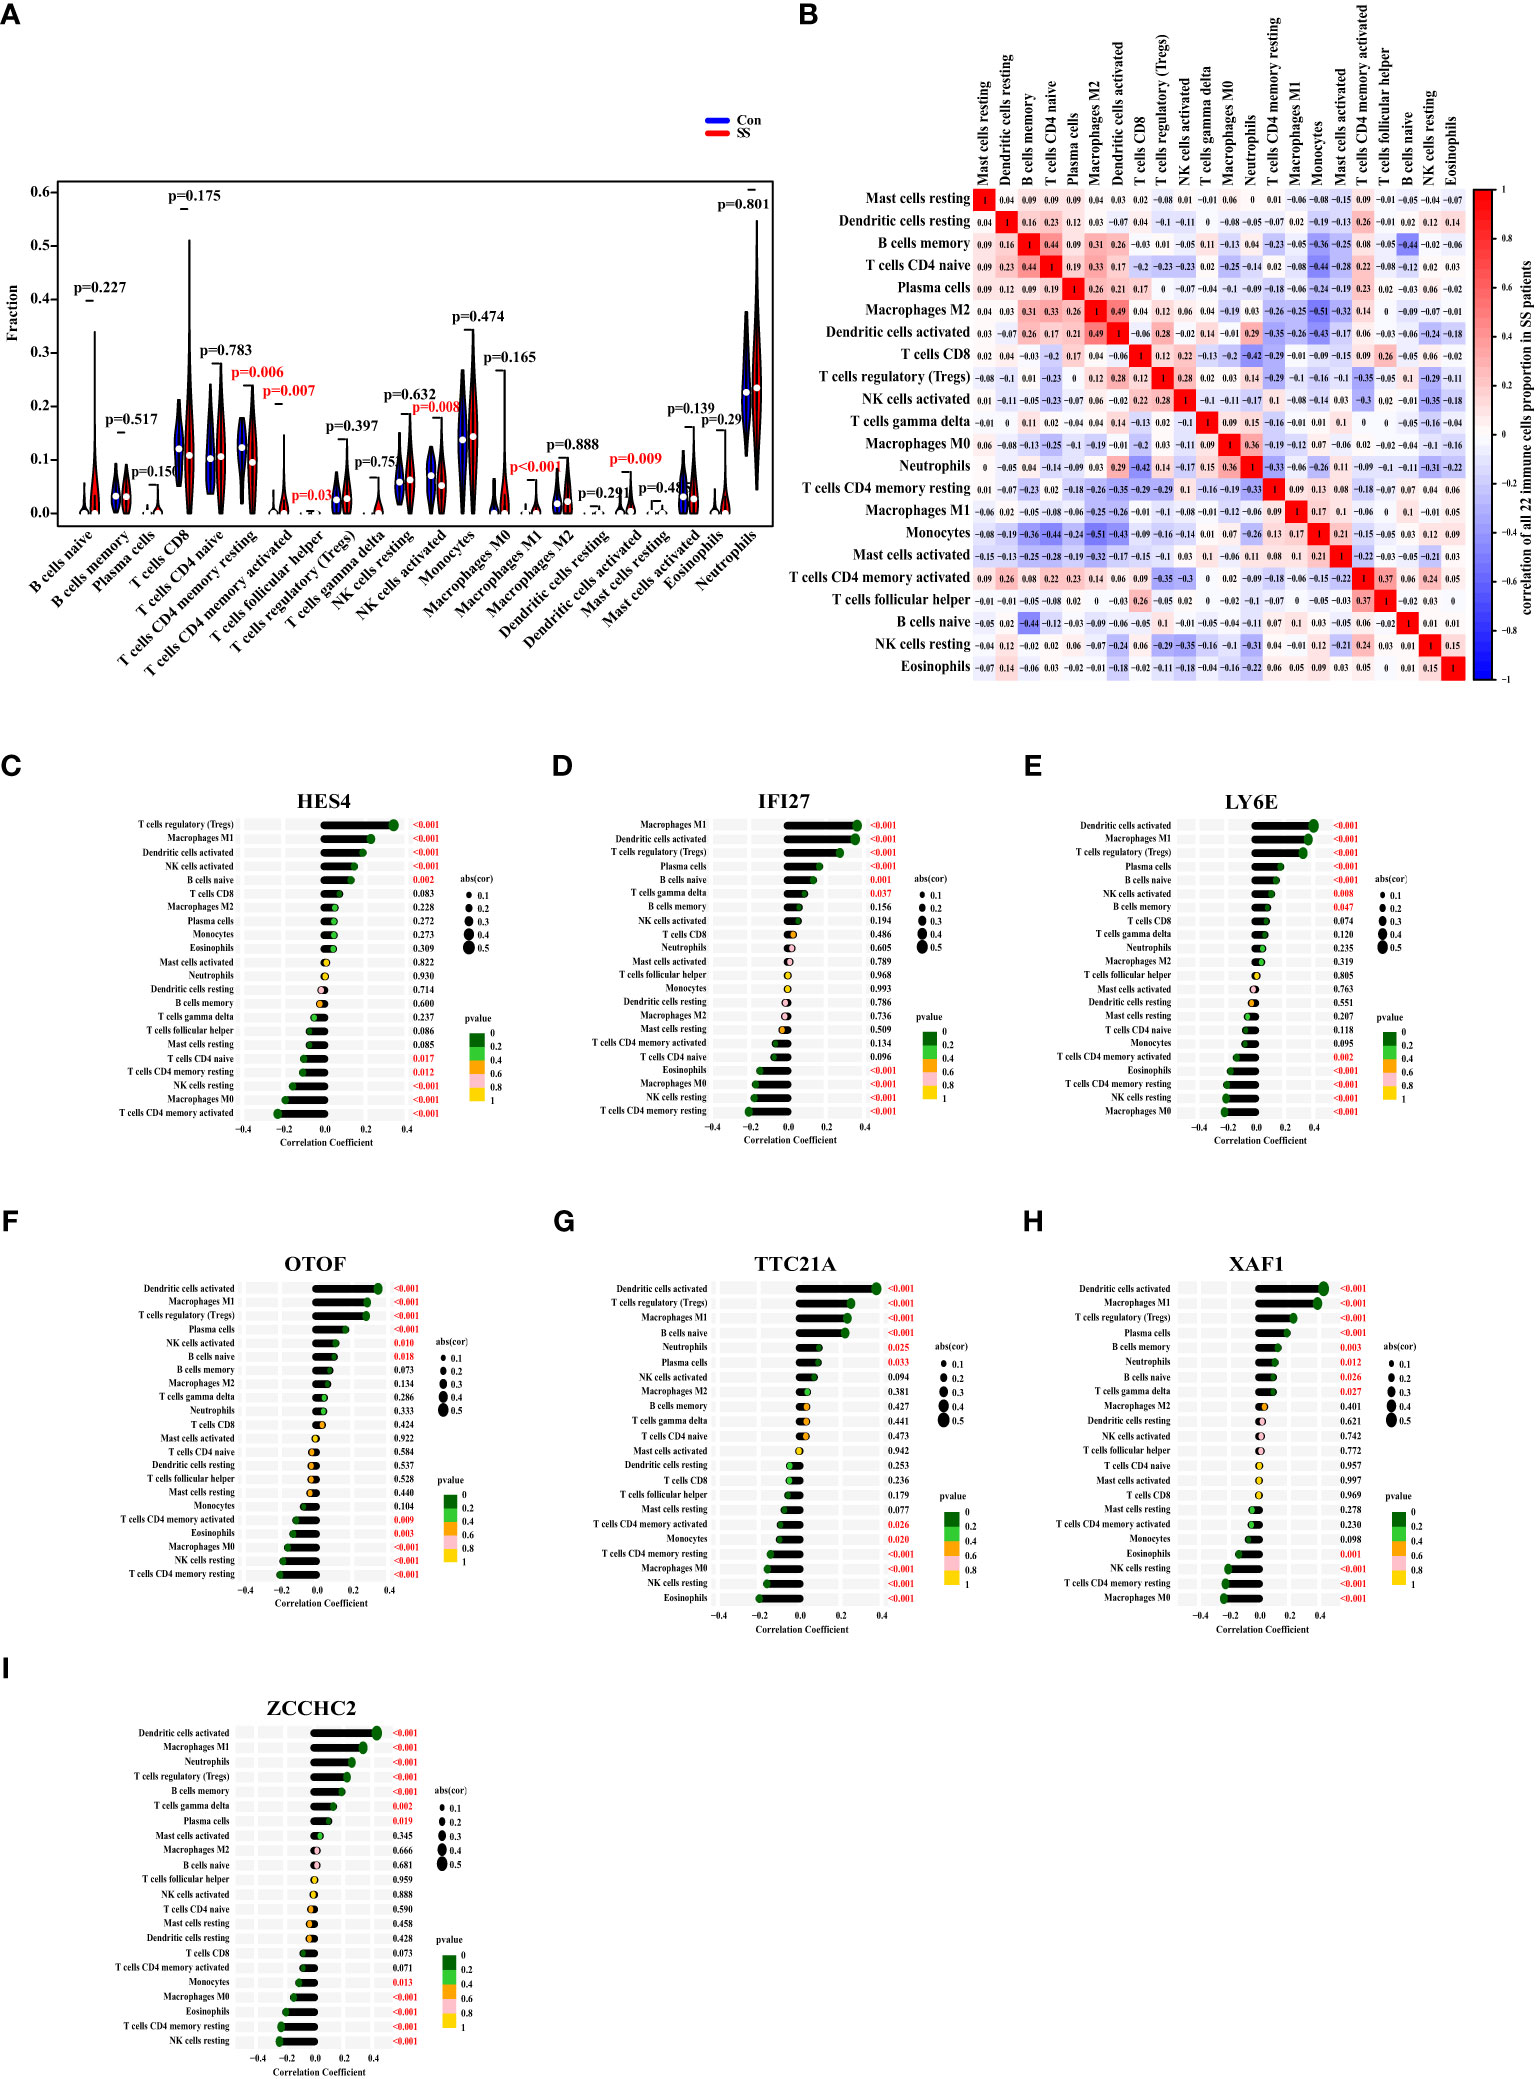
Figure 7 The Ratio Changes of Immune Cells in SS Patients, and Their Correlation with The Expression of Diagnostic Markers. (A) The fraction of 22 types of immune cells of SS patients (red) and healthy people (blue). (B) The heat map displaying the 22 different types of immune cells’ proportional association in SS patients. (C–I) The correlation between the expression of HES4, IFI27, LY6E, OTOF, TTC21A, XAF1, and ZCCHC2 with the levels of immune cells in SS. The size of the dots represented the correlation strength. The p value was represented by the color of the dots.
Eventually, we investigated the correlation between the expression of HES4, IFI27, LY6E, OTOF, TTC21A, XAF1, and ZCCHC2 in SS patients and the ratio of immune cell. As a result, the expression of HES4 was positively correlated with the levels of regulatory T cells (Tregs), macrophages M1, activated dendritic cells, activated NK cells, and naïve B cells, and negatively correlated with the ratios of CD4 naive T cells, CD4 memory resting T cells, resting NK cells, macrophages M0, and CD4 memory activated T cells (Figure 7C). The expression of IFI27 was positively linked with the degrees of macrophages M1, activated dendritic cells, regulatory T cells, plasma cells, naive B cells, and gamma delta T cells, and negatively linked with eosinophils, macrophages M0, resting NK cells, and CD4 memory resting T cells (Figure 7D). The expression of LY6E was positively correlated with the ratios of activated dendritic cells, macrophages M1, Tregs, plasma cells, naive B cells, activated NK cells, and memory B cells, and negatively correlated with CD4 memory activated T cells, eosinophils, CD4 memory resting T cells, resting NK cells, and macrophages M0 (Figure 7E). The OTOF expression was positively correlated with the ratios of activated dendritic cells, macrophages M1, Tregs, plasma cells, activated NK cells, and naive B cells, and negatively correlated with CD4 memory activated T cells, eosinophils, macrophages M0, resting NK cells, CD4 memory resting T cells (Figure 7F). The expression of TTC21A was positively correlated with the ratios of activated dendritic cells, Tregs, macrophages M1, naive B cells, neutrophils, and plasma cells, and negatively correlated with CD4 memory activated T cells, monocytes, CD4 memory resting T cells, macrophages M0, resting NK cells, and eosinophils (Figure 7G). The expression of XAF1 was positively correlated with the ratios of activated dendritic cells, macrophages M1, Tregs, plasma cells, memory B cells, neutrophils, naïve B cells, and gamma delta T cells, and negatively correlated with eosinophils, resting NK cells, CD4 memory resting T cells, and macrophages M0 (Figure 7H). The expression of ZCCHC2 was positively correlated with the ratios of activated dendritic cells, macrophages M1, neutrophils, Tregs, memory B cells, gamma delta T cells, and plasma cells, and negatively correlated with monocytes, macrophages M0, eosinophils, CD4 memory resting T cells, and resting NK cells (Figure 7I).
On the whole, the expressions of HES4, IFI27, LY6E, OTOF, TTC21A, XAF1, and ZCCHC2 were most closely linked to the ratios of activated dendritic cells, macrophages M1, and Tregs.
4 Discussion
SS is a systemic chronic autoimmune disease with complex pathogenesis (25, 26). The diagnosis of SS relies on blood samples, an evaluation of lacrimal and salivary gland function, and labial salivary gland biopsies (26, 27), which is arduous and time-consuming with an invasive way. Therefore, trying to identify reliable and sensitive biomarkers can be used to diagnose SS.
In this study, we used three machine learning methods to screen potential diagnostic biomarkers of SS. We used the same expression matrix files (GSE51092, GSE66795, and GSE140161) to screen biomarkers and verify the screening markers. The results showed that the expression trends of biomarkers screened in the discovery data set were consistent with those in the validation data set, indicating that our screening strategy was reliable. In addition, HES4, IFI27, LY6E, OTOF, TTC21A, XAF1, and ZCCHC2 were found to be more suitable biomarkers for SS in the Chinese population after validation in our own Chinese cohort (nSS =14, nnormal =10). However, a larger cohort may be required for further validation in future research. Due to the small sample size, there was a quite difference in age between SS and healthy control. The biomarkers we validated were somewhat impacted by the age mismatch. Previous studies have also shown that the levels of some indicators vary in different age groups. The elderly-onset of SS was associated with lower frequency of SS-related inflammatory arthritis, anti-Ro/SSA and anti-La/SSB positivity, and lower levels of RF, C3, and C4 (28). Hence, we hope to validate these potential biomarkers we screen in the future using larger cohorts with better cohort design.
Besides, the data set cohorts we downloaded from the GEO database did not provide information about ethnicity, age, disease duration, treatment, etc., which became a limitation in our study. In some extent, the absence of age and sex information may make it impossible to judge the generalization ability of markers. The biomarkers screened from patients of different age ranges or different sex ratios may be different. In addition, disease duration and treatment information may provide us with more useful hints.
Biomarkers for SS have been reported in some studies (17, 29, 30). In 2021, Li et al. revealed biomarkers of salivary glands in SS patients (31). Compared with this report, our research has the following expansion and in-depth research: First, we use three machine learning methods, which shows that our method has stronger recognition ability of biomarkers compared with the intersection method adopted by Li et al. Secondly, we use blood samples, which are easier to obtain than salivary glands, non-invasive to the patient and easier to repeat in later clinical monitoring. Finally, we have a larger sample size, which makes the markers we screen more reliable, accurate, and generic. Additionally, the innate immune response, type I interferon signaling pathway, and so on, which are common pathways connected to immunological illnesses, are included in the pathways we have enriched. This indicated that the biomarkers we investigated in DEGs could be potential biomarkers of SS for clinic. Furthermore, the biomarkers MS4A1, CD19, TCL1A, CCL19, CXCL9, CD3G, and CD3D that were ultimately screened from salivary glands did not overlap with the biomarkers that we screened from blood samples in this research, which may offer us a hint that the biomarkers from different tissues are noticeably different.
Disruption the balance of immunity cells has been observed in autoimmune diseases, such as multiple sclerosis (32), systemic lupus erythematosus (33, 34), rheumatoid arthritis (35). Biological abnormalities associated with B lymphocytes are a hallmark of SS (36–38). The tissue-resident Fc Receptor-Like 4 (FcRL4)+ B cell subset was recently reported to be a key driver in SS patients with mucosa-associated lymphoid tissue (MALT)-lymphomas, and FcRL4+ B cells are expanded in SS patients’ inflammatory tissues (39, 40). Apart from B cells, T cells are also important players in SS (41, 42). The normal balance of different subsets of CD4 +T cells, such as Th1, Th2, Th17, follicular helper T cells (Tfh), and Tregs, was found to be disrupted in SS patients (43, 44). It can be seen that immune system disorder played an important role in immune diseases. Thus, we explored the ratio changes of immune cells in SS patients, and investigated their correlation with the expression of diagnostic markers. Besides, we looked into the degree of correlation between Tfh and plasma blast using publicly available datasets, and we hypothesized that the lack of a positive result might be due to the fact that these studies used various inclusion criteria, sample processing techniques, data collection techniques, and data quality control methods.
Consistent with our results, Kimoto’s team has reported that IFI27 gene expression levels were considerably higher in the SS patients when compared to healthy controls (45). The interferon type I inducible genes LY6E and XAF1 were both increased in SS patients, and the two genes were found to be closely related and identified as the hub genes of SS (46, 47). HES4 has been reported to promote T cell development in the presence of Notch1 signaling (48). No previous study has reported that TTC21A is involved in development of SS. However, increased level of TTC21A expression was significantly associated with tumor status and lymph node status (49). There were few studies on the ZCCHC2 gene in the literature.
Interestingly, in our previous study of SLE based on the public database (22), we found that IFI27 is also a candidate marker for SLE. We concluded that IFI27 may be a biomarker for various immune diseases. In addition, we found that LY6E and XAF1 have also been reported as potential markers in SLE (23, 24). To the best of our knowledge, among the seven biomarkers of SS obtained in this study, HES4, OTOF, TTC21A, and ZCCHC2 can be used as specific diagnostic biomarkers of SS. Furthermore, in the Supplementary Table S1, we summarized the functions of these genes and their connections with SS or autoimmunity.
5 Conclusion
All in all, we identified seven genes (HES4, IFI27, LY6E, OTOF, TTC21A, XAF1, and ZCCHC2) as prospective SS biomarkers, which were more suitable for Chinese populations. In addition, we observed quantitative changes in six different types of immune cells in SS patients. Finally, we explored the relationship between the expression of the seven genes and the proportion of different immune cells. Our study provides potential biomarkers for Chinese SS patients and elucidates the relationship between gene expression and ratios of immune cells.
Data availability statement
The datasets presented in this study can be found in online repositories. The names of the repository/repositories and accession number(s) can be found in the article/Supplementary Material.
Ethics statement
The studies involving human participants were reviewed and approved by the Ethics Committee of Shenzhen People’s Hospital. The patients/participants provided their written informed consent to participate in this study.
Author contributions
WZ conceived and designed the project. YZ performed the literature search and wrote the manuscript. SL provided data analysis support. XH and DL contributed to clinical sample collection. JL and LL performed the literature search. ZZ and WC performed the experiments. DT and YD supervised the study. All authors contributed to the article and approved the submitted version.
Funding
This study was supported by grants from the Key Research and Development Program of Guangdong Province (No. 2019B020229001), the science and technology plan of Shenzhen (No. JCYJ20200109144218597 and No: JCYJ20210324113013035), Shenzhen Key Medical Discipline Construction Fund (No. SZXK011), and the Guangdong Basic and Applied Basic Research Foundation (No. 2021A1515111071).
Conflict of interest
Author WZ was employed by company Fapon Biotech Inc.
The remaining authors declare that the research was conducted in the absence of any commercial or financial relationships that could be construed as a potential conflict of interest.
Publisher’s note
All claims expressed in this article are solely those of the authors and do not necessarily represent those of their affiliated organizations, or those of the publisher, the editors and the reviewers. Any product that may be evaluated in this article, or claim that may be made by its manufacturer, is not guaranteed or endorsed by the publisher.
Supplementary material
The Supplementary Material for this article can be found online at: https://www.frontiersin.org/articles/10.3389/fimmu.2023.1023248/full#supplementary-material
References
1. Mavragani CP, Moutsopoulos HM. Sjogren’s syndrome. Annu Rev Pathol (2014) 9:273–85. doi: 10.1146/annurev-pathol-012513-104728
2. Brito-Zeron P, Baldini C, Bootsma H, Bowman SJ, Jonsson R, Mariette X, et al. Sjogren syndrome. Nat Rev Dis Primers (2016) 2:16047. doi: 10.1038/nrdp.2016.47
3. Mavragani CP, Moutsopoulos HM. Sjogren’s syndrome: old and new therapeutic targets. J Autoimmun (2020) 110:102364. doi: 10.1016/j.jaut.2019.102364
4. Chen J, Jin Y, Li C, Gan Y, Li J, Chen S, et al. Evaluation of soluble Cd25 as a clinical and autoimmune biomarker in primary sjögren’s syndrome. Clin Exp Rheumatol (2020) 126(4):142–9.
5. Machowicz A, Hall I, de Pablo P, Rauz S, Richards A, Higham J, et al. Mediterranean Diet and risk of sjögren’s syndrome. Clin Exp Rheumatol (2020) 126(4):216–21.
6. Zhao Y, Li Y, Wang L, Li XF, Huang CB, Wang GC, et al. Primary sjogren syndrome in han Chinese: clinical and immunological characteristics of 483 patients. Med (Baltimore) (2015) 94(16):e667. doi: 10.1097/MD.0000000000000667
7. Xu D, Zhao S, Li Q, Wang YH, Zhao JL, Li MT, et al. Characteristics of Chinese patients with primary Sjo¨Gren’s:Syndrome_ preliminary report of a multi-centre registration study. Lupus (2020) 29(1):45–51. doi: 10.1177/0961203319889666
8. Kim HJ, Kim KH, Hann HJ, Han S, Kim Y, Lee SH, et al. Incidence, mortality, and causes of death in physician-diagnosed primary sjogren’s syndrome in Korea: a nationwide, population-based study. Semin Arthritis Rheum (2017) 47(2):222–7. doi: 10.1016/j.semarthrit.2017.03.004
9. Yazisiz V, Gocer M, Erbasan F, Ucar I, Aslan B, Oygen S, et al. Survival analysis of patients with sjogren’s syndrome in Turkey: a tertiary hospital-based study. Clin Rheumatol (2020) 39(1):233–41. doi: 10.1007/s10067-019-04744-6
10. Brito-Zeron P, Kostov B, Solans R, Fraile G, Suarez-Cuervo C, Casanovas A, et al. Systemic activity and mortality in primary sjogren syndrome: predicting survival using the eular-ss disease activity index (Essdai) in 1045 patients. Ann Rheum Dis (2016) 75(2):348–55. doi: 10.1136/annrheumdis-2014-206418
11. Qian J, He C, Li Y, Peng L, Yang Y, Xu D, et al. Ten-year survival analysis of patients with primary sjogren’s syndrome in China: a national prospective cohort study. Ther Adv Musculoskelet Dis (2021) 13:1759720X211020179. doi: 10.1177/1759720X211020179
12. Shiboski CH, Shiboski SC, Seror R, Criswell LA, Labetoulle M, Lietman TM, et al. 2016 American College of Rheumatology/European league against rheumatism classification criteria for primary sjogren’s syndrome: a consensus and data-driven methodology involving three international patient cohorts. Arthritis Rheumatol (>2017) 69(1):35–45. doi: 10.1002/art.39859
13. Taylor KE, Wong Q, Levine DM, McHugh C, Laurie C, Doheny K, et al. Genome-wide association analysis reveals genetic heterogeneity of sjogren’s syndrome according to ancestry. Arthritis Rheumatol (2017) 69(6):1294–305. doi: 10.1002/art.40040
14. Thorne I, Sutcliffe N. Sjogren’s syndrome. Br J Hosp Med (Lond) (2017) 78(8):438–42. doi: 10.12968/hmed.2017.78.8.438
15. Fisher BA, Jonsson R, Daniels T, Bombardieri M, Brown RM, Morgan P, et al. Standardisation of labial salivary gland histopathology in clinical trials in primary sjögren’s syndrome. Ann Rheum Dis (2017) 76(7):1161–8. doi: 10.1136/annrheumdis-2016-210448
16. Chen W, Cao H, Lin J, Olsen N, Zheng SG. Biomarkers for primary sjogren’s syndrome. Genomics Proteomics Bioinf (2015) 13(4):219–23. doi: 10.1016/j.gpb.2015.06.002
17. Baldini C, Ferro F, Elefante E, Bombardieri S. Biomarkers for sjogren’s syndrome. biomark Med (2018) 12(3):275–86. doi: 10.2217/bmm-2017-0297
18. Seror R, Nocturne G, Mariette X. Current and future therapies for primary sjogren syndrome. Nat Rev Rheumatol (2021) 17(8):475–86. doi: 10.1038/s41584-021-00634-x
19. Alunno A, Petrillo MG, Nocentini G, Bistoni O, Bartoloni E, Caterbi S, et al. Characterization of a new regulatory Cd4+ T cell subset in primary sjogren’s syndrome. Rheumatol (Oxford) (2013) 52(8):1387–96. doi: 10.1093/rheumatology/ket179
20. Manfrè V, Cafaro G, Riccucci I, Zabotti A, Perricone C, Bootsma H, et al. One year in review 2020 comorbidities, diagnosis and treatment of primary sjögren’s syndrome. Clin Exp Rheumatol (2020) 126(4):10–22.
21. Sallusto F, Lanzavecchia A. Human Th17 cells in infection and autoimmunity. Microbes Infect (2009) 11(5):620–4. doi: 10.1016/j.micinf.2009.04.004
22. Zhong Y, Zhang W, Hong X, Zeng Z, Chen Y, Liao S, et al. Screening biomarkers for systemic lupus erythematosus based on machine learning and exploring their expression correlations with the ratios of various immune cells. Front Immunol (2022) 13:873787. doi: 10.3389/fimmu.2022.873787
23. Lin S, Fan R, Li W, Hou W, Lin Y. A cerna regulatory network in systemic lupus erythematosus and its molecular interplay with cancer. Ann Transl Med (2022) 10(10):563. doi: 10.21037/atm-22-1533
24. Feng X, Huang J, Liu Y, Xiao L, Wang D, Hua B, et al. Identification of interferon-inducible genes as diagnostic biomarker for systemic lupus erythematosus. Clin Rheumatol (2015) 34(1):71–9. doi: 10.1007/s10067-014-2799-4
25. Negrini S, Emmi G, Greco M, Borro M, Sardanelli F, Murdaca G, et al. Sjogren’s syndrome: a systemic autoimmune disease. Clin Exp Med (2022) 22(1):9–25. doi: 10.1007/s10238-021-00728-6
26. Wang B, Chen S, Li Y, Xuan J, Liu Y, Shi G. Targeted therapy for primary sjogren’s syndrome: where are we now? BioDrugs (2021) 35(6):593–610. doi: 10.1007/s40259-021-00505-7
27. Takagi Y, Nakamura H, Sumi M, Shimizu T, Hirai Y, Horai Y, et al. Combined classification system based on Acr/Eular and ultrasonographic scores for improving the diagnosis of sjogren’s syndrome. PloS One (2018) 13(4):e0195113. doi: 10.1371/journal.pone.0195113
28. Lee KA, Choi W, Kim J, Lee SH, Kim HR, Kim HS. Elderly-onset primary sjogren’s syndrome focused on clinical and salivary gland ultrasonographic features. Joint Bone Spine (2021) 88(4):105132. doi: 10.1016/j.jbspin.2021.105132
29. Chen L, Lu D, Yu K, He S, Liu L, Zhang X, et al. Bioinformatics analysis for identification of key genes in salivary gland and the potential of a combination of biomarkers for the diagnosis of ss. J Inflamm Res (2021) 14:4143–53. doi: 10.2147/JIR.S322318
30. Xu T, Guo Y, Lu J, Shan J, Lin L, Qian W, et al. Untargeted serum metabolomics and potential biomarkers for sjögren’s syndrome. Clin Exp Rheumatol (2021) 133(6):23–9. doi: 10.55563/clinexprheumatol/ylte6v
31. Li N, Li L, Wu M, Li Y, Yang J, Wu Y, et al. Integrated bioinformatics and validation reveal potential biomarkers associated with progression of primary sjogren’s syndrome. Front Immunol (2021) 12:697157. doi: 10.3389/fimmu.2021.697157
32. Azari H, Karimi E, Shekari M, Tahmasebi A, Nikpoor AR, Negahi AA, et al. Construction of a lncrna-Mirna-Mrna network to determine the key regulators of the Th1/Th2 imbalance in multiple sclerosis. Epigenomics (2021) 13(22):1797–815. doi: 10.2217/epi-2021-0296
33. Fouet G, Bally I, Chouquet A, Reiser JB, Thielens NM, Gaboriaud C, et al. Molecular basis of complement C1q collagen-like region interaction with the immunoglobulin-like receptor lair-1. Int J Mol Sci (2021) 22(10):5125. doi: 10.3390/ijms22105125
34. Llanos C, Carreno LJ, Kalergis AM. Contribution of dendritic Cell/T cell interactions to triggering and maintaining autoimmunity. Biol Res (2011) 44(1):53–61. doi: 10.4067/S0716-97602011000100007
35. Qiu J, Wu B, Goodman SB, Berry GJ, Goronzy JJ, Weyand CM. Metabolic control of autoimmunity and tissue inflammation in rheumatoid arthritis. Front Immunol (2021) 12:652771. doi: 10.3389/fimmu.2021.652771
36. Mielle J, Tison A, Cornec D, Le Pottier L, Daien C, Pers J-O. B cells in sjögren’s syndrome: from pathophysiology to therapeutic target. Rheumatology (2021) 60(6):2545–60. doi: 10.1093/rheumatology/key332
37. Pontarini E, Verstappen GM, Grigoriadou S, Kroese F, Bootsma H, Bombardieri M. Blocking T cell Co-stimulation in primary sjögren’s syndrome_ rationale, clinical efficacy and modulation of peripheral and salivary gland biomarkers. Clin Exp Rheumatol (2020) 126(4):222–7.
38. Nocturne G, Mariette X. B cells in the pathogenesis of primary sjögren syndrome. Nat Rev Rheumatol (2018) 14(3):133–45. doi: 10.1038/nrrheum.2018.1
39. Du W, Han M, Zhu X, Xiao F, Huang E, Che N, et al. The multiple roles of b cells in the pathogenesis of sjogren’s syndrome. Front Immunol (2021) 12:684999. doi: 10.3389/fimmu.2021.684999
40. Verstappen GM, Ice JA, Bootsma H, Pringle S, Haacke EA, de Lange K, et al. Gene expression profiling of epithelium-associated Fcrl4(+) b cells in primary sjogren’s syndrome reveals a pathogenic signature. J Autoimmun (2020) 109:102439. doi: 10.1016/j.jaut.2020.102439
41. Abe S, Tsuboi H, Kudo H, Asashima H, Ono Y, Honda F, et al. M3 muscarinic acetylcholine receptor-reactive Th17 cells in primary sjogren’s syndrome. JCI Insight (2020) 5(15):e135982. doi: 10.1172/jci.insight.135982
42. Tasaki S, Suzuki K, Nishikawa A, Kassai Y, Takiguchi M, Kurisu R, et al. Multiomic disease signatures converge to cytotoxic Cd8 T cells in primary sjogren’s syndrome. Ann Rheum Dis (2017) 76(8):1458–66. doi: 10.1136/annrheumdis-2016-210788
43. Chen W, Yang F, Xu G, Ma J, Lin J. Follicular helper T cells and follicular regulatory T cells in the immunopathology of primary sjogren’s syndrome. J Leukoc Biol (2021) 109(2):437–47. doi: 10.1002/JLB.5MR1020-057RR
44. Singh N, Cohen PL. The T cell in sjogren’s syndrome: force majeure, not spectateur. J Autoimmun (2012) 39(3):229–33. doi: 10.1016/j.jaut.2012.05.019
45. Kimoto O, Sawada J, Shimoyama K, Suzuki D, Nakamura S, Hayashi H, et al. Activation of the interferon pathway in peripheral blood of patients with sjogren’s syndrome. J Rheumatol (2011) 38(2):310–6. doi: 10.3899/jrheum.100486
46. Yao Q, Song Z, Wang B, Qin Q, Zhang JA. Identifying key genes and functionally enriched pathways in sjogren’s syndrome by weighted gene Co-expression network analysis. Front Genet (2019) 10:1142. doi: 10.3389/fgene.2019.01142
47. Brkic Z, Maria NI, van Helden-Meeuwsen CG, van de Merwe JP, van Daele PL, Dalm VA, et al. Prevalence of interferon type I signature in Cd14 monocytes of patients with sjogren’s syndrome and association with disease activity and baff gene expression. Ann Rheum Dis (2013) 72(5):728–35. doi: 10.1136/annrheumdis-2012-201381
48. De Decker M, Lavaert M, Roels J, Tilleman L, Vandekerckhove B, Leclercq G, et al. Hes1 and Hes4 have non-redundant roles downstream of notch during early human T-cell development. Haematologica (2021) 106(1):130–41. doi: 10.3324/haematol.2019.226126
Keywords: Sjogren’s Syndrome, machine learning, potential biomarker, immune cell disturbance, CIBERSORT
Citation: Zhong Y, Zhang W, Liu D, Zeng Z, Liao S, Cai W, Liu J, Li L, Hong X, Tang D and Dai Y (2023) Screening biomarkers for Sjogren’s Syndrome by computer analysis and evaluating the expression correlations with the levels of immune cells. Front. Immunol. 14:1023248. doi: 10.3389/fimmu.2023.1023248
Received: 22 August 2022; Accepted: 30 May 2023;
Published: 13 June 2023.
Edited by:
Luca Quartuccio, University of Udine, ItalyReviewed by:
Onorina Berardicurti, Campus Bio-Medico University, ItalyElizabeth C. Jury, University College London, United Kingdom
Copyright © 2023 Zhong, Zhang, Liu, Zeng, Liao, Cai, Liu, Li, Hong, Tang and Dai. This is an open-access article distributed under the terms of the Creative Commons Attribution License (CC BY). The use, distribution or reproduction in other forums is permitted, provided the original author(s) and the copyright owner(s) are credited and that the original publication in this journal is cited, in accordance with accepted academic practice. No use, distribution or reproduction is permitted which does not comply with these terms.
*Correspondence: Yong Dai, ZGFpeW9uZzIyQGFsaXl1bi5jb20=; ZGFpLnlvbmdAc3pob3NwaXRhbC5jb20=; Donge Tang, ZG9uZ2U2NkAxMjYuY29t; Xiaoping Hong, aG9uZ3hpYW9waW5nMTIzQHRvbS5jb20=
†These authors have contributed equally to this work