
95% of researchers rate our articles as excellent or good
Learn more about the work of our research integrity team to safeguard the quality of each article we publish.
Find out more
ORIGINAL RESEARCH article
Front. Immunol. , 03 October 2022
Sec. Cancer Immunity and Immunotherapy
Volume 13 - 2022 | https://doi.org/10.3389/fimmu.2022.997265
This article is part of the Research Topic Identification and Characterization of Molecular Targets in Hepatocellular Carcinoma View all 22 articles
 Jun Cao†
 Dao-yuan Tu†Jie Zhou†
 Guo-qing JiangSheng-jie Jin
 Bing-bing SuHao TangYu-hong TangAo-qing WangQian WangRen-jie LiuChi Zhang*
 Dou-sheng Bai*
The membrane‐associated RING‐CH (MARCH) family, a member of the E3 ubiquitin ligases, has been confirmed by a growing number of studies to be associated with immune function and has been highlighted as a potential immunotherapy target. In our research, hepatocellular carcinoma (HCC) patients were divided into C1 and C2 MARCH ligase-related patterns by the non-negative matrix factorization (NMF) algorithm. Multiple analyses revealed that the MARCH ligase-related cluster was related to prognosis, clinicopathological characteristics, and the tumor immune microenvironment (TIME). Next, the signature (risk score) of the MARCH prognosis was constructed, including eight genes associated with the MARCH ligase (CYP2C9, G6PD, SLC1A5, SPP1, ANXA10, CDC20, PON1, and FTCD). The risk score showed accuracy and stability. We found that the correlations between risk score and TIME, tumor mutation burden (TMB), prognosis, and clinicopathological characteristics were significant. Additionally, the risk score also had important guiding significance for HCC treatment, including chemotherapy, immunotherapy, and transarterial chemoembolization (TACE).
The global mortality and morbidity rates of hepatocellular carcinoma (HCC) are seven and three, respectively, which seriously threaten human health and life (1). With poor prognosis and complicated early diagnosis owing to the lack of reliable biomarkers, despite significant improvements in anticancer therapies over the past decades, the overall survival (OS) of HCC patients is still poor (2). Chemotherapy, immunotherapy, and transarterial chemoembolization (TACE) are the preferred treatments in patients with recurrent or end-stage HCC. However, the median OS probability usually does not improve much owing to the absence of reliable biomarkers of therapeutic sensitivity (3).
Ubiquitination is a highly versatile and conserved posttranslational modification that participates in the localization and degradation of many cytosolic and membrane proteins (4) and plays a significant role in cancer tumorigenesis and progression (5, 6). It requires the sequential action of three enzymes, E1, E2, and E3 ubiquitin ligase, and the E3 ubiquitin ligase, which can determine the specificity of protein substrates, is considered a potential diagnostic and therapeutic target for cancer (7). The membrane‐associated RING‐CH (MARCH) ligases, as one of the E3 ubiquitin ligases, control the function of important immunoreceptors, including histocompatibility complex class (MHC) molecules and the costimulatory molecule CD86. In fact, numerous studies have demonstrated the important role of MHC in the anti-PD-1 treatment of tumors. MHC-I expression is well known to facilitate immune evasion; MHC-II expression is correlated with the response to PD-1 blockade treatment (8). In addition, MARCH ligases are closely related to tumor invasion and metastasis. Downregulation of MARCH 1 decreases phosphorylated p38 MAPK (p-p38 MAPK) and Stat3 (p-Stat3) and inhibits HCC cell viability (9). MARCH 6 upregulation of ATF2 promotes HCC development (10). Downregulation of MARCH 8 expression in gastric cancer cells inhibited cell growth (11). These results suggest that MARCH ligases may play an important role in the regulation of the tumor immune microenvironment (TIME). Therefore, a comprehensive analysis of the clinical significance, immune infiltration, and biological role of MARCH ligases can provide new ideas for the diagnosis and treatment of HCC.
To counter the problems mentioned above, a cluster of 367 HCC patients from the TCGA database was formed according to the expression of MARCH ligases. By multiomics analysis, the differences between MARCH ligase-related patterns were analyzed, including clinical relevance, survival analysis, and TIME. We constructed the prognostic signature (risk score), which was proven to be an independent prognostic marker. The risk score can predict the OS of HCC patients. Furthermore, we have proven the significant correlation between risk score and somatic mutation, TIME, and the efficacy of immunotherapy, chemotherapy, and TACE in HCC patients.
Twenty patients with primary HCC were diagnosed at the Department of Hepatobiliary Pancreatic Surgery, Northern Jiangsu People’s Hospital and received surgical treatment. HCC tissues and paired adjacent tissues (n = 20 for both) were obtained from the patients in our hospital. The present study was performed in accordance with the principles outlined in the Declaration of Helsinki. Written informed consent was obtained from the individuals who provided the samples.
From the TCGA database (https://portal.gdc.cancer.gov/), we obtained the transcriptional RNA sequencing, somatic mutation, and clinical information of the TCGA-HCC cohort. Our transcript RNA sequencing panel included 374 HCC tumor tissues. These data were compiled as fragments per kilobase of transcript per million mapped reads (FPKM). When an individual gene symbol included more than one Ensembl ID, the calculation method annotated the gene expression in an average. A total of 367 patients were included in the training set after excluding the samples without complete information on OS. In this study, 350 TCGA samples had somatic mutation information. The 221 HCC samples with clinical information and RNA-seq data were provided by the GEO (https://www.ncbi.nlm.nih.gov/gds) to be used as the external test set. The copy number mutation landscape of 11 MARCH ligase genes was plotted, which are the mammalian homologs of K3 and K5 identified by bioinformatics studies (9), employing the R package “Rcircos” in human chromosomes. We used the GSE104580 (10) and GSE109211 (12) chips in the study to analyze TACE and sorafenib sensitivity.
To explore the distinct MARCH ligase-related patterns, we applied non-negative matrix factorization (NMF) through the R package “NMF.” The original matrix is subdivided into two non-negative matrices based on the NMF algorithm (13) to identify the potential characteristics of the gene expression profile. To obtain consistent clustering, the algorithm repeats the deposition and aggregates the result. K = 2 is the best cluster value, according to the cophenetic coefficient, sample size, and contour. Through the R package “prcomp,” the principal component analysis (PCA) scoring system was constructed by all the MARCH ligase-related genes that were selected.
Gene set enrichment analysis (GSEA) is an algorithm that is non-parametric and unsupervised that can convert the separated gene expression matrix into a particular gene set as a characteristic expression matrix. The algorithm is performed by the R packages “clusterProfiler,” “enrichplot,” and “DOSE.” We adopted the package “limma” to analyze the significant differences after transformation in the expression matrix. Through the R package “GSVA”, we investigated the Kyoto Encyclopedia of Genes and Genomes (KEGG) pathway by gene set variation analysis (GSVA). “h.all.v7.5.1.symbols.gmt” was obtained from the GSEA database.
The tumor immune dysfunction and exclusion (TIDE) score is a computational approach for predicting the immune escape of tumor cells; thus, a higher TIDE score suggests a lower response rate to immune checkpoint inhibitor (ICI) treatment. To model the mechanisms of distinct tumor immune evasion, the superior algorithm (14) was used to evaluate the TIDE.
To calculate the fractions of immune cell types in each sample, the MCP-counter method was adopted to determine the characteristics of the TIME. Additionally, through the Wilcoxon rank-sum test, we evaluated the relevance between immune cell abundance and risk score. We used the single-sample GSEA (ssGSEA) to study the immune status.
To identify differentially expressed genes (DEGs) between two different phenotypes, we adopted the package “limma” to assess the differences in gene expression after NMF clustering by p-values (p< 0.001) and t-statistics. Then, to analyze DEGs between MARCH ligase-related patterns, we used the enrichment of the KEGG and gene ontology (GO) pathways by the Metascape web-based platform (15).
The least absolute shrinkage and selection operator (LASSO) was performed by the package “glmnet” based on the DEGs that were prognosis-related in the model of univariate Cox regression; the important prognostic genes included eight DEGs (CYP2C9, G6PD, SLC1A5, SPP1, ANXA10, CDC20, PON1, and FTCD) that were identified by minimum criteria. Finally, we obtained the risk score formula:
The TCGA-HCC cohort was divided into low- and high-risk groups through the R package “surv_cutpoint” after calculating the optimal cutoff of risk score. Through the receiver operating characteristic (ROC) curve (package of “timeROC”) and Kaplan–Meier analysis (package of “survival”), we evaluated the predictive reliability of the prognostic models. The area under the curve (AUC) was applied to quantify the ROC curve. To validate the signature in the GEO cohort, we used the same analysis methods, risk score formula of calculation, and cutoff value.
The single-cell RNA-seq data are available in the GEO database, reference chip GSE146115 (16). The chip of genes in each cell is in the range of 50 to 9,000, the percentage of red blood cells is less than 3%, and the total gene expression copy numbers are less than 300,000. We selected 1,500 genes with the largest variances and labeled them in red, and we tagged the names of the first 10 genes that were highly variable at the same time.
First, PCA was utilized for dimension reduction based on the highly variable genes, and the resolution was set to 0.5. In total, we obtained 12 clusters. Cell clusters were visualized using UMAP algorithms, and the first 10 genes that showed significant differences in each cluster were selected and mapped. Subsequently, identifying the top differentially expressed genes for each cluster was performed using the FindAllMarkers function. In addition, the expression pattern of each marker gene among clusters was visualized by applying the “DotPlot” function in Seurat. Afterward, the SingleR package (version 1.10.0) was employed for marker-based cell-type annotation.
To calculate the half-maximal inhibitory concentration (IC50), we adopted the ridge regression algorithm, and through 10-fold cross-validation (17), we obtained satisfactory prediction veracity. The process was calculated through the package “pRRophetic” in R.
According to the manufacturer’s protocol, total RNA was extracted by TRIzol reagent (Invitrogen Carlsbad, CA, USA) from 20 paired HCC and paracancerous tissues. Then, total RNA from each sample was reverse-transcribed to cDNA using the PrimeScript™ RT reagent Kit (Takara Bio Inc., Japan). Real-time PCR was conducted using the SYBR-Green PCR kit (Takara, Osaka, Japan) in a Rotor-Gene 3000 machine (Corbett Life Science, Sydney, Australia). The specific primers used are listed in Supplementary Table 1.
The R software (version 4.0.5) was used to perform all statistical analyses in this study. To confirm a significant difference between the two groups, we used a paired-samples t-test or Wilcoxon rank-sum test. To check if there was a significant difference in more than two groups, the Kruskal–Wallis test was used. The relevance coefficients among the expression of immune checkpoint genes, tumor mutation burden (TMB), and risk score were calculated through Spearman’s correlation analysis. To indicate the gene mutation frequency, we built waterfall plots by the package “maftools” and set a standard of significant difference as p-value<0.05.
We researched the roles of 11 MARCH ligases (MARCH 1–11) in HCC. The analysis of 11 MARCH ligases showed that copy number variation (CNV) mutations were prevalent. MARCH 4, MARCH 6, MARCH 9, MARCH 10, and MARCH 11 revealed widespread CNV amplification. Figure 1A shows the locations of CNV alterations of 11 MARCH ligase genes on chromosomes. In contrast, MARCH 1, MARCH 2, MARCH 3, MARCH 5, MARCH 7, and MARCH 8 had prevalent CNV deletions (Figure 1B). Further analysis demonstrated that MARCH 2–11 were significantly upregulated in HCC samples (Figure 1C, Figure Supplement 2). The above results suggested that MARCH ligase may play a significant role in modulating the progression of HCC.
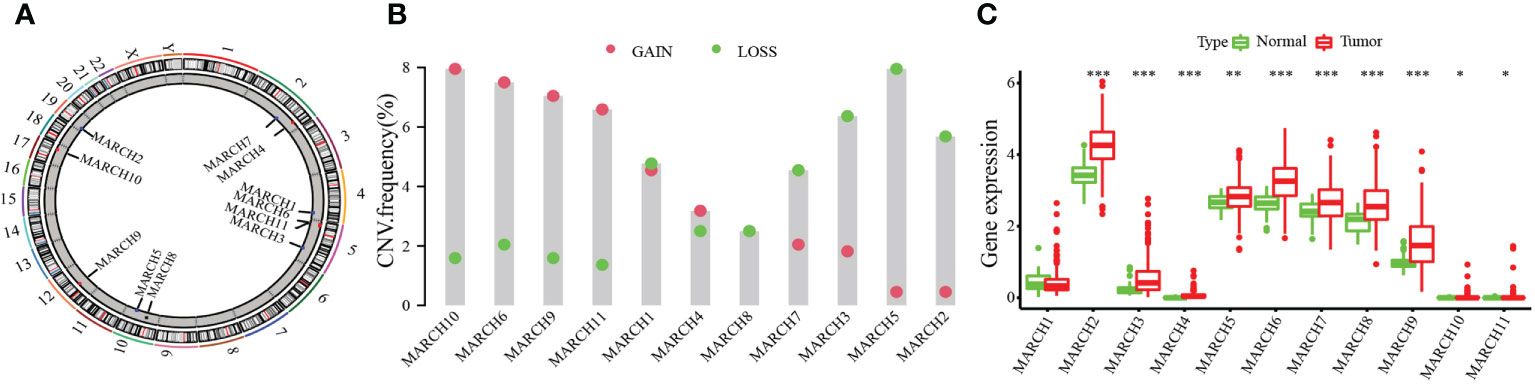
Figure 1 The genetic alterations of the membrane‐associated RING‐CH (MARCH) ligase landscape in hepatocellular carcinoma (HCC). (A) The CNV alteration location of MARCH ligase on chromosomes. (B) The CNV mutation frequency of 11 MARCH ligases was prevalent. The column represents the alteration frequency. The deletion frequency, blue dot; the amplification frequency, pink dot. (C) Differences in the gene expression levels of 11 MARCH ligases between normal and tumor samples. The asterisks represent statistical p-value (*p< 0.05; **p< 0.01; ***p< 0.001).
According to 11 MARCH ligases in the univariate Cox regression model, NMF clustering was used on the TCGA-HCC cohort. K = 2 was the best clustering result based on cophenetic coefficients (Figures 2A, B). The PCA results illustrated the differences between the C1 and C2 patterns at the transcriptional level of the MARCH ligases (Figure 2C). Compared with the C1 pattern, the Kaplan–Meier analysis suggested that the OS or progression-free survival (PFS) of the C2 pattern was significantly longer (Figure 2D, p< 0.001; Figure 2E, p = 0.001). Lastly, we adopted the chi-square test to reveal the difference between the C1 and C2 patterns in the clinicopathological characteristics. As the figure demonstrates, the pathologic stage, T stage, and histologic grade distribution were noticeably different in the C1 and C2 patterns (Figure 2F). The transcription profile heatmap of 11 MARCH ligase genes was significantly different in the C1 and C2 patterns (Figure 2G).
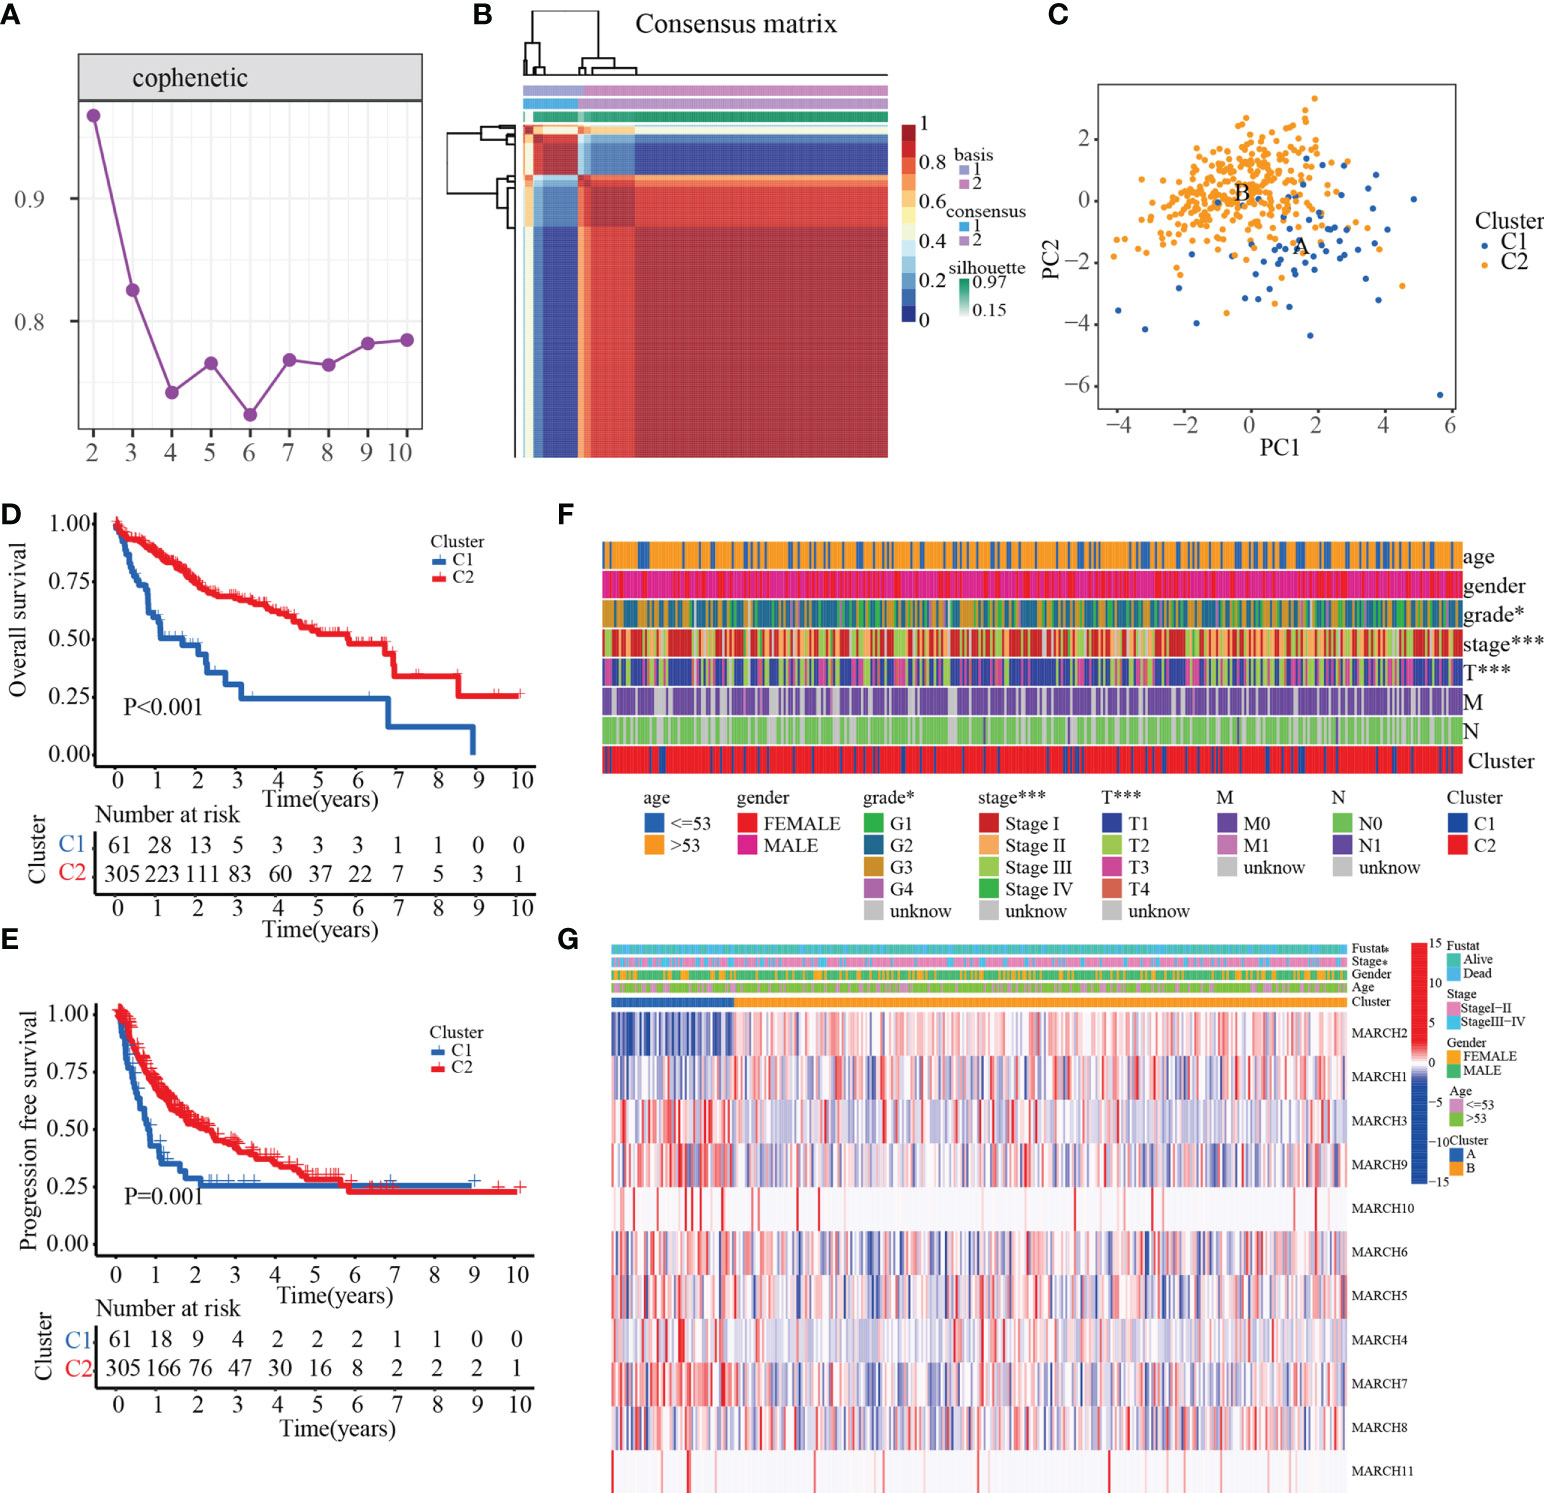
Figure 2 The prognostic value of C1 and C2. (A) Non-negative matrix factorization clustering of necroptosis-related patterns in the TCGA-HCC cohort. (B) Cophenetic coefficients. Expression profile of prognosis-related MARCH ligase gene: (C) PCA and (D, E) Kaplan–Meier analysis of OS and PFS. (F) Clinical relevance of MARCH ligase-related patterns. (G) Transcription profile heatmap of 11 prognosis-related MARCH ligase genes in C1 and C2 (*p< 0.05; ***p< 0.001).
To explore the biological molecular changes between the C1 and C2 patterns, we performed GSVA to explore the biological processes among these distinct RNA processing patterns (Figure 3A). The results showed that C1 had a significantly higher concentration in the reactive oxygen species pathway, oxidative phosphorylation, k-ras signaling, metabolism-related, and INF-α/γ response. However, in the PI3K–AKT–MTOR signaling, G2/M checkpoint, DNA repair, MYC target, and unfolded protein response pathways, C2 had a higher concentration. The results demonstrated that MARCH ligase may affect the prognosis of HCC patients by regulating the TIME. Therefore, we quantified the composition of the TIME using MCP-counter analysis to study the discrepancy in the immune-related characteristics between C1 and C2. We found that the infiltration rates of fibroblasts, myeloid dendritic cells, monocytic lineage, T cells, and B cells in C1 were higher than those in C2 (Figure 3B). Because the MARCH ligases could reduce the expression of MHC molecules, we researched the expression of MHC molecule-related genes between the C1 and C2 patterns. The results showed that the C1 cluster expression levels were higher than the C2 cluster in most major MHC molecules (Figure 3C). Additionally, to compare and visualize the correlative richness of 11 subpopulations of immune-infiltrating cells between the C1 cluster and C2 cluster, we established a heatmap with ssGSEA. We discovered that T follicular helper cells, CD4+ T cells, and NK cells were enriched in the C1 cluster (Figure 3D). As the waterfall plots showed, the 10 genes with the highest mutation rates in C1 were TP53 (40%), TTN (19%), MUC16 (17%), CTNNBI (16%), FAT3 (12%), OBSCN (12%), PCLO (12%), DNAH10 (12%), RYR2 (10%), and USH2A (10%). In contrast, the 10 genes with the highest mutation rates in C2 were CTNNB1 (24%), TTN (20%), TP53 (17%), MUC16 (12%), PCLO (8%), ABCA13 (8%), LRP1B (7%), XIRP2 (6%), CACNA1E (6%), and FLG (5%) (Figure 3E). In summary, we confirmed that C1 has more immune-related mutations.
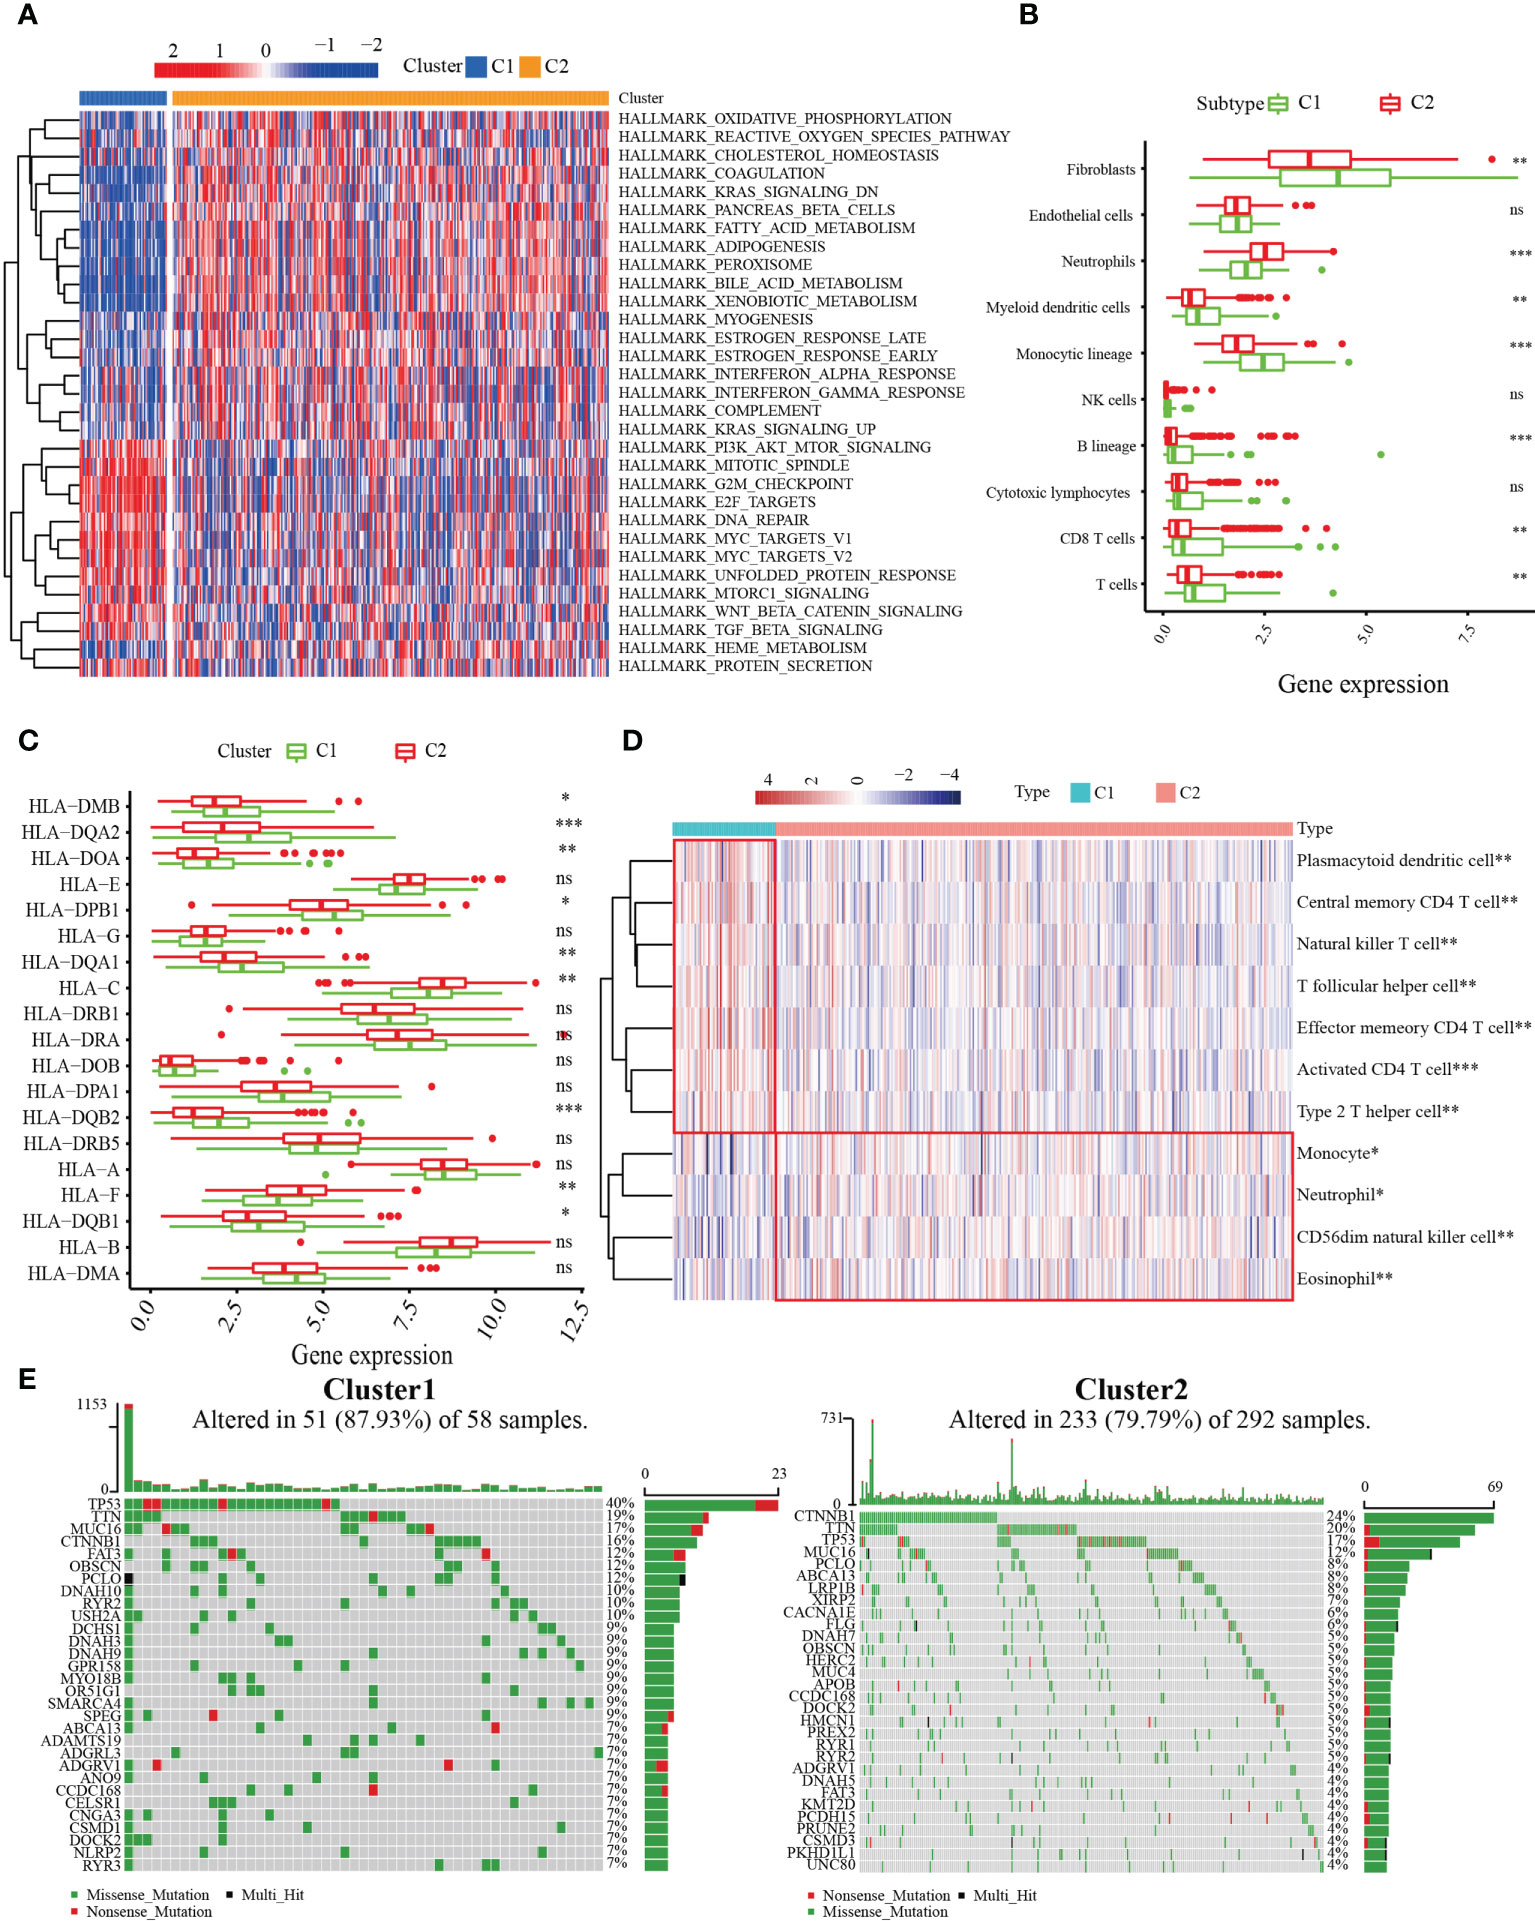
Figure 3 Correlation between MARCH ligase-related patterns and the tumor immune microenvironment (TIME). (A) Heatmap of GSVA results. (B) The difference in TIME composition. (C) Differential expression levels of HLA-related genes between the C1 (green) and C2 (red) groups (ns = not significant, *p< 0.05, **p< 0.01, ***p< 0.001). (D) Heatmap showing the relative abundances of 11 immune-infiltrating cell subpopulations. (E) The 30 genes with the highest mutation rates of C1 and C2 in waterfall plots.
To further construct the MARCH ligase-related prognostic score, we researched the DEGs between the C1 and C2 patterns. A total of 234 differentially expressed genes were screened, of which 24 genes were downregulated and 210 genes were upregulated (Figure Supplement 3A). We applied functional enrichment analyses of DEGs among the C1 and C2 patterns to study the differences in molecular GO, indicating that DEGs primarily participated in metabolic processes, biosynthetic processes, complement and coagulation cascades, nuclear receptor meta-pathways, and complement cascades (Figure Supplement 3B).
The univariate Cox regression analysis model was obtained based on previous research with DEGs among C1 and C2. Next, by analyzing the LASSO Cox regression, we processed the univariate Cox regression model to obtain the coefficient, and eight genes, CYP2C9, G6PD, SLC1A5, SPP1, ANXA10, CDC20, PON1, and FTCD, were chosen based on the minimum standard (Figures 4A, B). The quantitative indicator was obtained: risk score = (0.08152 × G6PD expression) + (−0.02512 × CYP2C29 expression) + (0.00272 × SLC1A5 expression) + (0.05107 × SPP1 expression) + (−0.04573 × ANXA10 expression) + (0.12660 × CDC20 expression) + (−0.00739 × PON1 expression) + (−0.03437 × FTCD expression). Next, we calculated the risk score according to the above formula for each patient. Based on the optimal cutoff value (cut point = 0.4380) for the risk score, the patients were divided into a low-risk group (n = 181) and a high-risk group (n = 180) through Kaplan–Meier analysis. Compared with the high-risk group, the OS in the low-risk group was obviously longer (Figure 4C, p = 4 × 10⁻⁷). In addition, to predict the OS survival rate of HCC patients, we used ROC curves to evaluate the risk score veracity. Figure 4D demonstrates that 0.772, 0.684, and 0.688 were the 1-, 3-, and 5-year OS survival rates of AUC, respectively. In the high-risk group, the ratio of deaths was elevated with risk score (Figures 4E, F). With the risk processes, the expression of G6PD, SLC1A5, SPP1, and CDC20 was increased, and CYP2C9, ANXA10, PON1, and FTCD expression was negatively correlated with the risk score (Figure 4G).
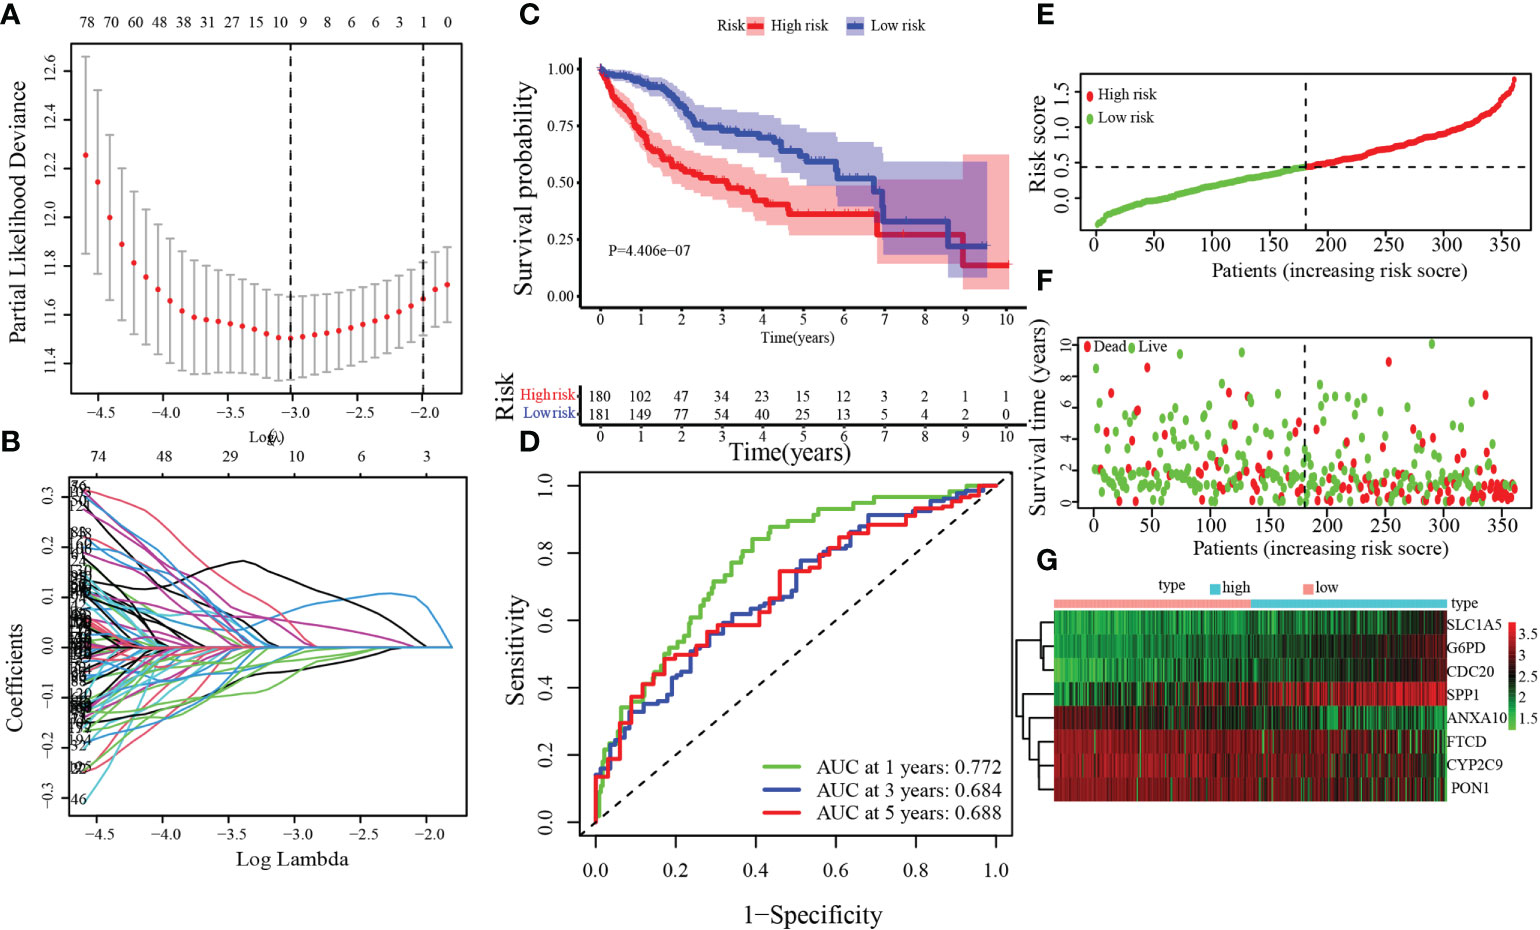
Figure 4 Establishment of the MARCH ligase signature according to the training set. (A, B) LASSO Cox regression analysis. (C) Kaplan–Meier analysis between risk score-defined groups. (D) Time-dependent ROC curve of risk score. (E) Risk score distribution. (F) Survival status heatmap. (G) The expression profile heatmap of eight genes.
To verify the accuracy and stability of our findings, the risk score model was further evaluated using the GEO dataset, which included 221 HCC patients. According to the same cutoff value (cut point = 0.4380), groups were divided into the training set [low-risk group (n = 56) and high-risk group (n = 165)]. By Kaplan–Meier analysis, we found that the OS of patients in the high-risk group was significantly poorer than that in the low-risk group (Figure 5A, p = 1.094 × 10⁻²). Figure 5B demonstrates that 0.639, 0.668, and 0.665 were the 1-, 3-, and 5-year OS survival rates of AUC, respectively. The trends of the training sets and test sets were similar in the risk score distribution, the status of survival, and the heatmaps of the expression profile (Figures 5C–E).
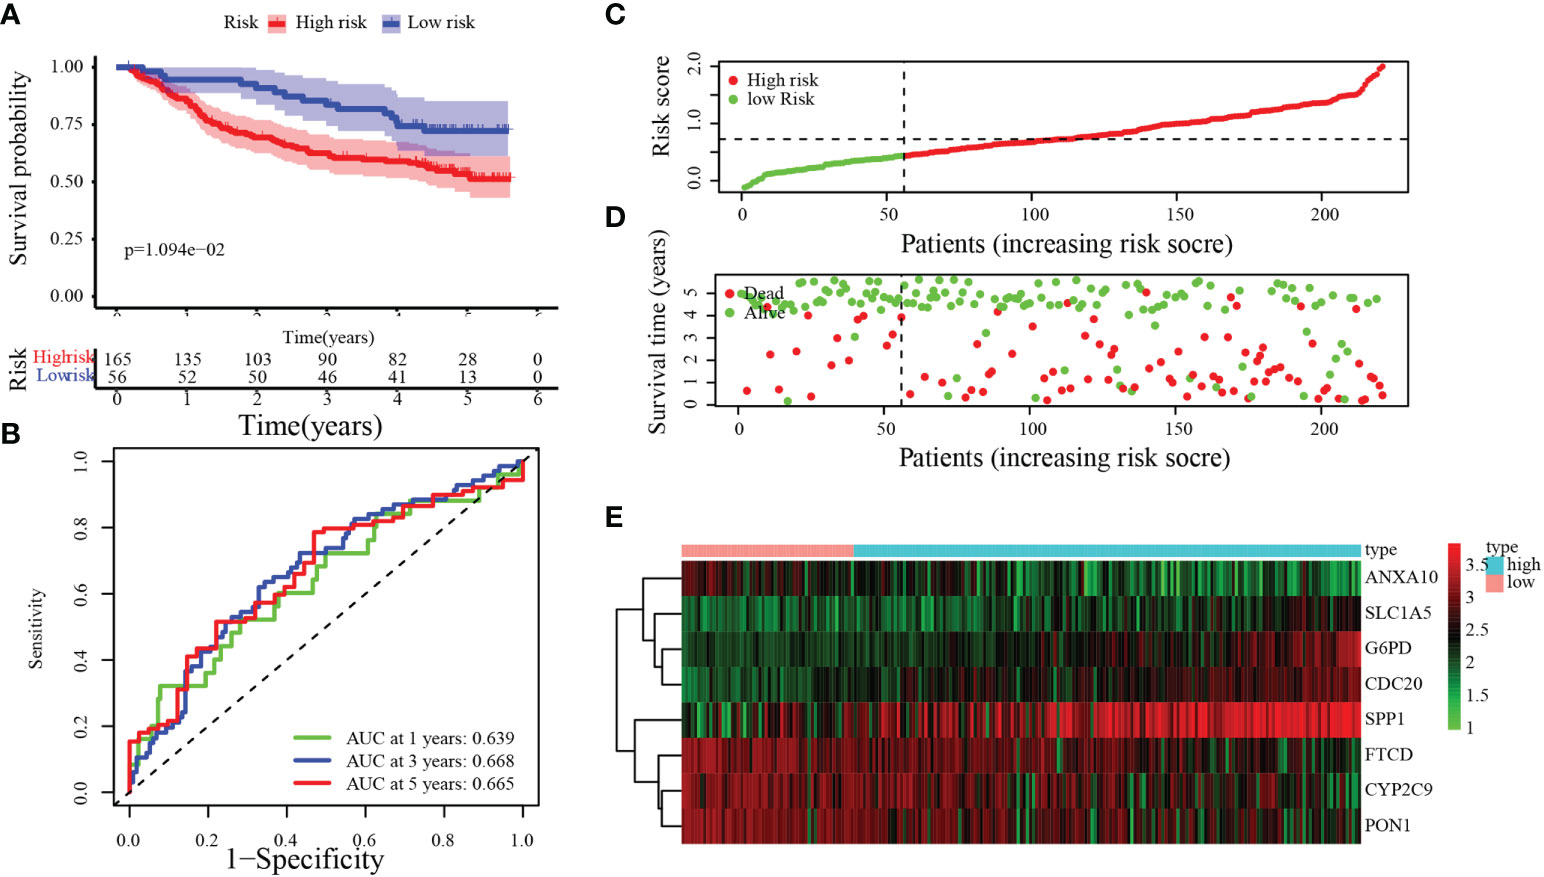
Figure 5 Validation of the MARCH ligase signature based on the test set. (A) Kaplan–Meier analysis between the risk score-defined groups. (B) Time-dependent ROC curve of risk score. (C) Risk score distribution. (D) Survival status heatmap. (E) The expression profile heatmap of eight genes.
To further analyze the clinical significance of the MARCH ligase signature, we studied the relevance of the risk score and clinicopathological characteristics. In the TCGA cohort, there was a significant difference between the low- and high-risk groups in terms of histologic grade, pathologic stage, and T stage (Figure 6A). In the GEO cohort, there was a significant difference between the low- and high-risk groups in the pathologic stage and the serum alpha-fetoprotein (AFP) content, which is a serum marker of HCC (Figure 6B). In summary, the tendency for poor prognosis results and advanced pathological characteristics was concentrated in the high-risk groups. Then, to study whether risk score could be an independent prognostic indicator of TCGA-HCC and GEO-HCC patients, univariate and multivariate Cox regression analyses were used. Through univariate Cox regression analysis, we found that risk score and pathological stage were also hazard factors in the TCGA cohort (Figure 6C). In the GEO cohort, univariate Cox regression analysis indicated that risk score was a hazard factor similar to tumor size, pathologic stage, and cirrhosis (Figure 6D). Next, through the analysis of multivariate Cox regression, we suggested that risk score was an excellent independent prognostic indicator both in the TCGA-HCC cohort [hazard ratio (HR) = 4.703 (2.585–8.556), p< 0.001, Figure 6E] and the GEO-HCC cohort [HR = 1.959 (1.158–3.314), p = 0.012, Figure 6F].
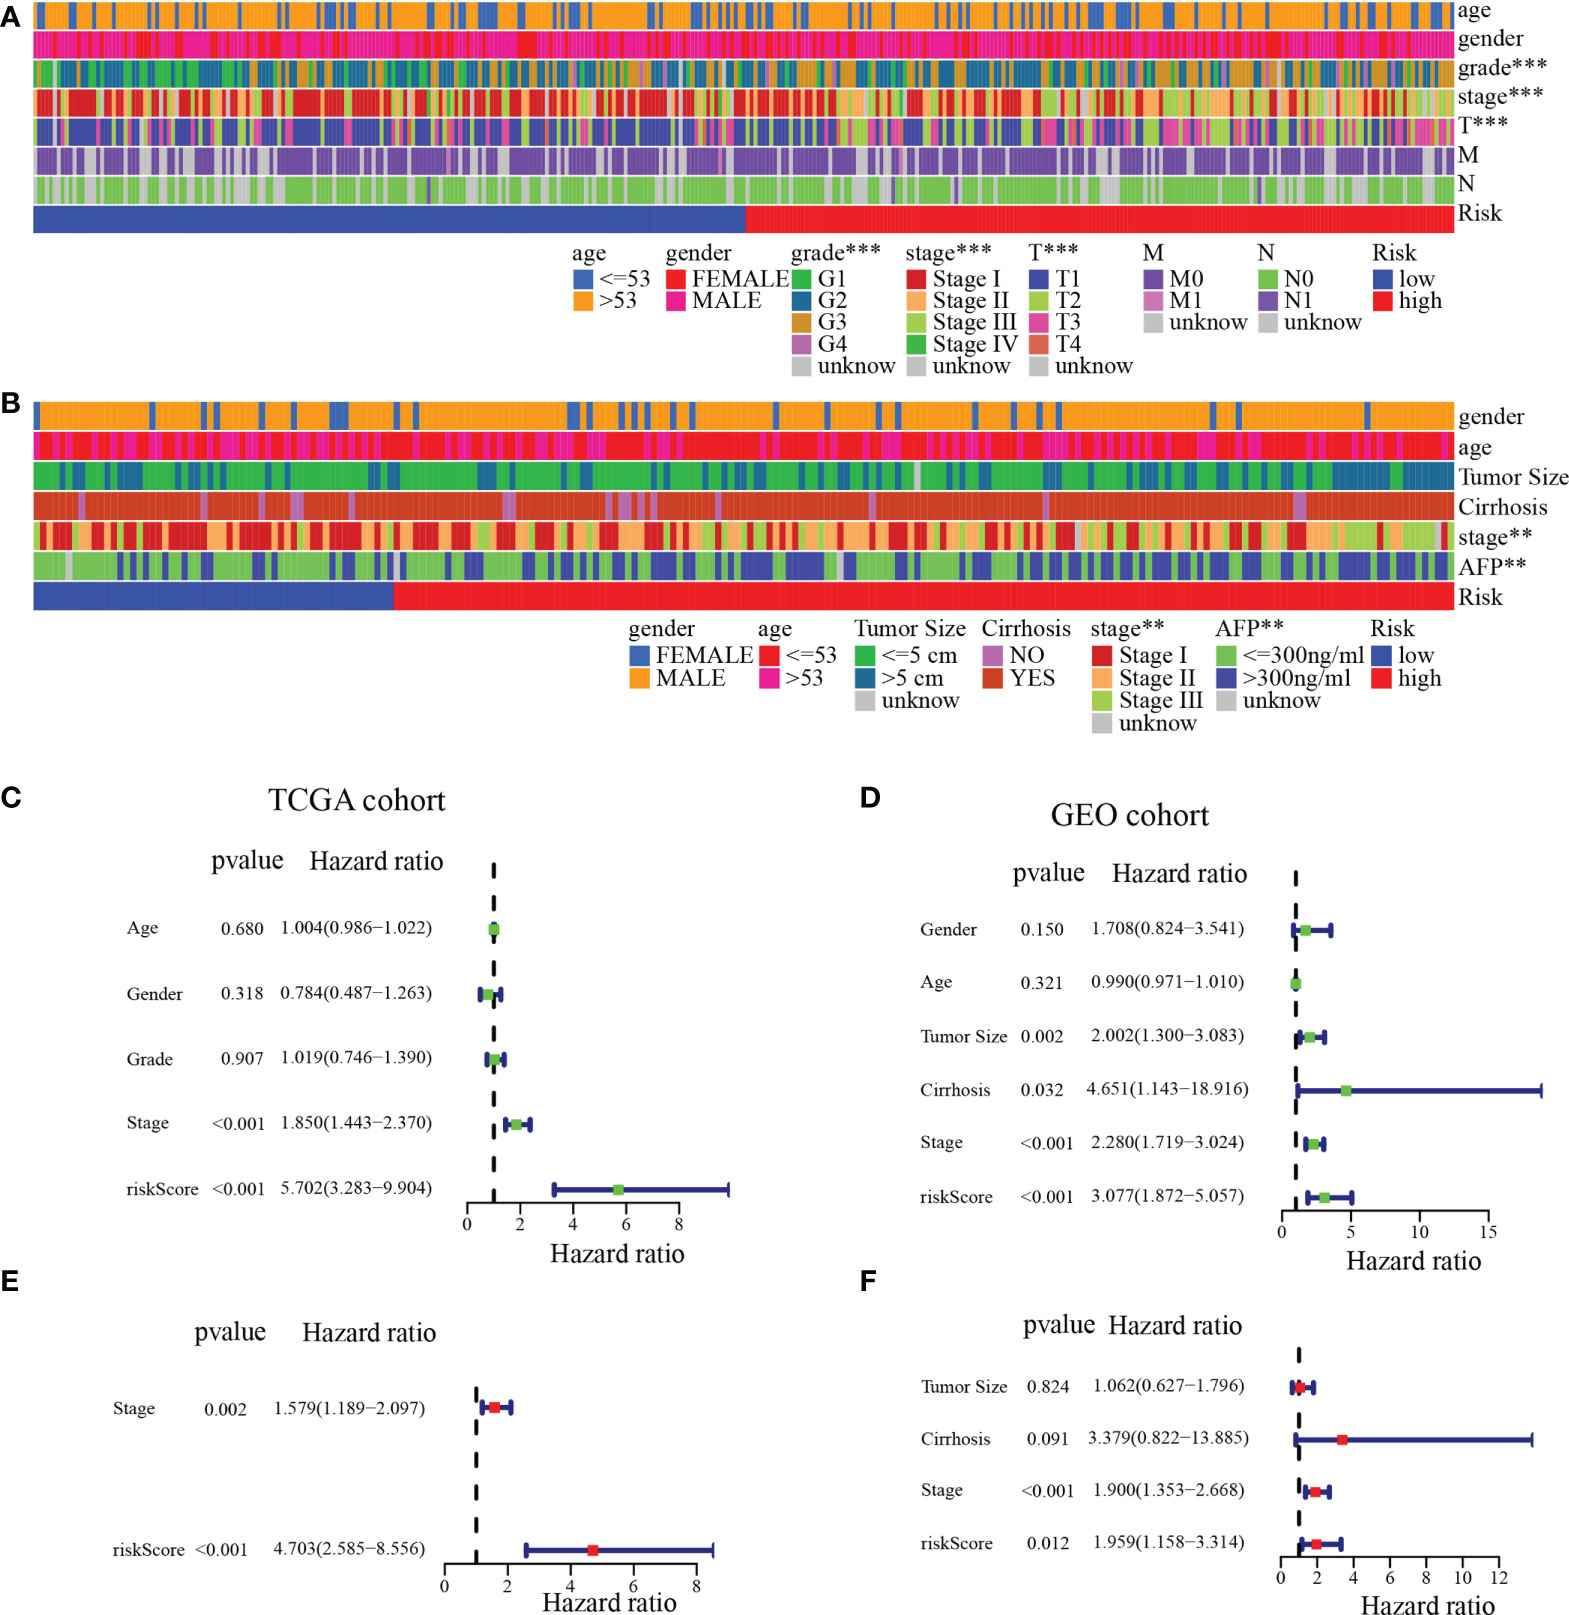
Figure 6 Independent prognostic analysis of risk score. (A) Clinical relevance of the high-risk and low-risk groups in the TCGA cohort. (B) Clinical relevance of the high-risk and low-risk groups in the GEO cohort. Univariate (C) and multivariate (E) Cox regression analyses of risk score and clinicopathological parameters in the TCGA cohort. Univariate (D) and multivariate (F) Cox regression analyses of risk score and clinicopathological parameters in the GEO cohort. **p< 0.01; ***p< 0.001.
To further verify the accuracy of our model, we compared our established model with four other predictive models of precision in determining HCC prognosis: the Dai signature prognostic model (18), the Guan signature prognostic model (19), the Liu signature prognostic model (20), and the Shao signature prognostic model (21). With a similar method that established our eight-gene-based model (described above), the relevant gene risk score in the dataset of the four models was calculated for TCGA-HCC. To predict the OS of the low- and high-risk groups, the Dai signature predictive model (log-rank p< 0.001) and the Liu signature predictive model (log-rank p = 0.004) showed significant differences; the Guan signature predictive model and the Shao signature predictive model showed no significant differences (Figures 7A–D). Except for the Dai signature, the predictive model for the 1-year survival rate had minutely higher AUC values than our model. The 1-year survival rate of the AUC value in the Liu signature predictive model was the same as that in our model. The AUC value of our model was significantly higher than that of the other models for the 1-, 3-, and 5-year survival rates (Figures 7E–H). In predicting the survival of HCC patients, these results suggested that our model possessed better accuracy.
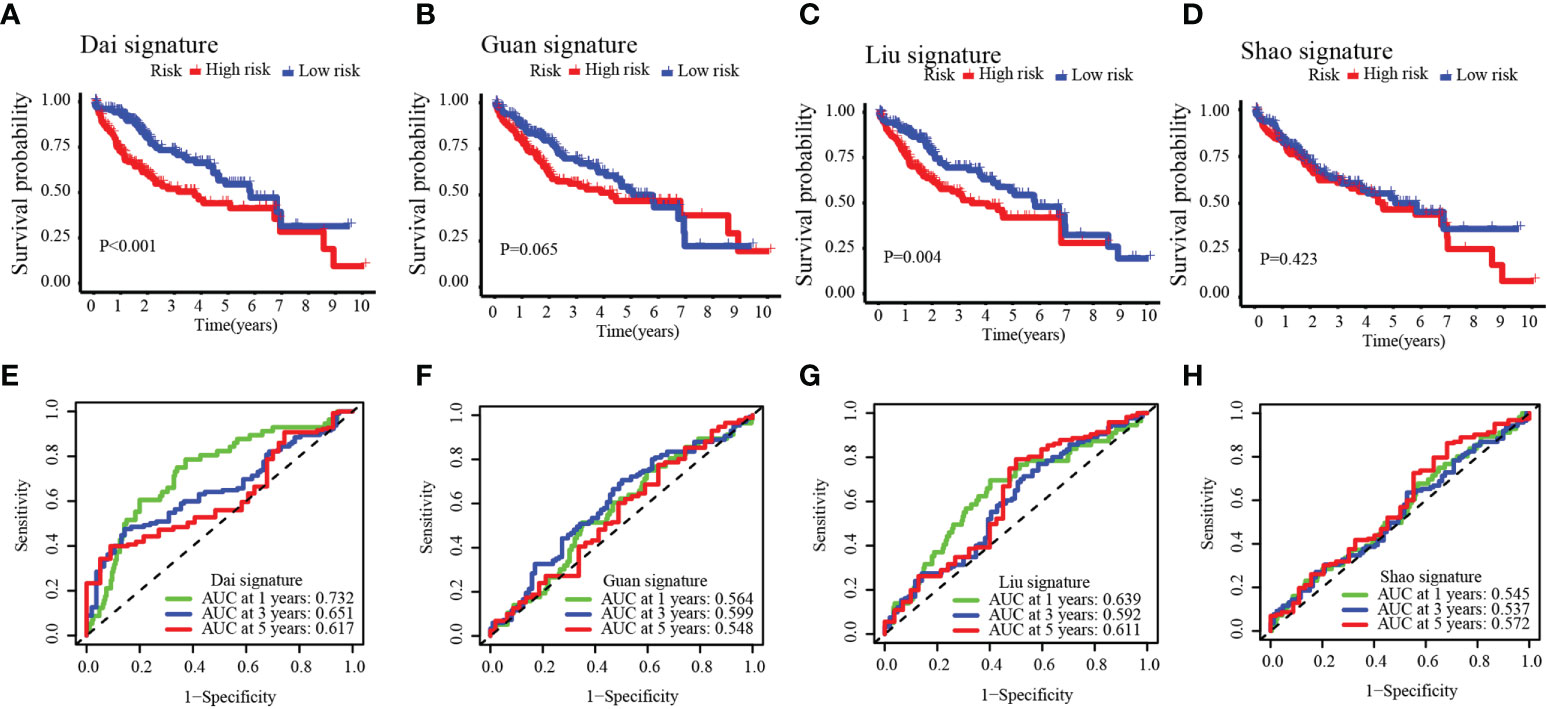
Figure 7 Four other prognostic models in the TCGA-HCC cohort (A–D) and time-dependent ROC curves (E–H).
Next, we analyzed the relationship between the TIME and the MARCH ligase signature. In the 361 TCGA cohort, we analyzed the distribution in the C1 group and the C2 group of low- and high-risk groups. The analysis showed that the low-risk groups were almost all concentrated in C2, and the C1 group consisted of the high-risk groups (Figure 8A). In addition, MARCH 1–11 gene expression was also analyzed in the low- and high-risk groups. The results showed that compared with the low-risk group, most of the MARCH genes (MARCH 1, 3, 5, 6, 7, 9, 10, 11) were more highly expressed in the high-risk group (Figure 8B). The above results indicated that risk score could reflect MARCH ligase-related patterns. The cellular underpinnings of immunotherapy are CD4+ T cells, CD8+ T cells, NK cells, and other immune cells (22). Therefore, the study of immune infiltrates in the TIME is the key to improving the therapeutic response rate of HCC. Through ssGSEA, we calculated the subpopulations of different immune cells and related functional enrichment scores to study the relationship between immune status and risk score. According to the results of the analysis, CD4+ T cells, CD8+ T cells, activated dendritic cells, immature dendritic cells, and NK cells had higher levels of infiltration in patients with high-risk scores in both datasets (Wilcoxon test, p< 0.001) (Figures 8C, D). In the TCGA-HCC and GEO-HCC datasets, ssGSEA indicated that the functions of most immune-related genes were mainly enriched in the high-risk group (Figures 8E, F). Additionally, we further explored the immune checkpoint molecule expression among the low- and high-risk groups in both cohorts. The results indicated that the difference in PDCD1 expression was statistically significant in the low- and high-risk groups. In the TCGA dataset, there were statistically significant differences in CTLA4 expression between the low-risk group and the high-risk group (Figures 8G, H).
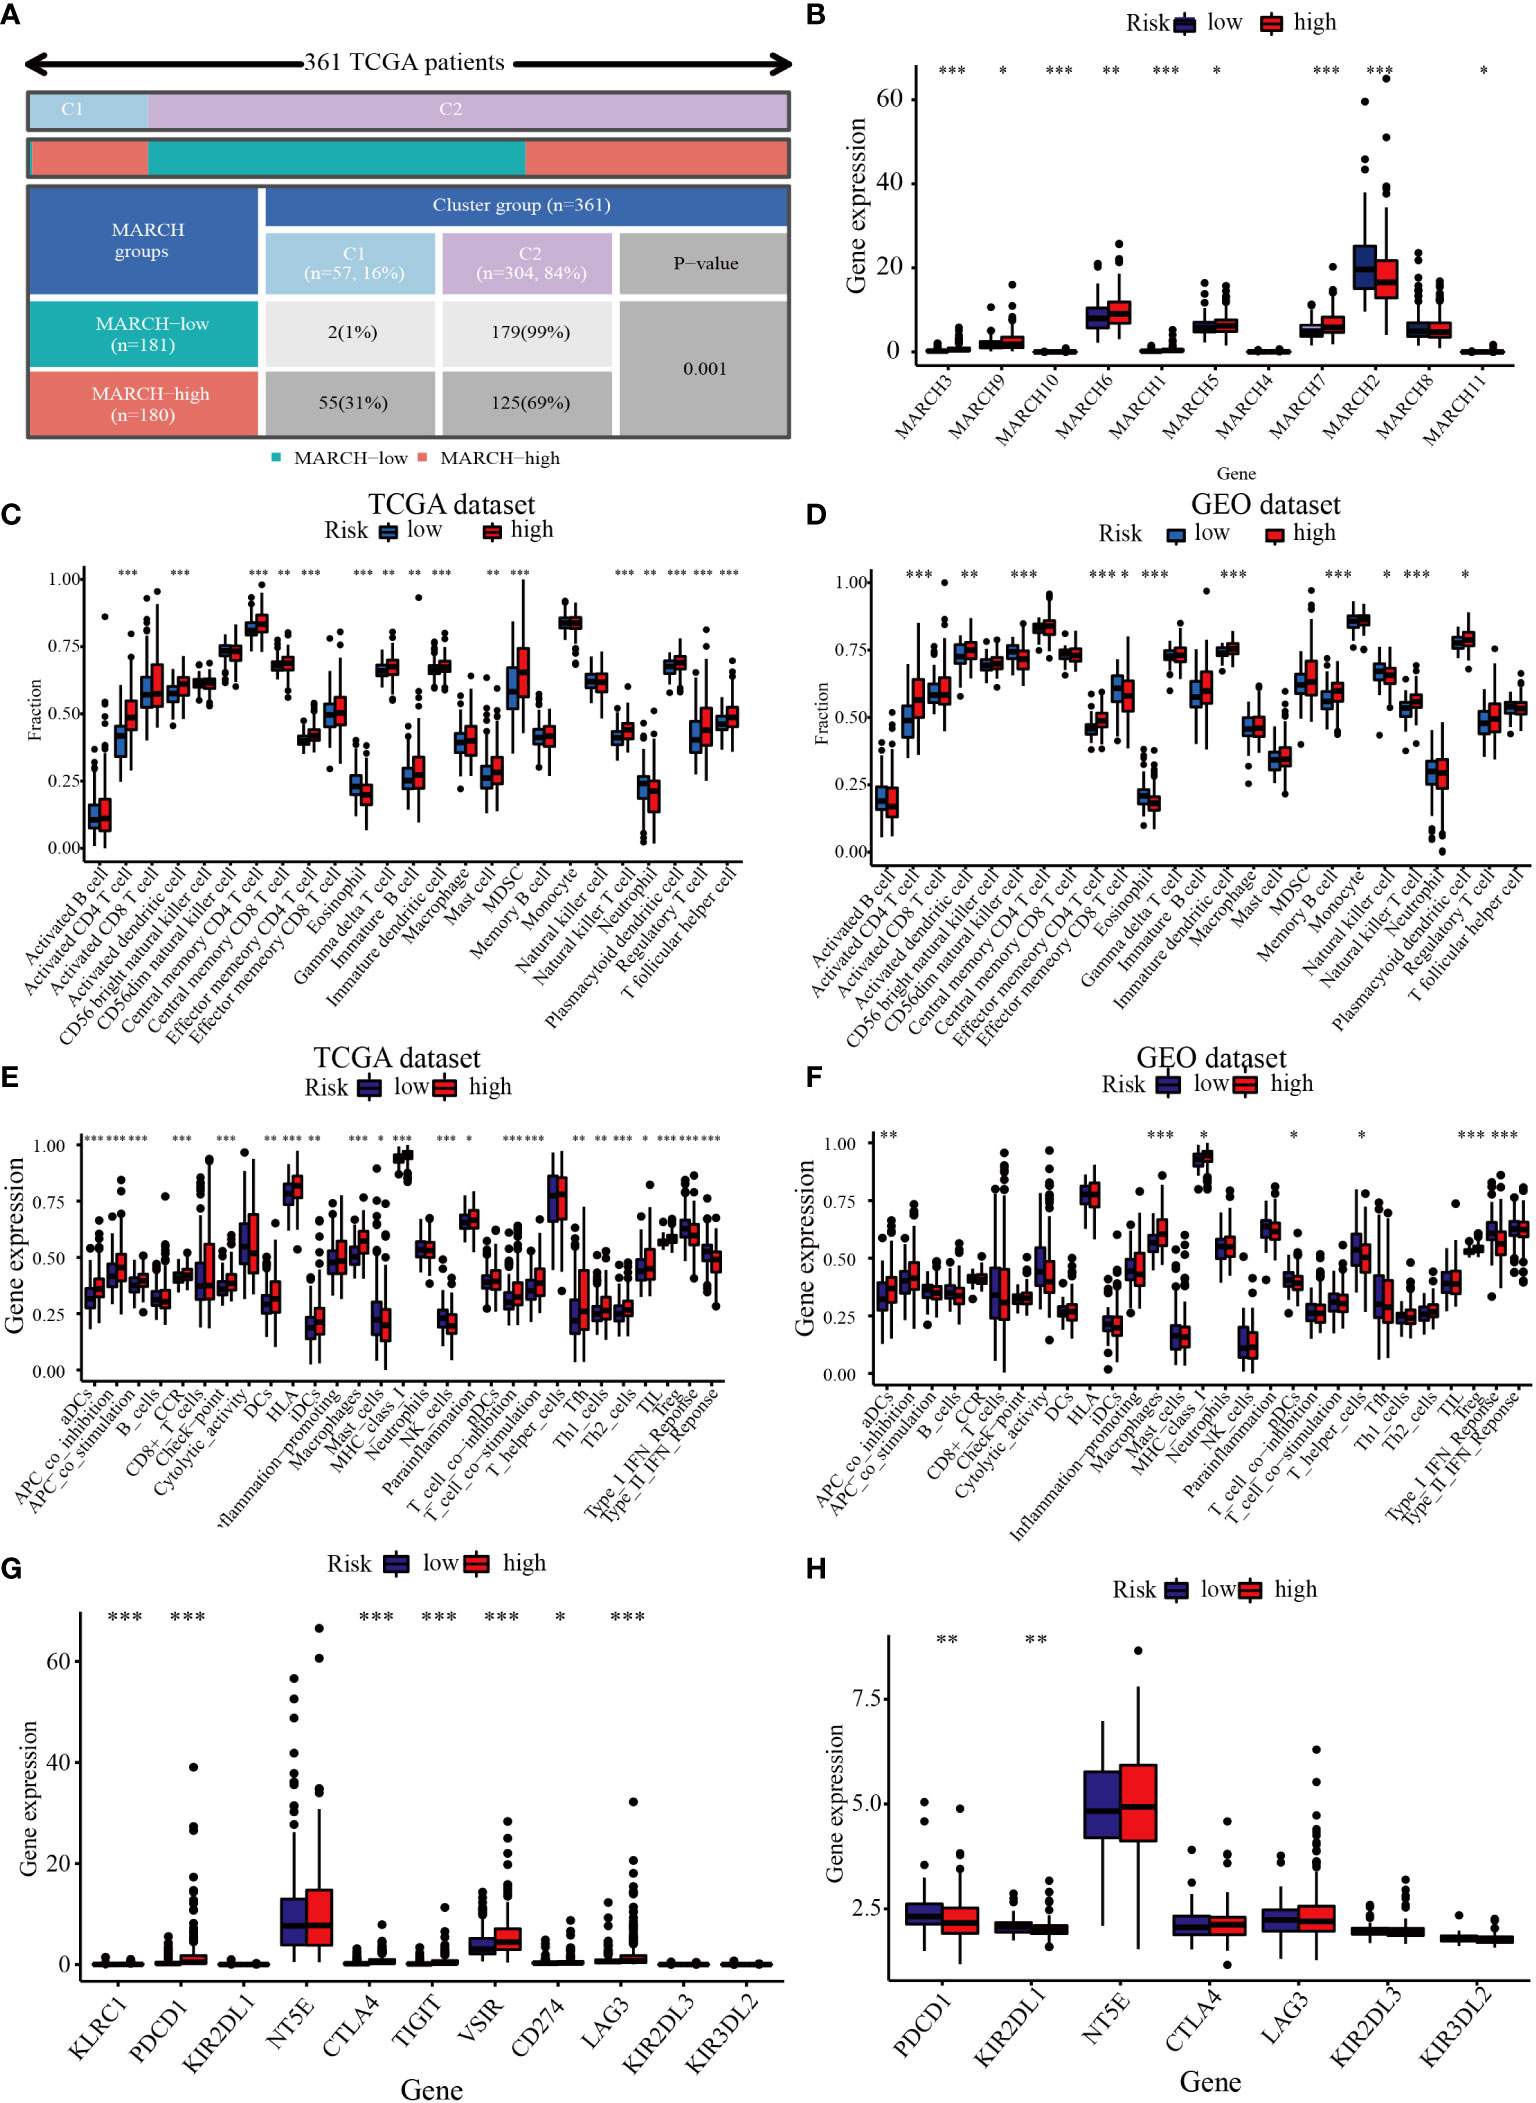
Figure 8 Correlation between the TIME and MARCH ligase signature. (A) The distribution of high-risk groups and low-risk groups in the C1 group and C2 group. (B) Expression of the MARCH 1–11 genes in the low-risk group and high-risk group. The ssGSEA results of different risk groups in the TCGA cohort (C, E) and the GEO cohort (D, F). The 25 immune cell scores (C, D) and 13 immune-related functions (E, F) are shown in boxplots. (G, H) The relationship between risk groups and immune checkpoint expression levels. Adjusted p is shown as follows: ns, not significant; *p< 0.05; **p< 0.01; ***p< 0.001.
To further verify the above results, single-cell sequencing was conducted. After stringent quality control, we obtained 3,200 single cells. We found that the cells were organized into 12 clusters after dimension reduction through PCA (Figure Supplement 4). The expression of the first 10 genes in each cluster was significantly higher than that in the other clusters. We categorized these clusters into HCC cells, T lymphocytes, monocyte cells, B lymphocytes, and NK cells (Figure 9A). Interestingly, the low-risk group had higher T lymphocytes (13% vs. 5%) and B lymphocytes (6% vs. 2%) than the high-risk group. Moreover, the proportion of HCC cells in the high-risk group was significantly higher than that in the low-risk group (90% vs. 78%) (Figure 9B). Our results indicated that risk score can correctly reflect the TIME and may have important clinical value in predicting the efficacy of tumor ICIs.
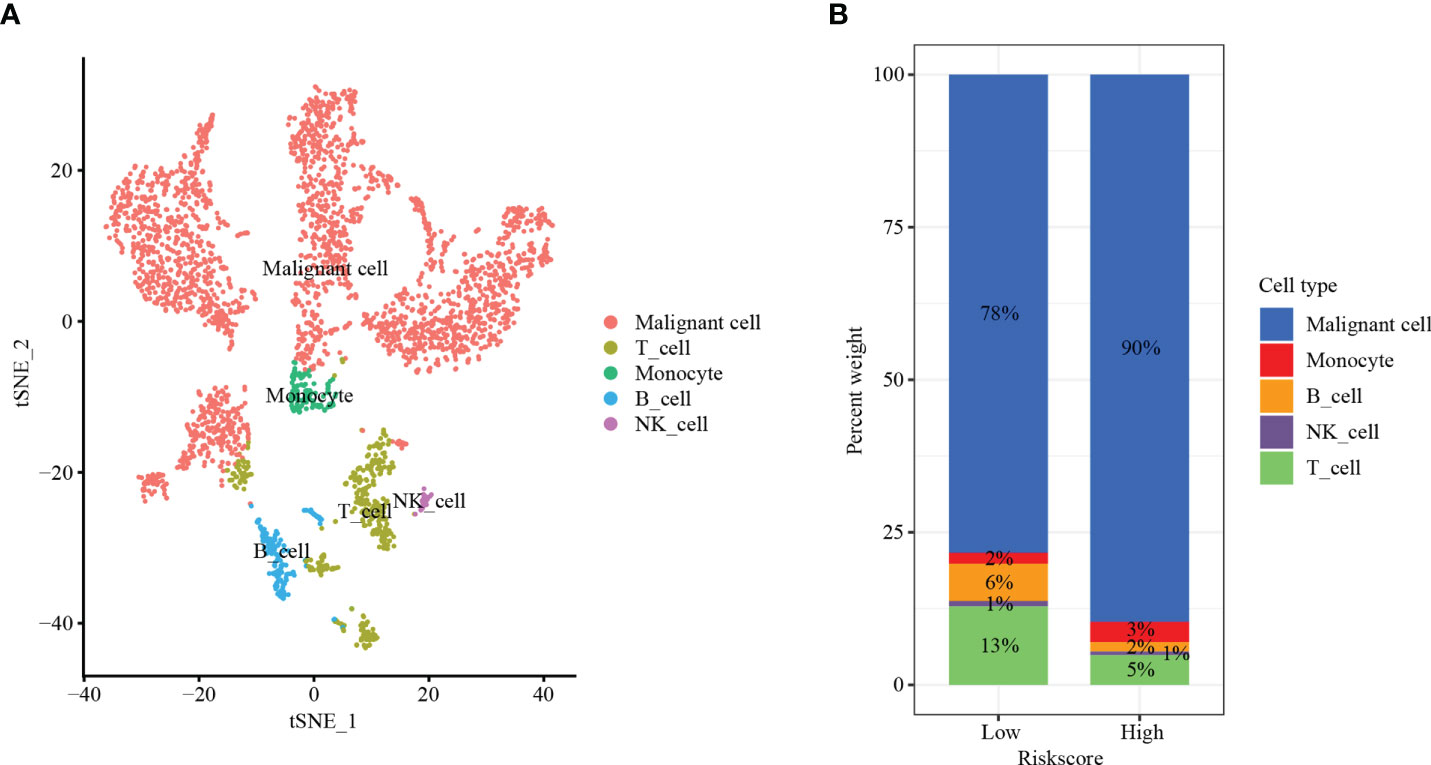
Figure 9 Single-cell sequencing. (A) t-SNE plot of 3,200 cells from 12 HCC patients showing eight major cell types. (B) The distribution of HCC cells, T lymphocytes, monocyte cells, B lymphocytes, and NK cells in the low- and high-risk groups.
The accumulation of mutations often leads to the development of tumors and TIME remodeling (23). Therefore, we studied the distinction of somatic mutations between the low- and high-risk groups. The top 5 genes with the highest mutation frequencies were TIN (23%), CTNNB1 (22%), MUC16 (12%), PCLO (10%), and TP5316 (10%) in the high-risk group (Figure 10A) and TP53 (33%), CTNNB1 (23%), TIN (16%), MUC16 (14%), and ABCAB (9%) in the low-risk group (Figure 10B). The results showed that the low-risk group had more immune-related mutations. Next, we divided patients into low- and high-TMB groups by applying the optimal TMB cutoff. The results showed that the higher TMB value of HCC patients was associated with lower OS (Figure 10C, p = 0.002). We divided TCGA patients into four groups of high-TMB + low-risk, high-TMB + high-risk, low-TMB + low-risk, and low-TMB + high-risk based on the risk score and the optimal TMB cutoff value. The low-TMB + low-risk group had a significantly higher OS than the high-TMB + high-risk group (Figure 10D, p< 0.001).
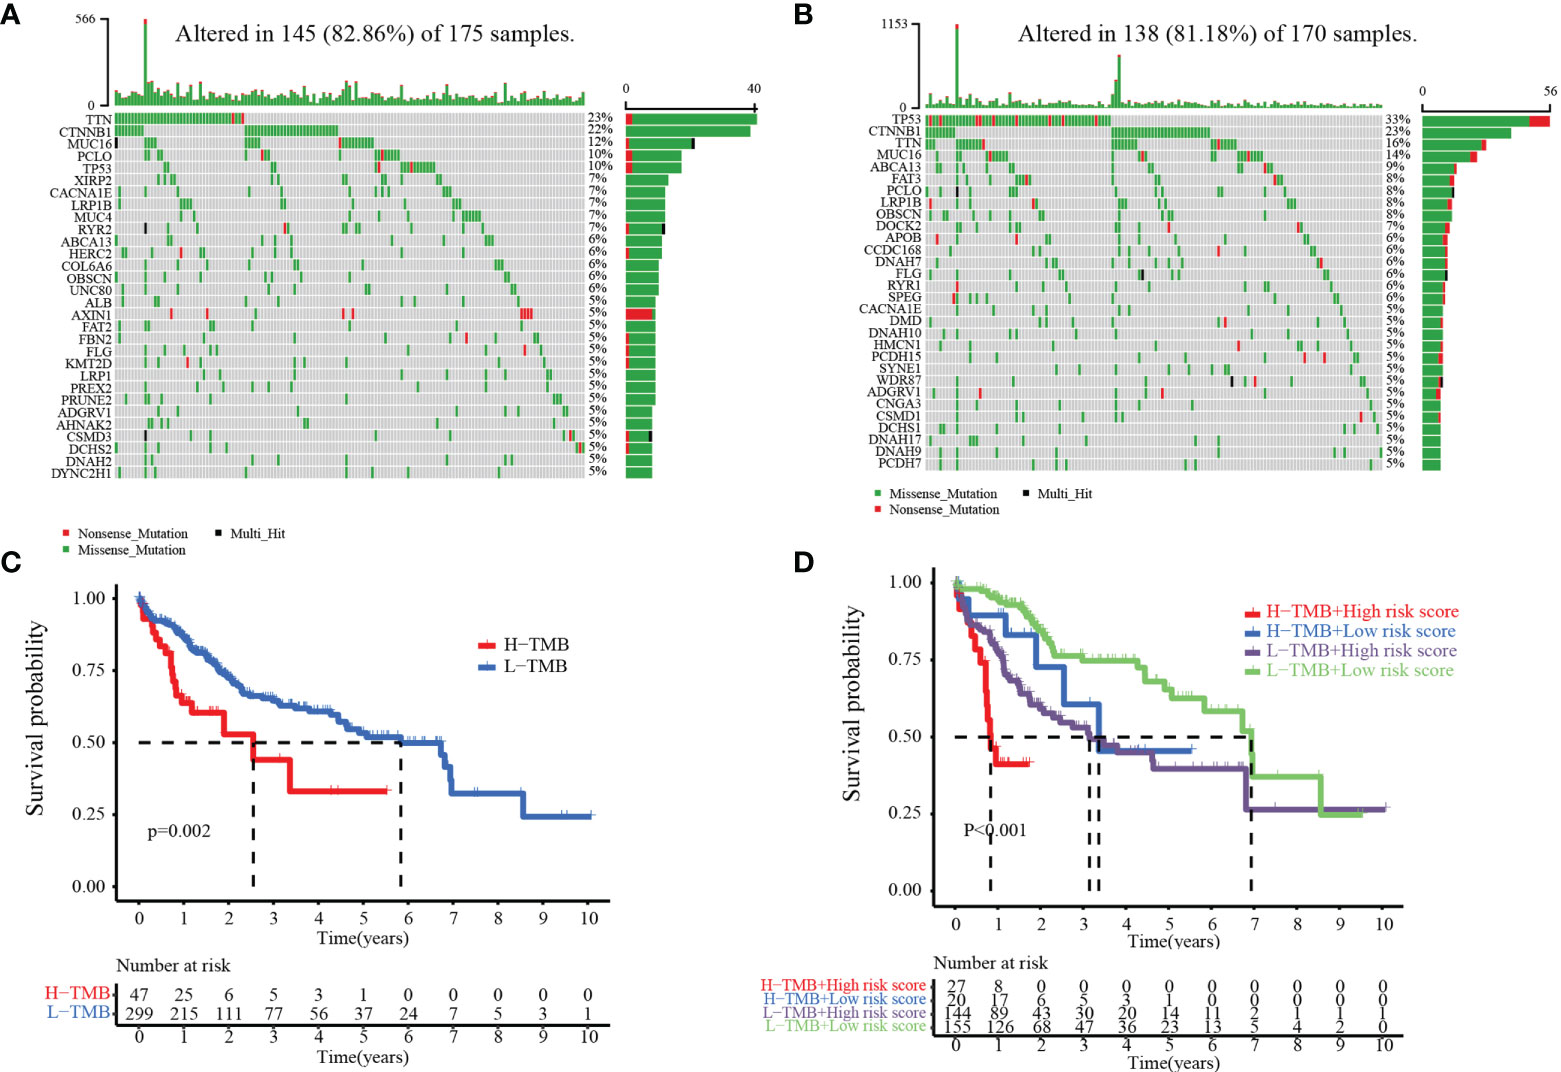
Figure 10 Relationship between the MARCH ligase signature and somatic mutation. Waterfall plots of 30 genes with the highest mutation rates in the high-risk group (A) and the low-risk group (B). (C) Kaplan–Meier analysis of TMB in HCC patients. (D) Kaplan–Meier analysis of the correlation between risk score and TMB.
Chemotherapy and targeted drugs have demonstrated clinical benefits in the treatment of advanced HCC. Nevertheless, adverse drug reactions and resistance are still significant obstacles to the development of drug therapy (24). TIME and SNV are important factors in the therapeutic effect of HCC. Therefore, it is vital to explore a reliable predictive drug-sensitive marker to guide medication. Then, the relationships between risk score and chemotherapy, targeted drugs, and ICIs were calculated. Our results show that the IC50 values of the AKT inhibitor VIII, gefitinib, and nilotinib were higher in the high-risk group than in the low-risk group, while the IC50 values of cisplatin and gemcitabine were lower in the high-risk group than in the low-risk group. However, there was no significant difference in the IC50 value of sorafenib between the low- and high-risk groups (Figures 11A–F). Our study also confirmed that the TIDE score was decreased in the high-risk group (TIDE distribution in TCGA-HCC, Figure 11G, p< 0.01). Compared with patients in the low-risk group, patients in the high-risk group exhibited higher scores of exclusion (Figure 11H), whereas patients in the low-risk group expressed higher scores of dysfunction compared with the high-risk group (Figure 11I). In addition, the treatment response to TACE was further analyzed between the low- and high-risk groups. We observed that 17% of patients had non-response to TACE in the low-risk group, and 54% of patients had non-response to TACE in the high-risk group in the GSE104580 TACE chip (Figure 11J). Furthermore, the TACE-responsive group had lower scores than the TACE-non-responsive group (Figure 11J). The GSE109211 chip was used to study the sorafenib response rates between the low- and high-risk groups. Although the low-risk group had higher response rates than the high-risk group (36% vs. 26%), there was no significant difference in treatment response to sorafenib among the low- and high-risk groups (Figure 11K). The results showed that risk score may have important implications for the treatment of HCC, including chemotherapy, TACE, and ICIs.
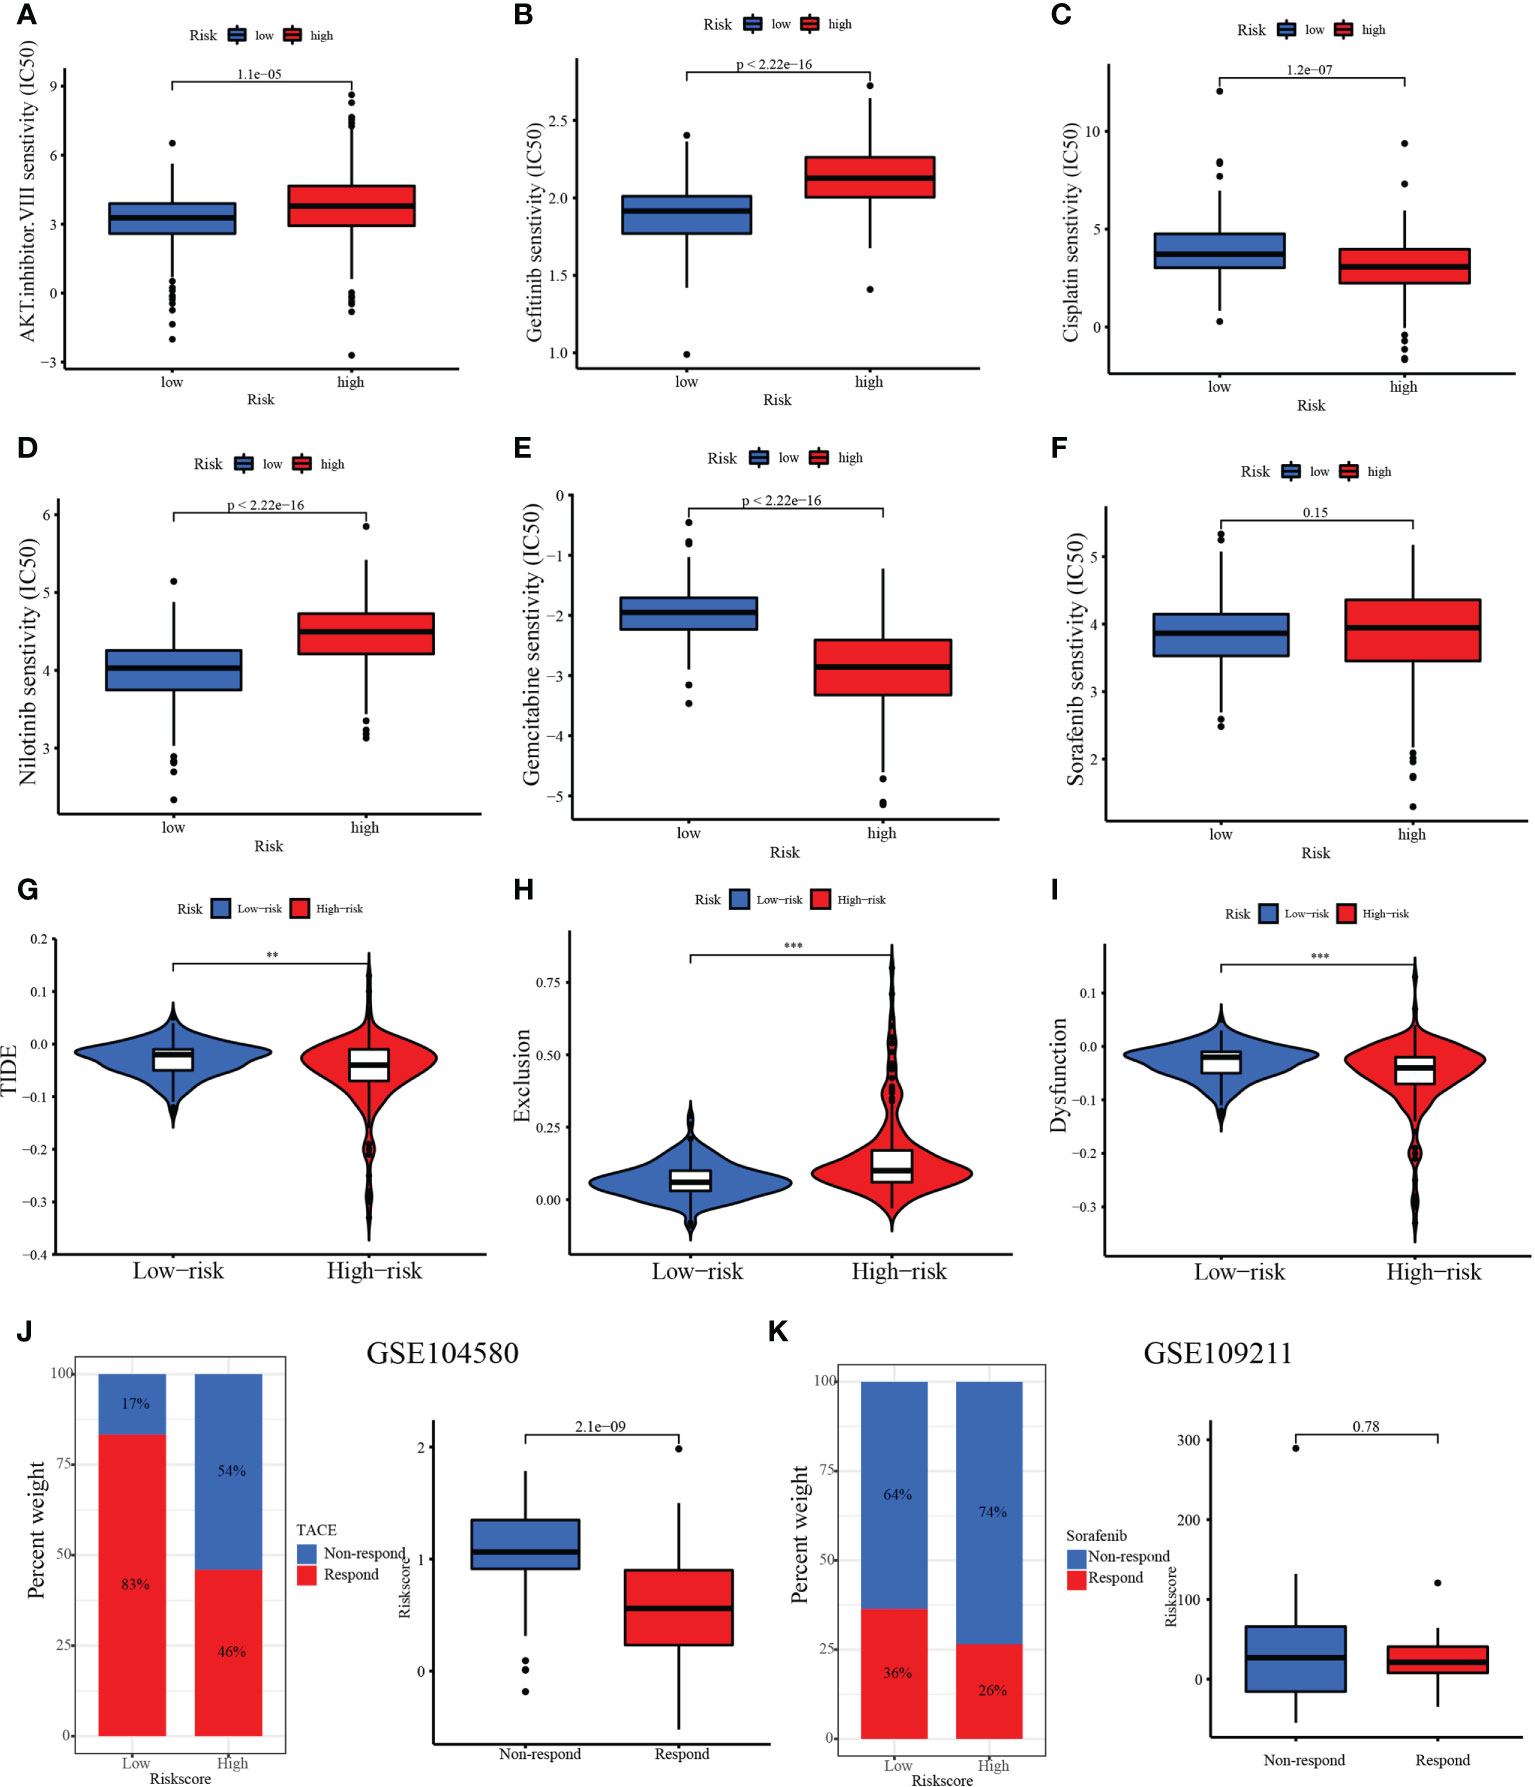
Figure 11 Therapeutic benefit of risk score. (A–F) Correlation between the MARCH ligase signature and IC50 values of chemotherapy and targeted drugs, including (A) AKT inhibitor VIII, (B) gefitinib, (C) cisplatin, (D) nilotinib, (E) gemcitabine, and (F) sorafenib. (G) The relative distribution of TIDE was compared between the low- and high-risk groups. (H) The relative distribution of exclusion was compared between the low- and high-risk groups. (I) The relative distribution of dysfunction was compared between the low- and high-risk groups. (J) The distribution of the transarterial chemoembolization (TACE)-responsive group versus the TACE-non-responsive group in the low- and high-risk groups and the relative distribution of risk score in the TACE-responsive group versus the TACE-non-responsive group. (K) The distribution of the TACE-responsive group versus the sorafenib-non-responsive group in the low- and high-risk groups and the relative distribution of risk score in the sorafenib-responsive group versus the sorafenib-non-responsive group. **p< 0.01; ***p< 0.001.
To explore the biological molecular changes among the low- and high-risk groups, we performed GSVA to explore the biological processes among these distinct RNA processing patterns (Figure 12). The low-risk groups were significantly enriched in metabolism-related processes, including heme metabolism, fatty acid metabolism, adipogenesis, peroxisome, bile acid metabolism, xenobiotic metabolism, pancreas beta cells, K-ras signaling, coagulation, and myogenesis. However, carcinogenic activation and related signaling pathways, such as DNA repair, MYC targets, mTORC1 signaling, unfolded protein response, mitotic spindle, G2/M checkpoint, E2F targets, and protein secretion, were significantly enriched in the high-risk group. As mentioned above, the results showed the obvious distinction between the low- and high-risk groups in biological function.
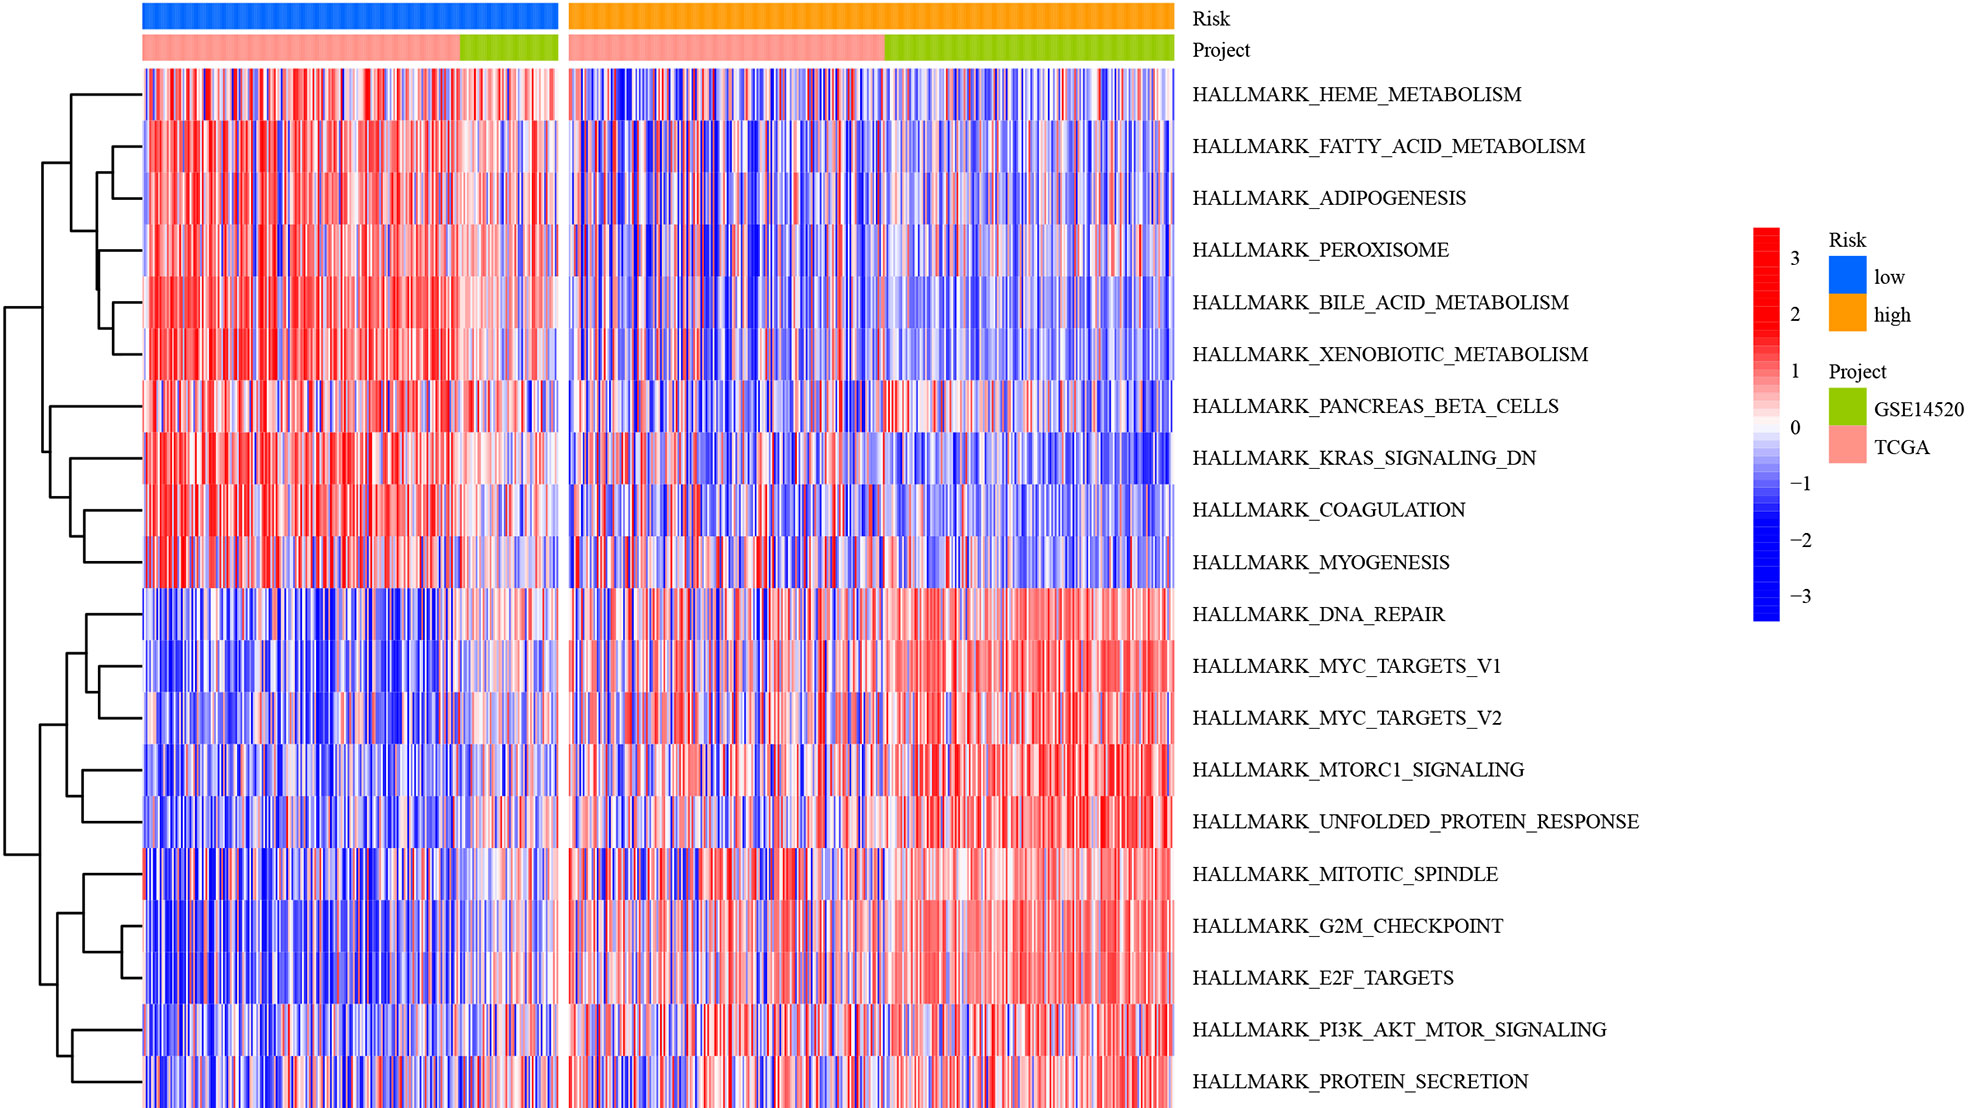
Figure 12 Heatmap showing GSVA scores of the hallmark gene sets for the five defined RNA processing patterns.
To further verify the expression of risk genes in HCC, quantitative real-time polymerase chain reaction (qRT-PCR) was used to analyze the expression of MARCH ligase-related genes (G6PD, SLC1A5, SPP1, and CDC20). We verified the mRNA expression levels in 20 HCC and paracancerous tissues. The results showed that the expression of G6PD, SPP1, and CDC20 in HCC tissues was higher than that in paracancerous tissues, while the expression of CYP2C9 and ANXA10 was lower than that in paracancerous tissues (Figure 13). The qRT-PCR results are mostly consistent with the group according to risk score.
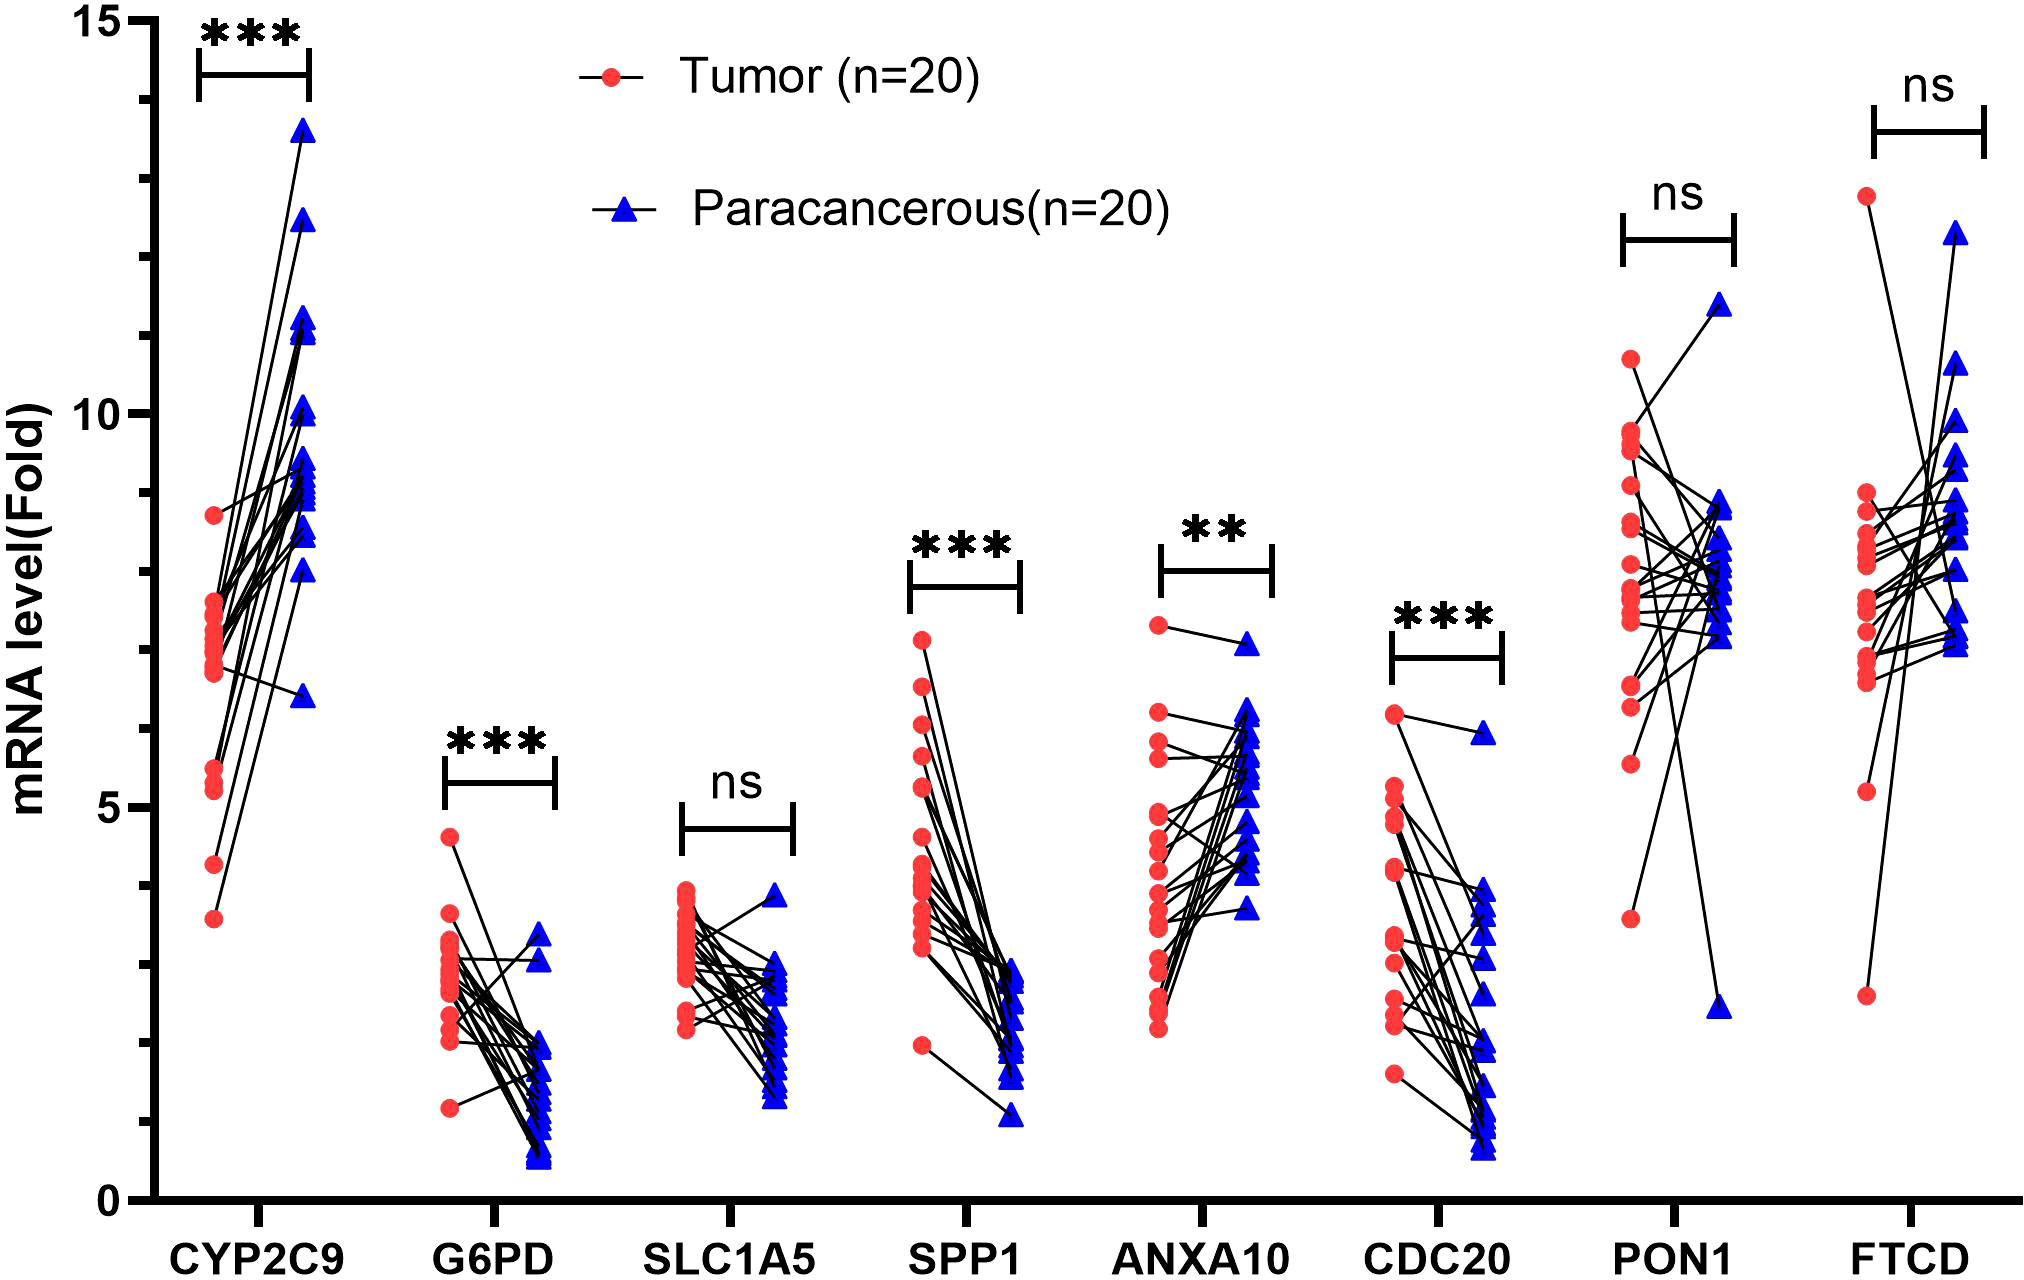
Figure 13 Validation of mRNA expression by real-time PCR. mRNA expression of eight genes associated with MARCH ligase in 20 HCC tissues and paracancerous tissues. ns, not statistically significant; **p< 0.01; ***p< 0.001.
Because of its high incidence rate and poor prognosis, HCC is regarded as one of the most malignant types of liver cancer (25). Therefore, finding predictive prognostic biomarkers for HCC to improve the clinical outcomes of HCC patients is of great significance. It has been reported that MARCH ligases play critical roles in tumor progression (26). Thus, a comprehensive analysis of the clinical significance, immune infiltration, and biological role of MARCH ligases can provide a new direction for the clinical treatment and research on HCC.
Through NMF algorithm clustering, we identified two MARCH ligase-related patterns. Compared with the C2 pattern, the C1 pattern indicated a poor OS or PFS probability. Moreover, the ratio of HCC patients with advanced T stages had higher levels in the C1 pattern. In addition, distinct immune cell infiltration and biological pathway enrichment were shown in these two MARCH ligase-related patterns. In the TCGA-HCC cohort, we found that the C1 pattern had more immune-related mutations and major MHC molecules. Recent studies have shown that the expression of HLA class I molecules in tumor cells is often associated with tumor escape from the immune system (27). A lack of HLA class I expression in tumor cells can have a negative impact on immunotherapy (28). These results indicate that MARCH ligase may affect the development of HCC by regulating the expression of MHC molecules in HCC. The evidence above certified that the MARCH ligase may play a significant role in regulating the immune landscape of HCC.
Next, we studied the DEGs between the C1 and C2 patterns. We established a prognostic signature (risk score) to evaluate and quantify HCC individuals, including eight MARCH ligase-related genes (CYP2C9, G6PD, SLC1A5, SPP1, ANXA10, CDC20, PON1, and FTCD) in the TCGA-HCC cohort. Based on the defined risk score, HCC patients were divided into high- and low-risk groups, and a series of analyses were performed. According to survival analysis, patients in the high-risk group had a worse OS than those in the low-risk group, suggesting that risk score is relevant to tumor progression or poor prognosis events. It was also proven in a separate external GEO-HCC cohort. Through the analysis of univariate Cox regression and multivariate Cox regression, we proved that risk score was an excellent independent prognostic indicator both in the TCGA-HCC cohort and in the GEO-HCC cohort. CYP2C9 is a drug-metabolizing enzyme gene (DME gene) that regulates cell growth, apoptosis, differentiation, and homeostasis and is involved in hepatocarcinogenesis (29). Previous studies revealed that G6PD is a key energy metabolism gene for HCC and contributes to tumor proliferation, migration, and invasion (30, 31). SLC1A5 is highly associated with the infiltration of tumor immune cells. Its expression can be a reliable prognostic biomarker in numerous cancers, especially in HCC (32). SPP1 promotes the migration of HCC cells (33). ANXA10 is related to the malignant phenotype of liver cells (34). CDC20 assumes crucial functions of cells in the anaphase of mitosis (35), and its expression is upregulated in HCC (36). PON1 not only can reduce the inhibition of leukocyte adhesion and chronic inflammation of vascular walls (especially macrophages and monocytes) but also participate in cell cholesterol synthesis (37) and result in tumor invasion/metastasis (38). The FTCD gene is downregulated in HCC tumor tissues. Therefore, as a reliable diagnostic biomarker, it distinguishes between early HCC and benign tumors (39).
To further verify the above results, qRT-PCR was conducted. The results showed that the expression of G6PD, SPP1, and CDC20 in HCC tissues was increased compared with that in paracancerous tissues, while the expression of CYP2C9 and ANXA10 was decreased compared with that in paracancerous tissues. The results are mostly consistent with the group according to risk score. However, the SLC1A5 and FTCD genes showed no significant difference. This lack of significance may be related to the small sample size and the expression of the protein that is not parallel to the mRNA.
It has been demonstrated that CD4+ T cells (40), CD8+ T cells (41), and NK cells (42) in HCC are protective factors. In addition, significantly reduced infiltration of CD4+ T cells, CD8+ T cells, and NK cells may trigger tumor immune evasion and ultimately lead to the progression, high recurrence, and poor prognosis of HCC based on their functions (43). Moreover, CD4+ T cells, CD8+ T cells, and NK cells are important cells in immunotherapy. CD4+ T cells are a key contributor to PD-L1/PD-1 blockade immunotherapy efficacy (44). Activated CD8+ cytotoxic T cells can release IFN-γ. Upon IFN-γ stimulation, PD-L1 is expressed on tumor cells (45). NK cells contribute to the effects of PD-1/PD-L1 blockade along with cytotoxic T cells (46). Interestingly, we found that patients in both the TCGA dataset and the GEO dataset with low-risk scores had lower CD4+ T-cell, CD8+ T-cell, and NK-cell infiltration levels than patients with high-risk scores in the immune microenvironment. Furthermore, the single-cell sequencing results showed that the low-risk group had higher T lymphocytes and B lymphocytes than the high-risk group. These results suggest that risk score may affect the prognosis of patients via the TIME.
Research has indicated that cancer patients are more likely to obtain long-term and effective responses from immunotherapy with high TMB (47, 48). In our research, the high-risk group had a higher TMB than the low-risk group, which we also confirmed in the TCGA dataset and the GEO dataset. However, compared with the high-risk group, patients in the low-risk group had more immune-related mutations. This is consistent with the results of immune infiltration mentioned above.
ICIs, chemotherapy, and TACE are effective clinical strategies for treating advanced HCC. In this study, we confirmed that the IC50 values of the AKT inhibitor VIII, gefitinib, and nilotinib were higher in the high-risk group than in the low-risk group, while the IC50 values of cisplatin and gemcitabine were lower in the high-risk group than in the low-risk group. The above results demonstrated that risk score is an important biomarker to assess immune status. Thus, we sought to further investigate the response rate to ICIs of risk score based on the TIDE score. The high-risk group had a lower TIDE score, which suggested that the high-risk group may have a higher response to ICI treatment. The findings above suggest that patients in the low-risk group may benefit more from the therapeutic regimens of TACE. Taken together, we believe that risk score may have important guiding significance for HCC treatment, including chemotherapy, immunotherapy, and TACE.
In addition, we performed GSVA and confirmed the result that the low-risk group was related to metabolism, and the high-risk group was relevant to carcinogenic activation-related signaling pathways, such as DNA repair, mTORC1 signaling, and UPR. Interestingly, all of these signaling pathways contribute to the progression of HCC. DNA repair (49), mTORC1 signaling (50), and UPR (51) are associated with unique characteristics and worse survival in HCC patients. DNA repair, a mechanism that allows cells to live longer, can lead to the accumulation of genetic lesions that can lead to the formation of cancer (52). Aberrant activation of MTORC1 signaling via enhanced cell survival and metastasis results in tumorigenesis and cancer progression (53). The UPR signaling pathway has been recognized to promote tumor cell proliferation by limiting oxidation DNA damage (54), and the UPR promotes HCC immune escape by transferring specific miRNAs to infiltrated macrophages in the tumor microenvironment (55). In addition, according to the GeneCards database (https://www.genecards.org/), MARCH E3 ligases are mainly located in the ER and mitochondria. Therefore, it was suggested that the expression of MARCH E3 ligases may be regulated by various tumor-related stresses. The results in this work point to future directions of the study.
Collectively, by comprehensively evaluating the molecular, cellular, and clinical characteristics of HCC patients, risk score can quantify and individualize the phenotypes of HCC patients. The risk score may have important implications for the selection of ICIs, chemotherapy, and TACE strategies for HCC patients. However, our study still has limitations that need to be further refined. As a retrospective study, multicenter, large-sample sizes, and prospective studies are required to confirm our results further. Moreover, further experimental studies are needed to refine our understanding of the relationship between MARCH ligases and HCC.
The datasets presented in this study can be found in online repositories. The names of the repository/repositories and accession number(s) can be found in the article/Supplementary Material.
This study was reviewed and approved by the Ethics Committee of the Subei People’s Hospital of Jiangsu Province, Clinical Medical College, Yangzhou University. The patients/participants provided their written informed consent to participate in this study.
JC, DT, JZ, DB, and CZ designed and implemented the research. GJ, SJ, BS, HT, YT, AW, QW, and RL collated and analyzed the data. JC, DT, JZ, DB, and CZ provided technical support. CZ and JZ provided the language polishing for this article. DT wrote the manuscript. DB and JC revised the manuscript. All authors contributed to the article and approved the submitted version.
This study was supported by The National Natural Science Foundation of China (grant number 81871909); “13th five-year Plan” Science and Education strong Health Project Innovation team of Yangzhou (YZCXTD201801); Provincial-level discipline leader of the NJPH (DTRC201809); Cross-cooperation special projects of the NJPH(YJCHZ-2021-08); Postgraduate Research and Practice Innovation Program of Jiangsu Province (KYCX22_3568).
We thank The Cancer Genome Atlas (TCGA) and Gene Expression Omnibus (GEO) for data support, gene set enrichment analysis (GSEA), and gene ontology (GO) for functional enrichment.
The authors declare that the research was conducted in the absence of any commercial or financial relationships that could be construed as a potential conflict of interest.
All claims expressed in this article are solely those of the authors and do not necessarily represent those of their affiliated organizations, or those of the publisher, the editors and the reviewers. Any product that may be evaluated in this article, or claim that may be made by its manufacturer, is not guaranteed or endorsed by the publisher.
The Supplementary Material for this article can be found online at: https://www.frontiersin.org/articles/10.3389/fimmu.2022.997265/full#supplementary-material
Supplementary Figure 1 | Flow chart of our study.
Supplementary Figure 2 | mRNA expression of MARCH ligases in 40 HCC tissues and paracancerous tissues in the TCGA-HCC cohort. ns not statistically significant, ** p < 0.01, *** p < 0.001.
Supplementary Figure 3 | (A) Heatmap of DEGs between the C1 and C2 patterns. (B) Functional enrichment analyses of DEGs between C1 and C2 patterns.
Supplementary Figure 4 | (A) Gene expression levels in each cell of the 4 samples were in the range of 50-9000, and the distribution was relatively uniform. At the same time, we found that the percentage of mitochondrial genes was almost 0. (B) Cells are evenly distributed in the four samples, and the number of genes is positively correlated with the expression level of genes, with a correlation of 0.8. (C) We selected 300 hypervariable genes from all the genes, which are in red, and the first 10 genes were flagged. (D) After dimension reduction through PCA, we found that the cells were clustered into 12 clusters.
1. Sung H, Ferlay J, Siegel RL, Laversanne M, Soerjomataram I, Jemal A, et al. Global cancer statistics 2020: GLOBOCAN estimates of incidence and mortality worldwide for 36 cancers in 185 countries. CA: Cancer J Clin (2021) 71(3):209–49. doi: 10.3322/caac.21660
2. Yang JD, Hainaut P, Gores GJ, Amadou A, Plymoth A, Roberts LR. A global view of hepatocellular carcinoma: trends, risk, prevention and management. Nat Rev Gastroenterol Hepatol (2019) 16(10):589–604. doi: 10.1038/s41575-019-0186-y
3. Chen S, Cao Q, Wen W, Wang H. Targeted therapy for hepatocellular carcinoma: Challenges and opportunities. Cancer Lett (2019) 460:1–9. doi: 10.1016/j.canlet.2019.114428
4. Komander D, Rape M. The ubiquitin code. Annu Rev Biochem (2012) 81:203–29. doi: 10.1146/annurev-biochem-060310-170328
5. Shen M, Schmitt S, Buac D, Dou QP. Targeting the ubiquitin-proteasome system for cancer therapy. Expert Opin Ther Targets (2013) 17(9):1091–108. doi: 10.1517/14728222.2013.815728
6. Xu SH, Zhu S, Wang Y, Huang JZ, Chen M, Wu QX, et al. ECD promotes gastric cancer metastasis by blocking E3 ligase ZFP91-mediated hnRNP f ubiquitination and degradation. Cell Death Disease (2018) 9(5):479. doi: 10.1038/s41419-018-0525-x
7. Liao Y, Liu Y, Xia X, Shao Z, Huang C, He J, et al. Targeting GRP78-dependent AR-V7 protein degradation overcomes castration-resistance in prostate cancer therapy. Theranostics (2020) 10(8):3366–81. doi: 10.7150/thno.41849
8. Rodig SJ, Gusenleitner D, Jackson DG, Gjini E, Giobbie-Hurder A, Jin C, et al. MHC proteins confer differential sensitivity to CTLA-4 and PD-1 blockade in untreated metastatic melanoma. Sci Trans Med (2018) 10(450):eaar3342. doi: 10.1126/scitranslmed.aar3342
9. Bartee E, Mansouri M, Hovey Nerenberg BT, Gouveia K, Früh K. Downregulation of major histocompatibility complex class I by human ubiquitin ligases related to viral immune evasion proteins. J Virol (2004) 78(3):1109–20. doi: 10.1128/JVI.78.3.1109-1120.2004
10. Ali HEA, Emam AA, Zeeneldin AA, Srour R, Tabashy R, El-Desouky ED, et al. Circulating miR-26a, miR-106b, miR-107 and miR-133b stratify hepatocellular carcinoma patients according to their response to transarterial chemoembolization. Clin Biochem (2019) 65:45–52. doi: 10.1016/j.clinbiochem.2019.01.002
11. Yin J, Ji Z, Hong Y, Song Z, Hu N, Zhuang M, et al. Sh-MARCH8 inhibits tumorigenesis via PI3K pathway in gastric cancer. Cell Physiol Biochem Int J Exp Cell Physiol Biochem Pharmacol (2018) 49(1):306–21. doi: 10.1159/000492882
12. Pinyol R, Montal R, Bassaganyas L, Sia D, Takayama T, Chau GY, et al. Molecular predictors of prevention of recurrence in HCC with sorafenib as adjuvant treatment and prognostic factors in the phase 3 STORM trial. Gut (2019) 68(6):1065–75. doi: 10.1136/gutjnl-2018-316408
13. Brunet JP, Tamayo P, Golub TR, Mesirov JP. Metagenes and molecular pattern discovery using matrix factorization. Proc Natl Acad Sci U States A (2004) 101(12):4164–9. doi: 10.1073/pnas.0308531101
14. Jiang P, Gu S, Pan D, Fu J, Sahu A, Hu X, et al. Signatures of T cell dysfunction and exclusion predict cancer immunotherapy response. Nat Med (2018) 24(10):1550–8. doi: 10.1038/s41591-018-0136-1
15. Zhou Y, Zhou B, Pache L, Chang M, Khodabakhshi AH, Tanaseichuk O, et al. Metascape provides a biologist-oriented resource for the analysis of systems-level datasets. Nat Commun (2019) 10(1):1523. doi: 10.1038/s41467-019-09234-6
16. Su X, Zhao L, Shi Y, Zhang R, Long Q, Bai S, et al. Clonal evolution in liver cancer at single-cell and single-variant resolution. J Hematol Oncol (2021) 14(1):22. doi: 10.1186/s13045-021-01036-y
17. Geeleher P, Cox N, Huang RS. pRRophetic: an r package for prediction of clinical chemotherapeutic response from tumor gene expression levels. PloS One (2014) 9(9):e107468. doi: 10.1371/journal.pone.0107468
18. Dai Y, Qiang W, Lin K, Gui Y, Lan X, Wang D. An immune-related gene signature for predicting survival and immunotherapy efficacy in hepatocellular carcinoma. Cancer Immunol Immunother CII (2021) 70(4):967–79. doi: 10.1007/s00262-020-02743-0
19. Gu X, Guan J, Xu J, Zheng Q, Chen C, Yang Q, et al. Model based on five tumour immune microenvironment-related genes for predicting hepatocellular carcinoma immunotherapy outcomes. J Trans Med (2021) 19(1):26. doi: 10.1186/s12967-020-02691-4
20. Liu Y, Zhang X, Zhang J, Tan J, Li J, Song Z. Development and validation of a combined ferroptosis and immune prognostic classifier for hepatocellular carcinoma. Front Cell Dev Biol (2020) 8:596679. doi: 10.3389/fcell.2020.596679
21. Liu S, Shao R, Bu X, Xu Y, Shi M. Identification of the pyroptosis-related gene signature for overall survival prediction in patients with hepatocellular carcinoma. Front Cell Dev Biol (2021) 9:742994. doi: 10.3389/fcell.2021.742994
22. Sharma P, Hu-Lieskovan S, Wargo JA, Ribas A. Primary, adaptive, and acquired resistance to cancer immunotherapy. Cell (2017) 168(4):707–23. doi: 10.1016/j.cell.2017.01.017
23. Martincorena I, Campbell PJ. Somatic mutation in cancer and normal cells. Sci (New York NY) (2015) 349(6255):1483–9. doi: 10.1126/science.aab4082
24. Strickson S, Campbell DG, Emmerich CH, Knebel A, Plater L, Ritorto MS, et al. The anti-inflammatory drug BAY 11-7082 suppresses the MyD88-dependent signalling network by targeting the ubiquitin system. Biochem J (2013) 451(3):427–37. doi: 10.1042/BJ20121651
25. Zhu RX, Seto WK, Lai CL, Yuen MF. Epidemiology of hepatocellular carcinoma in the Asia-pacific region. Gut Liver (2016) 10(3):332–9. doi: 10.5009/gnl15257
26. Lin H, Li S, Shu HB. The membrane-associated MARCH E3 ligase family: Emerging roles in immune regulation. Front Immunol (2019) 10:1751. doi: 10.3389/fimmu.2019.01751
27. del Campo AB, Carretero J, Aptsiauri N, Garrido F. Targeting HLA class I expression to increase tumor immunogenicity. Tissue Antigens (2012) 79(3):147–54. doi: 10.1111/j.1399-0039.2011.01831.x
28. Park J, Thomas S, Munster PN. Epigenetic modulation with histone deacetylase inhibitors in combination with immunotherapy. Epigenomics (2015) 7(4):641–52. doi: 10.2217/epi.15.16
29. Yu D, Green B, Marrone A, Guo Y, Kadlubar S, Lin D, et al. Suppression of CYP2C9 by microRNA hsa-miR-128-3p in human liver cells and association with hepatocellular carcinoma. Sci Rep (2015) 5:8534. doi: 10.1038/srep08534
30. Chen Q, Li F, Gao Y, Xu G, Liang L, Xu J. Identification of energy metabolism genes for the prediction of survival in hepatocellular carcinoma. Front Oncol (2020) 10:1210. doi: 10.3389/fonc.2020.01210
31. Lu M, Lu L, Dong Q, Yu G, Chen J, Qin L, et al. Elevated G6PD expression contributes to migration and invasion of hepatocellular carcinoma cells by inducing epithelial-mesenchymal transition. Acta Biochim Biophys Sinica (2018) 50(4):370–80. doi: 10.1093/abbs/gmy009
32. Zhao J, Yang Z, Tu M, Meng W, Gao H, Li MD, et al. Correlation between prognostic biomarker SLC1A5 and immune infiltrates in various types of cancers including hepatocellular carcinoma. Front Oncol (2021) 11:608641. doi: 10.3389/fonc.2021.608641
33. Yang L, Zhang Z, Sun Y, Pang S, Yao Q, Lin P, et al. Integrative analysis reveals novel driver genes and molecular subclasses of hepatocellular carcinoma. Aging (2020) 12(23):23849–71. doi: 10.18632/aging.104047
34. Liu SH, Lin CY, Peng SY, Jeng YM, Pan HW, Lai PL, et al. Down-regulation of annexin A10 in hepatocellular carcinoma is associated with vascular invasion, early recurrence, and poor prognosis in synergy with p53 mutation. Am J Pathol (2002) 160(5):1831–7. doi: 10.1016/S0002-9440(10)61129-7
35. Alfarsi LH, Ansari RE, Craze ML, Toss MS, Masisi B, Ellis IO, et al. CDC20 expression in oestrogen receptor positive breast cancer predicts poor prognosis and lack of response to endocrine therapy. Breast Cancer Res Treat (2019) 178(3):535–44. doi: 10.1007/s10549-019-05420-8
36. Zhuang L, Yang Z, Meng Z. Upregulation of BUB1B, CCNB1, CDC7, CDC20, and MCM3 in tumor tissues predicted worse overall survival and disease-free survival in hepatocellular carcinoma patients. BioMed Res Int (2018) 2018:7897346. doi: 10.1155/2018/7897346
37. Bouman HJ, Schömig E, van Werkum JW, Velder J, Hackeng CM, Hirschhäuser C, et al. Paraoxonase-1 is a major determinant of clopidogrel efficacy. Nat Med (2011) 17(1):110–6. doi: 10.1038/nm.2281
38. Ding GY, Zhu XD, Ji Y, Shi GM, Shen YH, Zhou J, et al. Serum PON1 as a biomarker for the estimation of microvascular invasion in hepatocellular carcinoma. Ann Trans Med (2020) 8(5):204. doi: 10.21037/atm.2020.01.44
39. Seimiya M, Tomonaga T, Matsushita K, Sunaga M, Oh-Ishi M, Kodera Y, et al. Identification of novel immunohistochemical tumor markers for primary hepatocellular carcinoma; clathrin heavy chain and formiminotransferase cyclodeaminase. Hepatology (2008) 48(2):519–30. doi: 10.1002/hep.22364
40. Sun C, Xu J, Song J, Liu C, Wang J, Weng C, et al. The predictive value of centre tumour CD8+ T cells in patients with hepatocellular carcinoma: comparison with immunoscore. Oncotarget (2015) 6(34):35602–15. doi: 10.18632/oncotarget.5801
41. Kang TW, Yevsa T, Woller N, Hoenicke L, Wuestefeld T, Dauch D, et al. Senescence surveillance of pre-malignant hepatocytes limits liver cancer development. Nature (2011) 479(7374):547–51. doi: 10.1038/nature10599
42. Wu M, Mei F, Liu W, Jiang J. Comprehensive characterization of tumor infiltrating natural killer cells and clinical significance in hepatocellular carcinoma based on gene expression profiles. Biomed Pharmacother = Biomed Pharmacother (2020) 121:109637. doi: 10.1016/j.biopha.2019.109637
43. Zheng X, Jin W, Wang S, Ding H. Progression on the roles and mechanisms of tumor-infiltrating T lymphocytes in patients with hepatocellular carcinoma. Front Immunol (2021) 12:729705. doi: 10.3389/fimmu.2021.729705
44. Zuazo M, Arasanz H, Bocanegra A, Fernandez G, Chocarro L, Vera R, et al. Systemic CD4 immunity as a key contributor to PD-L1/PD-1 blockade immunotherapy efficacy. Front Immunol (2020) 11:586907. doi: 10.3389/fimmu.2020.586907
45. Thomas S, Kuncheria L, Roulstone V, Kyula JN, Mansfield D, Bommareddy PK, et al. Development of a new fusion-enhanced oncolytic immunotherapy platform based on herpes simplex virus type 1. J Immunother Cancer (2019) 7(1):214. doi: 10.1186/s40425-019-0682-1
46. Gubin MM, Esaulova E, Ward JP, Malkova ON, Runci D, Wong P, et al. High-dimensional analysis delineates myeloid and lymphoid compartment remodeling during successful immune-checkpoint cancer therapy. Cell (2018) 175(4):1014–30.e19. doi: 10.1016/j.cell.2018.09.030
47. Chan TA, Yarchoan M, Jaffee E, Swanton C, Quezada SA, Stenzinger A, et al. Development of tumor mutation burden as an immunotherapy biomarker: utility for the oncology clinic. Ann Oncol Off J Eur Soc Med Oncol (2019) 30(1):44–56. doi: 10.1093/annonc/mdy495
48. Sholl LM, Hirsch FR, Hwang D, Botling J, Lopez-Rios F, Bubendorf L, et al. The promises and challenges of tumor mutation burden as an immunotherapy biomarker: A perspective from the international association for the study of lung cancer pathology committee. J Thorac Oncol Off Publ Int Assoc Study Lung Cancer (2020) 15(9):1409–24. doi: 10.1016/j.jtho.2020.05.019
49. Oshi M, Kim TH, Tokumaru Y, Yan L, Matsuyama R, Endo I, et al. Enhanced DNA repair pathway is associated with cell proliferation and worse survival in hepatocellular carcinoma (HCC). Cancers (2021) 13(2). doi: 10.3390/cancers13020323
50. Yao Z, Wen S, Luo J, Hao W, Liang W, Chen Y. Establishment and validation of an MTORC1 signaling-related gene signature to predict overall survival in patients with hepatocellular carcinoma. BioMed Res Int (2021) 2021:6299472. doi: 10.1155/2021/6299472
51. Patel A, Oshi M, Yan L, Matsuyama R, Endo I, Takabe K. The unfolded protein response is associated with cancer proliferation and worse survival in hepatocellular carcinoma. Cancers (2021) 13(17):4443. doi: 10.3390/cancers13174443
52. Weeden CE, Asselin-Labat ML. Mechanisms of DNA damage repair in adult stem cells and implications for cancer formation. Biochim Biophys Acta Mol Basis Disease (2018) 1864(1):89–101. doi: 10.1016/j.bbadis.2017.10.015
53. Magaway C, Kim E, Jacinto E. Targeting mTOR and metabolism in cancer: Lessons and innovations. Cells (2019) 8(12):1584. doi: 10.3390/cells8121584
54. Bi M, Naczki C, Koritzinsky M, Fels D, Blais J, Hu N, et al. ER stress-regulated translation increases tolerance to extreme hypoxia and promotes tumor growth. EMBO J (2005) 24(19):3470–81. doi: 10.1038/sj.emboj.7600777
Keywords: MARCH ligases, tumor immune microenvironment, prognostic signature, bioinformatics, hepatocellular carcinoma
Citation: Cao J, Tu D-y, Zhou J, Jiang G-q, Jin S-j, Su B-b, Tang H, Tang Y-h, Wang A-q, Wang Q, Liu R-j, Zhang C and Bai D-s (2022) Comprehensive analysis of the clinical significance, immune infiltration, and biological role of MARCH ligases in HCC. Front. Immunol. 13:997265. doi: 10.3389/fimmu.2022.997265
Received: 18 July 2022; Accepted: 15 September 2022;
Published: 03 October 2022.
Edited by:
Vinay Kumar, The Ohio State University, United StatesReviewed by:
Mansi Purwar, Wistar Institute, United StatesCopyright © 2022 Cao, Tu, Zhou, Jiang, Jin, Su, Tang, Tang, Wang, Wang, Liu, Zhang and Bai. This is an open-access article distributed under the terms of the Creative Commons Attribution License (CC BY). The use, distribution or reproduction in other forums is permitted, provided the original author(s) and the copyright owner(s) are credited and that the original publication in this journal is cited, in accordance with accepted academic practice. No use, distribution or reproduction is permitted which does not comply with these terms.
*Correspondence: Dou-sheng Bai, ZHJiYWlkb3VzaGVuZ0B5enUuZWR1LmNu; Chi Zhang, MTgwNTEwNjI3NjlAeXp1LmVkdS5jbg==
†These authors have contributed equally to this work and share first authorship
Disclaimer: All claims expressed in this article are solely those of the authors and do not necessarily represent those of their affiliated organizations, or those of the publisher, the editors and the reviewers. Any product that may be evaluated in this article or claim that may be made by its manufacturer is not guaranteed or endorsed by the publisher.
Research integrity at Frontiers
Learn more about the work of our research integrity team to safeguard the quality of each article we publish.