
94% of researchers rate our articles as excellent or good
Learn more about the work of our research integrity team to safeguard the quality of each article we publish.
Find out more
ORIGINAL RESEARCH article
Front. Immunol. , 18 October 2022
Sec. Cancer Immunity and Immunotherapy
Volume 13 - 2022 | https://doi.org/10.3389/fimmu.2022.994874
This article is part of the Research Topic Modulation of Human Immune Parameters by Anticancer Therapies, volume II View all 9 articles
 Mingxuan Zhou
 Silin Lv
 Yufang Hou
 Rixin Zhang
 Weiqi Wang
 Zheng Yan
 Tiegang Li
 Wenqiang Gan
 Zifan Zeng
 Fang Zhang
 Min Yang*
Aberrant sialylation plays a key biological role in tumorigenesis and metastasis, including tumor cell survival and invasion, immune evasion, angiogenesis, and resistance to therapy. It has been proposed as a possible cancer biomarker and a potential therapeutic target of tumors. Nevertheless, the prognostic significance and biological features of sialylation-related long noncoding RNAs (lncRNAs) in colorectal cancer (CRC) remain unclear. This study aimed to develop a novel sialylation-related lncRNA signature to accurately evaluate the prognosis of patients with CRC and explore the potential molecular mechanisms of the sialylation-related lncRNAs. Here, we identified sialylation-related lncRNAs using the Pearson correlation analysis on The Cancer Genome Atlas (TCGA) dataset. Univariate and stepwise multivariable Cox analysis were used to establish a signature based on seven sialylation-related lncRNAs in the TCGA dataset, and the risk model was validated in the Gene Expression Omnibus dataset. Kaplan-Meier curve analysis revealed that CRC patients in the low-risk subgroup had a better survival outcome than those in the high-risk subgroup in the training set, testing set, and overall set. Multivariate analysis demonstrated that the sialylation-related lncRNA signature was an independent prognostic factor for overall survival, progression-free survival, and disease-specific survival prediction. The sialylation lncRNA signature-based nomogram exhibited a robust prognostic performance. Furthermore, enrichment analysis showed that cancer hallmarks and oncogenic signaling were enriched in the high-risk group, while inflammatory responses and immune-related pathways were enriched in the low-risk group. The comprehensive analysis suggested that low-risk patients had higher activity of immune response pathways, greater immune cell infiltration, and higher expression of immune stimulators. In addition, we determined the sialylation level in normal colonic cells and CRC cell lines by flow cytometry combined with immunofluorescence, and verified the expression levels of seven lncRNAs using real-time quantitative polymerase chain reaction. Finally, combined drug sensitivity analysis using the Genomics of Drug Sensitivity in Cancer, Cancer Therapeutics Response Portal, and Profiling Relative Inhibition Simultaneously in Mixtures indicated that the sialylation-related lncRNA signature could serve as a potential predictor for chemosensitivity. Collectively, this is the first sialylation lncRNA-based signature for predicting the prognosis, immune landscape, and chemotherapeutic response in CRC, and may provide vital guidance to facilitate risk stratification and optimize individualized therapy for CRC patients.
Colorectal cancer (CRC) was the third most common and second most deadly tumor in 2020 worldwide (1). The 5-year survival rate for patients with metastatic CRC is only 14%, which highlights the need for early and precise recognition of different risk groups of patients for proper and personalized treatment. The normal staging process follows the criteria of the American Joint Committee on Cancer (AJCC) (2), which is the TNM staging system based on tumor size (T), node involvement (N), and presence of metastasis (M). The consensus molecular subtypes (CMSs) (3) of CRC have also been proposed as a gene expression-based subtyping. Although these two staging strategies are valuable in CRC treatment selection, patients within the same subtype can still exhibit a wide variation of clinical outcomes; thus, more refined classification methods are needed to provide a more personalized therapeutic strategy. Additionally, resistance of cancer cells to chemotherapy and targeted drugs remains common and significantly hinders the management of cancer (4). Tools to predict the drug sensitivity of each patient can be helpful to guide treatment decisions. More recently, treatment with antibodies to programmed cell death protein 1 (PD-1), one of the immunological approaches, has been shown to be successful only in treating microsatellite instability-high tumors, which leaves 85% of CRC patients unable to benefit from immunotherapy (5–8). New versions of immune checkpoint inhibitors are expected to expand the efficacy of immunotherapy. Hence, the discovery of novel biomarkers or therapeutic targets to predict the prognosis, response to treatment, and development of CRC is urgently required.
Sialylation is a posttranslational modification and is controlled by families of sialyltransferases, transporters, and neuraminidases. This process plays a pivotal biological role in the maintenance of cell-cell interactions and is involved in many pathological conditions such as cancer, embryonic lethality, and immune system abnormality (9). Mounting evidence indicates that aberrant sialylation is very common in human cancers. It has been shown to participate in oncogenesis, and contribute to tumor cell dissociation and invasion, immune evasion, and resistance to therapy (10). Thus, sialyltransferases have recently been proposed as a potential target for anticancer treatment (11). Sialic acid-binding immunoglobulin-like lectins (Siglecs), such as Siglec-5, -7, -9, and -10, have been praised as the next immune checkpoint targets to boost antitumor immune responses because they are extensively distributed on various tumor-infiltrating cells, including a subset of T cells (12, 13), neutrophils (14), and natural killer cells. For example, Siglec-10 on tumor-associated macrophages interacted with tumor-expressed CD24, and blockage of both molecules led to a reduction in tumor growth and an increase in survival time (15). In addition, Siglec-15 was recently recognized as an immune suppressive receptor in cancer, and found to be exclusively expressed with programmed cell death ligand 1 (PD-L1) (16, 17); this implies that it can be an alternative target for non-responders to PD-1 therapy. Currently, the phase I/II trial of a Siglec-15 antibody (NC318) is ongoing. In addition, hypersialylation has been considered essential for cancer growth and progression as tumors imitate host-like cell-surface sialylation. Research on sialyltransferases has generally focused on carcinomas. For example, ST6 beta-galactoside α-2,6-sialyltransferase 1 (ST6GAL1), one of the sialytransferases that catalyze the α-2,6-sialylation of N-acetyllactosamine, was associated with increased metastasis and poor survival in CRC (18, 19). Synthesized α-2,6-sialylation glycan ligands showed high specificity for Siglec-2, a crucial target on B cells for immunotherapy (20, 21). Therefore, biomarkers of sialylation-related molecules might be valuable for predicting survival outcomes in patients with CRC.
Long noncoding RNAs (lncRNAs) are non-protein coding transcripts longer than 200 nucleotides. Their annotation has been improved with the development of sequencing technology (22). lncRNAs play a significant role in the development and progression of cancer through epigenetic modifications or translational regulation. Although there have been thorough mass spectrometry studies on aberrant sialylation (23), there is still very little research on sialylation-related lncRNAs in cancer. ST8SIA6 antisense RNA 1 (ST8SIA6-AS1) (24), long intergenic non-protein coding RNA 1296 (LINC01296) (25), maternally expressed gene 3 (MEG3) (26), and ST3Gal6 antisense RNA 1 (ST3Gal6-AS1) (27) are lncRNAs that have been examined in relation to cancer progression. Additionally, Quan Du discovered ST6GAL1-related competing endogenous RNA networks in alcohol-related esophageal cancer (28). Nevertheless, it is still ambiguous whether sialylation-related lncRNAs could be useful in predicting CRC patient prognoses or treatment responses. Considering the large number of unknown lncRNAs, we believe that a number of potential lncRNAs take part in sialylation and Siglec interactions, and whether they have clinical significance in CRC should be explored. Therefore, there is an urgent need to identify sialylation-associated lncRNA biomarkers for predicting the prognosis and response to treatment in patients with CRC.
In this study, we identified prognostic lncRNAs related to sialylation and Siglec function pathways, and we successfully established a sialylation-related lncRNA signature in CRC. We comprehensively investigated the associations of the sialylation-related lncRNA signature with clinicopathological features, underlying mechanisms, somatic mutations, the immune microenvironment, and chemotherapeutic responses in CRC. Our results strongly suggest that our sialylation-related lncRNA signature can serve as a novel biomarker for estimating the risk of mortality and can clarify vital aspects of the signaling pathways and mechanisms of CRC progression. Additionally, it may be beneficial for personalized therapy in patients with CRC.
A total of 543 cases of colon adenocarcinoma and rectal adenocarcinoma with complete clinical information were downloaded from The Cancer Genome Atlas (TCGA, https://www.cancer.gov/tcga) and screened for further analysis. The expression data of 51 normal tissue samples were also obtained from the TCGA portal. Human gene symbols were annotated to Ensembl gene IDs by GENCODE V37 (22) through R, where lncRNAs were recognized as a subset of the main annotation file. The fragments per kilobase million (FPKM) of each sequence were downloaded and scaled to a total depth of 106 fragments per sample, which is transcripts per million, to facilitate further analysis. GSE147602 (29) and GSE198103 (https://www.ncbi.nlm.nih.gov/geo/query/acc.cgi?acc=GSE198103) from the Gene Expression Omnibus (GEO) (https://www.ncbi.nlm.nih.gov/geo/) database was used for external validation in this study. The somatic mutation and neoantigen data for CRC were acquired from the TCGA database analyzed by the package “maftools” (30), and CMSs for patients were obtained from the Colorectal Cancer Subtyping Consortium Synapse (3). The median value of the calculated risk score was used as a cutoff point to divide the low- and high-risk groups in the TCGA and GEO datasets.
Genes participating in the biological sialylation process were recognized through the Molecular Signatures Database (MSigDB) (31–33), which contains sialyltransferases, transporters, and neuraminidases (Supplementary Table S1). With a threshold of P< 0.001 and an absolute value of correlation coefficient > 0.3, we confirmed 1268 sialylation-related lncRNAs. The patient cohort was randomly divided into training and testing groups in a 70:30 ratio (Supplementary Table S2). After univariate Cox regression, sialylation-related lncRNAs with P< 0.01 were retained for the next step. Under a stepwise algorithm and multivariate Cox regression, a sialylation-related lncRNA prognostic signature was constructed to predict overall survival (OS) in CRC patients by computing a risk score. The risk score for each patient was calculated as follows:
where Coefficient is calculated using the multivariate Cox regression model, and Expression refers to the expression of lncRNAs in both the TCGA and GEO.
The median risk score was used as the dividing point for labeling the patients as high- or low-risk patients. Kaplan-Meier survival analysis of OS, progression-free survival (PFS), and disease-specific survival (DSS) was performed between the risk groups, and the association between clinical parameters and the risk score was assessed through univariate and multivariate Cox regression. A nomogram was drawn combining the significant independent factors (P< 0.05) along with the C-index and receiver operating characteristic (ROC) curve analysis to demonstrate its efficiency in predicting survival outcome of patients at 1, 3, 5, and 7 years.
The R packages “limma” (34) and “egdeR” (35–37) were used to determine differentially expressed genes (DEGs) between the two risk groups, with a threshold of an adjusted P< 0.05 and an absolute value of log(fold change (FC)) > 0.5. The Kyoto Encyclopedia of Genes and Genomes (KEGG) pathway and Gene Ontology (GO) analyses were performed using the gene names, and Gene Set Enrichment Analysis (GSEA) was conducted with the gene names and log(FC) between the phenotype labels “high risk” and “low risk.” All these analyses were conducted in the R package “clusterProfiler” (38).
Tumor Immune Estimation Resource (TIMER, https://cistrome.shinyapps.io/timer/) (39, 40) is a comprehensive resource to analyze immune infiltration. In this study, we examined the level of immune infiltration in the high- and low-risk groups using TIMER, Cell-type Identification By Estimating Relative Subsets of RNA Transcripts (CIBERSORT) (41), the Microenvironment Cell Populations-counter (MCP-counter) (42), and Estimating the Proportion of Immune and Cancer cells (EPIC) (43) methods. We used gene set variation analysis (GSVA) to calculate the immune cell infiltration in each patient as well.
We downloaded drug sensitivity data from three databases, Genomics of Drug Sensitivity in Cancer (GDSC, https://www.cancerrxgene.org/) (44), The Cancer Therapeutics Response Portal (CTRP, https://portals.broadinstitute.org/ctrp.v2.1/) (45–47), and Profiling Relative Inhibition Simultaneously in Mixtures (PRISM, https://www.theprismlab.org/) (48). The half-maximal inhibitory concentration (IC50) in GDSC and area under the dose-response curve (AUC) in CTRP and PRISM negatively correlated with the drug sensitivity. We also acquired the transcription data of cell lines from DepMap Public 22Q2 (https://depmap.org/portal/download/), and the prediction was conducted by using the R package “Oncopredict” (49).
Human primary colonic epithelial cells (HCoEpiC) and colonic cancer cells, including LoVo and HCT116, were purchased from BNBIO Company (Beijing, China). HCoEpiC and HCT116 cells were cultivated in F12/Dulbecco’s modified Eagle medium (Gibco, Invitrogen, Paisley, UK), and LoVo cells were grown in F-12K medium (Gibco, Invitrogen, Paisley, UK). Medium was supplemented with 10% fetal bovine serum (Corning, NY, USA) and 1% penicillin-streptomycin (10,000 units/mL penicillin, 10,000 μg/mL streptomycin; Gibco, Invitrogen, Paisley, UK). All the cells were cultured at 37°C in a humidified incubator containing 5% CO2.
Cells were harvested by trypsin/EDTA (Gibco, Invitrogen, Paisley, UK) treatment for 2 min at 37°C. After adding culture medium and centrifugation to terminate the digestion, phosphate-buffered saline (PBS; Solarbio, Beijing, China) was added and cells were centrifuged twice. Cells were then resuspended in 100 μL of PBS (2x10⁶ cells/100 μL) and mixed with 100 μL fluorescein-conjugated Sambucus nigra lectin (FITC-SNA; Vector Labs; L32479; 20 μg/mL) for 30 minutes at 4°C in the dark. After washing with PBS, filtering, and centrifuging, the supernatant was discarded, and stained cells were analyzed by Image-Stream MarkII imaging flow cytometry. The results were analyzed by IDEAS statistical image analysis software (Amnis, EMD-Millipore, Seattle, WA, USA).
After growing overnight on 35-mm glass bottom dishes (Cellwis, Mountain View, CA), cells were washed twice with PBS and incubated with a blocking solution (Vector Labs; SP-5040-125) at 4°C for 15 minutes to avoid background staining or false positive results. FITC-SNA diluted in blocking solution (20 μg/mL) was then added at 4°C for 30 minutes. Cells were washed twice with PBS, and fixed with 2% paraformaldehyde (Macklin, P804536) for 30 min at room temperature. Cells were mounted on slides with antifade mounting medium containing 4′,6-diamidino-2-phenylindole (DAPI, Solarbio, Beijing, China), to stain the nuclei at the same time. Samples were observed with a confocal laser scanning microscope (Olympus FV3000, Tokyo, Japan).
We extracted the total RNA from HCoEpiC, LoVo, and HCT116 cells using an RNeasy kit (Beyotime, Shanghai, China, R0027) in accordance with the manufacturer’s instructions. Then, we reverse-transcribed 1 μg of total RNA using SuperScript II reverse transcriptase (TaKaRa, Japan, RR047). Quantitative PCR analysis was performed using SYBR Green Master Mix (TaKaRa, Japan, RR820) with an ABI 7900 HT real-time PCR system. The primer sequences for RT-qPCR are listed in Supplementary Table S3.
R software (version 3.2), SPSS 25.0 (IBM Corp., Armonk, New York, USA), and GraphPad Prism 8.0 (GraphPad Software Inc., San Diego, CA, USA) were used for data processing and visualization. Continuous variables were analyzed using the Wilcoxon rank-sum test or Kruskal-Wallis test, and categorical variables were analyzed by Fisher’s exact test or chi-square test (χ2). Pearson correlation and Spearman’s correlation analyses were used to assess the relationship between mRNA and lncRNA, and between the risk score and expression of genes. The significance of large-scale multiple tests was evaluated by the Benjamini-Hochberg method.
The process for exploring the prognostic value of sialylation-related lncRNA expression in colorectal cancer is shown in Figure 1. First, 543 patients with complete clinical information were randomly divided into the training and validation sets. We downloaded 120 mRNAs involved in sialic acid and Siglec interaction from the MsigDB website with lncRNA annotations. A total of 1268 lncRNAs strongly correlated with the mRNAs as revealed by the Pearson correlation with a threshold of |r| > 0.3 and P< 0.001 in the training group. We next focused on these sialylation-related lncRNAs; univariate Cox regression analysis showed nine lncRNAs that were significantly associated with patient OS (P< 0.01, Figure 2A). ZEB1 antisense RNA 1 (ZEB1-AS1), LOC100506691, AC092687.3, and AC010973.2 had a hazard ratio (HR) of more than one, which indicated that they were risk factors. The remaining five lncRNAs, LOC100507403, LINC00261, ITGB8 antisense RNA 1 (ITGB8-AS1), ENTPD1 antisense RNA 1 (ENTPD1-AS1), and B4GALT1 antisense RNA 1 (B4GALT1-AS1), were protective factors with HR< 1.
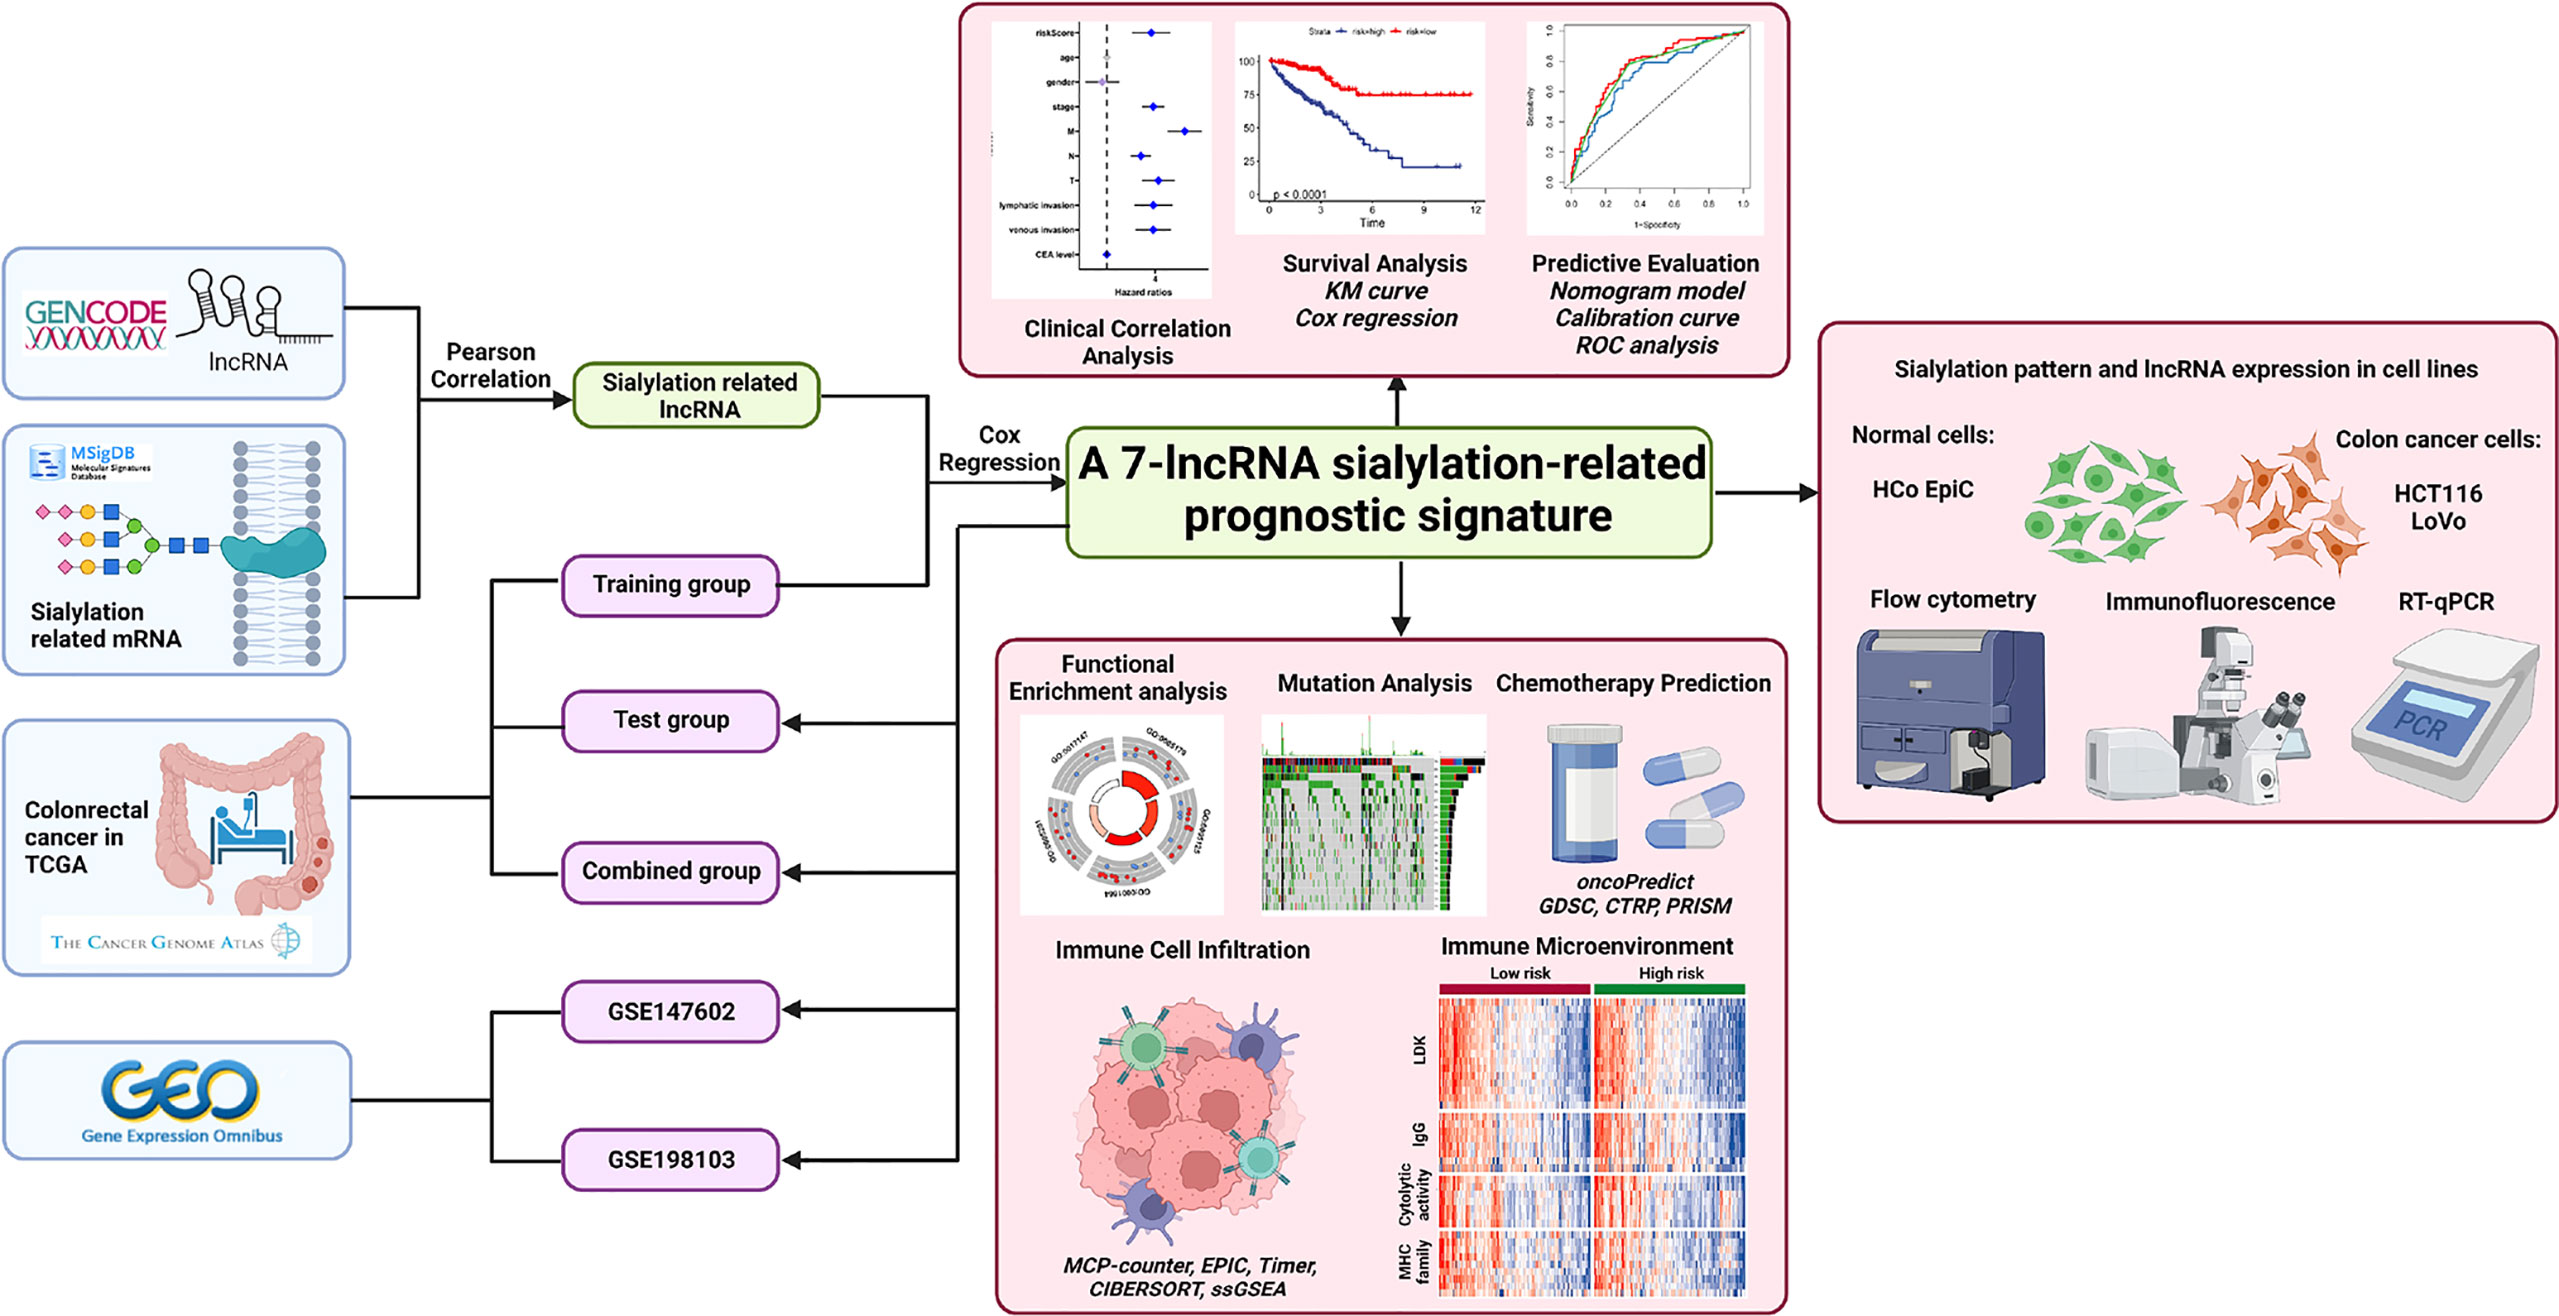
Figure 1 Flowchart of this study.
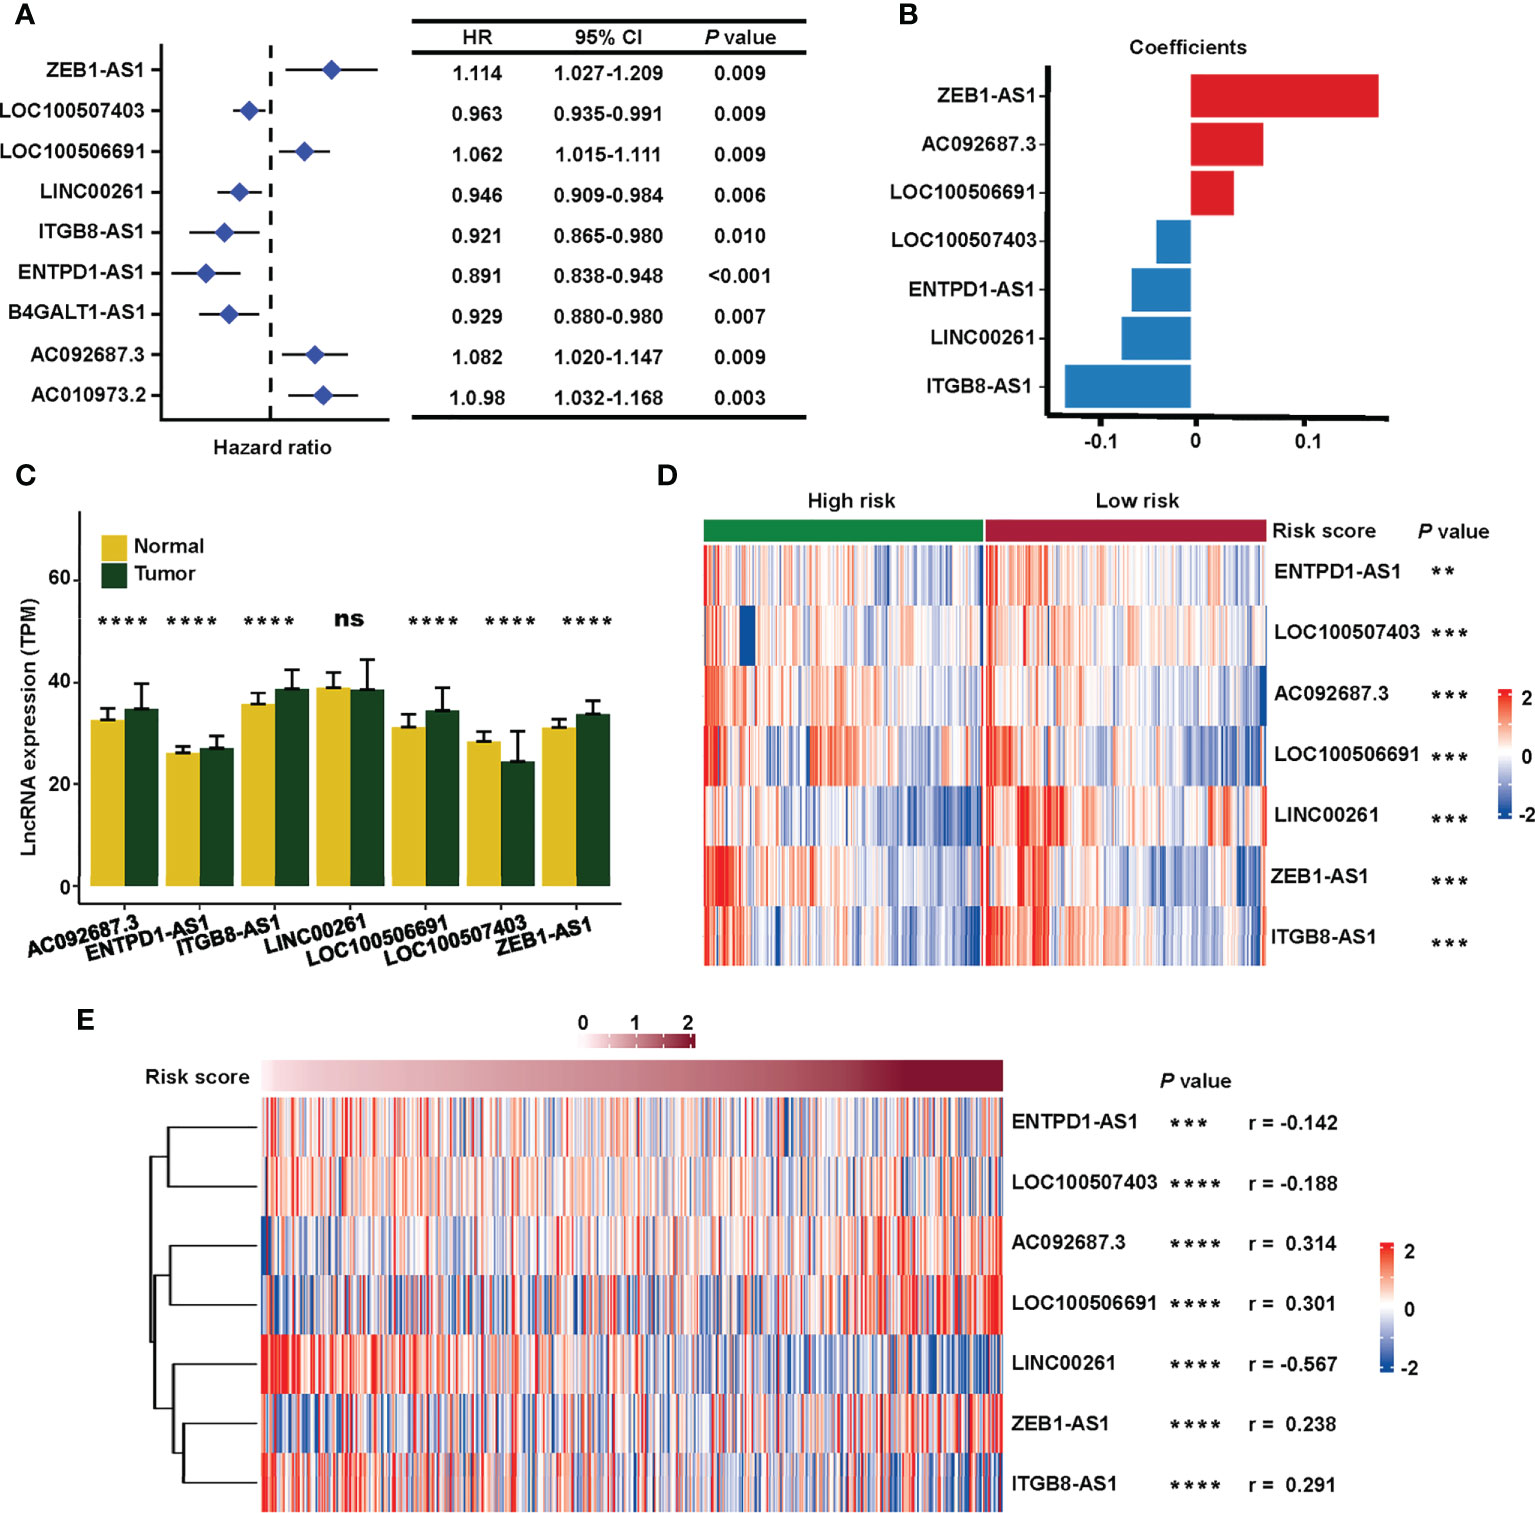
Figure 2 Construction of the sialylation-related lncRNA signature. (A) HR and CI of nine lncRNAs with P< 0.001 in a univariate Cox regression for OS. (B) Coefficients of the seven lncRNAs in the prognosis signature. (C) Expression of the lncRNAs in normal (n = 51) and cancer (n = 543) tissues in the TCGA dataset. (D) Expression profiles of the lncRNAs in high- and low-risk patients in the combined cohort. (E) Correlation of the expression of seven sialylation-related lncRNAs with risk scores by the Spearman test. HR, hazard ratio; CI, confidence interval; and OS, overall survival. ****P< 0.0001; ***P< 0.001; **P< 0.01; *P< 0.05.
Next, a signature based on the seven sialylation-related lncRNAs was constructed by multivariate Cox regression and a stepwise algorithm. The genes were as follows: ZEB1-AS1, AC092687.3, LOC100506691, LOC100507403, ENTPD1-AS1, LINC00261, and ITGB8-AS1. The coefficients of each lncRNA (Figure 2B) had the same trend as their HR value in the univariate Cox regression. Specifically, ZEB1-AS1, AC092687.3, and LOC100506691 showed positive coefficients leading to a higher risk score, while LOC100507403, ENTPD1-AS1, LINC00261, and ITGB8-AS1 had negative coefficients as they were protective factors.
The expression level of five of the lncRNAs was significantly higher in tumor tissue, except for LINC00261 (with no difference) and LOC100507403 (which was significantly higher in normal tissue) (Figure 2C). In the combined set, seven sialylation-related lncRNAs were significantly differentially expressed between the high- and low-risk groups, as defined by the median risk score (Figure 2D). Additionally, the relationship of the risk score with the seven sialylation-related lncRNAs was calculated by the Spearman test; LINC00261 showed the highest negative correlation (r = −0.567, Figure 2E).
The patients were divided into a high- or low-risk type according to the median of the calculated risk score of each set. The risk score and the survival status of the training, testing, and combined sets are displayed in Figure 3A (top). Higher mortality was observed in the high-risk group, indicating a worse prognosis both in the training set (Figure 3A (left), P< 0.001) and in the testing set (Figure 3A (middle), P = 0.036). High-risk patients had a significantly worse OS (Figure 3A (right), P< 0.001), DSS (Figure 3B, P< 0.001), and PFS (Figure 3C, P< 0.001) in the TCGA combined set.
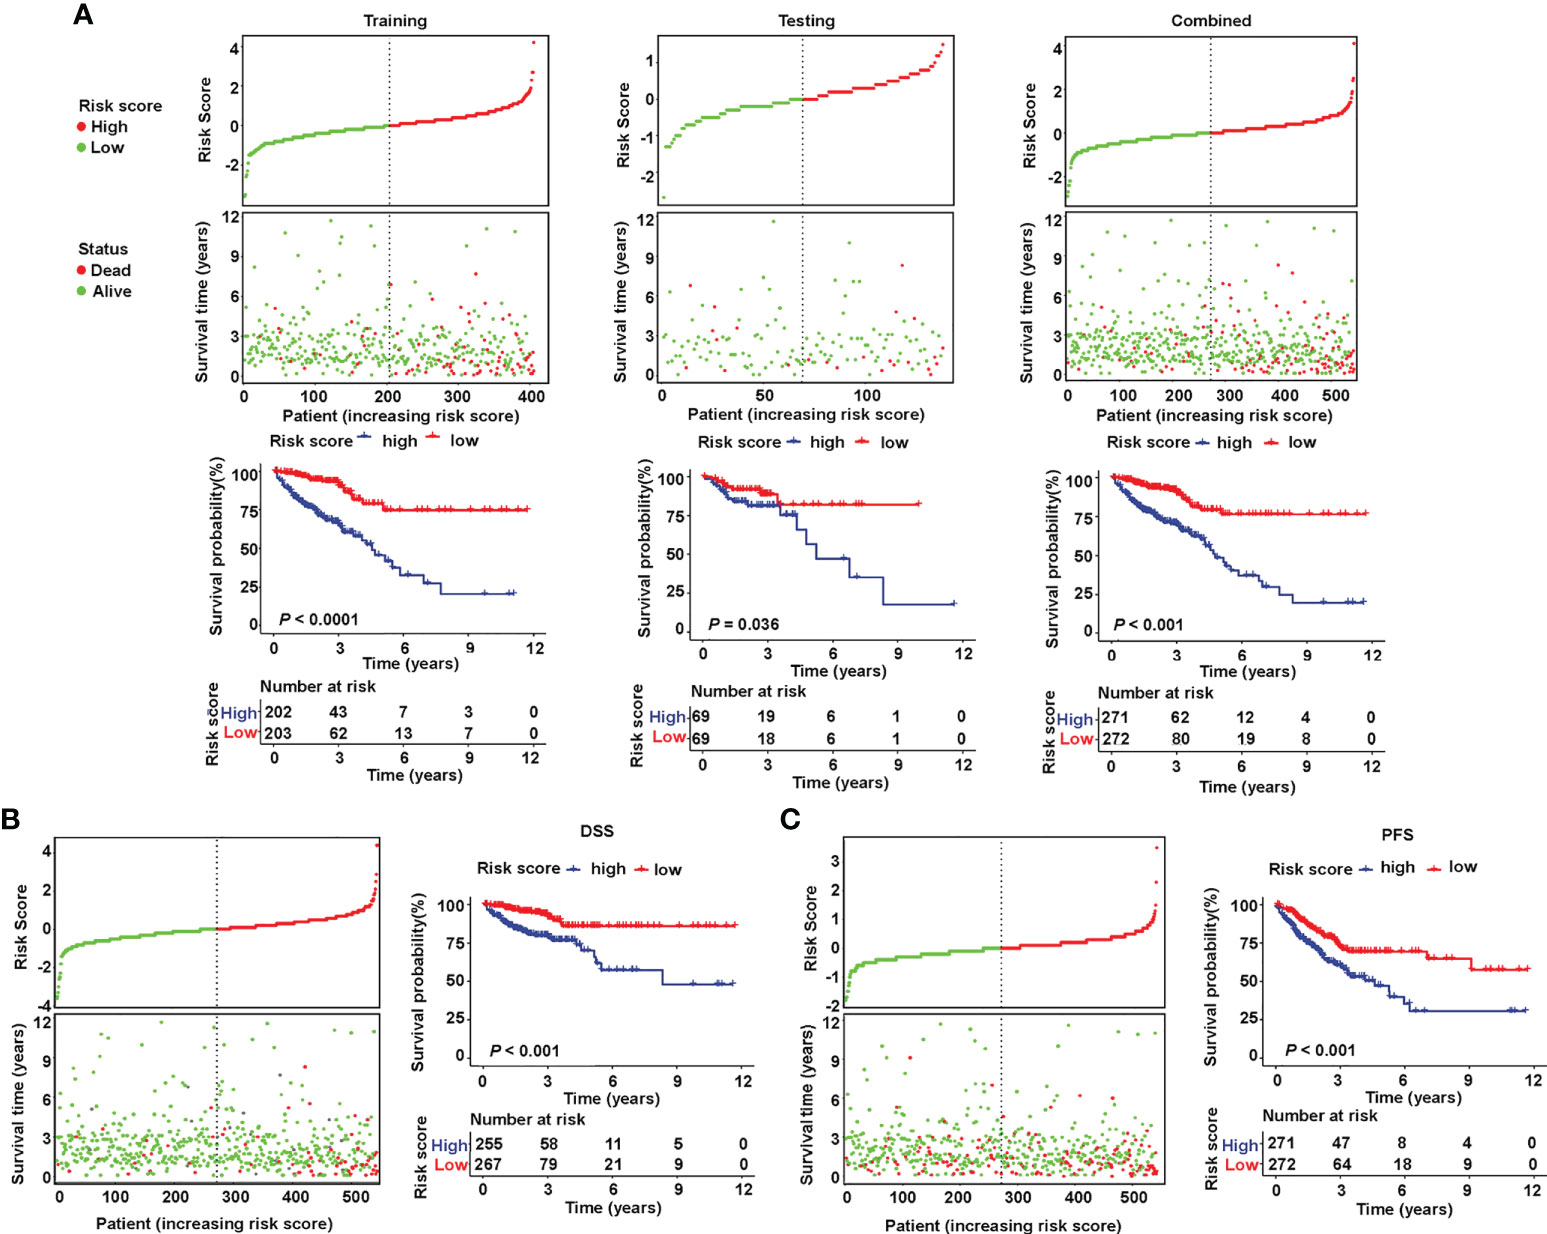
Figure 3 Validation of the prognostic value of the sialylation-related lncRNA signature in TCGA. (A) Distribution of risk score (high or low) and status (dead or alive) and KM curves of OS in the training (left), testing (medium), and combined (right) sets. (B, C) Distribution of risk score and status and KM curves of DSS and PFS in the combined set. KM, Kaplan-Meier survival test; OS, overall survival; DSS, disease-specific survival; and PFS, progression-free survival.
To examine the relationship between clinicopathological features and risk score, a χ2 test and Cox regression were used on the combined set. The high- and low-risk groups differed in OS, venous invasion, clinical stage, metastatic stage, node stage, and CMS as showed by the χ2 test (Figure 4A). Furthermore, the risk groups stratified by the signature based on the seven sialylation-related lncRNAs were significantly independent of the M, N, and T stages, and carcinoembryonic antigen level, and this finding was confirmed by the multiple Cox regression results of OS (HR = 4.343, 95% CI = 2.223–8.482, P< 0.001, Figure 4B), PFS (HR = 1.695, 95% CI = 1.095–2.623, P = 0.018, Figure 4C), and DSS (HR = 3.243, 95% CI = 1.525–6.896, P = 0.002, Figure 4D). These results implied that our sialylation-related lncRNA signature for CRC is reliable for predicting survival outcomes and may serve as an independent prognostic factor.
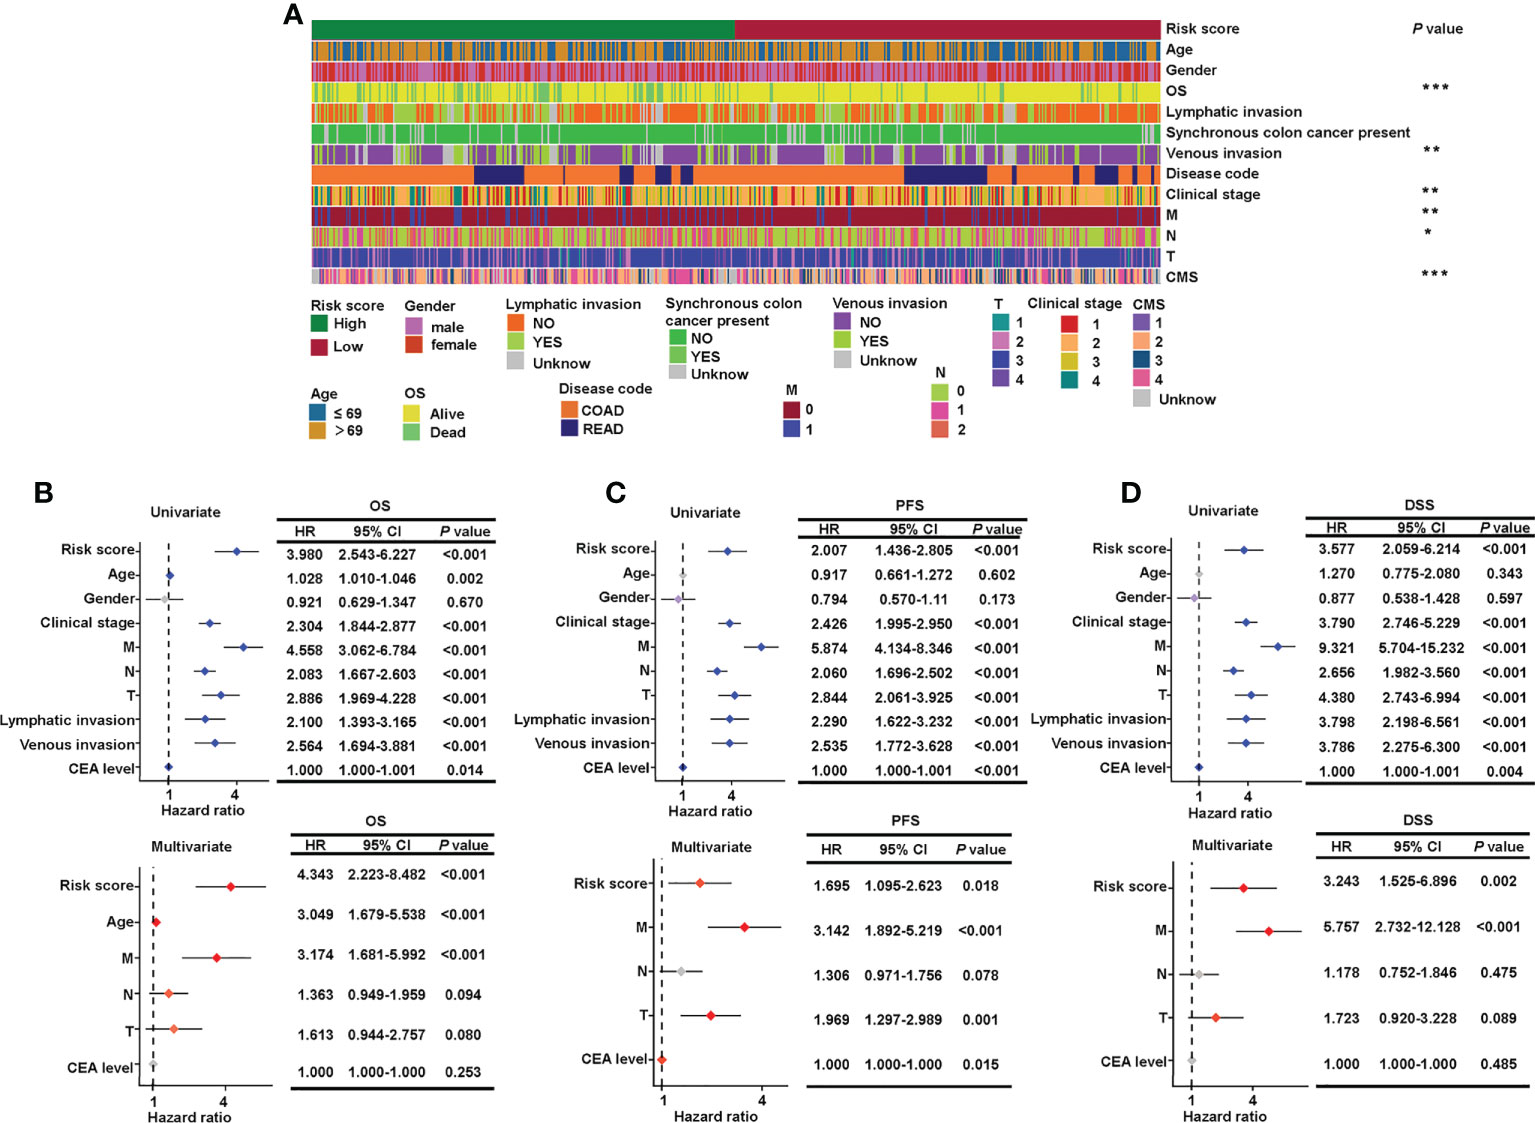
Figure 4 Verification of the relationship between risk score and clinicopathological features. (A) Clinical details of 543 patients and the significant difference between high- and low-risk groups. Forest plots of the hazard ratios predicting OS (B), PFS (C), and DSS (D) in univariate and multivariate Cox regression models. OS, overall survival; DSS, disease-specific survival; and PFS, progression-free survival. ***P< 0.001; **P< 0.01; *P< 0.05.
As the risk score was independent of other clinical characteristics, we attempted to optimize the signature for more clinically efficient utilization. Based on the multivariate Cox regression analysis of OS, we integrated age, M stage, and risk score to generate a nomogram predicting the probability of survival after 1, 3, 5, and 7 years (Figure 5A). ROC curves to assess the nomogram’s prediction accuracy showed that the nomogram performed better than clinical stage and risk score at 1 year (AUC = 0.769), 3 years (AUC = 0.771), 5 years (AUC = 0.781), and 7 years (AUC = 0.808) (Figure 5B). Additionally, calibration curves were drawn to examine the consistency of the actual measured outcome and predicted prognostic value. The results showed that the predicted outcome of the nomogram was highly consistent with the observed one (Figure 5C). These data showed that we successfully established a nomogram that combined a sialylation-related lncRNA signature and clinical characteristics for a more accurate prediction.
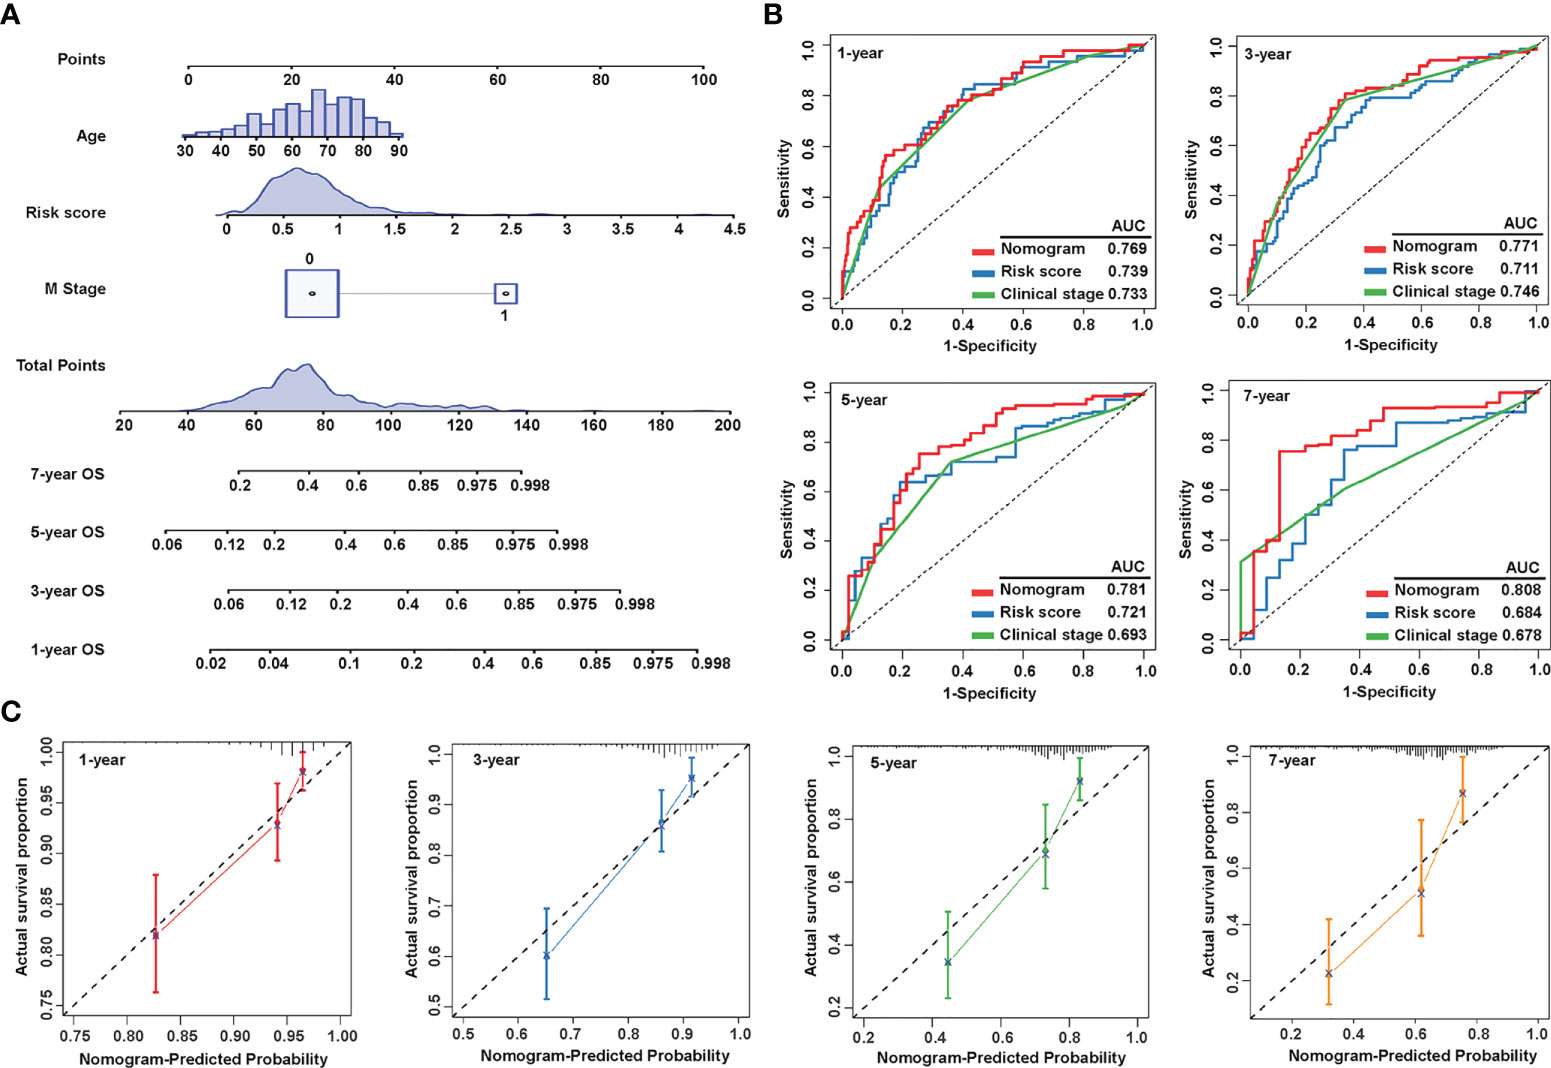
Figure 5 Construction and evaluation of the nomogram. (A) Nomogram constructed by three independent prognostic factors (risk score, metastatic (M) stage, and age) predicts 1-, 3-, 5-, and 7-year overall survival. (B) ROC curves show the predictive accuracy of the nomogram, risk score, and the clinical stage. (C) Calibration curves for 1-, 3-, 5-, and 7-year survival. ROC, receiver operating characteristic; and AUC, area under the curve.
To explore the underlying mechanism by which the risk signature stratified the prognosis of patients, we performed mutation, KEGG pathway, GSEA, and GO analyses. Since somatic mutations are the essential cause of malignancy (50), we visualized the landscape of mutation profiles in TCGA using the “maftool” package, where the top 20 most frequent mutations were displayed separately in the high- and low-risk groups (Figure 6A). A Fisher test showed that there were no significant differences in the ratio of mutation occurrences between the two risk groups, except for mutated gene TP53 (Figure 6B). In addition, the number of somatic mutations and neoantigens showed no significant differences between the two groups (Figure 6C). These results indicate that the prognostic significance of the sialylation lncRNAs-based signature may be independent of somatic mutations.
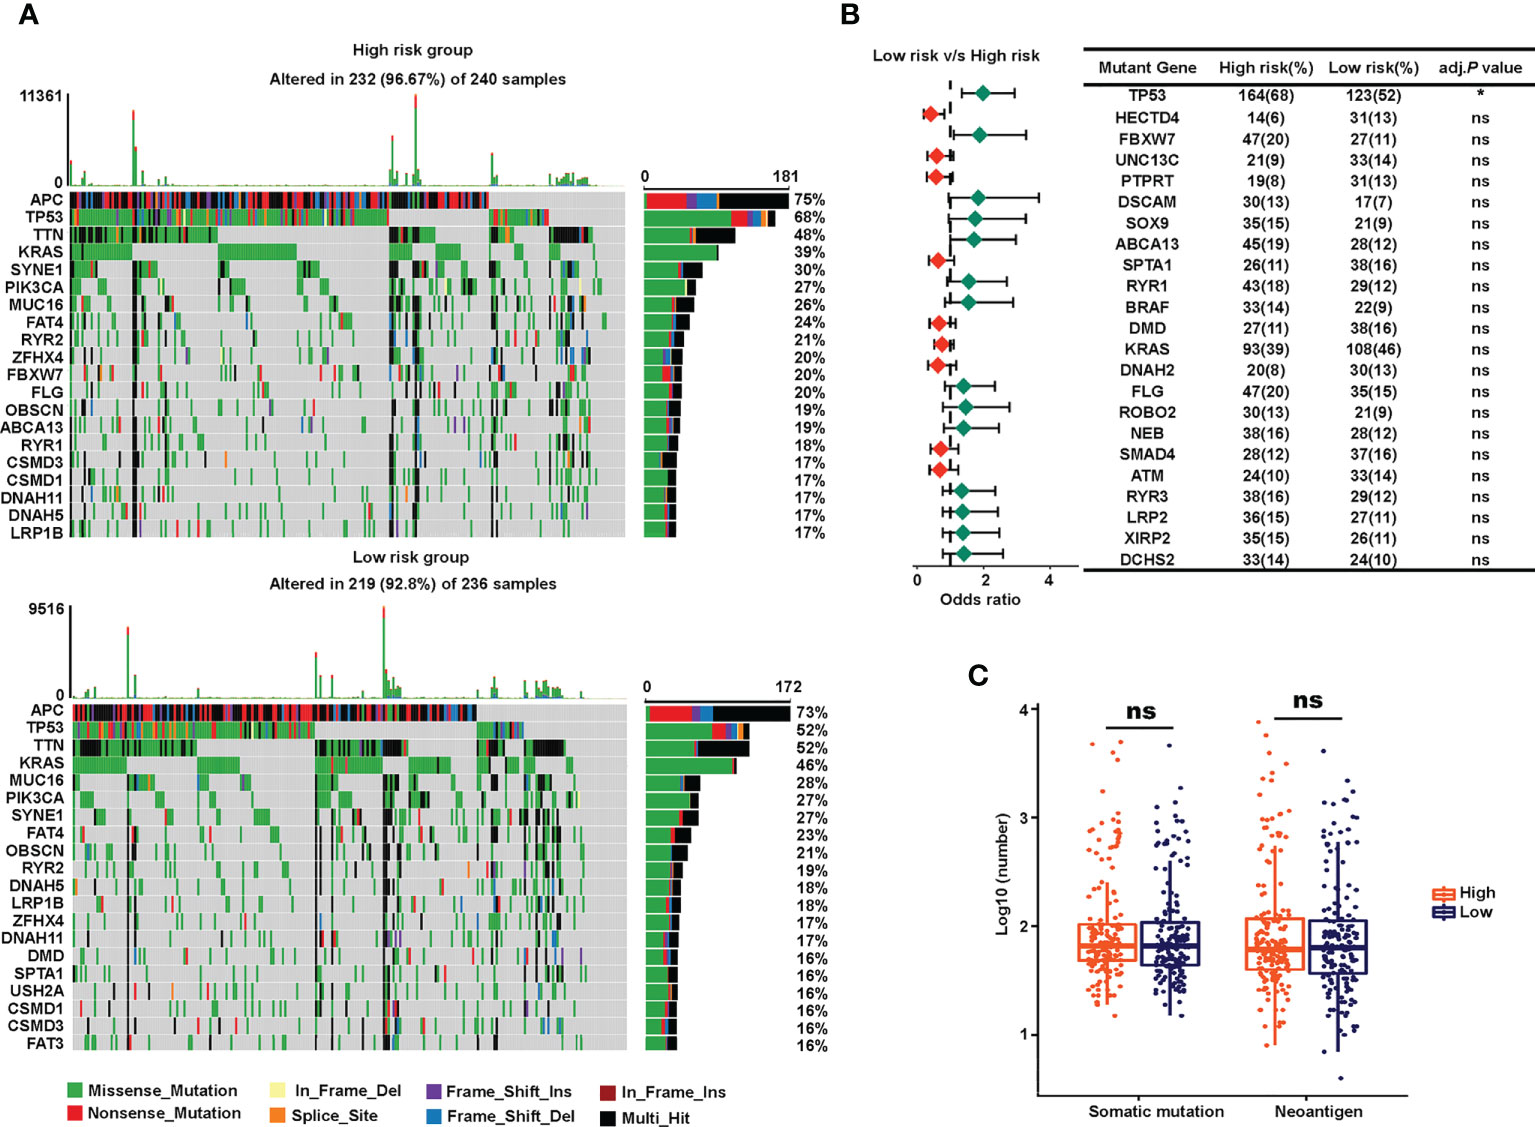
Figure 6 Somatic mutations of the high- and low-risk groups. (A) Waterfall of the top 20 tumor somatic mutations in the high-risk (up) and the low-risk (down) cohorts. (B) Forest plot showing the odds ratios of the 20 most significantly differentially distributed mutated genes between the two risk groups. (C) Numbers of somatic mutations and neoantigens in the high- and low-risk TCGA groups. *P< 0.05; ns, not significant.
Next, we conducted pathway analysis and GSEA to investigate the underlying biological importance of the sialylation-related lncRNA signature. A total of 603 DEGs were identified with their |log2(FC)| > 0.5 and adjusted P< 0.05 between the two risk groups in the combined set using the R package “edgeR” (Figure 7A). GSEA showed that pathways related to the extracellular matrix (ECM), such as basal cell carcinoma, ECM-receptor interaction, focal adhesion, and the hedgehog signaling pathway, were enriched in the high-risk group, and patients with a lower risk score had enriched pathways for cytokine-cytokine receptor interactions, oxidative phosphorylation, peroxisomes, and ribosomes (Figure 7B). Furthermore, GSEA showed that immune response pathways, such as B cell-mediated immunity and immune response regulation, were enriched in the low-risk group (Figure 7C). In patients with a higher risk prediction, pathways of collagen and axons were enriched, such as axon development, extracellular matrix structural constituent, collagen fibril organization, and regulation of axonogenesis. We also conducted GO analysis on the 603 DEGs and confirmed that immune processes participated in the sialylation signature-related division of CRC patients (Figure 7D). The pathway analysis illustrated that immunological and extracellular composition may explain the discriminatory power of our signature.
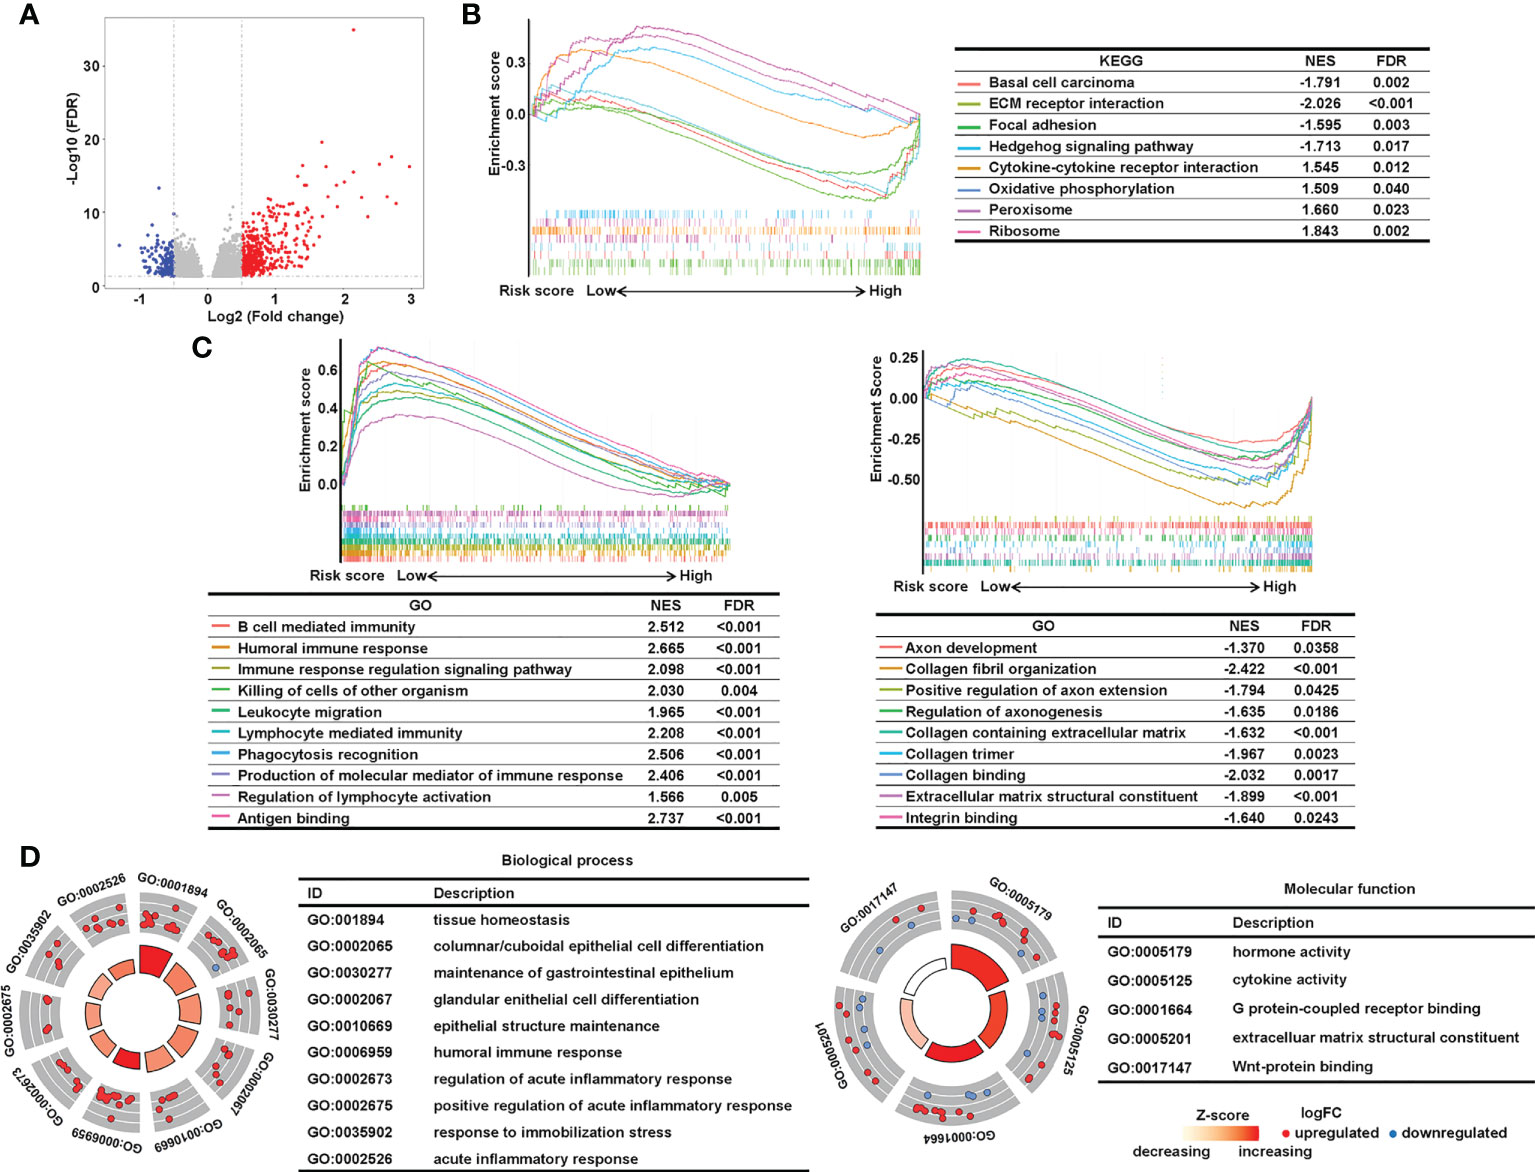
Figure 7 Analysis of underlying biological pathways of the sialylation-related lncRNA signature. (A) Volcano plot of differentially expressed genes in the high- and low-risk cohorts with a threshold of FDR > 0.05 and absolute log2(FC) > 0.5. Upregulated pathways enriched in the low-risk group (NES > 1) and the high-risk group (NES< 1) of KEGG (B) and GO (C) with FDR< 0.05. (D) GO enrichment of differentially expressed genes. FC, fold change; FDR, false discovery rate; and NES, normalized enrichment score.
To further investigate whether the immune process closely correlated with the risk score, we mined TCGA transcriptomic data to explore the difference in tumor immune infiltration between the two risk groups by using deconvolution algorithms in TIMER. Both MCP-counter (Figure 8A) and EPIC (Figure 8B) showed that cancer-associated fibroblasts, known as critical components of the tumor mesenchyme (51), were significantly higher in patients with a high risk. Antitumor immune cells, such as CD8+ T cells identified by EPIC (Figure 8B) and TIMER (Figure 8C), and CD4 memory resting T cells and naive B cells identified by CIBERSORT (Figure 8D) exhibited higher proportions in the low-risk group. To further validate these findings, we used GSVA to calculate immune infiltration (Figure 8E). Interestingly, the proportions of immune cells were higher in the low-risk group compared to the high-risk group, regardless of whether they were antitumor, intermediate, or pro-tumor immune cells, as shown in the GSVA heatmap.
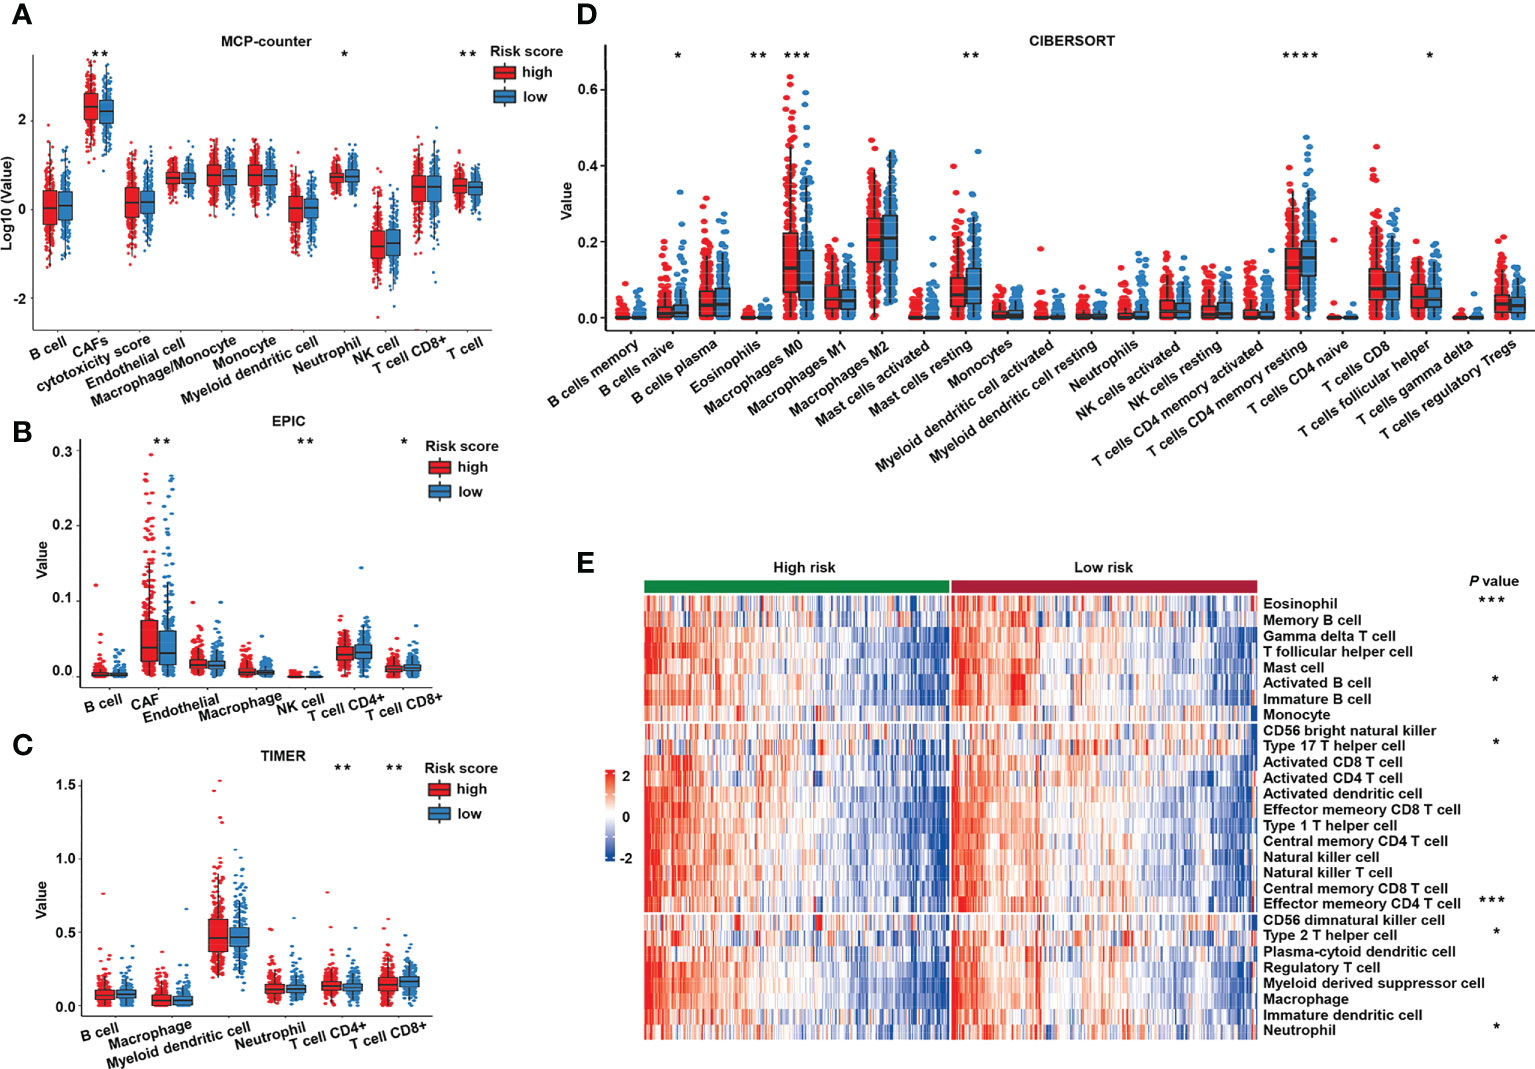
Figure 8 Immune cell infiltration of the different risk groups. Estimated immune cell infiltration value in different risk groups by MCP-counter (A), EPIC (B), TIMER (C), and CIBERSORT (D). (E) Heat map of prediction of immune cells infiltration in the high- and low-risk groups by GSVA. GSVA, gene set variation analysis. ****P< 0.0001; ***P< 0.001; **P< 0.01; *P< 0.05.
Furthermore, to investigate the immune system metagene, we examined crucial genes involved in inflammatory activities and immune molecules (52). Correlation between the chosen genes and sialylation-related lncRNAs were examined (Figure 9A). Serpin family B member 1 (SERPINB1) and Cathepsin S (CTSS) were significantly correlated to four of the seven lncRNAs, ITGB8-AS1, LINC00261, ZEB1-AS1, and LOC100506691. Major histocompatibility complex (MHC) genes, such as RAS oncogene family member 32 (RAB32), CTSS, RAS oncogene family member 27A (RAB27A), and cathepsin E (CTSE) were strongly correlated with LINC00261 (Supplementary Figure 1). Four immune stimulators, which were Interleukin 6 receptor (IL6R), 5’-nucleotidase ecto (NT5E), C-X-C motif chemokine receptor 4 (CXCR4), tumor necrosis factor superfamily member 13 (TNFSF13), were all strongly correlated with ZEB1-AS1 (Supplementary Figure 2). Specific genes and families, including the lymphocyte-specific protein tyrosine kinase (LCK) pathway; immunoglobulin G (IgG), MHC family, and cytolytic activity genes, such as interleukin 7 receptor (IL7R), CD48, immunoglobulin heavy constant gamma 1 (IGHG1), CTSE, and CD209 (Figure 9B); and immune stimulators, such as CD28, IL6R, and TNFSF13 (Figure 9C), had significantly lower expression in the high-risk samples. These data demonstrated that immunogenicity varied between the different risk groups.
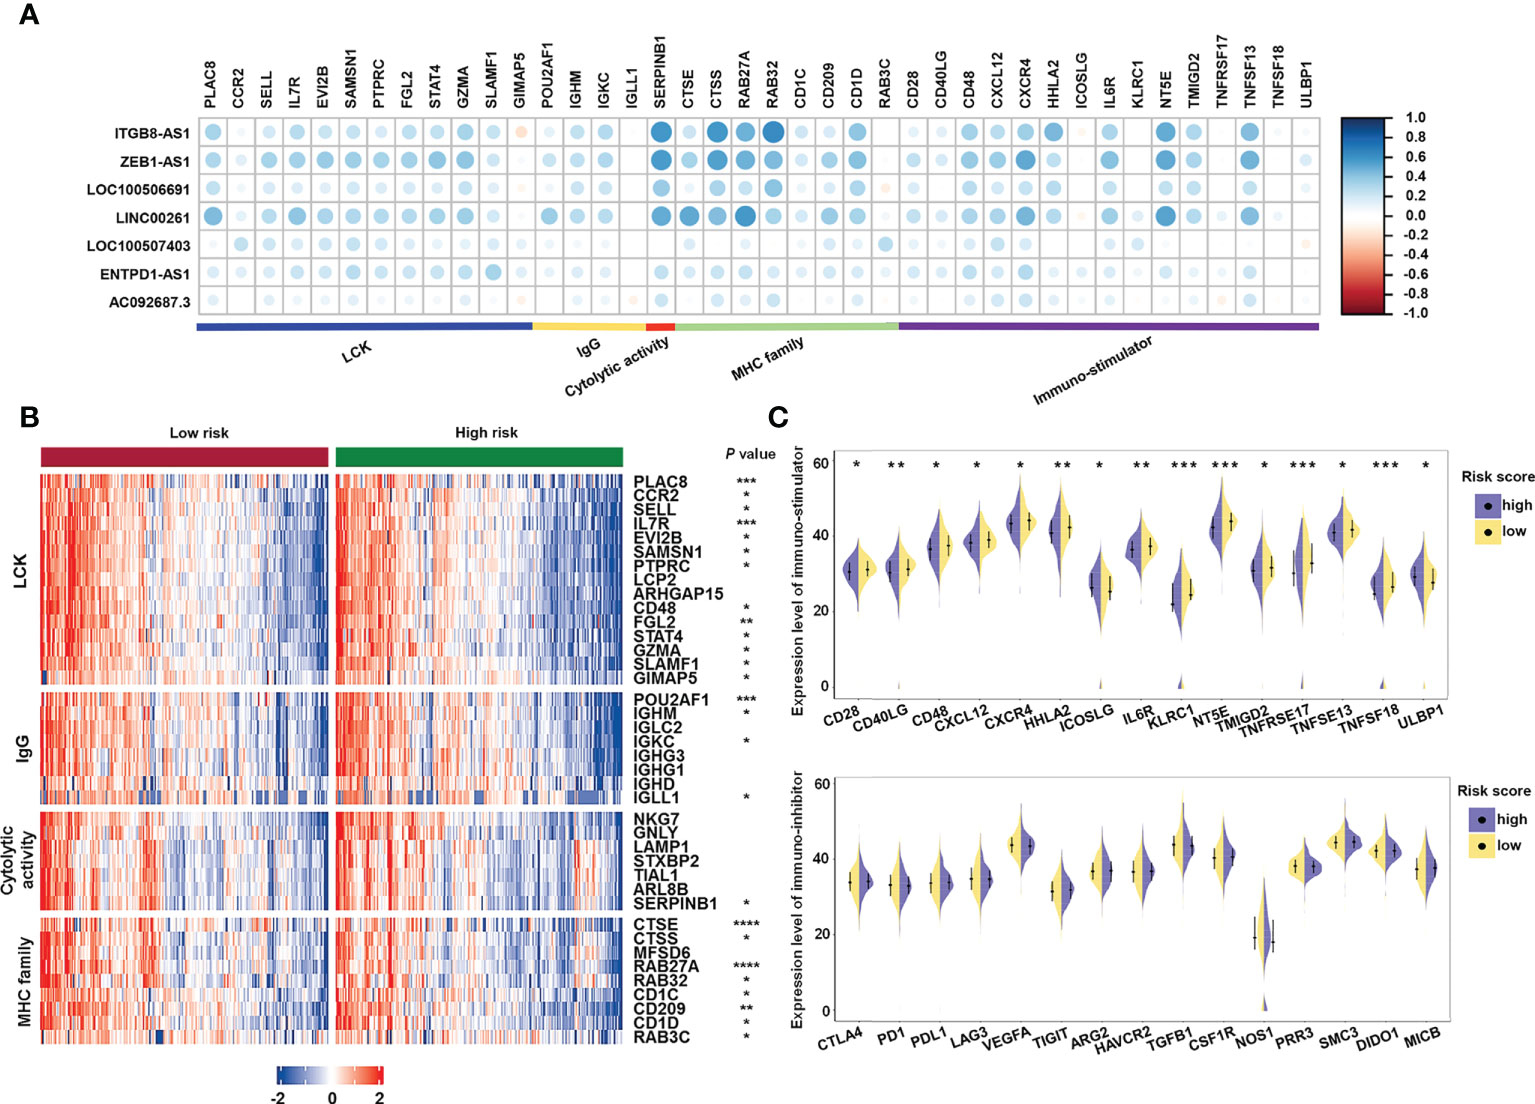
Figure 9 Analysis of the correlation between immune-related genes and sialylation-related lncRNA signature. (A) Heatmap of the correlation between expression of immune-related molecules and sialylation-related lncRNAs. (B) Expression of genes involved in the LCK pathway, IgG, cytolytic activity, and the MHC family in different risk groups. (C) Analysis of immune-stimulator and immune-inhibitor expression with different risk scores. LCK, lymphocyte-specific protein tyrosine kinase; IgG, immunoglobulin G; and MHC, major histocompatibility complex. ****P< 0.0001; ***P< 0.001; **P< 0.01; *P< 0.05.
We used flow cytometry and immunofluorescence to explore the sialylation pattern on different cell surfaces. We observed that HCoEpiC and HCT116 cells had significantly stronger fluorescence intensities than LoVo cells (Figures 10A–C) when the cell surface was stained with SNA, a specific lectin that binds to α-2,6 linked sialic acid. These results showed that LoVo cells had a significantly lower sialylation level. To confirm the expression of these seven sialylation-related lncRNA signature genes, RT-qPCR was performed on HCoEpiC and the colonic cancer cells (HCT116 and LoVo). Comparing HCT116 cells with HCoEpiC, we found that ENTPD1-AS1, ITGB81-AS1, LINC00261, LOC100506691, LOC100507403, and ZEB1-AS1 were significantly overexpressed in the tumor cells (Figure 10D). Comparing LoVo cells with the normal colonic epithelial cells, we found that LOC100506691 and ZEB1-AS1 had higher expression in the tumor cells, while ENTPD1-AS1, LINC00261, and LOC100507403 had higher expression in the normal cells. AC092687.3 and ITGB8-AS1 showed no significant differences between the cell types.
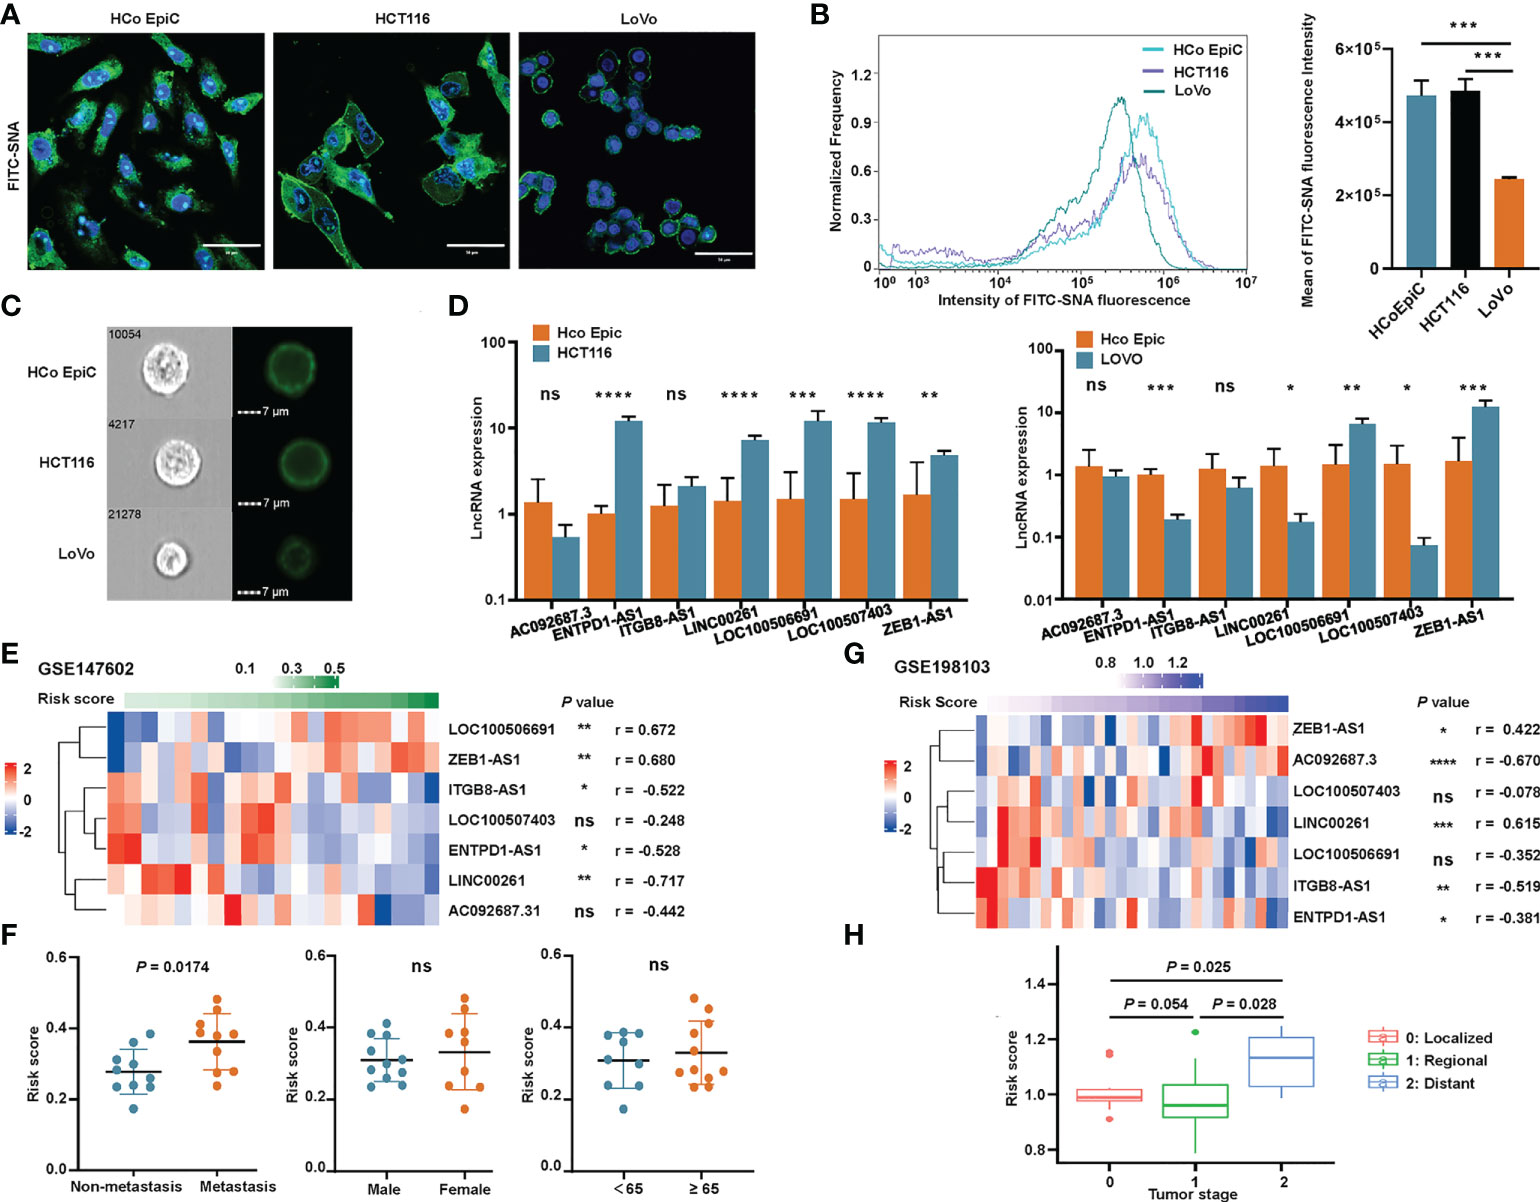
Figure 10 Validation of the sialylation-related lncRNA signature. (A) Representative confocal images of normal human colonic epithelial cells (HCoEpiC) and colonic cancer cells including HCT116 and LoVo stained with FITC-SNA. (B) Flow cytometry histogram and boxplot showing the α2’-6’-sialylation on the surface of the three cell types. (C) Representative images of the three cell types photographed by Image-Stream MarkII. (D) Comparison of the seven lncRNAs between HCoEpiC, HCT116 cells, and LoVo cells. (E) Expression profile of the lncRNAs in GSE147602. (F) Risk score distribution in GSE147602 with different clinical features. (G) Expression profile of the lncRNAs in GSE198103. (H) Risk score of patients with different tumor stages in GSE198103. ****P< 0.0001; ***P< 0.001; **P< 0.01; *P< 0.05; and ns, not significantly.
We also used two GEO cohorts, GSE147602 and GSE198103, to investigate the prognostic ability of our signature. In GSE147602, the risk score calculated by the formula showed a strong association with LOC100506691, ZEB1-AS1, ITGB8-AS1, ENTPD1-AS1, and LINC00261 (Figure 10E). As shown in Figure 10F, the risk score significantly correlated with metastasis stage but was not significantly associated with other clinicopathological features such as gender and age. In GSE198103, the risk score was strongly correlated with AC092687.3, LINC00261, and ITGB8-AS1 (Figure 10G). The risk score of patients with a distant metastasis stage was significantly higher than ones with a localized or regional stage (Figure 10H). The ability of the sialylation-related lncRNA signature to evaluate the prognosis of CRC patients was clearly validated by these two cohorts.
To evaluate the application of our sialylation-related signature in clinical therapy and identify promising drugs for high-risk patients, we analyzed the chemotherapeutic drug sensitivity. After predicting the sensitivity of 1900 compounds for 543 patients, we conducted a Wilcoxon test between the two risk groups and set a threshold of an adjusted P< 0.05 (Figure 11A). In 198 compounds from the GDSC, there were 49 compounds displaying a significantly low IC50 in the low-risk group, compared with only five in the high-risk group. Drugs commonly used in clinical chemotherapy are shown in Figure 11B. The IC50 of 5-fluorouracil and oxaliplatin did not differ between the risk groups, while the IC50 of camptothecin, irinotecan, and docetaxel were significantly lower in the low-risk group, which implied that patients with a lower risk score could be more sensitive to these chemotherapy compounds. Compounds targeting the receptor tyrosine kinase (RTK) pathway, such as cediranib, savolitinib, foretinib, and sorafenib, were predicted to be more effective in the low-risk group. There were no differences between the two risk groups in compounds targeting the extracellular signal-regulated kinase/mitogen-activated protein kinase (ERK/MAPK) pathway.
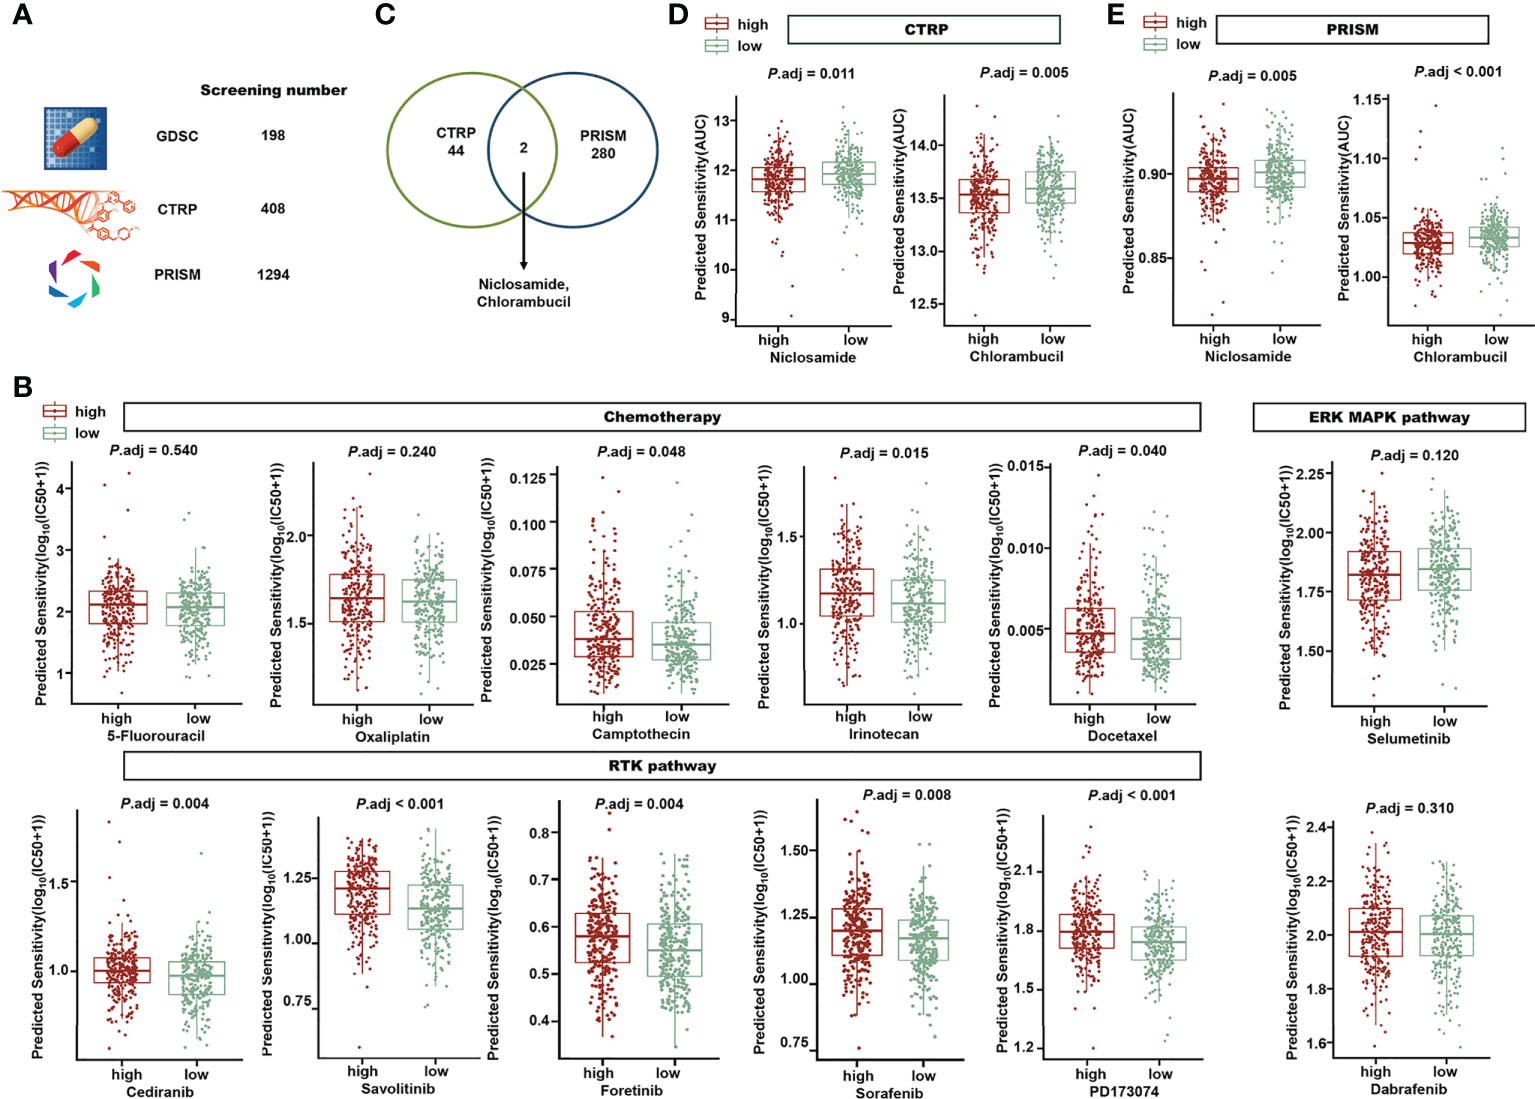
Figure 11 Exploration of the risk signature and drug sensitivity. (A) A total of 1900 compounds from GDSC, CTRP, and PRISM were screened to investigate promising drugs for clinical treatment. (B) In the high- or low-risk groups, different predicted IC50 values of drugs in chemotherapy, the RTK pathway, and the ERK/MAPK pathway are displayed. (C) Venn diagram showing the two candidate compounds between CTRP and PRISM. Niclosamide and chlorambucil are the two compounds predicted with significantly lower AUCs in the high-risk group (P adj< 0.05) in CTRP (D) and PRISM (E). GDSC, Genomics of Drug Sensitivity in Cancer; CTRP, The Cancer Therapeutics Response Portal; PRISM, Profiling Relative Inhibition Simultaneously in Mixtures; RTK, receptor tyrosine kinase; and ERK/MAPK, extracellular signal-regulated kinase/mitogen-activated protein kinase.
Forty-four compounds in the CTRP and 280 compounds in PRISM were identified with a significantly lower AUC in the high-risk group. Niclosamide and chlorambucil were at the intersection of the promising complexes of the two databases (Figure 11C), which means that they were both predicted with a lower AUC in the high-risk group in the CTRP (Figure 11D) and PRISM (Figure 11E). Our findings suggest that the risk signature can support clinical drug selection, and niclosamide and chlorambucil may be appropriate for high-risk patients.
The overexpression of sialic acid, hypersialylation, has been observed to stimulate tumor deterioration and dampen the immune response (21) with the involvement of Siglecs. Siglecs are commonly expressed on NK and tumor-infiltrating T cells and are involved in regulating immune cells. To normalize the immune system, molecules that block Siglecs, such as antibodies against Siglec-15 (16, 17), currently under a clinical safety and tolerability trial, are considered promising in advanced solid tumors. The roles of lncRNAs, a type of RNA that meditates multiple pathways and has a promising future in early cancer diagnosis, remain unclear in sialylation and Siglec interactions. Given the previous evidence that multiple gene-related signatures based on specific biological functions were superior in predicting the prognosis and individualized therapy in patients with CRC (53–56), in the present study, we aimed at exploring the clinical significance of a sialylation lncRNAs-based signature.
In this study, we developed a novel signature based on seven lncRNAs, all of which have a strong correlation with the sialic acid and Siglec pathways. Three of them (LOC100507403, ENTPD1-AS1, and AC092687.3) remain functionally uncharacterized. ZEB1-AS1 has been reported as an oncogene in prostate cancer (57), and was found to activate ZEB1 epigenetically. ZEB1-AS1 was also reported upregulated in colorectal cancer tissues (58). Interestingly, antiproliferative effects of metformin in gastric cancer have been shown to lead to suppression of LOC100506691 (59). According to Xiaoting Lin (60), ITGB8-AS1 regulated cell proliferation and tumor growth of CRC by regulating focal adhesion signaling, which indicates a therapeutic potential. Dysregulation of LINC00261 has been found to play vital roles in pancreatic cancer (61–63), gastric cancer (64), hepatocellular carcinoma (65–67), and colon cancer (68). Evidence of the role of sialic acid-related lncRNAs in cancer is sparse, though promising, and integrating these seven sialic acid-related lncRNAs into a 7-lncRNA signature exhibits novel clinical significance. Our results show that this 7-lncRNA signature can distinguish the prognosis of patients and theoretically support clinical treatment strategies. Additionally, a nomogram containing age, M stage, and risk score was constructed and shown to exhibit a greater predictive ability than the clinical stage, which implies an optimization of the current clinical classification for staging. Moreover, the risk score calculated by the 7-lncRNA signature was independent of the main prognostic factors in CRC. To exhibit the prognostic ability of the signature, we chose the median value rather than the optimal cutoff values to divide the patients into high- and low-risk groups for the following reasons. First, the median value is commonly considered robust as an unsupervised approach. The application of the median risk score as a cutoff can be easily found in studies constructing both mRNA (69) and lncRNA (70, 71) signatures. Second, the optimal cutoff values may show excellent performance in one specific cohort but lack universality. The application of the median value as a cutoff can be applied widely and easily with objectivity.
We assume that the development of fibroblasts and stronger immune activity may result in better outcomes in the low-risk group. As tumor stroma consists of immune cells, activated fibroblasts, ECM (72), and other basement membrane constituents (73), the progression of the tumor stroma stimulates the progression and metastasis of cancer. In high-risk patients, cancer-associated fibroblasts, as producers of pro-tumorigenic signals (51, 74–76), were predicted to show a higher infiltration rate by Epic and MCP-counter. In addition, ECM-receptor interactions, collagen interactions, hedgehog signaling, and focal adhesions, pathways that can be classified as fibroblast-related, were enriched. This suggests that our signature can indicate epigenetic changes, and that these seven sialylation-related lncRNAs may participate in the deterioration process of the stroma, which augments tumor growth.
The results of biological pathway and functional enrichment analyses also revealed that pathways concerning immune responses, such as humoral immune responses, leukocyte migration, phagocytosis recognition, regulation of lymphocyte activation, and antigen binding, were enriched in the low-risk group. Moreover, the immune cell infiltration estimated by five algorithms indicated that low-risk patients tended to display a higher antitumor immune activity. The immune stimulators were also more highly expressed in the low-risk group; however, inhibitors of the immune response show no difference between the risk groups. The correlation analysis further revealed that several genes in immune biological processes had a strong connection with the 7-lncRNA signature. In particular, genes in the MHC pathway, RAB27A, RAB32, and CTSS, had a correlation higher than 0.4 with ITGB8-AS1, ZEB1-AS1, and LINC00261. NT5E, TNFSF13, CXCR4, and IL6R, all related to immune stimulation, were correlated with ITGB8-AS1, ZEB1-AS1, and LINC00261. This implies that ITGB8-AS1, ZEB1-AS1, and LINC00261 may play a role in the MHC pathway or immune stimulation by interacting with these genes in some manner. Taken together, patients with low risk exhibited a strong immune response that could be a better prognostic indicator than somatic mutations. Increased sialylation in tumor cells has been found to lead to resistance to chemotherapeutics, such as gefitinib (77) and cisplatin (78, 79). In this study, the risk groups grouped by the sialylation-related lncRNA signature also showed different drug sensitivity; in particular, the low-risk group had better outcomes after receiving drugs regulating the RTK pathway. Niclosamide and chlorambucil were recognized as promising treatments for the high-risk group, given that their predicted AUCs were significantly lower in the high-risk group, which means that a higher efficacy is expected with these drugs. Interestingly, niclosamide has been repurposed as a STAT3 inhibitor in CRC treatment (80), and STAT3, an important therapeutic target, has recently been found to be meditated by sialylated c-Met in CRC (81). Our results linked clinical therapy outcomes with TCGA expression data, and these findings may guide drug selection for patients with different sialylation-related lncRNA signature scores in the future.
In the validation of the seven lncRNAs between the normal human colonic cells (HCoEpiC) and colonic cancer cells, the expression of LOC100506691 and ZEB1-AS1 was higher in the cancer cells, which agreed with the comparison of normal and cancer tissues in the TCGA dataset. CRC tissue contains cancer cells and stromal cells, such as immune cells, fibroblasts, and blood vessels, which may explain the inconsistency of other lncRNA expression between our RT-qPCR results and the TCGA database. The difference between two colonic cancer cells, HCT116 and LoVo, also cannot be ignored. Expression of ZEB1-AS1 was higher in CRC tissue than in paired noncancerous tissue, and higher in colonic cancer cell lines than in human normal cell lines, which was in agreement with our findings (82). Despite the absence of studies on LOC100506691 in CRC, there is evidence that LOC100506691 plays an oncogenic role in gastric cancer cell growth (59), which is in accordance with its high expression level in CRC. We believe that LOC100506691 and ZEB1-AS1 have promising value in the diagnosis of CRC and the available data provide clues regarding their possible function in tumorigenesis and progression, but more experiments are needed to validate these assumptions. To further investigate the cause of the relatively lower expression of lncRNAs in LoVo cells, we examined the α-2,6-sialic acid modification, a major factor contributing to cancer hypersialylation (23, 83). The results of flow cytometry and confocal microscopy showed that LoVo cells had a significantly lower α-2,6-sialylation on the cell surface than either HCoEpiC or HCT116 cells. There are also reports about the different glycan modification patterns in LoVo and HCT116 cells (77, 84). Considering the positive expression correlation of most lncRNAs in the signature with sialyltransferases, different sialylation patterns of different cells could explain the relatively poor expression of ENTPD1-AS1, LINC00261, LOC100507403, and ITGB8-AS1 in Lovo cells.
Some limitations should be addressed in the current study. First, most GEO datasets containing CRC patient data used platform GPL24676 and platform GPL570 and both lack tracks for ITGB8-AS1 or AC092687.3. This can be explained by the different coverage between RNA sequencing and microarrays and shows that the importance of lncRNAs remains masked with the limitation of available technology. Due to the lack of lncRNA expression profiles and complete survival time for CRC, the sialylation-related lncRNA signature was validated using the GSE147602 and GSE198103 datasets. GSE147602 used a new platform, GPL21047, with the metastasis status rather than survival condition to demonstrate the value of our signature. Although we included data for a total of 592 CRC patients from both RNA sequencing and microarray platforms, more independent CRC cohorts and a prospective study are needed for validating the risk signature in the future. Second, although the expression levels of all seven lncRNAs were assayed by RT-qPCR in the CRC cell lines and normal cells, sufficient clinical samples and corresponding clinical information was not available, and subsequent studies with larger sample sizes would be helpful to provide strong evidence for confirming the prognostic value of our signature. Third, the mechanisms by which these sialylation-related lncRNAs cooperate in affecting the immune landscape and in determining drug sensitivity in CRC remain unclear. The biological functions of these lncRNAs and their interactions with sialylation-related genes will be explored in future studies based on in vitro and in vivo experiments.
In conclusion, this is the most systemic exploration of the clinical significance of sialylation-related lncRNAs in patients with CRC to date. We successfully developed and validated a novel seven sialylation-related lncRNA signature, which exhibited accurate performance in predicting the prognosis, immune status, and chemotherapy sensitivity in CRC patients. The present study may provide innovative perspectives in clinical outcome prediction for CRC patients and contribute to deepening the theoretical foundation for immunotherapy improvement and individualized antitumor treatment.
The original contributions presented in the study are included in the article/Supplementary Material. Further inquiries can be directed to the corresponding authors.
Conception and design: MY and MZ. Administrative support: MY. Provision of study materials or patients: WW, YH, FZ, and ZY. Collection and assembly of data: MZ, SL, TL, and WG. Data analysis and interpretation: MZ, RZ, SL, and ZZ. Article writing: MY and MZ. All authors contributed to the article and approved the submitted version.
This work was supported by grants from CAMS Innovation Fund for Medical Sciences (CIFMS) (No. 2021-I2M-1-028) and the Natural Science Foundation of China (NSFC) (No. 81773750).
The authors are thankful for the publicly available databases.
The authors declare that the research was conducted in the absence of any commercial or financial relationships that could be construed as a potential conflict of interest.
All claims expressed in this article are solely those of the authors and do not necessarily represent those of their affiliated organizations, or those of the publisher, the editors and the reviewers. Any product that may be evaluated in this article, or claim that may be made by its manufacturer, is not guaranteed or endorsed by the publisher.
The Supplementary Material for this article can be found online at: https://www.frontiersin.org/articles/10.3389/fimmu.2022.994874/full#supplementary-material
1. Siegel RL, Miller KD, Fuchs HE, Jemal A. Cancer statistics, 2021. CA Cancer J Clin (2021) 71:7–33. doi: 10.3322/caac.21654
2. Olawaiye AB, Baker TP, Washington MK, Mutch DG. The new (Version 9) American joint committee on cancer tumor, node, metastasis staging for cervical cancer. CA Cancer J Clin (2021) 71:287–98. doi: 10.3322/caac.21663
3. Guinney J, Dienstmann R, Wang X, de Reyniès A, Schlicker A, Soneson C, et al. The consensus molecular subtypes of colorectal cancer. Nat Med (2015) 21:1350–6. doi: 10.1038/nm.3967
4. Vasan N, Baselga J. Hyman DM. A view Drug resistance cancer. Nat (2019) 575:299–309. doi: 10.1038/s41586-019-1730-1
5. Waldman AD, Fritz JM. Lenardo MJ. A guide to Cancer immunotherapy: T Cell basic Sci to Clin practice. Nat Rev Immunol (2020) 20:651–68. doi: 10.1038/s41577-020-0306-5
6. Mahoney KM, Rennert PD, Freeman GJ. Combination cancer immunotherapy and new immunomodulatory targets. Nat Rev Drug Discovery (2015) 14:561–84. doi: 10.1038/nrd4591
7. Korman AJ, Garrett-Thomson SC, Lonberg N. The foundations of immune checkpoint blockade and the ipilimumab approval decennial. Nat Rev Drug Discovery (2021) 21(7):509–28. doi: 10.1038/s41573-021-00345-8
8. Ganesh K, Stadler ZK, Cercek A, Mendelsohn RB, Shia J, Segal NH, et al. Immunotherapy in colorectal cancer: rationale, challenges and potential. Nat Rev Gastroenterol Hepatol (2019) 16:361–75. doi: 10.1038/s41575-019-0126-x
9. Büll C, Heise T, Adema GJ, Boltje TJ. Sialic acid mimetics to target the sialic acid-siglec axis. Trends Biochem Sci (2016) 41:519–31. doi: 10.1016/j.tibs.2016.03.007
10. Li F, Ding J. Sialylation is involved in cell fate decision during development, reprogramming and cancer progression. Protein Cell (2019) 10:550–65. doi: 10.1007/s13238-018-0597-5
11. Macauley MS, Crocker PR, Paulson JC. Siglec-mediated regulation of immune cell function in disease. Nat Rev Immunol (2014) 14:653–66. doi: 10.1038/nri3737
12. Vuchkovska A, Glanville DG, Scurti GM, Nishimura MI, White P, Ulijasz AT, et al. Siglec-5 is an inhibitory immune checkpoint molecule for human T cells. Immunology (2022) 166(2):238–48. doi: 10.1111/imm.13470
13. Ikehara Y, Ikehara SK, Paulson JC. Negative regulation of T cell receptor signaling by siglec-7 (p70/AIRM) and siglec-9. J Biol Chem (2004) 279:43117–25. doi: 10.1074/jbc.M403538200
14. Läubli H, Pearce OM, Schwarz F, Siddiqui SS, Deng L, Stanczak MA, et al. Engagement of myelomonocytic siglecs by tumor-associated ligands modulates the innate immune response to cancer. Proc Natl Acad Sci U.S.A. (2014) 111:14211–6. doi: 10.1073/pnas.1409580111
15. Barkal AA, Brewer RE, Markovic M, Kowarsky M, Barkal SA, Zaro BW, et al. CD24 signalling through macrophage siglec-10 is a target for cancer immunotherapy. Nature (2019) 572:392–6. doi: 10.1038/s41586-019-1456-0
16. Hiruma Y, Hirai T, Tsuda E. Siglec-15, a member of the sialic acid-binding lectin, is a novel regulator for osteoclast differentiation. Biochem Biophys Res Commun (2011) 409:424–9. doi: 10.1016/j.bbrc.2011.05.015
17. Wang J, Sun J, Liu LN, Flies DB, Nie X, Toki M, et al. Siglec-15 as an immune suppressor and potential target for normalization cancer immunotherapy. Nat Med (2019) 25:656–66. doi: 10.1038/s41591-019-0374-x
18. Seales EC, Jurado GA, Brunson BA, Wakefield JK, Frost AR, Bellis SL. Hypersialylation of beta1 integrins, observed in colon adenocarcinoma, may contribute to cancer progression by up-regulating cell motility. Cancer Res (2005) 65:4645–52. doi: 10.1158/0008-5472.Can-04-3117
19. Lee M, Lee HJ, Bae S, Lee YS. Protein sialylation by sialyltransferase involves radiation resistance. Mol Cancer Res (2008) 6:1316–25. doi: 10.1158/1541-7786.Mcr-07-2209
20. Collins BE, Smith BA, Bengtson P, Paulson JC. Ablation of CD22 in ligand-deficient mice restores b cell receptor signaling. Nat Immunol (2006) 7:199–206. doi: 10.1038/ni1283
21. Duan S, Paulson JC. Siglecs as immune cell checkpoints in disease. Annu Rev Immunol (2020) 38:365–95. doi: 10.1146/annurev-immunol-102419-035900
22. Frankish A, Diekhans M, Jungreis I, Lagarde J, Loveland JE, Mudge JM, et al. GENCODE 2021. Nucleic Acids Res (2021) 49:D916–d23. doi: 10.1093/nar/gkaa1087
23. Sethi MK, Hancock WS, Fanayan S. Identifying n-glycan biomarkers in colorectal cancer by mass spectrometry. Acc Chem Res (2016) 49:2099–106. doi: 10.1021/acs.accounts.6b00193
24. Luo ML, Li J, Shen L, Chu J, Guo Q, Liang G, et al. The role of APAL/ST8SIA6-AS1 lncRNA in PLK1 activation and mitotic catastrophe of tumor cells. J Natl Cancer Inst (2020) 112:356–68. doi: 10.1093/jnci/djz134
25. Liu B, Pan S, Xiao Y, Liu Q, Xu J, Jia L. LINC01296/miR-26a/GALNT3 axis contributes to colorectal cancer progression by regulating O-glycosylated MUC1 via PI3K/AKT pathway. J Exp Clin Cancer Res (2018) 37:316. doi: 10.1186/s13046-018-0994-x
26. Gong A, Zhao X, Pan Y, Qi Y, Li S, Huang Y, et al. The lncRNA MEG3 mediates renal cell cancer progression by regulating ST3Gal1 transcription and EGFR sialylation. J Cell Sci (2020) 133(16). doi: 10.1242/jcs.244020
27. Hu J, Shan Y, Ma J, Pan Y, Zhou H, Jiang L, et al. LncRNA ST3Gal6-AS1/ST3Gal6 axis mediates colorectal cancer progression by regulating α-2,3 sialylation via PI3K/Akt signaling. Int J Cancer (2019) 145:450–60. doi: 10.1002/ijc.32103
28. Du Q, Xiao RD, Luo RG, Xie JB, Su ZD, Wang Y. Construction of long non-coding RNA- and microRNA-mediated competing endogenous RNA networks in alcohol-related esophageal cancer. PloS One (2022) 17:e0269742. doi: 10.1371/journal.pone.0269742
29. Zhi Q, Wan D, Ren R, Xu Z, Guo X, Han Y, et al. Circular RNA profiling identifies circ102049 as a key regulator of colorectal liver metastasis. Mol Oncol (2021) 15:623–41. doi: 10.1002/1878-0261.12840
30. Mayakonda A, Lin DC, Assenov Y, Plass C, Koeffler HP. Maftools: efficient and comprehensive analysis of somatic variants in cancer. Genome Res (2018) 28:1747–56. doi: 10.1101/gr.239244.118
31. Liberzon A, Birger C, Thorvaldsdóttir H, Ghandi M, Mesirov JP, Tamayo P. The molecular signatures database (MSigDB) hallmark gene set collection. Cell Syst (2015) 1:417–25. doi: 10.1016/j.cels.2015.12.004
32. Liberzon A, Subramanian A, Pinchback R, Thorvaldsdóttir H, Tamayo P, Mesirov JP. Molecular signatures database (MSigDB) 3.0. Bioinformatics (2011) 27:1739–40. doi: 10.1093/bioinformatics/btr260
33. Subramanian A, Tamayo P, Mootha VK, Mukherjee S, Ebert BL, Gillette MA, et al. Gene set enrichment analysis: a knowledge-based approach for interpreting genome-wide expression profiles. Proc Natl Acad Sci U.S.A. (2005) 102:15545–50. doi: 10.1073/pnas.0506580102
34. Ritchie ME, Phipson B, Wu D, Hu Y, Law CW, Shi W, et al. Limma powers differential expression analyses for RNA-sequencing and microarray studies. Nucleic Acids Res (2015) 43:e47. doi: 10.1093/nar/gkv007
35. Robinson MD, McCarthy DJ, Smyth GK. edgeR: a bioconductor package for differential expression analysis of digital gene expression data. Bioinformatics (2010) 26:139–40. doi: 10.1093/bioinformatics/btp616
36. McCarthy DJ, Chen Y, Smyth GK. Differential expression analysis of multifactor RNA-seq experiments with respect to biological variation. Nucleic Acids Res (2012) 40:4288–97. doi: 10.1093/nar/gks042
37. Chen Y, Lun AT, Smyth GK. From reads to genes to pathways: differential expression analysis of RNA-seq experiments using rsubread and the edgeR quasi-likelihood pipeline. F1000Res (2016) 5:1438. doi: 10.12688/f1000research.8987.2
38. Wu T, Hu E, Xu S, Chen M, Guo P, Dai Z, et al. clusterProfiler 4.0: A universal enrichment tool for interpreting omics data. Innovation (Camb) (2021) 2:100141. doi: 10.1016/j.xinn.2021.100141
39. Li T, Fu J, Zeng Z, Cohen D, Li J, Chen Q, et al. TIMER2.0 for analysis of tumor-infiltrating immune cells. Nucleic Acids Res (2020) 48:W509–w14. doi: 10.1093/nar/gkaa407
40. Li T, Fan J, Wang B, Traugh N, Chen Q, Liu JS, et al. TIMER: A web server for comprehensive analysis of tumor-infiltrating immune cells. Cancer Res (2017) 77:e108–e10. doi: 10.1158/0008-5472.Can-17-0307
41. Newman AM, Liu CL, Green MR, Gentles AJ, Feng W, Xu Y, et al. Robust enumeration of cell subsets from tissue expression profiles. Nat Methods (2015) 12:453–7. doi: 10.1038/nmeth.3337
42. Becht E, Giraldo NA, Lacroix L, Buttard B, Elarouci N, Petitprez F, et al. Estimating the population abundance of tissue-infiltrating immune and stromal cell populations using gene expression. Genome Biol (2016) 17:218. doi: 10.1186/s13059-016-1070-5
43. Racle J, de Jonge K, Baumgaertner P, Speiser DE, Gfeller D. Simultaneous enumeration of cancer and immune cell types from bulk tumor gene expression data. Elife (2017) 6. doi: 10.7554/eLife.26476
44. Yang W, Soares J, Greninger P, Edelman EJ, Lightfoot H, Forbes S, et al. Genomics of drug sensitivity in cancer (GDSC): a resource for therapeutic biomarker discovery in cancer cells. Nucleic Acids Res (2013) 41:D955–61. doi: 10.1093/nar/gks1111
45. Rees MG, Seashore-Ludlow B, Cheah JH, Adams DJ, Price EV, Gill S, et al. Correlating chemical sensitivity and basal gene expression reveals mechanism of action. Nat Chem Biol (2016) 12:109–16. doi: 10.1038/nchembio.1986
46. Seashore-Ludlow B, Rees MG, Cheah JH, Cokol M, Price EV, Coletti ME, et al. Harnessing connectivity in a Large-scale small-molecule sensitivity dataset. Cancer Discovery (2015) 5:1210–23. doi: 10.1158/2159-8290.Cd-15-0235
47. Basu A, Bodycombe NE, Cheah JH, Price EV, Liu K, Schaefer GI, et al. An interactive resource to identify cancer genetic and lineage dependencies targeted by small molecules. Cell (2013) 154:1151–61. doi: 10.1016/j.cell.2013.08.003
48. Corsello SM, Nagari RT, Spangler RD, Rossen J, Kocak M, Bryan JG, et al. Non-oncology drugs are a source of previously unappreciated anti-cancer activity. bioRxiv (2019), 730119. doi: 10.1101/730119
49. Maeser D, Gruener RF, Huang RS. oncoPredict: an r package for predicting in vivo or cancer patient drug response and biomarkers from cell line screening data. Brief Bioinform (2021) 22(6). doi: 10.1093/bib/bbab260
50. Lin SH, Raju GS, Huff C, Ye Y, Gu J, Chen JS, et al. The somatic mutation landscape of premalignant colorectal adenoma. Gut (2018) 67:1299–305. doi: 10.1136/gutjnl-2016-313573
51. Isella C, Terrasi A, Bellomo SE, Petti C, Galatola G, Muratore A, et al. Stromal contribution to the colorectal cancer transcriptome. Nat Genet (2015) 47:312–9. doi: 10.1038/ng.3224
52. Rody A, Holtrich U, Pusztai L, Liedtke C, Gaetje R, Ruckhaeberle E, et al. T-Cell metagene predicts a favorable prognosis in estrogen receptor-negative and HER2-positive breast cancers. Breast Cancer Res (2009) 11:R15. doi: 10.1186/bcr2234
53. Hou Y, Zhang R, Zong J, Wang W, Zhou M, Yan Z, et al. Comprehensive analysis of a cancer-immunity cycle-based signature for predicting prognosis and immunotherapy response in patients with colorectal cancer. Front Immunol (2022) 13:892512. doi: 10.3389/fimmu.2022.892512
54. Yue T, Chen S, Zhu J, Guo S, Huang Z, Wang P, et al. The aging-related risk signature in colorectal cancer. Aging (Albany NY) (2021) 13:7330–49. doi: 10.18632/aging.202589
55. Lin D, Fan W, Zhang R, Zhao E, Li P, Zhou W, et al. Molecular subtype identification and prognosis stratification by a metabolism-related gene expression signature in colorectal cancer. J Transl Med (2021) 19:279. doi: 10.1186/s12967-021-02952-w
56. Ji L, Chen S, Gu L, Zhang X. Exploration of potential roles of m6A regulators in colorectal cancer prognosis. Front Oncol (2020) 10:768. doi: 10.3389/fonc.2020.00768
57. Su W, Xu M, Chen X, Chen N, Gong J, Nie L, et al. Long noncoding RNA ZEB1-AS1 epigenetically regulates the expressions of ZEB1 and downstream molecules in prostate cancer. Mol Cancer (2017) 16:142. doi: 10.1186/s12943-017-0711-y
58. Gong H, Wen H, Zhu X, Lian Y, Yang X, Qian Z, et al. High expression of long non-coding RNA ZEB1-AS1 promotes colorectal cancer cell proliferation partially by suppressing p15 expression. Tumour Biol (2017) 39:1010428317705336. doi: 10.1177/1010428317705336
59. Tseng HH, Chen YZ, Chou NH, Chen YC, Wu CC, Liu LF, et al. Metformin inhibits gastric cancer cell proliferation by regulation of a novel Loc100506691-CHAC1 axis. Mol Ther Oncolytics (2021) 22:180–94. doi: 10.1016/j.omto.2021.08.006
60. Lin X, Zhuang S, Chen X, Du J, Zhong L, Ding J, et al. lncRNA ITGB8-AS1 functions as a ceRNA to promote colorectal cancer growth and migration through integrin-mediated focal adhesion signaling. Mol Ther (2022) 30:688–702. doi: 10.1016/j.ymthe.2021.08.011
61. Dorn A, Glaß M, Neu CT, Heydel B, Hüttelmaier S, Gutschner T, et al. LINC00261 is differentially expressed in pancreatic cancer subtypes and regulates a pro-epithelial cell identity. Cancers (Basel) (2020) 12(5). doi: 10.3390/cancers12051227
62. Liu S, Zheng Y, Zhang Y, Zhang J, Xie F, Guo S, et al. Methylation-mediated LINC00261 suppresses pancreatic cancer progression by epigenetically inhibiting c-myc transcription. Theranostics (2020) 10:10634–51. doi: 10.7150/thno.44278
63. Zhai S, Xu Z, Xie J, Zhang J, Wang X, Peng C, et al. Epigenetic silencing of LncRNA LINC00261 promotes c-myc-mediated aerobic glycolysis by regulating miR-222-3p/HIPK2/ERK axis and sequestering IGF2BP1. Oncogene (2021) 40:277–91. doi: 10.1038/s41388-020-01525-3
64. Yu Y, Li L, Zheng Z, Chen S, Chen E, Hu Y. Long non-coding RNA linc00261 suppresses gastric cancer progression via promoting slug degradation. J Cell Mol Med (2017) 21:955–67. doi: 10.1111/jcmm.13035
65. Zhang HF, Li W, Han YD. LINC00261 suppresses cell proliferation, invasion and notch signaling pathway in hepatocellular carcinoma. Cancer biomark (2018) 21:575–82. doi: 10.3233/cbm-170471
66. Chen Z, Xiang L, Hu Z, Ou H, Liu X, Yu L, et al. Epigenetically silenced linc00261 contributes to the metastasis of hepatocellular carcinoma via inducing the deficiency of FOXA2 transcription. Am J Cancer Res (2021) 11:277–96.
67. Chen Z, Xiang L, Li L, Ou H, Fang Y, Xu Y, et al. TGF-β1 induced deficiency of linc00261 promotes epithelial-mesenchymal-transition and stemness of hepatocellular carcinoma via modulating SMAD3. J Transl Med (2022) 20:75. doi: 10.1186/s12967-022-03276-z
68. Yan D, Liu W, Liu Y, Luo M. LINC00261 suppresses human colon cancer progression via sponging miR-324-3p and inactivating the wnt/β-catenin pathway. J Cell Physiol (2019) 234:22648–56. doi: 10.1002/jcp.28831
69. Kandimalla R, Tomihara H, Banwait JK, Yamamura K, Singh G, Baba H, et al. A 15-gene immune, stromal, and proliferation gene signature that significantly associates with poor survival in patients with pancreatic ductal adenocarcinoma. Clin Cancer Res (2020) 26:3641–8. doi: 10.1158/1078-0432.Ccr-19-4044
70. Wu Z, Lu Z, Li L, Ma M, Long F, Wu R, et al. Identification and validation of ferroptosis-related LncRNA signatures as a novel prognostic model for colon cancer. Front Immunol (2021) 12:783362. doi: 10.3389/fimmu.2021.783362
71. Li X, Li Y, Yu X, Jin F. Identification and validation of stemness-related lncRNA prognostic signature for breast cancer. J Transl Med (2020) 18:331. doi: 10.1186/s12967-020-02497-4
72. Wiseman BS, Werb Z. Stromal effects on mammary gland development and breast cancer. Science (2002) 296:1046–9. doi: 10.1126/science.1067431
73. Kalluri R. The biology and function of fibroblasts in cancer. Nat Rev Cancer (2016) 16:582–98. doi: 10.1038/nrc.2016.73
74. Ostman A, Augsten M. Cancer-associated fibroblasts and tumor growth–bystanders turning into key players. Curr Opin Genet Dev (2009) 19:67–73. doi: 10.1016/j.gde.2009.01.003
75. Kobayashi H, Enomoto A, Woods SL, Burt AD, Takahashi M, Worthley DL. Cancer-associated fibroblasts in gastrointestinal cancer. Nat Rev Gastroenterol Hepatol (2019) 16:282–95. doi: 10.1038/s41575-019-0115-0
76. Chen YF, Yu ZL, Lv MY, Cai ZR, Zou YF, Lan P, et al. Cancer-associated fibroblasts impact the clinical outcome and treatment response in colorectal cancer via immune system modulation: a comprehensive genome-wide analysis. Mol Med (2021) 27:139. doi: 10.1186/s10020-021-00402-3
77. Park JJ, Yi JY, Jin YB, Lee YJ, Lee JS, Lee YS, et al. Sialylation of epidermal growth factor receptor regulates receptor activity and chemosensitivity to gefitinib in colon cancer cells. Biochem Pharmacol (2012) 83:849–57. doi: 10.1016/j.bcp.2012.01.007
78. Schultz MJ, Swindall AF, Wright JW, Sztul ES, Landen CN, Bellis SL. ST6Gal-I sialyltransferase confers cisplatin resistance in ovarian tumor cells. J Ovarian Res (2013) 6:25. doi: 10.1186/1757-2215-6-25
79. Ou L, He X, Liu N, Song Y, Li J, Gao L, et al. Sialylation of FGFR1 by ST6Gal−I overexpression contributes to ovarian cancer cell migration and chemoresistance. Mol Med Rep (2020) 21:1449–60. doi: 10.3892/mmr.2020.10951
80. Wu MM, Zhang Z, Tong CWS, Yan VW, Cho WCS, To KKW. Repurposing of niclosamide as a STAT3 inhibitor to enhance the anticancer effect of chemotherapeutic drugs in treating colorectal cancer. Life Sci (2020) 262:118522. doi: 10.1016/j.lfs.2020.118522
81. Liu B, Liu Q, Pan S, Huang Y, Qi Y, Li S, et al. The HOTAIR/miR-214/ST6GAL1 crosstalk modulates colorectal cancer procession through mediating sialylated c-met via JAK2/STAT3 cascade. J Exp Clin Cancer Res (2019) 38:455. doi: 10.1186/s13046-019-1468-5
82. Xiong WC, Han N, Wu N, Zhao KL, Han C, Wang HX, et al. Interplay between long noncoding RNA ZEB1-AS1 and miR-101/ZEB1 axis regulates proliferation and migration of colorectal cancer cells. Am J Transl Res (2018) 10:605–17.
83. Fernández-Rodríguez J, Feijoo-Carnero C, Merino-Trigo A, Páez de la Cadena M, Rodríguez-Berrocal FJ, de Carlos A, et al. Immunohistochemical analysis of sialic acid and fucose composition in human colorectal adenocarcinoma. Tumour Biol (2000) 21:153–64. doi: 10.1159/000030122
Keywords: sialylation, long noncoding RNA, colorectal cancer, prognostic signature, immune microenvironment
Citation: Zhou M, Lv S, Hou Y, Zhang R, Wang W, Yan Z, Li T, Gan W, Zeng Z, Zhang F and Yang M (2022) Characterization of sialylation-related long noncoding RNAs to develop a novel signature for predicting prognosis, immune landscape, and chemotherapy response in colorectal cancer. Front. Immunol. 13:994874. doi: 10.3389/fimmu.2022.994874
Received: 15 July 2022; Accepted: 03 October 2022;
Published: 18 October 2022.
Edited by:
Heinz Laubli, University Hospital of Basel, SwitzerlandReviewed by:
Shoib Sarwar Siddiqui, University of Hertfordshire, United KingdomCopyright © 2022 Zhou, Lv, Hou, Zhang, Wang, Yan, Li, Gan, Zeng, Zhang and Yang. This is an open-access article distributed under the terms of the Creative Commons Attribution License (CC BY). The use, distribution or reproduction in other forums is permitted, provided the original author(s) and the copyright owner(s) are credited and that the original publication in this journal is cited, in accordance with accepted academic practice. No use, distribution or reproduction is permitted which does not comply with these terms.
*Correspondence: Min Yang, bWlueWFuZ0BpbW0uYWMuY24=
Disclaimer: All claims expressed in this article are solely those of the authors and do not necessarily represent those of their affiliated organizations, or those of the publisher, the editors and the reviewers. Any product that may be evaluated in this article or claim that may be made by its manufacturer is not guaranteed or endorsed by the publisher.
Research integrity at Frontiers
Learn more about the work of our research integrity team to safeguard the quality of each article we publish.