 Menglian Zou
- 1Department of Gastroenterology, State Key Laboratory of Complex Severe and Rare Diseases, Peking Union Medical College Hospital, Chinese Academy of Medical Sciences & Peking Union Medical College, Beijing, China
- 2Department of Medical Research Center, State Key Laboratory of Complex Severe and Rare Diseases, Peking Union Medical College Hospital, Chinese Academy of Medical Science & Peking Union Medical College, Beijing, China
Background: Acute necrotizing pancreatitis (NP), a severe form of acute pancreatitis (AP), has higher mortality and worse outcome than non-necrotizing pancreatitis (non-NP). Infected NP is a devastating subgroup of NP. To date neither NP nor infected NP has robust prediction strategies, which may delay early recognition and timely intervention. Recent studies revealed correlations between disturbed gut microbiota and AP severity. Some features of intestinal microbiota have the potential to become biomarkers for NP prediction.
Methods: We performed 16S rRNA sequencing to analyze gut microbiota features in 20 healthy controls (HC), and 58 AP patients on hospital admission. The AP patients were later classified into NP and non-NP groups based on subsequent diagnostic imaging features. Random forest regression model and ROC curve were applied for NP and infected NP prediction. PIRCUSt2 was used for bacterial functional pathway prediction analysis.
Results: We found that the three groups (HC, NP, and non-NP) had distinct microorganism composition. NP patients had reduced microbial diversity, higher abundance of Enterobacteriales, but lower abundance of Clostridiales and Bacteroidales compared with the non-NP group. Correlation analyses displayed that intestine bacterial taxonomic alterations were related to severity, ICU admission, and prognosis. By pathway prediction, species more abundant in NP patients had positive correlation with synthesis and degradation of ketone bodies, and benzoate degradation. Enterococcus faecium (ASV2) performed best in discriminating NP and non-NP patients. Finegoldia magna (ASV3) showed the maximal prediction capacity among all ASVs and had comparable accuracy with Balthazar CT to detect patients with infected NP.
Conclusions: Our study suggests that NP patients have distinct intestinal microbiota on admission compared to non-NP patients. Dysbiosis of intestinal microbiota might influence NP progression through ketone body or benzoate metabolism. Enterococcus faecium and Finegoldia magna are potential predictors for NP and infected NP. Our findings explore biomarkers which may inform clinical decision-making in AP and shed light on further studies on NP pathophysiology and management.
Introduction
Acute pancreatitis (AP) is a leading cause for acute admission due to gastrointestinal diseases and results in enormous morbidity and mortality (1, 2). The incidence of AP is around 34 per 100,000 cases worldwide, and the overall incidence increases by 3.07% per year, inducing substantial medical and social burden (3, 4).
There are two subtypes of AP: interstitial edematous pancreatitis and necrotizing pancreatitis. Necrotizing pancreatitis (NP), a non-mild AP manifestation, represents (peri-)pancreatic parenchymal necrosis and accounts for 10%-20% of AP patients (5, 6). Developing NP leads to unfavorable prognosis, that is, the mortality is about 15%, and for those with infected NP (INP), even as high as 30%-39% (7). Early recognition of patients who are prone to develop NP is crucial, particularly on clinical admission, because proper triage, close monitoring, early intervention, and multidisciplinary treatment may prevent organ dysfunction and lethal outcome (8). Timely aggressive antibiotic treatment and proper drainage or debridement is indicated in patients with infected NP. Therefore, early prediction of NP with or without infection is of clinical significance.
However, neither etiologic factors (gallstones, alcohol use, etc.) nor demographics features are conclusively risk factors to necrosis formation (9). A series of studies have evaluated the prediction potential of a variety of biomarkers and scoring systems for NP or infected NP, but none are robust enough. Some studies have investigated lab indicators for necrosis prediction, but none have been solid (10, 11). Existing scoring systems, for instance the Ranson score, the acute physiology and chronic health evaluation-II (APACHE-II), the computed tomography severity index (CTSI), or the Bedside Index of Severity in Acute Pancreatitis (BISAP) could not differentiate the aseptic or infected necrosis (12). Thus more efficient and cost-effective methods for prediction of NP and infected NP are needed.
Recent decades have witnessed that gut microbiota alteration were closely related to the progression of AP. Around 60% of patients with AP had varying degrees of intestinal barrier injury, which led to increased intestinal mucosal permeability and intestinal bacterial translocation, furthering the exacerbation of NP, presumably developing MODS in the end (13). Moreover, a previous study indicated that severe AP (SAP) had a lower relative abundance of beneficial bacteria (Bifidobacterium etc.), and a higher relative abundance of potentially pathogenic bacteria (Enterococcus etc.), in comparison with MAP patients (14). These studies inspired the potential role of the microbiota in NP progression. It has been evidenced that (peri-)pancreatic collections are liable to be infected with gut microorganisms (15). Thus, gut microbiome may help with pathogen prediction and antibiotic selection. Therefore, clarifying the role of dysbiosis in NP will not only enrich our knowledge regarding the “gut microbiota-pancreas axis”, but also shed light on suitable therapy.
To determine the prediction potential of gut microbiota for NP outcome on admission, we performed a prospective, observational study. We studied the association between intestinal microflora and the prognosis of patients with NP to unveil potential microbiota biomarkers and lay the foundation for future research translation. We hypothesized that key features of the gut microbiome (diversity, community composition, certain ASVs) would predict exacerbation of NP patients on admission.
Materials and methods
Study population and sample collection
We performed a prospective, observational study in a single center. We enrolled 20 healthy controls and 58 AP patients at Peking Union Medical College Hospital (PUMCH), Beijing, China. Healthy controls were community workers or students enrolled from PUMCH who were age and gender matched to the patient population. They were free of intestinal, metabolic, cardiovascular or cerebrovascular diseases. Female volunteers were not pregnant. They were with no known allergens. They were neither on any treatment interfering bowel function, nor on any specific diet for weight loss or certain goals. Patients were selected from our database by a stratified random sampling method. Patients diagnosed with AP based on the Revised Atlanta Classification were included (5). Enrolled patients must be admitted within 24 h after symptom onset. Exclusion criteria included cancer, chronic pancreatitis, gastroenteritis, inflammatory bowel disease (IBD), irritable bowel syndrome (IBS), necrotizing enterocolitis, and immunocompromised status. Patients on antibiotics, probiotics, Chinese herbs, or laxatives within two months before enrollment were also excluded. All enrolled patients provided informed consent. Our study was approved by the PUMCH Ethics Committee (Identifier: JS1826, Date of approval: 20th February 2018. Period of validity: February 2018 to August 2020). All clinical characteristics were recorded according to standard procedures. Peripheral venous blood from the participants was tested on admission and through disease progression. We collected stool samples with rectal swabs from each participant on admission. Protocols of sample and data collection were described previously (16, 17).
Demographic and clinical data
We went through medical records to extract clinical data, such as gender, age, weight, height, comorbidities, lab results, imaging studies, severity stratification, complications, and outcomes. AP was graded into mild AP (MAP), moderately severe AP (MSAP), and severe AP (SAP) (5). NP was defined as pancreatic and/or peripancreatic necrosis (5). Infected NP was either diagnosed based on a positive culture of fine needle aspiration (FNA) of pancreatic and/or peripancreatic necrosis, or the presence of gas in CECT, or the positive culture from the first drainage procedure under sterile conditions. The APACHE II (18), the Balthazar scores (19), and the Sequential Organ Failure Assessment (SOFA) scores (20), were used to evaluate disease severity when NP patients were distinguished from non-NP patients. Local and systematic complications were also defined according to past studies (5, 21). Local complications consisted of acute peripancreatic fluid collection (APFC), acute necrotic collection (ANC), walled-off necrosis (WON), pseudocyst, and infected necrosis. Systematic complications comprised systemic inflammatory response syndrome (SIRS), acute respiratory distress syndrome (ARDS), shock, acute kidney injury (AKI), altered mental status, myocardial injury, liver damage, abdominal compartment syndrome (ACS), and bowel obstruction. Mortality, organ failure, duration of hospital stay, and days of ICU stay were chosen as clinical outcomes.
DNA collection and extraction, 16S rRNA gene sequencing and processing
Microbial DNA samples were extracted from rectal swab as previously described using the bead-beating method (22) and then went through gel electrophoresis to determine the quality of the DNA sample. DNA was diluted to 1 ng/L with sterile water and then served as templates to run PCR to amplify the V3-V4 regions (23). High-fidelity enzymes, Phusion® High-Fidelity PCR Master Mix with GC Buffer (New England Biolabs, Ipswich, MA, USA), and primers with Barcode were employed for PCR. After establishing a sequencing library of 16S rRNA V3-V4 regions, an Illumina MiSeq platform (Illumina Inc., San Diego, CA, USA) was used to pool and sequence the purified amplicons.
The bioinformatic analyses of 16s amplicons were accomplished relying on the EasyAmplicon (Version 1.10) (24). Dereplication was achieved by VSEARCH (version 2.15) (25) and the sequences were then denoised into amplicon sequence variants (ASV) with the implemented command in USEARCH (Version 10.0) (26), and an ASV table was generated. The sintax algorithm of USEARCH recognized taxonomic classification of ASVs according to the Ribosomal Database Project (RDP) training set v16 (27).
Sequencing data analysis and visualization
The R package vegan (v2.5-6) was applied on Alpha diversity analysis (28). Differences in richness index were evaluated by Turkey’s HSD test. The usearch achieved the weighted UniFrac distance matrix. PCoA (Principal coordinate analysis) was utilized to calculate beta diversity, and Adonis test was applied to verify the difference among groups. The R package ggplot2 visualized the alpha and beta diversity. A Venn diagram illustrating overlapping ASVs among the three groups was created by the R package VennDiagram.
The taxonomic composition was presented either as a stacked bar plot or a chord plot at different taxonomic levels by the ggplot2 package. As for between-group ASV comparisons, the EdgeR method was utilized to calculate the p-value and identify taxonomic features significantly different among groups, and FDR was calculated using the Benjamini-Hochberg method. The volcano plot and Manhattan plot exhibited differential ASVs among groups. Linear discriminant analysis effect size (LEfSe) (http://huttenhower.sph.harvard.edu/galaxy) was utilized for comparison of the intestinal microbiome composition.
Feature selection by random forest model
Using 16s sequence profiles and clinical parameters, we randomly divided the samples into a training set and a testing set. We built up a random forest regression model to establish a training set for 70% of the samples and a testing set for the remaining 30% using the R package randomForest. Then, tenfold cross-validation method was applied to the training set. An optimal set of microbial variables was built at the lowest cross-validation error to predict the AP severity, as evaluated by the APACHE II index. We constructed the predictive model with the most important variables, which further went through ROC calculation to distinguish NP patients from non-NP. The pROC R package was used to calculate the confidence intervals for the ROC curves.
Prediction of gut microbiota phenotype
The USEARCH-otutab command classified the sequences based on the Greengene database (29). Then, the sequence library was further processed by Bugbase for phenotype prediction of gut flora (30). As for pathway prediction analysis, we used PICRUSt2 to predict the possible functional composition based on GO and KEGG database (31). STAMP software (v2.1.3) was used for statistical comparison of the predicted pathways of the microbial community (Welch’s t-test).
Results
Clinical characteristics of enrolled patients
The study enrolled a total of 58 AP patients and 20 healthy controls. The AP patients were classified into NP and non-NP groups based on a careful evaluation on diagnostic imaging. Table 1 demonstrated the demographic and clinical features of these two groups. The non-NP group had a lower CRP level (median 115.0, IQR 21.5-160.0 vs. median 160.0, IQR 131.8-232.1; p < 0.001) than the NP group. Several scoring systems including APACHE II, SOFA, and Balthazar score were significantly different (p < 0.001) between the groups. Furthermore, the NP group had a higher risk of SAP development (89.5% vs. 2.6%, p < 0.001), and certain systematic complications including SIRS (89.5% vs. 28.2%, p < 0.001), ARDS (73.7% vs. 17.9%, p < 0.001), AKI (42.1% vs. 10.3%, p = 0.005), shock (36.8% vs. 2.6%, p < 0.001), ACS (26.3% vs. 5.1%, p = 0.021), liver damage (42.1% vs. 5.1%, p = 0.001), myocardial injury (26.3% vs. 0.0%, p = 0.001), and sepsis (47.4% vs. 7.7%, p = 0.001) compared to the non-NP group. Besides, more NP patients were complicated with organ failure (84.2% vs. 20.5%, p < 0.001) and ICU admission (89.5% vs. 7.7%, p < 0.001). And NP patients had a longer organ failure duration (median 74.0, IQR 48.0-276.0 vs. median 0.0, IQR 0.0-0.0; p < 0.001), a longer ICU stay (median 7.0, IQR 5.0-10.5 vs. median 0.0, IQR 0.0-0.0; p < 0.001), and a longer hospital stay (median 23.0, IQR 17.5-30.0 vs. median 6.0, IQR 3.0-11.5; p < 0.001) compared with non-NP patients.
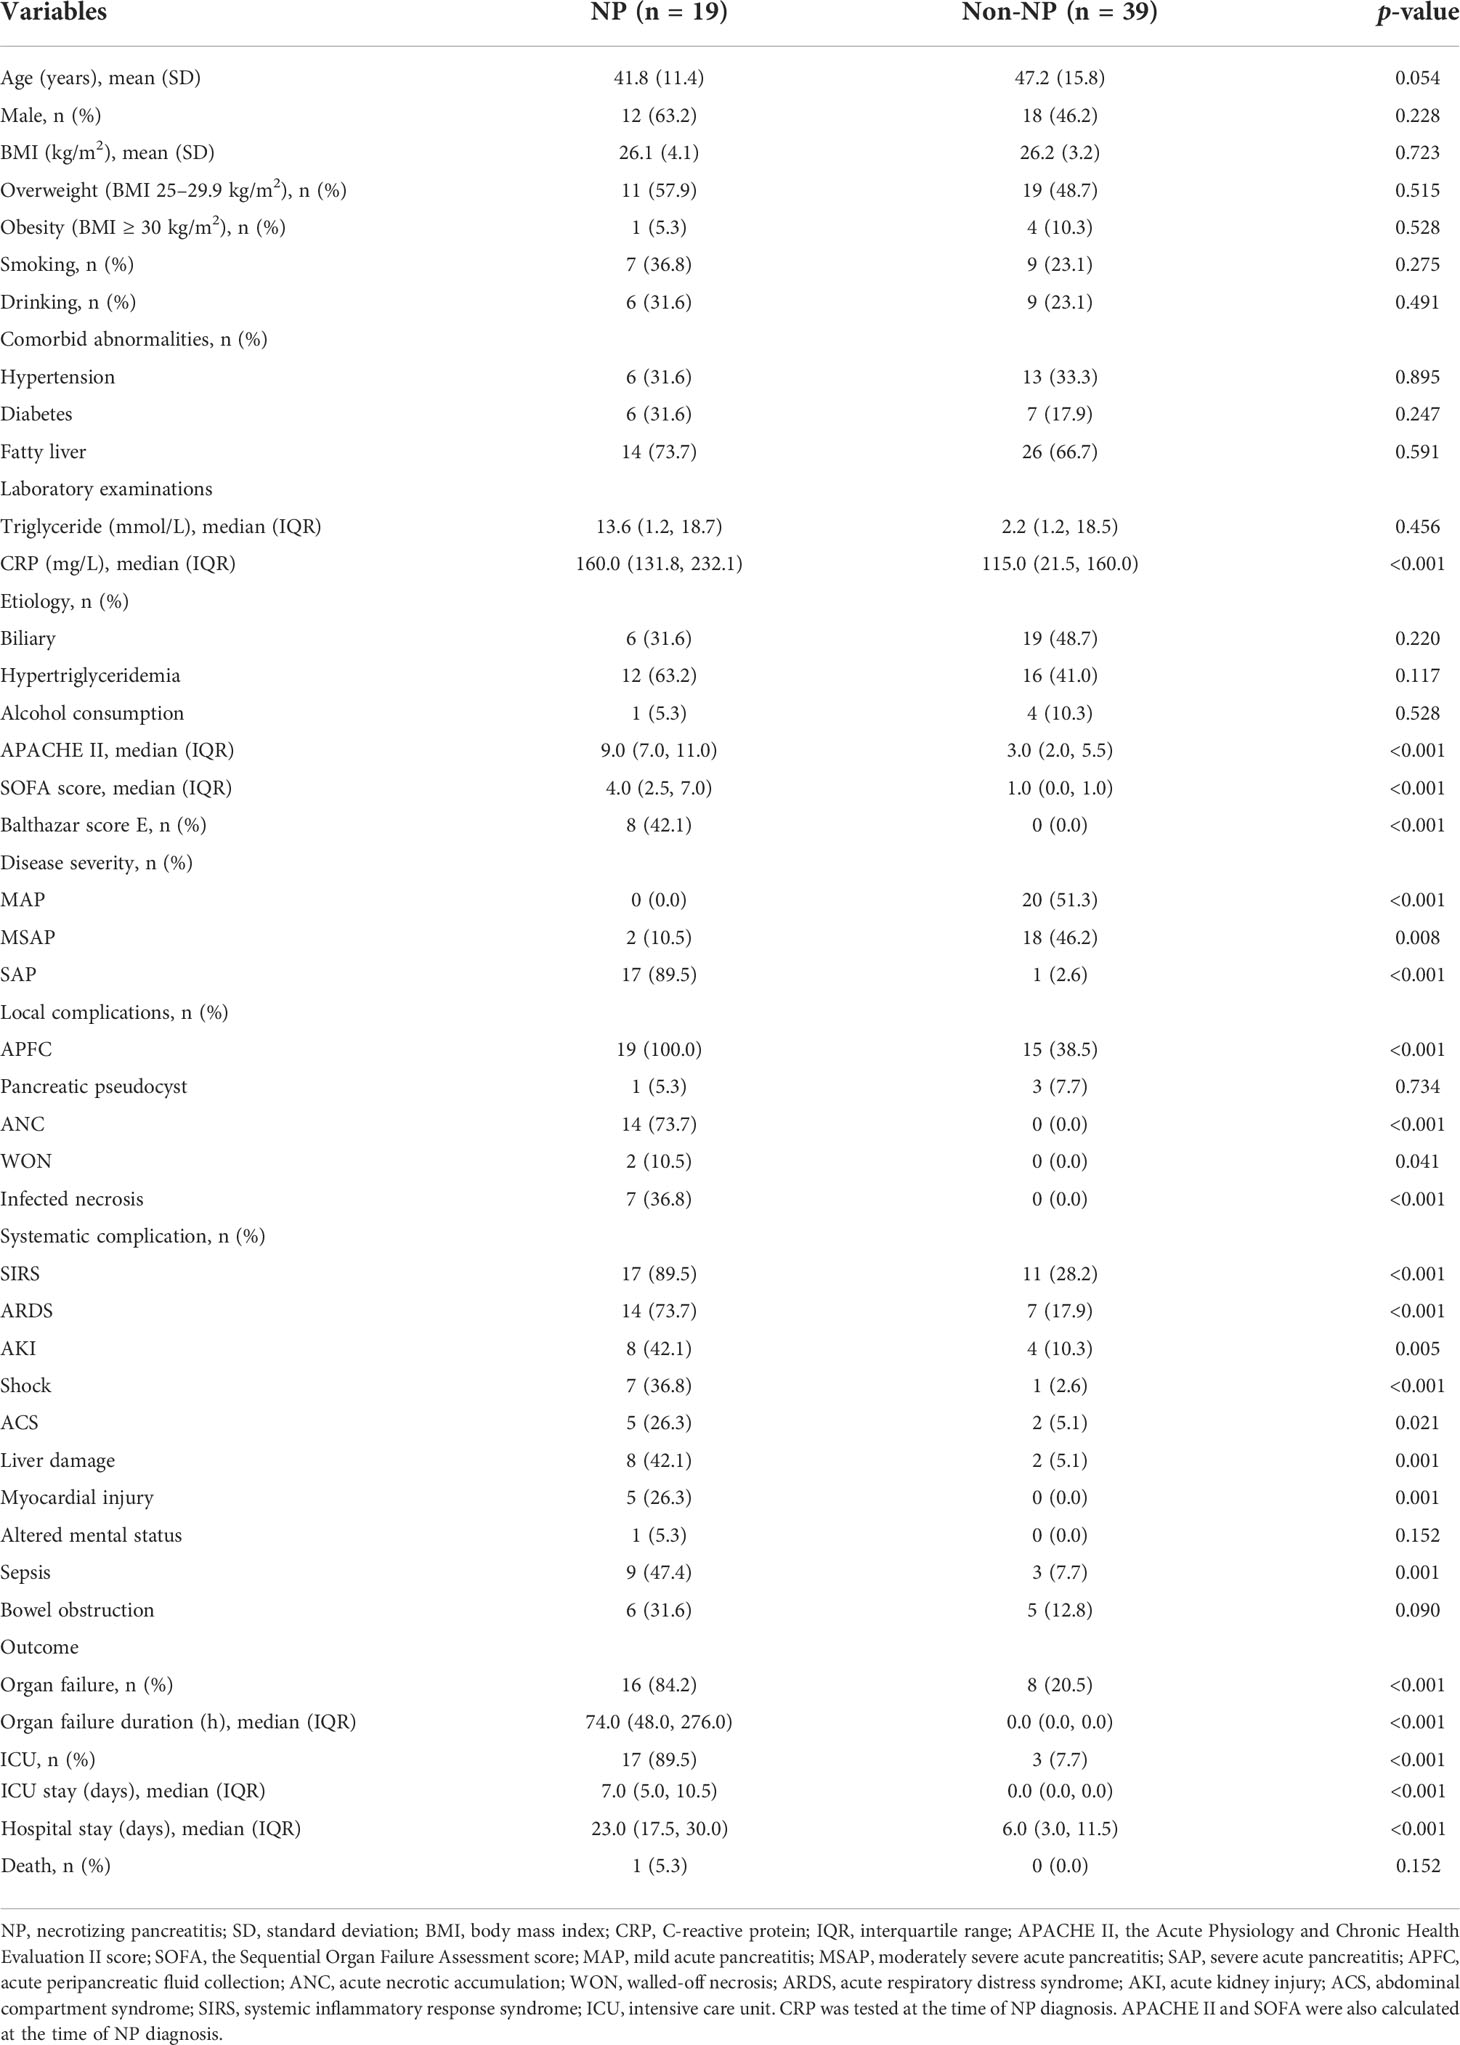
Table 1 Demographic and clinical characteristics of two groups.
Microbial profile of patients diagnosed with NP and non-NP
To determine whether the gut microbial composition may be predictive of NP and AP severity, we collected 58 rectal swabs from AP patients and 20 from healthy controls and performed 16S rRNA sequencing. Sequencing quality was good with no sample discarded and we identified 1664 ASVs in total. As is shown in Figure 1A, the alpha diversity was not significantly different among the three groups, indicating the similarity of global composition between NP and non-NP patients. The species richness rarefaction curves (Figure 1B) flattened out gradually, indicating that the number of individual samples was reasonable. The Venn diagram (Figure 1C) showed the common and unique ASVs detected in NP, non-NP, and HC groups, respectively. As displayed in CPCoA of weighted UniFrac distances (Figure 1D), a significant difference in beta diversity was detected in the microbial compositions among the three groups (p = 0.001).
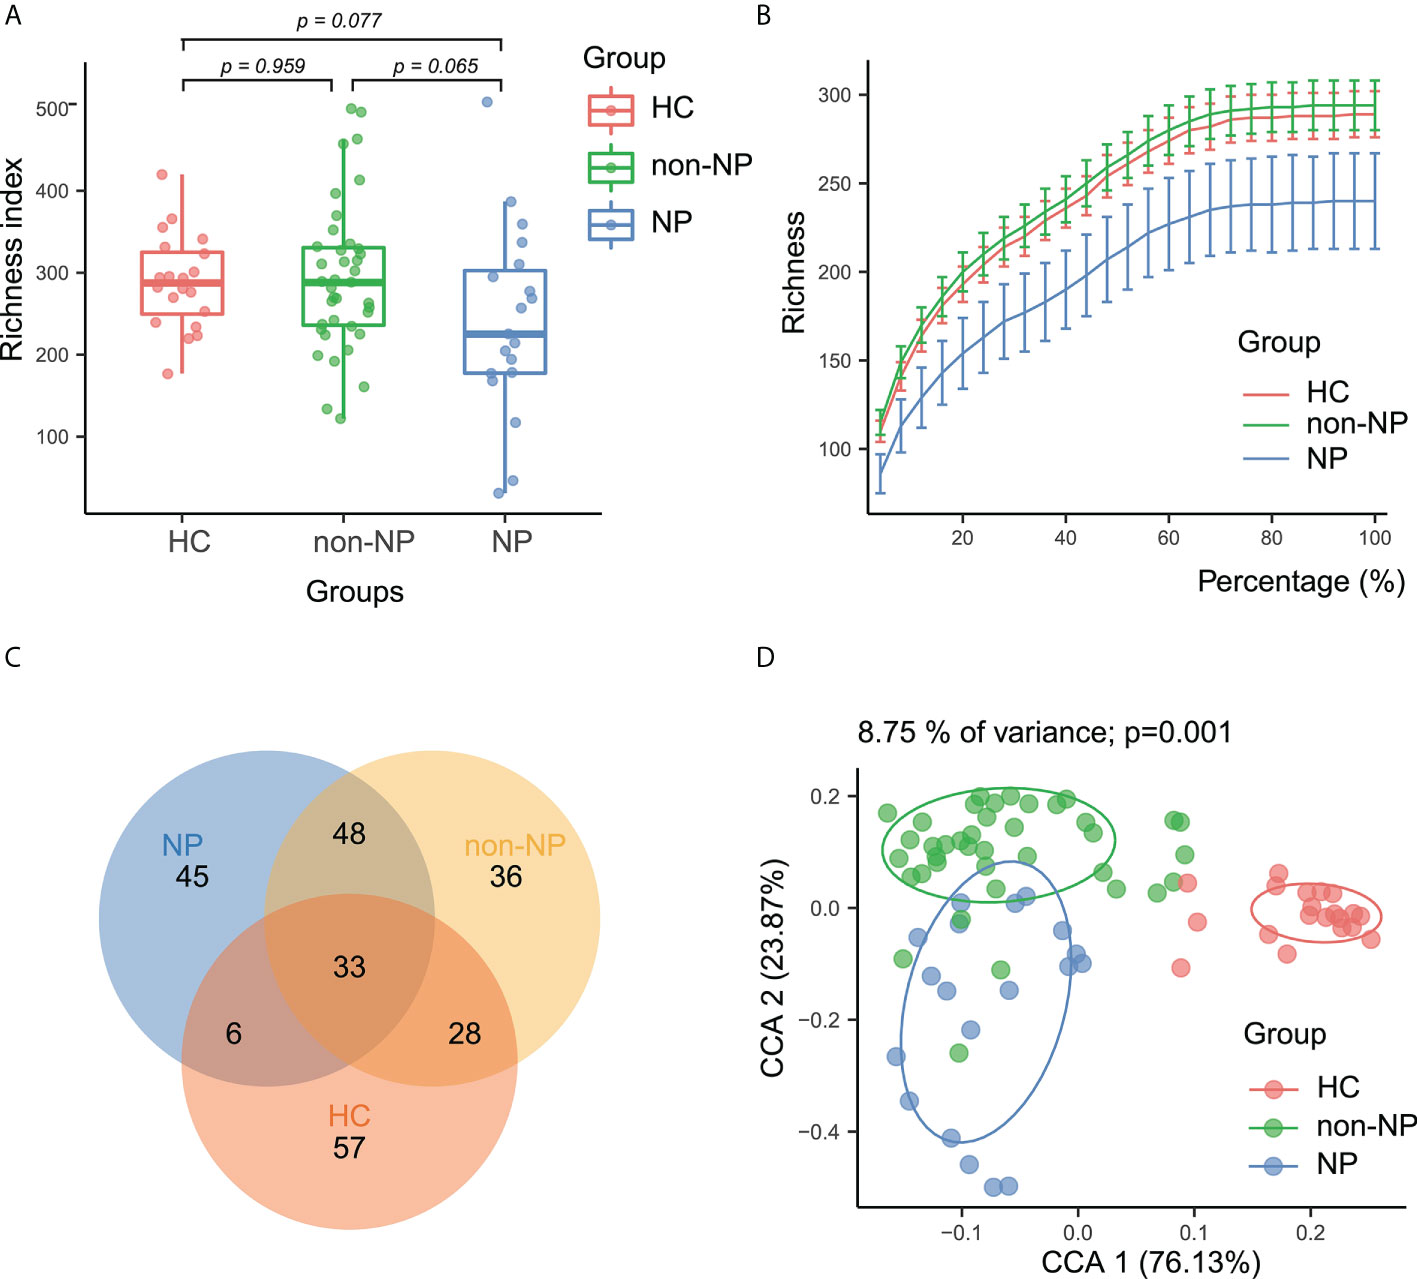
Figure 1 Alpha and beta diversity analysis between NP, non-NP and healthy control groups. (A) Alpha diversity based on richness index. Box-plot features represent the median (central line), upper and lower quartiles (box), and the maximum and minimum values of the data (bars). (B) A refraction curve demonstrating species richness. (C) A Venn diagram demonstrating the existence of ASVs in each group. (D) Beta diversity analysis based on CPCoA plot. Each symbol represents the gut microbiota of a sample. NP, necrotizing pancreatitis; non-NP, non-necrotizing pancreatitis; CPCoA, constrained principal coordinate analysis.
Taxonomic profiles at different levels of the three groups were presented in Figure 2. Firmicutes, Actinobacteria, Bacteroidetes, and Proteobacteria were the predominant phylum in the three groups (Figure 2A). At the order level (Figure 2B), the NP and the non-NP group showed lower relative abundances of Bifidobacteriale and Clostridiales and higher relative abundance of Lactobacillales compared with the HC group. In the NP group, Clostridiales and Bacteroidales were less abundant, while Lactobacillales and Enterobacteriales were more abundant, comparing with the non-NP group. As for family level, a chore diagram was constructed to visualize the connections between microbiota composition and the three groups (Figure 2C). Higher abundance of Enterococcaceae and lower abundance of Bacteroidaceae in the NP group were depicted comparing with the non-NP group. At the genus level, as shown in Figure 2D, NP exhibited a lower relative abundance of Bifidobacterium and Blautia, which were considered to be probiotic candidates. We also noticed an increased relative abundance of Enterococcus and Escheichia/Shigella comparing with non-NP. Overall, our finding suggested that AP (both non-NP and NP) might be associated with the decrease of certain taxa of probiotic microbes and the increase of opportunistic pathogens as well.
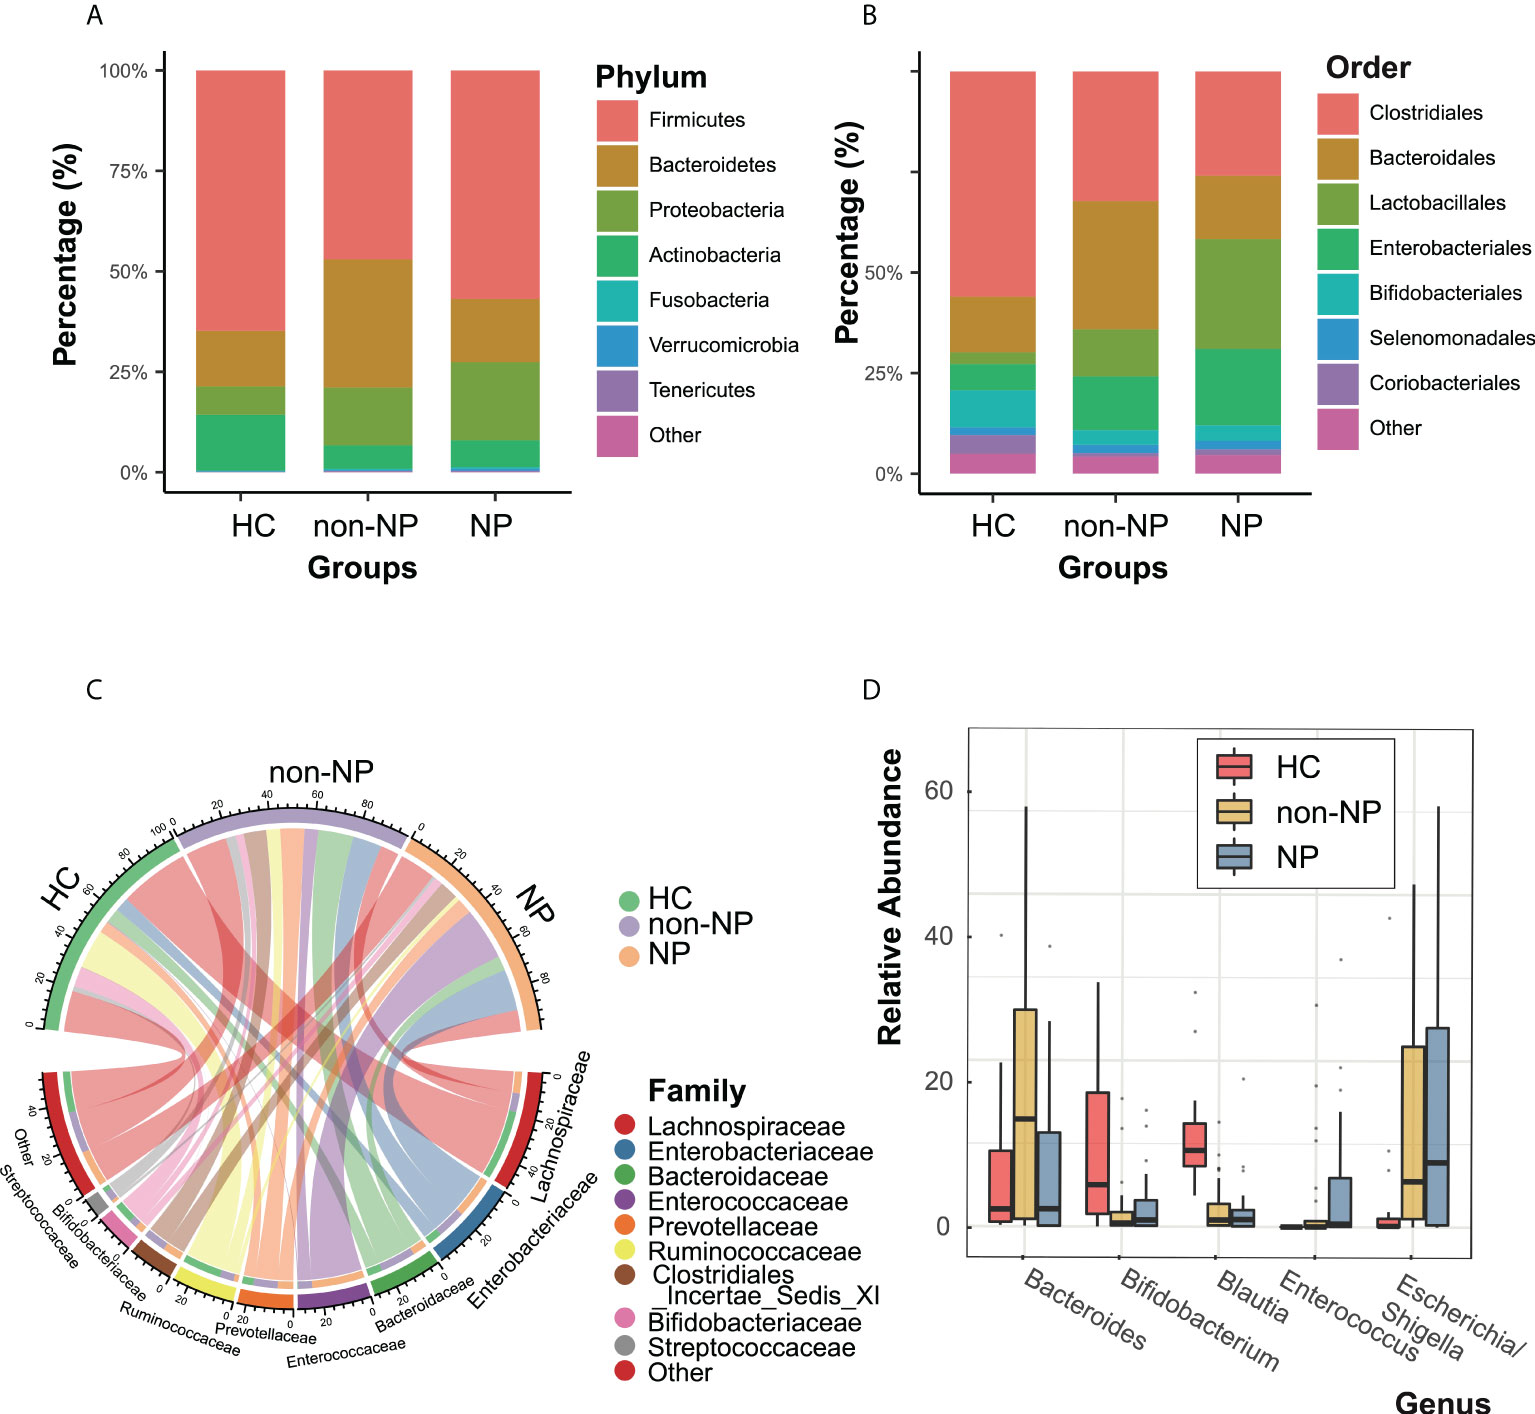
Figure 2 Taxonomic features of NP, non-NP and healthy control groups. Relative abundances of bacteria between groups at the phylum (A), order (B), family (C) and genus (D) levels. NP, necrotizing pancreatitis; non-NP, non-necrotizing pancreatitis.
Specific taxonomic signatures in NP patients
A LefSE analysis was performed to reveal the predominant bacterial taxa in NP and non-NP groups (Figure 3A). Manhattan plot (Figure 3B) delineated differential taxa between the NP and the non-NP group at the class level, in which Bacilli was enriched, while Bacteroidia and Clostridia were depleted in the NP group. The volcano plots based on edgeR analysis, as shown in Figures 3C–E, depicted that there were 121, 99, 49 ASVs with discrepant read counts statistically different between non-NP and HC group, NP and HC group, NP and non-NP group, respectively. 32 ASVs were depleted and 89 ASVs were enriched in non-NP as compared with HC, 33 ASVs were depleted and 69 ASVs were enriched in NP group as compared with HC, 30 ASVs were depleted and 19 ASVs were enriched in NP group as compared with non-NP.

Figure 3 Differential bacteria taxa and ASVs between the NP, non-NP and HC groups (A) LefSE analysis comparison between the NP and the non-NP groups, bacterial taxa are listed with a LDA score > 2.0. Microbial taxa enriched in non-NP group were highlighted in green; c, o, f, and g represent class, order, family and genus, respectively. (B) Manhattan plot of differential taxa between NP and non-NP groups. The x axis represents the microbial taxa at the class level ranked by alphabetical order, and y axis represents -log10 (p value). Filled triangles, hollow inverted triangles, and solid circles indicate ASVs enriched, depleted, and without significant difference, respectively. The color of each marker represents the different taxonomic affiliation of the ASVs, and the size corresponds to their relative abundances using log2 transformed CPM values. (C–E) Volcano plot. Each point represents an ASV, and significantly different ASVs are colored (non-NP vs HC, NP vs HC, NP vs non-NP; green = depleted in the former group; red = enriched in the former group; gray = not significant). NP, necrotizing pancreatitis; non-NP, non-necrotizing pancreatitis; ASV, amplicon sequence variants.
Gut microbiota composition was correlated with clinical indicators
Spearman correlation analysis was performed to recognize the connection between gut microflora and clinical indicators involving demographic characteristics, laboratory examinations, severity, and outcomes. Enterococcus faecium (ASV2), which belongs to the family Enterococcaceae, had a higher abundance in NP compared with non-NP (Figure 4A), bearing moderate to strong positive correlation with SOFA, disease severity, ICU stay, hospital stay, and CRP level. Likewise, Clostridium sporogenes (ASV25), found more abundant in the NP group, had a strong and positive correlation to SOFA, organ failure duration, and ICU stay while moderately positively correlated to hospital stay. Klebsiella pneumoniae (ASV94), within the order of Enterobacterales, had a moderate positive correlation with SOFA, organ failure duration, and disease severity.
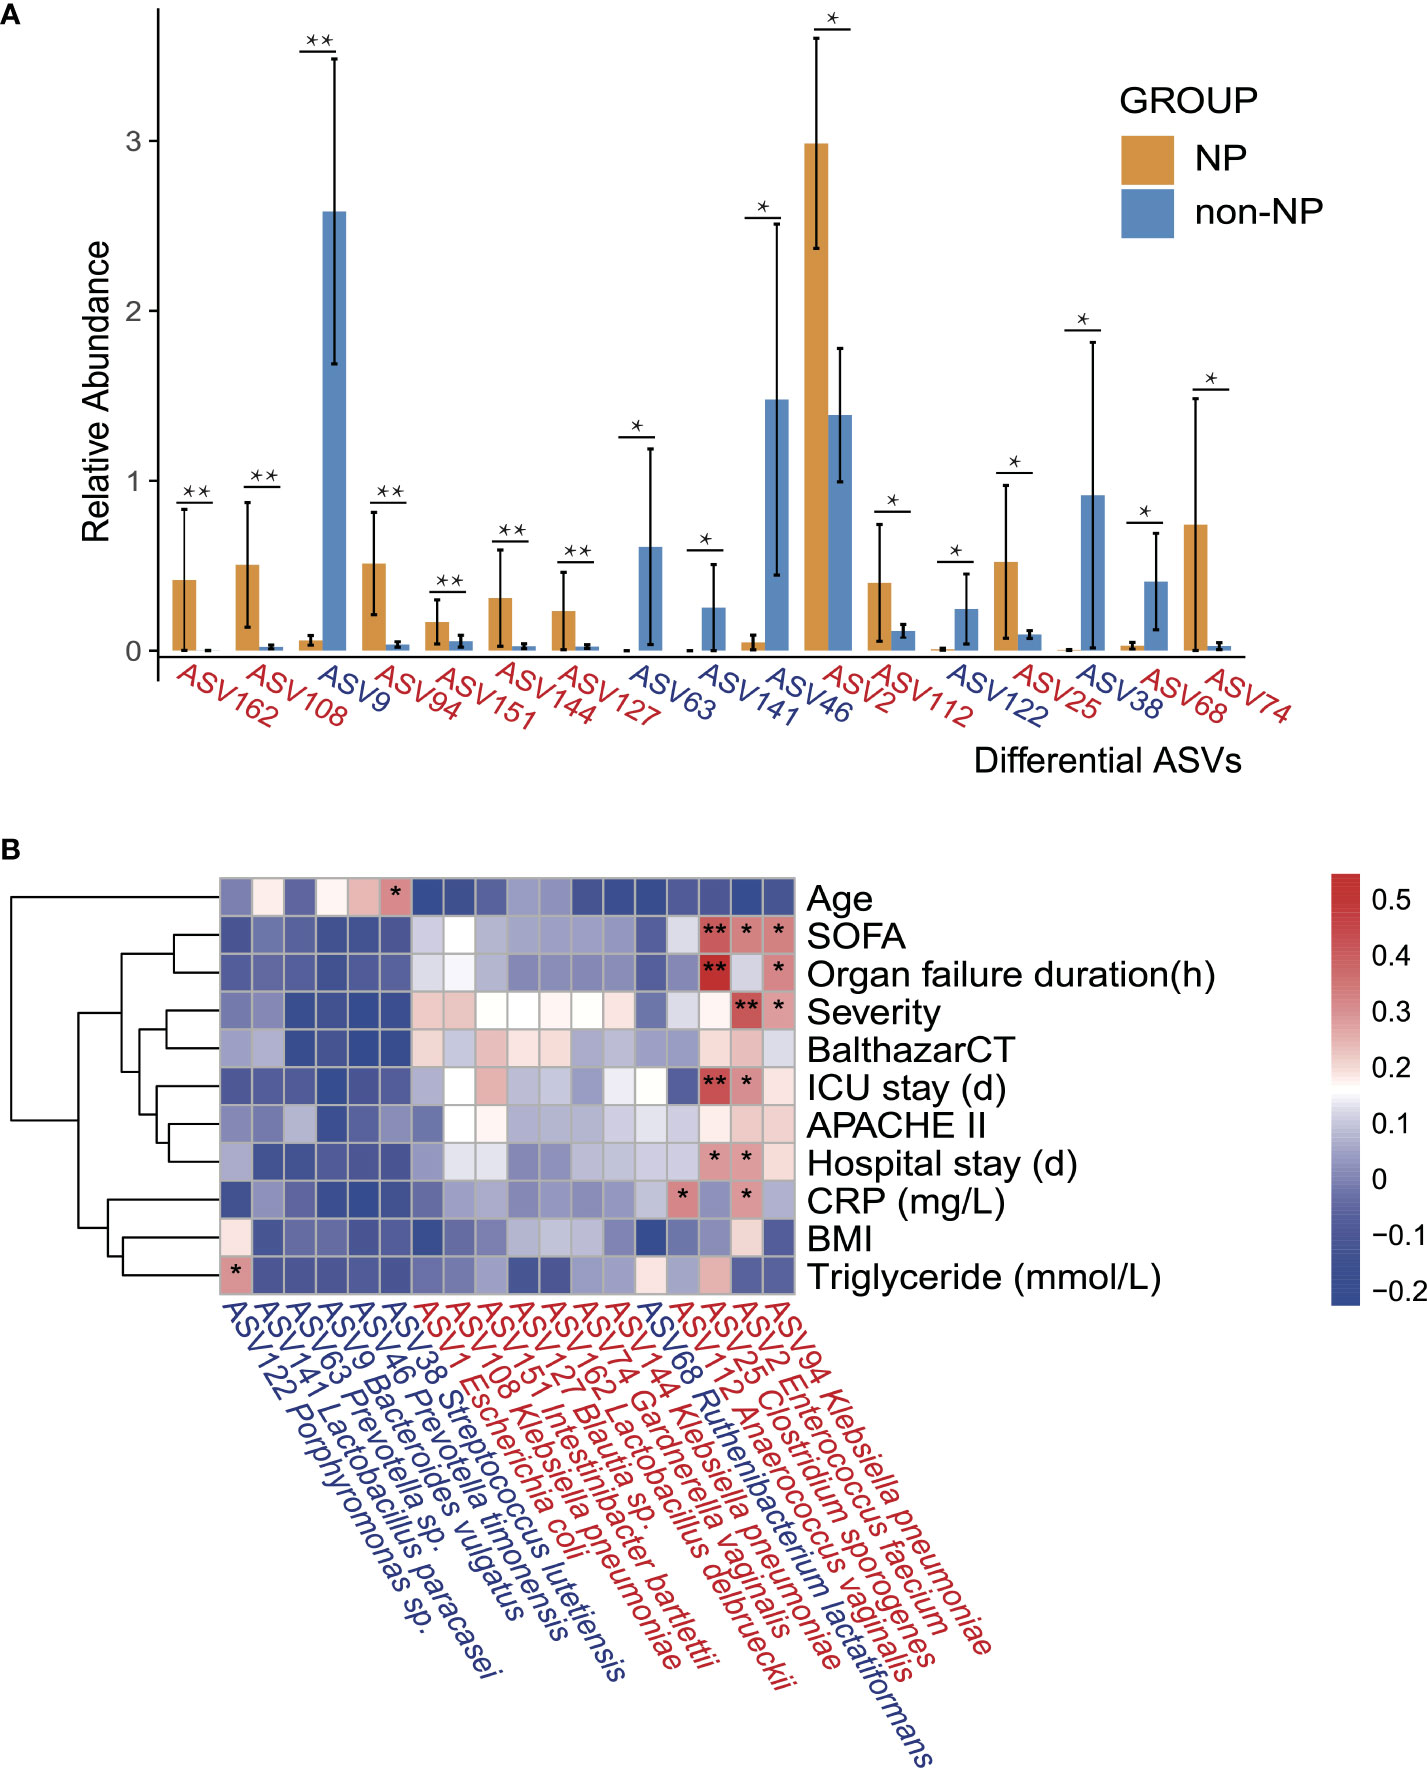
Figure 4 Differential ASVs between NP and non-NP groups and the correlation with clinical indicators. (A) Bar plot showing the relative abundance of differential ASVs between the NP and the non-NP groups. Values represent mean ± SEM, SEM-standard error of mean. *p < 0.05, **p < 0.01, edgeR test. (B) Spearman correlations between differential ASVs and clinical outcomes as well as indicators of disease severity. ASV, amplicon sequence variants; SOFA: the Sequential Organ Failure Assessment score; Severity: MAP-mild acute pancreatitis, MSAP-moderately severe acute pancreatitis and SAP-severe acute pancreatitis; BalthazarCT: Balthazar score within the CT severity index for grading of acute pancreatitis; APACHE II: the Acute Physiology and Chronic Health Evaluation II score; CRP: C-reactive protein; BMI: body mass index; Positive (red) or negative (blue) correlation are shown by two-color heatmap, with asterisks denoting statistical significance (*p < 0.05, **p < 0.01). ASVs enriched in the NP group were highlighted in red, and ASVs enriched in the non-NP group were in blue.
Altered functional pathways in microbiota of NP patients
We performed a BugBase analysis to predict the bacterial metabolic phenotypes in NP, non-NP, and HC groups, and the anaerobes abundance and mobile elements possession predictions are shown in Figures 5A, B. Compared to HC, non-NP had a significantly lower relative abundance of anaerobes (p < 0.01), while NP had a much lower relative anaerobes abundance in contrast to non-NP (p < 0.05). In terms of bacteria containing mobile elements, a significantly higher abundance was detected in the non-NP group as compared to the HC group (p < 0.01), while there was no significant difference between NP and non-NP (p = 0.06). Moreover, we analyzed the metabolic pathways of gut microflora based on PICRUSt2 (Figure 5C). We found that Enterococcus faecium (ASV2), Lactobacillus paracasei (ASV141), Klebsiella pneumoniae (ASV94, ASV108, and ASV144), and Escherichia coli (ASV1), had positive correlation with microbial gene functions concerning staphylococcus aureus infection, phosphotransferase system, ABC transporters, synthesis and degradation of ketone bodies, while they had a negative correlation with antigen processing and presentation, protein digestion and absorption, and restriction enzyme. While for Prevotella timonensis (ASV46), positive correlation to microbial gene functions related to restriction enzyme, protein digestion and absorption was observed. They had negative correlation with benzoate degradation.
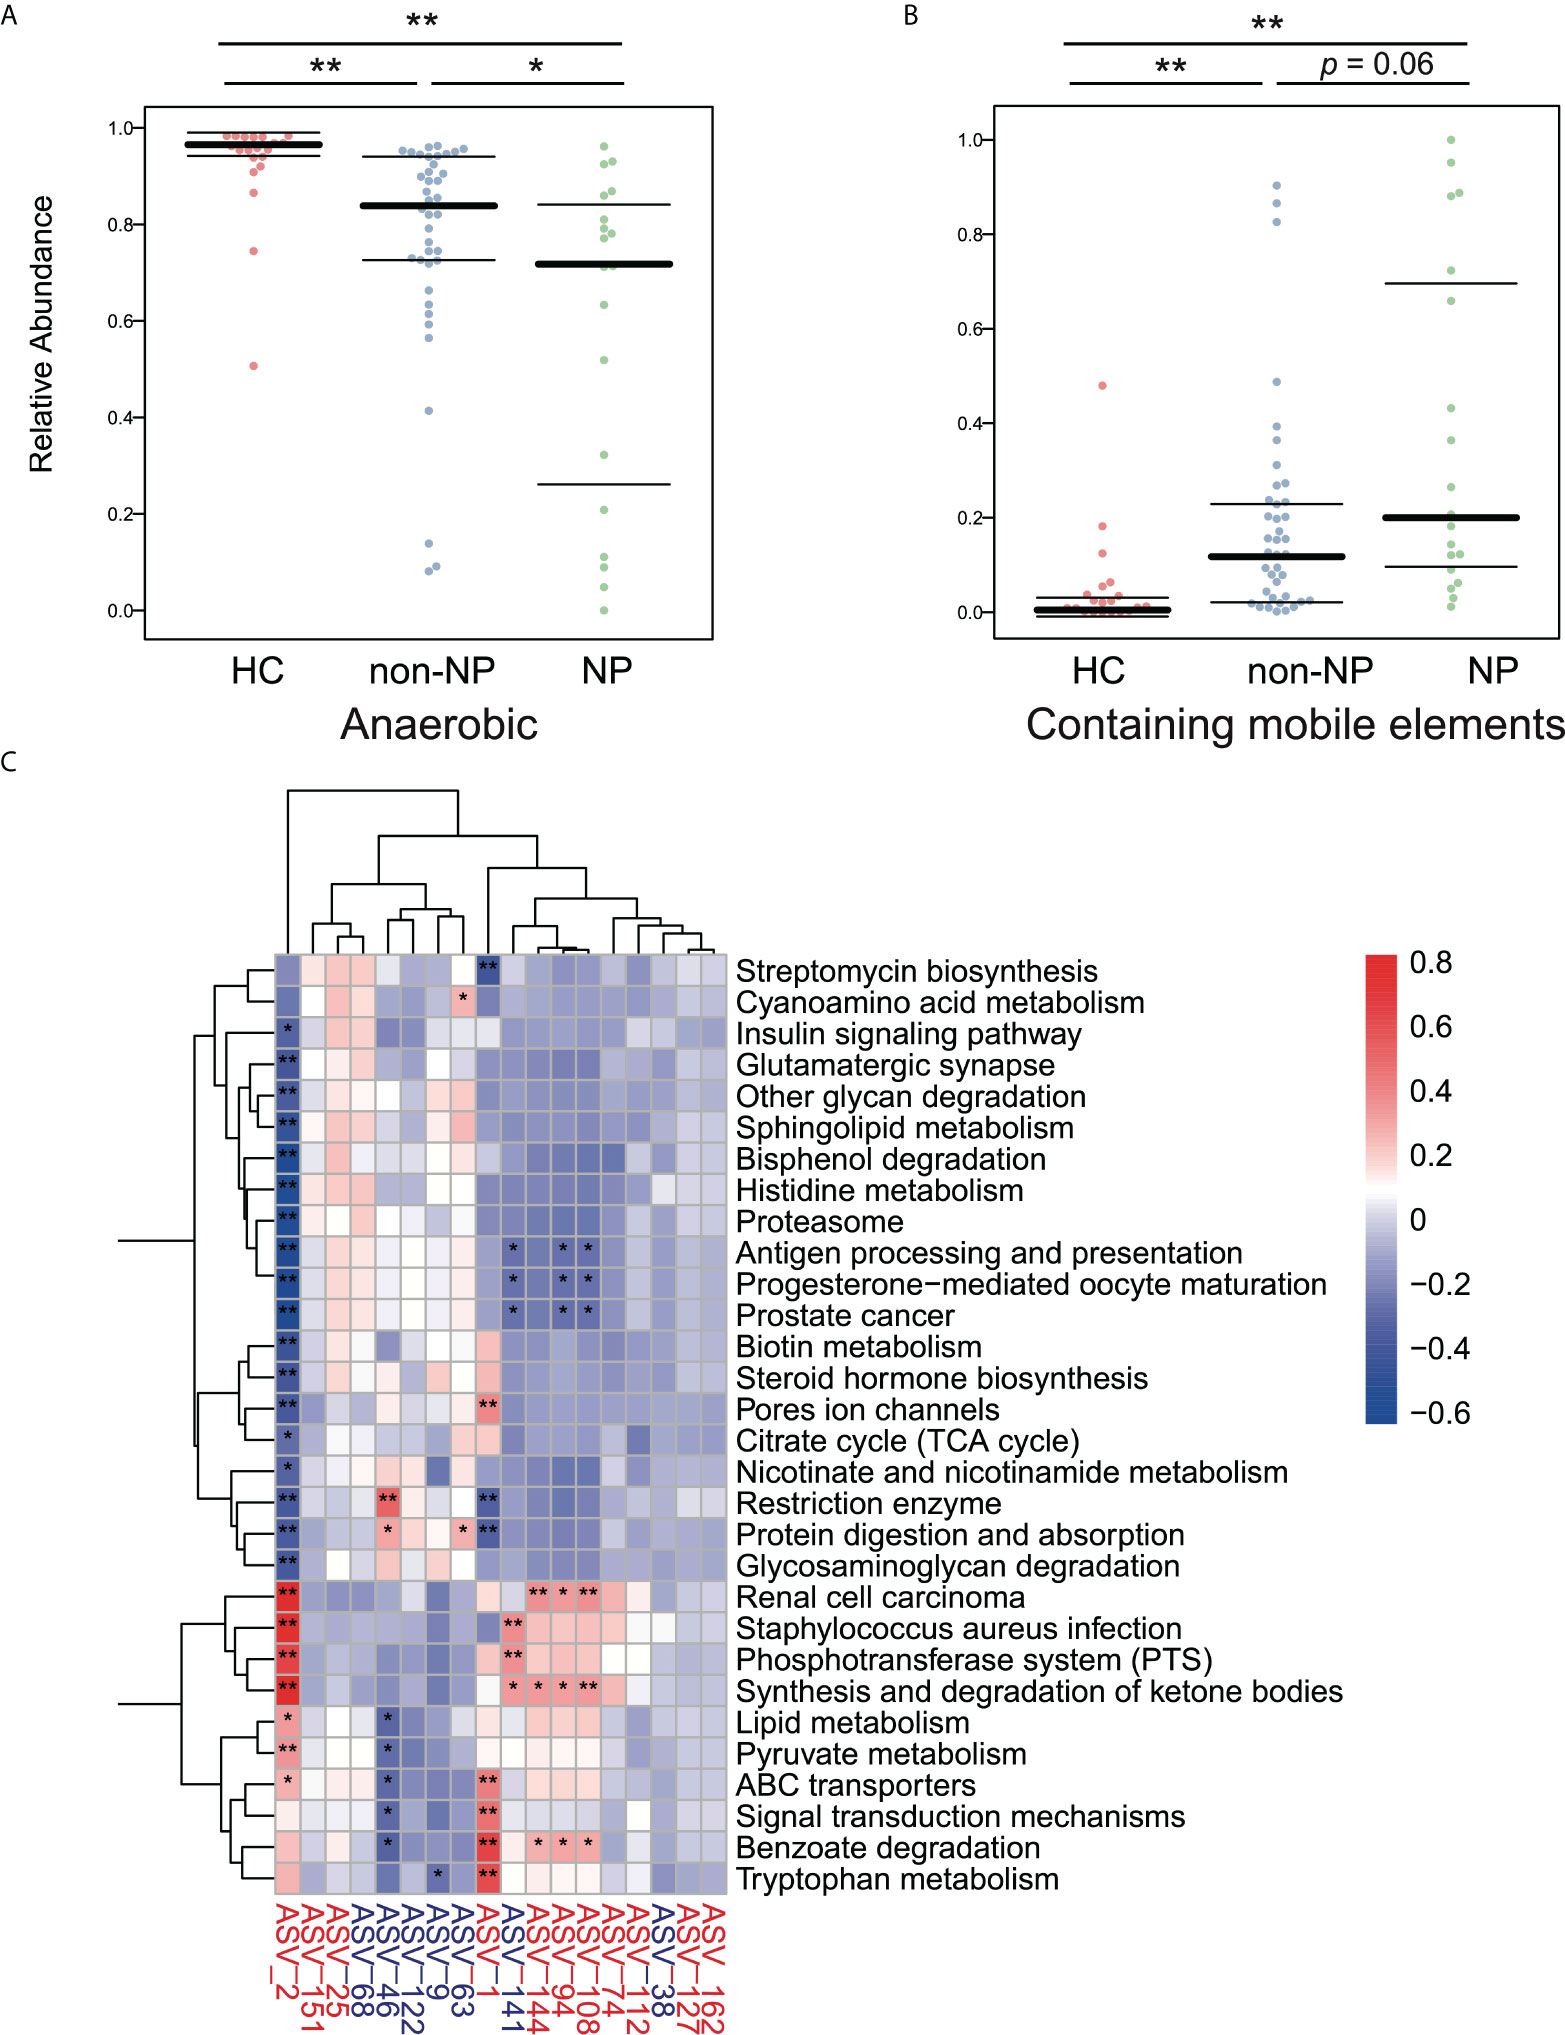
Figure 5 Predicted phenotypes of intestinal microflora in the NP, non-NP and HC groups. (A, B) Predicted relative abundance of anaerobic bacteria and bacteria containing mobile elements based on the BugBase database. *p < 0.01, *p <0.05, ns, not significant, by pairwise Mann-Whitney-Wilcoxon tests. (C) Spearman correlations were calculated between pathways predicted by PICRUSt2 that differed between the the NP and the non-NP groups and differential ASVs. Rows: Differential pathways predicted by PICRUSt2 between the NP and NNP groups; Columns: Differential ASVs. ASVs highlighted in red were enriched in the NP group, and ASVs highlighted in blue were depleted. *p < 0.05, **p < 0.01.
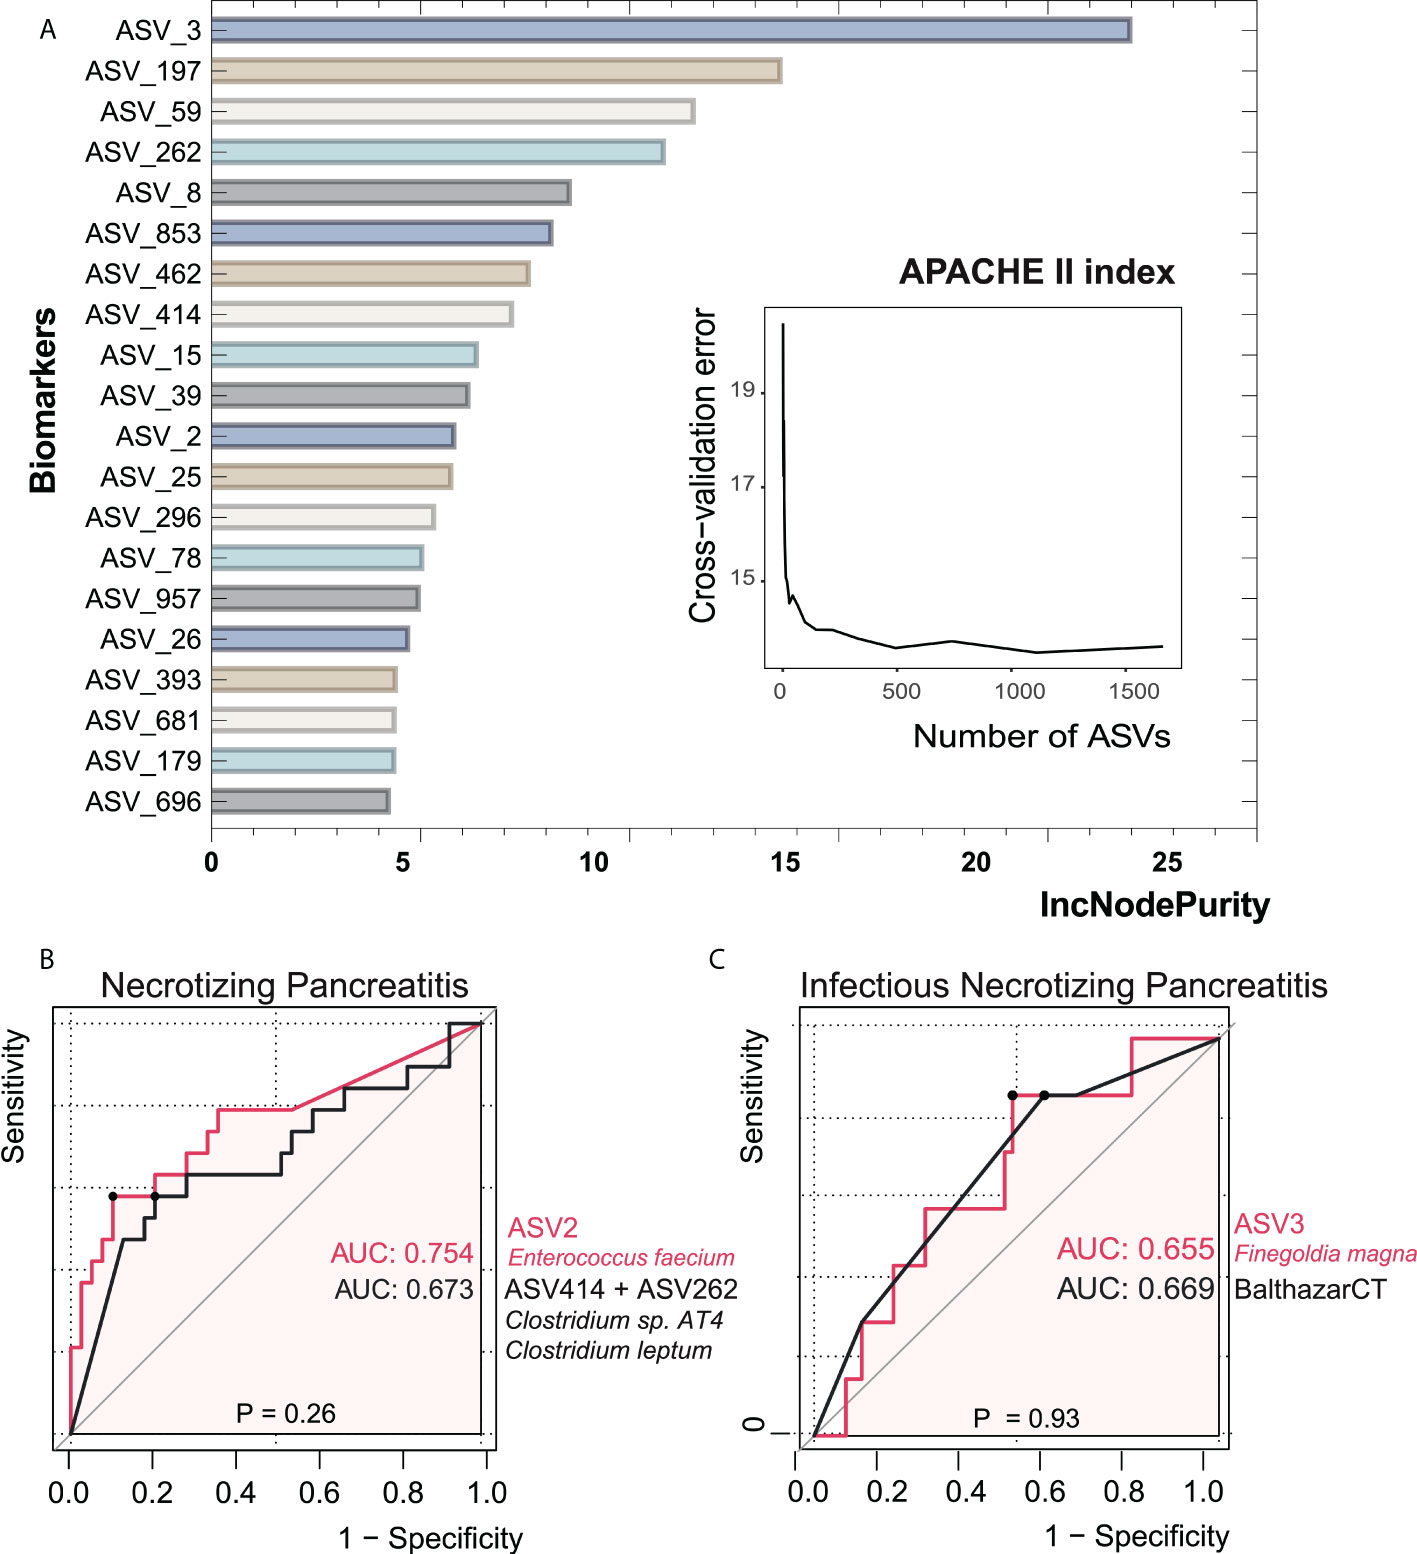
Figure 6 Bacterial taxonomic biomarkers of the APACHE II index in acute pancreatitis. (A) The top 20 biomarker bacterial classes were identified by applying random forests regression to their relative abundance values. Potential biomarker taxa are ranked in descending order of importance to the accuracy of the model. The inserted figure shows the 10-fold cross-validation error as a function of the number of ASVs used to regress against the APACHE II index in order of variable importance. (B, C) ROC curves showed the ability of specific microbiome biomarker in discriminating necrotizing pancreatitis and infectious necrotizing pancreatitis. AUC, area under ROC curve.
Potential gut microbial features were predictive of NP severity
In order to investigate the value of gut microbial signatures in forecasting NP severity, we applied random forest to identify taxa associated with poor outcomes, as shown in Figure 6. Finegoldia magna (ASV3) showed the maximal prediction capacity as a biomarker of NP when performing regression analyses with the APACHE II index. Enterococcus faecium (ASV2) had the highest AUC of 0.754 among all single ASVs in the setting of distinguishing NP and non-NP. The combination of two Clostridium species (ASV414+ASV262), which had a relatively low abundance in NP groups compared with non-NP, had comparable AUC value with ASV2. We then asked whether the composition of gut bacteria was predictive of infected NP. It turned out that there was not significant difference in AUC between ASV3 as a biomarker and Balthazar CT under the circumstance of infected NP (p = 0.93), suggesting the considerable predictive potential of ASV3.
Discussion
We explored the intestinal microbiota in patients with NP, non-NP, and healthy controls. Our analysis demonstrated a significant difference in microbiota composition among the three groups. We then proposed that bacterial biomarkers such as diversity, relative abundance feature, and specific ASVs might be useful to recognize patients who are likely to develop NP.
In our study, CRP, APACHE-II, and SOFA score differ significantly in NP and non-NP, which may be attributed to the severity of NP compared with non-NP. Many researchers have investigated a series of scoring systems from AP severity prediction. Prospective studies compared Ranson score, APACHE II, CTSI, BISAP score, and SOFA score, which were commonly used in clinical settings, in predicting necrosis development (32–34). CTSI had the highest positive predictive value compared with Ranson score, APACHE II and BISAP (32). However, CTSI is limited by accessibility to contrast enhanced CT (CECT) in the early stage of AP. BISAP score and APACHE II score did not have comparable predicting potential for NP (32). Besides, Ranson score consists of parameters assessed at both admission and after 48h, which is to the disadvantage of early clinical judgement. SOFA score, which was not specifically designed for AP, was more closely related to systemic complications and mortality, rather than local complications such as NP (8, 34). Other researchers generated de novo single factor or combination parameters for NP prediction. For instance, CRP (35), red cell distribution width (10) and immature granulocyte percentage (11) were also suggested as predictors of NP. However, these clinical laboratory items are likely to fail considering they are not specific for the complex pathophysiology of NP. A research team recently used machine learning strategy to process data from 2387 AP patients measured in the first 24h of clinical admission (36). They released an on-admission prediction model for NP online which stressed the impacts of gender, total white blood cell count, glucose, alkaline phosphatase, and CRP. However, more clinically relevant data should be included to improve the model. Also, model prediction efficacy usually shifted with various cohort (37).
As for infected NP prediction, studies suggested that sustained increase of procalcitonin (PCT) as a predictor for infected PN if repeatedly measured for a 2-week period (38). Nevertheless, PCT may be false positive in AP patients due to endotoxin translocation from intestine without infection (39). Inflammatory cytokines, such as interleukin 6 (IL6), are also predictor candidates, nevertheless they may be more difficult to access compared with PCT (40). One study reported that the peak of hematocrit (HCT), blood urea nitrogen (BUN), PCT, and CRP within 48h of admission were independent factors for infected PN, and parameters combination added to prediction accuracy. However, the limited sample size and the retrospective design raised issues of potential bias and questionable generalizability. Also, they diagnosed infected PN based on culture confirmation solely, which may missed false-negative cases.
Intestinal barrier injury, microbial translocation, and local inflammation have been proved to have an essential role in the generation and escalation of AP (13, 41), in which dysbiosis of the gut microbiota is a major contributing factor to intestinal damage (42). A previous study conducted by Zhu et al. showed that AP significantly triggered dysbiosis, and that gut microbiota dysbiosis increased the severity of AP in both animal studies and clinical settings (43). Besides, our previous studies also unveiled varying compositions and functions of gut microbiota in mild and non-mild AP patients, suggesting that altered microbiota might be responsible for the progression of AP (16). Although specific mechanism by which intestinal microflora affects escalation of NP remains unclear, some fundamental progress has been made recently. Zheng et al. reported that certain gut microbiome, for instance, non-pathogenic commensal Escherichia coli, had harmful potential in the human intestine and could aggravate NP through targeting intestinal epithelia (44).
We found that the microbial diversity in NP, species richness in particular, was lower than that in non-NP. Of note, the two groups had different microbiota composition. It is commonly acknowledged that the intestinal microbiota shapes a sophisticated community that bears various physiological and immune-modulating capacities (45). They also play a pivotal role in stimuli for antimicrobial peptides induction (46). Besides, the shift in the balance of symbionts and pathobionts (45), or dysbiosis, has been evidenced to be associated with ulcerative colitis and Crohn’s disease (47). Therefore, we presume that the decreased diversity may result in reduced ecological viability and dysbiosis in the intestine, implicating a weaker defense against pathogenic microorganisms, rendering the gut vulnerable to bacterial translocation that is essential for generating systemic inflammatory response, organ dysfunction, and local complications in AP.
There was consistency of relative abundance throughout different taxonomic levels. Opportunistic pathogens like Enterococcus were more abundant, while probiotic microbes like Bacteroides were less abundant in NP comparing with non-NP. Certain Bacteroides species, for instance Bacteroides xylanisolvens, Bacteroides ovatus, and Bacteroides uniformis, played a pivotal role in boosting the gut IgA production, which restored intestinal environment stability by restricting the microorganisms and endotoxin from invading gut epithelial cells, modulating microorganism colonization, and facilitating bacterial clearance (48–50).
Enterococci, a common inhabitant of human gastrointestinal tract, usually affect debilitated patients with prolonged hospital admission (51). Our previous study demonstrated that Escherichia/Shigella and Enterococcus were linked to poor prognosis of AP patients, and were commonly culprit pathogens of infected pancreatic necrosis (21). An increased abundance of Enterococcus may lead to higher disease severity (14, 16). Of note, infected NP were recommended to be treated with antibiotics in early disease stage (52). However, certain empiric antibiotics used in hospitalized patients might reduce abundance of the Gram-negative organisms in the GI tract. Depletion of the Gram-negative microbiota weakens the antimicrobial activity towards Gram-positive bacteria including enterococci, leading to overgrowth of enterococci (53, 54).
Besides, in the process of developing antibiotic resistance, certain enterococci lineages, Enterococcus faecium for instance, can colonize the intestine and disseminate to cause systemic infection (51). In this study, Enterococcus faecium was found enriched in NP compared with non-NP. Further, Enterococcus faecium (ASV2) performed best in discriminating NP and non-NP patients based on AUC. A previous study showed that Enterococcus faecium was one of the most frequently identified microbes in patients with infected pancreatic necrosis (55). Simultaneously, we found that Enterococcus faecium was not only correlated with clinical indicators such as CRP, SOFA, disease severity, ICU stay, and hospital stay, but was also connected with many microbial gene functions. Therefore, further studies on the mechanisms by which Enterococcus faecium boosters NP are required. In addition, NP patients had a much lower relative anaerobes abundance than non-NP patients, giving a hint of the selection of antibiotics when dealing with NP.
To be noticed, a combination of clostridium species had similar performance in discriminating NP and non-NP compared with Enterococcus faecium. Previous studies revealed protective effect of certain clostridium species in AP by regulating pancreatic-gut homeostasis. Supplemented Clostridium butyricum strains to mice model protected against AP (56). At the pancreas level, Clostridium butyricum inhibited dendritic cell and neutrophil infiltration, inflammasome activation, and certain pro-inflammatory pathways. At the gut level, Clostridium butyricum attenuated barrier dysfunction and intestinal inflammation, therefore prevented Enterococcus and Escherichia coli from penetration into pancreas. For inflammatory bowel disease (IBD) patients, significant reduction of Clostridium leptum was observed, which contributed to reduced short chain fatty acids and dysbiosis (57). Analysis of gut microbiota in AP patients with infection complication also revealed decreased bifidobacterial such as Clostridium leptum (58). Probiotic supplementation worth further investigation in AP patients.
Our random Forests regression analysis indicated that Finegoldia magna (ASV3) was the most robust microbial biomarker to predict the prognosis compared to the APACHE II score. Furthermore, we found that in the setting of infected NP, AUCs of Finegoldia magna and Balthazar CT were comparable, implicating that Finegoldia magna could be a potential substitute to assess disease severity of infected NP. Finegoldia magna, a commensal Gram-positive anaerobic coccus (GPAC) that colonizes gastrointestinal tract, is an important opportunistic pathogen. However, due to challenges of high-quality anaerobic specimens collection and difficulties in cultivation, its true impact in clinical settings is possibly underestimated (59).. Finegoldia magna and its soluble proteins Finegoldia magna adhesion factor (FAF) and superantigen protein L activate human neutrophils, promote inflammatory response, and hinder antibacterial peptides or proteins, which may increase virulence (60). Biofilm formation hampers successful antibiotic therapy and results in chronic infections. Relative high resistance of clindamycin (in some studies more than 30.0%) or quinolone (often more than 30%) was observed. And though quite rare, studies also observed resistance of metronidazole, penicillin G, and chloramphenicol (61). 16S rRNA PCR increases the possibility of Finegoldia magna detection compared to traditional methods, thus conducive to antibiotic selection and NP outcome prediction. Finegoldia magna has virulent factors such as subtilisin-like extracellular serine protease (SufA), superantigen protein L, and F. magna adhesion factor (FAF) that prevent clearance by innate defense system. Profound penetration and dissemination of the infections through skin are realized by capsule and tissue- destroying enzymes, as well as SufA. Biofilm contributes to chronic infection (61). However, the relationships between Finegoldia magna and the pathophysiology of NP or infected NP remain to be investigated.
In clinical setting, many microorganisms and their constituents have been transformed into robust diagnostic tests for certain diseases. For instance, Clostridium difficile and C. difficile Toxin A & B (CDAB) are practical diagnostic tests for antibiotic-associated colitis. Therefore, Enterococcus faecium, Finegoldia magna, and their virulence factors are promising to become cost-effective diagnostic markers.
As for function prediction analysis, we found that species more abundant in NP patients were correlated positively with microbial gene functions related to synthesis and degradation of ketone bodies, and benzoate degradation, while they had a negative correlation with antigen processing and presentation, protein digestion and absorption. While for species less abundant in NP patients, positive correlation to microbial gene functions related to restriction enzyme, protein digestion and absorption was observed, as well as negative correlation with benzoate degradation. A study observed that β-hydroxybutyrate (βOHB), a type of ketone body in circulation, was elevated in patient with non-SAP, but not in SAP (62). Then the researchers used mild or severe form of AP mice to demonstrate that βOHB weakened the pancreatic and systemic proinflammatory macrophages activation by means of class I histone deacetylases. Apart from endogenous ketogenesis, gut microbiota may affect the synthesis and degradation of ketone bodies, which may trigger NP, a non-mild form of AP. Activation of endogenous ketogenesis or supplementation of exogenous βOHB may help with AP prevention and treatment. Intestinal microbial growth may release metabolism excreted by urine. Urine benzoate was elevated in intestinal bacterial overgrowth patients, and was considered a dysbiosis marker (63). Benzoate degradation pathway connected host adrenergic stress to strengthened microorganism virulence, and was implicated in IBD (64). NP and non-NP groups possibly had different benzoate degradation metabolic phenotype, which might imply dysbiosis and bacterial virulence in terms of mechanism. Possible preventive treatment measures regarding metabolic products are worth trying.
Our pilot study had several limitations. Firstly, we took gut microbiome samples at the single time point of admission, but longitudinal monitoring at different time points would enable better understanding of dynamic changes in AP. Secondly, the sample size was limited, thus a multicenter study is needed to verify our results. Thirdly, microbiome taken from various segments of the intestine, whole genome sequencing, and multi-omics will hopefully provide multilevel information to better interpret the mechanisms.
Our study indicated that patients with NP had altered gut microbiome which was predictive for NP patients with worse outcome. Enterococcus faecium and Finegoldia magna, microbial biomarkers for NP and infected NP, warrant further investigation of their mechanism and clinical application. Our findings may help early prediction of disease progression and inform clinical decision-making in patients with AP.
Conclusion
In conclusion, NP patients had distinct features of gut microbiota which can be used to predict disease severity. These features were related to poor clinical prognosis. Enterococcus faecium and Finegoldia magna were potential microbial biomarkers for prediction of NP and infected NP. Further multi-omics, animal studies, and human trials are required to validate our findings and demonstrate the underlying mechanisms.
Data availability statement
The datasets for this article are not publicly available due to concerns regarding participants/patient anonymity. Request to access the datasets should be directed to the corresponding author.
Ethics statement
The studies involving human participants were reviewed and approved by PUMCH Ethics Committee (Identifier: JS1826, Date of approval: 20th February 2018. Period of validity: February 2018 to August 2020). The patients/participants provided their written informed consent to participate in this study.
Author contributions
Conceptualization, MZ, XH, DW. Methodology, XH and DW. Software, XH and YF. Validation, MZ, XH and DW. Formal Analysis, XH, YF. Investigation, MZ, LG, ZH, and LJ. Resources, DW. Data Curation, XH and DW. Writing—Original Draft Preparation, ZY (Zihan Yang) and YF. Writing—Review & Editing, MZ, XH, and DW. Visualization, XH and YF. Supervision, XH, DW. Project Administration, XH, DW. Funding Acquisition, DW. All authors have read and agreed to the published version of the manuscript.
Funding
This study was funded by grants from Chinese Natural Science Foundation, grant number 32170788, Beijing Natural Science Foundation, grant number 7202152, and National High Level Hospital Clinical Research Funding, grant number 2022-PUMCH-A-026
Conflict of interest
The authors declare that the research was conducted without any commercial or financial relationships that could be construed as a potential conflict of interest.
Publisher’s note
All claims expressed in this article are solely those of the authors and do not necessarily represent those of their affiliated organizations, or those of the publisher, the editors and the reviewers. Any product that may be evaluated in this article, or claim that may be made by its manufacturer, is not guaranteed or endorsed by the publisher.
Supplementary material
The Supplementary Material for this article can be found online at: https://www.frontiersin.org/articles/10.3389/fimmu.2022.988326/full#supplementary-material
References
1. Lankisch PG, Apte M, Banks PA. Acute pancreatitis. Lancet (2015) 386(9988):85–96. doi: 10.1016/S0140-6736(14)60649-8
2. Lee PJ, Papachristou GI. New insights into acute pancreatitis. Nat Rev Gastroenterol Hepatol (2019) 16(8):479–96. doi: 10.1038/s41575-019-0158-2
3. Xiao AY, Tan ML, Wu LM, Asrani VM, Windsor JA, Yadav D, et al. Global incidence and mortality of pancreatic diseases: a systematic review, meta-analysis, and meta-regression of population-based cohort studies. Lancet Gastroenterol Hepatol (2016) 1(1):45–55. doi: 10.1016/S2468-1253(16)30004-8
4. Iannuzzi JP, King JA, Leong JH, Quan J, Windsor JW, Tanyingoh D, et al. Global incidence of acute pancreatitis is increasing over time: A systematic review and meta-analysis. Gastroenterology (2022) 162(1):122–34. doi: 10.1053/j.gastro.2021.09.043
5. Banks PA, Bollen TL, Dervenis C, Gooszen HG, Johnson CD, Sarr MG, et al. Classification of acute pancreatitis–2012: revision of the Atlanta classification and definitions by international consensus. Gut (2013) 62(1):102–11. doi: 10.1136/gutjnl-2012-302779
6. Maheshwari R, Subramanian RM. Severe acute pancreatitis and necrotizing pancreatitis. Crit Care Clin (2016) 32(2):279–90. doi: 10.1016/j.ccc.2015.12.006
7. Bugiantella W, Rondelli F, Boni M, Stella P, Polistena A, Sanguinetti A, et al. Necrotizing pancreatitis: A review of the interventions. Int J Surg (2016) 28 Suppl 1:S163–71. doi: 10.1016/j.ijsu.2015.12.038
8. Ding N, Guo C, Li C, Zhou Y, Chai X. An artificial neural networks model for early predicting in-hospital mortality in acute pancreatitis in MIMIC-III. BioMed Res Int (2021) 2021:6638919. doi: 10.1155/2021/6638919
9. Leonard-Murali S, Lezotte J, Kalu R, Blyden DJ, Patton JH, Johnson JL, et al. Necrotizing pancreatitis: A review for the acute care surgeon. Am J Surg (2021) 221(5):927–34. doi: 10.1016/j.amjsurg.2020.08.027
10. Yalçın MS, Tas A, Kara B, Olmez S, Saritas B. New predictor of acute necrotizing pancreatitis: Red cell distribution width. Adv Clin Exp Med (2018) 27(2):225–8. doi: 10.17219/acem/67590
11. Ünal Y, Barlas AM. Role of increased immature granulocyte percentage in the early prediction of acute necrotizing pancreatitis. Ulus Travma Acil Cerrahi Derg (2019) 25(2):177–82. doi: 10.14744/tjtes.2019.70679
12. Harshit Kumar A, Singh Griwan M. A comparison of APACHE II, BISAP, ranson’s score and modified CTSI in predicting the severity of acute pancreatitis based on the 2012 revised Atlanta classification. Gastroenterol Rep (Oxf) (2018) 6(2):127–31. doi: 10.1093/gastro/gox029
13. Capurso G, Zerboni G, Signoretti M, Valente R, Stigliano S, Piciucchi M, et al. Role of the gut barrier in acute pancreatitis. J Clin Gastroenterol (2012) 46:S46–51. doi: 10.1097/MCG.0b013e3182652096
14. Tan C, Ling Z, Huang Y, Cao Y, Liu Q, Cai T, et al. Dysbiosis of intestinal microbiota associated with inflammation involved in the progression of acute pancreatitis. Pancreas (2015) 44(6):868–75. doi: 10.1097/MPA.0000000000000355
15. Mowbray NG, Ben-Ismaeil B, Hammoda M, Shingler G, Al-Sarireh B. The microbiology of infected pancreatic necrosis. Hepatobiliary Pancreat Dis Int (2018) 17(5):456–60. doi: 10.1016/j.hbpd.2018.08.007
16. Yu S, Xiong Y, Xu J, Liang X, Fu Y, Liu D, et al. Identification of dysfunctional gut microbiota through rectal swab in patients with different severity of acute pancreatitis. Dig Dis Sci (2020) 65(11):3223–37. doi: 10.1007/s10620-020-06061-4
17. Biehl LM, Garzetti D, Farowski F, Ring D, Koeppel MB, Rohde H, et al. Usability of rectal swabs for microbiome sampling in a cohort study of hematological and oncological patients. PloS One (2019) 14(4):e0215428. doi: 10.1371/journal.pone.0215428
18. Knaus WA, Draper EA, Wagner DP, Zimmerman JE. APACHE II: a severity of disease classification system. Crit Care Med (1985) 13(10):818–29. doi: 10.1097/00003246-198510000-00009
19. Chatzicostas C, Roussomoustakaki M, Vardas E, Romanos J, Kouroumalis EA. Balthazar computed tomography severity index is superior to ranson criteria and APACHE II and III scoring systems in predicting acute pancreatitis outcome. J Clin Gastroenterol (2003) 36(3):253–60. doi: 10.1097/00004836-200303000-00013
20. Vincent JL, de Mendonca A, Cantraine F, Moreno R, Takala J, Suter PM, et al. Use of the SOFA score to assess the incidence of organ dysfunction/failure in intensive care units: results of a multicenter, prospective study. working group on “sepsis-related problems” of the European society of intensive care medicine. Crit Care Med (1998) 26(11):1793–800. doi: 10.1097/00003246-199811000-00016
21. Wu D, Lu B, Xue HD, Yang H, Qian JM, Lee P, et al. Validation of modified determinant-based classification of severity for acute pancreatitis in a tertiary teaching hospital. Pancreatology (2019) 19(2):217–23. doi: 10.1016/j.pan.2019.01.003
22. Debebe T, Biagi E, Soverini M, Holtze S, Hildebrandt TB, Birkemeyer C, et al. Unraveling the gut microbiome of the long-lived naked mole-rat. Sci Rep (2017) 7(1):9590. doi: 10.1038/s41598-017-10287-0
23. Eri T, Kawahata K, Kanzaki T, Imamura M, Michishita K, Akahira L, et al. Intestinal microbiota link lymphopenia to murine autoimmunity via PD-1(+)CXCR5(-/dim) b-helper T cell induction. Sci Rep (2017) 7:46037. doi: 10.1038/srep46037
24. Liu YX, Qin Y, Chen T, Lu M, Qian X, Guo X, et al. A practical guide to amplicon and metagenomic analysis of microbiome data. Protein Cell (2021) 12(5):315–30. doi: 10.1007/s13238-020-00724-8
25. Rognes T, Flouri T, Nichols B, Quince C, Mahe F. VSEARCH: a versatile open source tool for metagenomics. PeerJ (2016) 4:e2584. doi: 10.7717/peerj.2584
26. Edgar RC. Search and clustering orders of magnitude faster than BLAST. Bioinformatics (2010) 26(19):2460–1. doi: 10.1093/bioinformatics/btq461
27. Khan TJ, Ahmed YM, Zamzami MA, Mohamed SA, Khan I, Baothman OAS, et al. Effect of atorvastatin on the gut microbiota of high fat diet-induced hypercholesterolemic rats. Sci Rep (2018) 8(1):662. doi: 10.1038/s41598-017-19013-2
28. Oksanen J, Kindt R, Legendre P, O’Hara B, Stevens MHH, Oksanen MJ, et al. The vegan package. Comm Ecol Pack (2007) 10:719.
29. McDonald D, Price MN, Goodrich J, Nawrocki EP, DeSantis TZ, Probst A, et al. An improved greengenes taxonomy with explicit ranks for ecological and evolutionary analyses of bacteria and archaea. ISME J (2012) 6(3):610–8. doi: 10.1038/ismej.2011.139
30. Ward T, Larson J, Meulemans J, Hillmann B, Lynch J, Sidiropoulos D, et al. BugBase predicts organism-level microbiome phenotypes. bioRxiv (2017) 133462. doi: 10.1101/133462
31. Douglas GM, Maffei VJ, Zaneveld JR, Yurgel SN, Brown JR, Taylor CM, et al. PICRUSt2 for prediction of metagenome functions. Nat Biotechnol (2020) 38(6):685–8. doi: 10.1038/s41587-020-0548-6
32. Khanna AK, Meher S, Prakash S, Tiwary SK, Singh U, Srivastava A, et al. Comparison of ranson, Glasgow, MOSS, SIRS, BISAP, APACHE-II, CTSI Scores, IL-6, CRP, and procalcitonin in predicting severity, organ failure, pancreatic necrosis, and mortality in acute pancreatitis. HPB Surg (2013) 2013:367581. doi: 10.1155/2013/367581
33. Papachristou GI, Muddana V, Yadav D, O’Connell M, Sanders MK, Slivka A, et al. Comparison of BISAP, ranson’s, APACHE-II, and CTSI scores in predicting organ failure, complications, and mortality in acute pancreatitis. Off J Am Coll Gastroenterol | ACG (2010) 105(2):435–41. doi: 10.1038/ajg.2009.622
34. De Campos T, Cerqueira C, Kuryura L, Parreira JG, Soldá S, Perlingeiro JAG, et al. Morbimortality indicators in severe acute pancreatitis. JOP (2008) 9(6):690–7.
35. Alfonso V, Gomez F, Lopez A, Moreno-Osset E, del Valle R, Anton M, et al. Value of c-reactive protein level in the detection of necrosis in acute pancreatitis. Gastroenterol y Hepatol (2003) 26(5):288–93. doi: 10.1016/S0210-5705(03)70358-6
36. Kiss S, Pintér J, Molontay R, Nagy M, Farkas N, Sipos Z, et al. Early prediction of acute necrotizing pancreatitis by artificial intelligence: a prospective cohort-analysis of 2387 cases. Sci Rep (2022) 12(1):7827. doi: 10.1038/s41598-022-11517-w
37. Shung DL, Sung JJ. Challenges of developing artificial intelligence-assisted tools for clinical medicine. J Gastroenterol Hepatol (2021) 36(2):295–8. doi: 10.1111/jgh.15378
38. Mofidi R, Suttie SA, Patil PV, Ogston S, Parks RW. The value of procalcitonin at predicting the severity of acute pancreatitis and development of infected pancreatic necrosis: Systematic review. Surgery (2009) 146(1):72–81. doi: 10.1016/j.surg.2009.02.013
39. Dias BH, Rozario AP, Olakkengil SA, Anirudh V. Procalcitonin strip test as an independent predictor in acute pancreatitis. Indian J Surg (2015) 77(Suppl 3):1012–7. doi: 10.1007/s12262-014-1112-8
40. Riché FC, Cholley BP, Laisné M-JC, Vicaut E, Panis YH, Lajeunie EJ, et al. Inflammatory cytokines, c reactive protein, and procalcitonin as early predictors of necrosis infection in acute necrotizing pancreatitis. Surgery (2003) 133(3):257–62. doi: 10.1067/msy.2003.70
41. Guo ZZ, Wang P, Yi ZH, Huang ZY, Tang CW. The crosstalk between gut inflammation and gastrointestinal disorders during acute pancreatitis. Curr Pharm Des (2014) 20(7):1051–62. doi: 10.2174/13816128113199990414
42. Castoldi A, Favero de Aguiar C, Moraes-Vieira PM, Olsen Saraiva Camara N. They must hold tight: Junction proteins, microbiota and immunity in intestinal mucosa. Curr Protein Pept Sci (2015) 16(7):655–71. doi: 10.2174/1389203716666150630133141
43. Zhu Y, He C, Li X, Cai Y, Hu J, Liao Y, et al. Gut microbiota dysbiosis worsens the severity of acute pancreatitis in patients and mice. J Gastroenterol (2019) 54(4):347–58. doi: 10.1007/s00535-018-1529-0
44. Zheng J, Lou L, Fan J, Huang C, Mei Q, Wu J, et al. Commensal escherichia coli aggravates acute necrotizing pancreatitis through targeting of intestinal epithelial cells. Appl Environ Microbiol (2019) 85(12):e00059–19. doi: 10.1128/AEM.00059-19
45. Round JL, Mazmanian SK. The gut microbiota shapes intestinal immune responses during health and disease. Nat Rev Immunol (2009) 9(5):313–23. doi: 10.1038/nri2515
46. Mukherjee S, Vaishnava S, Hooper LV. Multi-layered regulation of intestinal antimicrobial defense. Cell Mol Life Sci (2008) 65(19):3019–27. doi: 10.1007/s00018-008-8182-3
47. Frank DN, St Amand AL, Feldman RA, Boedeker EC, Harpaz N, Pace NR. Molecular-phylogenetic characterization of microbial community imbalances in human inflammatory bowel diseases. Proc Natl Acad Sci U.S.A. (2007) 104(34):13780–5. doi: 10.1073/pnas.0706625104
48. Yang C, Mogno I, Contijoch EJ, Borgerding JN, Aggarwala V, Li Z, et al. Fecal IgA levels are determined by strain-level differences in bacteroides ovatus and are modifiable by gut microbiota manipulation. Cell Host Microbe (2020) 27(3):467–75 e6. doi: 10.1016/j.chom.2020.01.016
49. Yanagibashi T, Hosono A, Oyama A, Tsuda M, Suzuki A, Hachimura S, et al. IgA production in the large intestine is modulated by a different mechanism than in the small intestine: Bacteroides acidifaciens promotes IgA production in the large intestine by inducing germinal center formation and increasing the number of IgA+ b cells. Immunobiology (2013) 218(4):645–51. doi: 10.1016/j.imbio.2012.07.033
50. Lopez-Almela I, Romani-Perez M, Bullich-Vilarrubias C, Benitez-Paez A, Gomez Del Pulgar EM, Frances R, et al. Bacteroides uniformis combined with fiber amplifies metabolic and immune benefits in obese mice. Gut Microbes (2021) 13(1):1–20. doi: 10.1080/19490976.2020.1865706
51. Arias CA, Murray BE. The rise of the enterococcus: beyond vancomycin resistance. Nat Rev Microbiol (2012) 10(4):266–78. doi: 10.1038/nrmicro2761
52. Arvanitakis M, Dumonceau JM, Albert J, Badaoui A, Bali MA, Barthet M, et al. Endoscopic management of acute necrotizing pancreatitis: European society of gastrointestinal endoscopy (ESGE) evidence-based multidisciplinary guidelines. Endoscopy (2018) 50(5):524–46. doi: 10.1055/a-0588-5365
53. Brandl K, Plitas G, Mihu CN, Ubeda C, Jia T, Fleisher M, et al. Vancomycin-resistant enterococci exploit antibiotic-induced innate immune deficits. Nature (2008) 455(7214):804–7. doi: 10.1038/nature07250
54. Kinnebrew MA, Ubeda C, Zenewicz LA, Smith N, Flavell RA, Pamer EG. Bacterial flagellin stimulates toll-like receptor 5-dependent defense against vancomycin-resistant enterococcus infection. J Infect Dis (2010) 201(4):534–43. doi: 10.1086/650203
55. Sahar N, Kozarek RA, Kanji ZS, Chihara S, Gan SI, Irani S, et al. The microbiology of infected pancreatic necrosis in the era of minimally invasive therapy. Eur J Clin Microbiol Infect Dis (2018) 37(7):1353–9. doi: 10.1007/s10096-018-3259-x
56. Pan LL, Niu W, Fang X, Liang W, Li H, Chen W, et al. Clostridium butyricum strains suppress experimental acute pancreatitis by maintaining intestinal homeostasis. Mol Nutr Food Res (2019) 63(13):1801419. doi: 10.1002/mnfr.201801419
57. Kabeerdoss J, Sankaran V, Pugazhendhi S, Ramakrishna BS. Clostridium leptum group bacteria abundance and diversity in the fecal microbiota of patients with inflammatory bowel disease: a case-control study in India. BMC Gastroenterol (2013) 13:20. doi: 10.1186/1471-230X-13-20
58. Cen M-E, Wang F, Su Y, Zhang W-J, Sun B, Wang G. Gastrointestinal microecology: a crucial and potential target in acute pancreatitis. Apoptosis (2018) 23(7):377–87. doi: 10.1007/s10495-018-1464-9
59. Murphy EC, Frick IM. Gram-positive anaerobic cocci–commensals and opportunistic pathogens. FEMS Microbiol Rev (2013) 37(4):520–53. doi: 10.1111/1574-6976.12005
60. Neumann A, Björck L, Frick I-M. Finegoldia magna, an anaerobic gram-positive bacterium of the normal human microbiota, induces inflammation by activating neutrophils. Front Microbiol (2020) 11. doi: 10.3389/fmicb.2020.00065
61. Boyanova L, Markovska R, Mitov I. Virulence arsenal of the most pathogenic species among the gram-positive anaerobic cocci, finegoldia magna. Anaerobe (2016) 42:145–51. doi: 10.1016/j.anaerobe.2016.10.007
62. Zhang L, Shi J, Du D, Niu N, Liu S, Yang X, et al. Ketogenesis acts as an endogenous protective programme to restrain inflammatory macrophage activation during acute pancreatitis. eBioMedicine (2022) 78:103959. doi: 10.1016/j.ebiom.2022.103959
63. Lord RS, Bralley JA. Clinical applications of urinary organic acids. Part 2. Dysbiosis markers Altern Med Rev (2008) 13(4):292–306.
Keywords: acute pancreatitis, necrotizing pancreatitis, gut microbiota, dysbiosis, prognosis
Citation: Zou M, Yang Z, Fan Y, Gong L, Han Z, Ji L, Hu X and Wu D (2022) Gut microbiota on admission as predictive biomarker for acute necrotizing pancreatitis. Front. Immunol. 13:988326. doi: 10.3389/fimmu.2022.988326
Received: 07 July 2022; Accepted: 11 August 2022;
Published: 29 August 2022.
Edited by:
Hui Hua, Thorne HealthTech, United StatesReviewed by:
Kentaro Fukushima, Osaka University, JapanGang Wang, First Affiliated Hospital of Harbin Medical University, China
Copyright © 2022 Zou, Yang, Fan, Gong, Han, Ji, Hu and Wu. This is an open-access article distributed under the terms of the Creative Commons Attribution License (CC BY). The use, distribution or reproduction in other forums is permitted, provided the original author(s) and the copyright owner(s) are credited and that the original publication in this journal is cited, in accordance with accepted academic practice. No use, distribution or reproduction is permitted which does not comply with these terms.
*Correspondence: Dong Wu, wudong@pumch.cn; Xiaomin Hu, huxiaomin@pumch.cn
†These authors have contributed equally to this work and share first authorship