 Jin-Ya Liu
 Le-Ping Liu
 Ze Li4
 Yan-Wei Luo
 Fang Liang
94% of researchers rate our articles as excellent or good
Learn more about the work of our research integrity team to safeguard the quality of each article we publish.
Find out more
ORIGINAL RESEARCH article
Front. Immunol., 19 October 2022
Sec. Cancer Immunity and Immunotherapy
Volume 13 - 2022 | https://doi.org/10.3389/fimmu.2022.986214
This article is part of the Research TopicUnveiling the Tumor Microenvironment by Machine Learning to Develop New Immunotherapeutic StrategiesView all 36 articles
Background: Melanoma, as one of the most aggressive and malignant cancers, ranks first in the lethality rate of skin cancers. Cuproptosis has been shown to paly a role in tumorigenesis, However, the role of cuproptosis in melanoma metastasis are not clear. Studying the correlation beteen the molecular subtypes of cuproptosis-related genes (CRGs) and metastasis of melanoma may provide some guidance for the prognosis of melanoma.
Methods: We collected 1085 melanoma samples in The Cancer Genome Atlas(TCGA) and Gene Expression Omnibus(GEO) databases, constructed CRGs molecular subtypes and gene subtypes according to clinical characteristics, and investigated the role of CRGs in melanoma metastasis. We randomly divide the samples into train set and validation set according to the ratio of 1:1. A prognostic model was constructed using data from the train set and then validated on the validation set. We performed tumor microenvironment analysis and drug sensitivity analyses for high and low risk groups based on the outcome of the prognostic model risk score. Finally, we established a metastatic model of melanoma.
Results: According to the expression levels of 12 cuproptosis-related genes, we obtained three subtypes of A1, B1, and C1. Among them, C1 subtype had the best survival outcome. Based on the differentially expressed genes shared by A1, B1, and C1 genotypes, we obtained the results of three gene subtypes of A2, B2, and C2. Among them, the B2 group had the best survival outcome. Then, we constructed a prognostic model consisting of 6 key variable genes, which could more accurately predict the 1-, 3-, and 5-year overall survival rates of melanoma patients. Besides, 98 drugs were screened out. Finally, we explored the role of cuproptosis-related genes in melanoma metastasis and established a metastasis model using seven key genes.
Conclusions: In conclusion, CRGs play a role in the metastasis and prognosis of melanoma, and also provide new insights into the underlying pathogenesis of melanoma.
Melanoma is a malignant tumor caused by aberrant melanocyte proliferation. It has a high fatality rate and is prone to metastasis. According to the 2020 global cancer statistics, skin melanoma ranks 19th among the most common cancers in the world (1), with the number of new cases rising to 324,635 and the number of deaths rising to 57,043. Melanoma is one of the malignant tumors with an extremely high metastasis rate. Its metastasis is characterized by local metastasis through lymphatics first, and then systemic metastasis through blood. Local surgery is the main treatment for early melanoma, while palliative remission is the main treatment for aggressive metastatic melanoma due to poor treatment effects (2). Second, as the most heterogeneous tumor, melanoma is prone to misdiagnosis and treatment failure (3). Melanoma can be classified into nine types according to epidemiology, clinical and histologic morphology, and genomic characteristics, namely low-cumulative solar damage (CSD) melanoma, high-CSD melanoma, Desmoplastic melanoma, Spitz melanomas, Acral melanoma, Mucosal melanomas, Melanomas arising in congenital nevi, Melanomas arising in blue nevi, Uveal melanoma (4). Characteristics of precursor lesions of different subtypes play a certain role in the prevention and early treatment of melanoma. Ultraviolet radiation is one of the main risk factors for the formation of melanoma, and sun exposure is also an important criterion for classifying melanoma types (5). However, little research has been done on melanoma subtypes. Due to the high mortality rate of melanoma, subtyping studies are also extremely important for the individualized treatment of patients.
Cuproptosis is a novel form of cell death induced by copper ionophores (6, 7). Under normal circumstances, cells maintain a relatively low level of intracellular copper through homeostatic mechanisms to prevent excessive copper accumulation leading to cellular damage. Copper ions in the body combine with enzymes and play a major role in blood coagulation, hormone maturation, and energy metabolism (8–11). Within tumor tissue, unbalanced copper levels can cause irreversible damage to tumor tissue. It induces various forms of tumor cell death including apoptosis and autophagy through mechanisms such as reactive oxygen species accumulation, proteasome inhibition, and anti-angiogenesis (11, 12). Studies have shown that copper chelate, taken orally with food, has antitumor and antimetastatic benefits in animals and humans (13). Recent studies have identified specific roles of copper in oncogenic signaling pathways and antitumor drug resistance (14).
In recent years, machine learning has been applied more and more deeply in the field of life sciences, and more and more studies have shown that machine learning plays an important role in medical big data and can effectively mine new information (15–18). With the development of microarray and sequencing technology, the gene expression data of various diseases is also increasing, and machine learning has emerged in the processing of gene expression data of various cancers (19). Machine learning can predict the occurrence and prognosis of cancer, as well as unearth new biomarkers of cancer (20, 21). This study aims to use machine learning combined with bioinformatics to classify melanoma based on cuproptosis-related genes (CRGs) and to establish melanoma prognosis and metastasis models.
In this study, we combined the transcriptional information of melanoma samples from seven GEO datasets and TCGA datasets to screen out a total of 12 CRGs. Then the molecular subtypes and gene subtypes of CRGs were constructed according to clinical characteristics and gene expression. Next, we explored the prognostic role of these CGRs between different subtypes, performed functional analysis of differentially expressed genes between different subtypes, and established a prognostic model. In addition, we performed tumor microenvironment analysis and drug sensitivity analysis. Finally, to further understand the role of CRGs in melanoma development, we established metastasis models based on CRGs using 9 different machine learning algorithms. Figure 1 shows the flow chart of this study.
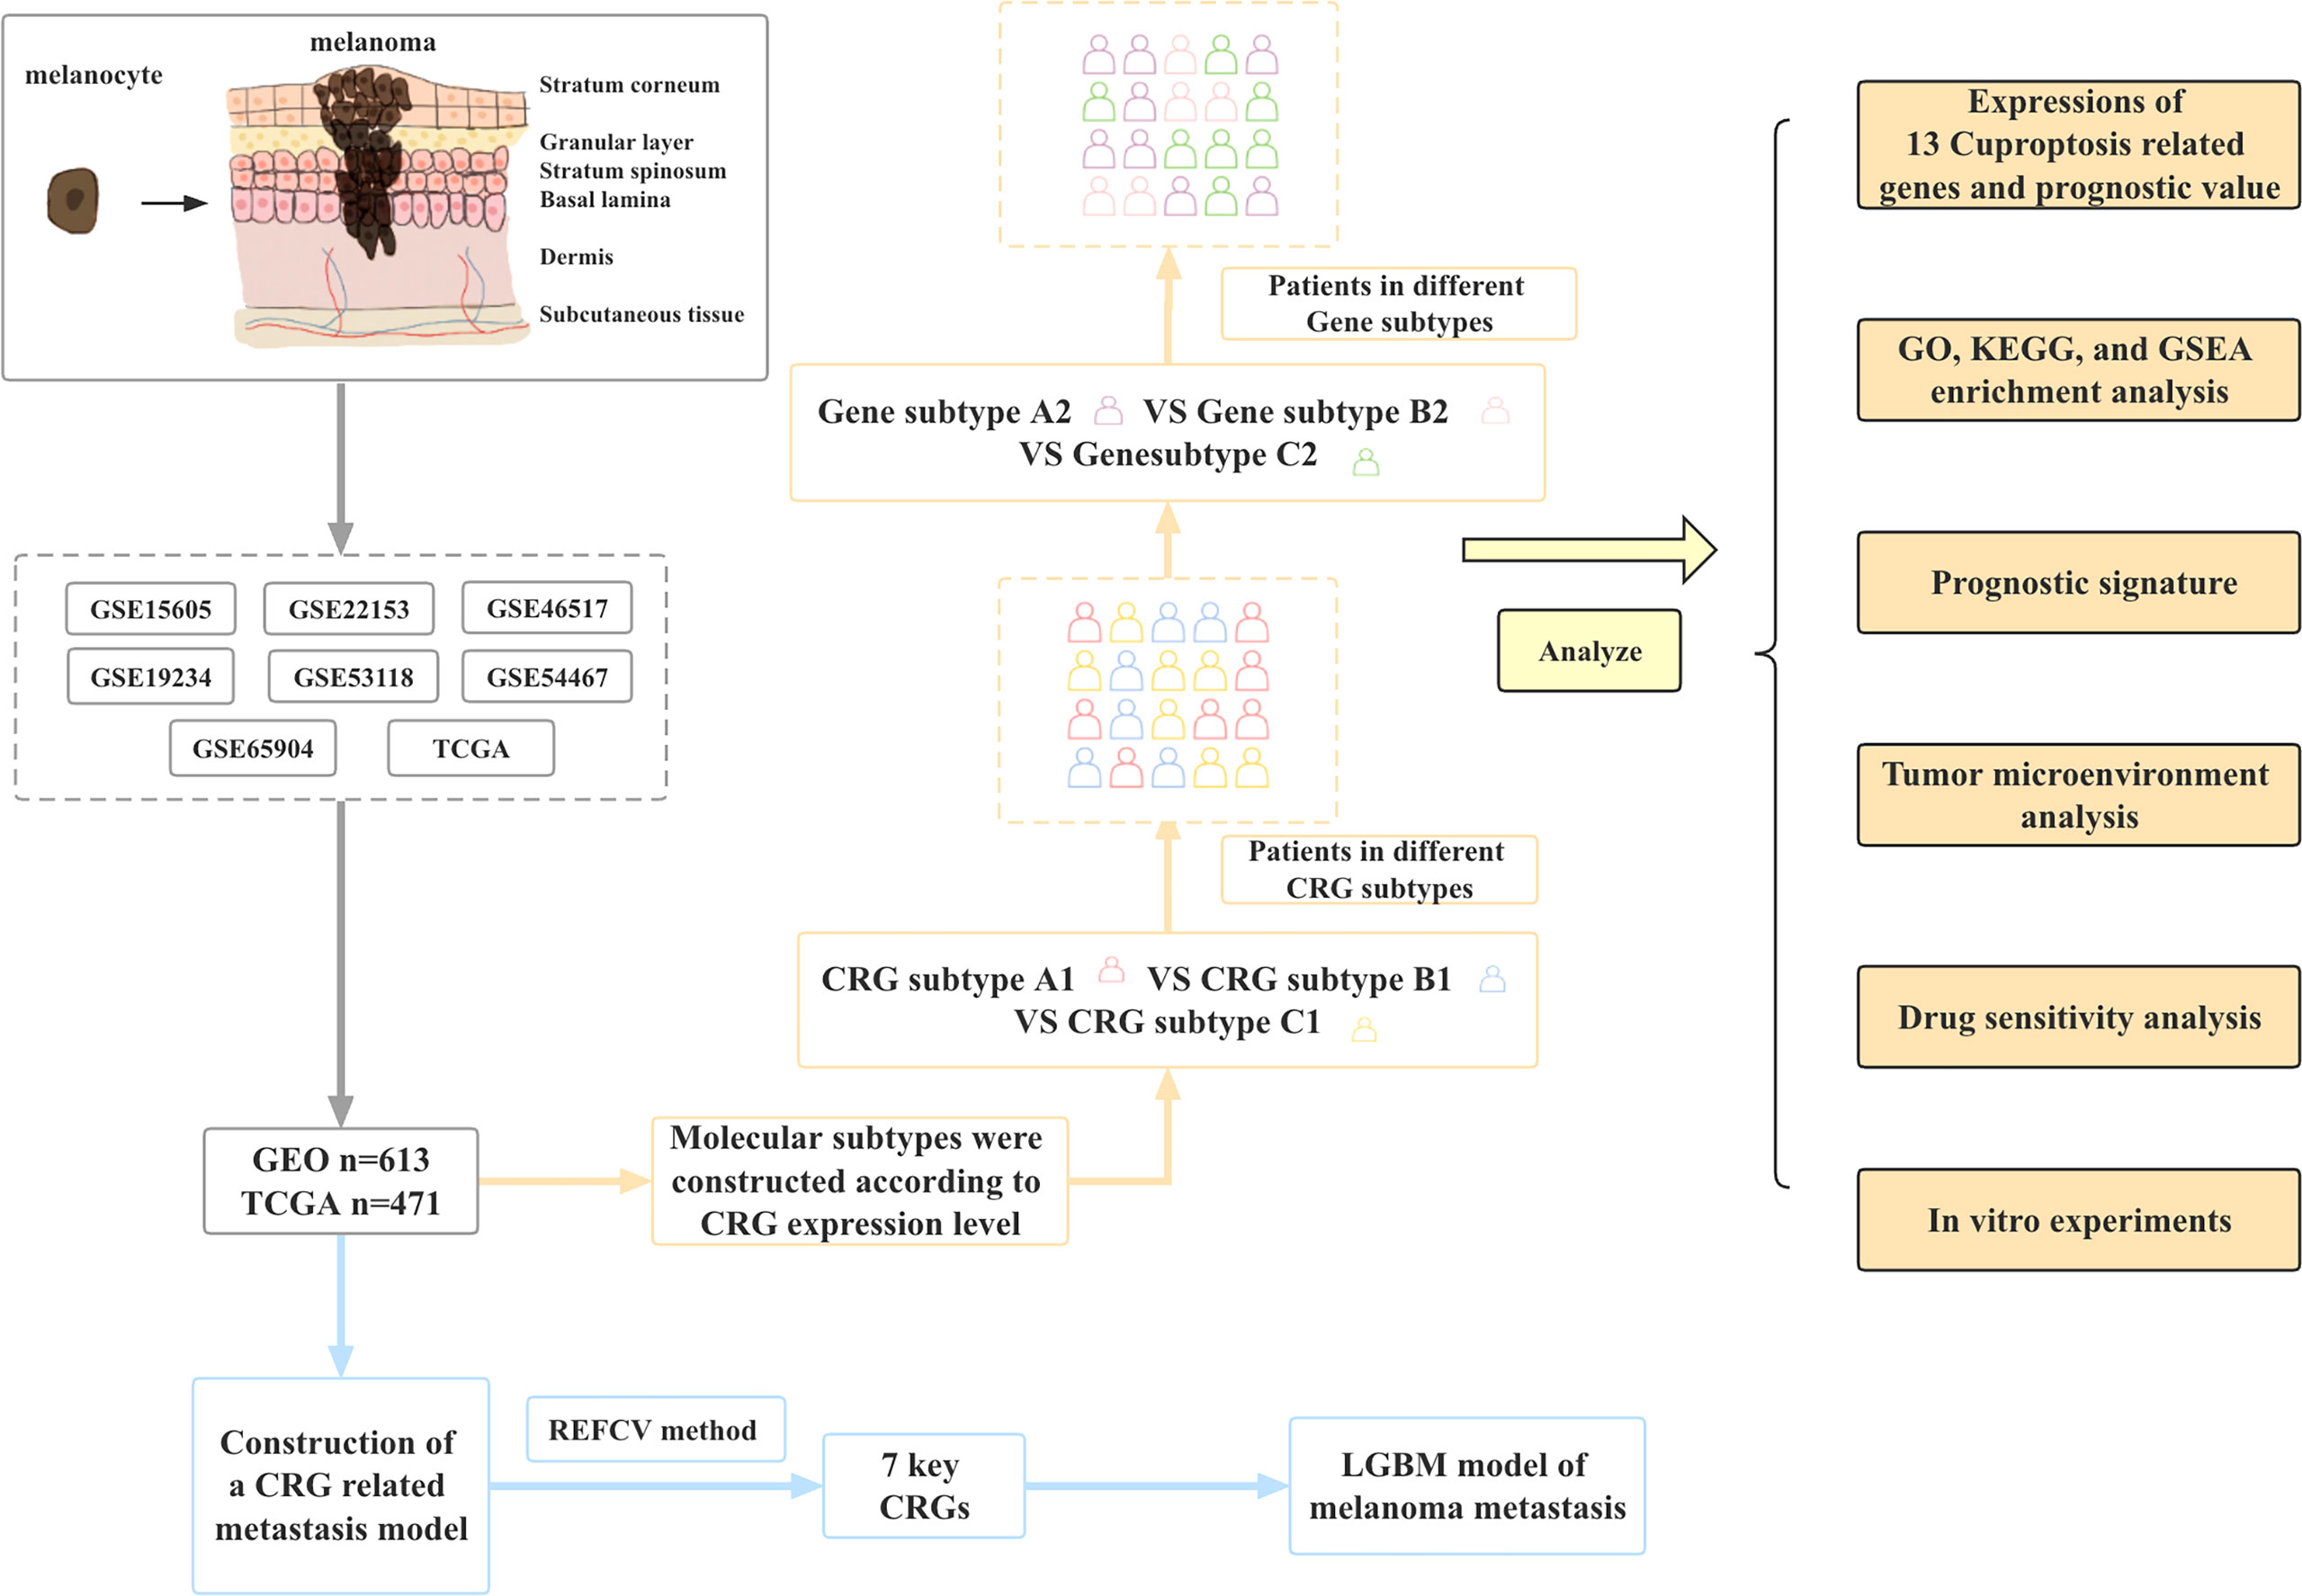
Figure 1 Article framework and workflow.
We screened melanoma datasets in two databases, GEO (https://www.ncbi.nlm.nih.gov/geo/.) and TCGA (http://portal.gdc.cancer.gov/). A total of 7 datasets related to prognosis and metastasis were downloaded from the GEO database [datasets containing prognostic information: GSE19234, GSE22153, GSE54467, GSE69504 (394 melanoma samples)]. Datasets containing metastasis information: GSE15605, GSE22153, GSE46517 (219 samples)). Similarly, we screened melanoma samples in the TCGA database and found 472 samples with prognostic information, of which 471 were melanoma samples. We merged datasets containing prognostic information (GSE19234, GSE22153, GSE54467, GSE69504) with the TCGA dataset. Then, the “perl” language was used to convert the probe matrix into a genes matrix based on the annotation information. Next, we converted the TCGA dataset to TPM format, so that the data form of TCGA was more similar to that of GEO. The “merge” package was used to merge the TCGA dataset with the GEO dataset, and the “sva” package in the R language was used to do a batch correction. Finally, we obtained 862 melanoma samples containing prognostic information and 628 samples containing metastasis information, respectively. In subsequent analyses, we used these combined datasets to build melanoma prognostic models and metastasis models.
In the TCGA cohort, “maftools” was used to map the mutation frequencies of CRGs, shown as waterfall plots. Likewise, we analyzed the copy number of CRG in melanoma. The “RCircos” package was used to draw copy number circle diagrams. Next, we constructed a prognostic model based on 12 CRGs (7) in the combined TCGA and GEO cohort. First, we extracted the expression levels of CRGs in datasets with prognostic information and then merged clinical data. The “survival” package was used for survival analysis, cox analysis was used for univariate analysis, and KM analysis was used for survival status analysis.
We obtained 13 CRGs (Supplementary Table 1) from previous studies, and after deleting unexpressed CRGs in some samples, we finally selected 12 CRGs for model construction. Consensus Clustering is an unsupervised clustering method and a common research method for cancer subtype classification. It can differentiate samples into different subtypes based on different omics data sets, so as to discover new disease subtypes or perform a comparative analysis of different subtypes. The “ConsensusClusterPlus” R package was used to perform consensus clustering to distinguish different molecular subtypes based on the mRNA expression levels of 12 CRGs. Next, to further analyze the differences between subtypes. We adopted the t-distributed stochastic neighbor embedding (t-SNE) method to explore the distribution of different subtypes, and the “R t sne” R package was used to estimate the effect of classification. Furthermore, we analyzed the extent of immune cell infiltration between different subtypes. The “heatmap” R package was used to analyze the expression levels of CRGs, tumor grade, gender, and age among different subtypes. Finally, the “GSVA” R package was used to analyze the enriched pathways between different subtypes and displayed as heatmaps.
To further understand the correlation between molecular subtypes and differentially expressed genes, we performed gene subtypes. The “limma” R package was used to analyze the differentially expressed genes between different subtypes (logfc > 0.585, p-value < 0.05). After obtaining the differentially expressed genes between each subtype, we took the intersection genes for subsequent analysis. “clusterPrfiler” was used to perform GO enrichment analysis (p-value < 0.05). Similarly, Metascape website (http://metascape.org) (version 2022-04-22) was used to perform enrichment analysis of 71 intergenes.Terms with a P value1.5 are collected and grouped into clusters depended on their membership similarities. The “limma” and “survival” packages were used to analyze the differentially expressed genes associated with prognosis. The Univariate cox regression analyses were used to find intersecting genes associated with prognosis (p-value<0.05). Next, we used the Consensus Clustering method to type the samples according to the expression levels of the intersecting genes. After finding the subtype with the highest internal correlation, survival analysis and clinical trait analysis were performed on different subtypes. We show the above analysis results with KM curve and heat map respectively. Finally, the “limma” package was used to analyze the expression levels of CRGs in different gene types and displayed as boxplots.
We divide the samples into training and validation sets in a 1:1 ratio. In the training set, differentially expressed genes associated with prognosis were used to perform Least Absolute Shrinkage and Selection Operator (LASSO) Cox regression analysis through the “glmnet” R package. The risk score was equal to the LASSO regression coefficient for each mRNA multiplied by the sum of the normalized expression levels for each mRNA. Next, we analyzed the AUC of the training set, the validation set, and all samples. Then, based on the samples with survival information, nomogram plots were constructed using the “rms” R package to predict the 1-, 3-, and 5-year survival probabilities of patients. A calibration plot was constructed to assess the agreement of the probabilities predicted by the nomogram with the actual values.
The “CIBERSORT” package was used to perform immune cell infiltration analysis. We analyzed the correlation between 6 key variable genes (AIM2, EDNRB, SLC39A6, TMEM117, PTPRC, and KIF14) and immune cells. At the same time, we also analyzed the correlation between the two prognostic risk groups and the tumor microenvironment. The “estimate” package was used to score the tumor microenvironment in the high-risk and low-risk groups and displayed in a violin plot. Then, we performed a drug sensitivity analysis based on the risk score results. We combined the sample’s risk score and drug sensitivity. Then, the high-risk and low-risk groups were analyzed for their sensitivity to the drug, and results with significant differences (p-value > 0.001) were represented by boxplots.
We integrated all GEO datasets (GSE15605, GSE21153, GSE46517) with melanoma metastasis information. 70% of the samples were set as the training set, and the remaining 30% of the samples were set as the validation set. We used the REFCV method to screen out key metastatic variables by python 3.7. The main idea of recursive feature elimination (REF) is to build the model iteratively and then select the best (or worst) features (selected according to the coefficients). Set the selected features aside and repeat the process on the remaining features until all features are traversed. The order that is eliminated in this process is the ordering of features. REFCV is REF + CV (cross-validation). Its operating mechanism is first to use REF to obtain the ranking of each feature, and then based on the ranking, select [min_features_to_select, len(feature)] feature subsets for model training in turn and cross-validation, and finally select the feature subset with the highest average score. (python 3.7 sklearn 0.22.1 package).
We then use these key variables to build models using 9 different machine learning algorithms (XGBoost’, ‘Logistic’, ‘LightGBM’, ‘RandomForest’, ‘AdaBoostClassifier’, ‘GaussianNB’, ‘ComplementNB’, ‘SVC’ ‘, ‘KNeighbors). Using the cross-validation method, the random seed is set to 1 and the fold is 15. The performance of each model was compared using multi-model forest plots, AUC, accuracy, and F1 values to screen out the best performing models. All Statistical analyses in the process of construction of the metastasis model were performed using python version 3.7 and the Extreme Smart Analysis platform (https://www.xsmartanalysis.com/) (22).
After filtering out the best performing models, use the “SHAP” package (version 0.39.0, python 3.7) to explain the importance and contribution of key variables to the model. At the same time, use the force diagram to illustrate 2 samples to show how different variables contribute in different samples (“SHAP” package version 0.39.0, python 3.7). All Statistical analyses in this part were performed using python version 3.7 and Extreme Smart Analysis platform (https://www.xsmartanalysis.com/).
The “survival” package was used for survival analysis, cox analysis was used for univariate analysis, and KM analysis was used for survival status analysis. Principal Component Analysis (PCA) was used to demonstrate the differences between CRG subtypes.The “ConsensusClusterPlus” package was used for the subtyping of CRG subtypes and gene subtypes. Lasso regression was used to screen for genes associated with prognosis, and prognostic models were developed using multivariate regression analysis. Wilcoxon rank sum test was used to compare TME scores between the high-risk and low-risk groups. The ROC curve was used to assess the predictive power of the prognostic model. There are several R packages, including “RCircos”, “heatmap”, and “ggplot” packages for generating graphs. P < 0.05 is considered statistically significant.The python software (version 3.7) used in the establishment of the melanoma metastasis model was used for statistical analysis. The REFCV method of the sklearn 0.22.1 package was used to screen key variables in the melanoma metastasis model. In the modeling process of various machine learning algorithms, the xgboost 1.2.1 package was used to perform the XGBoost algorithm, the lightgbm 3.2.1 package was used to perform the LightGBM algorithm, and the sklearn 0.22.1 package was used Used to run other machine learning algorithms. The shap 0.39.0 package was used to demonstrate model interpretability (SHAP graph, feature importance ranking graph, force graph).
Human malignant melanoma cell line A375 were cultured in Dulbecco’s modified Eagle’s medium (DMEM, Gibco), supplemented with 10% (v/v) heat-inactivated fetal bovine serum (FBS, Gibco) at 37°C in a humidified incubator containing 5% CO2. FDX1 siRNAs (1#: 5’-CAUUAACAACCAAAGG AAA-3’, 2#: 5’-CAUCUUUGAAGAUCACAUA-3’) and control siRNA (5’-UUCUCCGAACGU GUCACGU-3’) were obtained from Sangon (Shanghai, China). Transfection of siRNAs was performed with Lipofectamine RNAiMAX Transfection Reagent (Thermo Fisher) as recommended.
The protein was extracted using RIPA buffer (Beyotime) and the protein concentration was determined using the BCA Protein Assay Kit (Pierced, Grand Island, NY). Protein samples were separated by 12% SDS-PAGE and transferred onto polyvinylidene difluoride membranes ((PVDF, Millipore). To assess the protein expression, the blots were incubated with the primary rabbit antibodies against FDX1 (Abcam) and anti-rabbit secondary antibodies (Cell Signaling Technology) at a dilution of 1:2000 for 1 h at room temperature. β-Actin(Cell Signaling Technology) served as an endogenous control for equal loading.
The CCK-8 reagent was purchased from GLPBIO (GK10001). Briefly, A375 cells transient transfecting FDX1 siRNA (siFDX1) or the control siRNA (siNC) were seeded at 2x10⁴ cells per well in 96-well plates in quintuplicate, the number of viable cells in each well was measured at 0, 12, 24, and 36 hours according to the manufacturer’s instructions.
For wound healing assay, when the cells were grown to 90% confluence after transfection, a straight scratch in the cell monolayer was created by a 10μL pipette tip. A375 cells were incubated with 2% FBS. Images of the scratched area (wound) were taken at the time point of 0h, 24 h, 36 h, and 48 h under a microscope. Wound closure= (original wound area - existing wound area)/original wound area. The area of wound healing was calculated by Fiji (version Fiji for Mac OS X).
Statistical analysis was performed using software of Graph Pad Prism 5 (GraphPad, La Jolla, CA). Student’s t-tests were used to evaluate significant differences between any two groups of data. All data are represented as means ± SEM. Differences were considered significant if p < 0.05.
Flow chart of data collection and data analysis for the article (Figure 1).
Among the 467 samples in the TCGA dataset, 56 patients had CRGs mutations (S1 A). Meanwhile, CRGs chromosome positions are shown as copy number variant plots (S1 B). Besides, the frequency of CRGs copy number variation in the samples is shown graphically (S1 C), with red representing an increase in copy number and green representing a decrease in mutation. The graphs show a significantly reduced number of mutations in DBT, FDX1, and DLA. Next, we analyzed the association of CRGs with prognosis after combining the TCGA and GEO datasets. 9 of the 13 CRGs were associated with prognosis (S2 A-I). Moreover, Kaplan–Meier analysis results revealed that a higher expression of LIPT1, FDX1, LIAS, and DBT was associated with a better OS (P < 0.05), and a lower expression of ATP7B, SLC31A1, PDHA1, DLD, and DLST was associated with a better OS (P < 0.05).
To obtain the melanoma subtypes of CRGs, we performed a consensus clustering analysis on the expression level of CRGs on the combined GEO and TCGA datasets. In the cluster analysis of 862 samples, K = 3 was the optimal number of clusters. When K=3, the difference between groups was the smallest, and the difference outside the group was the largest. Therefore, we accurately divided melanoma patients into 3 subtypes, namely A1, B1, and C1 (Figure 2A). When dividing melanoma patients into 3 subtypes, the relative change in the area under the CDF curve indicated that the stable distribution of melanoma patients was close (Figure 2B, C). In the Kaplan Meier analysis of A1, B1, and C1 subtypes, the survival outcome of the C1 subtype was the best, followed by the B1 subtype, and the worst survival outcome of the A1 subtype (Figure 2D).
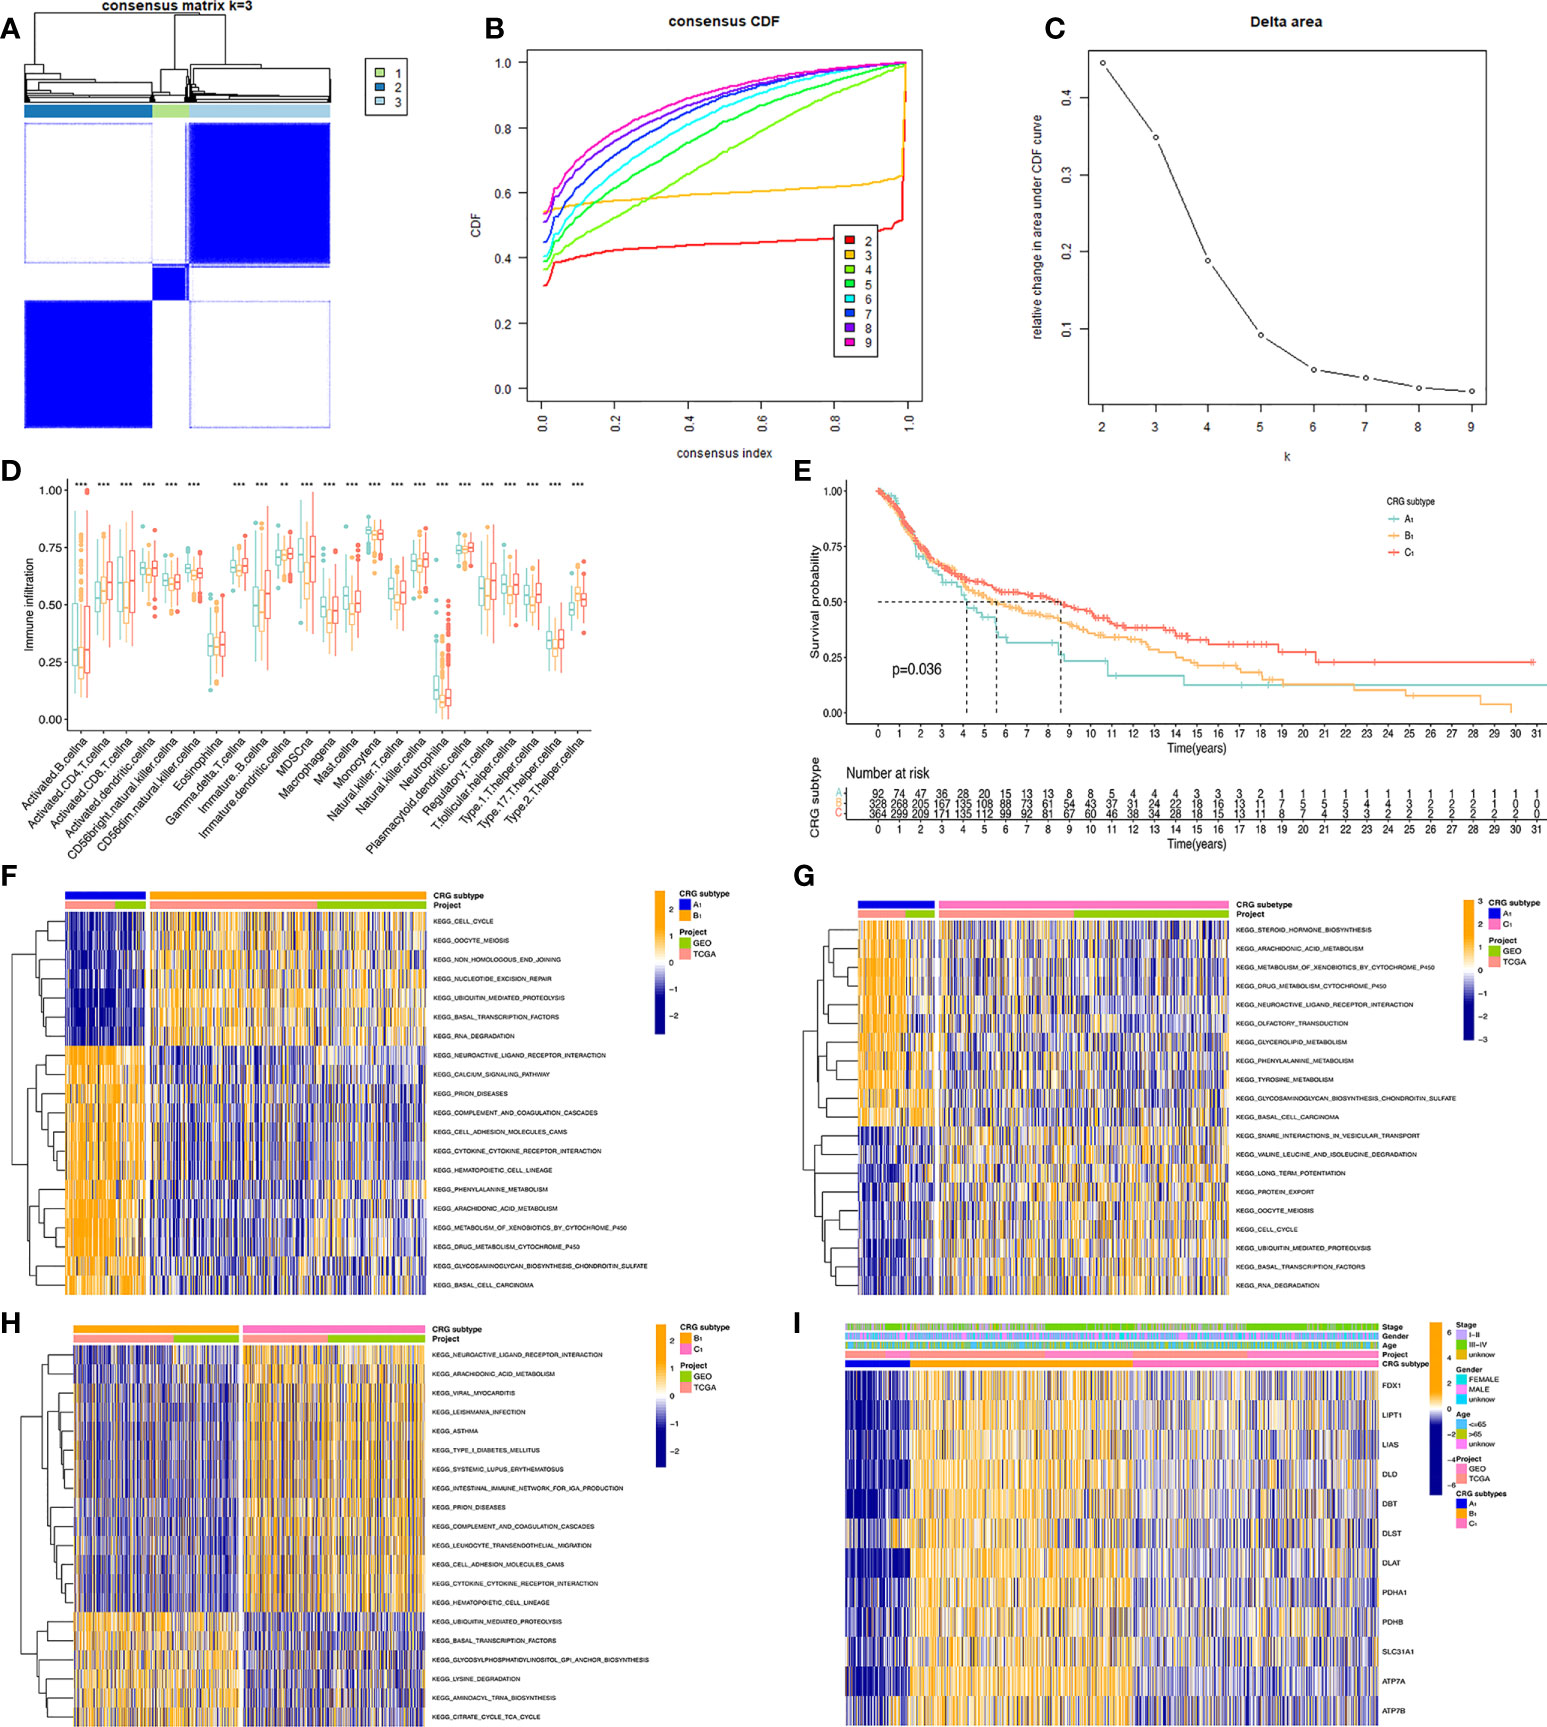
Figure 2 Classification of melanoma based on CRGs. (A) Molecular subtypes based on CRGs obtained under unsupervised consensus clustering. (B) The empirical cumulative distribution function (CDF) plot depicts the consistent distribution of different K values. (C) Relative increase in cluster stability by delta area fraction. (D) Comparison of the degree of immune cell infiltration of the three molecular subtypes*, P<0.05; **, P<0.01; ***, P<0.001. (E) Kaplan Meier analysis results of three molecular subtypes based on 12 CRGs. (F, G, H) pictures show the enriched pathways of differentially expressed genes obtained by comparing A1, B1, and C1 molecular subtypes with each other using the GSVA method. (I) Heatmap of clinical information and gene expression profiles of the three molecular subtypes based on 12 CRGs.
We present the expression level of CRGs and clinical traits, such as Stage, Gender, and Age of the A1, B1, and C1 subtypes in a heat map. CRGs were expressed at the highest level in the B1 subtype, followed by the C1 subtype, and lowest in the A1 subtype. Then, GSVA enrichment pathway analysis was performed on three different subtypes (Figures 2F–H). Comparing the A1 subtype and the B1 subtype, it was found that the B1 subtype was significantly more enriched than the A1 subtype in cell cycle, non-homologous end linkage, and ubiquitination-mediated hydrolytic protein action. A1 subtype showed significantly higher levels of enrichment in pathways such as neuroactive ligand receptor interactions, cytochrome p450 effects on foreign biometabolism, and drug metabolism of cytochrome p450 than B1. Comparing the A1 and C1 subtypes, the A1 subtype showed significantly higher levels of enrichment in the drug metabolism cytochrome p450, glycerolipid, and tyramine metabolism pathways than the C1 subtype. The C1 subtype was slightly more enriched than the A1 subtype in pathways such as trap interactions in vesicle transport, ubiquitin-mediated protein hydrolysis, and protein efflux. Comparing the B1 subtype and C1 subtype, the enrichment level of the C1 subtype is higher than that of the B1 subtype in pathways such as neuroactive ligand receptor interaction, complement system, and leukocyte endothelial migration. The B1 subtype was significantly more enriched in ubiquitin-mediated protein hydrolysis, aminyl biosynthesis, and citric acid cycle TCA cycle pathways than the C1 subtype.
Further, we analyzed the level of immune cell infiltration between three CRGs subtypes. Among the 23 immune cells, most of them differed in their degree of infiltration in the A1, B1, and C1 subtypes. Among them, Myeloid-derived suppressor cells (MDSC), Immature B cells, and active B cells had the highest difference in the degree of infiltration, and only Eosinophilna cells had no difference in the degree of infiltration. Overall, the highest level of immune cell infiltration was found in the C1 subtype and the lowest in the B1 subtype.
t-distributed stochastic neighbor embedding(tSNE) analysis showed that the A1, B1, and C1 subtypes are distinguishable from each other. This indicates that our subtype analysis based on CRGs has better typing ability (Figure 3A). Next, we analyzed the differentially expressed genes between A1, B1, and C1 subtypes. There were 1090 differentially expressed genes between A1 and B1 subtypes, 117 differentially expressed genes between A1 and C1 subtypes, and there are 219 Differentially expressed genes between the B1 and C1 subtypes. We intersected the differentially expressed genes of the three subtypes and obtained 71 differentially expressed genes that were co-expressed in the three subtypes (Figure 3B). Enrichment analysis in Metascape showed that differentially expressed genes were mainly associated with Signaling by Rho GTPases, Miro GTPases and RHOBTB3, MHC class II antigen presentation, and Platinum drug resistance (Figure 3C). GO (Gene ontology) enrichment analysis indicates the results of intersecting genes in BP (Biological Process), CC (Cellular Component), MF (Molecular Function) respectively (Figure 3D). BP is primarily associated with the establishment of organelle localization, mitotic cell cycle phase transitions, and cytoskeletal-intracellular transport dependence. CC is associated with cell cortex, cell division sites, and membrane microstructure domains. MF is mainly associated with the guanosine triphosphatase binding region, ATP hydrolysis activity, and microtubule binding proteins.
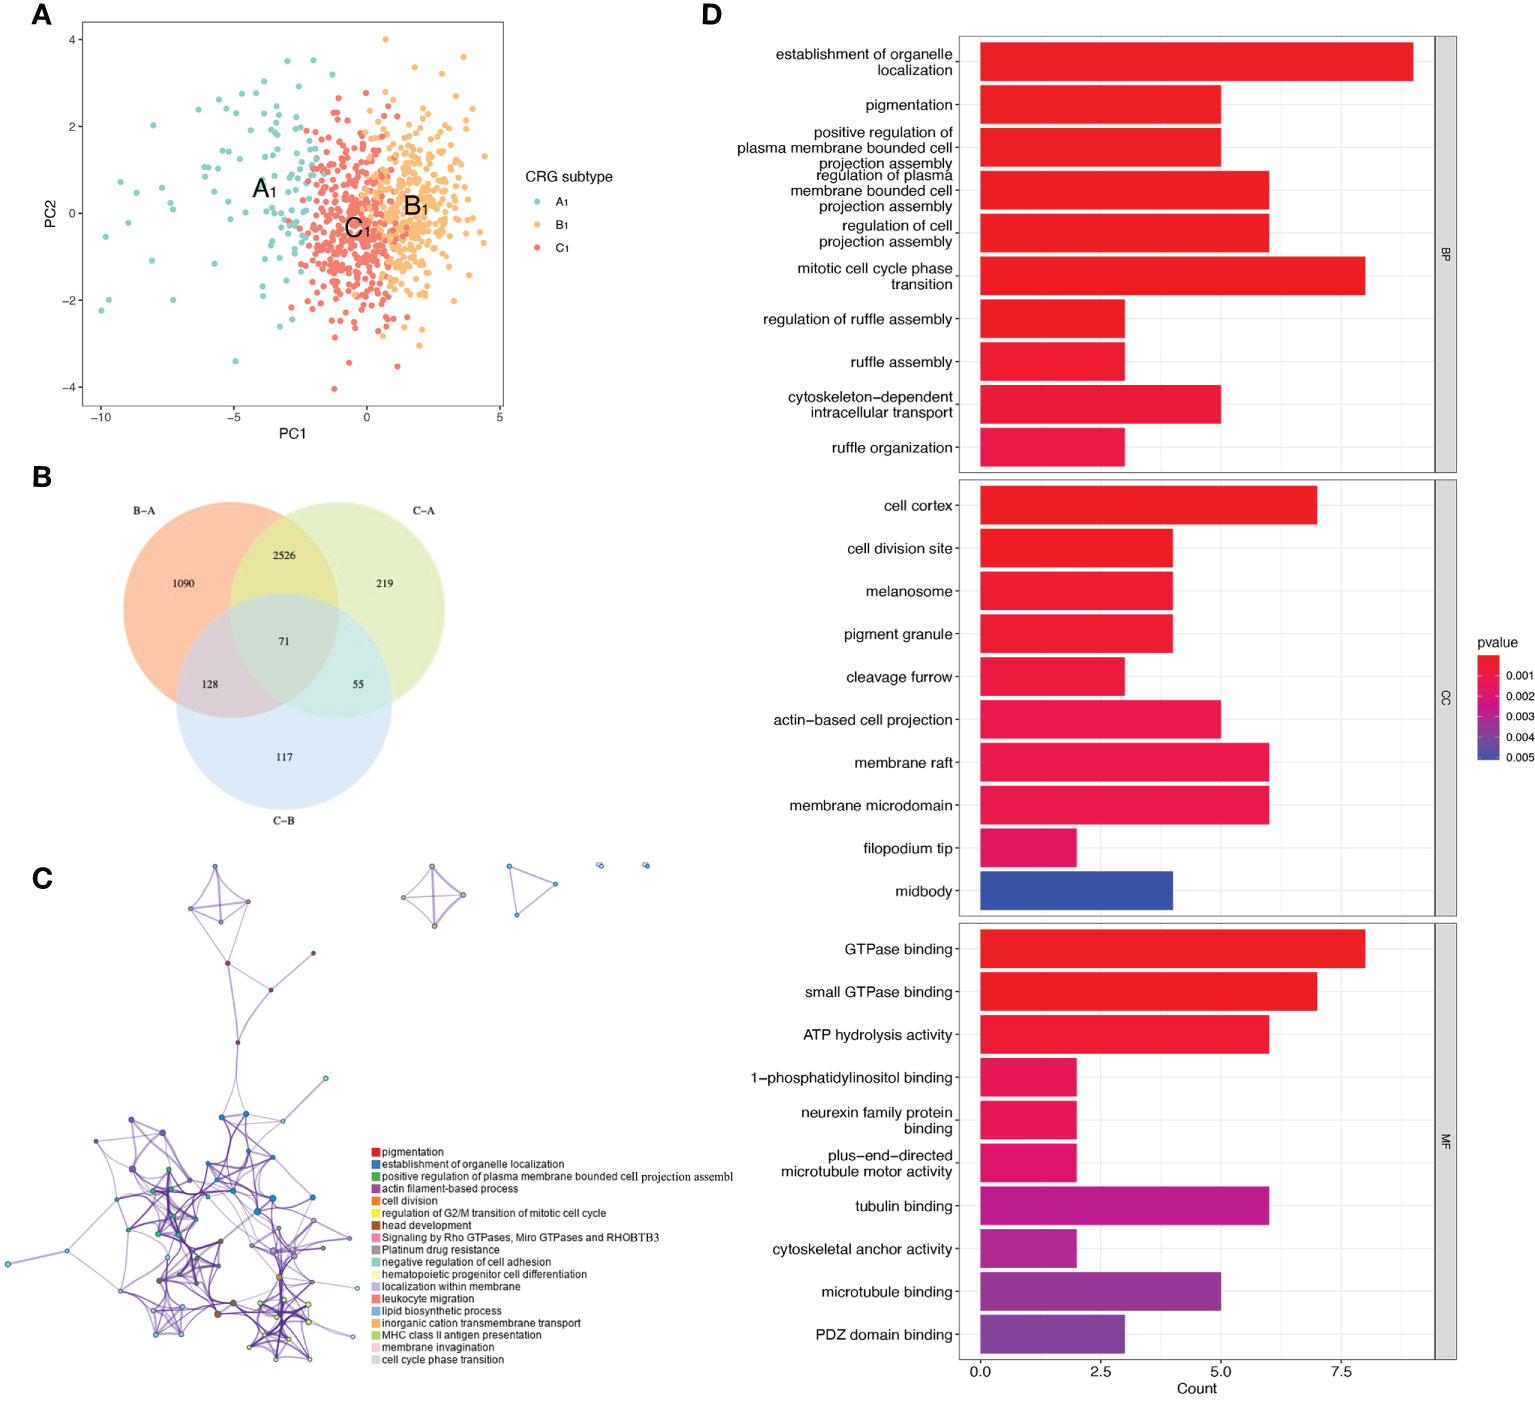
Figure 3 Differentially expressed genes of three CRGs molecular subtypes. (A) VENN plot showing 71 intersecting differentially expressed genes across three molecular subtypes. (B) t-distributed Stochastic Neighbor Embedding (tSNE) analysis of three CRGs molecular subtypes. (C) Metascape enrichment analysis of DEGs with intersections of the three molecular subtypes. (D) GO enrichment analysis of DEGs with intersections of the three molecular subtypes.
To further understand the correlation between CRGs subtypes and differentially expressed genes, we constructed gene subtypes. We performed univariate regression analysis on 71 differentially expressed genes co-expressed in the three CRGs subtypes, and obtained 16 differentially expressed genes associated with survival. In the cluster analysis, when K=3, we can see that the difference between groups is small, and the difference outside the group is large (S3 A). The comprehensive analysis of the consistent cumulative distribution function (S3 B) and Delt area(S3 C) also shows that K=3 is more suitable. Kaplan Meier analysis was performed on the three gene subtypes, with B2 having the best survival outcome, A2 having the second worst survival outcome, and C2 having the worst survival outcome (S3 D) (P-value<0.001). Then, we illustrate the clinical traits (stage, gender, age)of both gene subtypes and CRGs molecular subtypes in a heat map (S3 E). Besides, we explored the differences in the expression levels of CRGs among the A2, B2, and C2 subtypes. We found that the expression of CRGs was different in A2, B2, and C2 subtypes (p<0.001) (S3 F).
A Sankey diagram was used to show our flow chart for two types of melanoma (Figure 4A). AIM2, EDNRB, SLC39A6, TMEM117, PTPRC, and KIF14 were screened out by the LASSO regression algorithm to construct a prognostic model (Figures 4B, C). In the training set, there was a significant difference in prognostic value between the high-risk and low-risk groups (Figure 4D). Survival time was significantly lower in the high-risk group than in the low-risk group. The areas under the time-dependent ROC of the train set are 0.670, 0.662 and 0.683 for 1-, 3-, and 5-year survival. (Figure 4G). Next, the prognostic model was applied to the validation set and to the total sample. In the validation set and in the total sample, the prognostic value of the high-risk group was significantly lower than that of the low-risk group (Figures 4E, F). The areas under the time-dependent ROC of the validation set are 0.587, 0.620, and 0.601 for 1-, 3-, and 5-year survival (Figure 4H). In the total sample, The areas under the time-dependent ROC are 0.626, 0.640 and 0.643 (Figure 4I). The ROC of each group shows that our model has better prediction accuracy. Finally, we used nomograms to predict patient survival (Figure 4J). Calibration curves showed that our model had high accuracy in predicting patient survival at 1, 3, and 5 years (Figure 4K).
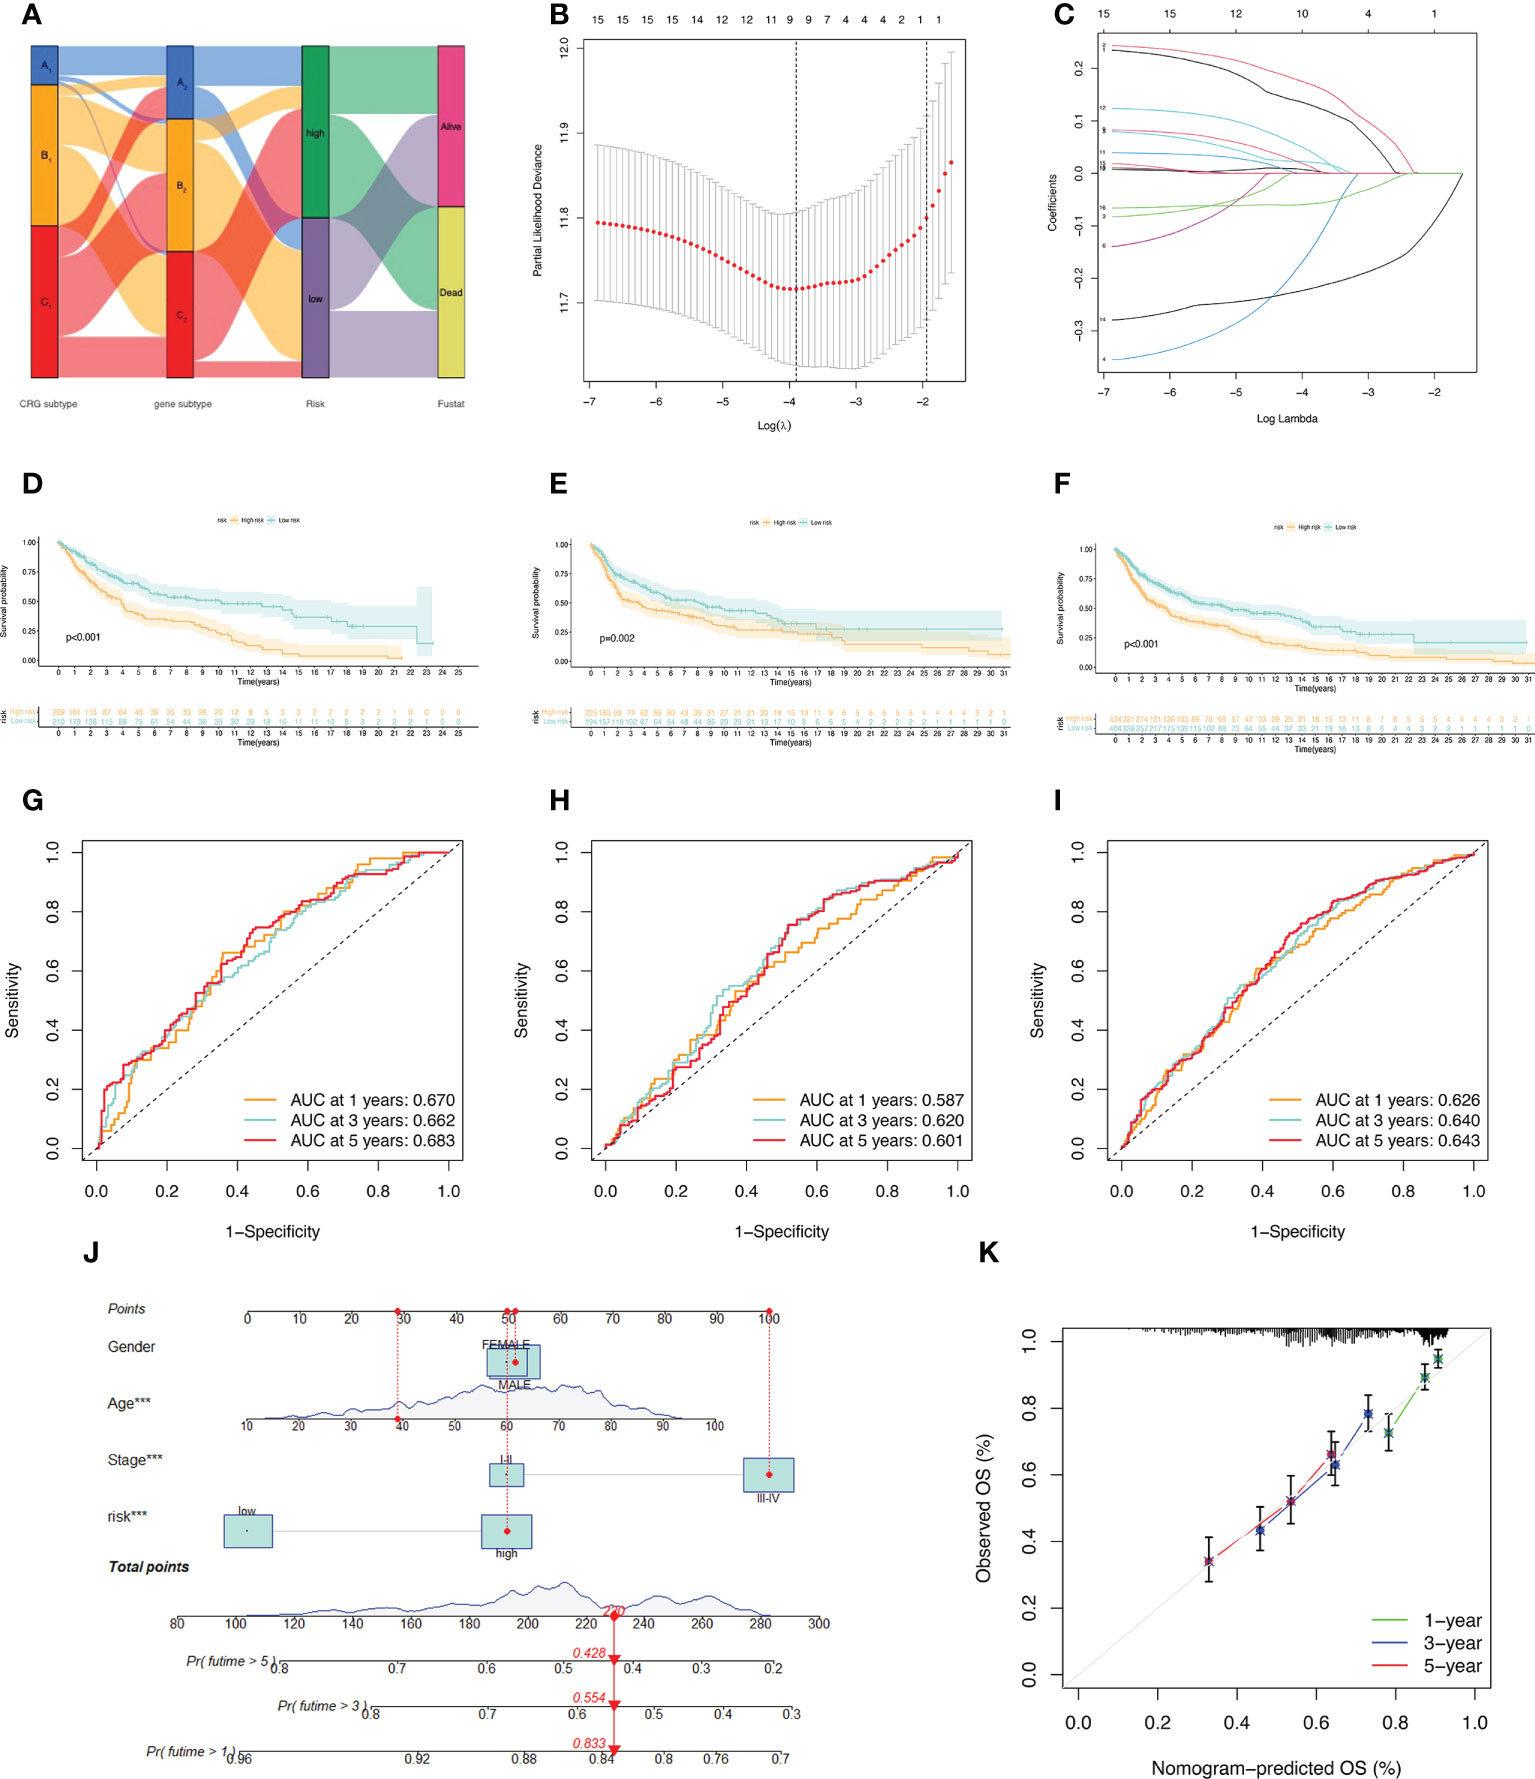
Figure 4 Construction of the prognostic model. (A) Sankey diagram to describe the process of constructing a prognostic model based on CRGs-subtypes and gene subtypes. (B, C) Prognostic genes were screened using LASSO regression. (D, G) Kaplan Meier analysis of OS in melanoma patients in the training set; ROC curves for 6 key variable genes. (E, H) OS of melanoma patients in Kaplan Meier analysis validation set; ROC curves of 6 key variable genes. (F, I) Kaplan Meier analysis of OS in all melanoma patients; ROC curves of 6 key variable genes. (J) Nomograms predicting 1-, 3-, and 5-year OS probabilities in melanoma patients. (K) Calibration plots of the nomograms.
We arranged the training set, validation set, and all samples according to the prognostic risk model from low to high risk scores, and obtained the risk curve (Figures 5A–C).Similarly, we obtained the survival status map between risk scores and death samples (Figures 5D–F), and finally, we used heatmaps to show the expression of the model’s key variable genes (AIM2, EDNRB, KIF14, PTPRC, SLC39A6, and TMEM117) in the training set, validation set and all sample (Figures 5G–I). Next, we performed tumor microenvironment analysis on 6 key variable genes (Figure 5J).
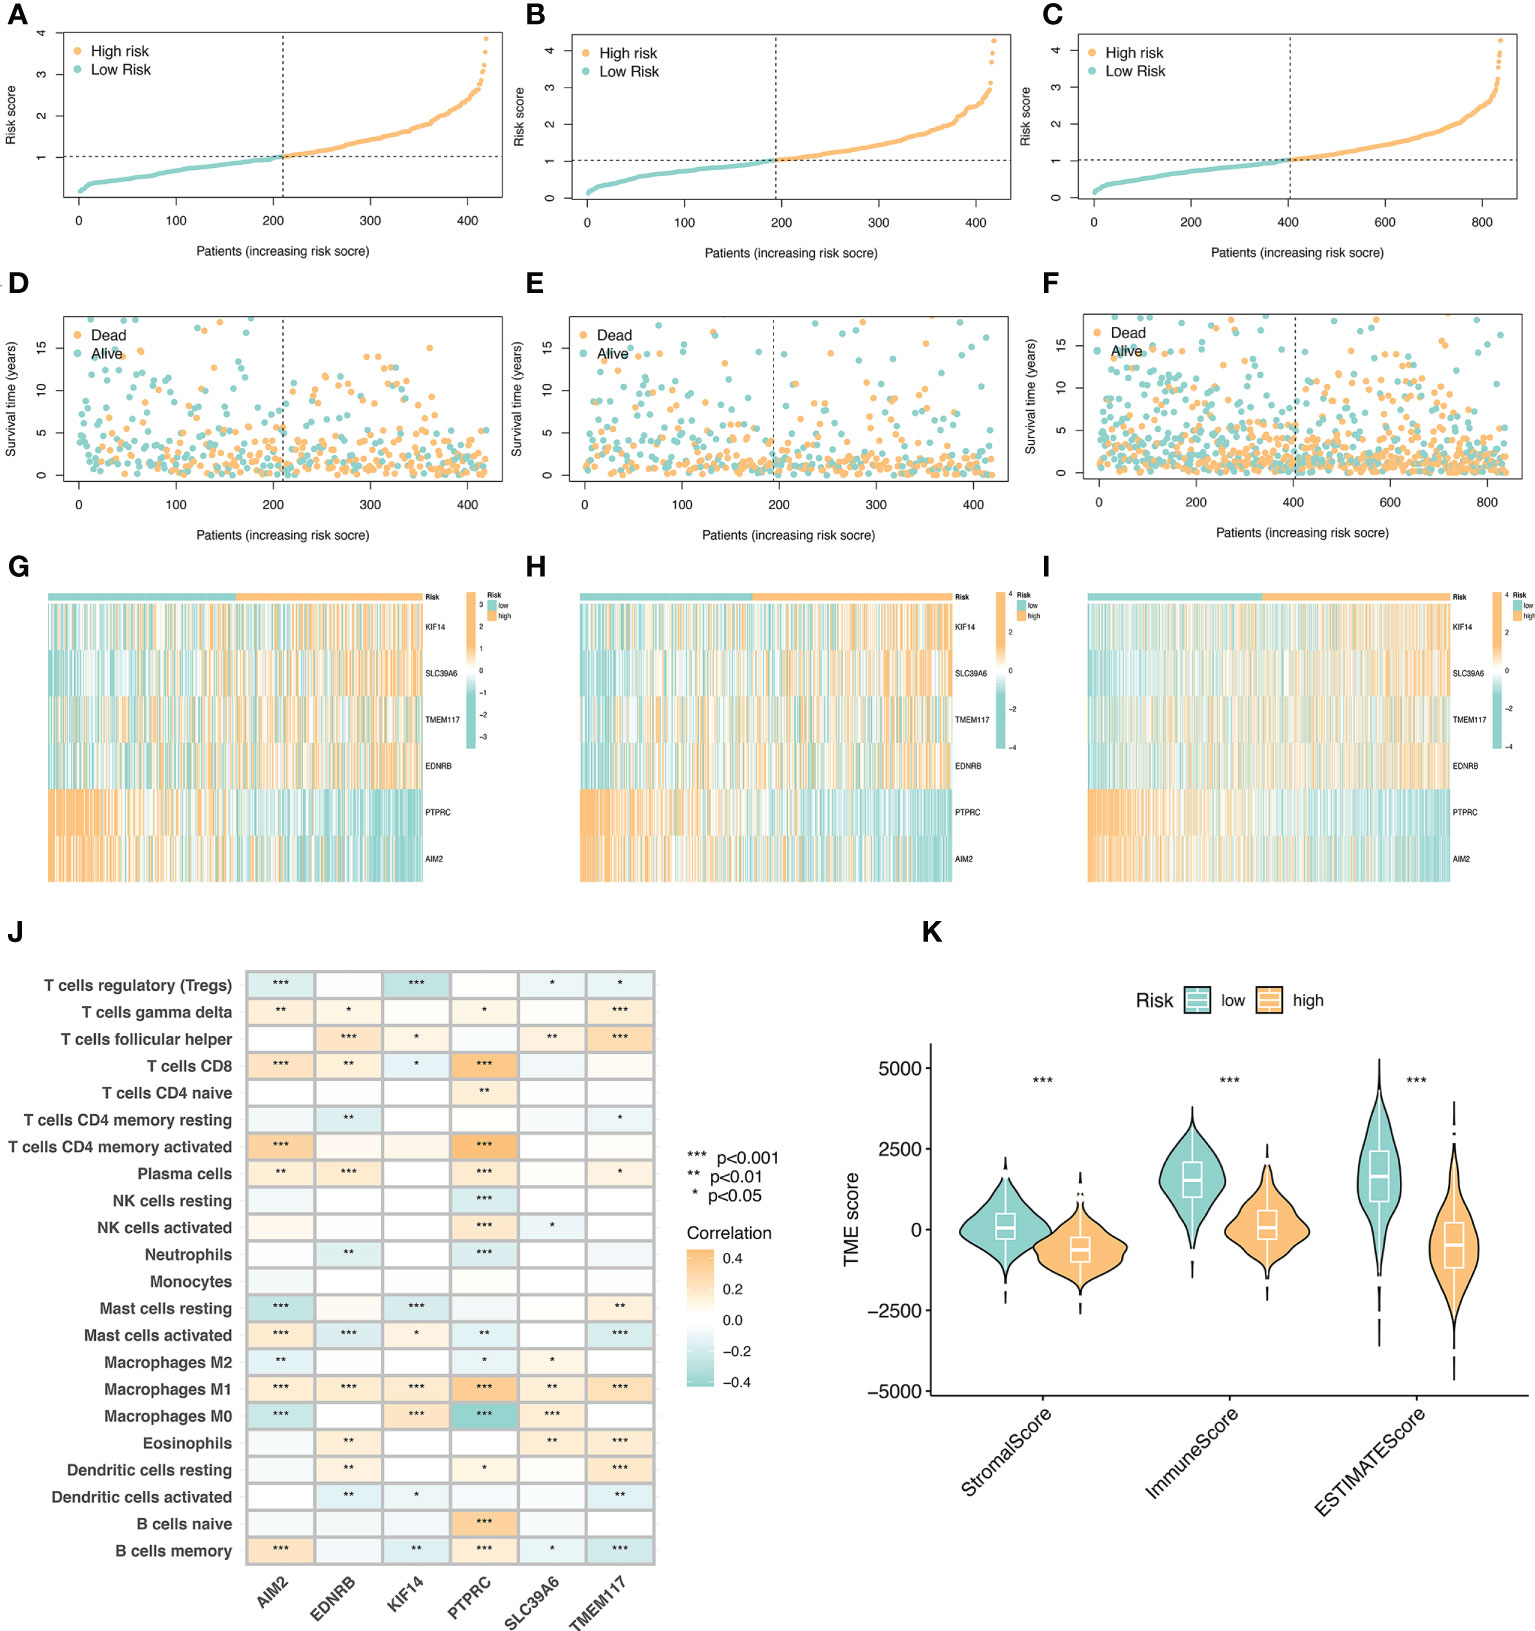
Figure 5 Risk curve and immune microenvironment analysis between high and low immune groups. (A) Risk curve in the training set. Take the median of the risk scores and use the median to divide the samples into high-risk and low-risk groups. (B) Risk curve in the validation set. (C) Risk curves of all samples. (D) Survival state diagram of the training set, red for dead and blue for survival. (E) The living state diagram of the validation set. (F) Survival state diagram of all samples. (G–I) Heat map showing the expression of 6 key variable genes in training set, validation set and all samples. (J) Correlation of 6 key variable genes with immune cells, red represents positive correlation and blue represents negative correlation. (K) Correlation of stroma score, immune score, and ESTIMATE with immune microenvironment.
The key variable genes were mainly associated with the degree of infiltration of M1 macrophage, M0 macrophage, and memory B cells. KIF14, SLC39A6, TMEM117, and EDNRB, as high-risk genes, were negatively correlated with the degree of infiltration of memory B cells and regulatory T cells, and positively correlated with the degree of infiltration of M1 macrophage, T follicular helper. AIM2 and PTPRC, as low-risk genes, showed a significant positive correlation with the degree of infiltration of memory B cells, activated memory CD4(+) T cells, and CD8(+) T cells, and a significant negative correlation with the degree of infiltration of M0 macrophage. The stromalscore, immunescore, and ESTIMATEscore scores in the high-risk group were significantly lower than those in the low-risk group (Figure 5K).
We divided the high-risk group and the low-risk group according to the model. Screening of sensitive drugs was carried out according to the difference in IC50 concentration between the two groups. A total of 98 drugs (S2) were screened, and we selected 3 high-sensitivity drugs in the low-risk group (Figures 6A–C) and 3 high-sensitivity drugs in the high-risk group (Figures 6D–F). Among the CRG subtypes, B1 has the lowest risk score and subtype C1 has the highest risk score (Figure 6G). Among the genesubtypes, C2 had the highest risk score and B2 had the lowest risk score (Figure 6H). Among the CRGs genes with differential expression in the high-risk and low-risk groups, only FDX1 expression was decreased in the high-risk group (Figure 6I).
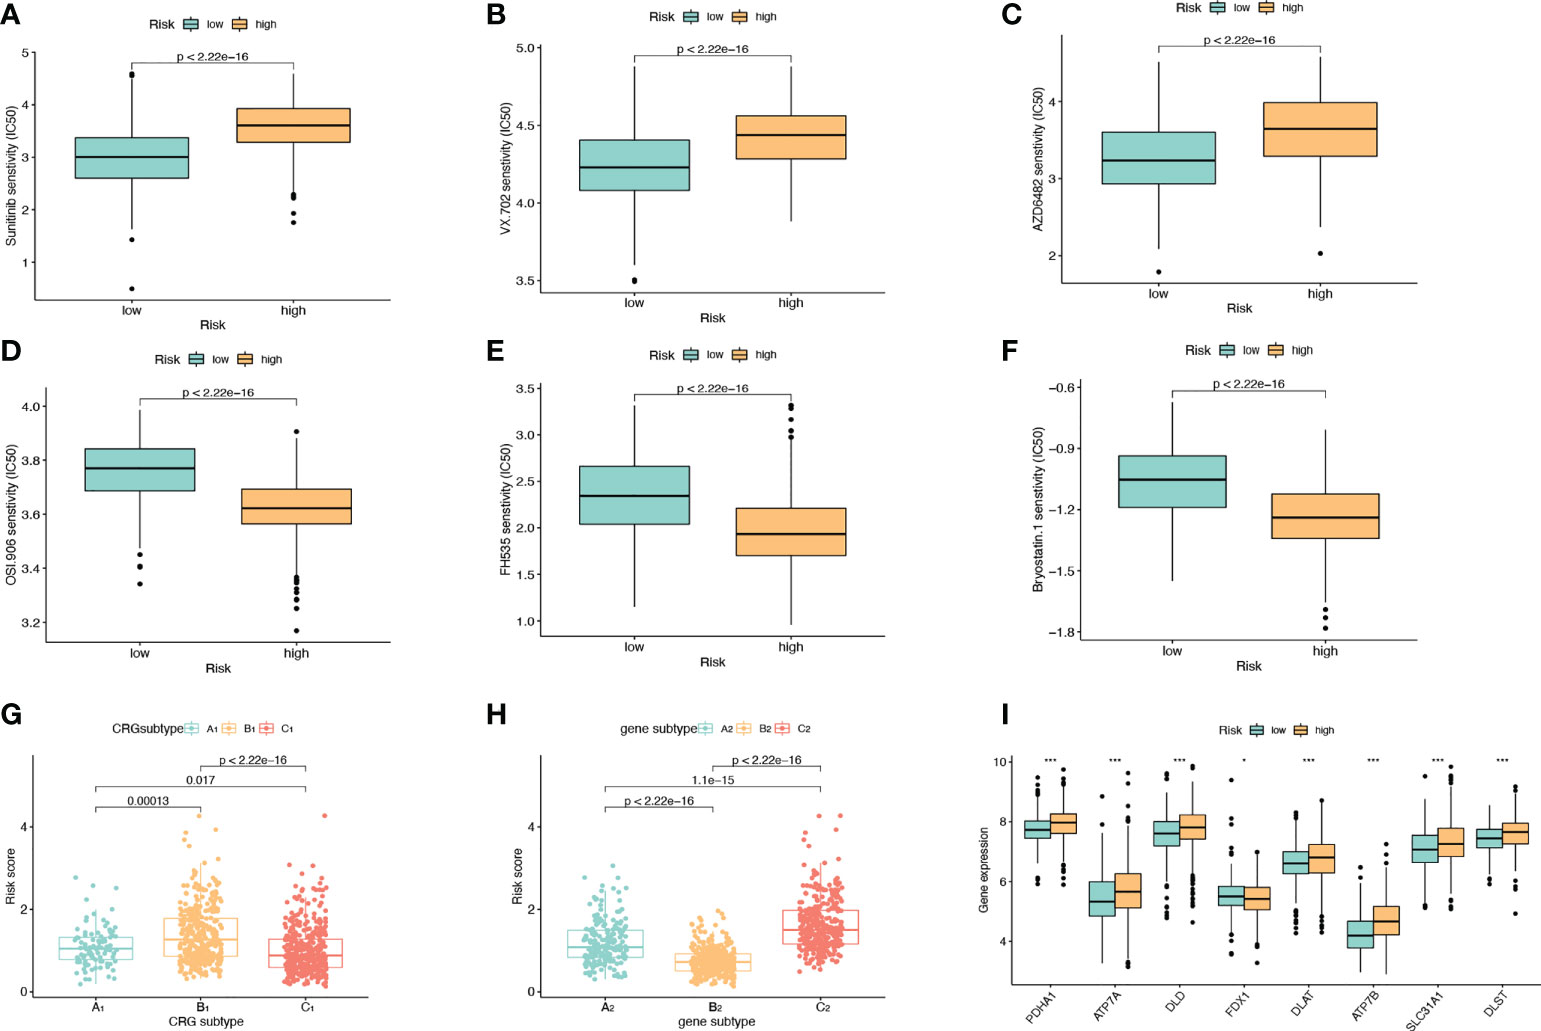
Figure 6 Drug Sensitivity Analysis. (A–C) The sensitivity of the low-risk group to Sunitinib, VX.702, AZD6482 was higher than that of the high-risk group. The abscissa is the low-risk group and the high-risk group, and the ordinate is the value of the drug IC50. (D–F) The high-risk group had higher sensitivity to OSI.906, FH535, and Bryostatin.1 than the low-risk group. (G) Risk scores for A1, B1, and C1 subtypes in CRGs molecular subtypes. (H) Risk scores for A2, B2, C2 subtypes in genotyping. (I) Expression levels of CRGs in high and low risk groups.
We used the REFCV method to filter out key metastatic variables: ‘FDX1’, ‘LIPT1’, ‘LIAS’, ‘DLD’, ‘DBT’, ‘DLAT’, ‘PDHB’. From Figures 7A, B we can see that LightGBM has the highest AUC in both training and validation sets, 1 and 0.750, respectively. The values of LightGBM and XGBoost in the multi-model forest graph in Figure 7C are also the highest at 0.748. Tables 1 and 2 show that the AUC, cutoff, accuracy, sensitivity, specificity, positive predictive value, negative predictive value, F1 score, Kappa value of LightGBM are 1.000, 0.637, 0.995, 1.000, 1.000, 1.000, 0.986, 1.000, 0.989. In conclusion, LightGBM is the best performing model, and we choose this model to establish a melanoma metastasis model.
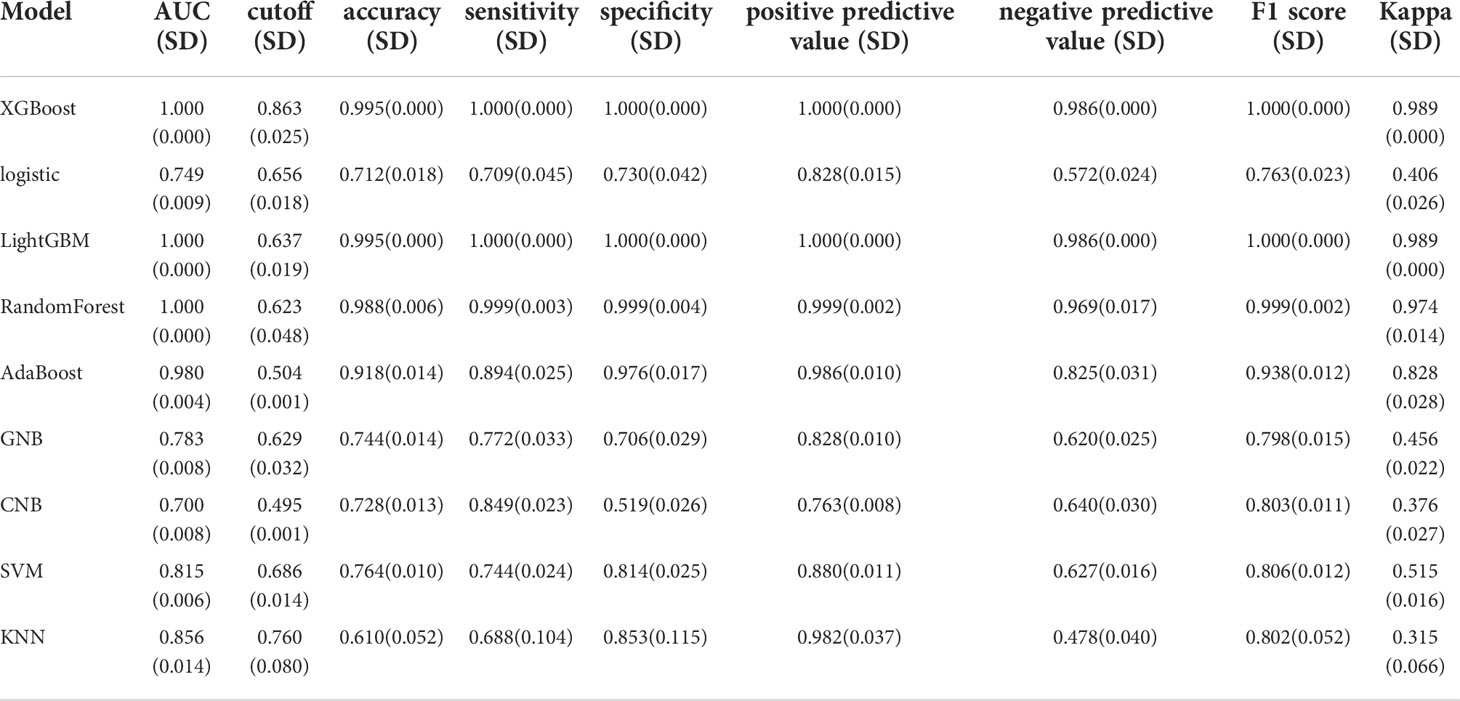
Table 1 Multi-model comparison, training set results.
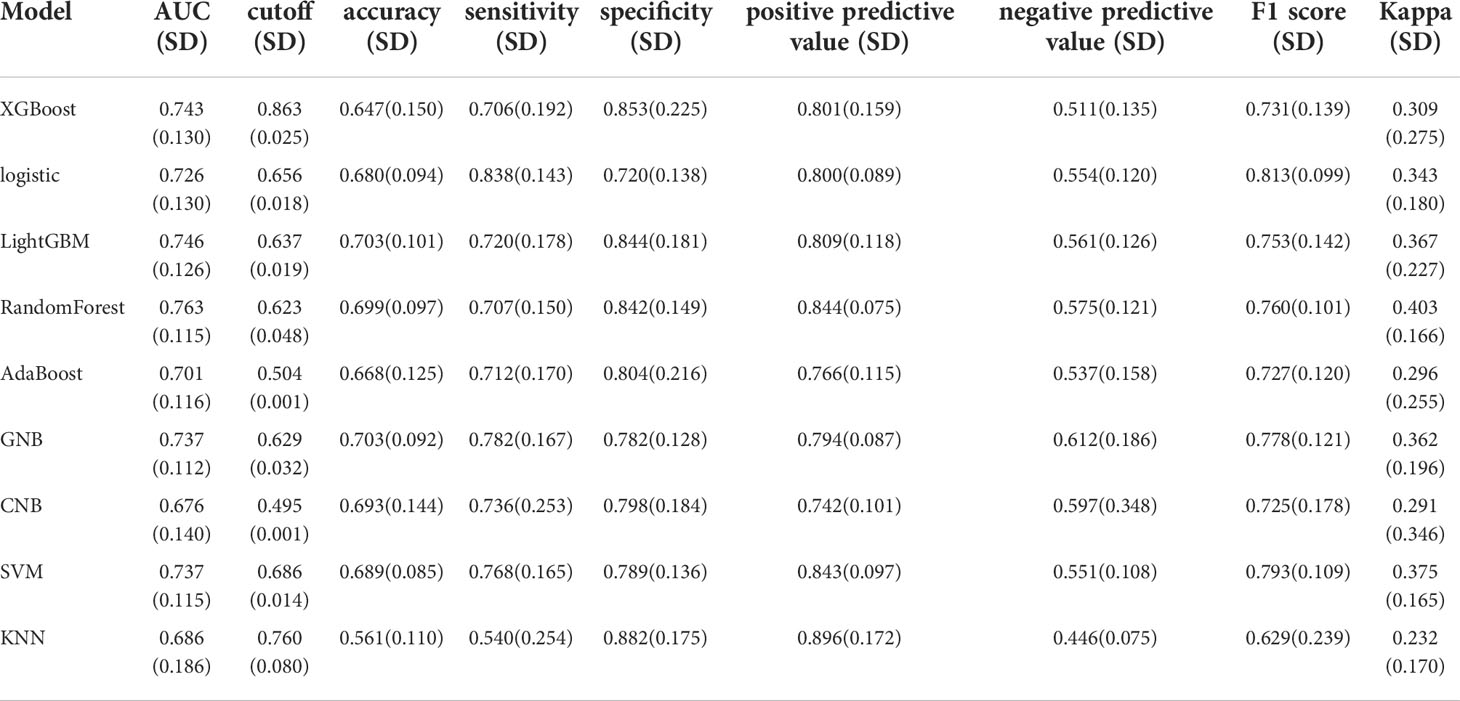
Table 2 Multi-model comparison, validation set results.
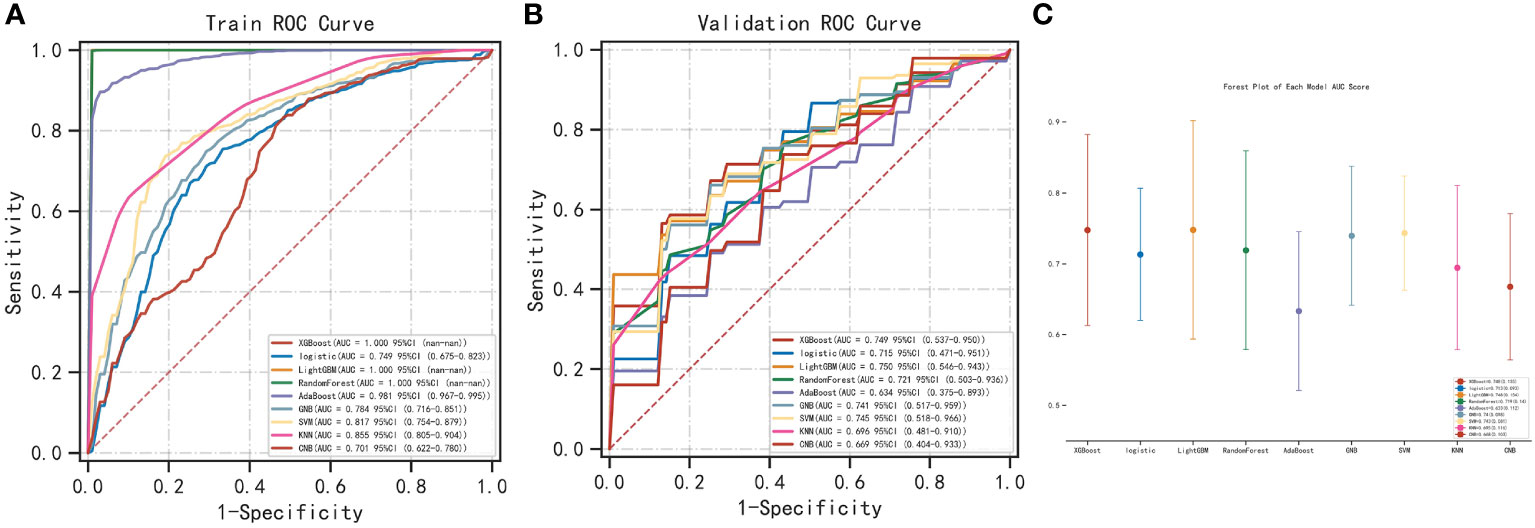
Figure 7 Construction of metastasis model. (A) REFCV method to filter out key metastatic variables in train set. (B) REFCV method to filter out key metastatic variables in validation set. (C) Multi-model forest graph.
After filtering out the best performing LightGBM model, we used the “SHAP” package to explain the importance of key variables to the model. As shown in Figure 8A, the importance of 7 variables from high to low is: ‘FDX1’, ‘ DBT’, ‘LIPT1’, ‘PDHB’, ‘DLD’, ‘DLAT’, ‘LIAS’. Figure 8B shows the contribution of each variable to the model. The red dots indicate positive contributions, and the blue dots indicate negative contributions. A point closer to the left indicates a smaller value and a point closer to the right indicates a larger value. For example, the higher the FDX1 value, the higher the probability of death from heart failure; the lower the FDX1 value, the lower the probability of heart failure death. At the same time, we use the force diagram to illustrate 2 samples to show how different variables contribute to different samples. Figures 8C, D show the model predicts that these two samples are likely to metastasize and not metastasize, respectively, and show the contribution of each gene’s expression to the sample prediction. Red indicates a positive contribution. Blue represents a negative contribution. If f(x) is greater than the cut-off value, the tumor sample is more likely to metastasize; if f(x) is less than the cut-off value, the tumor sample is less likely to metastasize.
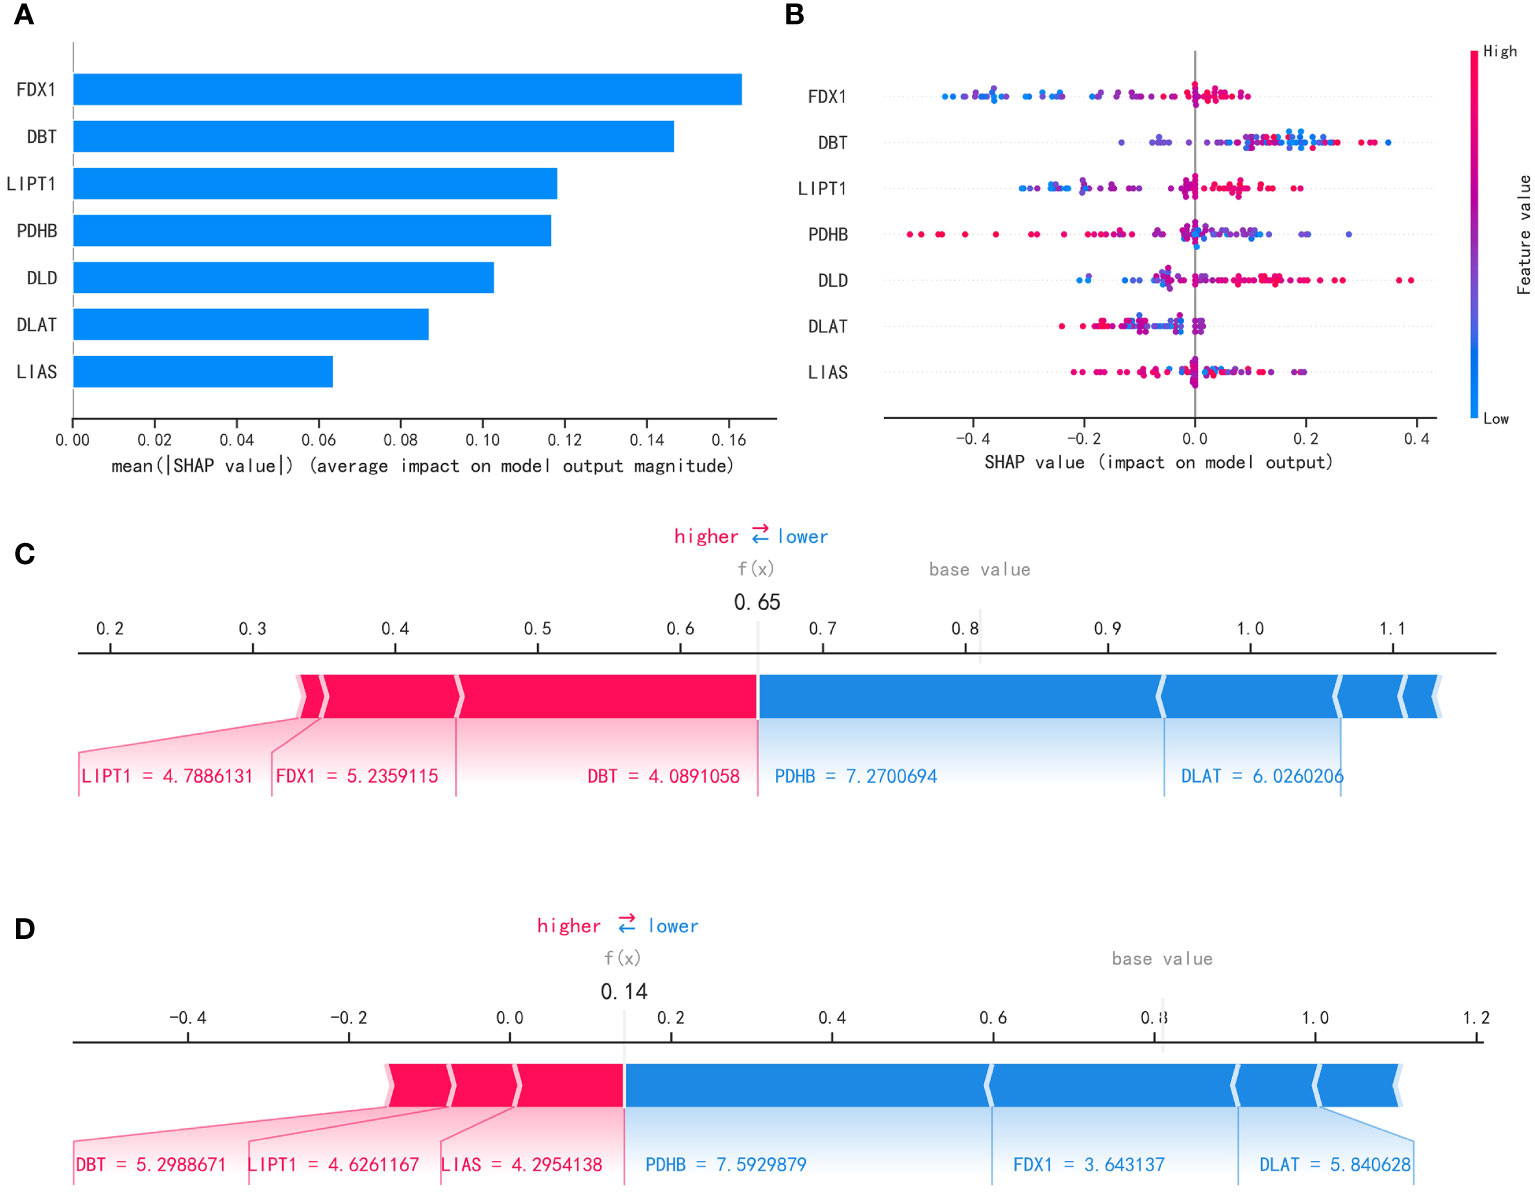
Figure 8 Interpretability of the metastasis model. (A) “SHAP” package to explain the importance of key variables to the model. (B) Contribution of each variable to the model. (C, D) Prediction of model.
We used specific FDX1-targeting siRNAs to knockdown the expression levels of FDX1 in the A375 cells (Figure 9A). siNC was used as a control group for subsequent comparative analysis. CCK-8 assay results showed that the proliferation of FDX1 knockdown cells at 12h, 24h, and 36h was significantly higher than that of the control group (Figure 9B). Wound healing assay results showed that FDX1 knockdown inhibited wound healing (Figure 9C). siNC group healed slightly faster than the siFDX1 group. However, this result is not statistically significant.
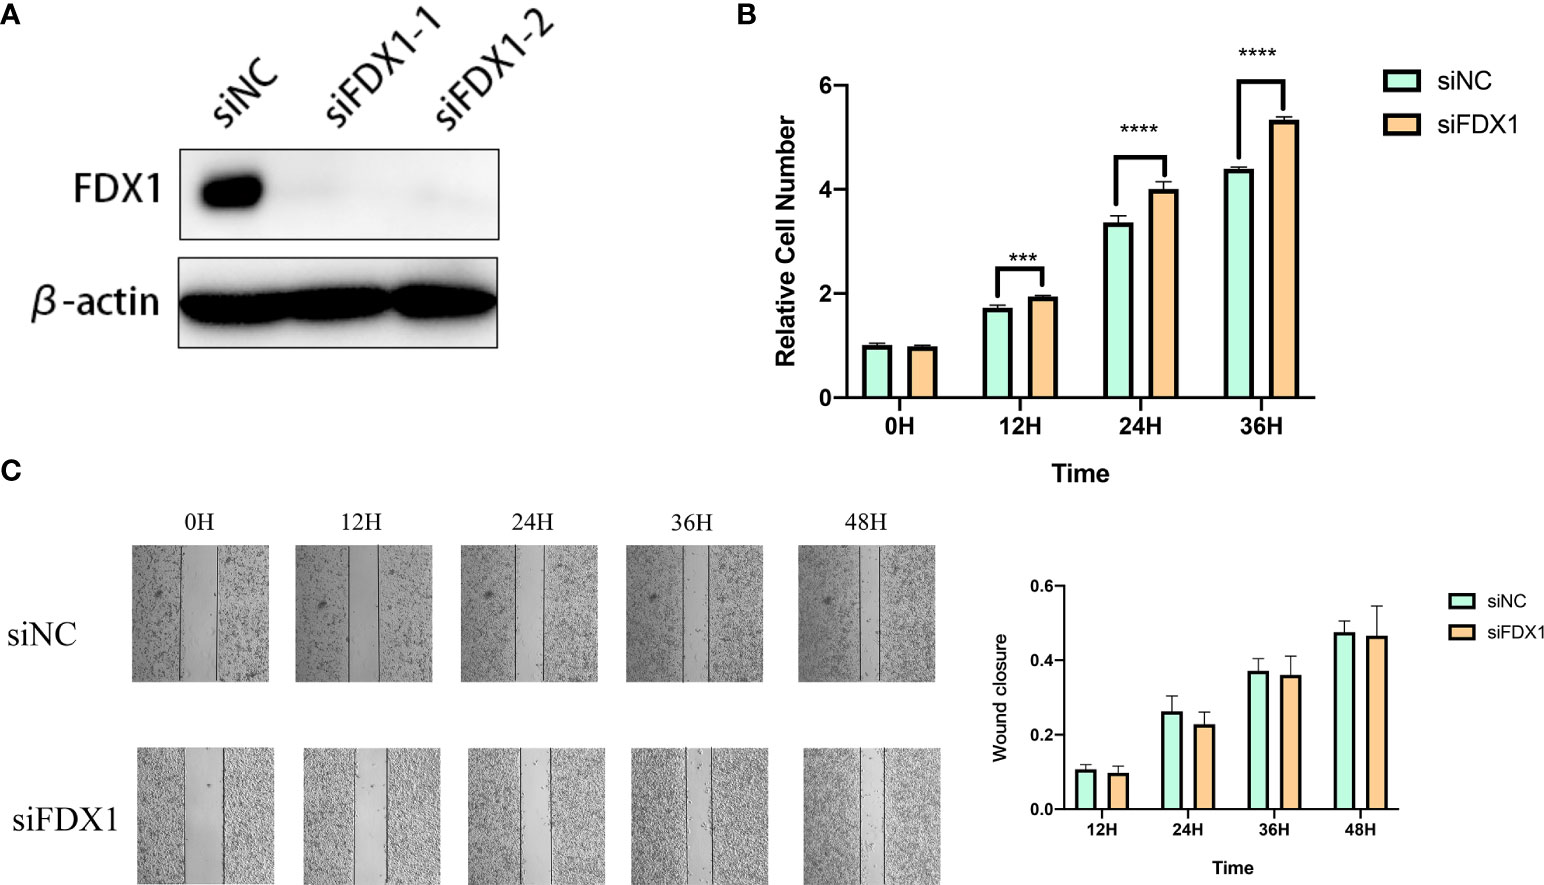
Figure 9 Knockdown of fdx1 inhibits the proliferation of melanoma cells. (A) FDX1-targeting siRNAs to knockdown the expression levels of FDX1. (B) The proliferation of FDX1 knockdown cells at 12 h, 24 h, and 36 h. (C) Wound healing assay at 12 h, 24 h, 36 h, and 48 h.
As one of the deadliest tumors in skin cancer, melanoma is characterized by high invasiveness and high mortality (1). Therefore, a large body of literature has explored the prognosis and metastasis of melanoma. At present, the literature has predicted the prognosis of melanoma patients based on the expression levels of pyroptotic genes, tumor microenvironment status, or m6a-regulated methylation patterns (23–30). Although many bioinformatics studies are predictingognosis of melanoma, the existing cuproptosis-related melanoma research is not abundant.
Recently, Tsvetkov et al. discovered a novel apoptosis-independent cell death pathway, copper-dependent cell death (termed cuproptosis) (7). They proved that copper ions bind directly to the lipoylated components of the tricarboxylic acid cycle. Then, proteotoxic stress and unique cell death were induced. At the same time, the role performed by cuproptosis in tumours is gradually being understood. Zhong Hao et al. discovered that 6 CRGs had good diagnostic efficacy in kidney renal clear cell carcinoma (31). Besides, Liyang et al. developed a safe, mitochondria-targeted, copper-depleted nanoparticle (CDN) and tested its efficacy against triple-negative breast cancer (TNBC) (32). Injection CDN into mice with triple negative breast cancer resulted in a significant reduction in tumour growth and a significantly longer survival time for the mice. Zhang Zheng et al. constructed a prognostic model of HCC using the expression levels of ferredoxin 1 (FDX1) in hepatocellular carcinoma (HCC). They found that the expression level of FDX1 was significantly lower in HCC patients than in the non-HCC population (33). At the same time, survival time was significantly higher in patients with high expression of HCC than in those with low expression of HCC.These studies suggest that cuproptosis has implications for the clinical diagnosis and treatment of tumours.
Therefore, CRGs were used to construct molecular subtypes of melanoma and to construct metastasis models in this research. The molecular subtypes of melanoma based on CRGs can give us a more comprehensive understanding of melanoma. At the same time, the metastasis model established based on CRGs can also fill the gap in melanoma bioinformatics research.
In this study, we explored the effects of CRGs on both survival and metastasis in melanoma patients. We analyzed the expression of 12 CRGs in TCGA and GEO cohorts. First, through bioinformatics analysis, we constructed molecular subtypes of 3 CRGs (A1, B1, C1) based on 12 CRGs. Among the three molecular subtypes of CRGs, the C1 subtype had the best survival outcome, and the A1 subtype had the worst survival outcome. Next, we obtained 71 Differentially expressed genes that were co-expressed by all three subtypes. Based on 71 Differentially expressed genes, we genotyped melanoma and obtained 3 gene subtypes (A2, B2, C2). Among them, the B2 type had the best survival outcome, and the C2 type had the worst survival outcome. Then, we screened prognosis-related genes from 71 co-expressed Differentially expressed genes. After obtaining 16 prognosis-related genes, the LASSO algorithm was used to screen out 6 key variable genes(AIM2, EDNRB, SLC39A6, TMEM117, PTPRC, and KIF14) for model construction and validation. Ultimately, our risk score model can distinguish between high-risk and low-risk groups. And KM analysis, AUC analysis, nomogram, and calibration curve indicated that our model could predict the prognosis of melanoma patients more accurately. Finally, in the analysis of metastasis, we used the LightGBM machine learning algorithm to screen out 7 CRGs to establish the metastasis model of melanoma.
In the TCGA cohort, we found that 9 out of 13 CRGs had an impact on the prognosis of melanoma patients. Therefore, this sparked our interest in investigating the role of CRGs in melanoma prognosis and metastasis. The degree of immune cell infiltration was also significantly different among the three molecular subtypes of CRGs. We selected 23 immune cells for analysis, except for Eosinophilna cells, the other 22 immune cells had significantly different infiltration degrees in the three subtypes. This suggests that immune cells play different roles in different subtypes. In many tumors, the immune microenvironment plays an important role in tumor angiogenesis, tumor invasion, and metastasis. Patients with high expression of CXCL9, CXCL10, CXCL13, CCL4, and CCL5 in SKCM (Skin cutaneous melanoma) had better overall survival (27). Some studies have constructed risk models based on immune-related genes and found that immune cell infiltration is different between patients with high and low immune scores, and the survival time of patients with high immune scores is significantly lower than that of patients with low immune scores. Other studies have shown that in melanoma patients, IL27 is closely related to CD8+ cells, and is related to the treatment effect and prognosis of patients (34–36). Enrichment analysis of Metascape shows 71 intergenes were mainly enriched in MHC class II antigen presentation and platinum resistance pathways. Melanoma-specific MHC-II expression predicted anti-pd-1/PD-L1 treatment efficacy (37). Overexpression of BCL2L10 in melanoma has also been shown to promote cisplatin and ABT-737 resistance (38). In a case report, a patient with metastatic melanoma was also associated with hyperprolactinemia (39). Next, we used cox regression analysis and the LASSO algorithm to screen out 6 key variable genes(AIM2, EDNRB, SLC39A6, TMEM117, PTPRC, and KIF14) to construct a risk model. Absent in melanoma 2 (AIM2) is a cytoplasmic sensor that recognizes double-stranded DNA derived from viruses, bacteria, or the host itself, and is a member of the interferon inducible p200-protein (IFI-P200) family of immune-related proteins. AIM2 plays a significant role in autoimmune diseases (40) and the activation of inflammasome (41–44). In the melanoma-related literature, patients with melanoma whose dendritic cells express AIM2 have a significantly lower prognosis than patients with melanoma whose dendritic cells do not express AIM2 (45). In breast cancer treatment, Dihydroartemisinin induces pyroptosis in breast cancer cells by promoting the AIM2/caspase-3/DFNA5 (gasdermin E) axis (46). Endothelin Receptor type B (EDNRB) is widely expressed in vascular endothelial cells of the cardiovascular system, gastrointestinal tract, lung, kidney, adrenal gland, uterus, prostate, and brain. In melanoma-related studies, the prognostic value of patients with high CD8(+) T cell subpopulations expressing EDNRB was significantly reduced (47). This suggests that EDNRB could be a potential therapeutic target for melanoma. Solute carrier family 39 member 6(SLC39A6) is also known as LIV-1, ZIP-6, and Zinc transporter ZIP6. May act as a zinc-influx transporter. Solute Carrier Family 39 Member 6 (SLC39A6) is also known as LIV-1, ZIP-6, and Zinc transporter ZIP6. May act as a zinc-influx transporter. In studies of esophageal cancer, SLC39A6 increases the invasiveness of esophageal cancer cells and reduces patient prognosis by increasing the level of Zinc expression in esophageal cancer cells (48). SLC39A6 can also be used as an indicator for early diagnosis of esophageal cancer (49). However, in luminal breast cancer, the Oestrogen-regulated protein SLC39A6 acts as a benign prognostic indicator (50). One study reported that transmembrane protein 117 (TMEM117) was associated with endoplasmic reticulum stress-mediated mitochondrial-mediated cell death (51). Studies have shown that in primary liver cancer, miR-631 can target the receptor protein tyrosine phosphatase gene (PTPRE) to inhibit the intrahepatic metastasis of liver cancer (52). In kras mutant lung adenocarcinoma, the PTPRE is highly expressed, which can be used as a novel therapeutic target in kras mutant lung adenocarcinoma (53). The kinesin family member 14 (KIF14), is a novel oncogene located on chromosome 1q. When it malfunctions, it can affect the development of the brain and kidneys, and it can lead to many types of cancer (54, 55). In breast cancer, high expression of KIF14 can promote breast cancer metastasis and is associated with poor prognosis of breast cancer patients (56, 57). Similarly, studies have shown that in gastric cancer, when KIF14 mRNA is highly expressed, the prognosis is significantly lower than that with low KIF14 mRNA expression (58). However, the above two genes have not been deeply studied in melanoma research, and the specific functions of PTPRE and KIF14 in melanoma need to be further explored.
Among these CRGs, we also screened out 7 key genes (FDX1, DBT, LIPT1, PDHB, DLD, DLAT, LIAS) as variables in the metastasis model. In other tumor metastasis models, the roles of some of these genes in tumor metastasis have also been found. Chen found that LIPT1 may be a prognostic-related gene for bladder cancer, and then found that this gene has a certain degree of inhibitory effect on the migration ability of bladder cancer cells by transwell method (59). Zhao found that PDHB is associated with ovarian cancer growth and metastasis, and miR-203 can target the 3’-UTR of PDHB to promote glycolysis. Meanwhile, overexpression of PDHB could abolish the promoting effect of miR-203 on ovarian cancer cell growth (60). Regarding the role of these genes in tumor metastasis, we still need further functional tests to verify.
During the occurrence and development of tumor tissue, there are a large number of gene mutations. Mutated genes can provide tumor antigens that can be recognized by the immune system as non-self tissues, inducing immune cells to respond (61). Immunotherapy takes advantage of the fact that immune cells can recognize and eliminate tumor cells, which plays a great role in the treatment of tumors (62, 63). However, tumors effectively suppress immune responses (immune escape) by activating negative regulatory pathways associated with immune homeostasis (checkpoints) or by adopting features that allow them to actively evade detection (64, 65). Effective immunotherapy drugs have been approved in preclinical and clinical phase I-III trials for highly aggressive, highly refractory, and advanced and metastatic melanoma (66). For example, the anti-PD-1 monoclonal antibodies nivolumab and pembrolizumab and the anti-CTLA-4 antibody ipilimumab are being tested in clinical trials to treat melanoma (67). Studies have shown that commonly used immune checkpoint inhibitors (ICIs) can improve progression-free survival and overall survival in melanoma patients (68, 69). In our study, the risk score model showed that the degree of immune cell infiltration in the high-risk group was significantly lower than that in the low-risk group. Interestingly, the survival time of the high-risk group was significantly lower than that of the low-risk group. In other melanoma studies, the survival time of the high immune score group was significantly higher than that of the low immune score group (70, 71). We also propose a hypothesis here, in melanoma, is the degree of immune cell infiltration positively correlated with the survival time of patients? This problem also needs more clinical data or experiments to confirm. It is worth mentioning that in this study, we also analyzed the drug sensitivity between high and low risk groups. We screened 98 drugs (Supplementary File 1) with significant differences in IC50 concentrations between high and low risk groups. Among them, worthy of our attention are Sunitinib, VX-702, and Bryostatin.1. Sunitinib is a new class of drugs that can selectively target multiple receptor tyrosine kinases, and is now being used alone or in combination with other antitumor drugs to treat many solid tumors, including liver cancer, renal cancer, and gastric cancer (72–74). VX-702 is a highly selective p38α MAPK inhibitor targeting nimokinase for the treatment of primary and acquired endocrine-resistant breast cancer (75). Bryostatin-1 is a protein kinase C (PKC) inhibitor that inhibits cell entry into mitosis, lowers pH and energy metabolism, and reduces tumor blood flow, thereby inhibiting tumor cell growth (76, 77). We screened 98 drugs to guide the development of melanoma drugs.
Furthermore, our in vitro experiments showed that FDX1 promoted the growth, and migration of melanoma cells. Therefore, we speculate that FDX1, as a CRG, is a marker of melanoma. People with high expression of this gene need to be more alert to the occurrence of melanoma. At the same time, it is also a prognostic marker for melanoma patients. The prognosis of cancer patients may be better than that of other patients. Taken together, our results suggest that FDX1 is aberrantly expressed in melanoma and may be associated with patient prognosis. In the future, we need to conduct more in-depth functional experiments to explore how this gene acts on the occurrence and development of melanoma.
This study established prognostic and metastatic models of CRGs in melanoma. But there are still some limitations. Although the sample size of our sequencing data is relatively large, it is mainly based on the data of the network database, and we also need our own sequencing data to verify. In our in vitro experiments, knockdown of FDX1 reduced the ability of cells to migrate, but there was no difference compared to the control group. However, this gene was selected in our model, which may be due to the joint effect of multiple genes in the establishment of the metastasis model. In the future, we will conduct more in-depth experiments to explore its transfer mechanism. We analyzed the enriched pathways and functions of these key genes, and functional assays are needed to verify them. Finally, the drugs we screened also need to be verified by drug resistance experiments.
In this study, melanoma was classified based on 12 CRGs and clinical features, and three subtypes, A1, B1, and C1, were established. Among them, the C1 subtype had the best survival outcome and the highest immune cell infiltration. Then, A2, B2, and C2 subtypes were established based on genotyping, with the B2 subtype having the best survival outcome. We performed functional analysis on the intergenes between different types, and the results showed that these intergenes were mainly enriched in cell cycle and drug metabolism pathways. We also established a prognostic model using 6 key variable genes and analyzed the tumor microenvironment according to the high and low risk scores of prognosis. In addition, we screened drugs for high and low risk groups and found that 98 drugs had significant differences in IC50 concentrations in high and low risk groups. Finally, we used the LightGBM algorithm to screen out 7 CRGs to build the transfer model of melanoma. These results help us to understand the role of CRGs in the occurrence and development of melanoma, and provide us with new therapeutic ideas and potential treatment methods.
The original contributions presented in the study are included in the article/Supplementary Material. Further inquiries can be directed to the corresponding author.
JL was responsible for the study concept and design. Y-WL and FL revised the manuscript and made final approval of the version. JL, ZL, and LL analyzed the data. ZL, JL, and LL helped with the experimental section. LL helped to write the manuscript. All authors contributed to the article and approved the submitted version.
This work was supported by National Key R&D Program of China (No.2020YFC2005000), the National Natural Science Foundation of China (No. 81802668, 82172832), the Wisdom Accumulation and Talent Cultivation Project of the Third Xiangya Hospital of Central South University (YX202108), and the Postgraduate Research and Innovation Project of Central South University (No.2020zzts892).
The authors would like to acknowledge the GEO databases (https://www.ncbi.nlm.nih.gov/gds/) and TCGA database (https://tcga-data.nci.nih.gov/tcga/) for providing their platforms and those contributors for uploading their valuable datasets. And we also thanks for Extreme Smart Analysis (https://www.xsmartanalysis.com/) for providing the platforms to analyse our metastasis model.
The authors declare that the research was conducted in the absence of any commercial or financial relationships that could be construed as a potential conflict of interest.
All claims expressed in this article are solely those of the authors and do not necessarily represent those of their affiliated organizations, or those of the publisher, the editors and the reviewers. Any product that may be evaluated in this article, or claim that may be made by its manufacturer, is not guaranteed or endorsed by the publisher.
The Supplementary Material for this article can be found online at: https://www.frontiersin.org/articles/10.3389/fimmu.2022.986214/full#supplementary-material
Supplementary Figure 1 | Mutations and copy number variations of CRGs in the TCGA cohort. (A) The proportion of mutation frequency of CRGs in melanoma. (B) The chromosome where the mutated CRGs are located. Red represents an increase in copy number and green represents a decrease in copy number. (C) CRGs copy number variation graph. The ordinate of the red circle is the number of samples with increased copy number, and the ordinate of the green circle is the number of samples with reduced copy number.
Supplementary Figure 2 | 9 CRGs associated with prognosis. (A–I) Comparison of the overall survival time of samples with high expression of CRGs genes (indicated in red) and samples with low expression of CRGs (indicated in blue).
Supplementary Figure 3 | Melanoma gene subtypes constructed based on prognostic-related intersection differentially expressed genes. (A) Three gene subtypes obtained by unsupervised consensus clustering method. (B) Consistent distribution of different K values described by a consistent cumulative distribution function (CDF) plot. (C) The delta area score displayed the relative growth in cluster stability. (D) Kaplan Meier analysis results of three gene subtypes. (E) Comparison of CRGs expression levels among the three gene subtypes. (F) Heatmap showing clinical information and gene expression profiles for the three gene subtypes.
Supplementary Table 1 | Names of 13 cuproptosis-related genes
Supplementary File 1 | 98 drugs were with significant differences in IC50 concentrations between high and low risk groups.
1. Sung H, Ferlay J, Siegel R, Laversanne M, Soerjomataram I, Jemal A, et al. Global cancer statistics 2020: GLOBOCAN estimates of incidence and mortality worldwide for 36 cancers in 185 countries. CA Cancer J Clin (2021) 71:209–49. doi: 10.3322/caac.21660
2. Pasquali S, Hadjinicolaou AV, Chiarion Sileni V, Rossi CR, Mocellin S. Systemic treatments for metastatic cutaneous melanoma. Cochrane Database Syst Rev (2018) 2(2):CD011123. doi: 10.1002/14651858.CD011123.pub2
3. Grzywa TM, Koppolu AA, Paskal W, Klicka K, Rydzanicz M, Wejman J, et al. Higher mutation burden in high proliferation compartments of heterogeneous melanoma tumors. Int J Mol Sci (2021) 22:3886. doi: 10.3390/ijms22083886
4. Elder DE, Bastian BC, Cree IA, Massi D, Scolyer RA. The 2018 world health organization classification of cutaneous, mucosal, and uveal melanoma: Detailed analysis of 9 distinct subtypes defined by their evolutionary pathway. Arch Pathol Lab Med (2020) 144:500–22. doi: 10.5858/arpa.2019-0561-RA
5. Strashilov S, Yordanov A. Aetiology and pathogenesis of cutaneous melanoma: Current concepts and advances. Int J Mol Sci (2021) 22:6395. doi: 10.3390/ijms22126395
6. Kahlson MA, Dixon SJ. Copper-induced cell death. Science (2022) 375:1231–32. doi: 10.1126/science.abo3959
7. Tsvetkov P, Coy S, Petrova B, Dreishpoon M, Verma A, Abdusamad M, et al. Copper induces cell death by targeting lipoylated TCA cycle proteins. Science (2022) 375:1254–61. doi: 10.1126/science.abf0529
9. Huff JD, Keung Y-K, Thakuri M, Beaty MW, Hurd DD, Owen J, et al. Copper deficiency causes reversible myelodysplasia. Am J Hematol (2007) 82:625–30. doi: 10.1002/ajh.20864
10. da Silva Fonseca J, de Barros Marangoni LF, Marques JA, Bianchini A. Energy metabolism enzymes inhibition by the combined effects of increasing temperature and copper exposure in the coral mussismilia harttii. Chemosphere (2019) 236:124420. doi: 10.1016/j.chemosphere.2019.124420
11. Tisato F, Marzano C, Porchia M, Pellei M, Santini C. Copper in diseases and treatments, and copper-based anticancer strategies. Med Res Rev (2010) 30:708–49. doi: 10.1002/med.20174
12. Jiang Y, Huo Z, Qi X, Zuo T, Wu Z. Copper-induced tumor cell death mechanisms and antitumor theragnostic applications of copper complexes. Nanomed (Lond) (2022) 17:303–24. doi: 10.2217/nnm-2021-0374
13. Shanbhag VC, Gudekar N, Jasmer K, Papageorgiou C, Singh K, Petris MJ. Copper metabolism as a unique vulnerability in cancer. Biochim Biophys Acta Mol Cell Res (2021) 1868:118893. doi: 10.1016/j.bbamcr.2020.118893
14. Arnesano F, Natile G. Interference between copper transport systems and platinum drugs. Semin Cancer Biol (2021) 76:173–88. doi: 10.1016/j.semcancer.2021.05.023
15. Panja S, Rahem S, Chu CJ, Mitrofanova A. Big data to knowledge: Application of machine learning to predictive modeling of therapeutic response in cancer. Curr Genomics (2021) 22:244–66. doi: 10.2174/1389202921999201224110101
16. Nayarisseri A, Khandelwal R, Tanwar P, Madhavi M, Sharma D, Thakur G, et al. Artificial intelligence, big data and machine learning approaches in precision medicine & drug discovery. Curr Drug Targets (2021) 22:631–55. doi: 10.2174/1389450122999210104205732
17. Hong M, Tao S, Zhang L, Diao L-T, Huang X, Huang S, et al. RNA Sequencing: new technologies and applications in cancer research. J Hematol Oncol (2020) 13:166. doi: 10.1186/s13045-020-01005-x
18. Gupta R, Srivastava D, Sahu M, Tiwari S, Ambasta RK, Kumar P. Artificial intelligence to deep learning: machine intelligence approach for drug discovery. Mol Divers (2021) 25:1315–60. doi: 10.1007/s11030-021-10217-3
19. Garbulowski M, Smolinska K, Çabuk U, Yones SA, Celli L, Yaz EN, et al. Machine learning-based analysis of glioma grades reveals Co-enrichment. Cancers (2022) 14:1014. doi: 10.3390/cancers14041014
20. Chen D-L, Cai J-H, Wang CCN. Identification of key prognostic genes of triple negative breast cancer by LASSO-based machine learning and bioinformatics analysis. Genes (Basel) (2022) 13:902. doi: 10.3390/genes13050902
21. Alimadadi A, Aryal S, Manandhar I, Munroe PB, Joe B, Cheng X. Artificial intelligence and machine learning to fight COVID-19. Physiol Genomics (2020) 52:200–02. doi: 10.1152/physiolgenomics.00029.2020
22. Fu Q, Hu L, Xu Y, Yi Y, Jiang L. High lipoprotein(a) concentrations are associated with lower type 2 diabetes risk in the Chinese han population: a large retrospective cohort study. Lipids Health Dis (2021) 20:76. doi: 10.1186/s12944-021-01504-x
23. Huang R, Mao M, Lu Y, Yu Q, Liao L. A novel immune-related genes prognosis biomarker for melanoma: associated with tumor microenvironment. Aging (Albany NY) (2020) 12:6966–80. doi: 10.18632/aging.103054
24. Wang X, Xiong H, Liang D, Chen Z, Li X, Zhang K. The role of SRGN in the survival and immune infiltrates of skin cutaneous melanoma (SKCM) and SKCM-metastasis patients. BMC Cancer (2020) 20:378. doi: 10.1186/s12885-020-06849-7
25. Liu D, Yang X, Wu X. Tumor immune microenvironment characterization identifies prognosis and immunotherapy-related gene signatures in melanoma. Front Immunol (2021) 12:663495. doi: 10.3389/fimmu.2021.663495
26. Ju A, Tang J, Chen S, Fu Y, Luo Y. Pyroptosis-related gene signatures can robustly diagnose skin cutaneous melanoma and predict the prognosis. Front Oncol (2021) 11:709077. doi: 10.3389/fonc.2021.709077
27. Huang B, Han W, Sheng Z-F, Shen G-L. Identification of immune-related biomarkers associated with tumorigenesis and prognosis in cutaneous melanoma patients. Cancer Cell Int (2020) 20:195. doi: 10.1186/s12935-020-01271-2
28. Li H, van der Leun AM, Yofe I, Lubling Y, Gelbard-Solodkin D, van Akkooi ACJ, et al. Dysfunctional CD8 T cells form a proliferative, dynamically regulated compartment within human melanoma. Cell (2019) 176:775-789.e18. doi: 10.1016/j.cell.2018.11.043
29. Tang J, Wan Q, Lu J. The prognostic values of m6A RNA methylation regulators in uveal melanoma. BMC Cancer (2020) 20:674. doi: 10.1186/s12885-020-07159-8
30. Shi S, Fan Z, Liu Y, Huang C, Zhou J. Integration analysis of m6A related genes in skin cutaneous melanoma and the biological function research of the SPRR1B. Front Oncol (2021) 11:729045. doi: 10.3389/fonc.2021.729045
31. Ji Z-H, Ren W-Z, Wang H-Q, Gao W, Yuan B. Molecular subtyping based on cuproptosis-related genes and characterization of tumor microenvironment infiltration in kidney renal clear cell carcinoma. Front Oncol (2022) 12:919083. doi: 10.3389/fonc.2022.919083
32. Cui L, Gouw AM, LaGory EL, Guo S, Attarwala N, Tang Y, et al. Mitochondrial copper depletion suppresses triple-negative breast cancer in mice. Nat Biotechnol (2021) 39:357–67. doi: 10.1038/s41587-020-0707-9
33. Zhang Z, Zeng X, Wu Y, Liu Y, Zhang X, Song Z. Cuproptosis-related risk score predicts prognosis and characterizes the tumor microenvironment in hepatocellular carcinoma. Front Immunol (2022) 13:925618. doi: 10.3389/fimmu.2022.925618
34. Yuan Y, Zhu Z, Lan Y, Duan S, Zhu Z, Zhang X, et al. Development and validation of a CD8+ T cell infiltration-related signature for melanoma patients. Front Immunol (2021) 12:659444. doi: 10.3389/fimmu.2021.659444
35. Tan Y, Chen Q, Li X, Zeng Z, Xiong W, Li G, et al. Pyroptosis: a new paradigm of cell death for fighting against cancer. J Exp Clin Cancer Res (2021) 40:153. doi: 10.1186/s13046-021-01959-x
36. Dong C, Dang D, Zhao X, Wang Y, Wang Z, Zhang C. Integrative characterization of the role of IL27 in melanoma using bioinformatics analysis. Front Immunol (2021) 12:713001. doi: 10.3389/fimmu.2021.713001
37. Johnson DB, Estrada MV, Salgado R, Sanchez V, Doxie DB, Opalenik SR, et al. Melanoma-specific MHC-II expression represents a tumour-autonomous phenotype and predicts response to anti-PD-1/PD-L1 therapy. Nat Commun (2016) 7:10582. doi: 10.1038/ncomms10582
38. Li Y, Zhang J, Liu Y, Zhang B, Zhong F, Wang S, et al. MiR-30a-5p confers cisplatin resistance by regulating IGF1R expression in melanoma cells. BMC Cancer (2018) 18:404. doi: 10.1186/s12885-018-4233-9
39. Manning A, Rassie K, Rivalland G. A case of hyperprolactinaemia in a patient with metastatic melanoma. Melanoma Res (2021) 31:277–79. doi: 10.1097/CMR.0000000000000738
40. Chou W-C, Guo Z, Guo H, Chen L, Zhang G, Liang K, et al. AIM2 in regulatory T cells restrains autoimmune diseases. Nature (2021) 591:300–05. doi: 10.1038/s41586-021-03231-w
41. Fernandes-Alnemri T, Yu J-W, Datta P, Wu J, Alnemri ES. AIM2 activates the inflammasome and cell death in response to cytoplasmic DNA. Nature (2009) 458:509–13. doi: 10.1038/nature07710
42. Hu B, Jin C, Li H-B, Tong J, Ouyang X, Cetinbas NM, et al. The DNA-sensing AIM2 inflammasome controls radiation-induced cell death and tissue injury. Science (2016) 354:765–68. doi: 10.1126/science.aaf7532
43. Onódi Z, Ruppert M, Kucsera D, Sayour AA, Tóth VE, Koncsos G, et al. AIM2-driven inflammasome activation in heart failure. Cardiovasc Res (2021) 117:2639–51. doi: 10.1093/cvr/cvab202
44. Youm Y-H, Nguyen KY, Grant RW, Goldberg EL, Bodogai M, Kim D, et al. The ketone metabolite β-hydroxybutyrate blocks NLRP3 inflammasome-mediated inflammatory disease. Nat Med (2015) 21:263–9. doi: 10.1038/nm.3804
45. Fukuda K, Okamura K, Riding RL, Fan X, Afshari K, Haddadi N-S, et al. AIM2 regulates anti-tumor immunity and is a viable therapeutic target for melanoma. J Exp Med (2021) 218:e20200962. doi: 10.1084/jem.20200962
46. Li Y, Wang W, Li A, Huang W, Chen S, Han F, et al. Dihydroartemisinin induces pyroptosis by promoting the AIM2/caspase-3/DFNA5 axis in breast cancer cells. Chem Biol Interact (2021) 340:109434. doi: 10.1016/j.cbi.2021.109434
47. Deng W, Ma Y, Su Z, Liu Y, Liang P, Huang C, et al. Single-cell RNA-sequencing analyses identify heterogeneity of CD8(+) T cell subpopulations and novel therapy targets in melanoma. Mol Ther Oncolytics (2021) 20:105–18. doi: 10.1016/j.omto.2020.12.003
48. Cheng X, Wei L, Huang X, Zheng J, Shao M, Feng T, et al. Solute carrier family 39 member 6 gene promotes aggressiveness of esophageal carcinoma cells by increasing intracellular levels of zinc, activating phosphatidylinositol 3-kinase signaling, and up-regulating genes that regulate metastasis. Gastroenterology (2017) 152:1985–97.e12. doi: 10.1053/j.gastro.2017.02.006
49. Cui X-B, Shen Y-y, Jin T-t, Li S, Li T-t, Zhang S-m, et al. SLC39A6: a potential target for diagnosis and therapy of esophageal carcinoma. J Transl Med (2015) 13:321. doi: 10.1186/s12967-015-0681-z
50. Althobiti M, El-Sharawy KA, Joseph C, Aleskandarany M, Toss MS, Green AR, et al. Oestrogen-regulated protein SLC39A6: a biomarker of good prognosis in luminal breast cancer. Breast Cancer Res Treat (2021) 189:621–30. doi: 10.1007/s10549-021-06336-y
51. Tamaki T, Kamatsuka K, Sato T, Morooka S, Otsuka K, Hattori M, et al. A novel transmembrane protein defines the endoplasmic reticulum stress-induced cell death pathway. Biochem Biophys Res Commun (2017) 486:149–55. doi: 10.1016/j.bbrc.2017.03.017
52. Chen B, Liao Z, Qi Y, Zhang H, Su C, Liang H, et al. miR-631 inhibits intrahepatic metastasis of hepatocellular carcinoma by targeting PTPRE. Front Oncol (2020) 10:565266. doi: 10.3389/fonc.2020.565266
53. Codreanu SG, Hoeksema MD, Slebos RJC, Zimmerman LJ, Rahman SMJ, Li M, et al. Identification of proteomic features to distinguish benign pulmonary nodules from lung adenocarcinoma. J Proteome Res (2017) 16:3266–76. doi: 10.1021/acs.jproteome.7b00245
54. Li KK-W, Qi Y, Xia T, Chan AK-Y, Zhang Z-Y, Aibaidula A, et al. The kinesin KIF14 is overexpressed in medulloblastoma and downregulation of KIF14 suppressed tumor proliferation and induced apoptosis. Lab Invest (2017) 97:946–61. doi: 10.1038/labinvest.2017.48
55. Reilly ML, Stokman MF, Magry V, Jeanpierre C, Alves M, Paydar M, et al. Loss-of-function mutations in KIF14 cause severe microcephaly and kidney development defects in humans and zebrafish. Hum Mol Genet (2019) 28:778–95. doi: 10.1093/hmg/ddy381
56. Singel SM, Cornelius C, Zaganjor E, Batten K, Sarode VR, Buckley DL, et al. KIF14 promotes AKT phosphorylation and contributes to chemoresistance in triple-negative breast cancer. Neoplasia (2014) 16:247–56, 56.e2. doi: 10.1016/j.neo.2014.03.008
57. Li T-F, Zeng H-J, Shan Z, Ye R-Y, Cheang T-Y, Zhang Y-J, et al. Overexpression of kinesin superfamily members as prognostic biomarkers of breast cancer. Cancer Cell Int (2020) 20:123. doi: 10.1186/s12935-020-01191-1
58. Yang X, Li C, Yan C, Li J, Yan M, Liu B, et al. KIF14 promotes tumor progression and metastasis and is an independent predictor of poor prognosis in human gastric cancer. Biochim Biophys Acta Mol Basis Dis (2019) 1865:181–92. doi: 10.1016/j.bbadis.2018.10.039
59. Chen Y, Xu T, Xie F, Wang L, Liang Z, Li D, et al. Evaluating the biological functions of the prognostic genes identified by the pathology atlas in bladder cancer. Oncol Rep (2021) 45:191–201. doi: 10.3892/or.2020.7853
60. Xiaohong Z, Lichun F, Na X, Kejian Z, Xiaolan X, Shaosheng W. MiR-203 promotes the growth and migration of ovarian cancer cells by enhancing glycolytic pathway. Tumour Biol (2016) 37:14989–97. doi: 10.1007/s13277-016-5415-1
61. Hegde PS, Chen DS. Top 10 challenges in cancer immunotherapy. Immunity (2020) 52:17–35. doi: 10.1016/j.immuni.2019.12.011
62. Zhang Y, Zhang Z. The history and advances in cancer immunotherapy: understanding the characteristics of tumor-infiltrating immune cells and their therapeutic implications. Cell Mol Immunol (2020) 17:807–21. doi: 10.1038/s41423-020-0488-6
63. Magrì A, Germano G, Lorenzato A, Lamba S, Chilà R, Montone M, et al. High-dose vitamin c enhances cancer immunotherapy. Sci Transl Med (2020) 12:eaay8707. doi: 10.1126/scitranslmed.aay8707
64. Galassi C, Musella M, Manduca N, Maccafeo E, Sistigu A. The immune privilege of cancer stem cells: A key to understanding tumor immune escape and therapy failure. Cells (2021) 10:2361. doi: 10.3390/cells10092361
65. Ubellacker JM, Tasdogan A, Ramesh V, Shen B, Mitchell EC, Martin-Sandoval MS, et al. Lymph protects metastasizing melanoma cells from ferroptosis. Nature (2020) 585:113–18. doi: 10.1038/s41586-020-2623-z
66. Marzagalli M, Ebelt ND, Manuel ER. Unraveling the crosstalk between melanoma and immune cells in the tumor microenvironment. Semin Cancer Biol (2019) 59:236–50. doi: 10.1016/j.semcancer.2019.08.002
67. Alrabadi NN, Abushukair HM, Ababneh OE, Syaj SS, Al-Horani SS, Qarqash AA, et al. Systematic review and meta-analysis efficacy and safety of immune checkpoint inhibitors in advanced melanoma patients with anti-PD-1 progression: a systematic review and meta-analysis. Clin Transl Oncol (2021) 23:1885–904. doi: 10.1007/s12094-021-02598-6
68. Robert C, Ribas A, Schachter J, Arance A, Grob J-J, Mortier L, et al. Pembrolizumab versus ipilimumab in advanced melanoma (KEYNOTE-006): post-hoc 5-year results from an open-label, multicentre, randomised, controlled, phase 3 study. Lancet Oncol (2019) 20:1239–51. doi: 10.1016/S1470-2045(19)30388-2
69. Hodi FS, Chiarion-Sileni V, Gonzalez R, Grob JJ, Rutkowski P, Cowey CL, et al. Nivolumab plus ipilimumab or nivolumab alone versus ipilimumab alone in advanced melanoma (CheckMate 067): 4-year outcomes of a multicentre, randomised, phase 3 trial. Lancet Oncol (2018) 19:1480–92. doi: 10.1016/S1470-2045(18)30700-9
70. Tang R, Xu J, Zhang B, Liu J, Liang C, Hua J, et al. Ferroptosis, necroptosis, and pyroptosis in anticancer immunity. J Hematol Oncol (2020) 13:110. doi: 10.1186/s13045-020-00946-7
71. Liu Q, Nie R, Li M, Li L, Zhou H, Lu H, et al. Identification of subtypes correlated with tumor immunity and immunotherapy in cutaneous melanoma. Comput Struct Biotechnol J (2021) 19:4472–85. doi: 10.1016/j.csbj.2021.08.005
72. Qi X, Yang M, Ma L, Sauer M, Avella D, Kaifi JT, et al. Synergizing sunitinib and radiofrequency ablation to treat hepatocellular cancer by triggering the antitumor immune response. J Immunother Cancer (2020) 8:e001038. doi: 10.1136/jitc-2020-001038
73. Hojo Y, Kishi S, Mori S, Fujiwara-Tani R, Sasaki T, Fujii K, et al. Sunitinib and pterostilbene combination treatment exerts antitumor effects in gastric cancer via suppression of PDZD8. Int J Mol Sci (2022) 23:4002. doi: 10.3390/ijms23074002
74. Choueiri TK, Motzer RJ, Rini BI, Haanen J, Campbell MT, Venugopal B, et al. Updated efficacy results from the JAVELIN renal 101 trial: first-line avelumab plus axitinib versus sunitinib in patients with advanced renal cell carcinoma. Ann Oncol (2020) 31:1030–39. doi: 10.1016/j.annonc.2020.04.010
75. Zhou Y, Zhou H, Hua L, Hou C, Jia Q, Chen J, et al. Verification of ferroptosis and pyroptosis and identification of PTGS2 as the hub gene in human coronary artery atherosclerosis. Free Radic Biol Med (2021) 171:55–68. doi: 10.1016/j.freeradbiomed.2021.05.009
76. Koutcher JA, Motwani M, Zakian KL, Li XK, Matei C, Dyke JP, et al. The in vivo effect of bryostatin-1 on paclitaxel-induced tumor growth, mitotic entry, and blood flow. Clin Cancer Res (2000) 6:1498–507.
Keywords: melanoma, subtype, machine learning, prognostic model, metastasis model, cuproptosis
Citation: Liu J-Y, Liu L-P, Li Z, Luo Y-W and Liang F (2022) The role of cuproptosis-related gene in the classification and prognosis of melanoma. Front. Immunol. 13:986214. doi: 10.3389/fimmu.2022.986214
Received: 04 July 2022; Accepted: 28 September 2022;
Published: 19 October 2022.
Edited by:
Jun Liu, Yuebei People’s Hospital, ChinaReviewed by:
Shaocong Mo, Fudan University, ChinaCopyright © 2022 Liu, Liu, Li, Luo and Liang. This is an open-access article distributed under the terms of the Creative Commons Attribution License (CC BY). The use, distribution or reproduction in other forums is permitted, provided the original author(s) and the copyright owner(s) are credited and that the original publication in this journal is cited, in accordance with accepted academic practice. No use, distribution or reproduction is permitted which does not comply with these terms.
*Correspondence: Fang Liang, bGlhbmdmYW5nOTI0QDE2My5jb20=; Yan-Wei Luo, cm95YWx3YXlAY3N1LmVkdS5jbg==
†These authors have contributed equally to this work and share the first authorship
Disclaimer: All claims expressed in this article are solely those of the authors and do not necessarily represent those of their affiliated organizations, or those of the publisher, the editors and the reviewers. Any product that may be evaluated in this article or claim that may be made by its manufacturer is not guaranteed or endorsed by the publisher.
Research integrity at Frontiers
Learn more about the work of our research integrity team to safeguard the quality of each article we publish.