
95% of researchers rate our articles as excellent or good
Learn more about the work of our research integrity team to safeguard the quality of each article we publish.
Find out more
ORIGINAL RESEARCH article
Front. Immunol. , 27 October 2022
Sec. Cancer Immunity and Immunotherapy
Volume 13 - 2022 | https://doi.org/10.3389/fimmu.2022.968165
This article is part of the Research Topic The Roles of Ion-Induced Cell Death in Cancer Treatment View all 19 articles
 Muhammad Khan1,2
 Jie Lin2
 Baiyao Wang2
 Chengcong Chen2Zhong Huang2
 Yunhong Tian2
 Yawei Yuan1,2*Junguo Bu1*
Background: Gastric cancer (GC) represents a major global clinical problem with very limited therapeutic options and poor prognosis. Necroptosis, a recently discovered inflammatory form of cell death, has been implicated in carcinogenesis and inducing necroptosis has also been considered as a therapeutic strategy.
Objective: We aim to evaluate the role of this pathway in gastric cancer development, prognosis and immune aspects of its tumor microenvironment.
Methods and results: In this study, we evaluated the gene expression of 55 necroptosis-related genes (NRGs) that were identified via carrying out a comprehensive review of the medical literature. Necroptosis pathway was deregulated in gastric cancer samples (n=375) as compared to adjacent normal tissues (n=32) obtained from the “The Cancer Genome Atlas (TCGA)”. Based on the expression of these NRGs, two molecular subtypes were obtained through consensus clustering that also showed significant prognostic difference. Differentially expressed genes between these two clusters were retrieved and subjected to prognostic evaluation via univariate cox regression analysis and LASSO cox regression analysis. A 13-gene risk signature, termed as necroptosis-related genes prognostic index (NRGPI), was constructed that comprehensively differentiated the gastric cancer patients into high- and low-risk subgroups. The prognostic significance of NRGPI was validated in the GEO cohort (GSE84437: n=408). The NRGPI-high subgroup was characterized by upregulation of 10 genes (CYTL1, PLCL1, CGB5, CNTN1, GRP, APOD, CST6, GPX3, FCN1, SERPINE1) and downregulation of 3 genes (EFNA3, E2F2, SOX14). Further dissection of these two risk groups by differential gene expression analysis indicated involvement of signaling pathways associated with cancer cell progression and immune suppression such as WNT and TGF-β signaling pathway. Para-inflammation and type-II interferon pathways were activated in NRGPI-high patients with an increased infiltration of Tregs and M2 macrophage indicating an exhausted immune phenotype of the tumor microenvironment. These molecular characteristics were mainly driven by the eight NRGPI oncogenes (CYTL1, PLCL1, CNTN1, GRP, APOD, GPX3, FCN1, SERPINE1) as validated in the gastric cancer cell lines and clinical samples. NRGPI-high patients showed sensitivity to a number of targeted agents, in particular, the tyrosine kinase inhibitors.
Conclusions: Necroptosis appears to play a critical role in the development of gastric cancer, prognosis and shaping of its tumor immune microenvironment. NRGPI can be used as a promising prognostic biomarker to identify gastric cancer patients with a cold tumor immune microenvironment and poor prognosis who may response to selected molecular targeted therapy.
Gastric cancer represents a major clinical problem and is ranked fifth for incidence and fourth for mortality globally. It is responsible for 1,089,103 new cases in 2020 and an estimated 768,793 deaths which means one in every 13 deaths (1). The overall survival remains at 31% within the United States and 25% worldwide (2). Pathogenic infections such as H. pylori, which is infecting 50% of global population, and Epstein Barr virus (EBV) have been linked to gastric cancer (3, 4). Eradication of H. pylori strategies have helped to prevent a significant proportion of gastric cancer (5). Multidisciplinary approach of surgery and chemotherapy has improved the survival rate to 60% and 80% in early staged gastric cancer. However, majority of the cases are diagnosed at an advanced stage for whom the 5-year survival rate is merely 18% to 50% (3). These figures indicate the need for more effective molecularly driven treatment strategies.
Necroptosis is a programmed lytic cell death pathway and is deregulated in various inflammatory disorders and cancers (6–8). Receptor-interacting serine/threonine-protein kinase 1 (RIPK1), receptor-interacting protein kinase 3 (RIPK3), and mixed lineage kinase domain like pseudokinase (MLKL), which constitutes the core components of necroptosis, are downregulated in various types of cancers including colorectal cancer, pancreatic adenocarcinoma, cervical squamous cell carcinoma, and melanoma (6, 7, 9–13). Downregulation correlated with histological grade and was shown to be an independent prognostic factor for overall survival (OS) and disease-free survival (DFS) (10). Moreover, testing of more than 60 cancer cell lines showed absence of RIPK3 protein expression in two-thirds of these cancer cell lines, which was restored upon treatment with the hypomethylating agent decitabine (14). In glioblastoma cells, RIPK3 downregulation or inhibition of RIPK1 with Nec-1 were sufficient to abrogate the necroptosis-mediated cell death induced by edelfosine (15). Induction of osteosarcoma cell death via necroptosis has also been demonstrated by combining the stress-inducing agents and nuclear factor-kappa B (NF-κB) inhibitors (16). These studies indicate that necroptosis-induction strategies could be exploited for cancer therapy. Necroptosis is characterized by simultaneous swelling of organelles and disruption of plasma membrane leading to organelle breakdown and leakage of intracellular contents resulting in a pro-inflammatory response (7, 8). Carcinogenic effects include its ability to induce inflammation which has been associated with cancer metastasis and T cell death (11). On the other hand, due to its inflammatory nature, necroptosis is also regarded as a potential target for cancer therapy as necroptosis cells were shown to initiate adaptive immunity by activating CD8+ T cells via production of antigens and inflammatory stimuli for dendritic cells (DCs) (17). Therefore, understanding the molecular dynamics of this pathway in gastric cancer may unravel its potential as a therapeutic target.
In this study we investigated the role of necroptosis in stomach adenocarcinoma by first 1) reviewing the medical literature for the various molecules involved in the process of necroptosis and then 2) carrying out comprehensive bioinformatic analysis of the expression datasets. We successfully developed a risk model that can not only predict the prognosis of gastric cancer patients but also their immune landscape.
Clinical and mRNA expression data of 375 stomach adenocarcinoma tissues (STAD) and 32 adjacent normal tissues was retrieved from TCGA Data Portal (https://portal.gdc.cancer.gov/repository/). Likewise, RNA-Seq and clinical data for external validation cohort (GEO ID: GSE84437) were downloaded from GEO database (https://www.ncbi.nlm.nih.gov/geo/). Both datasets were subjected to log2(x+1) transformation and normalization with “limma” package. Batch effects were removed with “sva” package using “Combat” function. General characteristics of the two cohorts are outlined in Supplementary Table 1 (Supplementary Data-Sheet#1). Genetic alterations data (Simple Nucleotide Variation) of TCGA STAD cohort was downloaded from the University of California, Santa Cruz (UCSC) Xena website (https://xenabrowser.net/). The oncoplot was constructed using the R package “maftools” to analyze the number and categories of gene mutations in two NRGPI subgroups. Protein-protein interaction (PPI) network was constructed with the Search Tool for the Retrieval of Interacting Genes (STRING) database, version 11.5 (https://string-db.org/). STRING is a database of known and predicted protein-protein interactions. Interactions in STRING are derived from five main sources: genomic context predictions; high-throughput lab experiments; (conserved) co-expression; automated textmining; and previous knowledge in databases. The TIMER 2.0 website (http://timer.comp-genomics.org/) was utilized for estimation of association between NRGPI risk genes and macrophage infiltration.
A total of 55 necroptosis-related genes (NRGs) were extracted from The Molecular Signatures Database (MSigDB) and previously published reviews and research articles (Supplementary Data-Sheet#2: Supplementary Table 2) (18–58). RIPK1, RIPK3 and MLKL constitutes the core components of this pathway. Mainly three receptor pathways were identified in regulation of necroptosis, namely: tumor necrosis factor receptor 1 (TNFR1), FAS receptor (TNFR6) and toll-like receptors (TLR3/4) (30–33). Moreover, negative and positive regulators of RIPK1, RIPK3, MLKL and necrosome (RIPK1-RIPK3-MLKL complex) were also studied (18–58). Differentially expressed genes (DEGs) were determined with the application of “limma” package with p value <0.05.
Consensus clustering analysis, which is a rigorous unsupervised classification technique, was carried out to identify distinct necroptosis patterns based on the expression of 55 NRGs. R package “ConsensuClusterPlus” was utilized for measuring similarity between and within each group via Euclidean distance with 1000 times repetition (59). Optimum cluster number (k) and level of consensus stability was determined according to the cumulative distribution function (CDF) plots and the atness of the CDF curve, respectively. Overall survival difference between the clusters was obtained using the R package “survival”. Survival risk was estimated using Cox Proportional-Hazards model and statistical difference was assessed by log-rank test. The DEGs between the clusters were estimated with “limma” package according to the criteria: log fold change (logFC) = 1, and the false discover rate (FDR) < 0.01.
Next, univariate cox regression analysis was carried out to estimate the prognostic significance of the DEGs (n=1056) identified between the clusters. In total, 124 DEGs showed prognostic association when significance level was set at p<0.01. Using the R package “glmnet”, these DEGs were subjected to the least absolute shrinkage and selection operator (LASSO) penalized Cox regression analysis to construct the prognostic model by narrowing down the candidate genes (60). Normalized candidate DEGs expression and survival data (time and status) constituted the independent and independent variable of the LASSO regression, respectively. Penalty parameter (λ) was determined with the minimum criteria by using a ten-fold cross-validation. The risk score was calculated for each patient according to the expression level of DEGs and their corresponding coefficient. The formula was as follows: risk score = (expression of mRNA1 × coefficientmRNA1) + (expression of mRNA2 × coefficientmRNA2) + … + (expression of mRNAn × coefficientmRNAn). The median risk score was used to determine the subgroups into low- and high-risk cohorts. The Kaplan-Meier analysis was performed to compare the overall survival between the risk groups. Receiver operating characteristic (ROC) curve to evaluate diagnostic efficacy of the risk model was obtained via ROC curve analysis using the R packages “survival”, “survminer” and “time-ROC”. Furthermore, principal component analysis (PCA) and t-distributed stochastic neighbor embedding (t-SNE) were also performed to further visualize spatial dimensions between the risk groups. PCA was performed using the “prcomp” function in the “stats” R package and t-SNE with the R package “Rtsne”. All of the steps were repeated for validation in the GEO cohort.
We further sought to validate the prognostic model by undertaking independent prognostic analysis in the TCGA and GEO cohorts along with other variables such age, gender, tumor grade and tumor stage (TNM staging data). Univariate and multivariate cox regression models were employed.
Differential expression of genes was investigated between the low- and high-risk subgroups in the TCGA cohort to assess the biological processes and pathways differentiating the risk subgroups. DEGs were filtered according to logFC = 1 and FDR < 0.05. Gene ontology (GO) and Kyoto Encyclopedia of Genes and Genomes (KEGG) analysis was performed based on these DEGs by applying the “clusterProfiler” package. Immune landscape was evaluated in term of immune cell infiltration as well as the immune-related pathways. Infiltration of major immune cells and the status of immune-related pathways was evaluated by employing the “gsva” package to conduct the single-sample gene set enrichment analysis (ssGSEA). Score for the activity of each immune-related pathways was calculated. Furthermore, to elucidate on the subtypes of various immune cells, a quantitative analysis of the relative abundance of 22 types of immune cells in the TCGA cohort was achieved using the CIBERSORT algorithm. The results were used to quantify the difference in the infiltration of each cell in the risk groups. Moreover, the prognostic significance of each immune cell and immune-related pathway was also elaborated by employing the K-M survival analysis. Significance level was set at p<0.05. In an attempt to establish the immune subtype of the risk groups, we used the immune subtype information available from the previous paper to establish the enrichment of each subtype in the high- and low-risk groups (61).
To construct the competing endogenous RNA network, the miRNA targets for the risk genes were predicted using miRWalk 3.0 (http://mirwalk.umm.uni-heidelberg.de/), which provides the predicted and experimentally verified results of TargetScan, MirTarbase and miRDB. A cutoff criterion (≥ 0.95) was set for the prediction analysis in miRWalk. The miRNA targets obtained were further screened for negative correlation with the risk genes in the TCGA STAD cohort which was followed by further prognostic significance. The starbase v2.0 (http://starbase.sysu.edu.cn/) was investigated for miRNA-lncRNA targets which were then screened for their positive correlation with risk genes and negative correlation with miRNA targets in the TCGA STAD cohort (62). The ceRNA network was plotted with Cytoscape v3.6.0 (63). Correlation scrutiny was tested with Spearman’s correlation test with the following criteria: R=0.2 and p value <0.001.
Formalin-fixed, paraffin-embedded 4-μm thick tumor tissue sections were deparaffinized in xylene and ethanol. Antigen retrieval was performed by boiling in a microwave oven (citrate buffer, pH 6.0) which was followed by blocking of endogenous HRP activity with 0.3% hydrogen peroxide. After washing with 10% phosphate buffered saline (PBS), the sections were blocked with 5% BSA and incubated with primary antibodies against RIPK1 (Proteintech, #17519-1-AP, Rabbit, 1:50), RIPK3 (Proteintech, #17563-1-AP, Rabbit, 1:100), MLKL (Proteintech, #21066-1-AP, Rabbit, 1:50), SERPINE1 (Proteintech, #13801-1-AP, Rabbit, 1:50), FCN1 (Proteintech, #11775-1-AP, Rabbit, 1:50), CNTN1 (Proteintech, #13843-1-AP, Rabbit, 1:50), CYTL1 (Proteintech, #15856-1-AP, Rabbit, 1:50), PLCL1 (Abcam, #EPR11213, Rabbit, 1:100), GRP (Proteintech, #28482-1-AP, Rabbit, 1:500), GPX3 (Affinity Biosciences, #DF6765, Rabbit, 1:50), APOD (Proteintech, #10520-1-AP, Rabbit, 1:50), TGFB1 (Affinity Biosciences, #AF1027, Rabbit, 1:100), TGFB3 (Proteintech, #18942-1-AP, Rabbit, 1:50), WNT2B (Affinity Biosciences, #DF12538, Rabbit, 1:100), WNT9A (Affinity Biosciences, #DF9044, Rabbit, 1:100), CD68 (Abcam,ab955,1:3000), CD206 (Cell Signaling,#24595,1:200), and CD163 (Cell Signaling,#93498,1:250) at 4°C overnight. Next, the sections were incubated with a biotinylated goat anti-rabbit IgG secondary antibody for 20 min at room temperature and visualized with 3, 5- diaminobenzidine (DAB) Substrate Kit and finally counterstained with Hematoxylin. The staining intensity was scored using a semi-quantitative approach as follows: 0, negative; 1, weak; 2, moderate; and 3, strong. The frequency of positive cells was defined as follows: 0, less than 5%; 1, 5–25%; 2, 26–50%; 3, 51–75%; and 4, greater than 75%. The final IHC scores were obtained by multiplying the staining intensity and the frequency of positive cells. When tissue staining was heterogeneous, each area was scored independently and the scores of each area were added together as the final result. Patient informed consents were obtained and approval of the internal review and ethics boards of the Affiliated Cancer Hospital and Institute of Guangzhou Medical University was also acquired.
Human gastric cancer cell lines (human gastric adenocarcinoma AGS & MNK45 cell lines) were obtained from Committee of Type Culture Collection of Chinese Academy of Sciences (Shanghai, China). Cells were grown in DMEM medium supplemented with 10% fetal bovine serum (FBS), penicillin (100 U/ml), and streptomycin (100 mg/ml). Cells were maintained at 37°C in a humid incubator (37°C, 5% CO2).
Necroptosis was induced in cells by treating them with a combination of recombinant human tumor necrosis factor-α (TNF-α) (Peprotech, New Jersey, USA; 10 ng/ml), second mitochondrial- derived activator of caspases (SMAC) mimetic (BV6; Selleck Chemicals, Houston, USA; 1 nM) and pan-caspase inhibitor (zVAD-FMK; ENZO Life Science, New York, USA; 40 μM). Necrostatin-1 (Enzo; 30 μM) was added an hour before treating with the above agents to inhibit necroptosis. To collect culture media, the cells were washed twice with PBS and media was replaced with fresh media after being treated for 3 hours with the aforementioned agents, which was followed by 12 hours’ incubation at 37 °C. The culture media (CM) was then collected and filtered with a 22-μm syringe filter (Merck, Darmstadt, Germany). Supernatants were collected after centrifugation at 1500 rpm for 5 minutes and stored at 4°C.
Total RNA was extracted and purified using Trizol Reagent (Takara, Otsu, Japan) and it was reverse transcribed to cDNA and qRT-PCR were conducted by using a SYBR Green PCR Kit (Takara, Otsu, Japan). The expression of mRNA was standardized by internal control Glyceraldehyde 3-phosphate dehydrogenase (GAPDH), and relative mRNA level of the treated group was based on the control group. The Primers used in the study are presented in Supplementary Table 3 (Supplementary Data-Sheet#3).
To predict the therapeutic vulnerability of high-risk group, the “pRRophetic” package in R was used to estimate the half-maximal inhibitory concentration (IC50) of drugs in the STAD patients (64). The pRRophetic algorithm uses the gene expression and drug sensitivity data from the cancer cell lines in the Cancer Genome Project (CGP) (65). The CGP investigated the therapeutic sensitivity of 130 drugs in more 639 cancer cell lines. The therapeutic targets, primary functions, or cellular functions of the 130 drugs included the following: serine/threonine kinase, receptor tyrosine kinase, cytoplasmic tyrosine kinase, cytoskeleton, metabolism, apoptosis, mitosis, replication, cell cycle, DNA repair, stress pathways, adhesion, transcription, angiogenesis, and chromatin. The panel of 130 encompassed 114 targeted and 13 cytotoxic chemotherapeutic agents. Of these, 31 are clinically approved, 47 in development undergoing clinical trials, and 52 were experimental tool compounds.
Comparison of the gene expression level and drug sensitivity between the groups was accomplished using Wilcoxon test. Chi-square test was used to compare the categorical variables. Overall survival difference between the groups were estimated using the Kaplan-Meier method with log-rank test. Univariate and multivariate factor analyses were carried with cox-regression hazard models. All statistical analyses were performed with R software (v4.0.2).
Comparison of expression levels of the 55 necroptosis-related genes (NRGs) between 375 gastric cancer and 32 paired normal tissues obtained from the “The Cancer Genome Atlas (TCGA)” revealed 38 differentially expressed genes (DEGs) (all P < 0.01). Majority of the NRGs were deregulated in cancer tissues as compared to normal tissues which showed a uniform downregulated expression pattern except for NDRG2, BCL2, PRKN, TLR3, and STUB1. The mRNA levels of these genes are presented as heatmap in Figure 1A. A similar outlook was obtained when paired samples (n=32) from TCGA STAD cohort were considered only (Figure 1B). A protein-protein interaction was assessed for further exploration revealing a strong interaction activity among these molecules at protein level as demonstrated in Figure 1C. Likewise, the correlation network constructed based on the mRNA expression level in TCGA STAD demonstrated negative (blue) and positive (red) correlation among these NRGs as shown in Figure 1D. A strong positive correlation can be observed between majority of these NRGs. These results indicate a critical deregulation of necroptosis in gastric cancer.
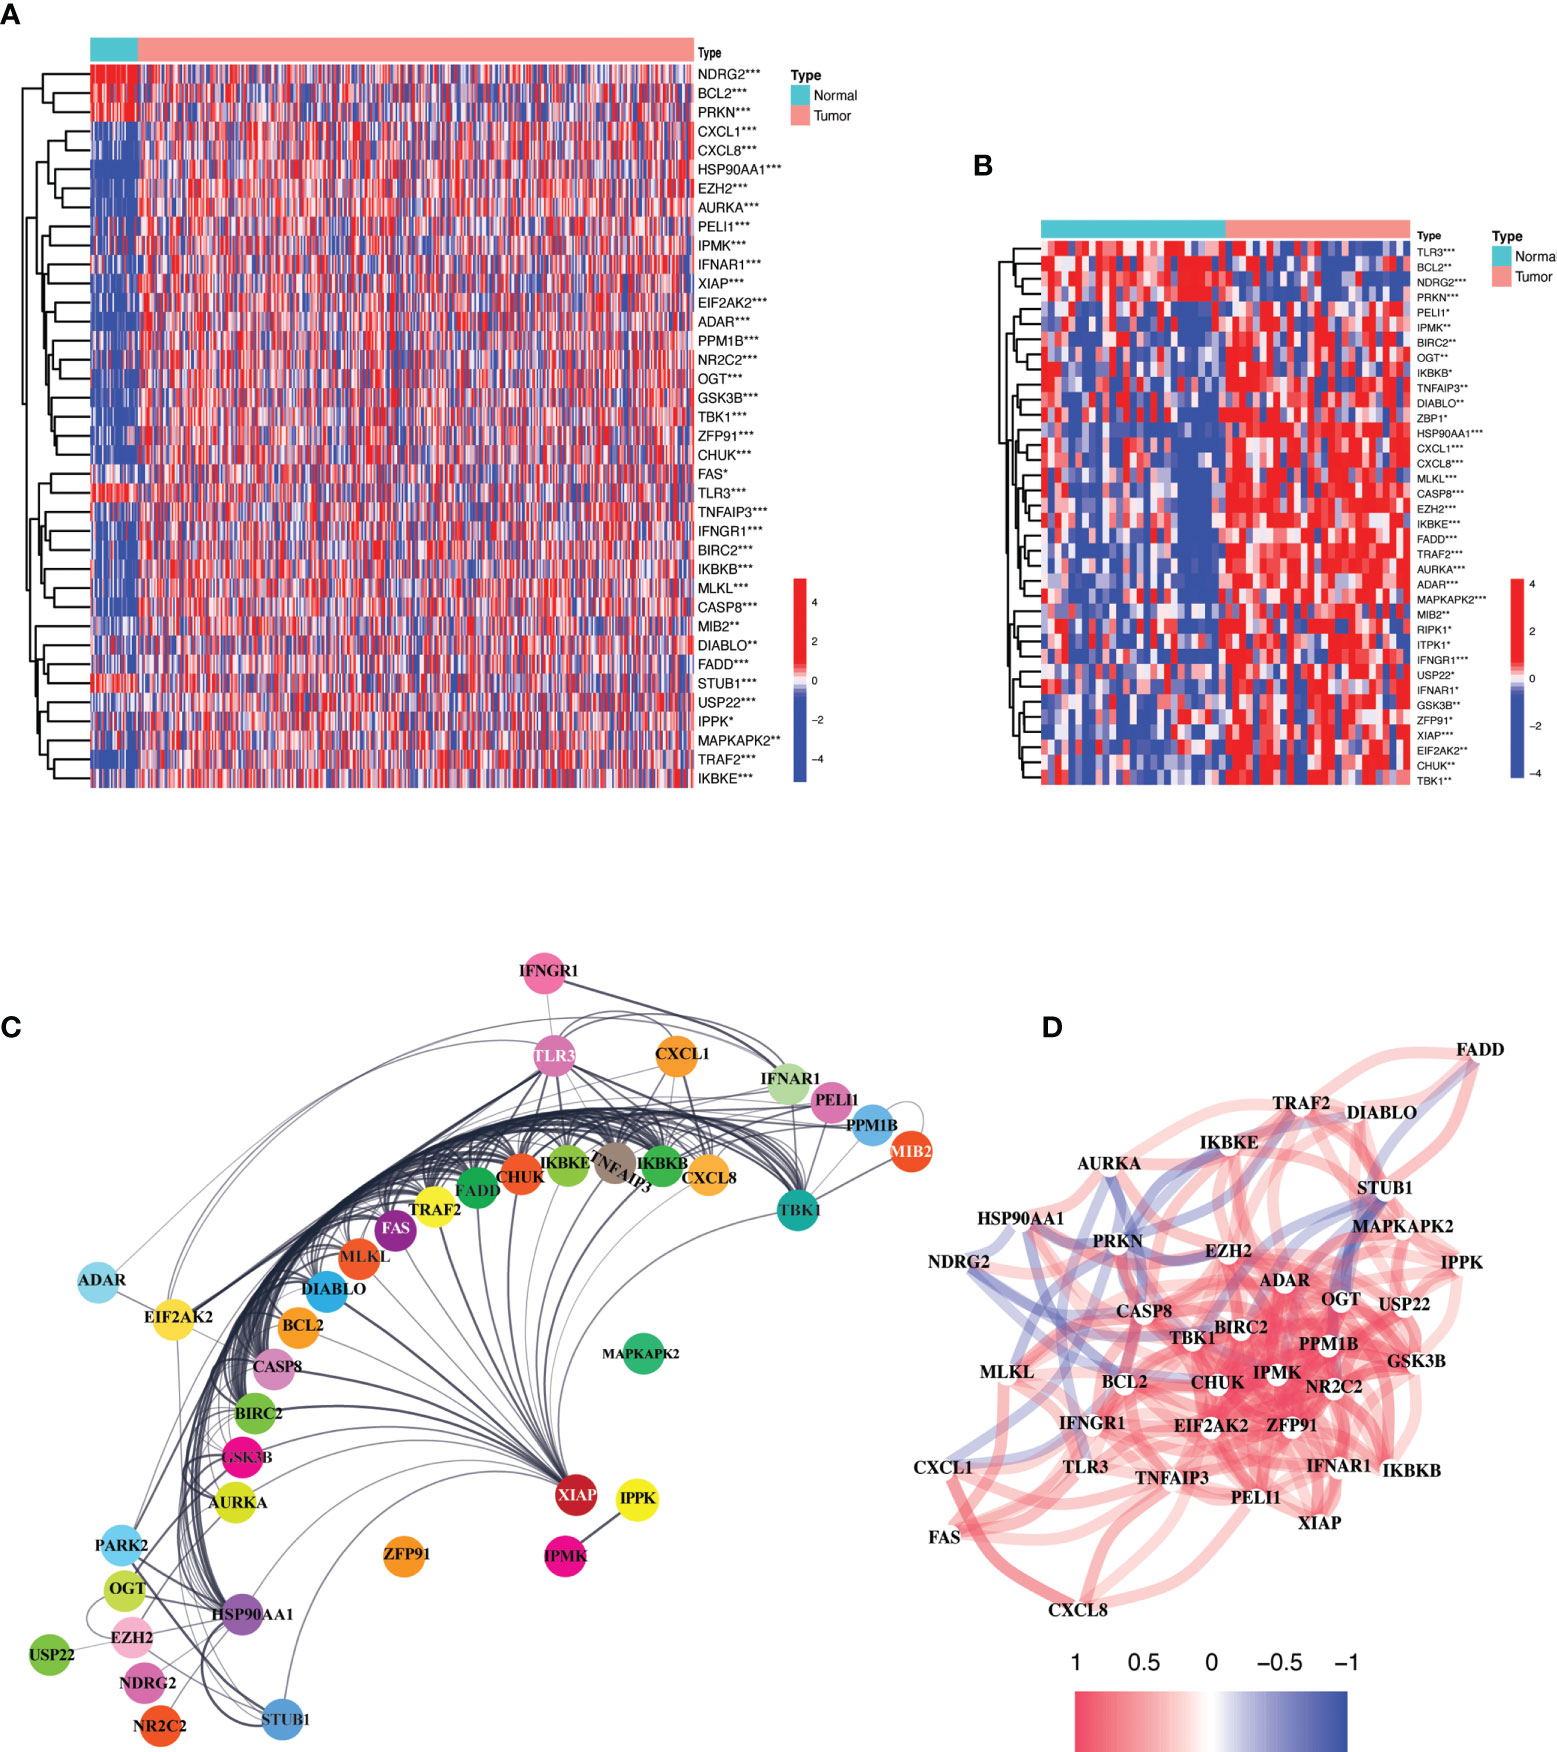
Figure 1 Expression and interaction of 55 necroptosis-related genes. (A) Heatmap of the NRGs between TCGA STAD tumor (n=375) and normal samples (n = 32). Red and blue represent upregulation and downregulation respectively. P values are shown as: *P < 0.05; **P < 0.01; ***P < 0.001. (B) Heatmap of NRGs between TCGA STAD paired normal (n = 32) and tumor samples (n = 32). Red and blue represent upregulation and downregulation respectively. P values are shown as: *P < 0.05; **P < 0.01; ***P < 0.001. (C) Protein-protein interaction (PPI) network demonstrating the interaction of NRGs (interaction score = 0.4). The interactions include direct (physical) and indirect (functional) associations; they stem from computational prediction, from knowledge transfer between organisms, and from interactions aggregated from other (primary) databases. (D) The correlation network of the NRGs based on mRNA expression in the TCGA STAD cohort. Red and blue lines indicate positive and negative correlation respectively. Color depth depicts the strength of the correlation.
Molecular subtypes were identified by subjecting necroptosis-related genes expression to consensus clustering. The 375 gastric patients were divided into two clusters (Cluster 1[C1] = 248 and Cluster 2[C2] = 123) as the intragroup correlations were the highest and the inter-group correlations were low when clustering variable (k) was equal to 2 (Figure 2A). The overall survival was significantly better for C1 as compared to C2 (p=0.007) (Figure 2B). Significant differences were also observed for clinical features such as tumor grade (degree of differentiation) and T stage (primary tumor) as highlighted in the Figure 2C and Supplementary Table 4 (Supplementary Data-Sheet#4). We further sought the distribution of NRGs between the clusters. As shown in Figure 2D, cluster 1 was mainly characterized by the upregulation of RIPK3, inositol phosphates (IPMK, ITPK1, IPPK) and enhanced expression of negative regulators such as PPMIB, AURKA, OGT, TBK1, IKKα/β, IKKε, and TRAF2. While a stronger activity of TAM kinases (AXL and MERTK) and the main pathways receptors such as TNFR1, TLR3, TLR4, and FAS was demonstrated in the cluster 2. There was no significant difference between the clusters for RIPK1 and MLKL which indicates that both clusters may have undergone necroptosis via distinctive regulatory mechanisms which might have prompted differential negative regulation and prognosis.
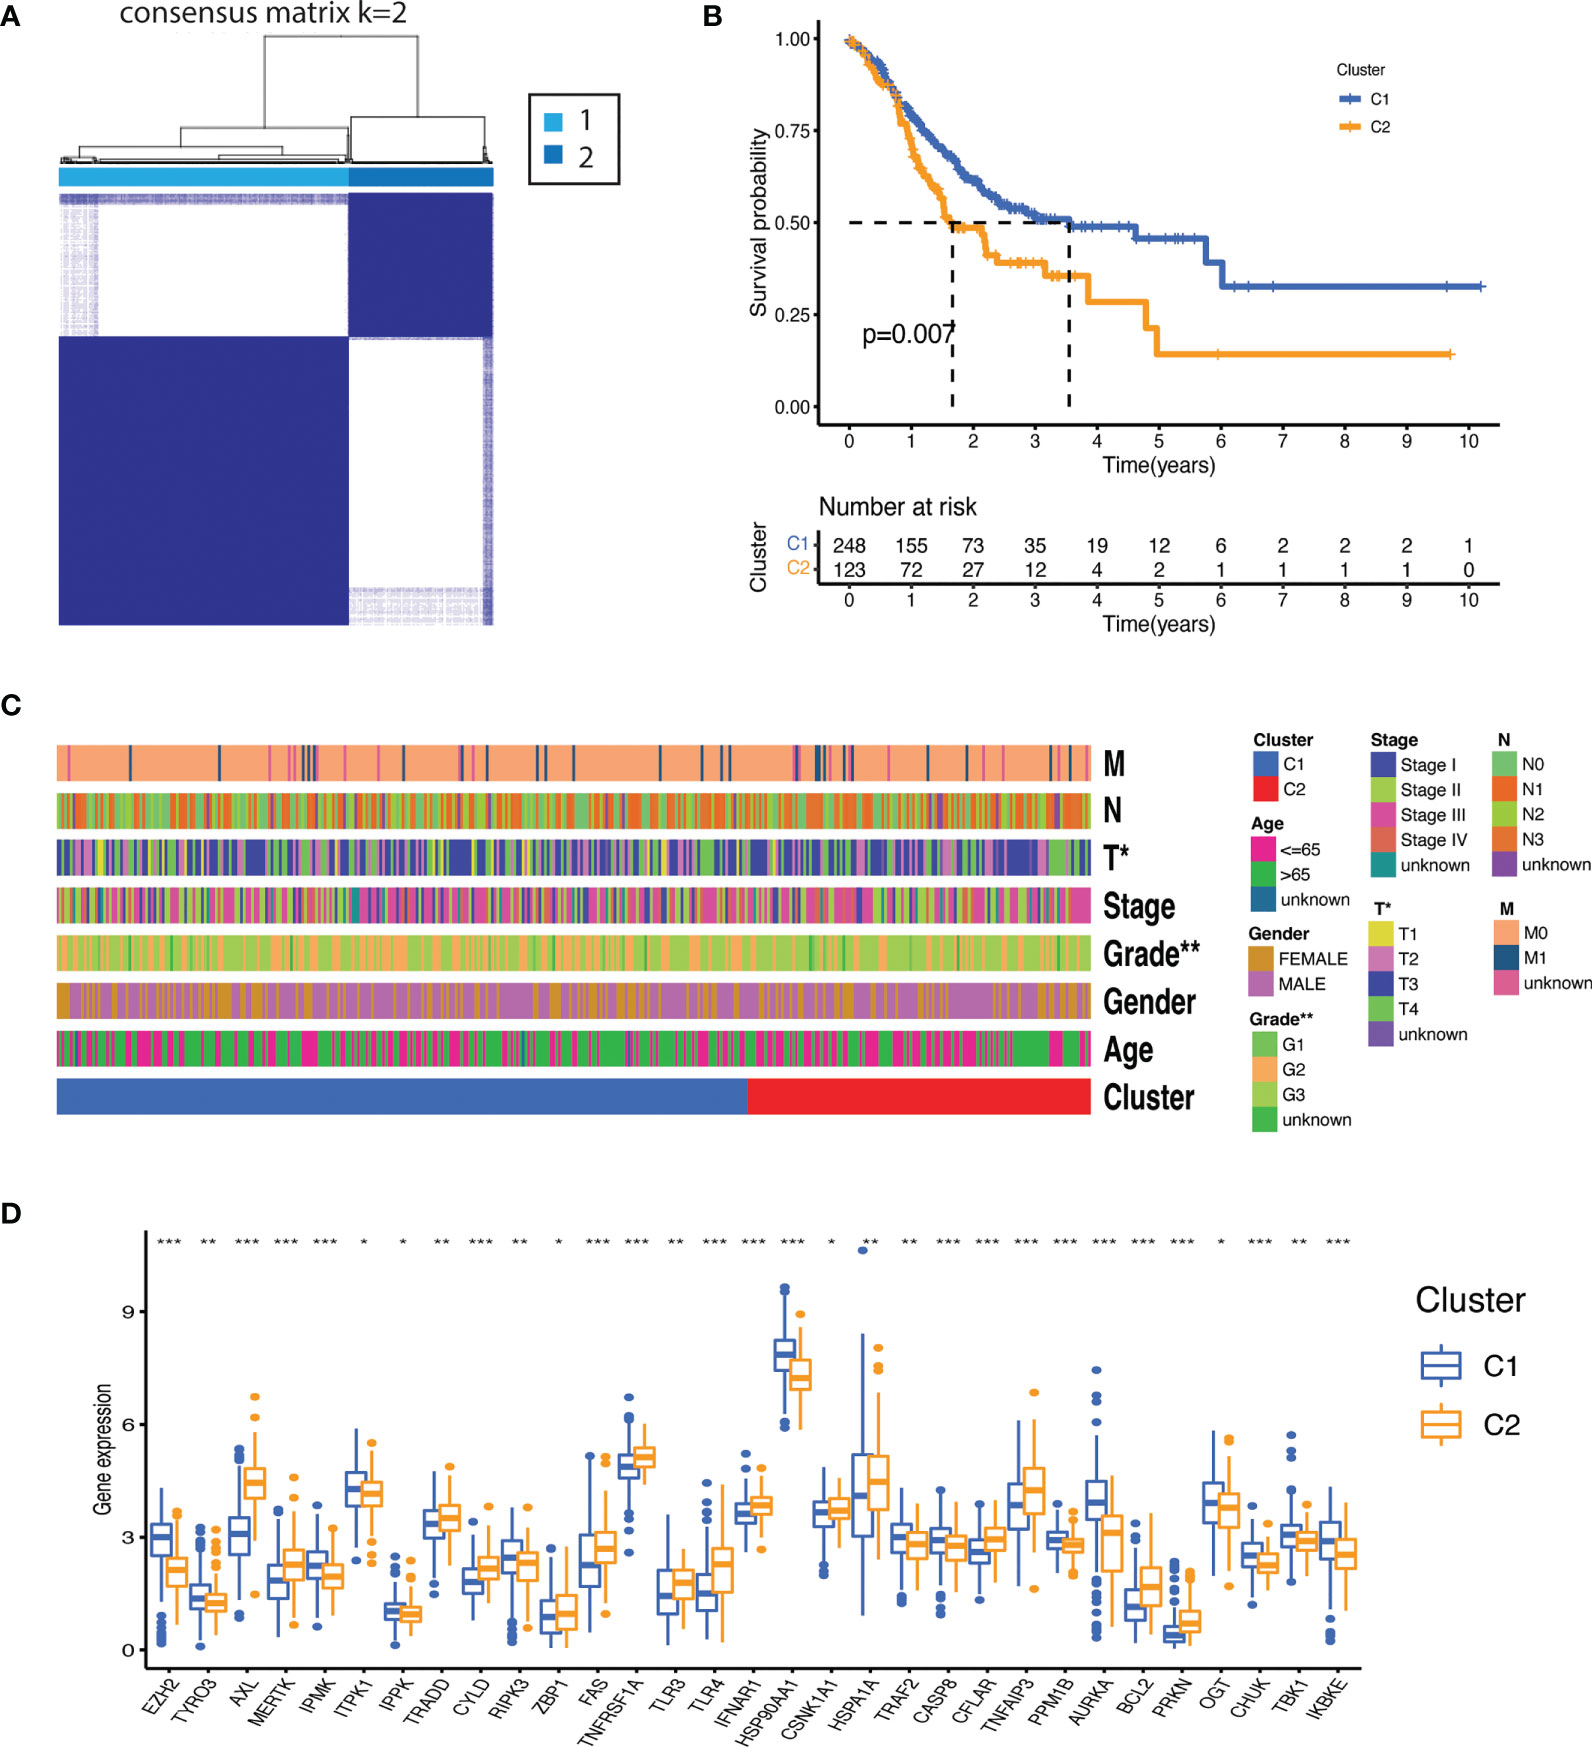
Figure 2 Molecular subtypes based on the necroptosis-related genes expression. (A) Consensus clustering matrix (k=2) identified two clusters (C1 = 248; C2 = 123) based on the expression of the 55 NRGs. (B) The clusters demonstrated significant difference in overall survival (p<0.007). (C) Heatmap illustrating association between the clusters and their clinicopathological features of the gastric cancer patients (TNM staging. T: primary tumor; N: lymph node; M: metastasis. Degree of differentiation. G1: highly differentiated; G2: moderately differentiated; G3: poorly differentiated). P value are shown as *P < 0.05; **P < 0.01. (D) Distribution of NRGs expression between the clusters (P values are shown as: *P < 0.05; **P < 0.01; ***P < 0.001).
To evaluate the differences between the clusters, differential gene expression analysis was carried out which yielded 1055 differentially expressed genes (DEGs) according to the criteria (log fold change (logFC) = 1, and the false discover rate (FDR) < 0.01) (Figure 3A and Supplementary Data-Sheet#5: Supplementary Table 5). Both TCGA and GEO cohorts were screened for these DEGs (n=1055) and only gene expression of shared DEGs (n=860) was retained. After incorporation of survival information, both cohorts were subjected to prognostic analysis. Univariate cox regression analysis identified a total of 123 genes that showed a significant correlation with OS (Supplementary Data-Sheet#6: Supplementary Table 6). Among 123 survival genes, 119 survival genes were associated with increased risk (HR>1) and only four genes were protective genes with HR<1. Next, least absolute shrinkage and selection operator (LASSO) cox regression analysis was performed and a 13-gene risk signature, termed as necroptosis-related genes prognostic index (NRGPI) was obtained according to the optimum lambda (λ) value (Figures 3B, C). The risk score was calculated as follows: risk score = (0.0461 * CYTL1 expression) + (0.1313 * PLCL1 expression) + (0.1589 * CGB5 expression) + (0.0534 * CNTN1 expression) + (0.0104 * GRP expression) + (-0.0128 * EFNA3 expression) + (-0.0012 * E2F2 expression) + 0.0383 * APOD expression) + (-0.2798 * SOX14 ;expression) + (0.0044 * CST6 expression) + (0.0168 * GPX3 expression) + (0.0019 * FCN1 expression) + (0.1688 * SERPINE1 expression). Based on the median value of the risk score, samples were rated as low and high risk. A K-M plot, as depicted in Figures 3D, E, showed significantly worst survival for high-risk patients (NRGPI-High) versus low-risk patients (NRGPI-Low) in both TCGA and GEO cohorts (p<0.001). Diagnostic value of the prognostic model was evaluated with time-dependent receiver operating characteristic (ROC) analysis. The area under the curves (AUCs) were 0.651/0.722/0.753 at 1/3/5 years in the TCGA cohort, and 0.557/0.611/0.607 at 1/3/5 years in the GEO cohort (Figures 3F, G). Plotting of the risk scores indicated an equal distribution of patients into low- and high-risk groups (Supplementary Figures 1A, B). Patients in the NRGPI-High subgroup experienced more deaths and a shorter survival time (negative correlation) than those in the NRGPI-Low subgroup as demonstrated in Supplementary Figures 1C, D. Overall, a negative correlation was evident between survival time and risk score for both cohorts (Supplementary Figures 1E, F). Similarly, principal component analysis (PCA) and t-distributed stochastic neighbor embedding (t-SNE) showed well-separated clusters for the two risk groups (Supplementary Figures 1G–J).
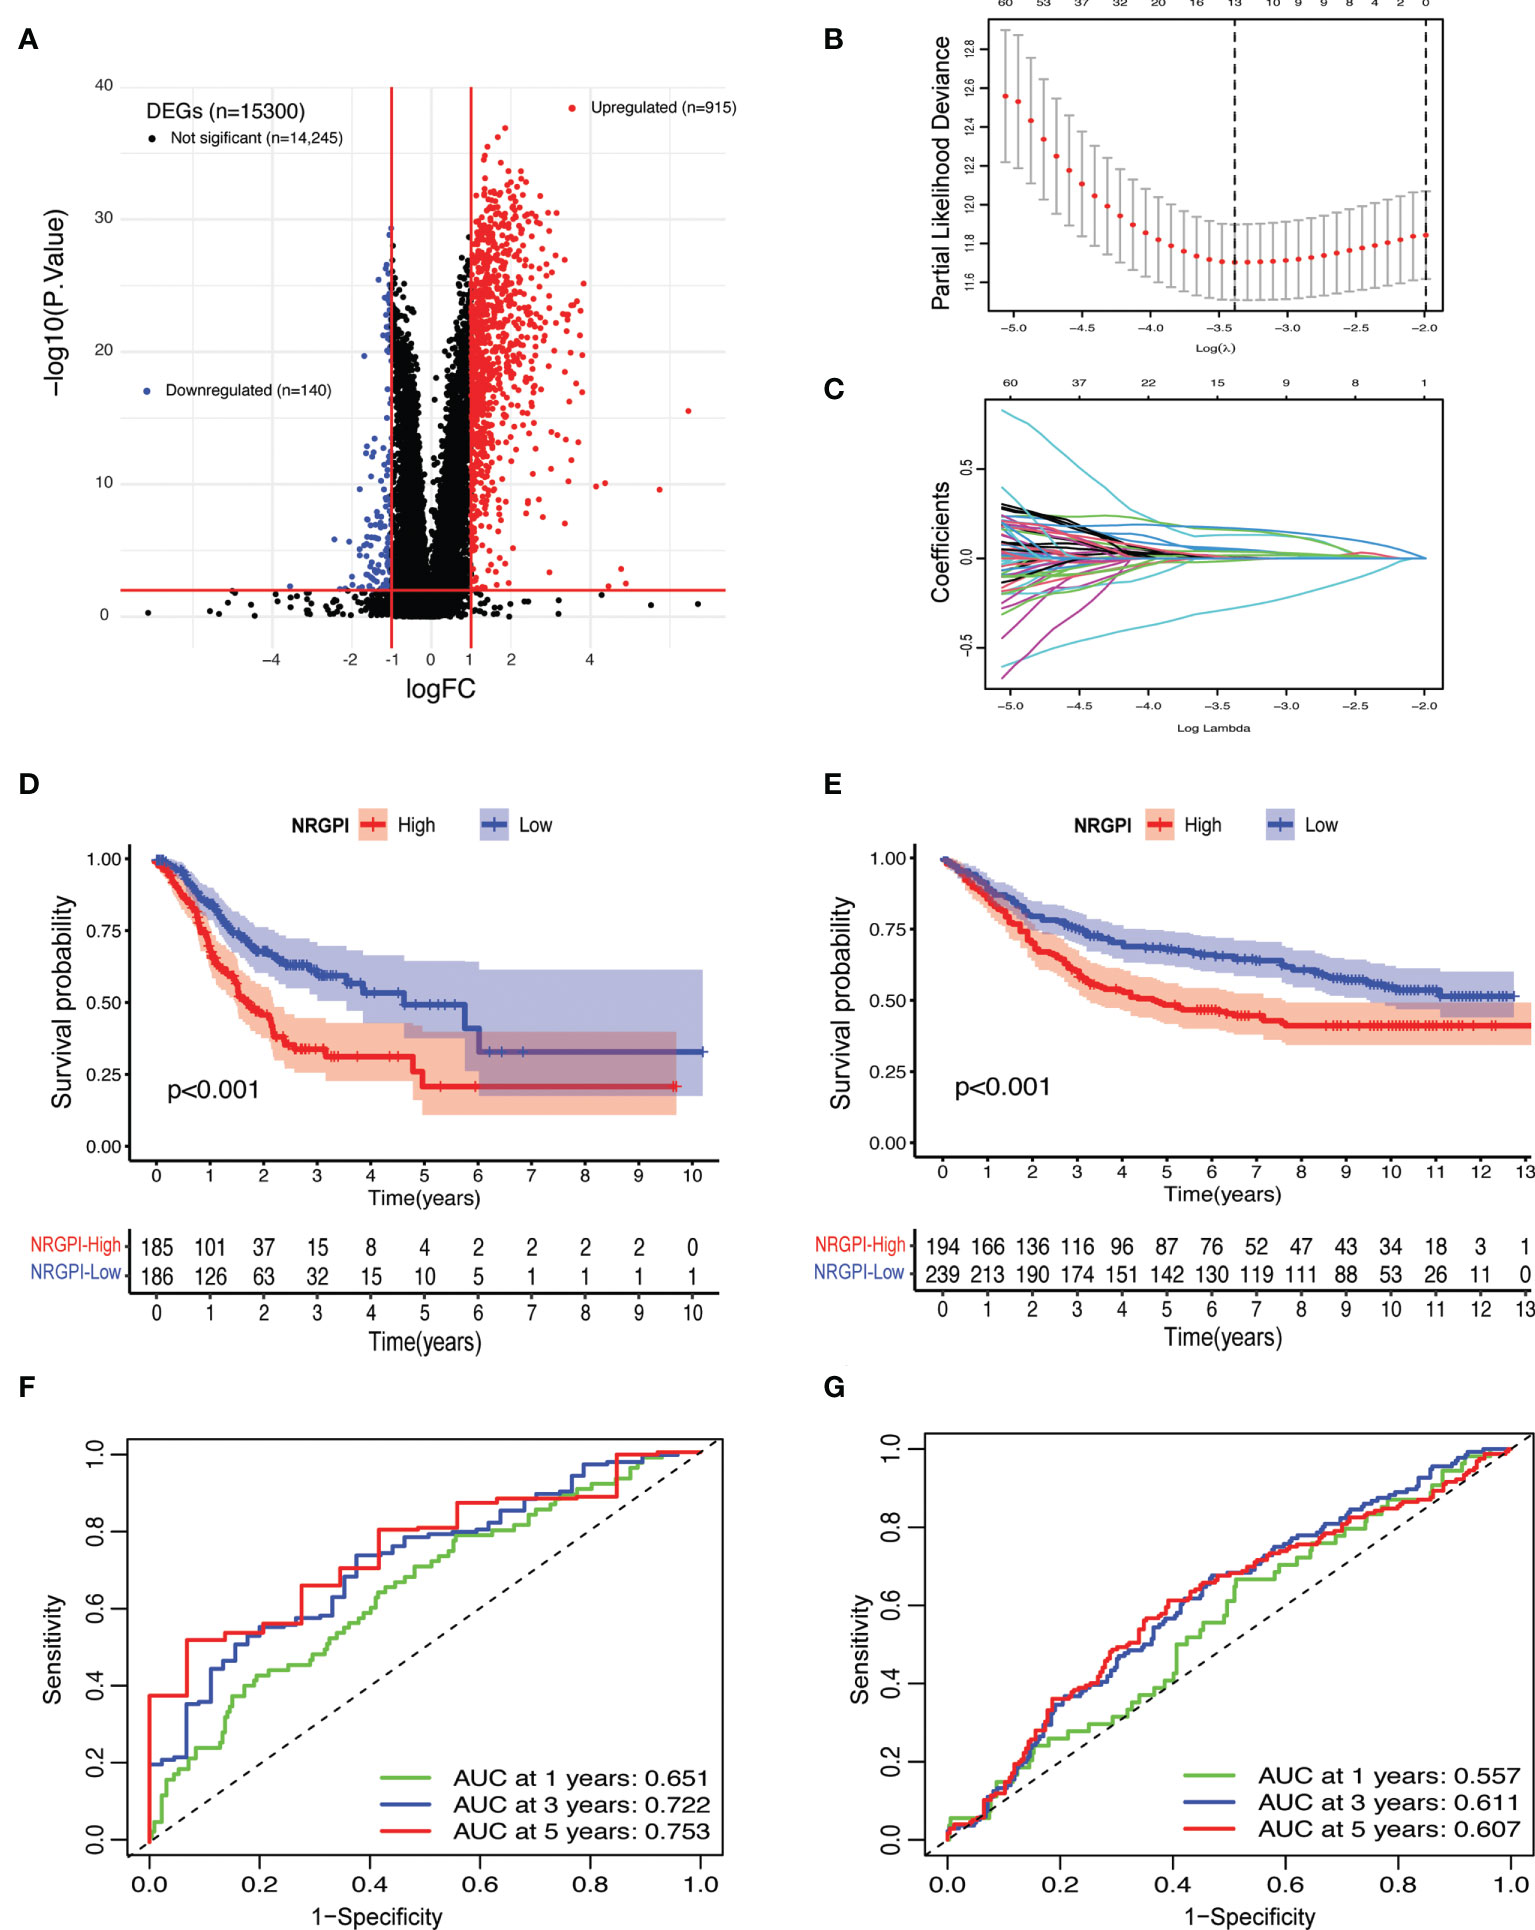
Figure 3 Risk signature construction. (A) Volcano plot depicting the differentially expressed genes (DEGs) between the necroptosis-based clusters. DEGs. Were defined according to the following criteria: log fold change (logFC) = 1, and the false discover rate (FDR) < 0.01. (B) LASSO regression of the 123 OS-related genes identified via uni-cox regression analysis. (C) Cross-validation for tuning the parameter selection in the LASSO regression. (D) Kaplan–Meier curves for the OS of NRGPI-High and NRGPI-Low patients in the TCGA cohort and (E) GEO cohort. (F) Time-dependent receiver operating characteristic (ROC) curves and area under curve (AUC) analyses depicting the predictive efficiency of risk score in TCGA cohort and (G) GEO cohort.
Independent prognostic value of the risk model and assessment of other clinical features as independent prognostic factors was evaluated by carrying out uni- and multi-variate cox regression analyses. Risk score was established as independent prognostic factor on univariate cox regression analysis in both cohorts (Figure 4). Risk score prognostic value was remained significant (only in TCGA and tended towards significance in GEO) after adjusting for confounding factors by undertaking multivariate analysis. Age and tumor stage also showed independent prognostic value in TCGA (univariate: T, N, and M; multivariate: N, and M) and GEO cohort (uni & multivariate: T and N).
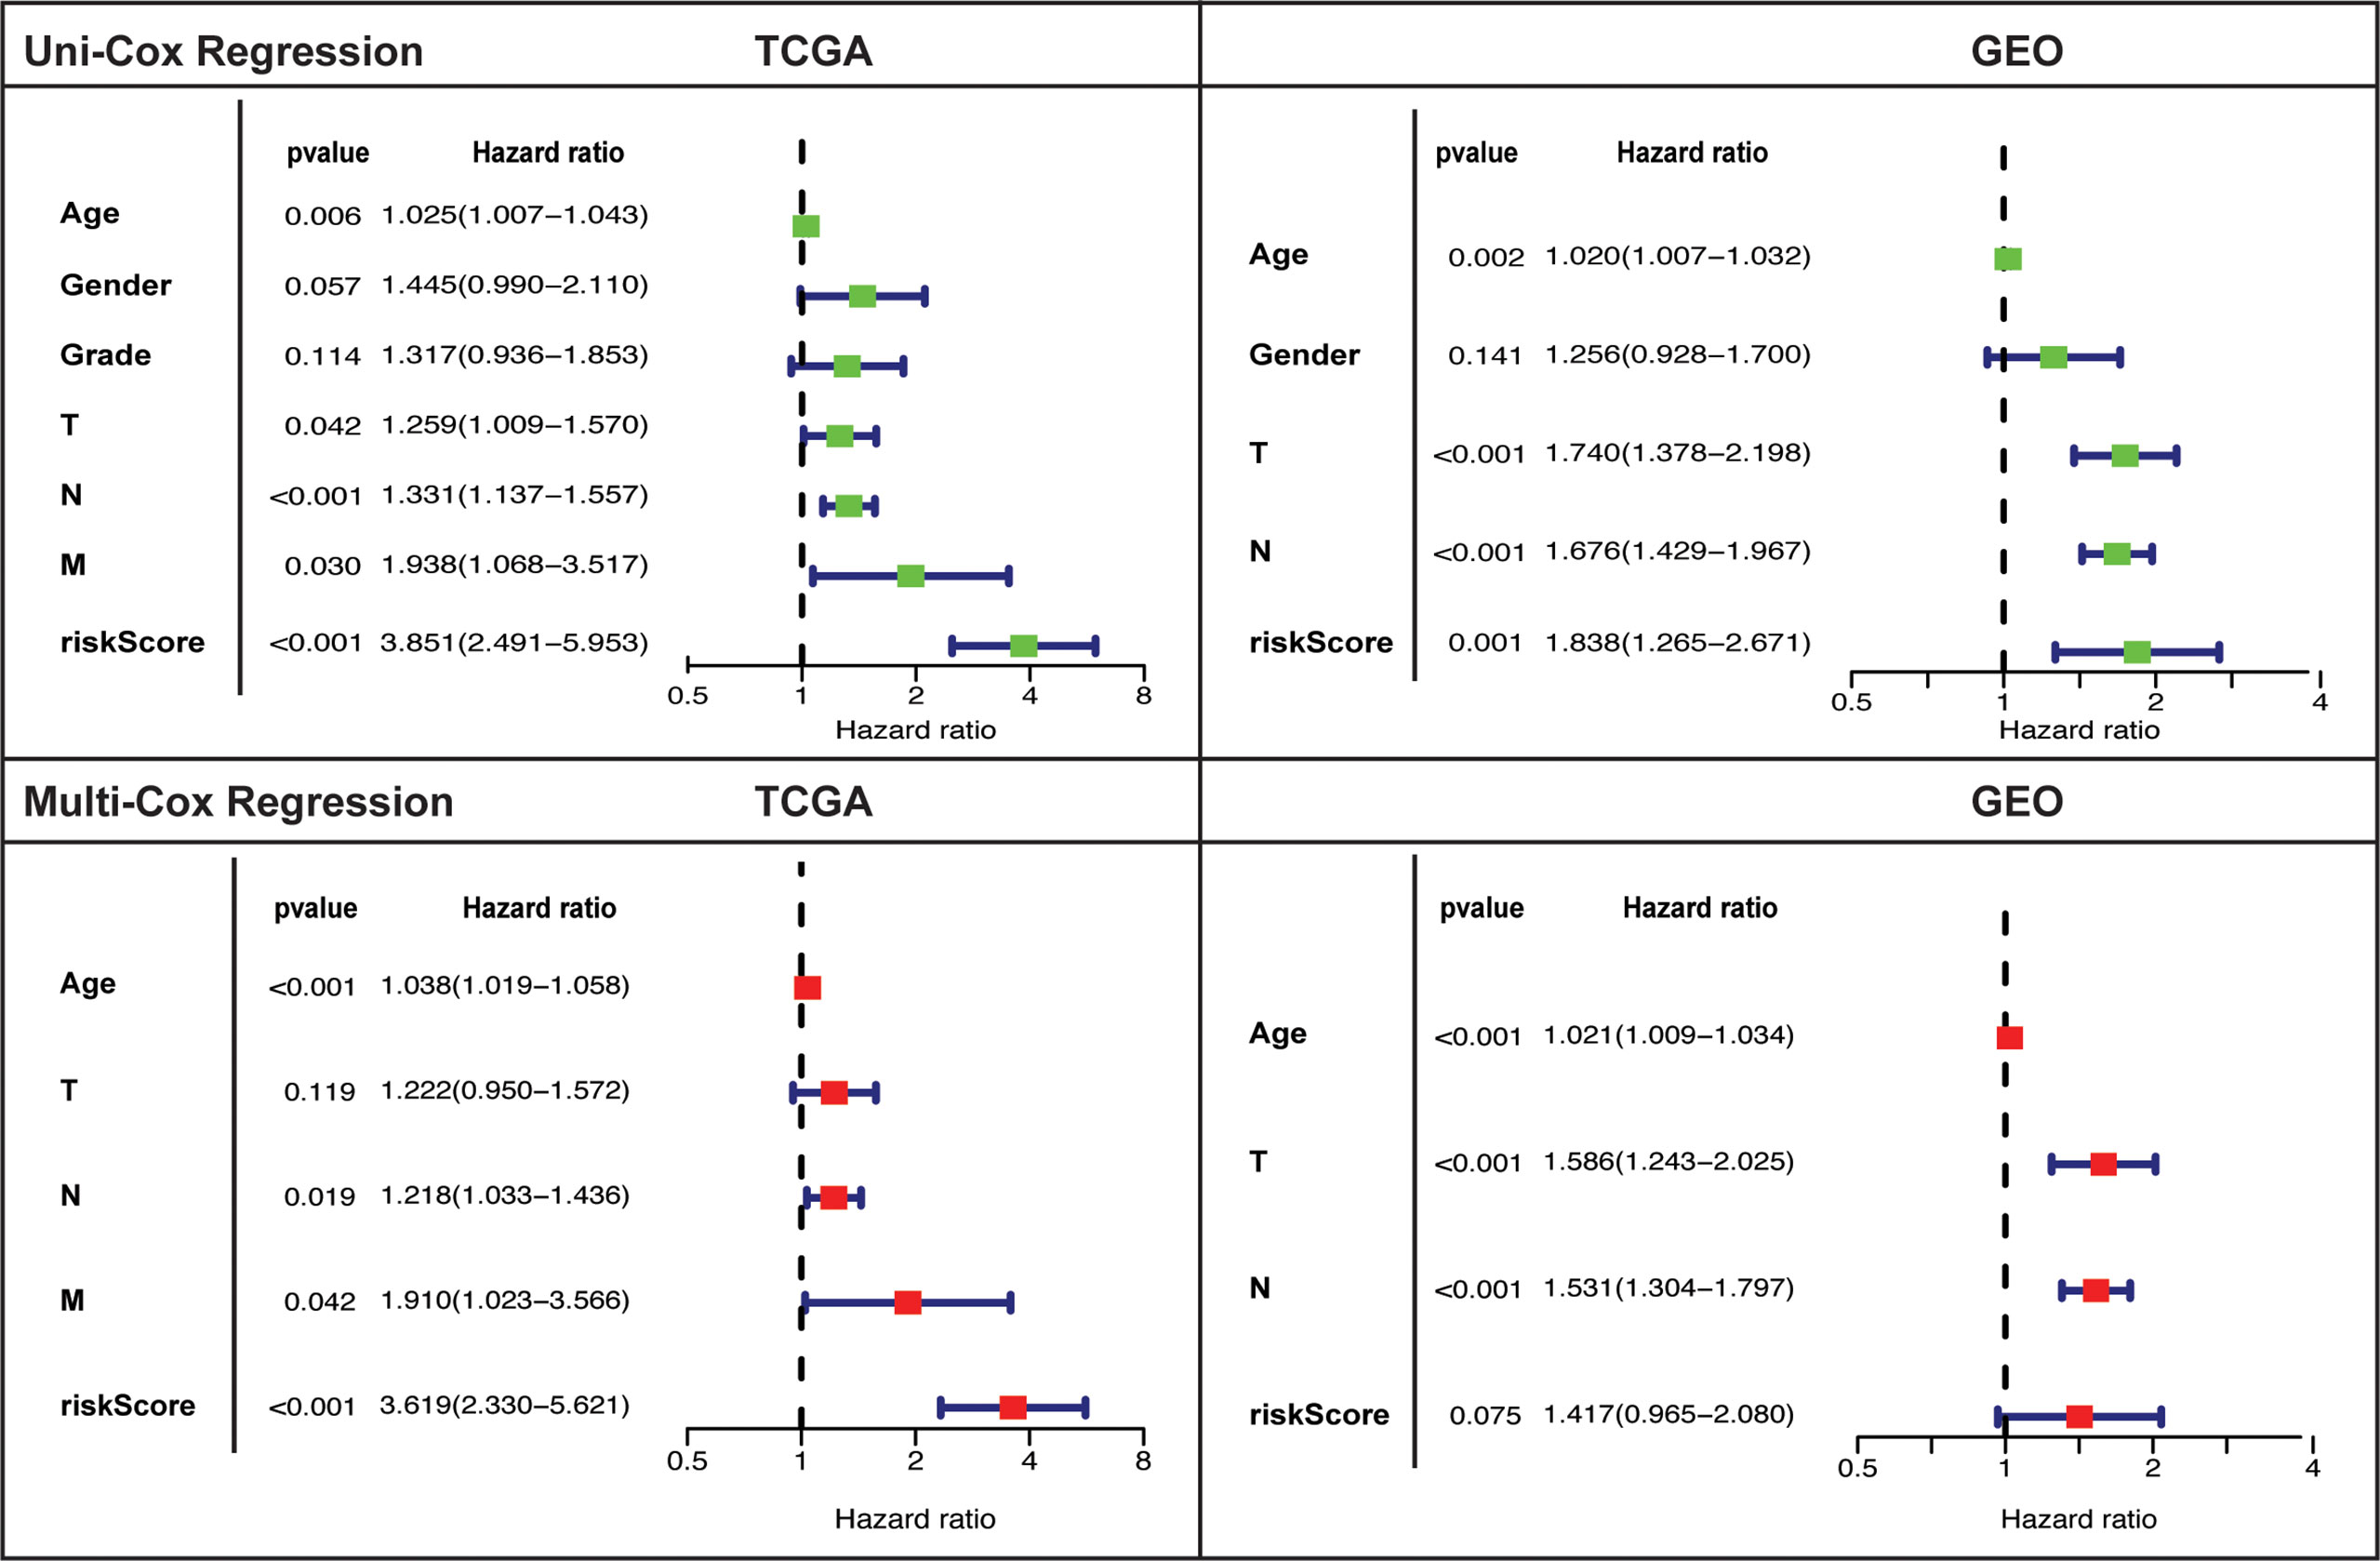
Figure 4 Univariate and multivariate cox-regression analysis to evaluate the independent prognostic value of the risk score in TCGA and GEO cohorts.
The expression level of the 13 risk genes and its correlation with clinical features are illustrated in heatmap (Figure 5A). No significant differences between NRGPI-risk subgroups for the clinical features were observed (Supplementary Data-Sheet#7: Supplementary Table 7). Of the 13 risk genes, expression of 10 genes (CYTL1, PLCL1, CGB5, CNTN1, GRP, APOD, CST6, GPX3, FCN1, SERPINE1) was unregulated in NRGPI-High subgroup. Overall, a positive correlation was evident between the 55 NRGs and 13 risk genes (Figure 5B and Supplementary Figure 2A). Significant differences in the 23 NRGs described the NRGPI-risk groups as compared to the clusters (significant difference in 31 NRGs between the clusters) (Figure 5C). Expression level of NRGs in the NRGPI-risk subgroups mirrored their expression status in the prognostic clusters. NRGPI-High subgroup showed significant elevated expression of TAM kinases (AXL and MERTK) and pathways receptors (TNFR1, FAS, and TLR4) as observed in the cluster 2. Likewise, inositol phosphates (IPMK, ITPK1) and negative regulators (PPMIB, AURKA, OGT, IKKε, and TRAF2) were expressed NRGPI-Low subgroup. These results indicate differential regulation of necroptosis in stomach adenocarcinoma. Moreover, mutations were less frequent in the NRGPI-High subgroup (91.94%) as compared to the NRGPI-Low subgroup (84.09%) (Figure 5D). Except for the TP53 gene, all the top 20 mutated genes showed lower frequency (up to 50% decrease) in the NRGPI-High subgroup in comparison to NRGPI-Low subgroup. Mutation frequency of the TP53 gene (second most mutated gene in gastric cancer) showed no difference at all between NRGPI subgroups and constituted the top mutated gene in the NRGPI-High subgroup (41%).
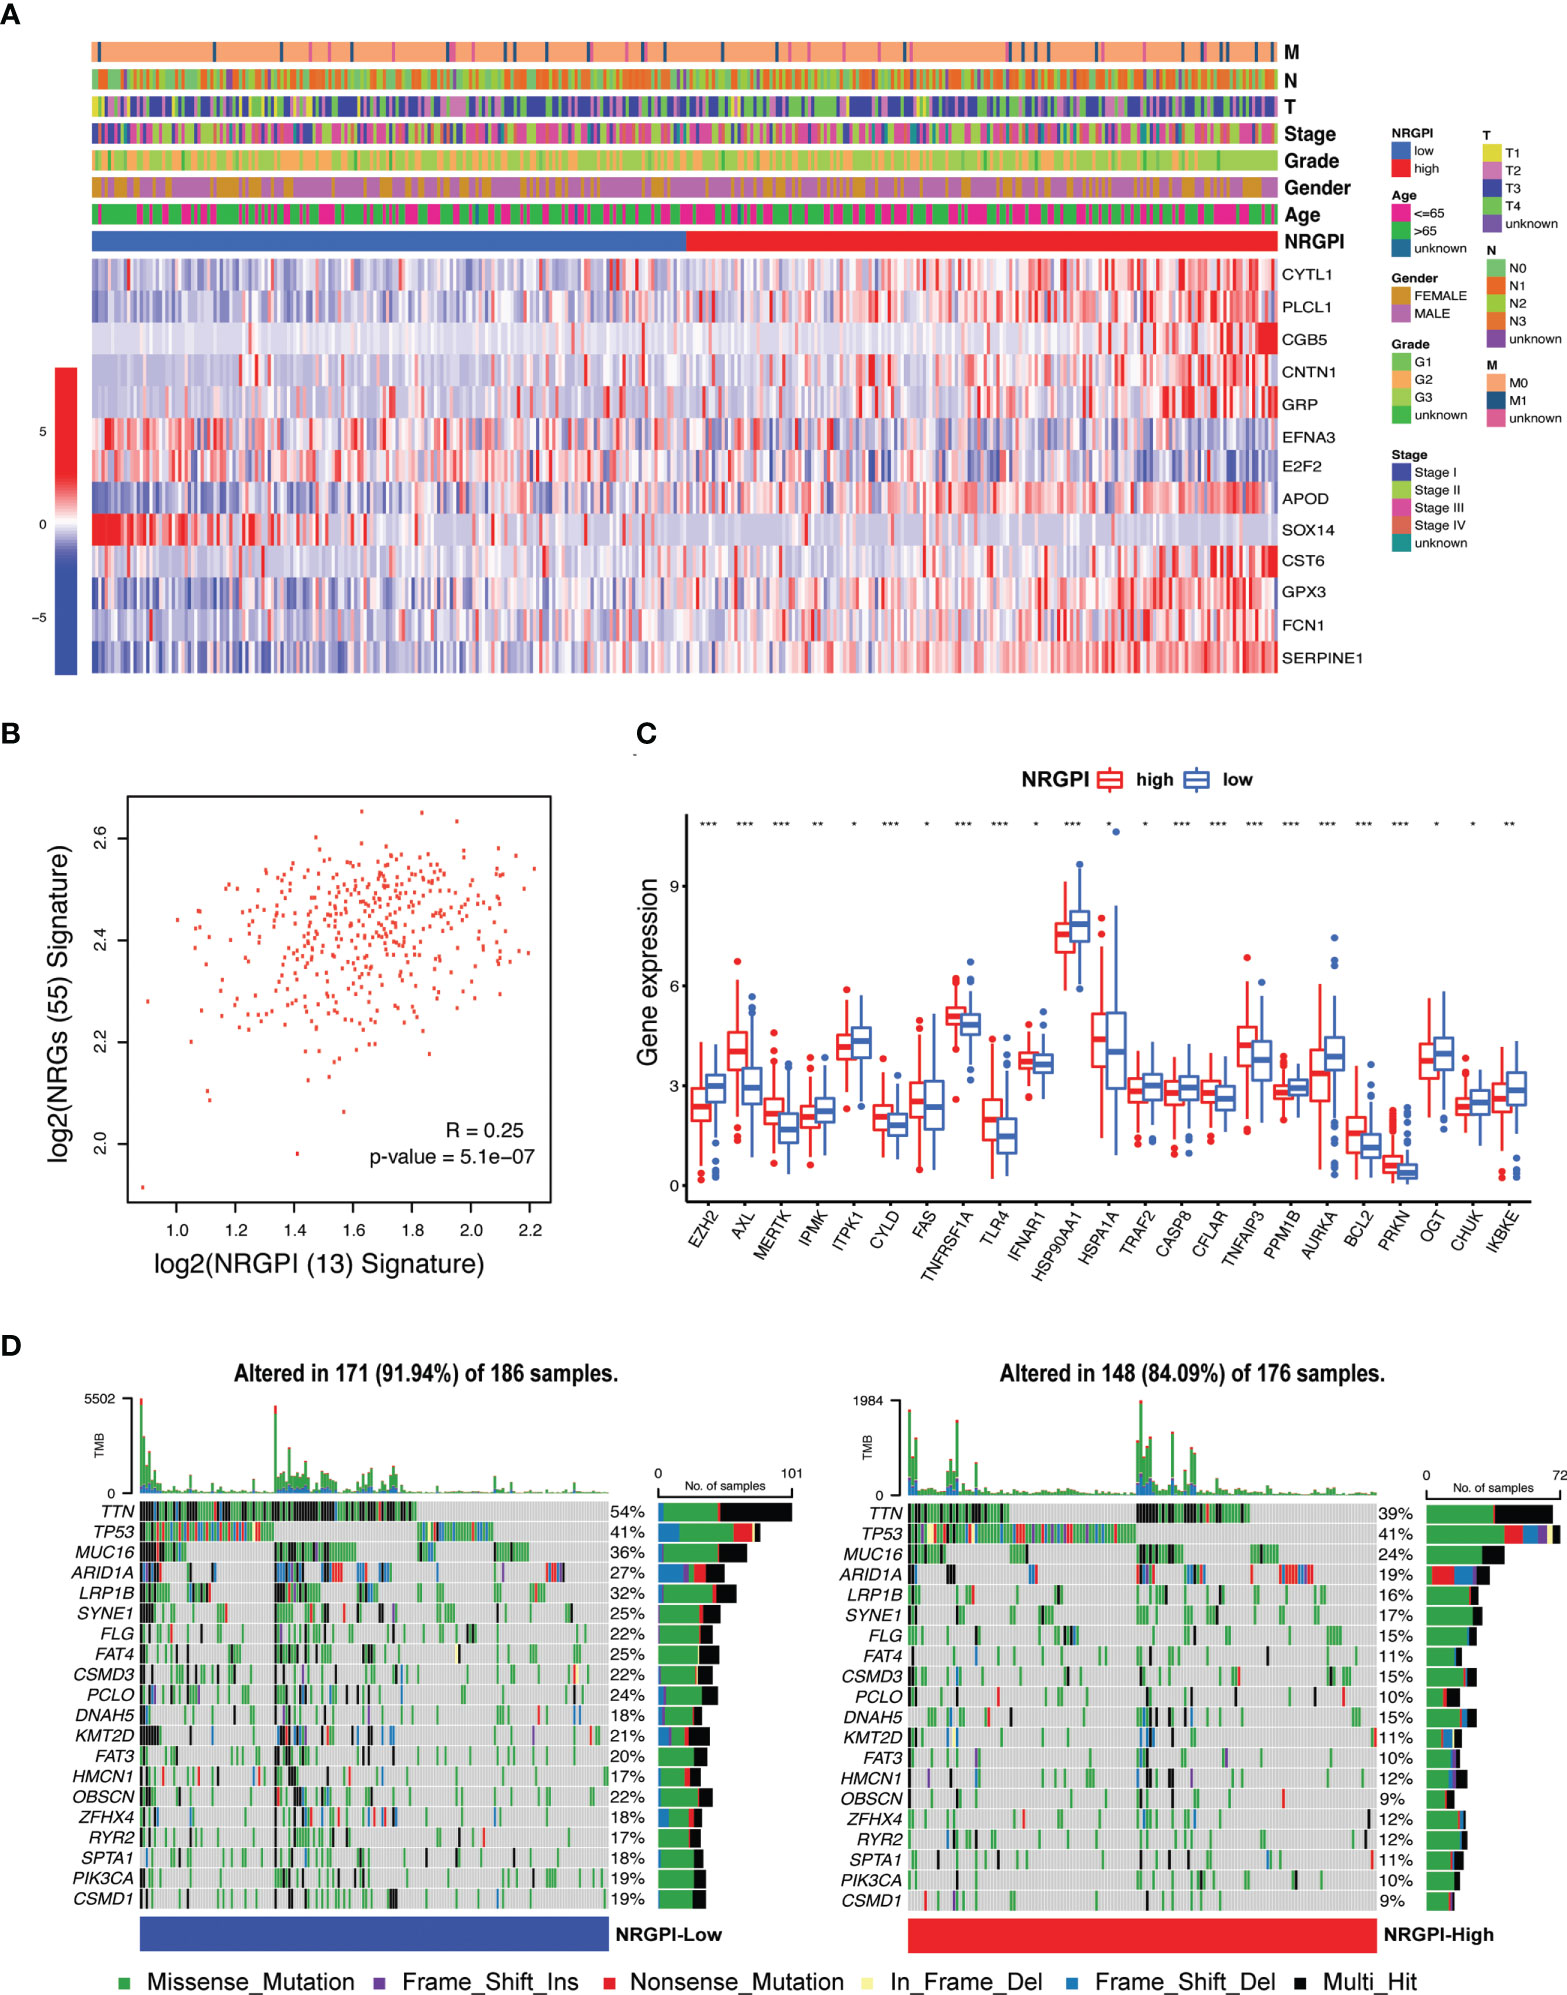
Figure 5 Expression and distribution of the risk signature genes and their correlation with clinical features. (A) Heatmap illustrating the expression of 13 risk genes (Red: upregulation; Blue: downregulation) in the NRGPI subgroups (Red: high-risk; Blue: low-risk) and correlation between NRGPI subgroups and clinicopathological features (TNM staging. T: primary tumor; N: lymph node; M: metastasis. Degree of differentiation. G1: highly differentiated; G2: moderately differentiated; G3: poorly differentiated). (B) Spearman’s correlation between 55 NRGs and NRGPI (13 risk genes) signature. (C) The expression levels of necroptosis-related genes between NRGPI-High and NRGPI-Low subgroups in the TCGA cohort (P values are shown as: *P < 0.05; **P < 0.01; ***P < 0.001). (D) Oncoplot depicting the mutation frequency of top 20 mutated genes in the high- and low-risk groups.
To evaluate functional implications of risk model, DEGs between the NRGPI subgroups defined by the risk model was obtained for evaluating differences between gene functions and pathways. The “limma” package was utilized with defined criteria: FDR < 0.05 and |log2FC | ≥ 1. According to this criterion, a total of 118 DEGs were identified between the NRGPI-High and NRGPI-Low subgroups in the TCGA cohort (Supplementary Data-Sheet#8: Supplementary Table 8). These DEGs were then subjected to Gene ontology (GO) enrichment analysis and Kyoto Encyclopedia of Genes and Genomes (KEGG) pathway analysis. Main biological process identified included extracellular matrix (ECM) structural organization, ECM-receptor interaction, cell-substrate adhesion and its regulation, negative regulation of cell motility and cellular component movement (Supplementary Figures 2B, C). Angiogenesis-related processes and pathways were also detected such as regulation of angiogenesis, vascular smooth muscle contraction, and cGMP-PKG signaling pathway. DEGs were also associated with complement and coagulation cascades, and proteoglycans in cancer. Moreover, signaling pathways implicated in cancer progression and immune suppression such as Wnt signaling pathway and TGF-β signaling pathway were also correlated.
Immunological significance was sought by undertaking immune enrichment analysis in terms of immune cells and immune-related pathways for the differences between NRGPI subgroups. Results of the single-sample gene set enrichment analysis (ssGSEA) involving TCGA and GEO cohorts indicated higher infiltration of various immune cells including B cells, dendritic cells (DCs), macrophages, mast cells, neutrophils, T helper cells, tumor infiltrating lymphocytes (TIL), and regulatory T cells (Treg) in NRGPI-High subgroup as compared to the NRGPI-Low subgroup (Figure 6A and Supplementary Figure 3A). Survival analysis based on the infiltration of immune cells indicated that a higher infiltration of immature dendritic cells (iDCs), mast cells, and neutrophils was associated with a worst prognosis (Figures 6B–D). All these three cells were more abundant in the NRGPI-High subgroup. To further dissect the various subtypes of immune cells, the CIBERSORT algorithm was used (Figures 7A–H). Results revealed that mainly M2 phenotype of the macrophages was more abundant in NRGPI-High subgroup and their infiltration was associated with a worst prognosis (Figures 7B, C). Resting DCs were also significantly abundant in the NRGPI-High subgroup, which was also associated with a worst outcome (Figures 7B, D). Likewise, different types of mast cells (resting and activated) also had prognostic significance (Figures 7B, F).
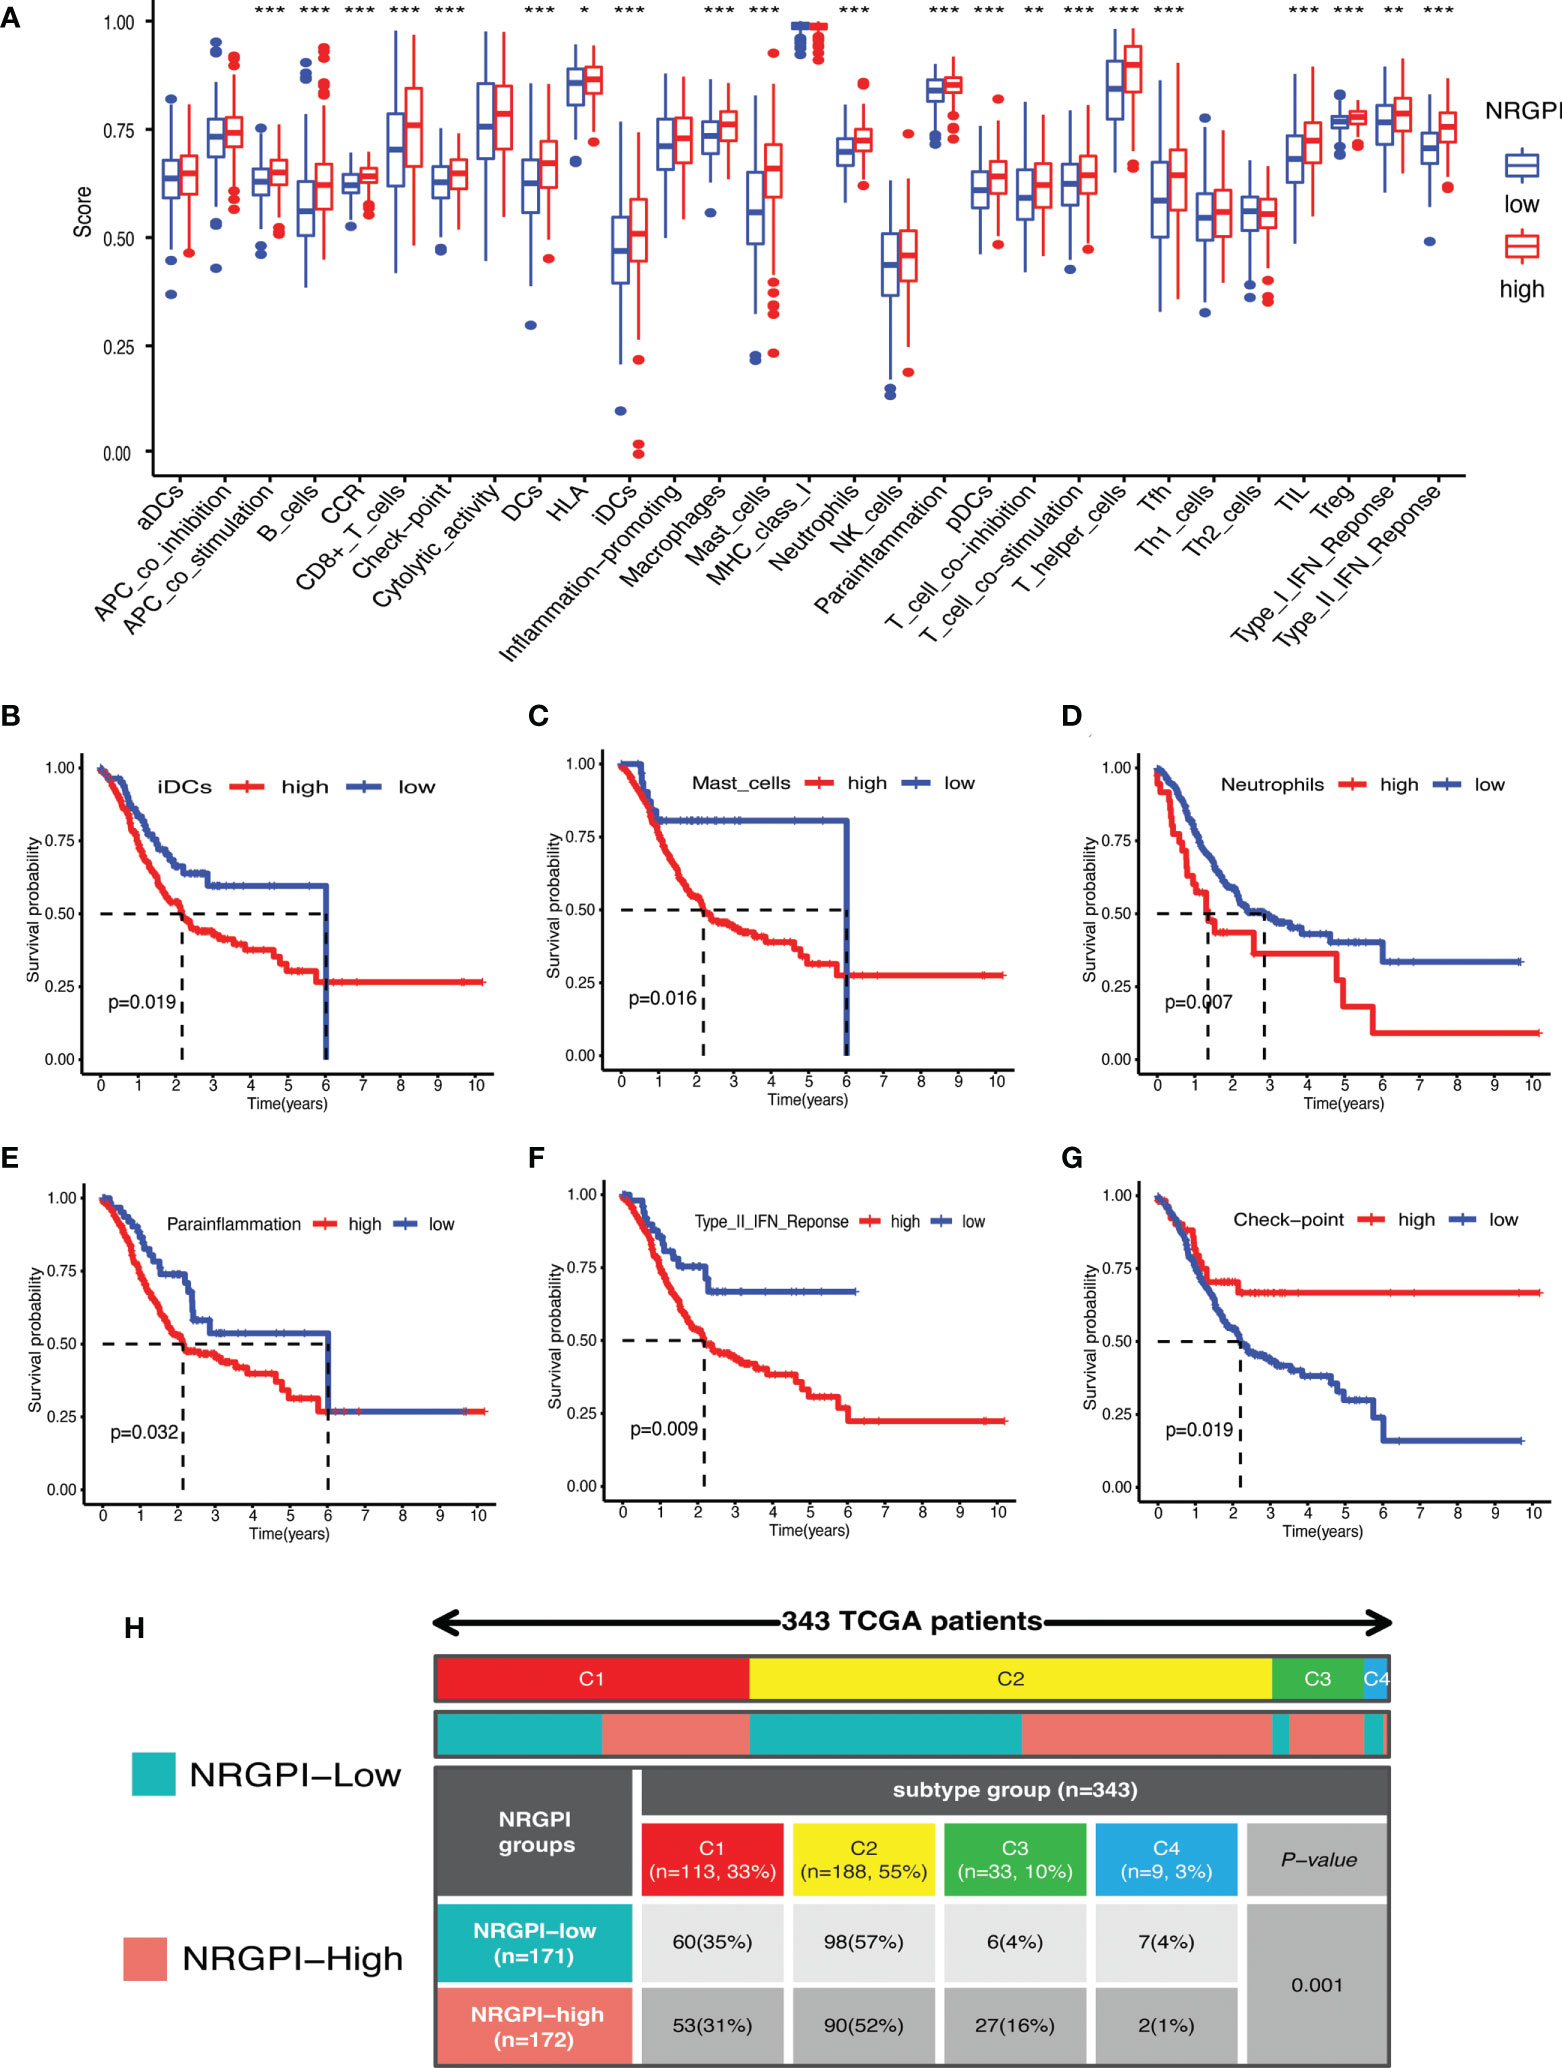
Figure 6 Immune landscape of NRGPI subgroups based on the single sample gene set enrichment analysis (ssGSEA) scores. (A) Comparison of enrichment scores of 16 types of immune cells and 13 immune-related pathways in the TCGA cohort between NRGPI-High and NRGPI-Low subgroups. (B-D) Kaplan-Meier curves for survival difference between TCGA patients with high and low- infiltration of immune cells. (E-G) Kaplan-Meier curves for survival difference between TCGA patients with high and low-activation of immune-related pathways. (H) Heatmap and table showing the distribution of immune subtypes (IC1, IC2, IC3, IC4, IC5, and IC6) between the NRGPI-High and NRGPI-Low subgroups. P values are shown as: *P < 0.05; **P < 0.01; ***P < 0.001.
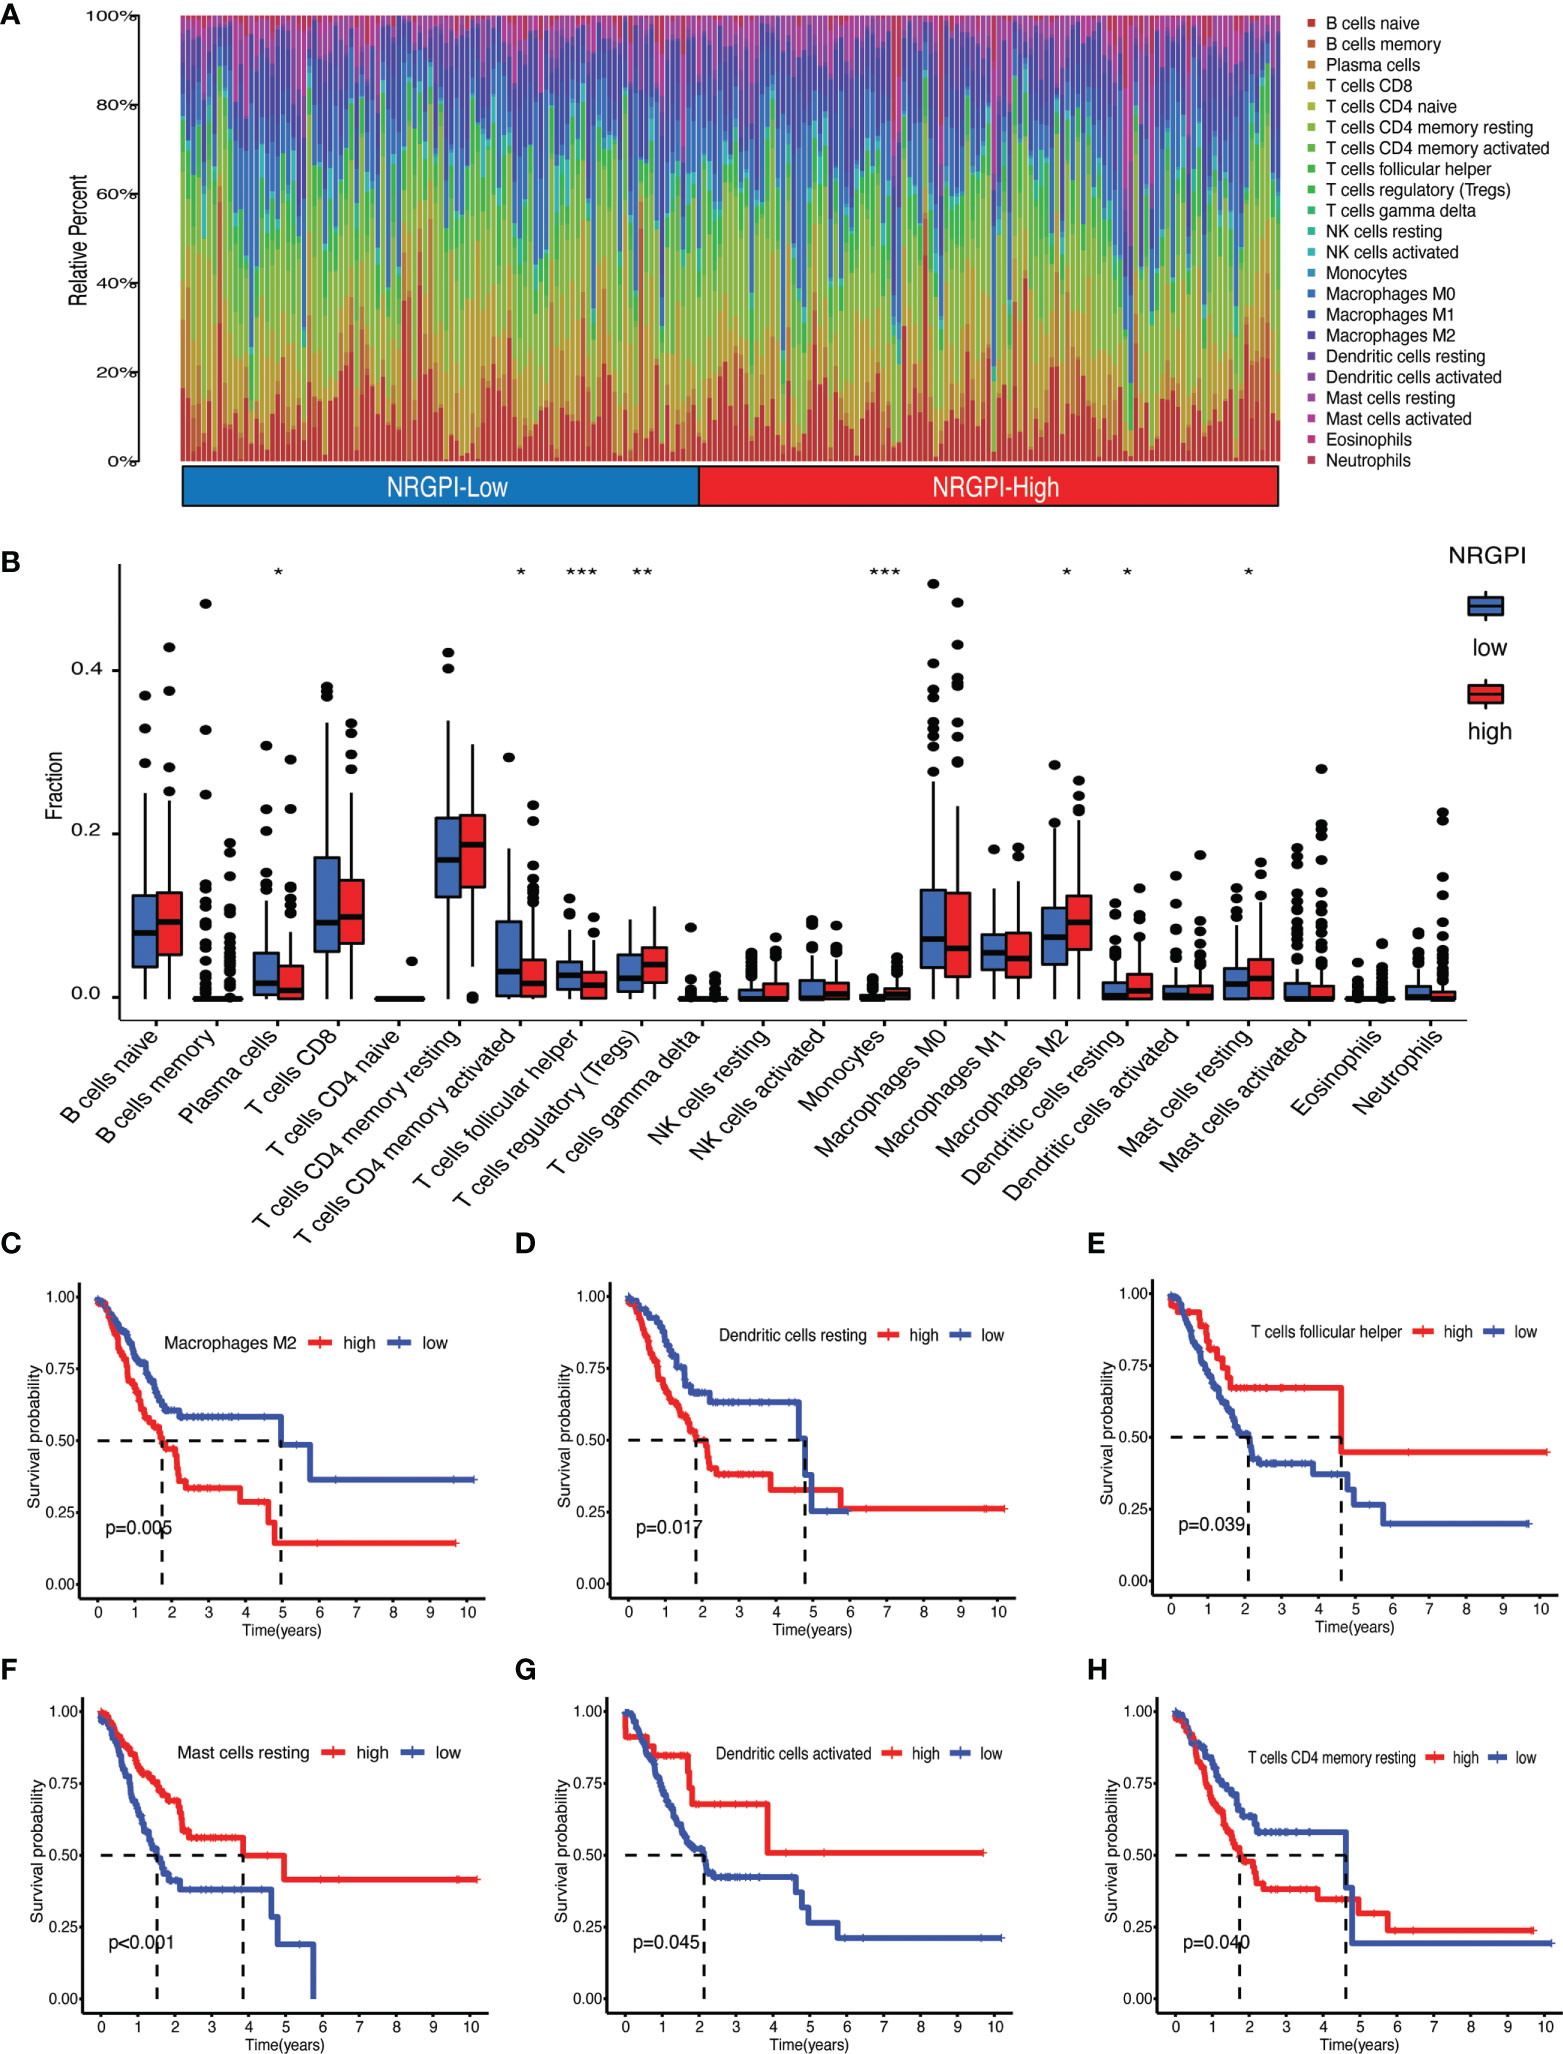
Figure 7 Immune landscape assessed by CIBERSORT algorithm. (A) Heatmap and (B) bar plot of abundance of 22 subtypes of immune cells in NRGPI-High and NRGPI-Low subgroups (P values are shown as: *P < 0.05; **P < 0.01; ***P < 0.001). (C–H) Kaplan-Meier curves for survival difference between TCGA patients with high and low- infiltration of immune cells.
Immune-related pathways that were significantly upregulated in NRGPI-High subgroup (investigated in the TCGA cohort and validated in the GEO dataset) included APC co-stimulation, Chemokine receptors (CCR), checkpoint, para-inflammation, T cell co-stimulation, and type-II interferon (IFN) response. Upregulation of para-inflammation and type-II interferon pathways were associated with a worst prognosis (Figures 6E, F). On the other hand, checkpoint and T cell co-inhibition pathways, that were also slightly activated in the NRGPI-High subgroup, were associated with a better prognosis (Figure 6G and Supplementary Figure 3F). Other pathways and immune cells that had no significant differences between the cohorts had also significant impact on the prognosis (Figure 6G and Supplementary Figures 3B-E, G). Moreover, immune subtype analysis indicated that the main difference between the NRGPI subgroups was the comparative enrichment of inflammatory subtype in the NRGPI-High subgroup (C3: 6(4%) versus 27(16%, p=0.001) (Figure 6H).
The potential molecular mechanism of NRGPI genes was elucidated by constructing the network of mRNA–miRNA–lncRNA interactions as illustrated in Figures 8A–C (Supplementary Data-Sheet 9-12: Supplementary Tables 9–12). A total of 72 miRNA targets with prognostic significance were identified after screening for negative correlation with individual NRGPI genes (Supplementary Data-Sheet#9, 10: Supplementary Tables 9, 10). LncRNA targets (obtained from starbase v2.0) were screened for positive correlation with NRGPI genes and negative correlation with miRNA targets, which yielded 32 lncRNAs regulating the expression of 21 miRNAs and 9 NRGPI genes (Supplementary Data-Sheet#11, 12: Supplementary Tables 11, 12). Main miRNA families (miR-200, miR-15/107, let-7) were identified as regulator of NRGPI genes. For example, miRNA-200 family members (hsa-miR-200a-3p, hsa-miR-200b-3p, hsa-miR-200c-3p, and hsa-miR-141-3p), which are reported as tumor-suppressive group of miRNAs with essential role in suppressing EMT, were downregulated miRNAs (among the targeting miRNAs) in patients with higher expression of CNTN1, GPX3, FCN1 and SERPINE1 (NRGPI-high) (66). Additionally, CNTN1 was also regulated by hsa-miR-15b-5p and hsa-miR-503-5p (members of the microRNA-15/107 family) (67). APOD was regulated by hsa-miR-107 (another member of microRNA-15/107 family) and hsa-let-7d-5p which belongs to the let-7 family (68). PLCL1 and CYTL1 were negatively regulated by hsa-miR-18a-5p and hsa-miR-339-5p and positively regulated by lncRNA FENDRR and MAGI2-AS3, respectively. FENDRR was the predominant lncRNA regulator significantly correlating with 5 microRNAs and 3 NRGPI oncogenes. The tumor suppressive genes of the NRGPI (suppressed in NRGPI-High subgroup), the E2F2 and EFNA3, were regulated by a group of 4 microRNAs (E2F2: hsa-miR-490-3p and hsa-miR-145-5p; EFNA3: hsa-let-7c-5p and hsa-miR-133a-3p) (Figures 8H–K). The higher expression of these four microRNAs were predictive of worst prognosis as opposed to the other microRNAs regulating the oncogenes of NRGPI (Figures 8D–G and Supplementary Figure 4).
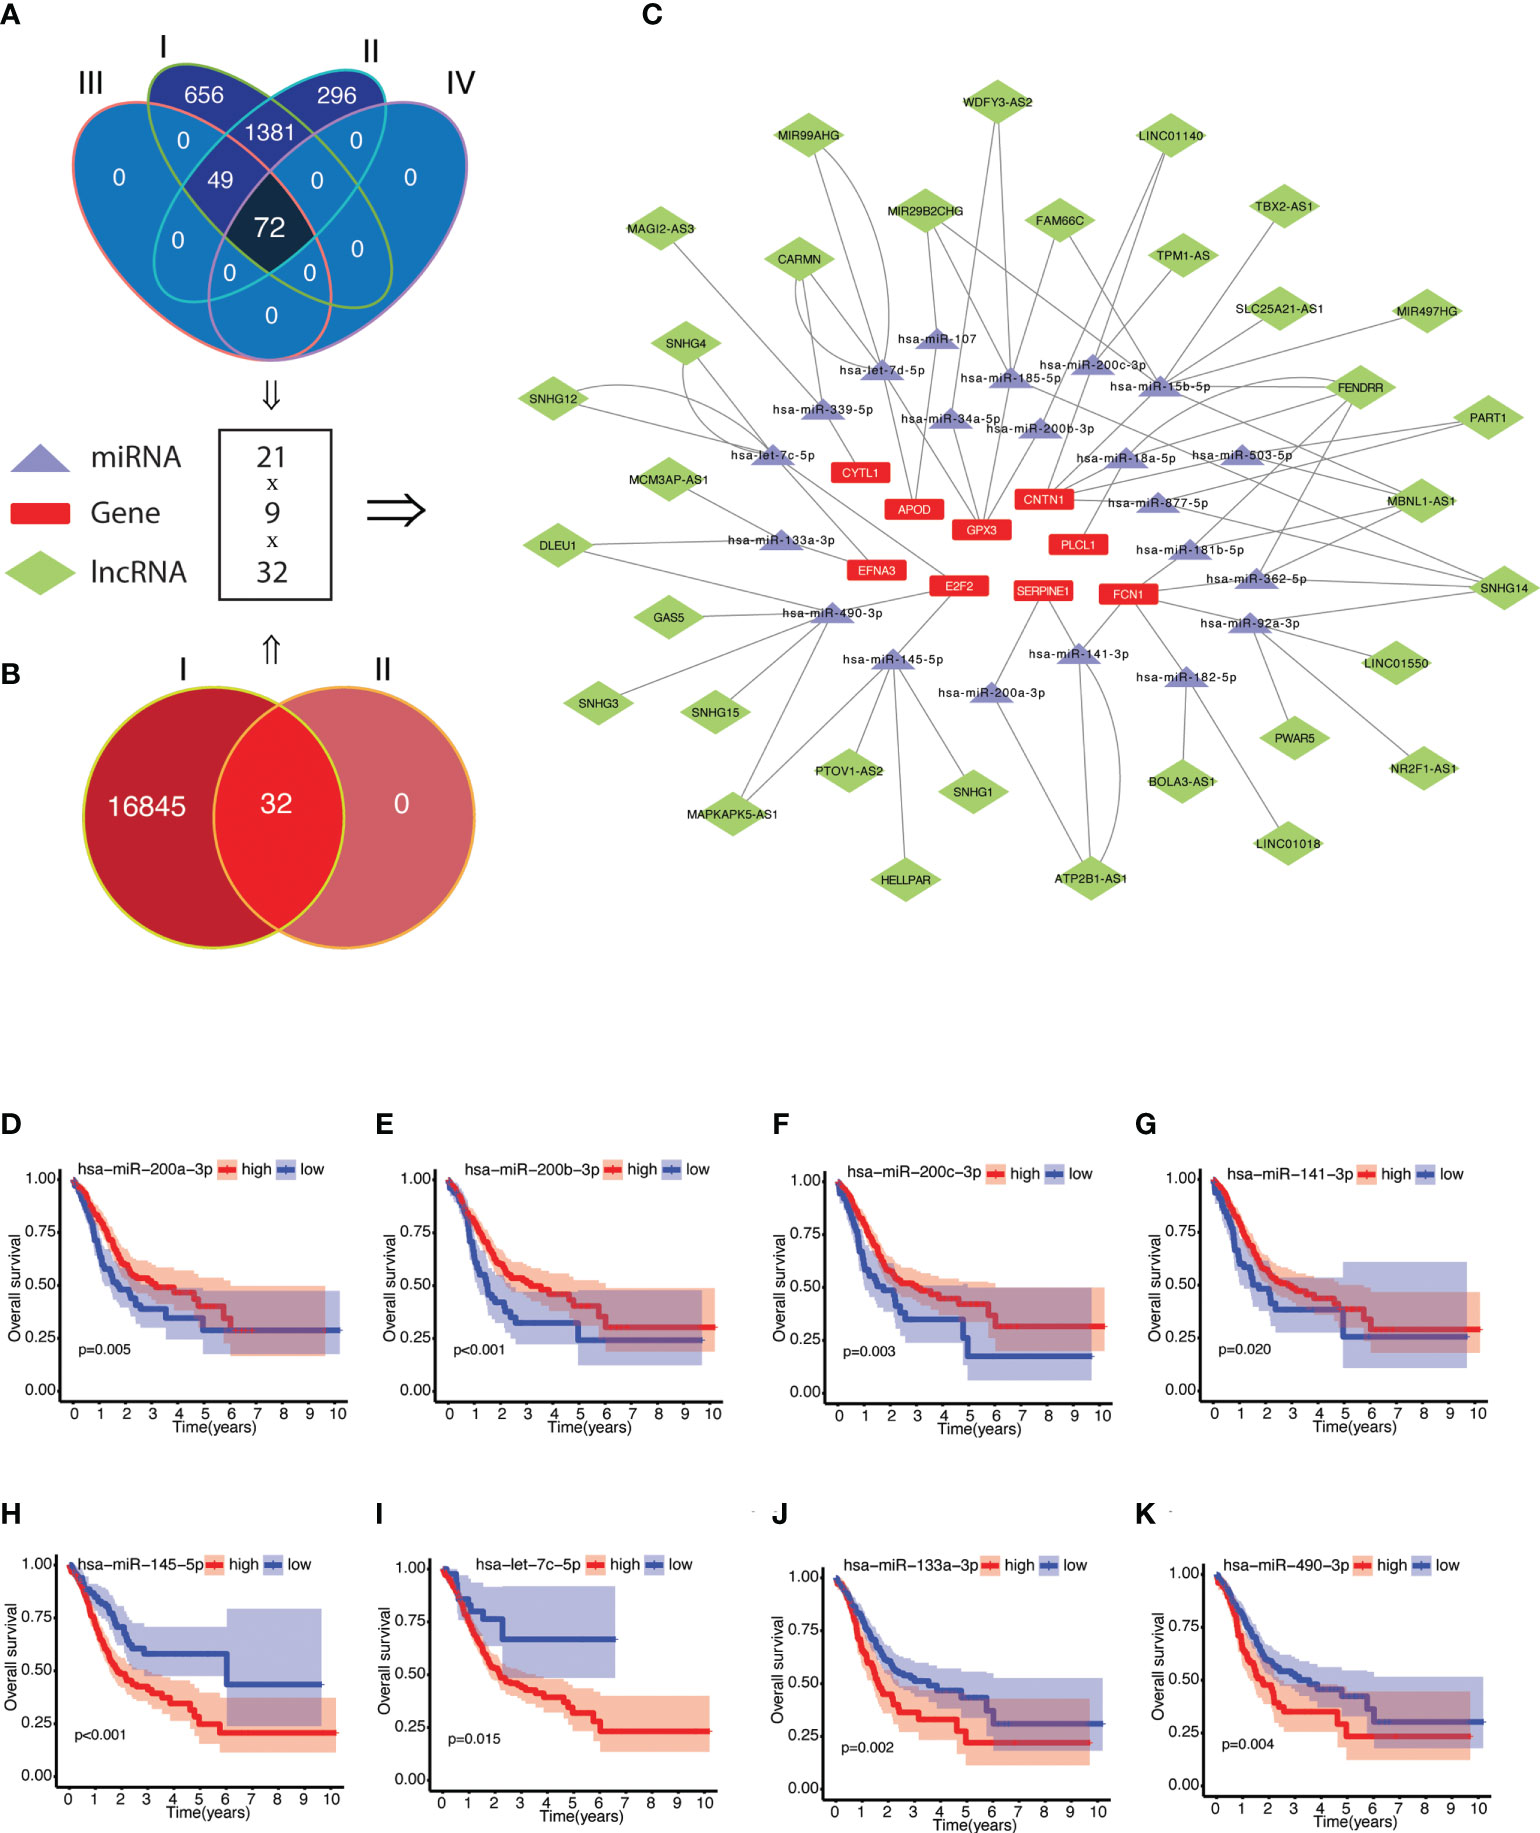
Figure 8 Construction of competing endogenous RNA (ceRNA) network of NRGPI genes. (A) Scrutiny of miRNA by (I) obtaining miRNA targets from miRWalk version 3.0 (n = 2158); (II) screening for miRNA expression in TCGA STAD cohort (n = 1798); (III) followed by gene-miRNA target correlation analysis (n = 122); and (IV) survival significance (n = 72). (B) lncRNA targets (n = 16877) were obtained for the 72 miRNA targets (I), which were then (II) screened for individual target-based correlation analysis (positive correlation with risk gene and negative correlation with miRNA). (C) A mRNA-miRNA-lncRNA (ceRNA) network (9 risk genes-21 miRNAs-32 lncRNAs) was constructed. Kaplan-Meier curves of survival analysis for miRNA targets of NRGPI oncogene (D-G) and NRGPI tumor suppressor genes (H–K). Correlation was tested with Spearman’s correlation test with the following criteria: R=0.2 and p value <0.001.
In order to experimentally validate the outcomes of our study, we further dissect the association of NRGPI genes with the characteristics of tumor microenvironment in gastric cancer such as wnt and TGF-β signaling pathways, and the infiltration of M2 macrophages. The individual NRGPI genes were evaluated for association with M2 macrophage in TCGA STAD cohort which revealed eight NRGPI oncogenes (SERPINE1, APOD, CYTL1, CNTN1, FCN1, GRP, GPX3, PLCL1) showed significant correlation with the infiltration of M2 macrophage (Figure 9A). In accordance with outcomes of GO enrichment analysis (Supplementary Figure 2C), NRGPI association with the two pathways was also investigated which showed strong correlation between the NRGPI and the two pathways (Supplementary Figures 5A, B). Interestingly, the aforementioned eight genes were among the most correlated with these pathways, in particular the TGF-β signaling pathway (Figures 9B, C). Hence, these eight NRGPI oncogenes were selected for further experimental analysis.
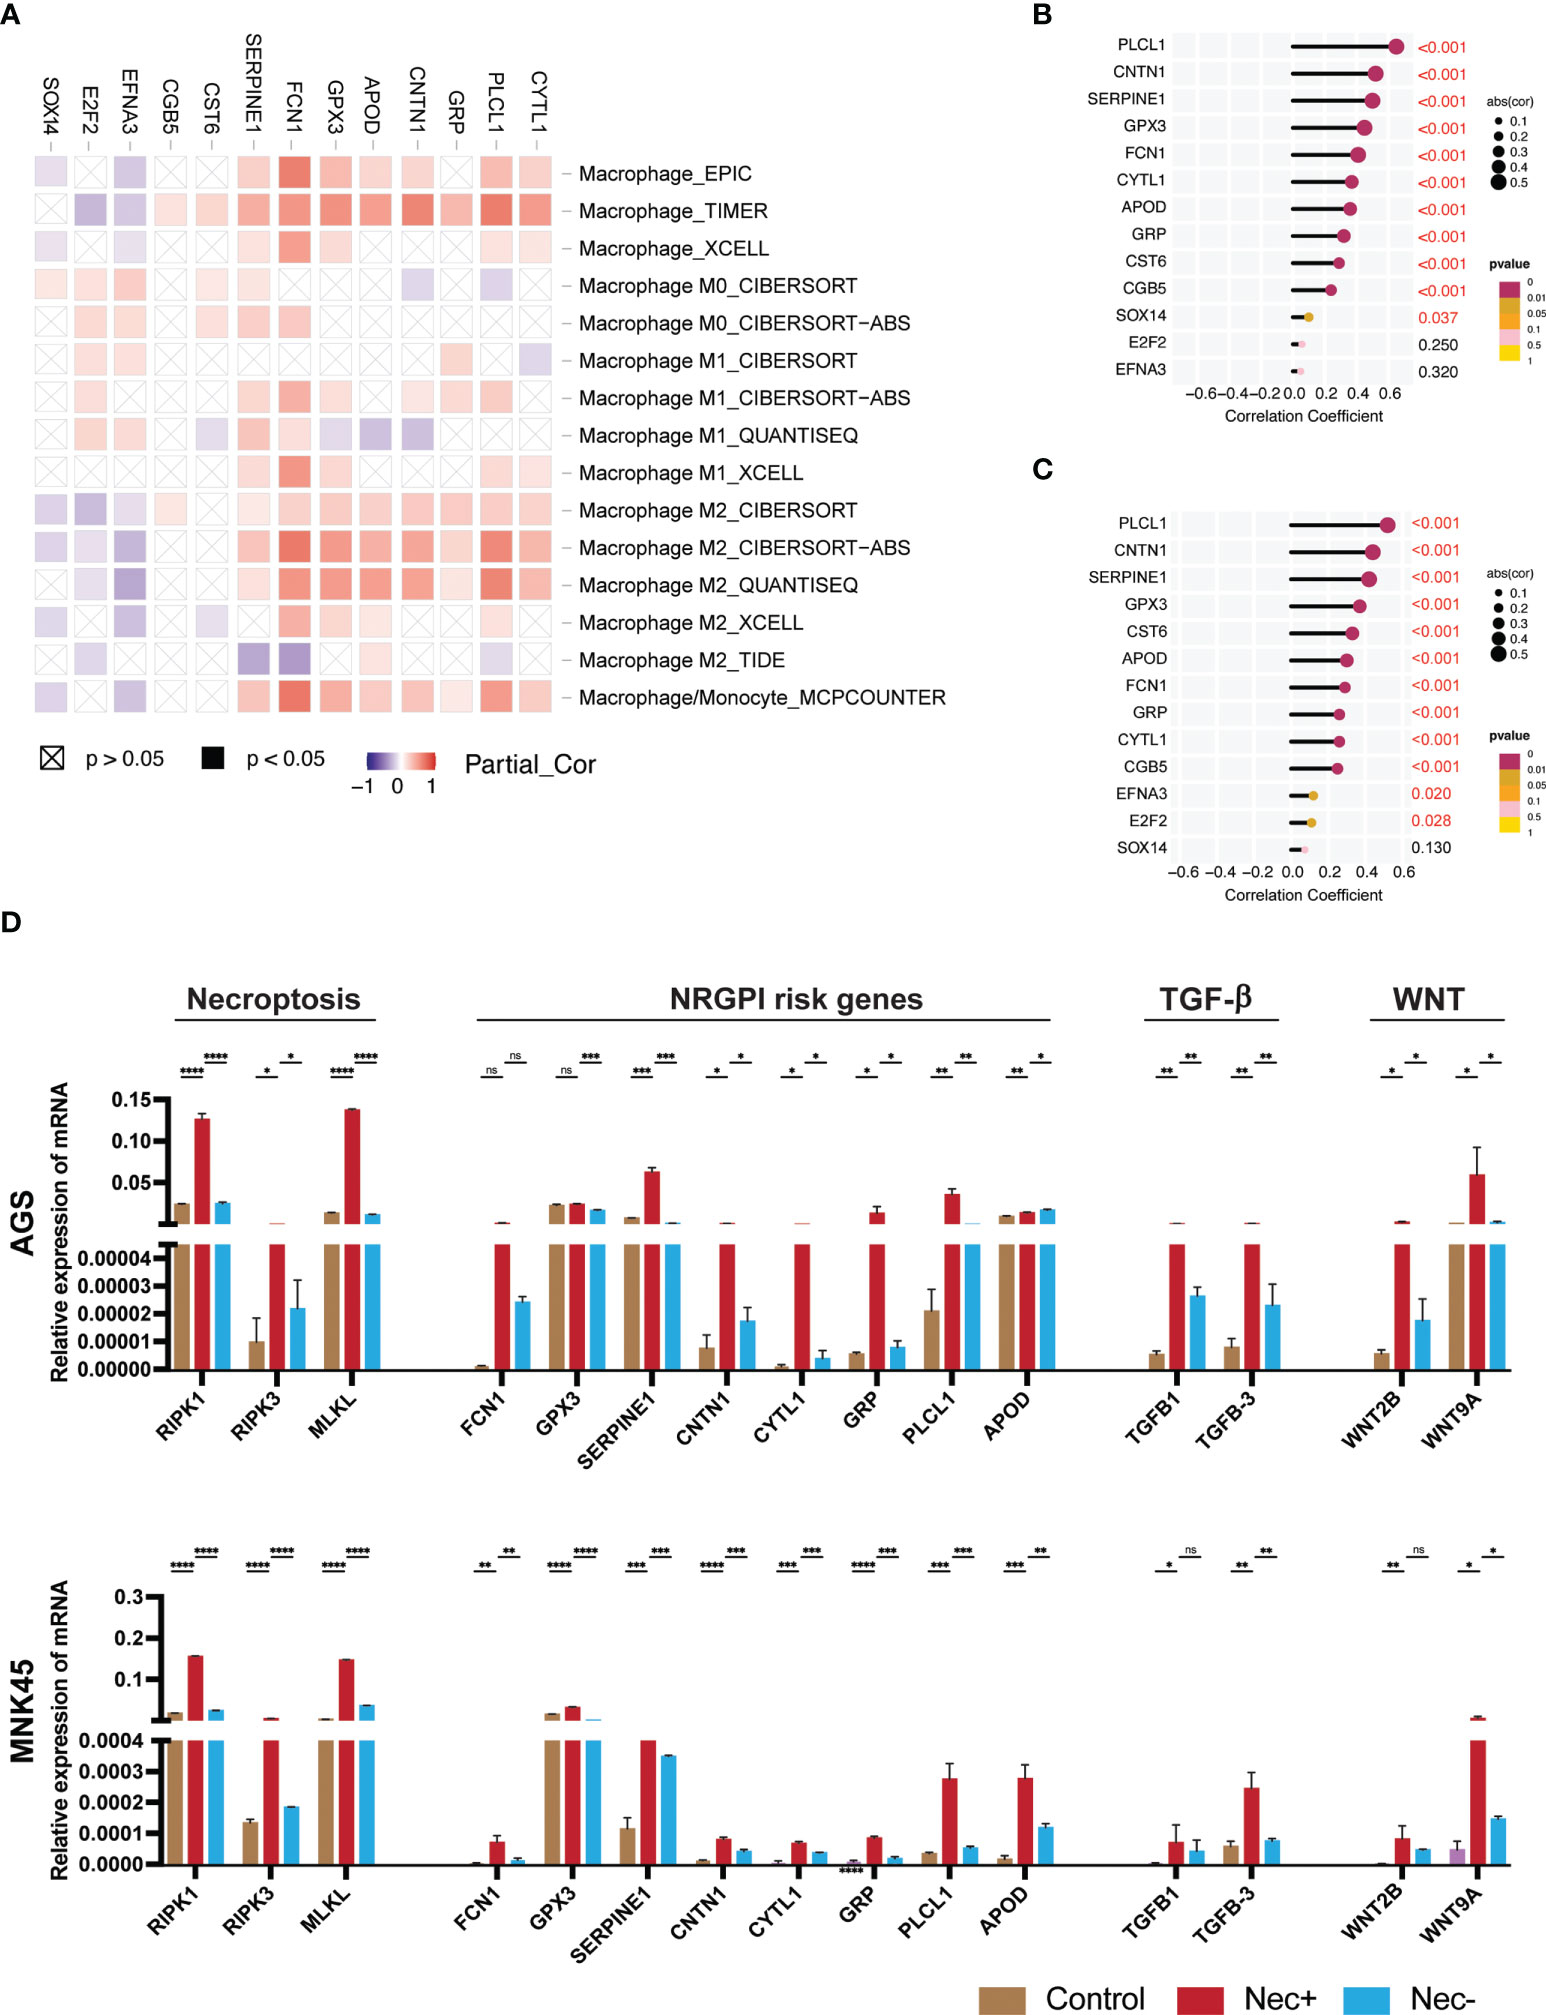
Figure 9 Individual assessment of NRGPI genes and association with necroptosis. (A) Spearman’s correlation between NRGPI genes and infiltration of macrophages in the TCGA STAD dataset assessed with TIMER database. (B) Spearman’s correlation between NRGPI genes and KEGG TGF-β signaling pathway signature genes and (C) WNT signaling pathway signature genes. (D) mRNA expression level of RIPK1, RIPK3, MLKL (necroptosis core mediators), NRGPI oncogenes (SERPINE1, GPX3, GRP, FCN1, CYTL1, CNTN1, PLCL1, and APOD), and markers of WNT signaling pathway (WNT2B, WNT9A) and TGF- signaling pathway (TGFB1, TGFB3) in gastric cancer cells (AGS and MNK45) after being treated with a combination of human recombinant TNF-α, SMAC mimetic, and zVAD-FMK (TSZ) to induce necroptosis or added necroptosis inhibitor (necrostatin-1) to inhibit necroptosis. Graph shows mean ± SD. *P<0.05; **P < 0.01; ***P < 0.001; ****P < 0.0001; ns, not signficant.
To confirm the association of necroptosis and NRGPI oncogenes, necroptosis was induced in gastric cancer cells (AGS and MNK45) using a combination of human recombinant TNF-α, SMAC mimetic, and zVAD-FMK (TSZ) as previously suggested (69, 70). After induction of necroptosis, the mRNA expression level of core mediators (RIPK1, RIPK3, and MLKL) were increased and suppressed when necroptosis inhibitor (necrostatin-1) was added (Figure 9D). There was statistical difference between the mRNA expression levels of these core mediators in both cell lines (AGS and MNK45). Moreover, a similar pattern of expression was evident for selected NRGPI oncogenes. The relationship between NRGPI and cancer progression pathways, such as WNT and TGF-β signaling pathways, was also confirmed as the mRNA expression level of WNT and TGF-β markers (wnt markers: WNT2B, WNT9A; TGF-β markers: TGFB1 and TGFB3), which were selected based on correlation analysis (Supplementary Figures 5C, D), were also significantly elevated with induction of necroptosis.
The relationship of necroptosis, NRGPI oncogenes and tumor microenvironment characteristics was further established in clinical samples via conducting immunohistochemistry analysis in stomach adenocarcinoma patients. As shown in Figures 10, 11A, B, the core mediators of necroptosis (mainly RIPK3 and. MLKL) were highly expressed in these patients which correlated with several of NRGPI oncogenes such as APOD, CYTL1, CNTN1, and PLCL1. TGF-β pathway was evidently activated as the both of the receptors (TGFB1 and TGFB3) showed considerable expression in these patients (Figure 11A). Moreover, macrophage infiltration was intensely evident and showed a predominant positive correlation with the NRGPI oncogenes and pathway markers (Figures 11A, B). M2 phenotype expression (CD206 and CD163) was also demonstrated which, in general, showed a negative correlation but certain significant positive correlation was also apparent. For example, RIPK3 expression was significantly positively correlated with CNTN1 (p<0.001), TGFB1 (p<0.001), and CD206 (not significant). Overall, these results indicate the presence of a strong relationship as suggested by bioinformatics outcomes between the necroptosis, NRGPI oncogenes, and the tumor immune microenvironment which should further be elaborated on individual level.
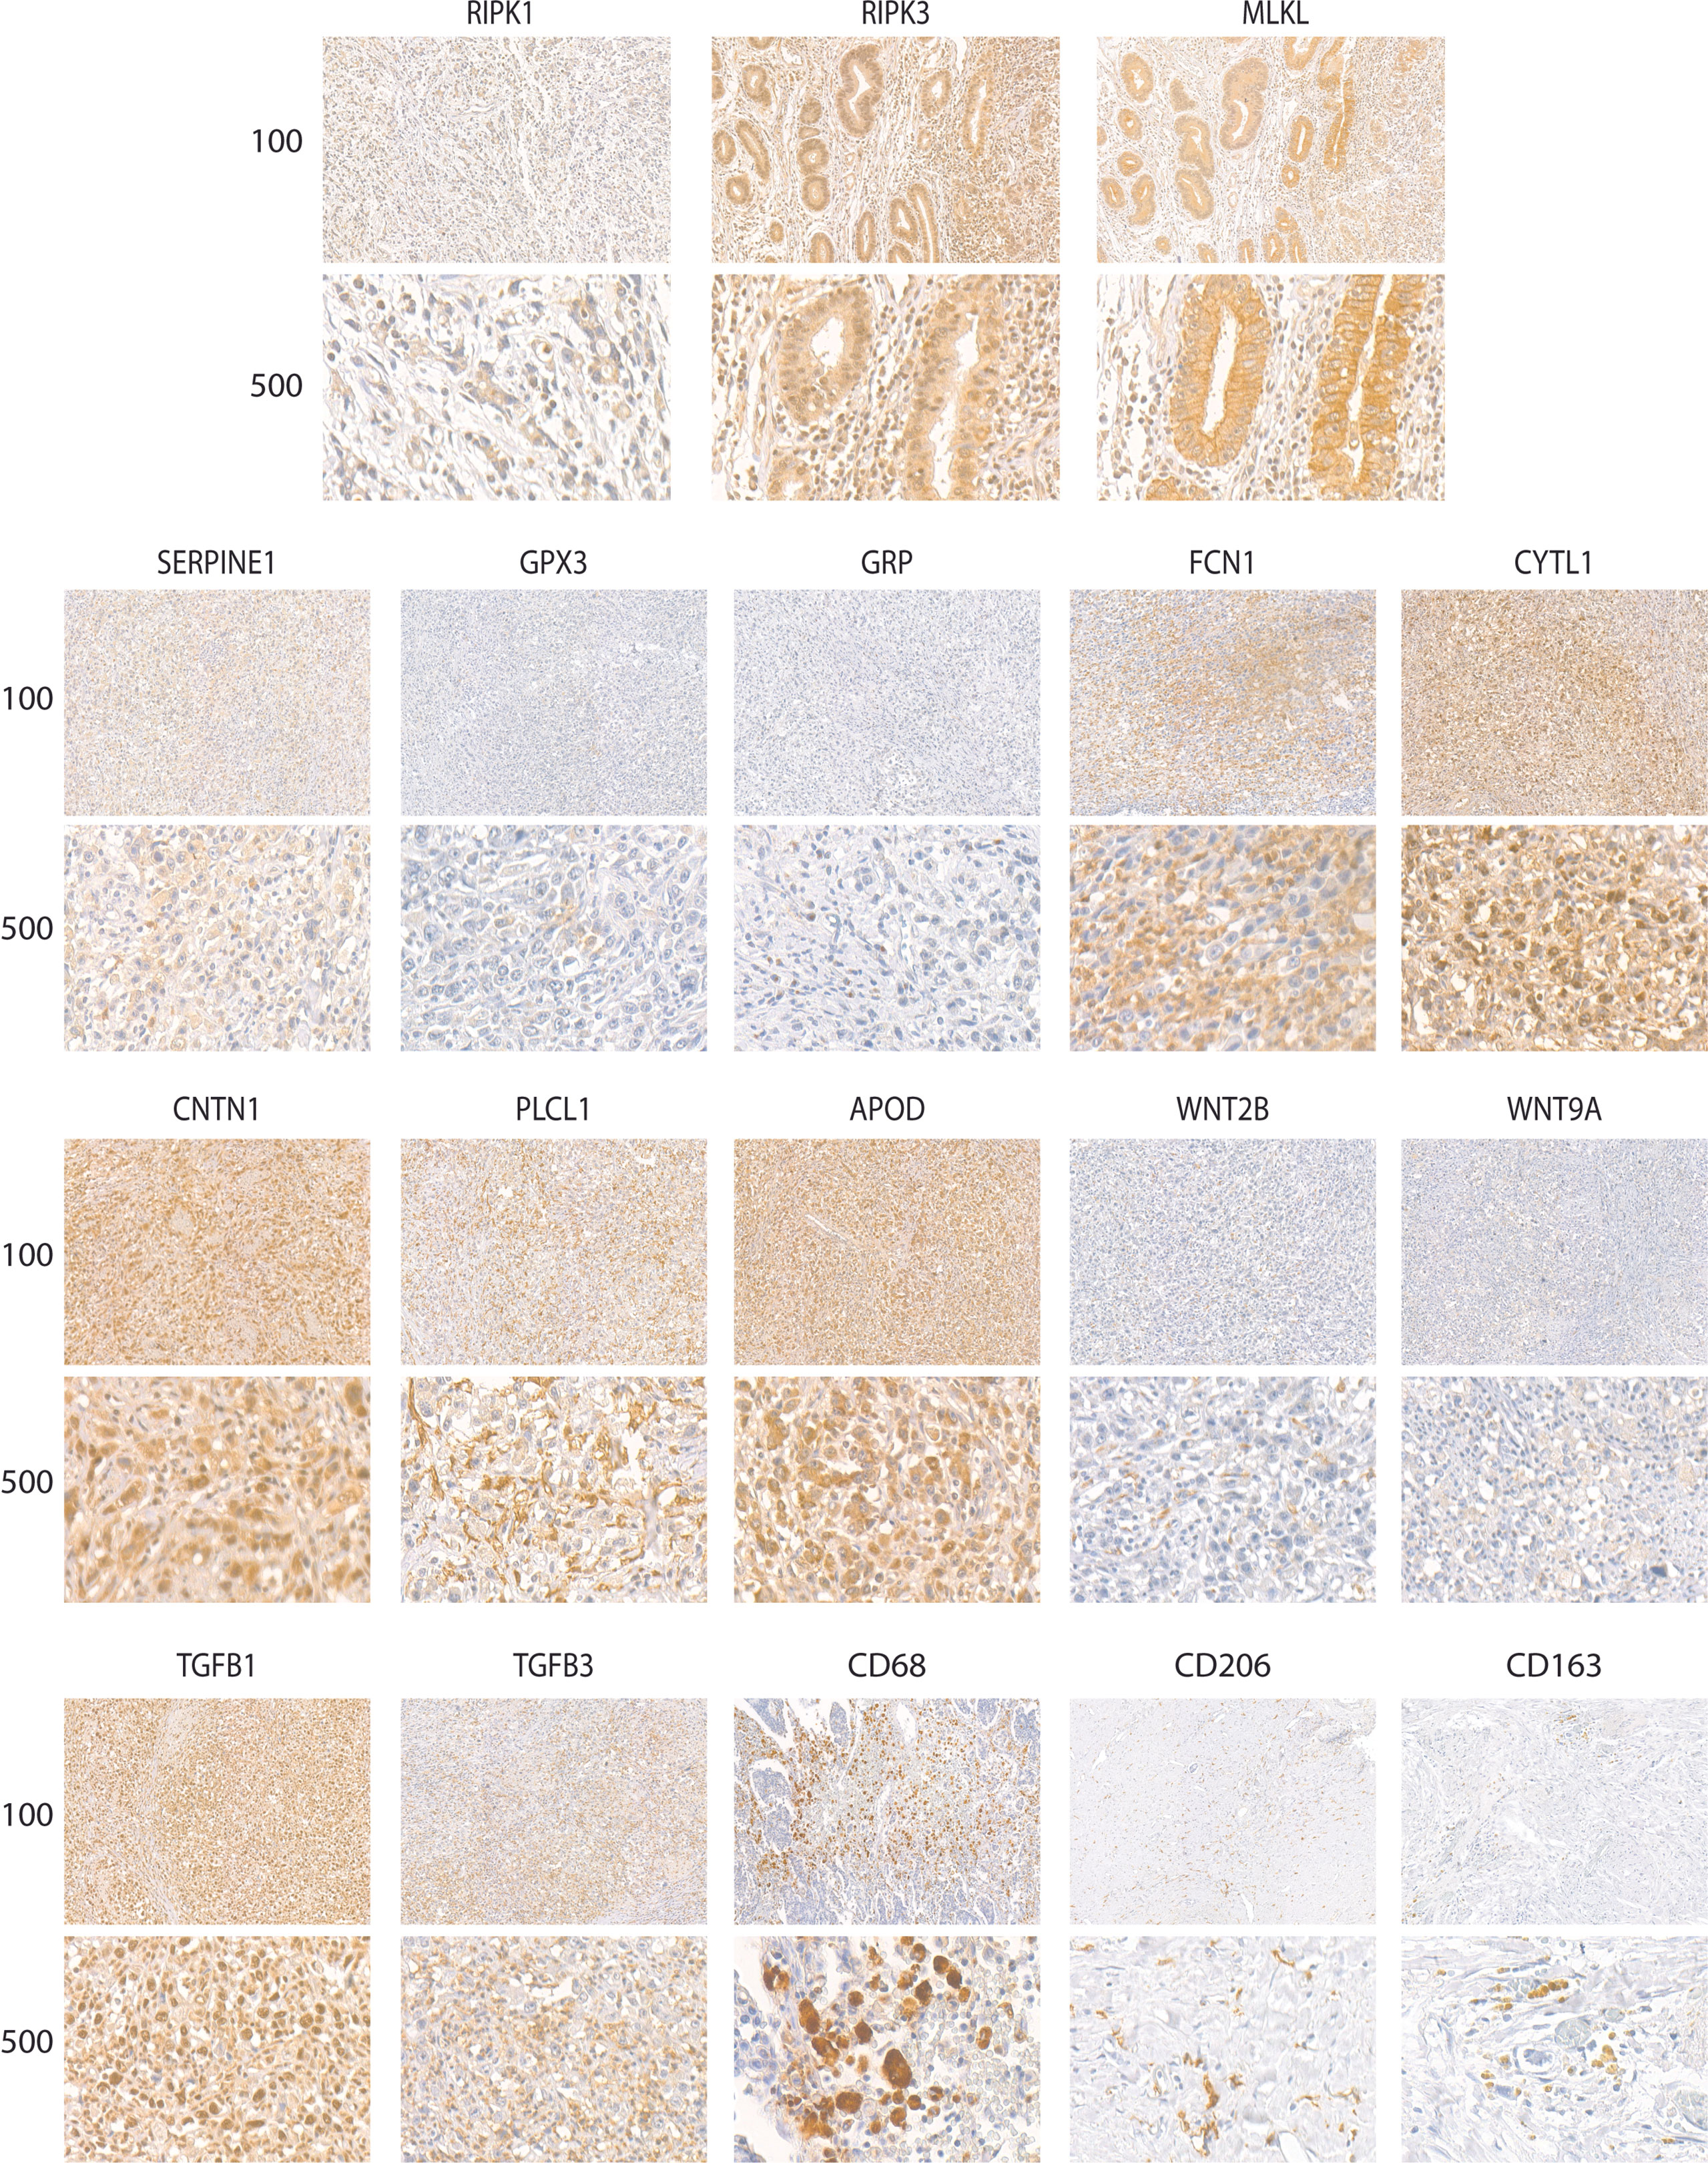
Figure 10 Representative images of expression (brown, cell cytoplasmic/nucleus stain) of RIPK1, RIPK3, MLKL (necroptosis core mediators), NRGPI oncogenes (SERPINE1, GPX3, GRP, FCN1, CYTL1, CNTN1, PLCL1, and APOD), markers of WNT signaling pathway (WNT2B, WNT9A), TGF-β signaling pathway (TGFB1, TGFB3), and macrophage (CD63, CD206, CD163) in the clinical samples of stomach adenocarcinoma.
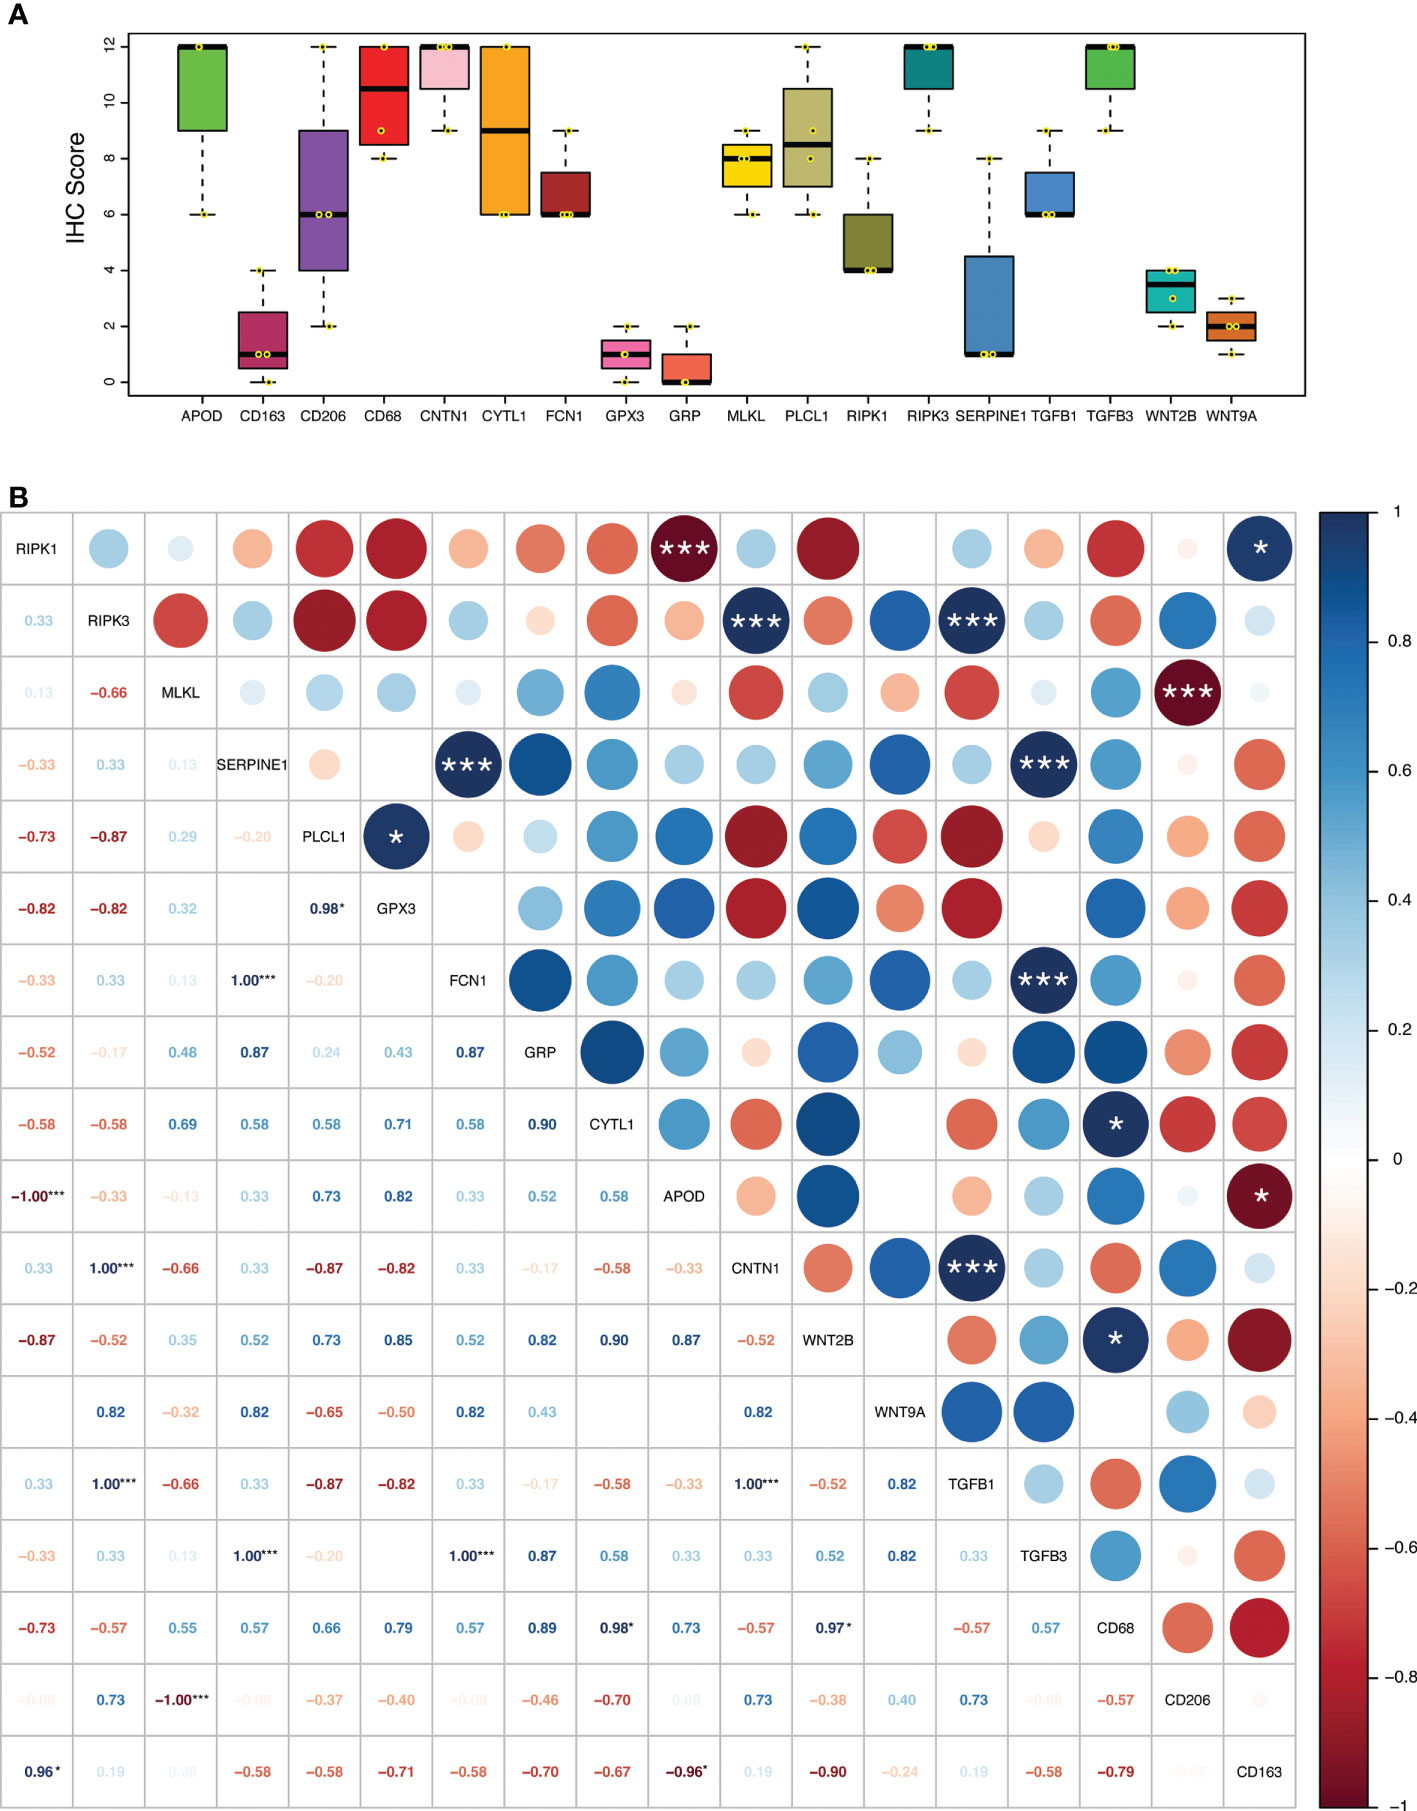
Figure 11 (A) Expression level (IHC quantification) of RIPK1, RIPK3, MLKL (necroptosis core mediators), NRGPI oncogenes (SERPINE1, GPX3, GRP, FCN1, CYTL1, CNTN1, PLCL1, and APOD), and markers of WNT signaling pathway (WNT2B, WNT9A), TGF-β signaling pathway (TGFB1, TGFB3), and macrophage (CD63, CD206, CD163) in the clinical samples (n = 4) of stomach adenocarcinoma. The scattered dots represent the IHC score of each individual sample. The thick middle lines represent the median value and error bars indicate the standard deviation. The bottom and top of the boxes are the 25th and 75th percentiles (interquartile range), respectively. (B) A correlation matrix illustrating Pearson’s correlation coefficients indicating the relationship among expression levels of RIPK1, RIPK3, MLKL (necroptosis core mediators), NRGPI oncogenes (SERPINE1, GPX3, GRP, FCN1, CYTL1, CNTN1, PLCL1, and APOD), and markers of WNT signaling pathway (WNT2B, WNT9A), TGF-β signaling pathway (TGFB1, TGFB3), and macrophage (CD63, CD206, CD163) in the clinical samples (n = 4) of stomach adenocarcinoma. P values are shown as: *P < 0.05; **P < 0.01; ***P < 0.001.
The drug sensitivity profile highlighted two main aspects of the NRGPI subgroups (Supplementary Figure 6). Of the 13 chemotherapy agents, 4 agents showed sensitivity to NRGPI-Low subgroup and none to NRGPI-High subgroup. Major tyrosine kinase inhibitors, that mainly target epidermal growth factor receptor (EGFR), phosphoinositide 3-kinases (PI3K), mammalian target of rapamycin (mTOR), SRC kinases, BCR-Abl, vascular endothelial growth factor receptor (VEGFR), and platelet-derived growth factor receptor (PDGFR), showed sensitivity to NRGPI-High subgroup. Moreover, two poly (ADP-ribose) polymerase (PARP) agents also showed lower IC50 values for the NRGPI-High subgroup. Interestingly, the NRGPI-High subgroup showed resistant to polo-like kinase 1 (PLK1) inhibitors. Detailed profile of the drug sensitivity is listed in Supplementary Table 13 (Supplementary Data-Sheet#13).
Necroptosis pathway was greatly deregulated in gastric cancer samples as compared to adjacent normal tissues, wherein the majority of the necroptosis-related genes (NRGs) demonstrated a uniform downregulation. Differential expression of NRGs also identified two molecular subtypes that showed significant difference in prognosis. A 13-gene risk signature was constructed based on the differential expression of genes between the molecular subtypes, that comprehensively differentiated the gastric cancer patients into high and low-risk subgroups. Dissection of these two risk groups by differential gene expression analysis indicated involvement of several biological processes related to cell motility, extracellular organization, and signaling pathways associated with cancer cell progression and immune suppression such as WNT signaling pathway and TGF-β signaling pathway. Para-inflammation and type-II interferon response pathways were evident with an increased infiltration of regulatory T cells (Tregs) and M2 macrophages. Overall, an exhausted immune phenotype was apparent in the NRGPI-High subgroup (Figure 12).
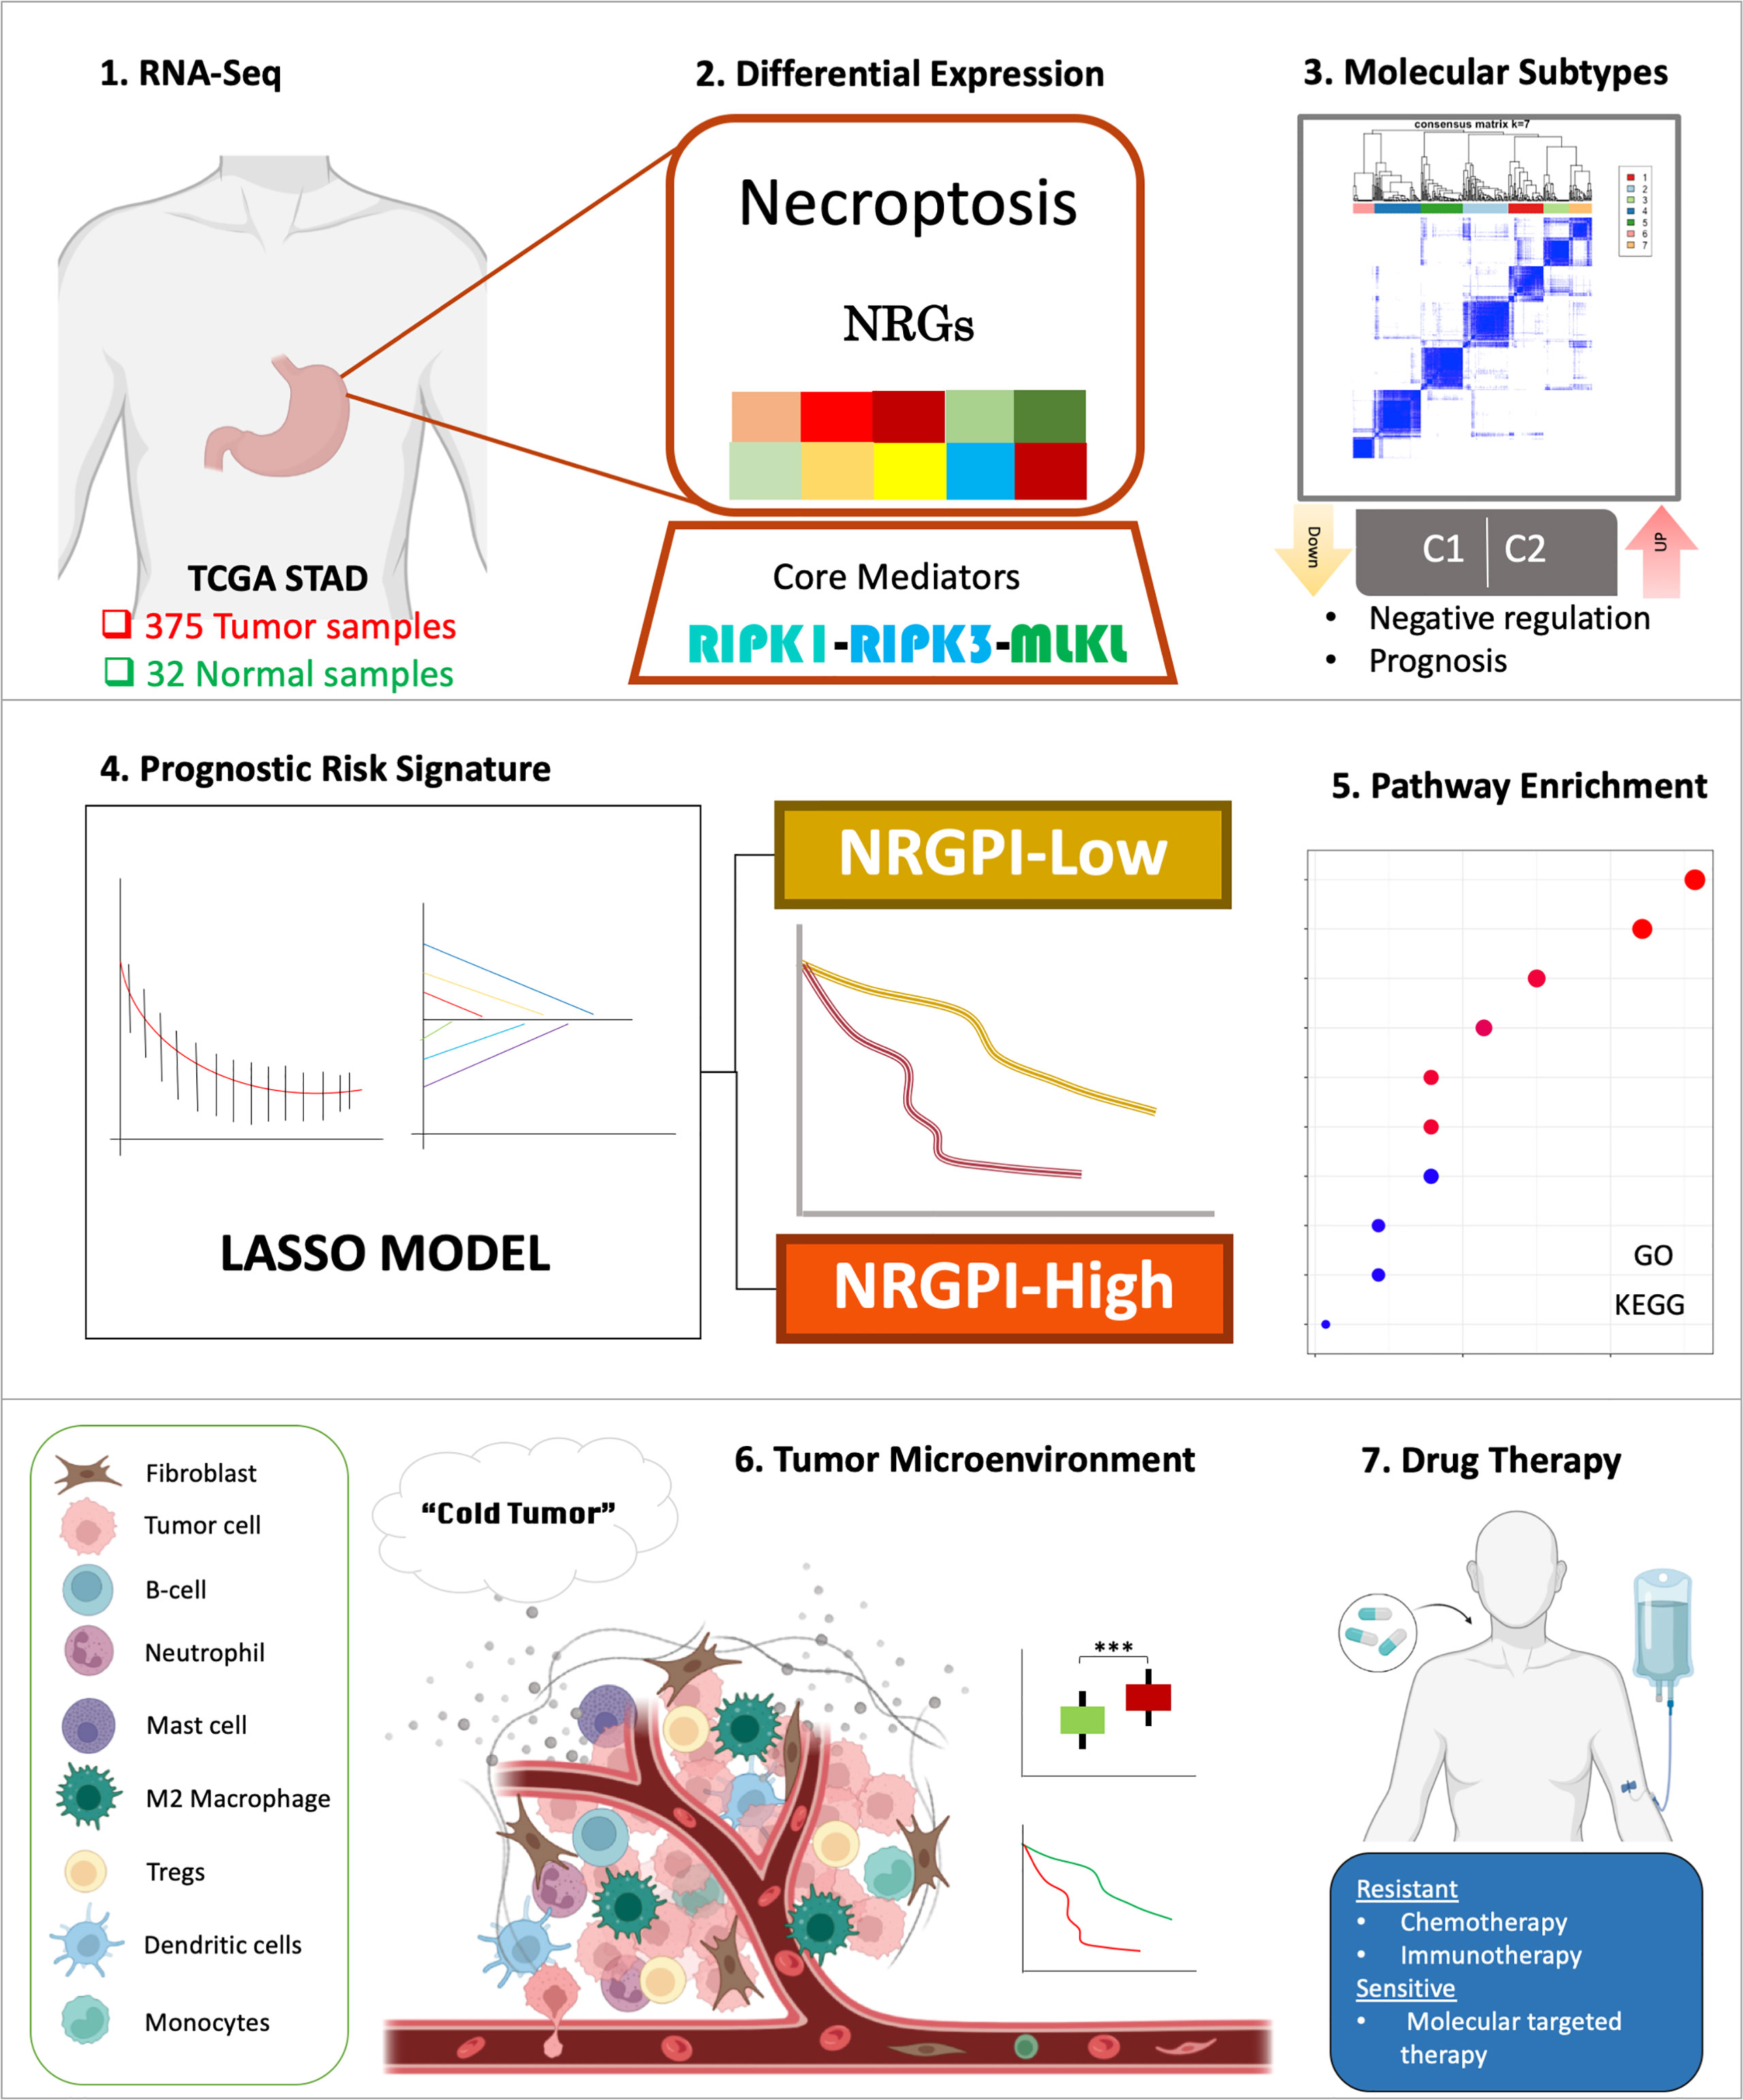
Figure 12 Graphical abstract of construction and characterization of NRGPI subgroups.
In general, current evidence is insufficient to conclude the role of necroptosis as pro-tumorigenic or anti-cancer process. Down-regulation of core mediators such as RIPK3 and MLKL indicates an attempt to escape from necroptosis. On the other hand, its role in promotion of metastasis and T cell death underlines its role in carcinogenesis. While its inflammatory nature and promotion of cross-priming holds potential for targeted therapy. The clustering based on NRGs indicated two patterns of expression for necroptosis that was also evident in the NRGPI subgroups. Cluster with the worst prognosis (C2 & NRGPI-High subgroup) was identified by the upregulation of necroptosis-associated receptor activity and TAM kinases, AXL and MERTK. TAM kinases promote necroptosis via regulating MLKL oligomerization (23). Although MLKL showed no differential expression between the NRGPI subgroups, it was the only differentially expressed core necroptotic mediator in cancer samples as compared to normal tissues. Both of these indicators plus the lower expression of negative regulators indicate this cohort may have undergone significant necroptosis. While the cluster with a better prognosis (C1 & NRGPI-Low subgroup) was enriched in the expression of negative regulators, RIPK3 upregulation and inositol phosphates, which may indicate higher suppression or resistance to necroptosis in this cohort. Like TAM kinases, inositol phosphates, IPMK, ITPK1, and IPPK, have also been reported for their role in execution of necroptosis via activation of MLKL (27, 28). This could also explain the lack of significant differential expression of MLKL between the cohorts. Hence, under different circumstances, the necroptosis process may or may not be suppressed or resisted which holds prognostic significance. Further investigations would be required to investigate the mechanistic details of this phenomenon.
In our study, we identified a 13-gene risk signature (NRGPI) which characterized the gastric cancer patients into a NRGPI-High- and NRGPI-Low patients based on the differential gene expression between the two clusters. The study of these genes may help to comprehend the mechanism of differential necroptotic status and outcome between the aforementioned clusters. The 13-gene risk signature included several genes that have previously been implicated in cancer development and progression. Cytokine-like 1 (CYTL1, also known as C17 or C4ORF4) is a secreted protein that has shown a deregulated expression profile across cancers and has also been implicated in carcinogenesis (71). A previous study has reported its role in chemoattraction of monocytes via the CCR2/ERK pathway, which were more abundant in the NRGPI-High subgroup compared to the NRGPI-Low subgroup (72). Moreover, CYTL1 expression was positively correlated with macrophage marker CD68 indicating an interplay between necroptosis (CYTL1 positively correlated with MLKL), CYTL1 and macrophage infiltration which needs further exploration. It was identified as a tumor suppressor in lung cancer via inhibiting the tumor invasion and metastasis rather proliferation (72). While a similar effect on tumor growth and metastasis was achieved via inhibition of metabolic reprogramming in breast cancer cells expressing an intracellular form of CYTL1 that lacked a 1-22 aa signal peptide, ΔCYTL1 (73). In contrast, CYTL1 was involved in the growth and metastasis of neuroblastoma cells (74). Although its expression is downregulated in gastric cancer, a higher expression suggested a poor prognosis as shown in our study. Furthermore, our study identified the hsa-miR-339-5p as miRNA target of CYTL1 which has previously been recognized as a suppressor of malignant development in gastric cancer thereby further cementing CYTL1 role as an oncogenic molecule in gastric cancer (75). Phospholipase C like 1 (PLCL1) is required for insulin induced gamma-aminobutyric acid type A (GABA(A)) receptor expression and in the gonadotropin secretion (76, 77). PLCL1 was demonstrated to induce abnormal lipid metabolism in tumor cells by interacting with metabolism-related gene uncoupling protein 1 (UCP1), thereby repressing progression of clear cell renal cell carcinoma (ccRCC) (78). In a breast cancer study, its expression was associated with PIK3CA mutation and PFS; nonetheless, its role in cancer has largely been unknown (79). Our study indicated PLCL1 to play a role in macrophage infiltration as shown in bioinformatic analysis and validated in the immunohistochemistry analysis of the clinical samples. In coherence with our study, chorionic gonadotropin subunit beta 5 (CGB5) – a protein-encoding gene primarily associated with invasive mole and ectopic pregnancy – has previously been identified as a biomarker in gastric cancer (80). It exhibits structural similarities with other growth factors and has been shown to act as proangiogenic factor in some tumors (81, 82). Other properties include suppression of apoptosis and induction of epithelial‐to‐mesenchymal transition (EMT) via TGF-β signaling pathway (83–85). These functional properties of CGB5 could also be reflected in our study.
Contactin 1 (CNTN1), a neuronal membrane glycoprotein, has long been implicated in cancer cell invasion, migration, metastasis via the epithelial-mesenchymal transition (EMT) in several cancers such as the lung cancer, gastric cancer, esophageal cancer, thyroid cancer, liver cancer, prostate cancer, and breast cancer (86–93). In fact, CNTN1 was identified as a critical NRGPI oncogene in our study which showed strong association with necroptosis (RIPK3), TGF-β signaling pathway (TGFB1), and infiltration of the M2 macrophages (CD206). Moreover, ceRNA network identified hsa-miR-200c-3p as regulator of CNTN1 which further assert CNTN1 role in gastric cancer development via EMT (66). Hence, CNTN1 may induce TGF-β1 which can promote differentiation of macrophages into M2 phenotype thereby further inducing the secretion of TGF-β1 and consequently prompting the EMT (94, 95). In has also been involved in the development of chemoresistance in lung cancer (96). Several studies have clearly indicated CNTN1 as an independent prognostic factor in gastric cancer 87, 88). Gastrin releasing peptide (GRP) is a neuropeptide that causes the secretion of gastrin in the stomach (97). GRP is over-expressed in a number of cancers including lung, breast, stomach, pancreas, renal, prostate, and colon (98, 99). GRP actions relevant to carcinogenesis include its role as a potent mitogen and its effects on angiogenesis, cell adhesion, and cell migration – pathways that were also revealed in our study (100, 101). Apolipoprotein D (ApoD), a protein regulated by androgen and estrogen, is implicated in breast cancer as a poor prognostic factor (102). In gastric cancer, several bioinformatic analysis have revealed APOD as a component of gene-risk model and associated with tumor mutational burden and immune cell infiltration (103–105). Our study further validated these characteristics of APOD demonstrating a positive correlation with infiltration of macrophages (CD68) and WNT signaling pathway (WNT2B). Cystatin E/M (CST6), a representative cysteine protease inhibitor, has been well appreciated as a tumor-promoting and tumor-suppressing agent and is pursued as an epigenetically therapeutic target in special cancer types (106). Loss of expression in 70% of gastric cancer was reported due to promoter hypermethylation which was associated with shorter survival (107). Moreover, CST6 was also part of a CpG island methylator phenotype-related prognostic gene signature which differentiated gastric cancer into high-and low-risk groups with a significant OS difference (108). Although the DNA methylation status of CST6 was not determined in our study, low expression of CST6 was associated with better prognosis. Likewise, extracellular glutathione peroxidase (GPX3) also plays a dichotomous role in different types of cancer (109). Bioinformatic analysis of TCGA data have revealed poor prognosis for gastric patients with higher GPX3 expression, which is in coherence with the outcome of our study. However, a tumor suppressive role also been reported for GPX3 in gastric cancer wherein its knockdown resulted in tumor cell invasion and migration by targeting NFкB/Wnt5a/JNK signaling (110). Ficolin-1 (FCN1) is a member of the ficolins family proteins that are considered as multifunctional innate immune defense factors mainly associated with complement pathway. Their role in cancer is not exclusively elaborated (111). Our study indicates association of higher expression of FCN1 with poor prognosis. Further exploration of these factors is warranted as a therapeutic target in gastric cancer. Serpin family E member 1 (SERPINE1) encodes plasminogen activator inhibitor 1 (PAI-1), which is a primary inhibitor of tissue plasminogen activator (tPA) (112). It has been detected in various cancer and involved in cancer invasion, migration, and angiogenesis (112–116). Activation of PAI-1 transcription is mediated by the cooperation of tumor suppressor p53 with TGF-β signal transducers, Smad proteins, to selectively enhance TGF-β-induced cytostatic effects (117). In gastric cancer, it was highly expressed and associated with regulation of EMT (114). Our study indicated PAI-1 as one of the NRGPI oncogenes associated with the TGF-β and infiltration of M2 macrophages.
Ephrin A3 (EFNA3), like most genes in the ephrin family, plays a central role in embryonic development and can be dysregulated in a variety of tumors (118). In gastric cancer, it has been identified as part of the prognostic gene signature during investigation of hypoxia and glycolysis (119, 120). Interestingly, the expression of Ephrin A3 was down-regulated in the high-risk group. Indicating it as tumor suppressive factor as reported before (121). E2Fs, transcription factor protein family, are implicated in carcinogenesis for their role in cell cycle control (122, 123). Previously, E2F2 has been reported for its role in development of gastric cancer growth (124). However, it was downregulated in the high-risk cohort indicating it as a tumor suppressive target. SOX14, a transcription factor, has largely been unexplored in cancer.
Investigations of immune-related pathways revealed activation of para-inflammation, a low-grade form of inflammation, in the high-risk group. Para-inflammation is implicated in the cancer development (125). Viral infection such as Epstein-Barr virus (EBV) and chronic infections such as H. Pylori might contribute to the para-inflammatory status (126). This status could certainly activate the innate immune pathways as observed in our study including APC co-stimulation, and type-II interferon secretions. Enrichment of TP53 mutation has also been linked to parainflammation-positive tumors, which was the highly mutated gene in the high-risk group (125). TP53 role in cancer cell cycle is mediated via p53-TGF-β signaling pathway which showed comparative enrichment in the high-risk group. Moreover, the immune landscape indicated a predominantly innate immune phenotype for the high-risk group, which was characterized by high infiltration of monocytes, M2 macrophages, activated mast cells, resting dendritic cells and regulatory T cells (Tregs). The survival analysis indicated significant impact on prognosis for the infiltration of these cells. Infiltration of Tregs as well as M2 macrophage phenotype have previously been associated with poor prognosis in cancers including gastric cancer (127–129). Overall, an exhaustive immune subtype is apparent for the high-risk patients characterized by the activation of Wnt and TGF-β pathways and the abundance of M2 macrophage and Tregs (130). As such, the high-risk patients may not respond well to the immune checkpoint inhibition therapy. Our investigations of the immune subtype identified the major difference between the cohorts which was the enrichment of inflammatory immune subtype in the high-risk group. Inflammatory subtype is characterized by the highest infiltration of Th17 cells among the immune subtypes, which is also implicated in cancer (61). TGF-β in the gastric tumor microenvironment is reported to promote the differentiation and expansion of both Th17 cells, Tregs and M2 macrophage (94, 95, 131, 132). Th17 contribute to gastric cancer growth through promotion of inflammation and secretion of IL-17 as opposed to Tregs which is involved in immune surveillance (132). Overall, the exhausted immune microenvironment may not be a suitable candidate for immunotherapy. Interestingly, resistance to certain chemotherapy agents was also apparent in our study. However, selective molecular targeted therapy, as demonstrated in the drug sensitivity analysis, might be a better option for the NRGPI-High gastric patients.
Necroptosis appears to play a critical role in the development and progression of gastric cancer. Molecular subtypes could further dissect the differential role necroptosis might play during the gastric cancer progression with implications for tumor immune microenvironment, prognosis, and therapy. Results of our study could provide a basis for further work on elaborating the mechanistic details of necroptosis in gastric cancer.
The mRNA expression and clinical data used in this article can be accessed from TCGA (https://portal.gdc.cancer.gov/) and GEO (https://www.ncbi.nlm.nih.gov/geo/) databases. The accession number(s) can be found in the article/Supplementary Material.
The studies involving human participants were reviewed and approved by Internal review and ethics boards of the Affiliated Cancer Hospital and Institute of Guangzhou Medical University. The patients/participants provided their written informed consent to participate in this study.
MK, JL, and BW contributed equally to this work. All authors have made significant contributions to the conception, supervision, and final approval of the manuscript.
This study was supported by the National Natural Science Foundation of China (82102974), Science and Technology Program of Guangzhou, China (202201011048), and Key Clinical Technology of Guangzhou (2019ZD17).
The authors declare that the research was conducted in the absence of any commercial or financial relationships that could be construed as a potential conflict of interest.
All claims expressed in this article are solely those of the authors and do not necessarily represent those of their affiliated organizations, or those of the publisher, the editors and the reviewers. Any product that may be evaluated in this article, or claim that may be made by its manufacturer, is not guaranteed or endorsed by the publisher.
The Supplementary Material for this article can be found online at: https://www.frontiersin.org/articles/10.3389/fimmu.2022.968165/full#supplementary-material
Supplementary Figure 1 | Assessment of the risk model. (A) Distribution of TCGA and (B) GEO patients based on the risk score. (C) Risk scores and survival correlation for the high- (on the right side of the dotted line) and low-risk (on the left side of the dotted line) TCGA and (D) GEO patients. (E) Linear regression between risk score and survival time in years for TCGA and (F) GEO cohorts. (G) Principal component analysis (PCA) plots of risk scores for TCGA and H) GEO cohorts. (I) t-distributed stochastic neighbor embedding (t-SNE) plots of risk scores for TCGA and (J) GEO cohorts.
Supplementary Figure 2 | Correlation and functional analysis of the risk groups. (A) Pearson’s correlation between individual NRGs (n = 55) and NRGPI (n = 13). P values are shown as: *P < 0.05; **P < 0.01; ***P < 0.001. (B) Circos plot depicting the enrichment of gene ontology (GO) terms (only biological process: BP) and (C) Kyoto Encyclopedia of Genes and Genomes (KEGG) pathways (increasing depth of the red indicate the more obvious differences; q-value: the adjusted p-value).
Supplementary Figure 3 | Immune landscape of NRGPI subgroups based on the single sample gene set enrichment analysis (ssGSEA) scores. (A) Comparison of enrichment scores of 16 types of immune cells and 13 immune-related pathways in the GEO cohort between NRGPI-High and NRGPI-Low subgroups. (B–F) Kaplan-Meier curves for survival difference between TCGA patients with high and low-activation of immune-related pathways. (G) Kaplan-Meier curves for survival difference between TCGA patients with high and low- infiltration of Th2 cells. P values are shown as: *P < 0.05; **P < 0.01; ***P < 0.001.
Supplementary Figure 4 | Kaplan-Meier curves of survival analysis for miRNA targets of NRGPI oncogenes.
Supplementary Figure 5 | Association of NRGPI and cancer-associated pathways (B) Spearman’s correlation between NRGPI (13 risk genes) signature and KEGG TGF-β signaling pathway (86-gene signature) in TCGA STAD cohort. (B) Spearman’s correlation between NRGPI (13 risk genes) signature and KEGG WNT signaling pathway (151-gene signature) in TCGA STAD cohort. (C) Pearson’s correlation between individual NRGPI (n=13) and markers of TGF-β signaling pathway in TCGA STAD cohort. P values are shown as: *P < 0.05; **P < 0.01; ***P < 0.001. (B) Pearson’s correlation between individual NRGPI (n=13) and markers of WNT signaling pathway in TCGA STAD cohort. P values are shown as: *P < 0.05; **P < 0.01; ***P < 0.001.
Supplementary Figure 6 | Prediction of drug sensitivities of NRGPI-High and NRGPI-Low subgroups in TCGA cohort.
1. Sung H, Ferlay J, Siegel RL, Laversanne M, Soerjomataram I, Jemal A, et al. Global cancer statistics 2020: GLOBOCAN estimates of incidence and mortality worldwide for 36 cancers in 185 countries. CA Cancer J Clin (2021) 71(3):209–49. doi: 10.3322/caac.21660
2. Rugge M, Fassan M, Graham DY. Epidemiology of gastric cancer. Gastric Cancer (2015), 23–34. doi: 10.1007/978-3-319-15826-6_2
3. Sexton RE, Al Hallak MN, Diab M, Azmi AS. Gastric cancer: A comprehensive review of current and future treatment strategies. Cancer Metastasis Rev (2020) 39(4):1179–203. doi: 10.1007/s10555-020-09925-3
4. Hooi JKY, Lai WY, Ng WK, Suen MMY, Underwood FE, Tanyingoh D, et al. Global prevalence of helicobacter pylori infection: Systematic review and meta-analysis. Gastroenterology (2017) 153(2):420–9. doi: 10.1053/j.gastro.2017.04.022
5. Lee YC, Chiang TH, Chou CK, Tu YK, Liao WC, Wu MS, et al. Association between helicobacter pylori eradication and gastric cancer incidence: A systematic review and meta-analysis. Gastroenterology (2016) 150(5):1113–24.e5. doi: 10.1053/j.gastro.2016.01.028
6. Gong Y, Fan Z, Luo G, Yang C, Huang Q, Fan K, et al. The role of necroptosis in cancer biology and therapy. Mol Cancer (2019) 18(1):100. doi: 10.1186/s12943-019-1029-8
7. Najafov A, Chen H, Yuan J. Necroptosis and cancer. Trends Cancer (2017) 3(4):294–301. doi: 10.1016/j.trecan.2017.03.002
8. Philipp S, Sosna J, Adam D. Cancer and necroptosis: Friend or foe? Cell Mol Life Sci (2016) 73(11-12):2183–93. doi: 10.1007/s00018-016-2193-2
9. Moriwaki K, Bertin J, Gough PJ, Orlowski GM, Chan FK. Differential roles of RIPK1 and RIPK3 in TNF-induced necroptosis and chemotherapeutic agent-induced cell death. Cell Death Dis (2015) 6(2):e1636. doi: 10.1038/cddis.2015.16
10. Feng X, Song Q, Yu A, Tang H, Peng Z, Wang X. Receptor-interacting protein kinase 3 is a predictor of survival and plays a tumor suppressive role in colorectal cancer. Neoplasma (2015) 62(4):592–601. doi: 10.4149/neo_2015_071
11. Ando Y, Ohuchida K, Otsubo Y, Kibe S, Takesue S, Abe T, et al. Necroptosis in pancreatic cancer promotes cancer cell migration and invasion by release of CXCL5. PloS One (2020) 15(1):e0228015. doi: 10.1371/journal.pone.0228015
12. Geserick P, Wang J, Schilling R, Horn S, Harris PA, Bertin J, et al. Absence of RIPK3 predicts necroptosis resistance in malignant melanoma. Cell Death Dis (2015) 6(9):e1884. doi: 10.1038/cddis.2015.240
13. Schmidt SV, Seibert S, Walch-Rückheim B, Vicinus B, Kamionka EM, Pahne-Zeppenfeld J, et al. RIPK3 expression in cervical cancer cells is required for PolyIC-induced necroptosis, IL-1α release, and efficient paracrine dendritic cell activation. Oncotarget (2015) 6(11):8635–47. doi: 10.18632/oncotarget.3249
14. Koo G-B, Morgan MJ, Lee D-G, Kim W-J, Yoon J-H, Koo JS, et al. Methylation-dependent loss of RIP3 expression in cancer represses programmed necrosis in response to chemotherapeutics. Cell Res (2015) 25(6):707–25. doi: 10.1038/cr.2015.56
15. Melo-Lima S, Celeste Lopes M, Mollinedo F. Necroptosis is associated with low procaspase-8 and active RIPK1 and -3 in human glioma cells. Oncoscience (2014) 1(10):649–64. doi: 10.18632/oncoscience.89
16. Zhou J, Du X, Chen X, Wang J, Zhou N, Wu D, et al. Enzymatic self-assembly confers exceptionally strong synergism with NF-κB targeting for selective necroptosis of cancer cells. J Am Chem Soc (2018) 140(6):2301–8. doi: 10.1021/jacs.7b12368
17. Yatim N, Jusforgues-Saklani H, Orozco S, Schulz O, Barreira da Silva R, Reis e Sousa C, et al. RIPK1 and NF-κB signaling in dying cells determines cross-priming of CD8+ T cells. Science (2015) 350(6258):328–34. doi: 10.1126/science.aad0395
18. Choi ME, Price DR, Ryter SW, Choi AMK. Necroptosis: A crucial pathogenic mediator of human disease. JCI Insight (2019) 4(15):e128834. doi: 10.1172/jci.insight.128834
19. Chen J, Kos R, Garssen J, Redegeld F. Molecular insights into the mechanism of necroptosis: The necrosome as a potential therapeutic target. Cells (2019) 8(12):1486. doi: 10.3390/cells8121486
20. Galluzzi L, Vitale I, Aaronson SA, Abrams JM, Adam D, Agostinis P, et al. Molecular mechanisms of cell death: recommendations of the nomenclature committee on cell death 2018. Cell Death Differ (2018) 25(3):486–541. doi: 10.1038/s41418-017-0012-4
21. Grootjans S, Vanden Berghe T, Vandenabeele P. Initiation and execution mechanisms of necroptosis: an overview. Cell Death Differ (2017) 24(7):1184–95. doi: 10.1038/cdd.2017.65
22. Seo J, Nam YW, Kim S, Oh D-B, Song J. Necroptosis molecular mechanisms: Recent findings regarding novel necroptosis regulators. Exp Mol Med (2021) 53(6):1007–17. doi: 10.1038/s12276-021-00634-7
23. Najafov A, Mookhtiar AK, Luu HS, Ordureau A, Pan H, Amin PP, et al. TAM kinases promote necroptosis by regulating oligomerization of MLKL. Mol Cell (2019) 75(3):457–68.e4. doi: 10.1016/j.molcel.2019.05.022
24. Zhu K, Liang W, Ma Z, Xu D, Cao S, Lu X, et al. Necroptosis promotes cell-autonomous activation of proinflammatory cytokine gene expression. Cell Death Disease (2018) 9(5):500. doi: 10.1038/s41419-017-0073-9
25. McComb S, Cheung HH, Korneluk RG, Wang S, Krishnan L, Sad S. cIAP1 and cIAP2 limit macrophage necroptosis by inhibiting Rip1 and Rip3 activation. Cell Death Differ (2012) 19(11):1791–801. doi: 10.1038/cdd.2012.59
26. LaCasse EC, Mahoney DJ, Cheung HH, Plenchette S, Baird S, Korneluk RG. IAP-targeted therapies for cancer. Oncogene (2008) 27(48):6252–75. doi: 10.1038/onc.2008.302
27. Dovey CM, Diep J, Clarke BP, Hale AT, McNamara DE, Guo H, et al. MLKL requires the inositol phosphate code to execute necroptosis. Mol Cell (2018) 70(5):936–48.e7. doi: 10.1016/j.molcel.2018.05.010
28. McNamara DE, Dovey CM, Hale AT, Quarato G, Grace CR, Guibao CD, et al. Direct activation of human MLKL by a select repertoire of inositol phosphate metabolites. Cell Chem Biol (2019) 26(6):863–77.e7. doi: 10.1016/j.chembiol.2019.03.010
29. Roedig J, Kowald L, Juretschke T, Karlowitz R, Ahangarian Abhari B, Roedig H, et al. USP22 controls necroptosis by regulating receptor-interacting protein kinase 3 ubiquitination. EMBO Rep (2021) 22(2):e50163. doi: 10.15252/embr.202050163
30. Vandenabeele P, Declercq W, Van Herreweghe F, Vanden Berghe T. The role of the kinases RIP1 and RIP3 in TNF-induced necrosis. Sci Signal (2010) 3(115):re4. doi: 10.1126/scisignal.3115re4
31. Vercammen D, Brouckaert G, Denecker G, Van de Craen M, Declercq W, Fiers W, et al. Dual signaling of the fas receptor: Initiation of both apoptotic and necrotic cell death pathways. J Exp Med (1998) 188(5):919–30. doi: 10.1084/jem.188.5.919
32. Kaiser WJ, Sridharan H, Huang C, Mandal P, Upton JW, Gough PJ, et al. Toll-like receptor 3-mediated necrosis via TRIF, RIP3, and MLKL. J Biol Chem (2013) 288(43):31268–79. doi: 10.1074/jbc.M113.462341
33. He S, Liang Y, Shao F, Wang X. Toll-like receptors activate programmed necrosis in macrophages through a receptor-interacting kinase-3-mediated pathway. Proc Natl Acad Sci U States A (2011) 108(50):20054–9. doi: 10.1073/pnas.1116302108
34. Malireddi RKS, Kesavardhana S, Kanneganti T-D. ZBP1 and TAK1: Master regulators of NLRP3 Inflammasome/Pyroptosis, apoptosis, and necroptosis (PAN-optosis). Front Cell Infect Microbiol (2019) 9. doi: 10.3389/fcimb.2019.00406
35. Ciotti S, Iuliano L, Cefalù S, Comelli M, Mavelli I, Di Giorgio E, et al. GSK3β is a key regulator of the ROS-dependent necrotic death induced by the quinone DMNQ. Cell Death Disease (2020) 11(1):2. doi: 10.1038/s41419-019-2202-0
36. Li X, Gong W, Wang H, Li T, Attri KS, Lewis RE, et al. O-GlcNAc transferase suppresses inflammation and necroptosis by targeting receptor-interacting Serine/Threonine-protein kinase 3. Immunity (2019) 50(3):576–90.e6. doi: 10.1016/j.immuni.2019.01.007
37. Shi C-S, Kehrl JH. Bcl-2 regulates pyroptosis and necroptosis by targeting BH3-like domains in GSDMD and MLKL. Cell Death Discov (2019) 5(1):151. doi: 10.1038/s41420-019-0230-2
38. Zhong Y, Zhang ZH, Wang JY, Xing Y, Ri MH, Jin HL, et al. Zinc finger protein 91 mediates necroptosis by initiating RIPK1-RIPK3-MLKL signal transduction in response to TNF receptor 1 ligation. Toxicol Lett (2021) 356:75–88. doi: 10.1016/j.toxlet.2021.12.015
39. Li D, Xu T, Cao Y, Wang H, Li L, Chen S, et al. A cytosolic heat shock protein 90 and cochaperone CDC37 complex is required for RIP3 activation during necroptosis. Proc Natl Acad Sci (2015) 112(16):5017–22. doi: 10.1073/pnas.1505244112
40. Johnston AN, Ma Y, Liu H, Liu S, Hanna-Addams S, Chen S, et al. Necroptosis-blocking compound NBC1 targets heat shock protein 70 to inhibit MLKL polymerization and necroptosis. Proc Natl Acad Sci U S A (2020) 117(12):6521–30. doi: 10.1073/pnas.1916503117
41. Nakabayashi O, Takahashi H, Moriwaki K, Komazawa-Sakon S, Ohtake F, Murai S, et al. MIND bomb 2 prevents RIPK1 kinase activity-dependent and -independent apoptosis through ubiquitylation of cFLIPL. Commun Biol (2021) 4(1):80. doi: 10.1038/s42003-020-01603-y
42. Wang L, Chang X, Feng J, Yu J, Chen G. TRADD mediates RIPK1-independent necroptosis induced by tumor necrosis factor. Front Cell Dev Biol (2019) 7:393. doi: 10.3389/fcell.2019.00393
43. Kaiser WJ, Upton JW, Long AB, Livingston-Rosanoff D, Daley-Bauer LP, Hakem R, et al. RIP3 mediates the embryonic lethality of caspase-8-deficient mice. Nature (2011) 471(7338):368–72. doi: 10.1038/nature09857
44. Oberst A, Dillon CP, Weinlich R, McCormick LL, Fitzgerald P, Pop C, et al. Catalytic activity of the caspase-8-FLIP(L) complex inhibits RIPK3-dependent necrosis. Nature (2011) 471(7338):363–7. doi: 10.1038/nature09852
45. Lafont E, Draber P, Rieser E, Reichert M, Kupka S, de Miguel D, et al. TBK1 and IKKϵ prevent TNF-induced cell death by RIPK1 phosphorylation. Nat Cell Biol (2018) 20(12):1389–99. doi: 10.1038/s41556-018-0229-6
46. Seo J, Lee EW, Sung H, Seong D, Dondelinger Y, Shin J, et al. CHIP controls necroptosis through ubiquitylation- and lysosome-dependent degradation of RIPK3. Nat Cell Biol (2016) 18(3):291–302. doi: 10.1038/ncb3314
47. Onizawa M, Oshima S, Schulze-Topphoff U, Oses-Prieto JA, Lu T, Tavares R, et al. The ubiquitin-modifying enzyme A20 restricts ubiquitination of the kinase RIPK3 and protects cells from necroptosis. Nat Immunol (2015) 16(6):618–27. doi: 10.1038/ni.3172
48. Chen W, Wu J, Li L, Zhang Z, Ren J, Liang Y, et al. Ppm1b negatively regulates necroptosis through dephosphorylating Rip3. Nat Cell Biol (2015) 17(4):434–44. doi: 10.1038/ncb3120
49. Xie Y, Zhu S, Zhong M, Yang M, Sun X, Liu J, et al. Inhibition of aurora kinase a induces necroptosis in pancreatic carcinoma. Gastroenterology (2017) 153(5):1429–43.e5. doi: 10.1053/j.gastro.2017.07.036
50. Seo J, Seong D, Nam YW, Hwang CH, Lee SR, Lee C-S, et al. Beclin 1 functions as a negative modulator of MLKL oligomerisation by integrating into the necrosome complex. Cell Death Differ (2020) 27(11):3065–81. doi: 10.1038/s41418-020-0561-9
51. Hitomi J, Christofferson DE, Ng A, Yao J, Degterev A, Xavier RJ, et al. Identification of a molecular signaling network that regulates a cellular necrotic cell death pathway. Cell (2008) 135(7):1311–23. doi: 10.1016/j.cell.2008.10.044
52. Petersen SL, Chen TT, Lawrence DA, Marsters SA, Gonzalvez F, Ashkenazi A. TRAF2 is a biologically important necroptosis suppressor. Cell Death Differ (2015) 22(11):1846–57. doi: 10.1038/cdd.2015.35
53. Lou X, Zhu H, Ning L, Li C, Li S, Du H, et al. EZH2 regulates intestinal inflammation and necroptosis through the JNK signaling pathway in intestinal epithelial cells. Dig Dis Sci (2019) 64(12):3518–27. doi: 10.1007/s10620-019-05705-4
54. Karki R, Sundaram B, Sharma BR, Lee S, Malireddi RKS, Nguyen LN, et al. ADAR1 restricts ZBP1-mediated immune response and PANoptosis to promote tumorigenesis. Cell Rep (2021) 37(3):109858. doi: 10.1016/j.celrep.2021.109858
55. Xu D, Jin T, Zhu H, Chen H, Ofengeim D, Zou C, et al. TBK1 suppresses RIPK1-driven apoptosis and inflammation during development and in aging. Cell (2018) 174(6):1477–91.e19. doi: 10.1016/j.cell.2018.07.041
56. Dondelinger Y, Delanghe T, Rojas-Rivera D, Priem D, Delvaeye T, Bruggeman I, et al. MK2 phosphorylation of RIPK1 regulates TNF-mediated cell death. Nat Cell Biol (2017) 19(10):1237–47. doi: 10.1038/ncb3608
57. Cao K, Tait SWG. Parkin inhibits necroptosis to prevent cancer. Nat Cell Biol (2019) 21(8):915–6. doi: 10.1038/s41556-019-0350-1
58. Wang H, Meng H, Li X, Zhu K, Dong K, Mookhtiar AK, et al. PELI1 functions as a dual modulator of necroptosis and apoptosis by regulating ubiquitination of RIPK1 and mRNA levels of c-FLIP. Proc Natl Acad Sci (2017) 114(45):11944. doi: 10.1073/pnas.1715742114
59. Wilkerson MD, Hayes DN. ConsensusClusterPlus: A class discovery tool with confidence assessments and item tracking. Bioinformatics (2010) 26(12):1572–3. doi: 10.1093/bioinformatics/btq170
60. Ishwaran H, Gerds TA, Kogalur UB, Moore RD, Gange SJ, Lau BM. Random survival forests for competing risks. Biostatistics (2014) 15(4):757–73. doi: 10.1093/biostatistics/kxu010
61. Thorsson V, Gibbs DL, Brown SD, Wolf D, Bortone DS, Ou Yang TH, et al. The immune landscape of cancer. Immunity (2018) 48(4):812–30.e14. doi: 10.1016/j.immuni.2018.03.023
62. Li JH, Liu S, Zhou H, Qu LH, Yang JH. starBase v2.0: decoding miRNA-ceRNA, miRNA-ncRNA and protein-RNA interaction networks from large-scale CLIP-seq data. Nucleic Acids Res (2014) 42(Database issue):D92–7. doi: 10.1093/nar/gkt1248
63. Smoot ME, Ono K, Ruscheinski J, Wang PL, Ideker T. Cytoscape 2.8: New features for data integration and network visualization. Bioinformatics (2011) 27(3):431–2. doi: 10.1093/bioinformatics/btq675
64. Geeleher P, Cox N, Huang RS. pRRophetic: an r package for prediction of clinical chemotherapeutic response from tumor gene expression levels. PloS One (2014) 9(9):e107468. doi: 10.1371/journal.pone.0107468
65. Garnett MJ, Edelman EJ, Heidorn SJ, Greenman CD, Dastur A, Lau KW, et al. Systematic identification of genomic markers of drug sensitivity in cancer cells. Nature (2012) 483(7391):570–5. doi: 10.1038/nature11005
66. Feng X, Wang Z, Fillmore R, Xi Y. MiR-200, a new star miRNA in human cancer. Cancer Lett (2014) 344(2):166–73. doi: 10.1016/j.canlet.2013.11.004
67. Finnerty JR, Wang WX, Hébert SS, Wilfred BR, Mao G, Nelson PT. The miR-15/107 group of microRNA genes: evolutionary biology, cellular functions, and roles in human diseases. J Mol Biol (2010) 402(3):491–509. doi: 10.1016/j.jmb.2010.07.051
68. Büssing I, Slack FJ, Großhans H. Let-7 microRNAs in development, stem cells and cancer. Trends Mol Med (2008) 14(9):400–9. doi: 10.1016/j.molmed.2008.07.001
69. Cai Z, Zhang A, Choksi S, Li W, Li T, Zhang XM, et al. Activation of cell-surface proteases promotes necroptosis, inflammation and cell migration. Cell Res (2016) 26(8):886–900. doi: 10.1038/cr.2016.87
70. Hannes S, Abhari BA, Fulda S. Smac mimetic triggers necroptosis in pancreatic carcinoma cells when caspase activation is blocked. Cancer Lett (2016) 380(1):31–8. doi: 10.1016/j.canlet.2016.05.036
71. Wang X, Li T, Cheng Y, Wang P, Yuan W, Liu Q, et al. CYTL1 inhibits tumor metastasis with decreasing STAT3 phosphorylation. Oncoimmunology (2019) 8(5):e1577126–e. doi: 10.1080/2162402X.2019.1577126
72. Wang X, Li T, Wang W, Yuan W, Liu H, Cheng Y, et al. Cytokine-like 1 chemoattracts Monocytes/Macrophages via CCR2. J Immunol (2016) 196(10):4090–9. doi: 10.4049/jimmunol.1501908
73. Xue W, Li X, Li W, Wang Y, Jiang C, Zhou L, et al. Intracellular CYTL1, a novel tumor suppressor, stabilizes NDUFV1 to inhibit metabolic reprogramming in breast cancer. Signal Transduct Target Ther (2022) 7(1):35. doi: 10.1038/s41392-021-00856-1
74. Wen M, Wang H, Zhang X, Long J, Lv Z, Kong Q, et al. Cytokine-like 1 is involved in the growth and metastasis of neuroblastoma cells. Int J Oncol (2012) 41(4):1419–24. doi: 10.3892/ijo.2012.1552
75. Wang C, Huang Y, Zhang J, Fang Y. MiRNA-339-5p suppresses the malignant development of gastric cancer via targeting ALKBH1. Exp Mol Pathol (2020) 115:104449. doi: 10.1016/j.yexmp.2020.104449
76. Fujii M, Kanematsu T, Ishibashi H, Fukami K, Takenawa T, Nakayama KI, et al. Phospholipase c-related but catalytically inactive protein is required for insulin-induced cell surface expression of gamma-aminobutyric acid type a receptors. J Biol Chem (2010) 285(7):4837–46. doi: 10.1074/jbc.M109.070045
77. Matsuda M, Tsutsumi K, Kanematsu T, Fukami K, Terada Y, Takenawa T, et al. Involvement of phospholipase c-related inactive protein in the mouse reproductive system through the regulation of gonadotropin levels. Biol Reprod (2009) 81(4):681–9. doi: 10.1095/biolreprod.109.076760
78. Xiong Z, Xiao W, Bao L, Xiong W, Xiao H, Qu Y, et al. Tumor cell “Slimming” regulates tumor progression through PLCL1/UCP1-mediated lipid browning. Adv Sci (2019) 6(10):1801862. doi: 10.1002/advs.201801862
79. Ramirez-Ardila DE, Ruigrok-Ritstier K, Helmijr JC, Look MP, van Laere S, Dirix L, et al. LRG1 mRNA expression in breast cancer associates with PIK3CA genotype and with aromatase inhibitor therapy outcome. Mol Oncol (2016) 10(8):1363–73. doi: 10.1016/j.molonc.2016.07.004
80. Qin M, Liang Z, Qin H, Huo Y, Wu Q, Yang H, et al. Novel prognostic biomarkers in gastric cancer: CGB5, MKNK2, and PAPPA2. Front Oncol (2021) 11:683582–. doi: 10.3389/fonc.2021.683582
81. Brouillet S, Hoffmann P, Chauvet S, Salomon A, Chamboredon S, Sergent F, et al. Revisiting the role of hCG: new regulation of the angiogenic factor EG-VEGF and its receptors. Cell Mol Life Sci (2012) 69(9):1537–50. doi: 10.1007/s00018-011-0889-x
82. Schanz A, Lukosz M, Hess AP, Baston-Büst DM, Krüssel JS, Heiss C. hCG stimulates angiogenic signals in lymphatic endothelial and circulating angiogenic cells. J Reprod Immunol (2015) 110:102–8. doi: 10.1016/j.jri.2015.01.011
83. Szczerba A, Śliwa A, Kubiczak M, Nowak-Markwitz E, Jankowska A. Human chorionic gonadotropin β subunit affects the expression of apoptosis-regulating factors in ovarian cancer. Oncol Rep (2016) 35(1):538–45. doi: 10.3892/or.2015.4386
84. Yang Y, Shi Y, Hou Y, Lu Y, Yang J. CGB5 expression is independently associated with poor overall survival and recurrence-free survival in patients with advanced gastric cancer. Cancer Med (2018) 7(3):716–25. doi: 10.1002/cam4.1364
85. Kawamata F, Nishihara H, Homma S, Kato Y, Tsuda M, Konishi Y, et al. Chorionic gonadotropin-β modulates epithelial-mesenchymal transition in colorectal carcinoma metastasis. Am J Pathol (2018) 188(1):204–15. doi: 10.1016/j.ajpath.2017.08.034
86. Su JL, Yang PC, Shih JY, Yang CY, Wei LH, Hsieh CY, et al. The VEGF-C/Flt-4 axis promotes invasion and metastasis of cancer cells. Cancer Cell (2006) 9(3):209–23. doi: 10.1016/j.ccr.2006.02.018
87. Szász AM, Lánczky A, Nagy Á, Förster S, Hark K, Green JE, et al. Cross-validation of survival associated biomarkers in gastric cancer using transcriptomic data of 1,065 patients. Oncotarget (2016) 7(31):49322–33. doi: 10.18632/oncotarget.10337
88. Chen DH, Yu JW, Wu JG, Wang SL, Jiang BJ. Significances of contactin-1 expression in human gastric cancer and knockdown of contactin-1 expression inhibits invasion and metastasis of MKN45 gastric cancer cells. J Cancer Res Clin Oncol (2015) 141(12):2109–20. doi: 10.1007/s00432-015-1973-7
89. Liu P, Chen S, Wu W, Liu B, Shen W, Wang F, et al. Contactin-1 (CNTN-1) overexpression is correlated with advanced clinical stage and lymph node metastasis in oesophageal squamous cell carcinomas. Jpn J Clin Oncol (2012) 42(7):612–8. doi: 10.1093/jjco/hys066
90. Shi K, Xu D, Yang C, Wang L, Pan W, Zheng C, et al. Contactin 1 as a potential biomarker promotes cell proliferation and invasion in thyroid cancer. Int J Clin Exp Pathol (2015) 8(10):12473–81.
91. Li GY, Huang M, Pan TT, Jia WD. Expression and prognostic significance of contactin 1 in human hepatocellular carcinoma. Onco Targets Ther (2016) 9:387–94. doi: 10.2147/OTT.S97367
92. Wang B, Yang X, Zhao T, Du H, Wang T, Zhong S, et al. Upregulation of contactin-1 expression promotes prostate cancer progression. Oncol Lett (2020) 19(2):1611–8. doi: 10.3892/ol.2019.11244
93. Chen N, He S, Geng J, Song ZJ, Han PH, Qin J, et al. Overexpression of contactin 1 promotes growth, migration and invasion in Hs578T breast cancer cells. BMC Cell Biol (2018) 19(1):5. doi: 10.1186/s12860-018-0154-3
94. Zhang F, Wang H, Wang X, Jiang G, Liu H, Zhang G, et al. TGF-β induces M2-like macrophage polarization via SNAIL-mediated suppression of a pro-inflammatory phenotype. Oncotarget (2016) 7(32):52294–306. doi: 10.18632/oncotarget.10561
95. Zhu L, Fu X, Chen X, Han X, Dong P. M2 macrophages induce EMT through the TGF-β/Smad2 signaling pathway. Cell Biol Int (2017) 41(9):960–8. doi: 10.1002/cbin.10788
96. Zhang R, Yao W, Qian P, Li Y, Jiang C, Ao Z, et al. Increased sensitivity of human lung adenocarcinoma cells to cisplatin associated with downregulated contactin-1. BioMed Pharmacother (2015) 71:172–84. doi: 10.1016/j.biopha.2014.11.004
97. Schubert ML. Regulation of gastric acid secretion. Curr Opin Gastroenterol (1999) 15(6):457–62. doi: 10.1097/00001574-199911000-00002
98. Patel O, Shulkes A, Baldwin GS. Gastrin-releasing peptide and cancer. Biochim Biophys Acta (2006) 1766(1):23–41. doi: 10.1016/j.bbcan.2006.01.003
99. Ischia J, Patel O, Bolton D, Shulkes A, Baldwin GS. Expression and function of gastrin-releasing peptide (GRP) in normal and cancerous urological tissues. BJU Int (2014) 113 Suppl 2:40–7. doi: 10.1111/bju.12594
100. Martínez A, Zudaire E, Julián M, Moody TW, Cuttitta F. Gastrin-releasing peptide (GRP) induces angiogenesis and the specific GRP blocker 77427 inhibits tumor growth in vitro and in vivo. Oncogene (2005) 24(25):4106–13. doi: 10.1038/sj.onc.1208581
101. Faviana P, Boldrini L, Erba PA, Di Stefano I, Manassero F, Bartoletti R, et al. Gastrin-releasing peptide receptor in low grade prostate cancer: Can it be a better predictor than prostate-specific membrane antigen? Front Oncol (2021) 11. doi: 10.3389/fonc.2021.650249
102. Jankovic-Karasoulos T, Bianco-Miotto T, Butler MS, Butler LM, McNeil CM, O’Toole SA, et al. Elevated levels of tumour apolipoprotein d independently predict poor outcome in breast cancer patients. Histopathology (2020) 76(7):976–87. doi: 10.1111/his.14081
103. Yu J, Zhang Q, Wang M, Liang S, Huang H, Xie L, et al. Comprehensive analysis of tumor mutation burden and immune microenvironment in gastric cancer. Biosci Rep (2021) 41(2):BSR20203336. doi: 10.1042/BSR20203336
104. Guo X, Liang X, Wang Y, Cheng A, Zhang H, Qin C, et al. Significance of tumor mutation burden combined with immune infiltrates in the progression and prognosis of advanced gastric cancer. Front Genet (2021) 12:642608–. doi: 10.3389/fgene.2021.642608
105. Huo J, Wu L, Zang Y. Construction and validation of a universal applicable prognostic signature for gastric cancer based on seven immune-related gene correlated with tumor associated macrophages. Front Oncol (2021) 11:635324–. doi: 10.3389/fonc.2021.635324
106. Lalmanach G, Kasabova-Arjomand M, Lecaille F, Saidi A. Cystatin M/E (Cystatin 6): A janus-faced cysteine protease inhibitor with both tumor-suppressing and tumor-promoting functions. Cancers (Basel) (2021) 13(8):1877. doi: 10.3390/cancers13081877
107. Chen X, Cao X, Dong W, Xia M, Luo S, Fan Q, et al. Cystatin m expression is reduced in gastric carcinoma and is associated with promoter hypermethylation. Biochem Biophys Res Commun (2010) 391(1):1070–4. doi: 10.1016/j.bbrc.2009.12.022
108. Zeng Z, Xie D, Gong J. Genome-wide identification of CpG island methylator phenotype related gene signature as a novel prognostic biomarker of gastric cancer. PeerJ (2020) 8:e9624. doi: 10.7717/peerj.9624
109. Chang C, Worley BL, Phaëton R, Hempel N. Extracellular glutathione peroxidase GPx3 and its role in cancer. Cancers (Basel) (2020) 12(8):2197. doi: 10.3390/cancers12082197
110. Cai M, Sikong Y, Wang Q, Zhu S, Pang F, Cui X. Gpx3 prevents migration and invasion in gastric cancer by targeting NFкB/Wnt5a/JNK signaling. Int J Clin Exp Pathol (2019) 12(4):1194–203.
111. Świerzko AS, Michalski M, Sokołowska A, Nowicki M, Szala-Poździej A, Eppa Ł, et al. Associations of ficolins with hematological malignancies in patients receiving high-dose chemotherapy and autologous hematopoietic stem cell transplantations. Front Immunol (2020) 10. doi: 10.3389/fimmu.2019.03097
112. Li S, Wei X, He J, Tian X, Yuan S, Sun L. Plasminogen activator inhibitor-1 in cancer research. Biomed Pharmacother (2018) 105:83–94. doi: 10.1016/j.biopha.2018.05.119
113. Seker F, Cingoz A, Sur-Erdem İ, Erguder N, Erkent A, Uyulur F, et al. Identification of SERPINE1 as a regulator of glioblastoma cell dispersal with transcriptome profiling. Cancers (Basel) (2019) 11(11):1651. doi: 10.3390/cancers11111651
114. Yang JD, Ma L, Zhu Z. SERPINE1 as a cancer-promoting gene in gastric adenocarcinoma: facilitates tumour cell proliferation, migration, and invasion by regulating EMT. J Chemother (2019) 31(7-8):408–18. doi: 10.1080/1120009X.2019.1687996
115. Huang X, Zhang F, He D, Ji X, Gao J, Liu W, et al. Immune-related gene SERPINE1 is a novel biomarker for diffuse lower-grade gliomas via Large-scale analysis. Front Oncol (2021) 11. doi: 10.3389/fonc.2021.646060
116. Sakamoto H, Koma Y-I, Higashino N, Kodama T, Tanigawa K, Shimizu M, et al. PAI-1 derived from cancer-associated fibroblasts in esophageal squamous cell carcinoma promotes the invasion of cancer cells and the migration of macrophages. Lab Invest (2021) 101(3):353–68. doi: 10.1038/s41374-020-00512-2
117. Kawarada Y, Inoue Y, Kawasaki F, Fukuura K, Sato K, Tanaka T, et al. TGF-β induces p53/Smads complex formation in the PAI-1 promoter to activate transcription. Sci Rep (2016) 6(1):35483. doi: 10.1038/srep35483
118. Zheng P, Liu X, Li H, Gao L, Yu Y, Wang N, et al. EFNA3 is a prognostic biomarker correlated with immune cell infiltration and immune checkpoints in gastric cancer. Front Genet (2022) 12. doi: 10.3389/fgene.2021.796592
119. Yu S, Hu C, Cai L, Du X, Lin F, Yu Q, et al. Seven-gene signature based on glycolysis is closely related to the prognosis and tumor immune infiltration of patients with gastric cancer. Front Oncol (2020) 10:1778. doi: 10.3389/fonc.2020.01778
120. Pei JP, Zhang CD, Yusupu M, Zhang C, Dai DQ. Screening and validation of the hypoxia-related signature of evaluating tumor immune microenvironment and predicting prognosis in gastric cancer. Front Immunol (2021) 12:705511. doi: 10.3389/fimmu.2021.705511
121. Wang Z, Liu Z, Liu B, Liu G, Wu S. Dissecting the roles of ephrin-A3 in malignant peripheral nerve sheath tumor by TALENs. Oncol Rep (2015) 34(1):391–8. doi: 10.3892/or.2015.3966
122. Chen HZ, Tsai SY, Leone G. Emerging roles of E2Fs in cancer: an exit from cell cycle control. Nat Rev Cancer (2009) 9(11):785–97. doi: 10.1038/nrc2696
123. Lavia P, Jansen-Dürr P. E2F target genes and cell-cycle checkpoint control. Bioessays (1999) 21(3):221–30. doi: 10.1002/(SICI)1521-1878(199903)21:3<221::AID-BIES6>3.0.CO;2-J
124. Wang H, Zhang X, Liu Y, Ni Z, Lin Y, Duan Z, et al. Downregulated miR-31 level associates with poor prognosis of gastric cancer and its restoration suppresses tumor cell malignant phenotypes by inhibiting E2F2. Oncotarget (2016) 7(24):36577–36589. doi: 10.18632/oncotarget.9288
125. Aran D, Lasry A, Zinger A, Biton M, Pikarsky E, Hellman A, et al. Widespread parainflammation in human cancer. Genome Biol (2016) 17(1):145. doi: 10.1186/s13059-016-0995-z
126. Medzhitov R. Origin and physiological roles of inflammation. Nature (2008) 454(7203):428–35. doi: 10.1038/nature07201
127. Shang B, Liu Y, Jiang SJ, Liu Y. Prognostic value of tumor-infiltrating FoxP3+ regulatory T cells in cancers: A systematic review and meta-analysis. Sci Rep (2015) 5:15179. doi: 10.1038/srep15179
128. Gambardella V, Castillo J, Tarazona N, Gimeno-Valiente F, Martínez-Ciarpaglini C, Cabeza-Segura M, et al. The role of tumor-associated macrophages in gastric cancer development and their potential as a therapeutic target. Cancer Treat Rev (2020) 86:102015. doi: 10.1016/j.ctrv.2020.102015
129. Davidsson S, Fiorentino M, Giunchi F, Eriksson M, Erlandsson A, Sundqvist P, et al. Infiltration of M2 macrophages and regulatory T cells plays a role in recurrence of renal cell carcinoma. Eur Urol Open Sci (2020) 20:62–71. doi: 10.1016/j.euros.2020.06.003
130. Chen YP, Wang YQ, Lv JW, Li YQ, Chua MLK, Le QT, et al. Identification and validation of novel microenvironment-based immune molecular subgroups of head and neck squamous cell carcinoma: Implications for immunotherapy. Ann Oncol (2019) 30(1):68–75. doi: 10.1093/annonc/mdy470
131. Knochelmann HM, Dwyer CJ, Bailey SR, Amaya SM, Elston DM, Mazza-McCrann JM, et al. When worlds collide: Th17 and treg cells in cancer and autoimmunity. Cell Mol Immunol (2018) 15(5):458–69. doi: 10.1038/s41423-018-0004-4
Keywords: programmed cell death, tumor microenvironment, molecular targeted therapy, immunotherapy, cancer prognosis
Citation: Khan M, Lin J, Wang B, Chen C, Huang Z, Tian Y, Yuan Y and Bu J (2022) A novel necroptosis-related gene index for predicting prognosis and a cold tumor immune microenvironment in stomach adenocarcinoma. Front. Immunol. 13:968165. doi: 10.3389/fimmu.2022.968165
Received: 13 June 2022; Accepted: 05 October 2022;
Published: 27 October 2022.
Edited by:
Kui Zhang, The University of Chicago, United StatesReviewed by:
Runchen Zhao, Merck, United StatesCopyright © 2022 Khan, Lin, Wang, Chen, Huang, Tian, Yuan and Bu. This is an open-access article distributed under the terms of the Creative Commons Attribution License (CC BY). The use, distribution or reproduction in other forums is permitted, provided the original author(s) and the copyright owner(s) are credited and that the original publication in this journal is cited, in accordance with accepted academic practice. No use, distribution or reproduction is permitted which does not comply with these terms.
*Correspondence: Junguo Bu, YnVqZ0BnZDJoLm9yZy5jbg==; Yawei Yuan, eXVhbnlhd2VpQGd6aG11LmVkdS5jbg==
Disclaimer: All claims expressed in this article are solely those of the authors and do not necessarily represent those of their affiliated organizations, or those of the publisher, the editors and the reviewers. Any product that may be evaluated in this article or claim that may be made by its manufacturer is not guaranteed or endorsed by the publisher.
Research integrity at Frontiers
Learn more about the work of our research integrity team to safeguard the quality of each article we publish.