
95% of researchers rate our articles as excellent or good
Learn more about the work of our research integrity team to safeguard the quality of each article we publish.
Find out more
ORIGINAL RESEARCH article
Front. Immunol. , 28 September 2022
Sec. Immunological Tolerance and Regulation
Volume 13 - 2022 | https://doi.org/10.3389/fimmu.2022.965905
This article is part of the Research Topic Soluble Immune Checkpoints: Novel Physiological Immunomodulators View all 6 articles
 Alicia Landeira-Viñuela1
 Carlota Arias-Hidalgo1
 Pablo Juanes-Velasco1
 Miguel Alcoceba2
 Almudena Navarro-Bailón2
 Carlos Eduardo Pedreira3
 Quentin Lecrevisse1
 Laura Díaz-Muñoz1José Manuel Sánchez-Santos4
 Ángela-Patricia Hernández1,5
 Marina L. García-Vaquero1
 Rafael Góngora1
 Javier De Las Rivas6Marcos González2
 Alberto Orfao1
 Manuel Fuentes1,7*
Chronic lymphocytic leukemia (CLL) is a lymphoid neoplasm characterized by the accumulation of mature B cells. The diagnosis is established by the detection of monoclonal B lymphocytes in peripheral blood, even in early stages [monoclonal B-cell lymphocytosis (MBLhi)], and its clinical course is highly heterogeneous. In fact, there are well-characterized multiple prognostic factors that are also related to the observed genetic heterogenicity, such as immunoglobulin heavy chain variable region (IGHV) mutational status, del17p, and TP53 mutations, among others. Moreover, a dysregulation of the immune system (innate and adaptive immunity) has been observed in CLL patients, with strong impact on immune surveillance and consequently on the onset, evolution, and therapy response. In addition, the tumor microenvironment is highly complex and heterogeneous (i.e., matrix, fibroblast, endothelial cells, and immune cells), playing a critical role in the evolution of CLL. In this study, a quantitative profile of 103 proteins (cytokines, chemokines, growth/regulatory factors, immune checkpoints, and soluble receptors) in 67 serum samples (57 CLL and 10 MBLhi) has been systematically evaluated. Also, differential profiles of soluble immune factors that discriminate between MBLhi and CLL (sCD47, sCD27, sTIMD-4, sIL-2R, and sULBP-1), disease progression (sCD48, sCD27, sArginase-1, sLAG-3, IL-4, and sIL-2R), or among profiles correlated with other prognostic factors, such as IGHV mutational status (CXCL11/I-TAC, CXCL10/IP-10, sHEVM, and sLAG-3), were deciphered. These results pave the way to explore the role of soluble immune checkpoints as a promising source of biomarkers in CLL, to provide novel insights into the immune suppression process and/or dysfunction, mostly on T cells, in combination with cellular balance disruption and microenvironment polarization leading to tumor escape.
Chronic lymphocytic leukemia (CLL) is one of the most common leukemias in Western countries in adulthood (1). It is characterized by a progressive accumulation of mature B cells of the following phenotypes: CD5+, CD19+, and CD23+. These cells show low levels of surface immunoglobulins (Ig M and Ig D) and clonal expansion in peripheral and secondary lymphoid organs and bone marrow, which are immunologically incompetent (1–3).
Diagnosis of the disease is established by the detection of monoclonal B lymphocytes (B cells) in peripheral blood (≥5 × 10⁹/L), where there is a precursor stage, termed monoclonal B-cell lymphocytosis (MBLhi), in which there is a detection of <5 × 10⁹/L clonal B cells with CLL phenotype and absence of CLL-related signs or symptoms (4). The clinical course of CLL is highly heterogeneous; in fact, some patients have stable disease without any treatment, while other patients are suffering from an aggressive form, with relapses or transformations (Richter transformation—a type of non-Hodgkin lymphoma called fast-growing diffuse large B-cell lymphoma), and who need early treatment (5, 6). Relevant prognostic biomarkers for CLL include age, immunoglobulin heavy chain variable region mutational status (IGHV—mutated or unmutated), cytogenetic profiles (del17p, del11q, trisomy 12, or del13q) and gene mutations (TP53, NOTCH1, SF3B1, ATM, and MYD88, among others). Among all of them, the following biomarkers are associated with good prognosis: age (<65 years), mutated IGHV, del13q, and mutated MYD88. On the other hand, the following are associated with poor prognosis: unmutated IGHV, del17p, del11q, mutations on NOCTH1, SF3B1,TP53, and ATM. Currently, the therapeutic algorithm used to establish the type of treatment is based on IGHV mutational status, TP53 mutations, and del17p as key prognostic biomarkers (7, 8).
CLL is characterized by a strong correlation with an intense alteration of the immune system (innate and adaptive response) with a strong impact on immune surveillance, which is interconnected and highly relevant in onset, evolution and therapeutic response it has been reported altered immunological functions (1, 9). In this regard, multiple studies have analysed the role of T-cells (Th1, Th2 and Tregs), nurse-like cells, dendritic cells, or bone marrow stromal cells in tumor immune surveillance and tumor pathogenesis (2, 10).
Many alterations in the balance of immunomodulators and soluble immune factors could support the growth of the leukemic clone. Some biomolecules (i.e., cytokines, chemokines, and immune checkpoints) have been reported to affect the life of B-CLL cells in vivo, by both stimulation of growth and defense against programmed cell death (1, 10, 11).
Also, the importance of the tumor microenvironment (TME) in the immune suppression and CLL development is becoming more relevant (12). It has been observed that B-CLL cells when cultured in vivo, without the presence of other cell types, exhibit spontaneous death; this action is inhibited when cytokines and accessory cells are presented. This confirms the complexity of the intercellular and intermolecular interactions to which these tumor cells are exposed (1, 4, 7). These include microenvironmental compartments (lymph nodes and bone marrow) where B-CLL cells receive proliferative and survival signals. In these niches, B-CLL cells establish close and intimate interactions with the matrix and multiple cell types (i.e., fibroblasts, immune response cells, and endothelial cells), generating a bidirectional network that ensures contact through effector molecules that can be expressed or secreted (adhesion molecules, cell surface ligands, chemokines, cytokines, and receptors, among others). This leads to the manipulation and alteration of cytokine balance of the microenvironment by B-CLL cells, enabling disease development and progression, as well as drug resistance (2, 4, 5, 7, 10, 13).
Moreover, B-CLL cells acquire the capacity to evade the immune response, taking advantage of immune checkpoint pathways due to increased levels of inhibitory proteins such as PD-1, PD-L1, CTLA-4, TIM-3, LAG-3, and CD47, and are responsible for modulating the activity of T and NK cells by playing a negative role in their activation. In addition, the B-CLL cells themselves act as antigen-presenting cells, but in this case, they reduce the surface expression of HLA molecules, which allows them to be weakly immunogenic (12, 14, 15). Also, several studies report that B-CLL cells express signals to inhibit phagocytosis capacity of the macrophages. In fact, high levels of antiphagocytic molecules like PD-L1, major histocompatibility complex I (MHC-I), CD24, and CD47 allow the inhibition of macrophage action and the breaking of immune homeostasis, which leads to the persistence of tumoral cells (16, 17).
Currently, it is well-known that immune checkpoints have non-redundant functions, although the same checkpoint is susceptible to several ligands. Hence, depending on the type of binding, it can have positive or negative regulation on the lymphocytes (15, 18). In addition to immune checkpoints, it is important to consider the co-existence with cytokines, which can have a pleiotropic effect and redundancy of functions (15, 19). Bearing this in mind, in this study, 103 proteins’ soluble isoforms (cytokines, chemokines, growth/regulatory factors, immune checkpoints, and soluble receptors) in plasma from CLL patients were simultaneously analyzed at different stages of the disease and at the pre-stage (MBLhi) to decipher profiles related to TME, immune dysfunction, and disease prognosis.
Sixty-seven plasma samples from 57 CLL diagnostic adults and 10 MBLhi diagnostic adults were collected between May 2018 and October 2020 (29 women and 38 men, median age of 70 years, ranging from 36 to 91 years) (Table 1 and Supplementary Table 1). The diagnosis was made according to the National CLL Guidelines of the Spanish CLL Group (GELLC) based on the International Workshop on Chronic Lymphocytic Leukemia (iwCLL) (20). Staging was performed according to Binet and Rai criteria (21, 22). Informed consent was given by each individual before entering the study, and approved by the local ethics committee of the University Hospital of Salamanca (HUS, Salamanca, Spain). In all cases, peripheral blood (PB) samples (10 ml/case) were obtained in EDTA-coated tubes. Immediately after collection, PB samples were centrifuged to 800 g for 10 min at RT, and the plasma was stored at −80°C until analysis.
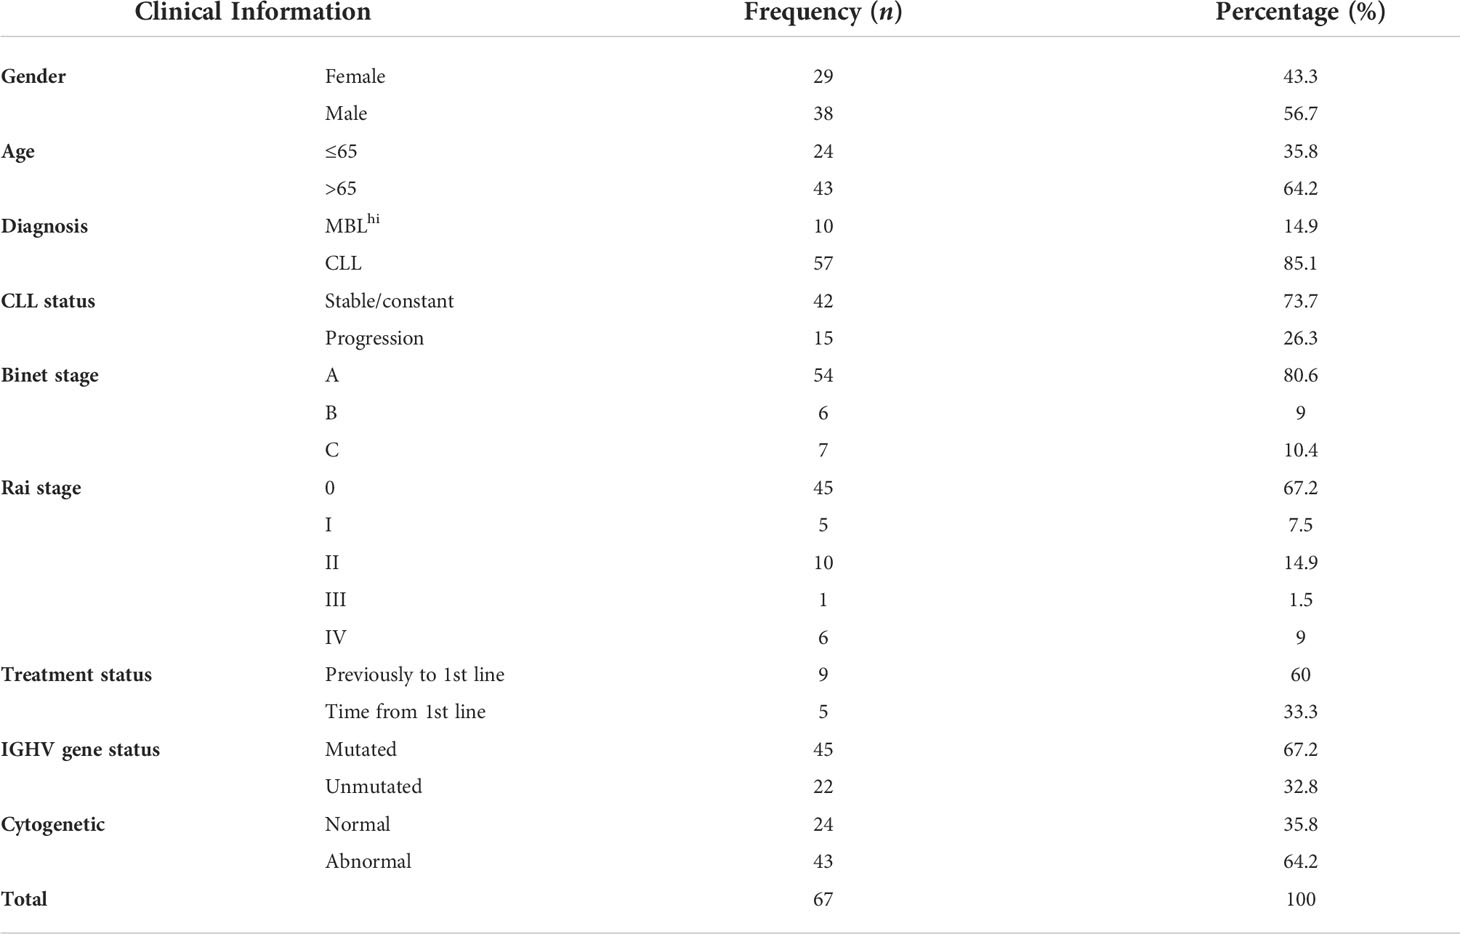
Table 1 Clinical and biological characteristics of patient cohort.
One milliliter of each plasma sample was defrosted on ice and centrifuged for 5 min to 2000 g. One hundred microliters of each sample was aliquoted into 96-well polypropylene PCR microplates (Axygen, EE.UU.). Aliquots in 96-well plates were stored at −80°C until use.
In this study, all serum samples have been analyzed by use of Luminex technology. All Luminex kits (Luminex Inc, EE.UU.) used for this study are described in detail in Table 2.
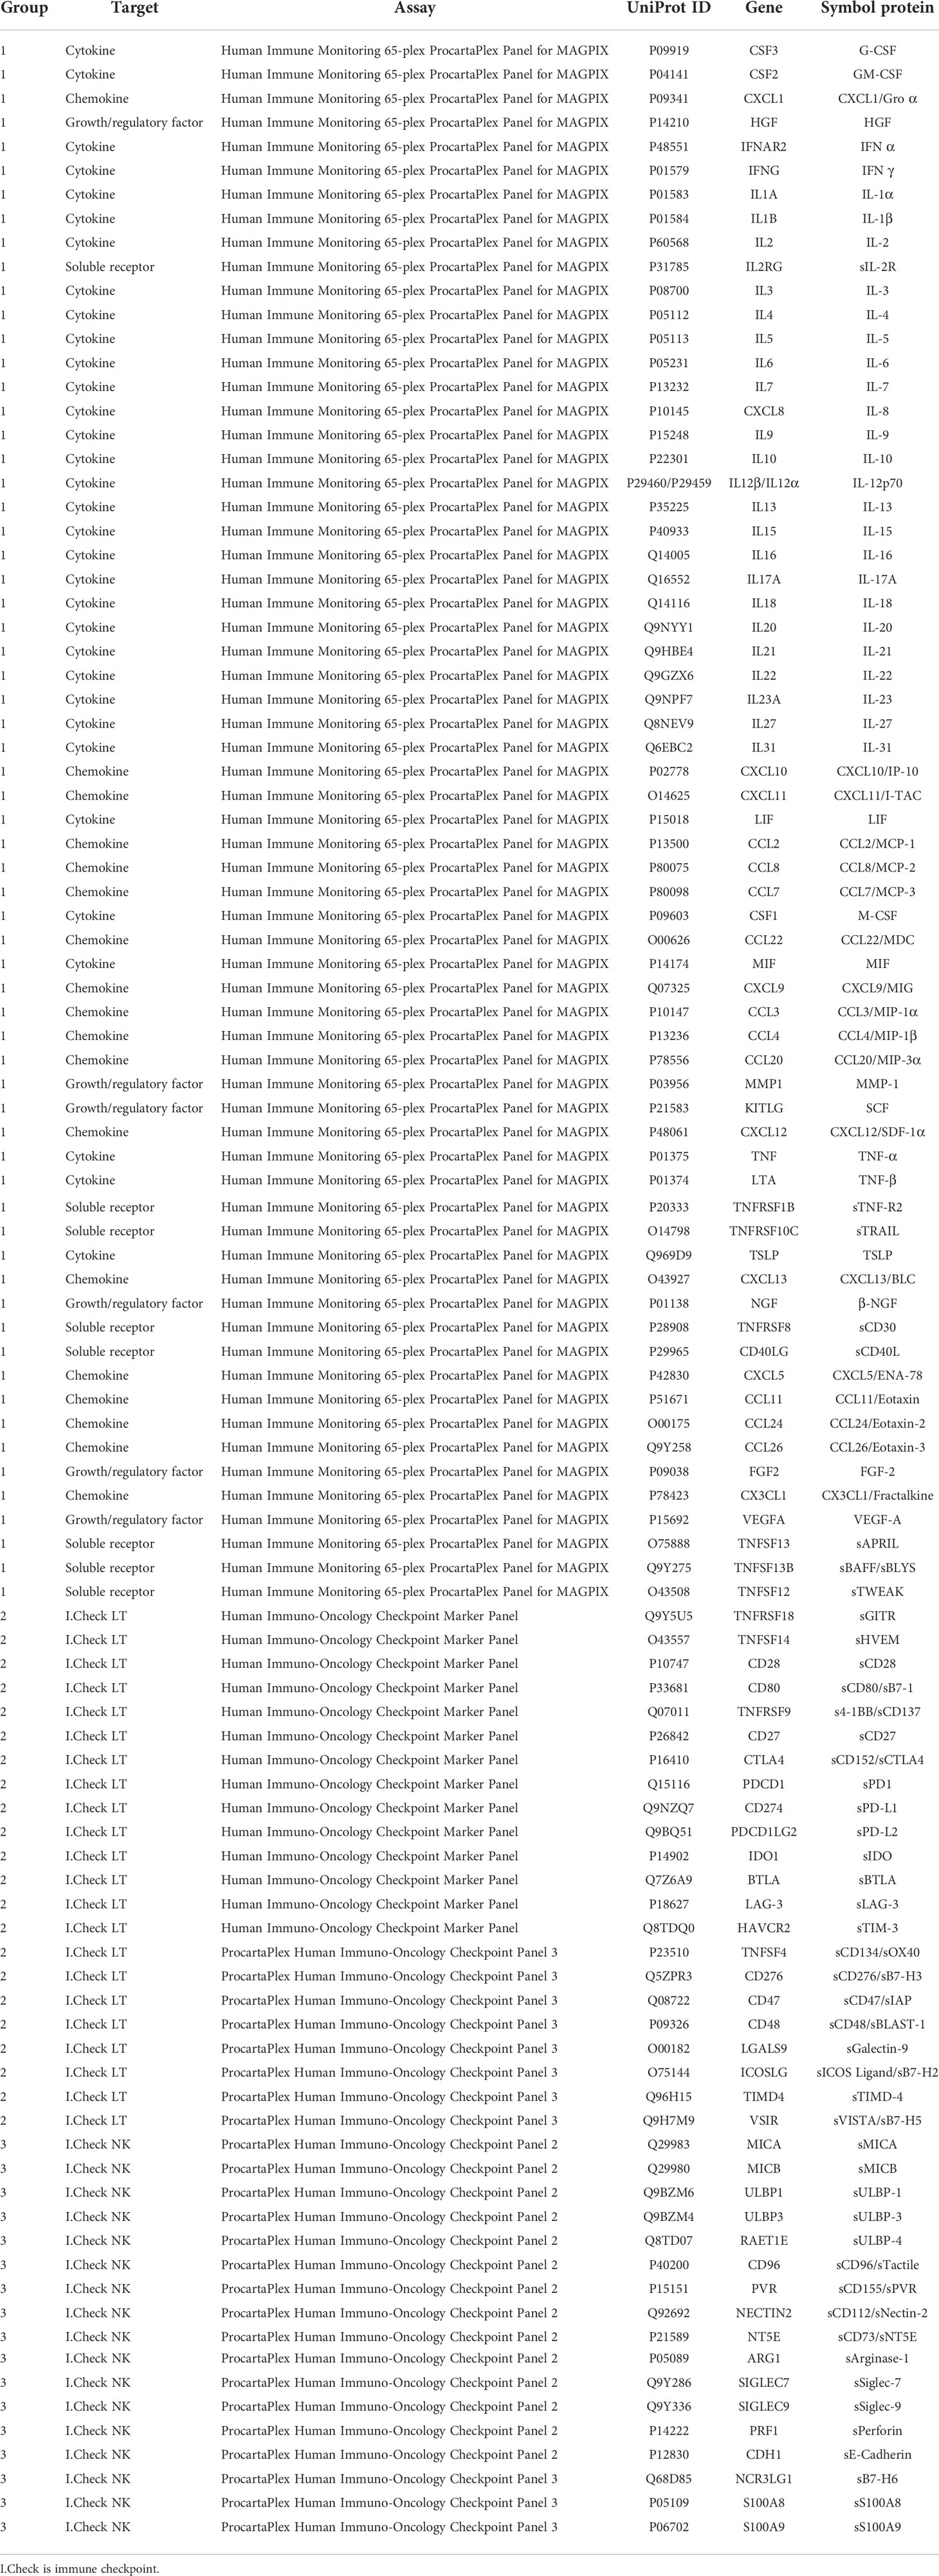
Table 2 List of soluble immune factors in the study.
The Luminex system used microspheres or a bead set marker with different ratios of two different fluorophores, conjugated with monoclonal antibodies specific for different cytokines, chemokines, immune checkpoints, growth/regulatory factors, and soluble receptors. In the assay, once the protein of interest is bound, it is incubated with a secondary detection antibody specific for the molecule of interest. The color-coded beads are read on a MAGPIX® system (Luminex Corporation, EE.UU.), which has two lasers, one that can identify the bead, and thus the protein of interest, and one that can detect the quantity of the detection agent on the bead, and thus the quantity of the soluble protein of interest (i.e., cytokine, chemokine, and soluble immune checkpoints). In all the analysis, the MAGPIX® reproducibility has been evaluated by calibration and verification reagents as described by the manufactures (MPXIVD-CAL-K25 and MPXIVD-PVER-K25, respectively). In addition, a standard curve has been added to the plate in duplicate for each experiment. Following the generation of a five-parameter logistic curve, the standard recovery was calculated using the following equation: (observed concentration/expected concentration) × 100. A recovery range between 70% and 130% is recommended by the manufacturer. Any sample that fell on an area of the curve that was outside these ranges was not considered accurate. A positive sample is considered if it was above the limits of detection as determined by the manufacturer descriptions.
Here, the Luminex kit used is “Human Monitoring 65-plex” ProcartaPlex Panel for MAGPIX® (EPX650-16500-091). All the serum samples were incubated in a 96-well Solid Polystyrene Microplate (Corning®, EE.UU.), and during the washing process, a magnetic 96-well separator (Thermo Fisher Scientific, EE.UU.) was used following the manufacturer’s instructions. The acquisition was performed on MAGPIX® Instrument and xMAP® component software v. 4.2. All experiments were performed by the same operator according to the manufacturer’s instructions.
These studies were performed with the following Luminex kits according to the manufacturer’s instructions: Human Immuno-Oncology Checkpoint marker Panel 1 (EPX14A-15803-901), Human Immuno-Oncology Checkpoint marker Panel 2 (EPX140-15815-901), and Human Immuno-Oncology Checkpoint marker Panel 3 (EPX-100-1582-901). All the serum samples were incubated in a 96-well Solid Polystyrene Microplate (Corning®, EE.UU.), and during the washing process, a magnetic 96-well separator (Thermo Fisher Scientific, EE.UU.) was used following the manufacturer’s instructions. The acquisition was performed on MAGPIX® Instrument and xMAP® component software v. 4.2. All experiments were performed by the same operator according to the manufacturer’s instructions.
For each protein (contained in Table 2), the concentration (pg/ml) was determined by a five-parameter logistic (5PL) curve-fitting algorithm, which was used for concentration data and whose equation is as follows:
where a, b, c, d, and f are constant coefficients, y is the net median fluorescence intensity, and x is the concentration in pg/ml. In all cases, xPONENT® software for Luminex instrumentation was used for data analysis.
For values lower than the limit of detection, the same methodology as Dong et al. (23) was used. Values below the limit of detection were substituted by the 10% of the minimum value for each analyte. All concentration values (pg/ml) were converted to log10 for further analysis.
For statistical analysis, the samples were pooled according to the clinical characteristics of the patients (Figure 1).
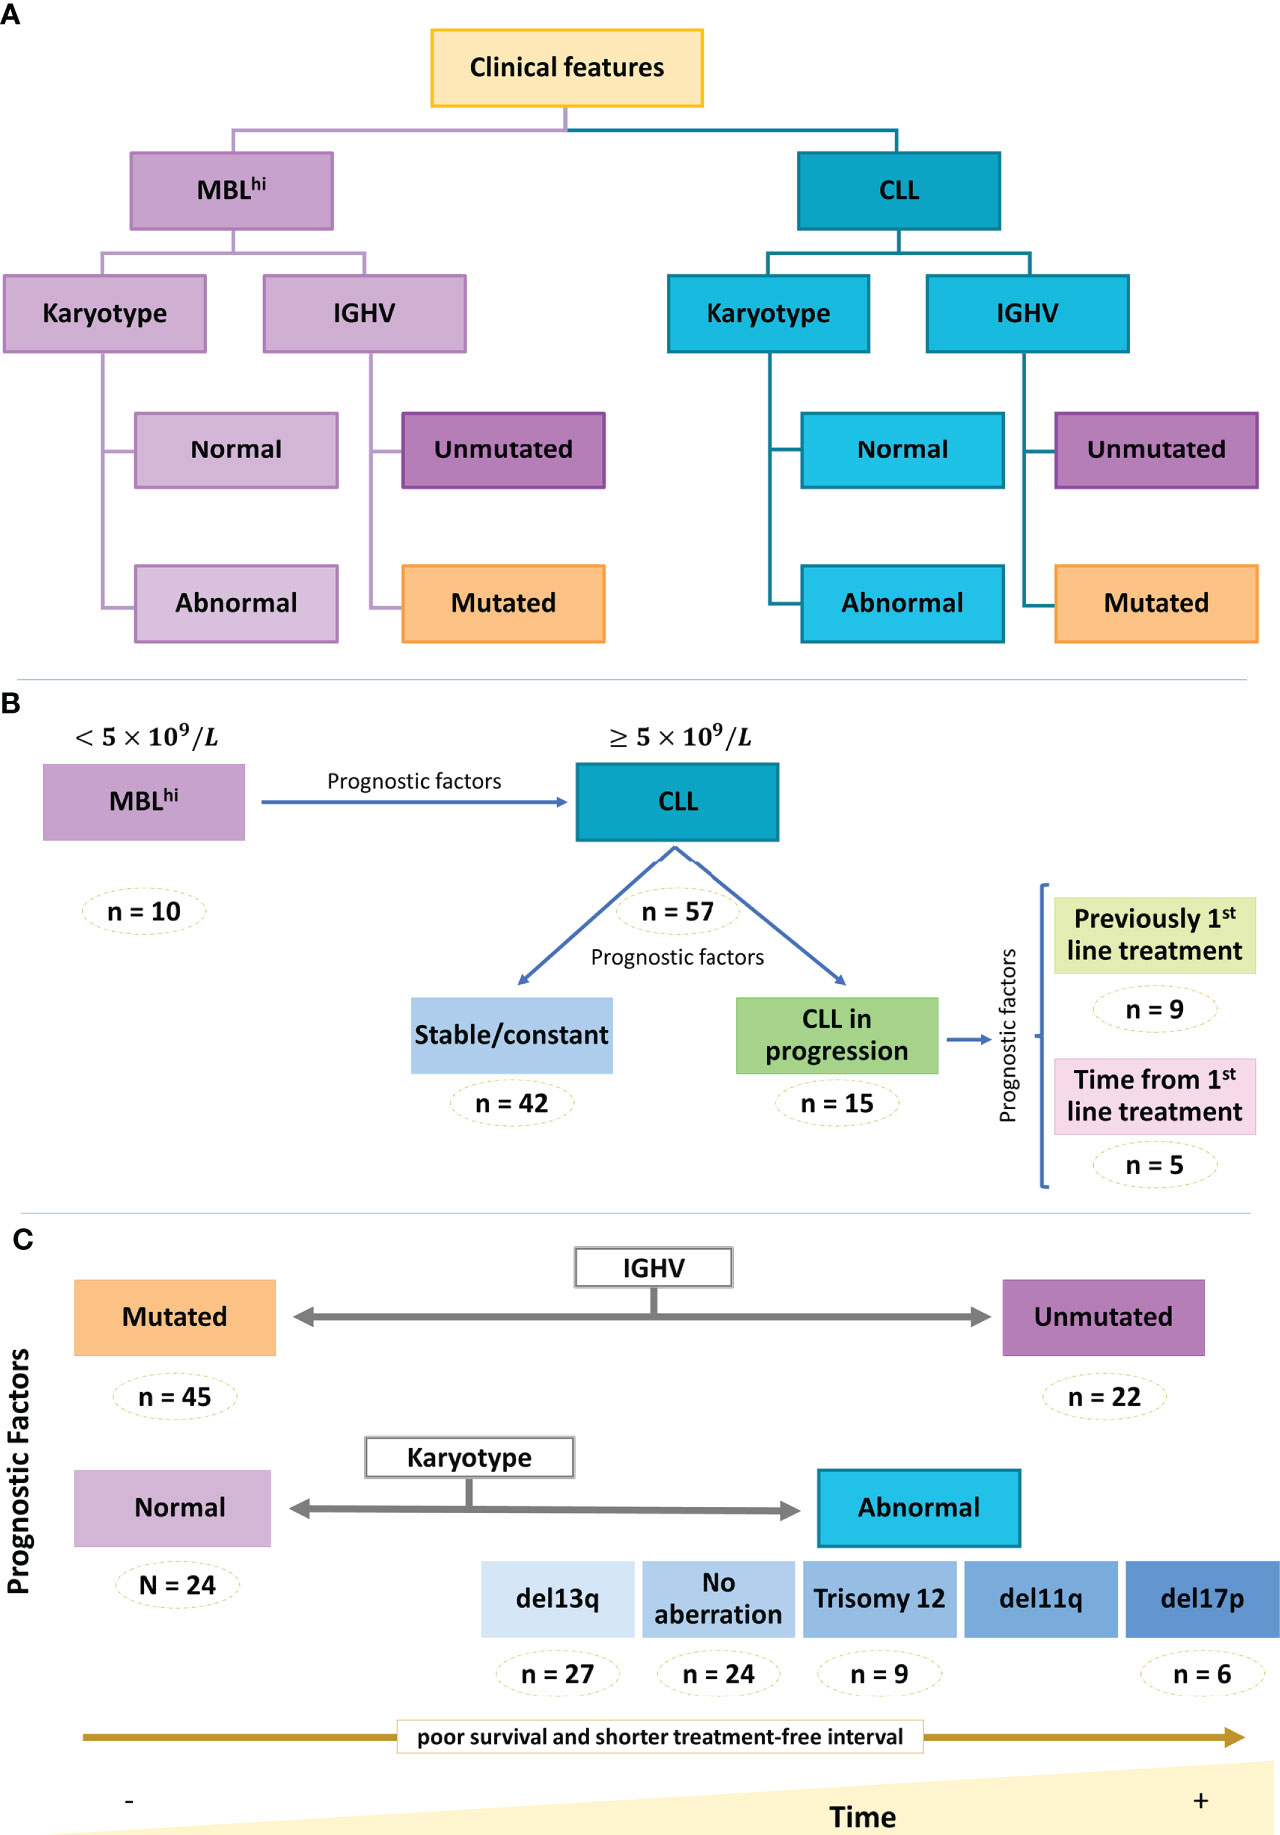
Figure 1 Clinical and biological info of the cohort. Schematic representation of cohort main features. (A) Diagnosis. (B) Distribution of diagnosis group. (C) Main prognostic factors.
The conventional statistical analyses were made with the software R v. 4.1 under RStudio v. 2022.02.0. The normality of the data was studied with the Shapiro–Wilk normality test. Due to the absence of normality of some variables, the correlation between the proteins was carried out using Spearman’s correlation. The homoscedasticity between categories of factor variables was verified with the Fligner–Killeen test and the Bartlett test. According to whether the variables were normal, heteroscedastic, or their possible combinations, the search for significant differences between categories was done with the t-test or Wilcoxon–Mann–Whitney test (for two categories) and ANOVA or Kruskal–Wallis (for more than two categories). The post-hoc tests used were Tukey, t-test, or Wilcoxon depending on the corresponding global test of significant differences. A significance level of 5% was used in all statistical tests (Supplementary Figure 1).
In addition, a linear model (based on the limma statistical framework) including the six major covariates (diagnosis, disease status, treatment, IGHV mutational status, age, and sex) was generated to analyze significant differences in protein abundance between the 67 analyzed samples (design matrix: ~ 0 + groups + IGHV mutational status+ age + sex, soluble protein) (24). Pairwise comparisons (MBL vs. CLL; c-CLL vs. p-CLL; c-CLL vs. CLL-PFT; c-CLL vs. CLL-TFT) returned 88, 84, and 64 proteins with significant differences at least in contrast [adjusted p-values< 0.1, 0.05, and 0.01, Benjamini–Hochberg (BH) correction for multiple testing].
Representation groups were made with GraphPad Prism Software v. 8.0.2 (GraphPad Software Inc., San Diego, EE.UU.) and Infinicyt™ 2.0.5 (Cytognos SL, Salamanca, Spain). Pathways and functional enrichment were made using Reactome (https://reactome.org) (25).
A quantitative methodology, based on the maximum relevance minimum redundancy (mRMR) scheme (26, 27), was used to rank the proteins by relevance. To make the results more robust, we repeated the mRMR procedure with 1,000 different sets each consisting of a subset with 80% of the available patients selected at random. Subsequently, for each protein, we counted the number of times the proteins belong to the top 5 or top 20, and ranked them using a score based on this information.
Several decision tree models (28, 29) were used to classify (i) monoclonal B-cell lymphocytosis (MBLhi) and chronic lymphocytic leukemia stable/constant (c-CLL) or progression (p-CLL), and depending on the treatment line, (ii) the CLL group prior to first-line treatment (CLL-PFT) and another group after first-line treatment (CLL-TFT), and (iii) IGHV mutational status (mutated and unmutated). These decision tree models were carried out based on (i) the top 5 soluble immune factors considered with the mRMR analysis, (ii) proteins with significant differences after conventional statistical analysis, and (iii) the coincident ones obtained with significant differences with the linear model. These results were expressed as confusion matrices for each run, where the out-of-sample error was estimated using k-fold cross-validation (30).
In Table 1, the clinical–biological information of the cohort analyzed is described (MBLhi vs. CLL—stable/constant and/or progression). In order to decipher differential protein profiles in all the samples, three groups of soluble proteins were established: (a) group 1: cytokines, chemokines, growth/factors, regulators, and soluble receptors; (b) group 2: soluble immune checkpoints related to T cells; and (c) group 3: soluble immune checkpoints related to NK cells.
Initially, variations in the quantitative values of these soluble immune factors (groups 1, 2, and 3) in serum have been assessed. When analyzing the deviation of the average concentrations for each protein in relation to the average from each group (group 1, 2, or 3) based on diagnostic (MBLhi vs. CLL—stable/constant and/or progression), it has been observed that:
● 33.85% (22/65) of cytokines in group 1 show a deviation from their average concentration with respect to the average levels within this group for the MBLhi and CLL cohort. Of these, 18.46% (12/65) have a higher average distribution compared to all cytokines assessed in the case of MBLhi and 15.38% (10/65) for CLL; in addition, several of these proteins are common to both cases (MBLhi and CLL): IL-16, CXCL5, CXCL13, CCL22/MDC, CCL24/Eotaxin-2, CXCL12/SDF-1α, sIL-2R, sTWEAK, sCD30, sAPRIL, and sTRAIL. On the other side, there is a set of soluble proteins that have lower values compared to the average concentration of soluble proteins studied in both CLL and MBLhi [13.84% (9/65) and 7.69% (5/65), respectively], such as IL-13, IL-1β, IL-7, and IL-8 (Supplementary Figure 2A).
● In the case of soluble immune checkpoints assessed in groups 2 and 3, 21.05% (8/38) show a quantitative increase in relation to the average concentration of proteins studied for both groups in the study cohort (MBLhi and CLL) (sTIM3, sCD27, sPD-L2, sBTLA, and sCD276/sB7-H3 or accessory molecules such as sPerforin, sE-Cahderine, and sCD155/sPVR, which are involved in the immunological synapsis). On the other hand, 18.42% (7/38) of soluble immune checkpoints of these groups have a decrease of concentration with respect to the quantitative average for all these molecules of the study (sCD134/sOX40, sPD-L1, sCD47/IAP, sCD48/sBLAST-1, sMICA, sMICB, and sArginase-1) (Supplementary Figures 2B, C).
Considering the panel of soluble immune factors detected with significant differences and according to diagnosis, it was further evaluated if there was a trend during the disease progression (comparison of c-CLL and p-CLL). Changes between MBLhi, c-CLL, and p-CLL have been observed for the studied protein profile (Supplementary Figure 3; Supplementary Table 2).
After conventional statistics (Student’s t-test or Wilcoxon–Mann–Whitney test for two categories, and ANOVA or Kruskal–Wallis for more than two categories), significant differences were detected for certain proteins such as sTIMD-4, sIDO, sGalectin-9, IL-4, sBTLA, sLAG-3, IFN-γ, and CXCL13 (Supplementary Figure 4; Supplementary Table 3). Certain proteins presented a significant increase with the progression of the disease (i.e., sGalectin-9, s4-1BB, and sOX40), most of which are involved in cell recruitment (pro-inflammatory response), cell death regulation, cell cycle regulation, and cell chemotaxis (Supplementary Figure 5; Supplementary Table 4), while other proteins have a significant reduction of concentration (i.e., sCD30, INF-γ, and sIDO) according to disease progression, from MBLhi through c-CLL to p-CLL. These are related to interferon signaling, CD28 co-stimulation, tryptophan catabolism, and immunological synapse (T and B cells) (Supplementary Figure 6; Supplementary Table 5).
Furthermore, 30.4% (7/23) of the soluble immune factors have significant differences between p-CLL and c-CLL. These are related to cell recruitment and cell death regulation (Supplementary Figure 7; Supplementary Table 4). In this case, a few of them are highlighted (IL-4, sTIM-3, IL-18, and CXCL9), which directly target T and B cells.
Regarding alterations in IL-4 levels, the detection of differences in p-CLL may be relevant (Figure 2). This is because IL-4 production is regulated by immune factors such as CD40L, IL-9, CD28 family, IL-1 family, and IL-13. In addition, it has an important role in TME, as it could be released, for example, by granulocytes (basophils, eosinophils, or mast cells) and T cells. It also has an important role in virus infections and negative regulation of the PI3K/AKT intracellular signaling pathway.
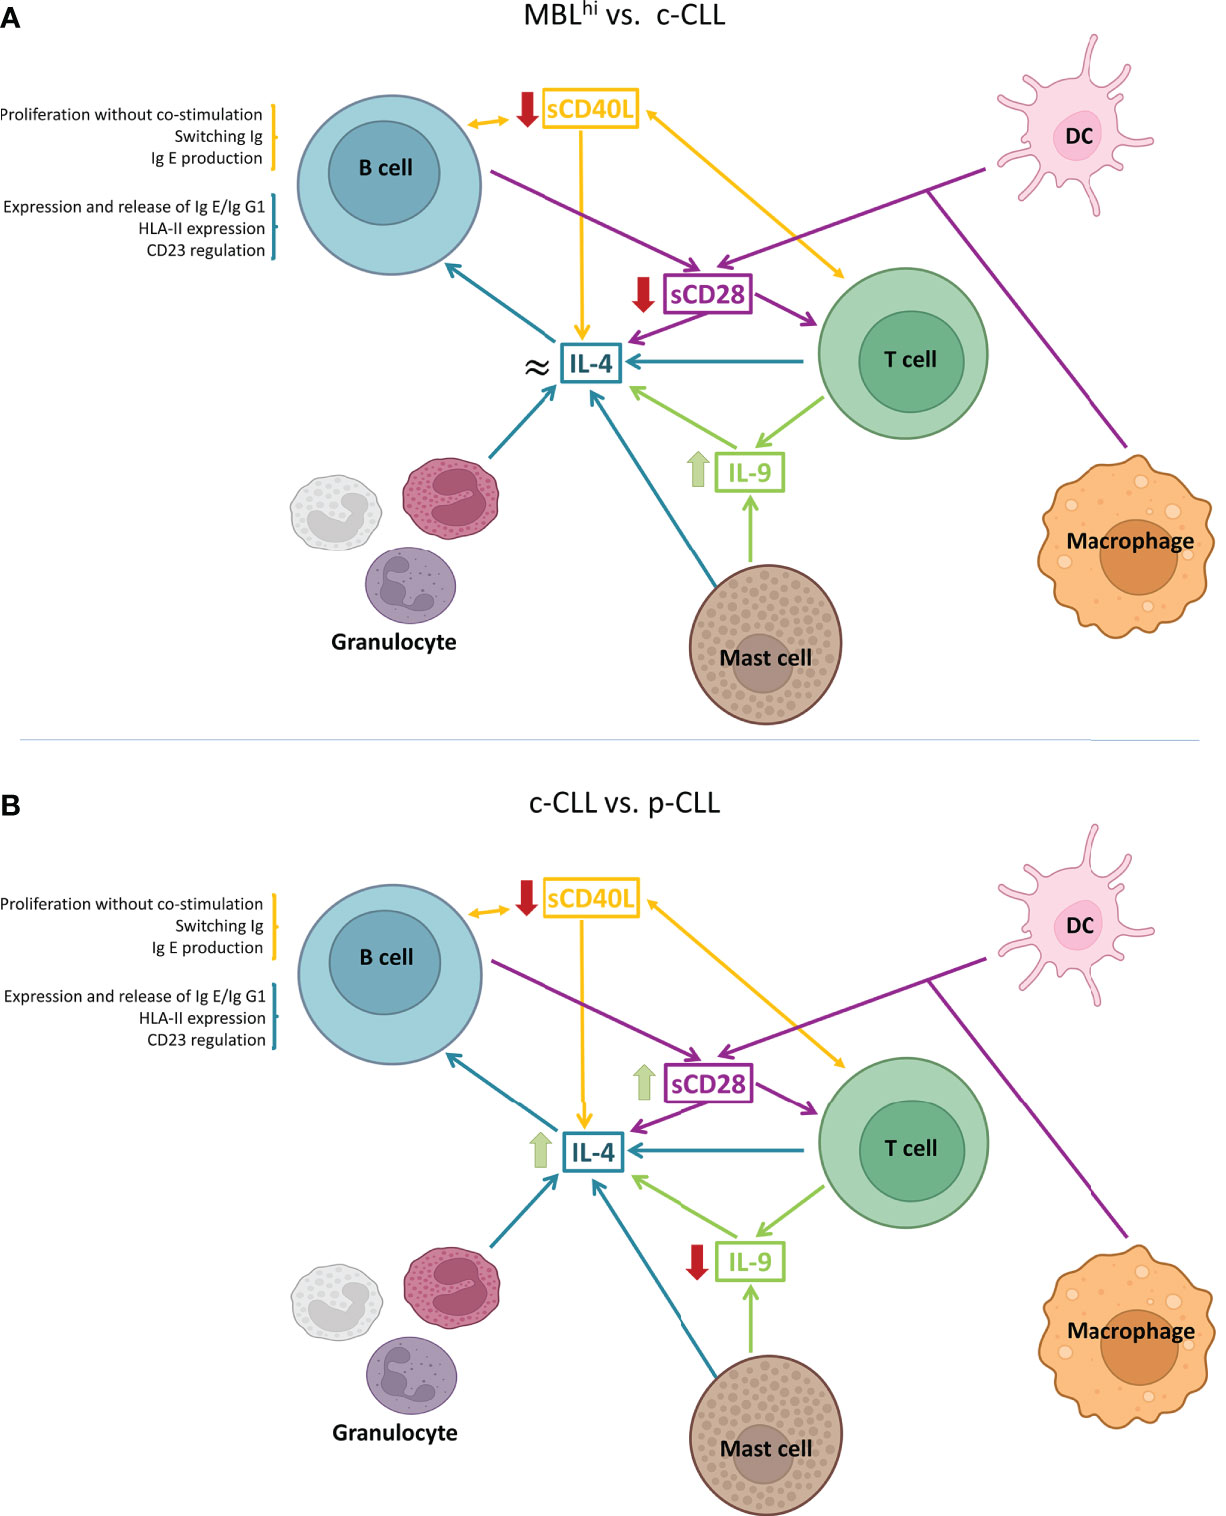
Figure 2 Schematic representation of IL-4-associated differential profiles in TME. (A) Cytokine profile observed between MBLhi and c-CLL. (B) Cytokine profile between c-CLL and p-CLL. (Created in Biorender.com)
Then, a panel of potential soluble immune factors that are useful in discriminating between diagnosis stage and disease evolution is deciphered and has been obtained from the correlation analysis (Supplementary Figures 8A,B; Supplementary Table 6), the top five soluble immune factors were obtained by mRMR analysis (Supplementary Table 7), and significant proteins from conventional statistics analysis (Supplementary Table 3) and proteins with significant differences were detected using the linear model (Supplementary Table 8). The set of soluble immune factors that constitute this panel has 71% (CLL) and 90% (MBLhi) success in discerning the stage of the disease (Supplementary Figure 9A) and 79% (p-CLL), 76% (c-CLL), and 90% (MBLhi) regarding the discrimination of the groups according to the disease evolution (Supplementary Figure 9B). These consist of the following:
● For disease stage: A panel of five soluble immune factors is obtained, which is feasible to discriminate between MBLhi and CLL: sCD47 (cutoff values<16.62 pg/ml to select the sCD27 branch and ≥16.62 pg/ml to select the sTIMD-4 branch), sTIMD-4 (values<1,716.48 pg/ml for CLL and ≥1,716.48 pg/ml for MBLhi), sCD27 (≥2,317.44 pg/ml for CLL), sIL-2R (<619.99 pg/ml for CLL), and sULBP-1 (<1,975.5 pg/ml for MBLhi and ≥1,975.5 pg/ml for CLL) (Figure 3 and Table 3).
● For disease evolution: A panel of six soluble immune factors is obtained, which is feasible to distinguish between MBLhi and c-CLL, and between MBLhi and p-CLL: sCD48 (<14.56 pg/ml to select the sArginase-1 branch and ≥14.56 pg/ml to select the sLAG-3 branch), sCD27 (<618.73 pg/ml for MBLhi and ≥618.73 pg/ml for c-CLL or ≥2,579 pg/ml for p-CLL), sArginase-1 (≥39.05 pg/ml for c-CLL, ≥443.65 pg/ml for MBLhi,<14.14 pg/ml for p-CLL, and ≥14.14 pg/ml for c-CLL), sLAG-3 (<468.22 pg/ml for p-CLL and ≥468.22 pg/ml for MBLhi), IL-4 (≥134.61 pg/ml for p-CLL), and sIL-2R (<619.98 pg/ml for c-CLL and ≥619.98 pg/ml for MBLhi) to discriminate disease evolution (Figure 4 and Table 3).
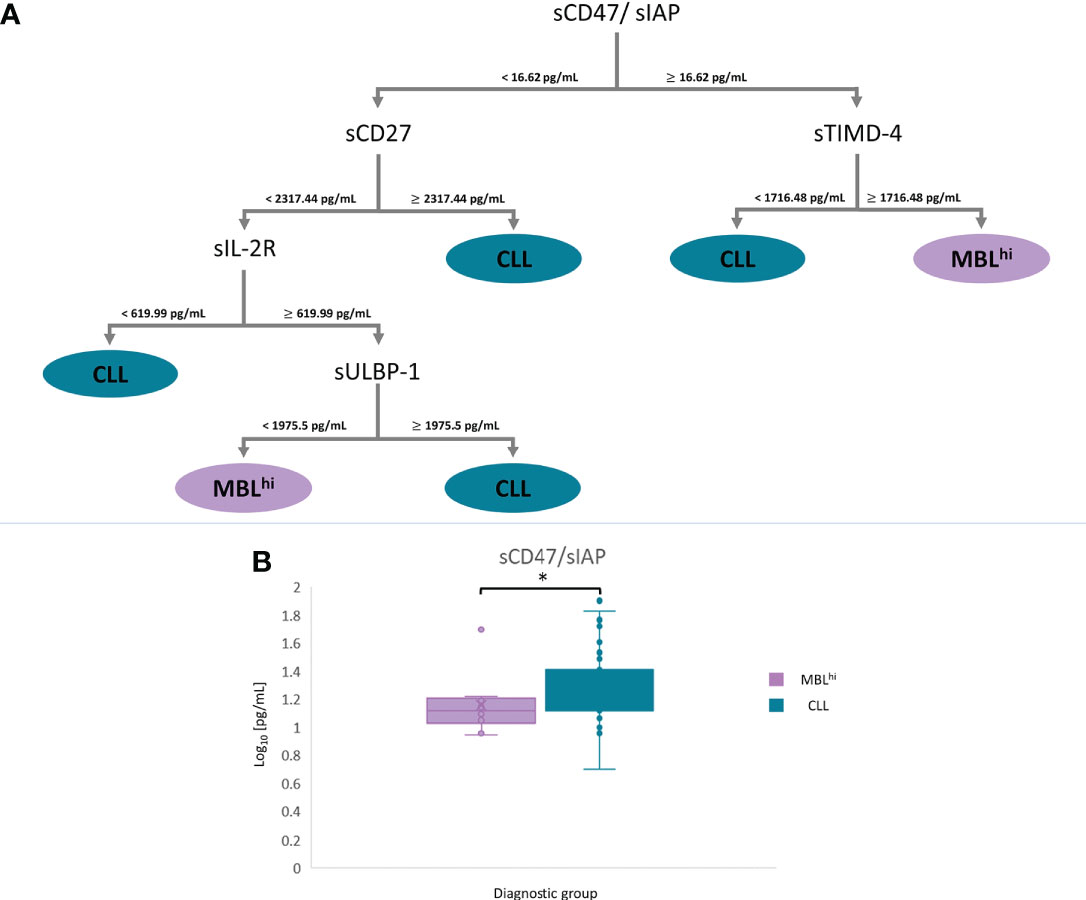
Figure 3 mRMR analysis: MBLhi vs. CLL. (A) Distribution and classification of MBLhi and CLL patients from quantitative soluble immune checkpoints and cytokines in serum. (B) Boxplot sCD47 in serum between MBLhi and CLL (*p – value< 0.05).
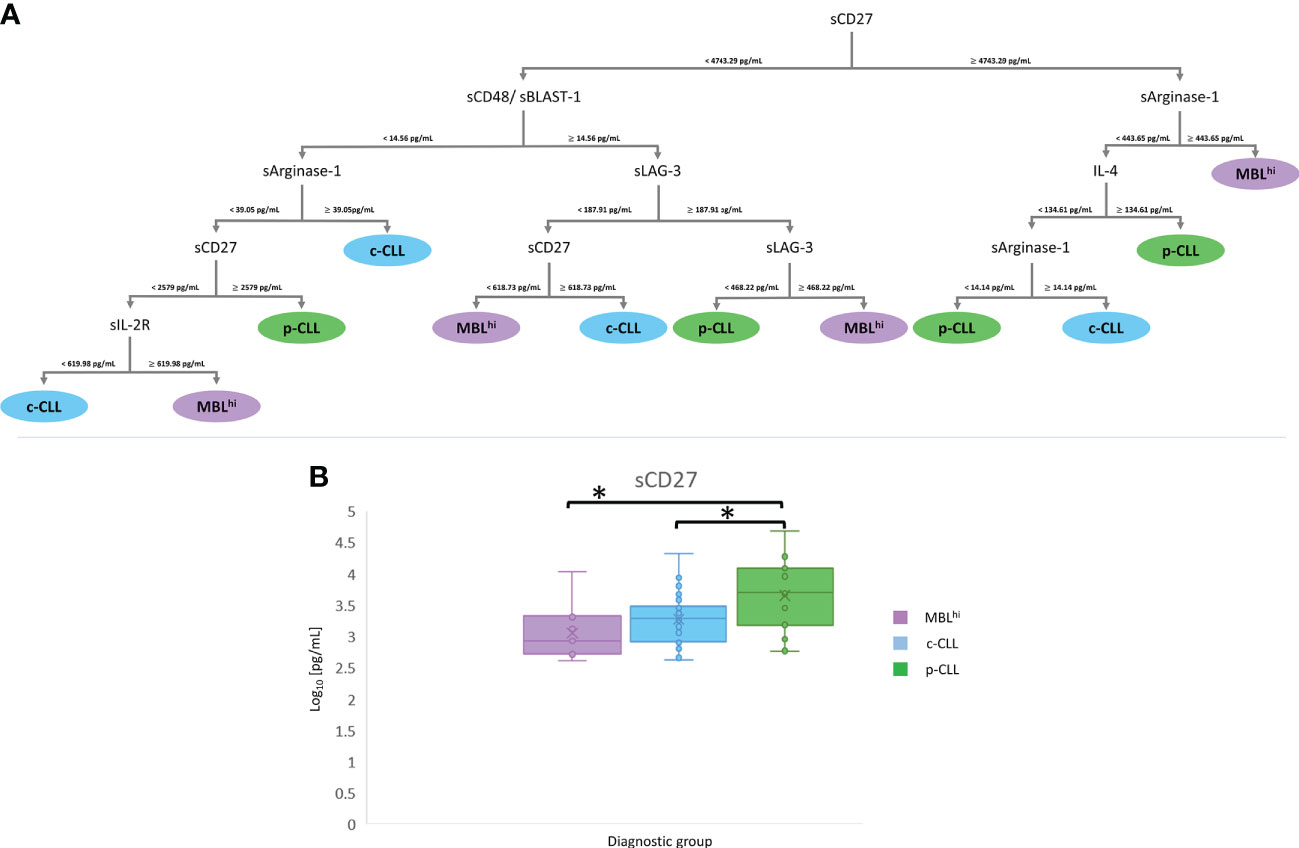
Figure 4 mRMR analysis: MBLhi vs. CLL stages. (A) Distribution and classification of MBLhi and c-CLL/p-CLL from quantitative soluble immune checkpoints and cytokines in serum. (B) Boxplot sCD27 in serum between MBLhi and CLL stages (*p – value< 0.05).
Table 3 List of relevant soluble immune factors according to stage and evolution disease.
The therapeutic algorithm used in CLL includes several targeted oncotherapies according to multiple prognostic factors and treatment resistances. In this study, potential biomarkers are explored to determine the differences in profiles of soluble immune factors before/after treatment at the different disease stages and during disease evolution.
At first glance, approximately 20% (13/65) of the soluble immune factors in group 1 show a deviation with respect to the average of global group 1. Of these, 18.46% (12/65) of soluble immune factors have higher average concentrations (IL-16, CXCL13, CCL22/MDC, CCL24/Eotaxin-2, CXCL5, CXCL12/SDF-1α, sIL-2R, sTRAIL, sCD30, sTWEAK, sAPRIL, and CCL2/MCP-1), while 16.92% (11/65) of soluble immune factors have lower average concentrations (IL-10, IL-1β, IL-7, IL-8, IL-13, TNF-α, IL-1α, IL-15, CX3CL1/Fractalkine, β-NGF, and sCD40L) (Supplementary Figure 10A).
Regarding soluble immune checkpoints (groups 2 and 3), 23.68% (9/38) of them show an increase in regard to the average concentration for each group [sPerforin, sCD276/sB7-H3 and sPD-L2, several receptors (sCD27, sBTLA, sTIM3, and s4-1BB/sCD137), and adhesion proteins (sE-Cadherin and sCD155/sPVR)], while on the other hand, 21.05% (8/38) of soluble immune checkpoints have downward deviations from average concentrations for all these groups (sCD134/sOX40, sPD-L1, sCD48/sBLAST-1, sCD47/sIAP, sULBP-3, sArginase-1, and, related to antigen presentation, sMICA and sMICB) (Supplementary Figures 10B,C).
To establish a pattern of soluble immune factors useful to discriminate between diagnostic stage and response to treatment (before/after therapy), firstly, the profile tendency of the soluble immune factors is studied. An increase in them is observed in CLL-PFT (Supplementary Figure 11), where this profile is related to cellular senescence, post-translational protein phosphorylation, PI3K/AKT intracellular signaling, and virus infection, among others. However, from the correlation analysis with disease progression, a profile with indirect correlation is observed, since the quantitative levels are lower after treatment. When performing a functional analysis, it is observed that among the cell signaling pathways involved are TLR signaling cascade, response to infection, regulation of gene expression by hypoxia-inducible factor, apoptotic cleavage of cell adhesion proteins, extracellular matrix organization, cell–cell communication, signaling transduction, and transcription regulation of pluripotent stem cells (Supplementary Table 9).
Some of the significant soluble immune factors are sIL-2R, CXCL9/MIG, sTIMD-4 for MBLhi vs. CLL-PFT, sIDO, IL-18 and sCD30 for c-CLL vs. CLL-PFT or sLAG-3, and IFN-γ for c-CLL vs. CLL-TFT. All significant soluble immune factors for these comparisons are reported in Supplementary Table 2, and their trend is shown in Supplementary Figure 12. After functional enrichment, most of the soluble immune factors reveal signaling pathways related to co-stimulation mediated by the CD28 family in the immune system and immune-related signaling. For the comparison of c-CLL vs. CLL-PFT, differential signaling pathways are related to metabolism of amino acids and the programmed cell death (Supplementary Table 10).
As described above on the IL-4 quantitative levels, this increases with the evolution of the disease, but it is decreased in CLL-PFT. Considering a detailed study of soluble immune factors involved in the regulation of IL-4 production, these show that a decrease in sCD40L and sCD28 is associated with an increase in disease progression (Figure 5).
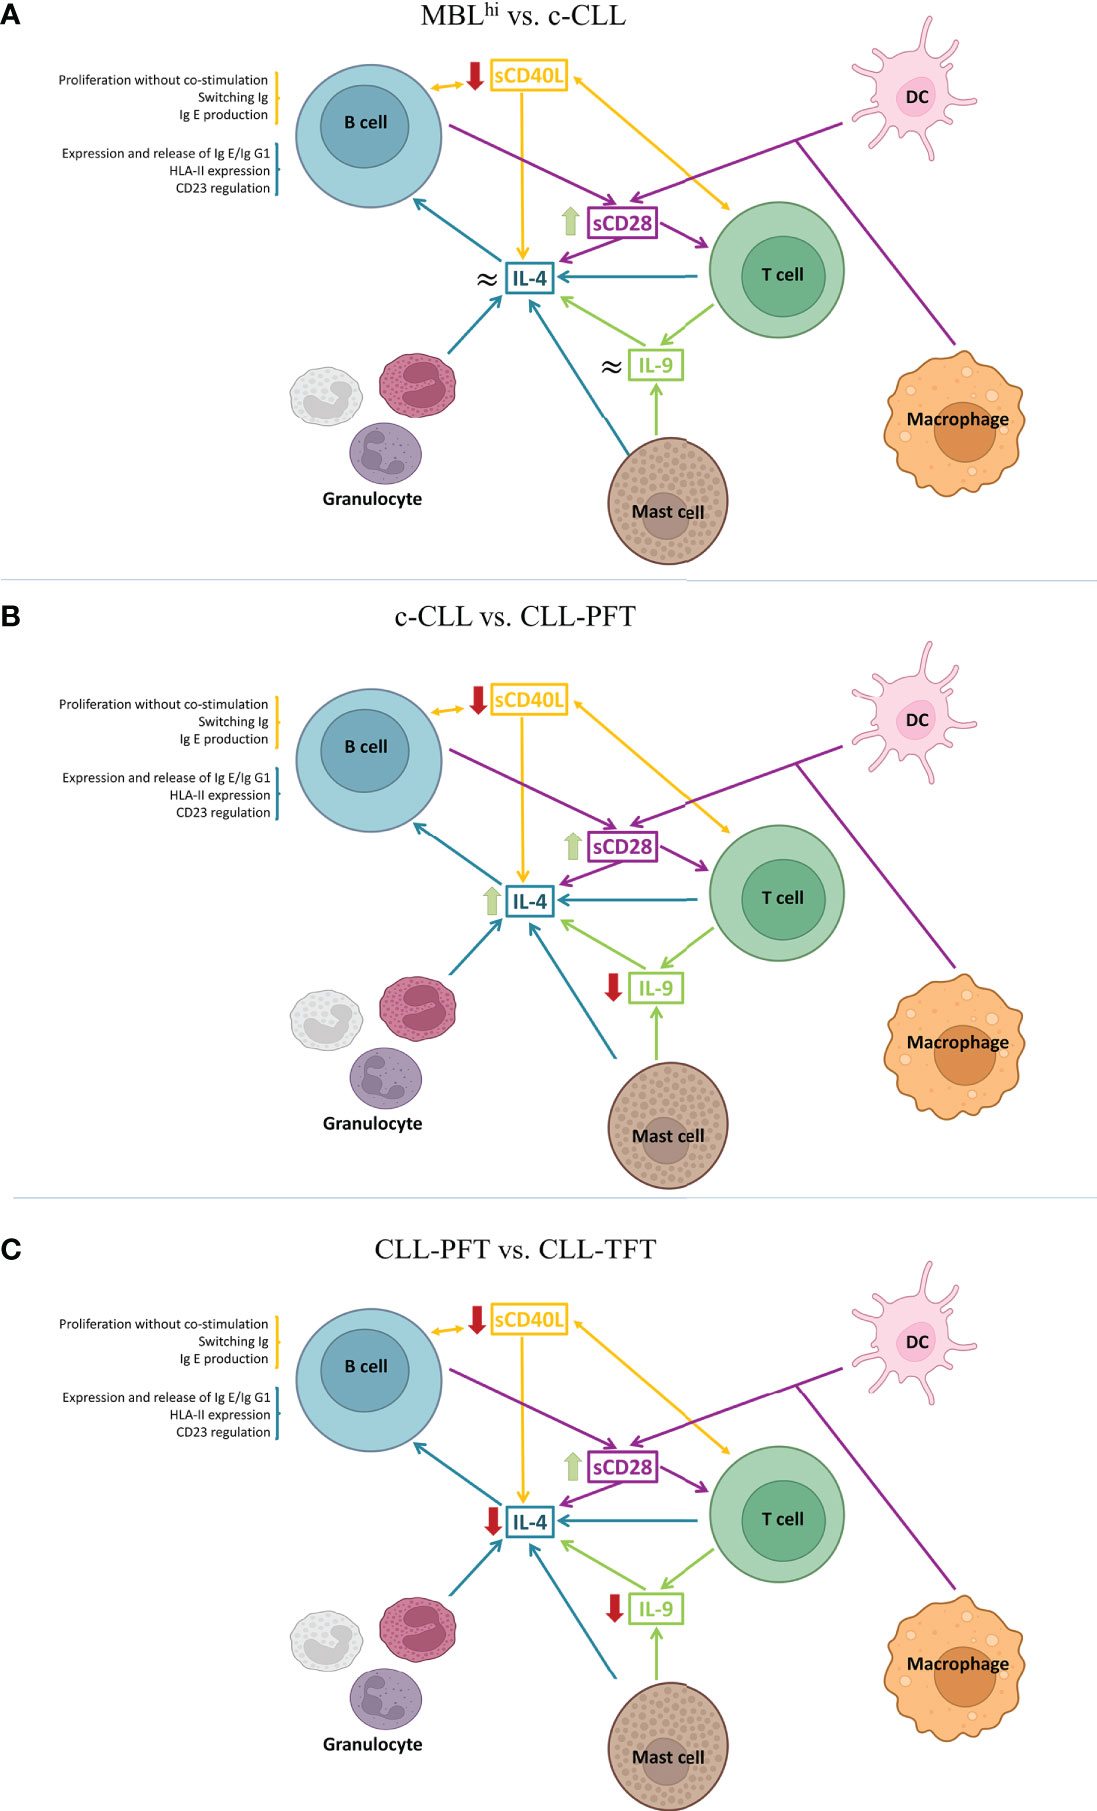
Figure 5 Schematic models of the TME from the role of the observed differential serum profiles. (A) MBLhi vs. c-CLL (stable and progression). (B) c-CLL vs. CLL-PFT. (C) CLL-PFT vs. CLL-TFT. (Created in Biorender.com)
Similarly, from the correlation analysis (Supplementary Figure 8C; Supplementary Tables 3, 6–8), it is feasible to establish a pattern of soluble immune factor to successfully discriminate between groups according to treatment response, which yields the following rates: 48% (c-CLL), 93% (MBLhi), 95% (CLL-PFT), and 100% (CLL-TFT) (Supplementary Figure 9C). Thus, a panel containing sIL-2R (<3,923.23 pg/ml to select the sTIMD-4 branch and ≥3,923.23 pg/ml to select the sSiglec-9 branch), sTIMD-4 (<92.28 pg/ml for MBLhi or<251.38 pg/ml for MBLhi and ≥251.38 pg/ml for CLL-PFT), sSiglec-9 (<330.32 pg/ml for CLL-TFT and ≥330.32 pg/ml for MBLhi or<352.41 pg/ml for MBLhi and ≥352.41 pg/ml for c-CLL), INF-γ (<2.27 pg/ml to select the sCD48 branch and ≥2.27 pg/ml to select the sSiglec-9 branch), sPD-L1 (<3.39 pg/ml for CLL-TFT and ≥3.39 pg/ml for CLL-PFT or ≥12.73 pg/ml for CLL-TFT), sCD48 (≥14.56 pg/ml for c-CLL), and sLAG-3 (<348.13 pg/ml for c-CLL and ≥348.13 pg/ml for MBLhi) could distinguish between diagnostic stage and therapeutic response (Figure 6 and Table 3).
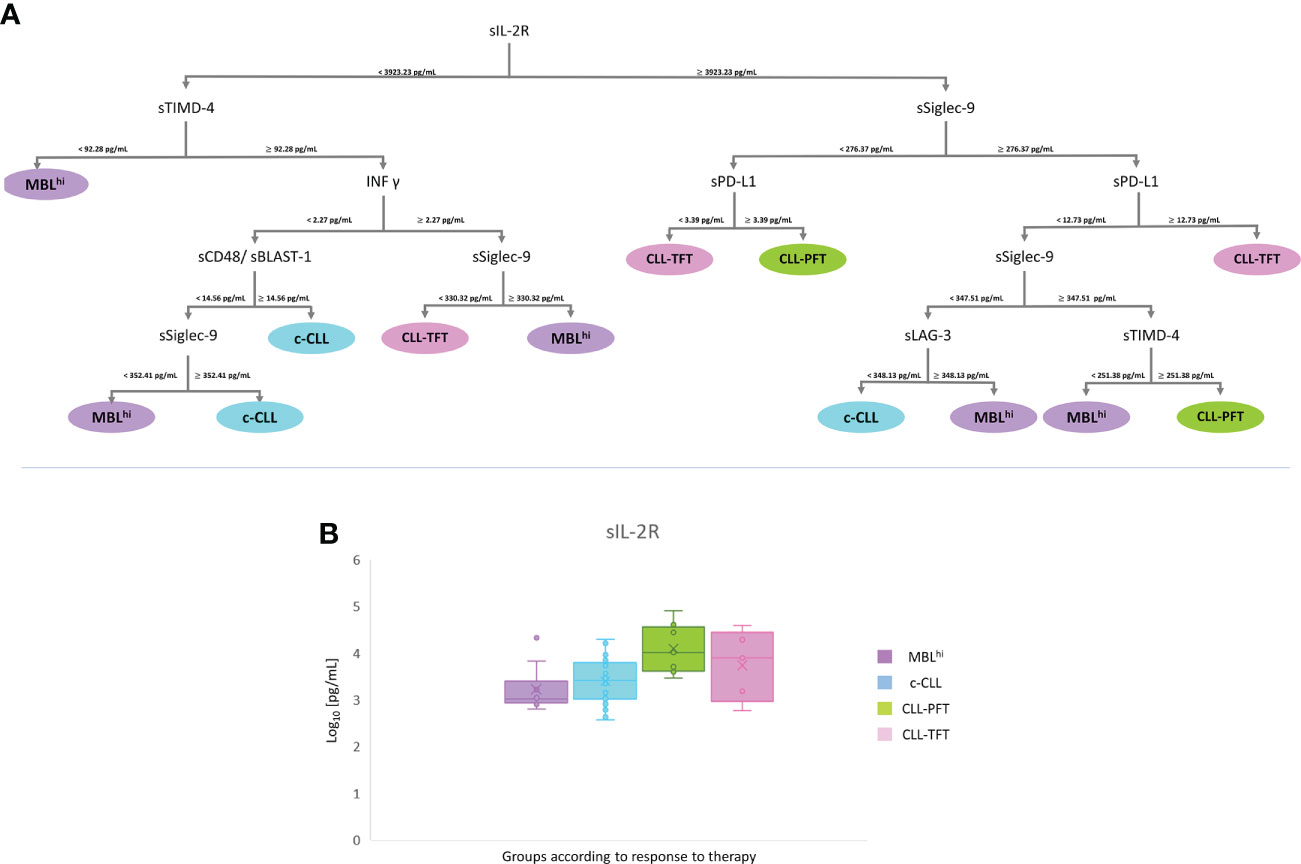
Figure 6 mRMR analysis according to therapy. (A) Distribution and classification from differential profiles of soluble receptors and immune checkpoints. (B) Boxplot sIL-2R in serum across the analyzed cohort.
In this study, the profiles of soluble immune factors based on immunoglobulin heavy chain variable (IGHV) mutational status are also analyzed due to the critical role as a prognostic factor in CLL.
In Supplementary Figure 13, the general distribution of soluble immune factors for both IGHV mutational status (unmutated vs. mutated) is depicted. In group 1 of soluble immune factors, 16.90% (11/65) show higher levels with respect to the global average (IL-16, CXCL5, CCL24/Eotaxin-2, CXCL12/SDF-1α, sIL-2R, sTWEAK, sCD30, and sAPRIL), while 15.38% (10/65) of soluble immune factors show decreased levels (IL-1α, IL-7, IL-13, IL-15, IL-10, TNF-α, IL-1β, IL-8, CXC3CL1/fractalkine, and β-NGF) (Supplementary Figure 13A).
With regard to soluble immune checkpoints (T cells or NK cells), 18.42% (7/38) of them, included in both groups, have an increased average concentration concerning the total average for each group (sBTLA, sCD276/sB7-H3, sTIM-3, sCD27, sPerforin, sE-Cadherin, and sCD155/sPVR). Likewise, a reduction in quantitative levels is also observed for 15.79% (6/38) of the soluble immune checkpoints included in these groups (sPD-L1, sCD47/sIAP, sCD134/sOX40, sMICA, and sMICB) (Supplementary Figures 13B, C).
Most of the studied soluble immune factors [83.5% (86/103)] show higher levels for unmutated IGHV patients than mutated IGHV patients. These results are to be expected due to the poor clinical prognosis of unmutated IGHV patients (Supplementary Figure 14). From the functional point of view, these soluble immune factors are related to CD28 co-stimulation, regulation of TLR by endogenous ligand, infectious disease, constitutive signaling by aberrant PI3K, adherens junction interactions, cellular response to stress, regulated necrosis, and pyroptosis (Supplementary Table 11). Although only 9.7% (10/103) of soluble immune factors are significantly increased (Supplementary Figure 13). The last mentioned factors are related to VEGF signaling, immunoregulatory interactions between lymphoid and non-lymphoid cells, and transcriptional regulation, among others (Supplementary Table 11).
In this comparison, CXCL11/I-TAC, CXCL10/IP-10, sHVEM, and sLAG-3 are found to have a significant profile for IGHV mutational status (Supplementary Table 3), which is related to antigen presentation and cytokine signaling cascades (i.e., IL-10 signaling, TNFR2 non-canonical NF-κB pathway, and interferon signaling) (Supplementary Table 12).
Bearing in mind the prognostic value of the IGHV mutational status in CLL, it is very interesting to identify a profile of soluble immune checkpoints with a strong correlation. In this way, a panel of four proteins is feasible to discriminate IGHV mutational status: CXCL10/IP-10 (<9.05 pg/ml for mutated IGHV), sCD134/sOX40 (<17.87 pg/ml for unmutated IGHV), sULBP-1 (<1,105.11 pg/ml for mutated IGHV), and sLAG-3(<147.24 pg/ml for mutated IGHV and ≥147.24 pg/ml for unmutated IGHV) (Figure 7 and Table 3). This panel has a high discrimination capacity between groups (70% for mutated IGHV and 77% for unmutated IGHV) (Supplementary Figure 8D, Supplementary Figure 9D, and Supplementary Tables 3, 6–8), and all of them are involved in interactions with T cells and the mechanism of antigen presentation.
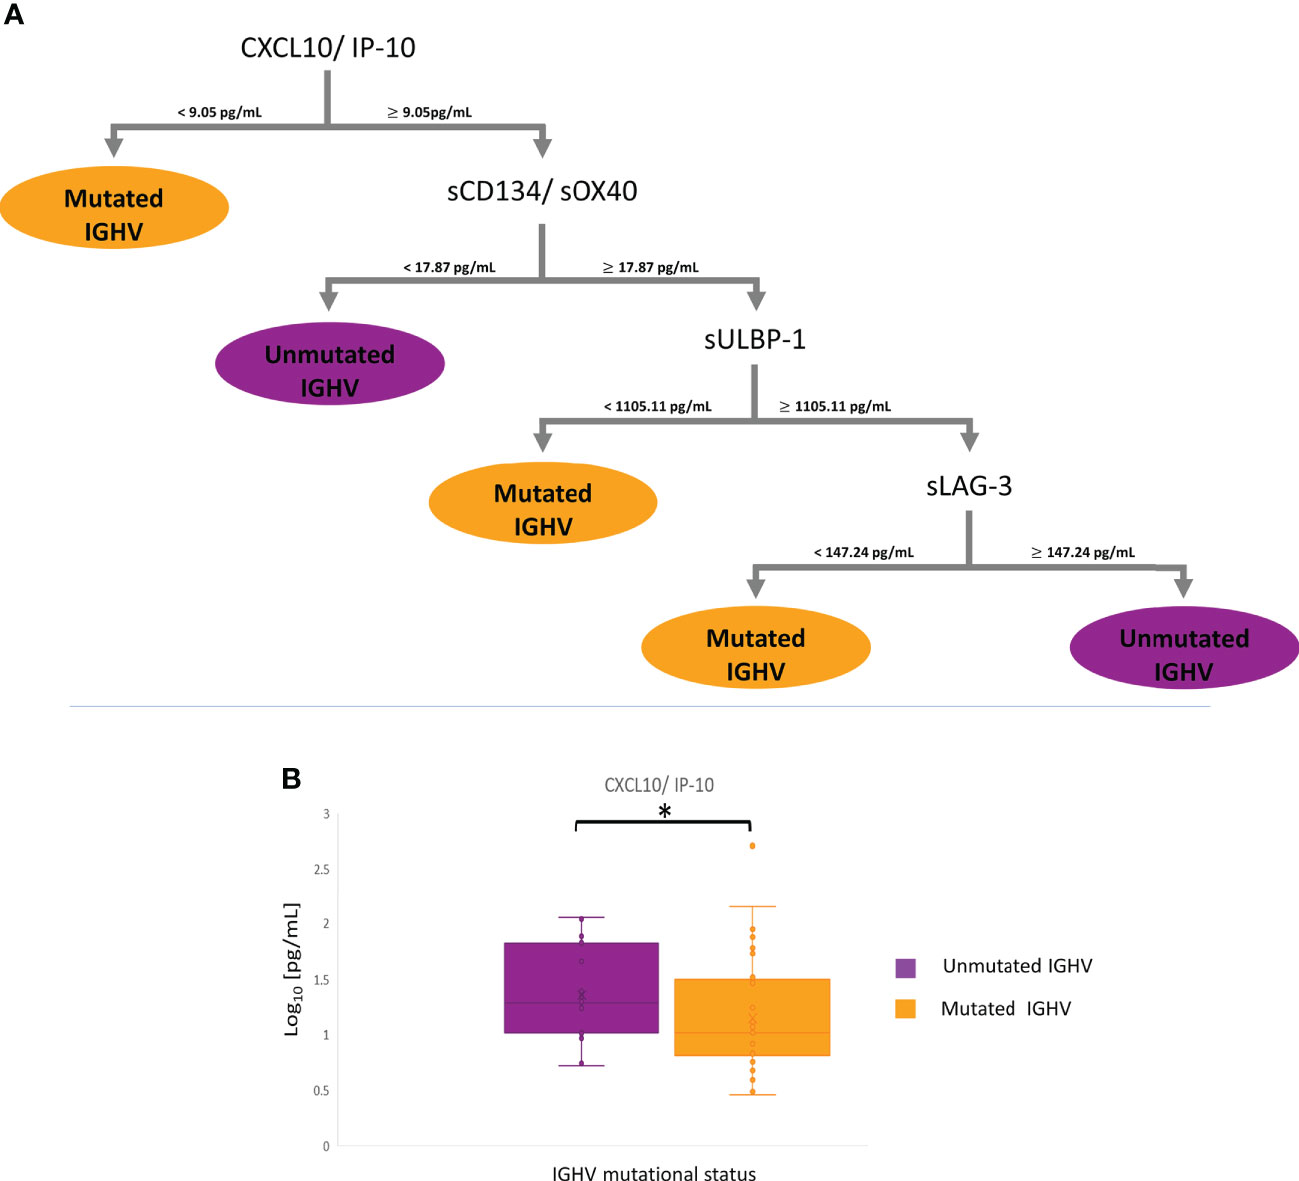
Figure 7 mRMR analysis according to IGHV status. (A) Distribution and classification from differential profiles of soluble immune checkpoints correlated with IGHV mutational status. (B) Boxplot CXCL10/IP-10 in serum between groups (*p – value< 0.05).
In this study, serum quantitative levels of 103 soluble immune factors have been analyzed in MBLhi/CLL patients. The characterization of significant profiles of soluble immune factors reveals patterns and trends that might be useful as potential biomarkers to distinguish between diagnostic stage, disease evolution, and prognostics factors (such as IGHV mutational status). Briefly, it has been observed that soluble immune factors show an increment according to diagnostic stage (MBLhi vs. CLL), disease evolution (c-CLL and p-CLL), and therapy response (c-CLL and p-CLL) (CLL-PFT vs. CLL-TFT). On the other hand, after treatment, a common reduction in soluble immune factors is observed. Despite these patterns, an exception has been determined as sLAG-3, sPD-L1, and INF-γ have reduced levels at the early stage of the disease. As regards prognostic factors, unmutated IGHV patients display lower levels of soluble immune factors in comparison with mutated IGHV, except for sCD47/sIAP and sTIMD-4, which maintain their levels, and sArginase-1, which shows increased levels.
The significant profiles of soluble immune factors are directly related to the microenvironment where T cells, NK cells, macrophages, and granulocytes are involved (Figure 8). As a proof, IL-4 is increased according to disease evolution. IL-4 is a cytokine that polarizes T-lymphocyte differentiation towards Th2 cells (1) and macrophages towards pro-tumoral (M2) phenotypes, leading to tumor escape caused by an unbalanced immune response. Previously, it has been reported that IL-4 is produced by B-CLL cell (2) and in T-cell cultures isolated from CLL patients (31). This general immunosuppression increased the survival of B-CLL cells and the modulation of the therapeutic response of CLL patients (1, 10, 32). This is compatible with the current study, since the maintenance or increment in IL-4 serum concentrations could be driven by the polarization of the microenvironment, skewing the action of the immune system towards a pro-tumor microenvironment, which would be restored after targeted therapy.
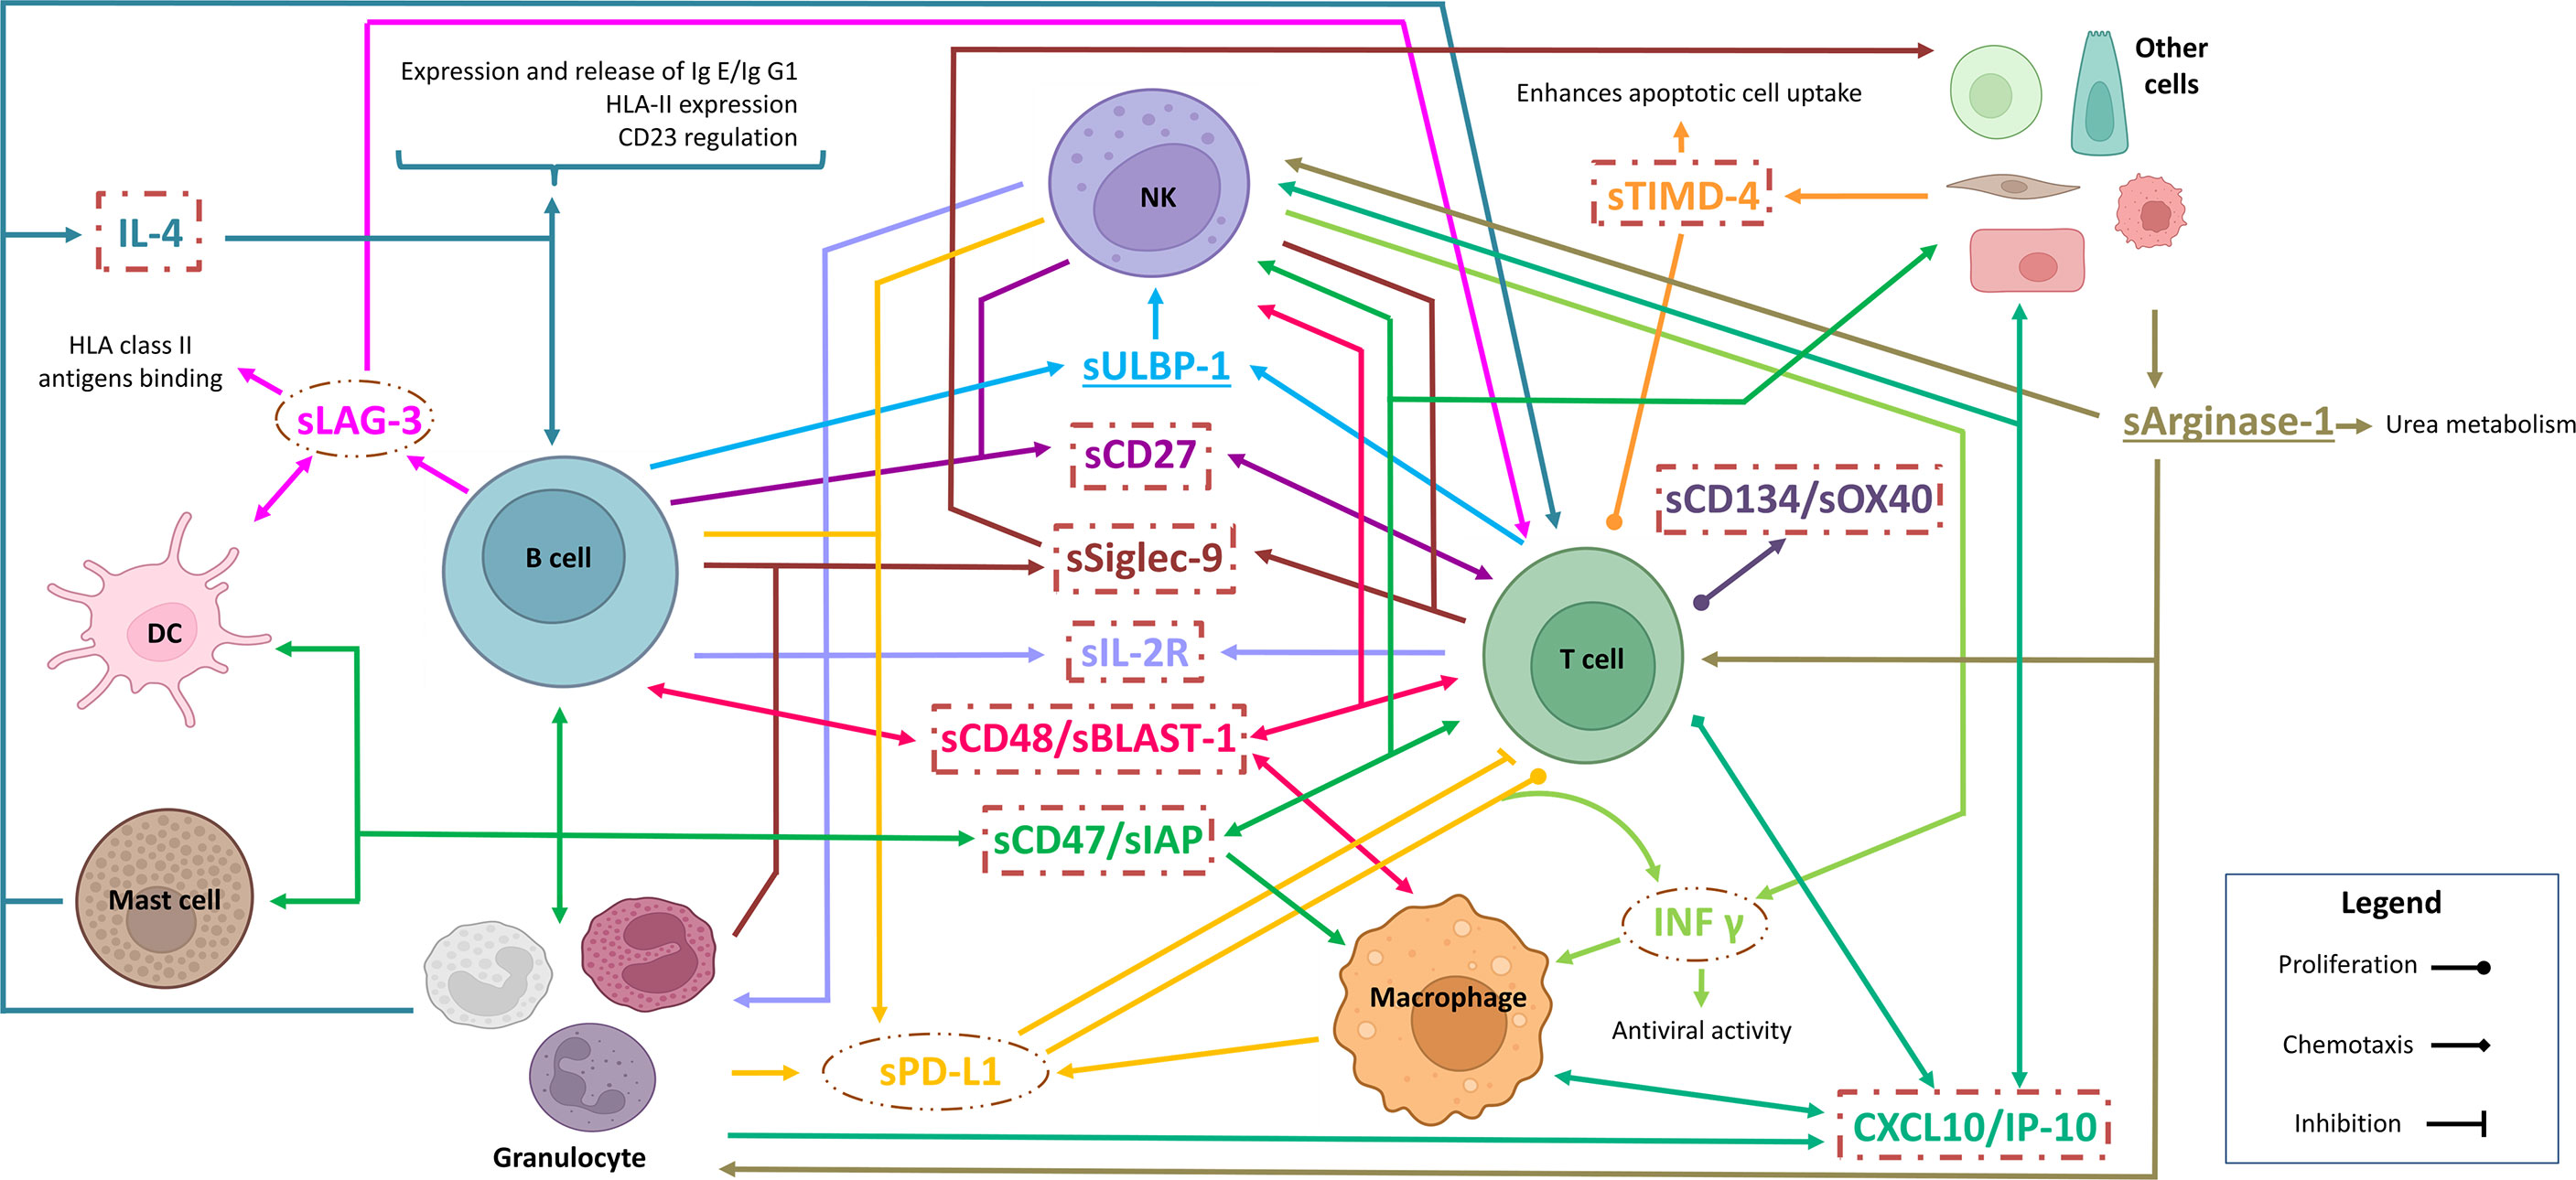
Figure 8 Model of the role of soluble immune checkpoints in the TME in the studied cohort. Inside circles, protein profiling decreased levels according to disease evolution. Inside squares, protein profile correlated with mutated IGHV. Underline, protein profiles with fluctuations over disease evolution and IGHV mutational status. (Created in Biorender.com)
Bearing in mind the polarization of Th2 cells in the microenvironment and the increased presence of M2 macrophages (releasing IL-4 into the microenvironment), Arginase-1 is also expected to be involved. Arginase-1 production is stimulated by IL-4 production, thus supporting the effect of Th2 cells (33). In addition, Arginase-1 could also be released into the microenvironment by myeloid cells; thus, it contributes to the suppression of T-cell functions and inhibits NK proliferation. Alterations in arginase metabolism have also been observed in tumors, which might affect cell proliferation. On the other hand, tumor cells have been shown to exhibit an increase in arginase catabolism that leads to the suppression of CD8+ T cells and stabilizes Treg T cells (34, 35). In this study, it is observed that sArginase-1 increases its concentration according to disease progression. In particular, CLL-PFT patients display a lower level compared to patients with c-CLL and show an increase when compared with CLL-TFT. This suggests that the catabolism of Arginase-1 is increased in B-CLL cells, generating a protective environment for these leukemic cells that allows their further proliferation and, consequently, treatment resistance.
Also, the current study reveals the critical role of T cells in disease progression and evolution. Significant alterations in soluble immune factors related to T-cell functions are as follows: (i) sULBP-1 is relevant in the inhibition of cytokine release, co-stimulation, and cytotoxicity of T cells (6, 36). (ii) sSiglec-9, which could bind to its ligands, promotes the block of antitumoral activity of NK and T cells (37). (iii) sLAG-3 inhibits the co-receptor of HLA-II that downregulates the activation of T and NK cells to alert the exhaustion status of T and NK cells (12, 38, 39). Sordo-Bahamonde et al. in 2021 (11) observed that LAG-3 has a negative impact on the clinical outcomes of CLL patients, affecting T-cell proliferation, cytokine production, and cytolytic activity, while promoting immunosuppression by Tregs’ T-cell action. Moreover, LAG-3 dysregulation in CLL patients correlates with disease progression. (iv) PD-L1 binding to its receptor PD-1 inhibits T cells (40); increased soluble levels in plasma are associated with poor prognosis, shorter survival, and resistance to immunotherapy in different several cancers (41). In summary, a dysfunctional immune response is expected because of the reduction in antigen presentation by tumor cells and the decrease in the number of T and NK cells, which result in disease progression and no change in the serum levels of sLAG-3 and sPD-L1 after treatment, thus generating treatment resistance.
Interestingly, the sCD48 profile is correlated to the progressive increment with disease progression and evolution. CD48 is a membrane protein that stimulates the cytotoxic activity of CD8+ T cells and NK cells (42). This might be related to the response of CLL patients when they are exposed to recurrent viral and bacterial infections. Previously, it has been reported that infected patients show high CD48 expression (43), which is in contrast with what is observed in other hematological malignancies, where downregulation of CD48 has been determined (44). In addition, the presence of elevated levels of sCD48 may be involved with an overstimulation of NK and CD8+ T cells, which could block the activity of these cells due to depletion (42). Similarly, it is expected for sCD47. CD47 is a transmembrane protein that plays an important role in migration, phagocytosis, apoptosis, and immune homeostasis because it is responsible for the immune escape control. In normal tissues, there is a constant balance between inhibition/activation of phagocytosis that is disproportionate in malignant cells, mainly because of the upregulation of CD47. In addition, CD47 interacts with signal regulatory protein α (SIRPα) expressed in myeloid cells (monocytes, macrophages, and DCs), blocking the migration and phagocytosis process of these cell types (12, 16, 17, 40).
Finally, from the analysis of soluble immune checkpoint according to the IGHV mutational status, it is revealed that patients with unmutated IGHV are characterized by (i) the proliferation of compromised T cells [sLAG-3 (11, 12), INF-γ (44), sOX40/sCD134 (45), and sCD27 (46)]; (ii) inefficient antigen presentation by APCs [downregulation of HLA-II molecule expression by B-CLL cells, blockade of the HLA-II molecule by sLAG-3 (11, 12), upregulation of IL-4 (1, 10), and blocking of antigenic presentation by DCs by sTIMD-4 (47)]; (iii) the inhibition of CD8+ T cells that co-exists with the recruitment and activation of NK [CXCL10 (19), sULBP-1 (6, 36), and sCD48/sBLAST-1 (44)]; and (iv) the inhibition of phagocytosis in macrophages by the binding of sCD47 to SIRPα (12, 16, 17, 40), which, in combination with inefficient antigenic presentation, promotes B-CLL cell survival. Regarding sArginase-1, mutated IGHV patients display higher values than unmutated IGHV patients, which is in contrast with the previously reported level of sArginase-1 in TME, as it is involved in the stabilization of Treg T cells, generating protection for B-CLL cells and suppressing CD8+ T cells (34).
In conclusion, the systematic analysis of soluble immune factors provides a new perspective on the understanding of the TME of B-CLL cells, suggesting that T cells have an important role in this process of immune suppression and dysfunction. This is because most of the soluble immune checkpoints and immune factors that presented significant differences are related to the following:
- Antigenic recognition by T lymphocytes, and co-stimulation, differentiation, proliferation, and selection of circulating tumor-associated monocytes.
- Breakdown of the cellular balance due to the increase in Th2 CD4+ T cells, Treg lymphocytes, and type 2 macrophages (M2), which is related to the polarization of the microenvironment. Consequently, an inhibition of the immune system and the presence of an inflamed TME leading to tumor escape are observed.
In this study, four different quantitative profiles of soluble immune factors are proposed. Furthermore, this study paves the way for soluble immune factors as potential and useful biomarkers for this pathology, which could influence disease progression.
The datasets presented in this study can be found in online repositories. The names of the repository/repositories and accession number(s) can be found in the article/Supplementary Material.
Informed consent was given by each individual before entering the study and approved by the local ethics committee of the University Hospital of Salamanca (HUS, Salamanca, Spain).
Conceptualization: AL-V, MA, AN-B, MG, MF. Sample acquisition and informed consents: AN-B, MG, MA. Statistical Data: AL-V, LD-M, JS-S. Bioinformatic analysis; AL-V, CP, QL, MF. Bioinformatic resources; CP, QL, JDLR. Resources: CA-H, PJ-V, Á-PH, MG-V, AO. Writing-original draft preparation: AL-V, MF. Supervision: MF, MG, AO,CP, QL, JS-S, RG, JD. Funding acquisition: MF. All authors contributed to the article and approved the submitted version.
We gratefully acknowledge Fondos FEDER (EU) and Junta Castilla-León (grant SA198A12-2 and COVID-19 grant COV20EDU/00187), Fundación Solórzano FS/38-2017. The Proteomics Unit belongs to ProteoRed, PRB3-ISCIII, supported by grant PT17/0019/0023, of the PE I + D + I 2017-2020, funded by ISCIII and FEDER. AL-V is supported by VIII Centenario-USAL PhD Program, and PJ-V is supported by the JCYL PhD Program “JCYL Nos Impulsa” and scholarship JCYL-EDU/601/2020. This research work was performed in the framework of the Nanomedicine CSIC HUB (ref. 202180E048). AL-V, CA-H, PJ-V, MG-V, ÁP-H, and MF are part of the CSIC’s Global Health Platform (PTI SaludGlobal). CA-H is supported by Instituto de Investigación Biomédica de Salamanca, IBSAL (Programa Puente Contratos Predoctorales-2021).
We thank the financial support from the Spanish Health Institute Carlos III (ISCIII) (grants FIS PI21/01545, FIS PI17/01930, and CB16/12/00400).
The authors declare that the research was conducted in the absence of any commercial or financial relationships that could be construed as a potential conflict of interest.
All claims expressed in this article are solely those of the authors and do not necessarily represent those of their affiliated organizations, or those of the publisher, the editors and the reviewers. Any product that may be evaluated in this article, or claim that may be made by its manufacturer, is not guaranteed or endorsed by the publisher.
The Supplementary Material for this article can be found online at: https://www.frontiersin.org/articles/10.3389/fimmu.2022.965905/full#supplementary-material
1. Allegra A, Musolino C, Tonacci A, Pioggia G, Casciaro M, Gangemi S. Clinico-biological implications of modified levels of cytokines in chronic lymphocytic leukemia: A possible therapeutic role. Cancers (Basel) (2020) 12:524. doi: 10.3390/cancers12020524
2. Haseeb M, Anwar MA, Choi S. Molecular interactions between innate and adaptive immune cells in chronic lymphocytic leukemia and their therapeutic implications. Front Immunol (2018) 9:2720. doi: 10.3389/fimmu.2018.02720
3. Manouchehri-Doulabi E, Abbaspour S, Rostami S, Faranoush M, Ghahramanfard F, Pak F, et al. Evaluating the mechanism underlying antitumor effect of interleukin 27 on b cells of chronic lymphocytic leukemia patients. J Cell Physiol (2020) 235:9424–31. doi: 10.1002/jcp.29747
4. Fiorcari S, Maffei R, Atene CG, Potenza L, Luppi M, Marasca R. Nurse-like cells and chronic lymphocytic leukemia b cells: A mutualistic crosstalk inside tissue microenvironments. Cells (2021) 10:217. doi: 10.3390/cells10020217
5. Awan FT, Byrd JC. 99 - chronic lymphocytic leukemia. In: Niederhuber JE, Armitage JO, Kastan MB, Doroshow JH, Tepper JE, editors. Abeloff’s clinical oncology, Sixth Edition. Philadelphia: Elsevier (2020). p. 1850–1871.e5. doi: 10.1016/B978-0-323-47674-4.00099-2
6. Nückel H, Switala M, Sellmann L, Horn PA, Dürig J, Dührsen U, et al. The prognostic significance of soluble NKG2D ligands in b-cell chronic lymphocytic leukemia. Leukemia (2010) 24:1152–9. doi: 10.1038/leu.2010.74
7. Dubois N, Crompot E, Meuleman N, Bron D, Lagneaux L, Stamatopoulos B. Importance of crosstalk between chronic lymphocytic leukemia cells and the stromal microenvironment: Direct contact, soluble factors, and extracellular vesicles. Front Oncol (2020) 10:1422. doi: 10.3389/fonc.2020.01422
8. Kipps TJ, Stevenson FK, Wu CJ, Croce CM, Packham G, Wierda WG, et al. Chronic lymphocytic leukaemia. Nat Rev Dis Primers (2017) 3:16096. doi: 10.1038/nrdp.2016.96
9. Vitale C, Boccellato E, Comba L, Jones R, Perutelli F, Griggio V, et al. Impact of immune parameters and immune dysfunctions on the prognosis of patients with chronic lymphocytic leukemia. Cancers (Basel) (2021) 13:3856. doi: 10.3390/cancers13153856
10. Bojarska-Junak A, Waldowska M, Woś J, Chocholska S, Hus I, Tomczak W, et al. Intracellular IL-4 and IFN-γ expression in iNKT cells from patients with chronic lymphocytic leukemia. Oncol Lett (2018) 15:1580–90. doi: 10.3892/ol.2017.7484
11. Sordo-Bahamonde C, Lorenzo-Herrero S, González-Rodríguez AP, Payer ÁR, González-García E, López-Soto A, et al. LAG-3 blockade with relatlimab (BMS-986016) restores anti-leukemic responses in chronic lymphocytic leukemia. Cancers (Basel) (2021) 13:2112. doi: 10.3390/cancers13092112
12. Joshi M, Ansell SM. Activating the antitumor immune response in non-Hodgkin lymphoma using immune checkpoint inhibitors. J Immunol Res (2020) 2020:8820377. doi: 10.1155/2020/8820377
13. Pascutti MF, Jak M, Tromp JM, Derks IAM, Remmerswaal EBM, Thijssen R, et al. IL-21 and CD40L signals from autologous T cells can induce antigen-independent proliferation of CLL cells. Blood (2013) 122:3010–9. doi: 10.1182/blood-2012-11-467670
14. Quan L, Lan X, Meng Y, Guo X, Guo Y, Zhao L, et al. BTLA marks a less cytotoxic T-cell subset in diffuse large b-cell lymphoma with high expression of checkpoints. Exp Hematol (2018) 60:47–56.e1. doi: 10.1016/j.exphem.2018.01.003
15. Cao Y, Wang X, Jin T, Tian Y, Dai C, Widarma C, et al. Immune checkpoint molecules in natural killer cells as potential targets for cancer immunotherapy. Signal Transduct Target Ther (2020) 5:250. doi: 10.1038/s41392-020-00348-8
16. Li Z, Li Y, Gao J, Fu Y, Hua P, Jing Y, et al. The role of CD47-SIRPα immune checkpoint in tumor immune evasion and innate immunotherapy. Life Sci (2021) 273:119150. doi: 10.1016/j.lfs.2021.119150
17. Wang Y, Zhao C, Liu Y, Wang C, Jiang H, Hu Y, et al. Recent advances of tumor therapy based on the CD47-SIRPα axis. Mol Pharm (2022) 19:1273–93. doi: 10.1021/acs.molpharmaceut.2c00073
18. Dyck L, Mills KHG. Immune checkpoints and their inhibition in cancer and infectious diseases. Eur J Immunol (2017) 47:765–79. doi: 10.1002/eji.201646875
19. Neo SY, Lundqvist A. The multifaceted roles of CXCL9 within the tumor microenvironment. Adv Exp Med Biol (2020) 1231:45–51. doi: 10.1007/978-3-030-36667-4_5
20. Hallek M, Cheson BD, Catovsky D, Caligaris-Cappio F, Dighiero G, Döhner H, et al. iwCLL guidelines for diagnosis, indications for treatment, response assessment, and supportive management of CLL. Blood (2018) 131:2745–60. doi: 10.1182/blood-2017-09-806398
21. Rai K, Sawitsky A, Cronkite E, Chanana A, Levy R, Pasternack B. Clinical staging of chronic lymphocytic leukemia. Blood (1975) 46:219–34. doi: 10.1182/blood.V46.2.219.219
22. Binet JL, Auquier A, Dighiero G, Chastang C, Piguet H, Goasguen J, et al. A new prognostic classification of chronic lymphocytic leukemia derived from a multivariate survival analysis. Cancer (1981) 48:198–206. doi: 10.1002/1097-0142(19810701)48:1<198:aid-cncr2820480131>3.0.co;2-v
23. Dong MP, Enomoto M, Thuy LTT, Hai H, Hieu VN, Hoang DV, et al. Clinical significance of circulating soluble immune checkpoint proteins in sorafenib-treated patients with advanced hepatocellular carcinoma. Sci Rep (2020) 10:3392. doi: 10.1038/s41598-020-60440-5
24. Ritchie ME, Phipson B, Wu D, Hu Y, Law CW, Shi W, et al. Limma powers differential expression analyses for RNA-sequencing and microarray studies. Nucleic Acids Res (2015) 43:e47. doi: 10.1093/nar/gkv007
25. Fabregat A, Korninger F, Viteri G, Sidiropoulos K, Marin-Garcia P, Ping P, et al. Reactome graph database: Efficient access to complex pathway data. PloS Comput Biol (2018) 14:e1005968. doi: 10.1371/journal.pcbi.1005968
26. Peng H, Long F, Ding C. Feature selection based on mutual information criteria of max-dependency, max-relevance, and min-redundancy. IEEE Trans Pattern Anal Mach Intell (2005) 27:1226–38. doi: 10.1109/TPAMI.2005.159
27. Ding C, Peng H. Minimum redundancy feature selection from microarray gene expression data. J Bioinform Comput Biol (2005) 3:185–205. doi: 10.1142/s0219720005001004
28. Costa VG, Pedreira CE. Recent advances in decision trees: An updated survey. Artif Intell Rev (2022).
29. Kotsiantis SB. Decision trees: A recent overview. Artif Intell Rev (2013) 39:261–83. doi: 10.1007/s10462-011-9272-4
30. Stone M. Cross-validatory choice and assessment of statistical predictions. J R Stat Soc Ser B (Methodol) (1974) 36:111–47.
31. Krause G, Hassenrück F, Hallek M. Relevant cytokines in the b cell lymphoma micro-environment. Cancers (Basel) (2020) 12:E2525. doi: 10.3390/cancers12092525
32. De Falco F, Del Papa B, Baldoni S, Sabatini R, Falzetti F, Di Ianni M, et al. IL-4-dependent Jagged1 expression/processing is associated with survival of chronic lymphocytic leukemia cells but not with notch activation. Cell Death Dis (2018) 9:1–17. doi: 10.1038/s41419-018-1185-6
33. Rébé C, Ghiringhelli F. Interleukin-1β and cancer. Cancers (Basel) (2020) 12:1791. doi: 10.3390/cancers12071791
34. Lemos H, Huang L, Prendergast GC, Mellor AL. Immune control by amino acid catabolism during tumorigenesis and therapy. Nat Rev Cancer (2019) 19:162–75. doi: 10.1038/s41568-019-0106-z
35. Grzywa TM, Sosnowska A, Matryba P, Rydzynska Z, Jasinski M, Nowis D, et al. Myeloid cell-derived arginase in cancer immune response. Front Immunol (2020) 11:938. doi: 10.3389/fimmu.2020.00938
36. Kubin M, Cassiano L, Chalupny J, Chin W, Cosman D, Fanslow W, et al. ULBP1, 2, 3: Novel MHC class I-related molecules that bind to human cytomegalovirus glycoprotein UL16, activate NK cells. Eur J Immunol (2001) 31:1428–37. doi: 10.1002/1521-4141(200105)31:5<1428:AID-IMMU1428>3.0.CO;2-4
37. Ono E, Uede T. Implication of soluble forms of cell adhesion molecules in infectious disease and tumor: Insights from transgenic animal models. Int J Mol Sci (2018) 19:E239. doi: 10.3390/ijms19010239
38. Marcovecchio PM, Thomas G, Salek-Ardakani S. CXCL9-expressing tumor-associated macrophages: New players in the fight against cancer. J Immunother Cancer (2021) 9:e002045. doi: 10.1136/jitc-2020-002045
39. Yoshimoto T, Chiba Y, Furusawa J-I, Xu M, Tsunoda R, Higuchi K, et al. Potential clinical application of interleukin-27 as an antitumor agent. Cancer Sci (2015) 106:1103–10. doi: 10.1111/cas.12731
40. Li Y, Liu X, Zhang X, Pan W, Li N, Tang B. Immune cycle-based strategies for cancer immunotherapy. Adv Funct Mater (2021) 31:1–27. doi: 10.1002/adfm.202107540
41. Nakamura Y. Biomarkers for immune checkpoint inhibitor-mediated tumor response and adverse events. Front Med (Lausanne) (2019) 6:119. doi: 10.3389/fmed.2019.00119
42. Pahima H, Puzzovio PG, Levi-Schaffer F. 2B4 and CD48: A powerful couple of the immune system. Clin Immunol (2019) 204:64–8. doi: 10.1016/j.clim.2018.10.014
43. McArdel SL, Terhorst C, Sharpe AH. Roles of CD48 in regulating immunity and tolerance. Clin Immunol (2016) 164:10–20. doi: 10.1016/j.clim.2016.01.008
44. Huang C-H, Liao Y-J, Chiou T-J, Huang H-T, Lin Y-H, Twu Y-C. TGF-β regulated leukemia cell susceptibility against NK targeting through the down-regulation of the CD48 expression. Immunobiology (2019) 224:649–58. doi: 10.1016/j.imbio.2019.07.002
45. Nuebling T, Schumacher CE, Hofmann M, Hagelstein I, Schmiedel BJ, Maurer S, et al. The immune checkpoint modulator OX40 and its ligand OX40L in NK-cell immunosurveillance and acute myeloid leukemia. Cancer Immunol Res (2018) 6:209–21. doi: 10.1158/2326-6066.CIR-17-0212
46. Hosnijeh FS, Portengen L, Späth F, Bergdahl IA, Melin B, Mattiello A, et al. Soluble b-cell activation marker of sCD27 and sCD30 and future risk of b-cell lymphomas: A nested case-control study and meta-analyses. Int J Cancer (2016) 138:2357–67. doi: 10.1002/ijc.29969
Keywords: soluble immune checkpoints, cytokines profiles, cellular microenvironment, chronic lymphocytic leukaemia (CLL), immune dysfunction
Citation: Landeira-Viñuela A, Arias-Hidalgo C, Juanes-Velasco P, Alcoceba M, Navarro-Bailón A, Pedreira CE, Lecrevisse Q, Díaz-Muñoz L, Sánchez-Santos JM, Hernández Á-P, García-Vaquero ML, Góngora R, De Las Rivas J, González M, Orfao A and Fuentes M (2022) Unravelling soluble immune checkpoints in chronic lymphocytic leukemia: Physiological immunomodulators or immune dysfunction. Front. Immunol. 13:965905. doi: 10.3389/fimmu.2022.965905
Received: 10 June 2022; Accepted: 24 August 2022;
Published: 28 September 2022.
Edited by:
Antonio Riva, Foundation for Liver Research, United KingdomReviewed by:
Gianluca Gaidano, Università degli Studi del Piemonte Orientale, ItalyCopyright © 2022 Landeira-Viñuela, Arias-Hidalgo, Juanes-Velasco, Alcoceba, Navarro-Bailón, Pedreira, Lecrevisse, Díaz-Muñoz, Sánchez-Santos, Hernández, García-Vaquero, Góngora, De Las Rivas, González, Orfao and Fuentes. This is an open-access article distributed under the terms of the Creative Commons Attribution License (CC BY). The use, distribution or reproduction in other forums is permitted, provided the original author(s) and the copyright owner(s) are credited and that the original publication in this journal is cited, in accordance with accepted academic practice. No use, distribution or reproduction is permitted which does not comply with these terms.
*Correspondence: Manuel Fuentes, bWZ1ZW50ZXNAdXNhbC5lcw==
Disclaimer: All claims expressed in this article are solely those of the authors and do not necessarily represent those of their affiliated organizations, or those of the publisher, the editors and the reviewers. Any product that may be evaluated in this article or claim that may be made by its manufacturer is not guaranteed or endorsed by the publisher.
Research integrity at Frontiers
Learn more about the work of our research integrity team to safeguard the quality of each article we publish.