
94% of researchers rate our articles as excellent or good
Learn more about the work of our research integrity team to safeguard the quality of each article we publish.
Find out more
ORIGINAL RESEARCH article
Front. Immunol. , 15 August 2022
Sec. Cancer Immunity and Immunotherapy
Volume 13 - 2022 | https://doi.org/10.3389/fimmu.2022.952059
 Zhang-Wei Hu1,2†
 Wei Sun1,2†
 Yi-Hui Wen1,2
 Ren-Qiang Ma1,2Lin Chen1,2Wen-Qing Chen1,2
 Wen-Bin Lei1,2*
 Wei-Ping Wen1,2,3*
Background: PD-1/PD-L1 blockade is a promising immunotherapeutic strategy with the potential to improve the outcomes of various cancers. However, there is a critically unmet need for effective biomarkers of response to PD-1/PD-L1 blockade.
Materials and methods: Potential biomarkers of response to PD-1/PD-L1 blockade were obtained from the Cancer Treatment Response gene signature Database (CTR-DB). A comprehensive pan-cancer analysis was done on The Cancer Genome Atlas (TCGA) and Genotype-Tissue Expression (GTEx) datasets. Correlations between gene expression and infiltration by immune cells were assessed using TIMER, EPIC, MCPcounter, xCell, CIBERSORT, and quanTIseq. Immunophenoscore (IPS) was used to assess the potential application of the biomarkers to all TCGA tumors.
Results: Analysis of CTR-DB data identified CD69 and SBK1 as potential biomarkers of response to PD-1/PD-L1 blockade. Correlation analysis revealed that in various TCGA cancer datasets, CD69 expression level correlated positively with most immune checkpoints and tumor-infiltrating immune cells, while SBK1 expression level correlated negatively with infiltrating immune cells. IPS analysis demonstrated the ability of CD69 and SBK1 to predict PD-1/PD-L1 blockade responses in various cancers.
Conclusion: CD69 and SBK1 are potential predictors of response to cancer immunotherapy using PD-1/PD-L1 blockade. These biomarkers may guide treatment decisions, leading to precise treatment and minimizing the waste of medical resources.
The development of immune checkpoint blockade therapy, especially strategies that target PD-1 or PD-L1, has revolutionized the treatment of various cancers (1). Several antibodies for blocking PD-1 (such as pembrolizumab and nivolumab) and PD-L1 (such as atezolizumab and avelumab) are FDA approved for clinical use against various cancers, including head and neck cancer, melanoma, and lung cancer (2–5). Several clinical trials have associated PD-1/PD-L1 blockade immunotherapy with superior prognosis when compared with standard chemotherapy (6, 7).
However, only 20%–40% of cancer patients achieve sustained response to PD-1/PD-L1 blockade immunotherapy (8–10) and some patients have been found to experience cancer hyper-progression (11). Clinically, tumor proportional score (TPS) and combined positive score (CPS) based on immunohistochemical analysis of PD-L1 levels are the most widely used predictors of response to PD-1/PD-L1 blockade. However, it has limitations (9) and the development of robust biomarkers remains a significant challenge. Thus, effective biomarkers are still urgently needed for guiding treatment decisions.
Here, we mined data on the Cancer Treatment Response gene signature Database (CTR-DB) (12) and identified candidate biomarkers. We then performed a comprehensive pan-cancer analysis through The Cancer Genome Atlas (TCGA) (13) with the aim of uncovering potential biomarkers of clinical response to PD-1/PD-L1 blockade cancer immunotherapy, which may be helpful to improve the prediction accuracy in clinic.
Data on gene expression levels and responses to PD-1/PD-L1 blockade immunotherapy were obtained from CTR-DB (12). Three lung cancer datasets (CTR_RNAseq_13, CTR_RNAseq_197, and CTR_RNAseq_381) and 10 melanoma datasets (CTR_RNAseq_11, CTR_RNAseq_96, CTR_RNAseq_165, CTR_RNAseq_178, CTR_RNAseq_179, CTR_RNAseq_189, CTR_RNAseq_225, CTR_RNAseq_289, CTR_RNAseq_370, CTR_RNAseq_502) were downloaded from CTR-DB and analyzed. All patients involved in the datasets had been treated with PD-1/PD-L1 blockade immunotherapy only. Data for pan-cancer analysis were obtained from TCGA via UCSC Xena (14). Corresponding normal tissue gene expression data were downloaded from Genotype-Tissue Expression (GTEx) program (15). Because these resources are publicly available, their use did not require approval by the local ethics committee.
Differentially expressed genes (DEGs) were identified using negative binomial distribution analysis with adjusted p-value (Benjamini–Hochberg multiple testing correction method) using the R package, DESeq2. Batch effect removal was done by the “ComBat_seq” function of the “SVA” R package. Log2 (fold change) = >1 and q-value = <0.01 were used as cutoff thresholds for identifying DEGs. Gene set enrichment analysis (GSEA) was implemented through Kyoto Encyclopedia of Genes and Genomes (KEGG).
Protein–protein interaction (PPI) analysis was done using the GeneMANIA (16), which offers a biological network integration method of predicting gene function. For genes that were differentially expressed in the response versus non-response group, the top 10 upregulated protein-coding genes (based on log FC value) were subjected to PPI analysis. For similar genes identified using GEPIA2 (17), the top 10 protein-coding genes (based on Pearson’s correlation coefficient) were subjected to PPI analysis.
Correlation between the gene expression levels and overall survival (OS) was determined using the Cox proportional hazards regression model and log-rank test using the R package, SURVIVAL. Tumors with significance (p<0.01) were then subjected to Receiver Operating Characteristic (ROC) curve analysis using the R package, pROC. The candidate biomarkers of response to PD-1/PD-L1 blockade cancer immunotherapy were subjected to Area Under the Curve (AUC) analysis using pROC and statistical differences calculated using one sample t test.
The correlation between candidate biomarkers and 60 immune checkpoint genes (18) was analyzed using Pearson’s correlation coefficient. Immune score, stromal score and ESTIMATE (19) (Estimation of STromal and Immune cells in MAlignant Tumour tissues using Expression data) score of 9620 samples across 33 TCGA tumors were calculated using the R package, ESTIMATE and their correlation with the expression levels of candidate biomarkers evaluated using Pearson’s correlation coefficient.
Tumor-infiltrating immune cell levels were analyzed using Tumor Immune Estimation Resource (TIMER) (20), Estimating the Proportion of Immune and Cancer cells (EPIC) (21), Microenvironment Cell Populations-counter (MCPcounter) (22), xCell (23), Cell-type Identification By Estimating Relative Subsets Of RNA Transcripts (CIBERSORT) (24) and QuanTIseq (25). The IPS (26) and tumor mutation burden (TMB) were analyzed using the R package IOBR and MAFTOOLS separately. Correlation analysis was done using Pearson’s correlation coefficient.
First, we analyzed the DEGs between responders and non-responders for lung cancer and melanoma separately. In total, 13 responders and 30 non-responders of lung cancer and 34 responders and 66 non-responders of melanoma were included in the present analysis. In all, we identified 283 DEGs in lung cancer and 133 DEGs in melanoma (Supplementary Table 1). GSEA revealed that for lung cancer, the DEGs were mainly enriched for hematopoietic cell lineage and steroid hormone biosynthesis; and that for melanoma, they were enriched for intestinal immune network for IgA production and ECM receptor interaction (Figures 1A, B). The top 10 significantly upregulated and downregulated genes are shown in Figure 1C for lung cancer and Figure 1D for melanoma. GeneMANIA analysis revealed that in lung cancer and melanoma responders, the top 10 upregulated protein-coding genes were primarily associated with cytokine activity and B cell activation, respectively (Figures 1E, F).
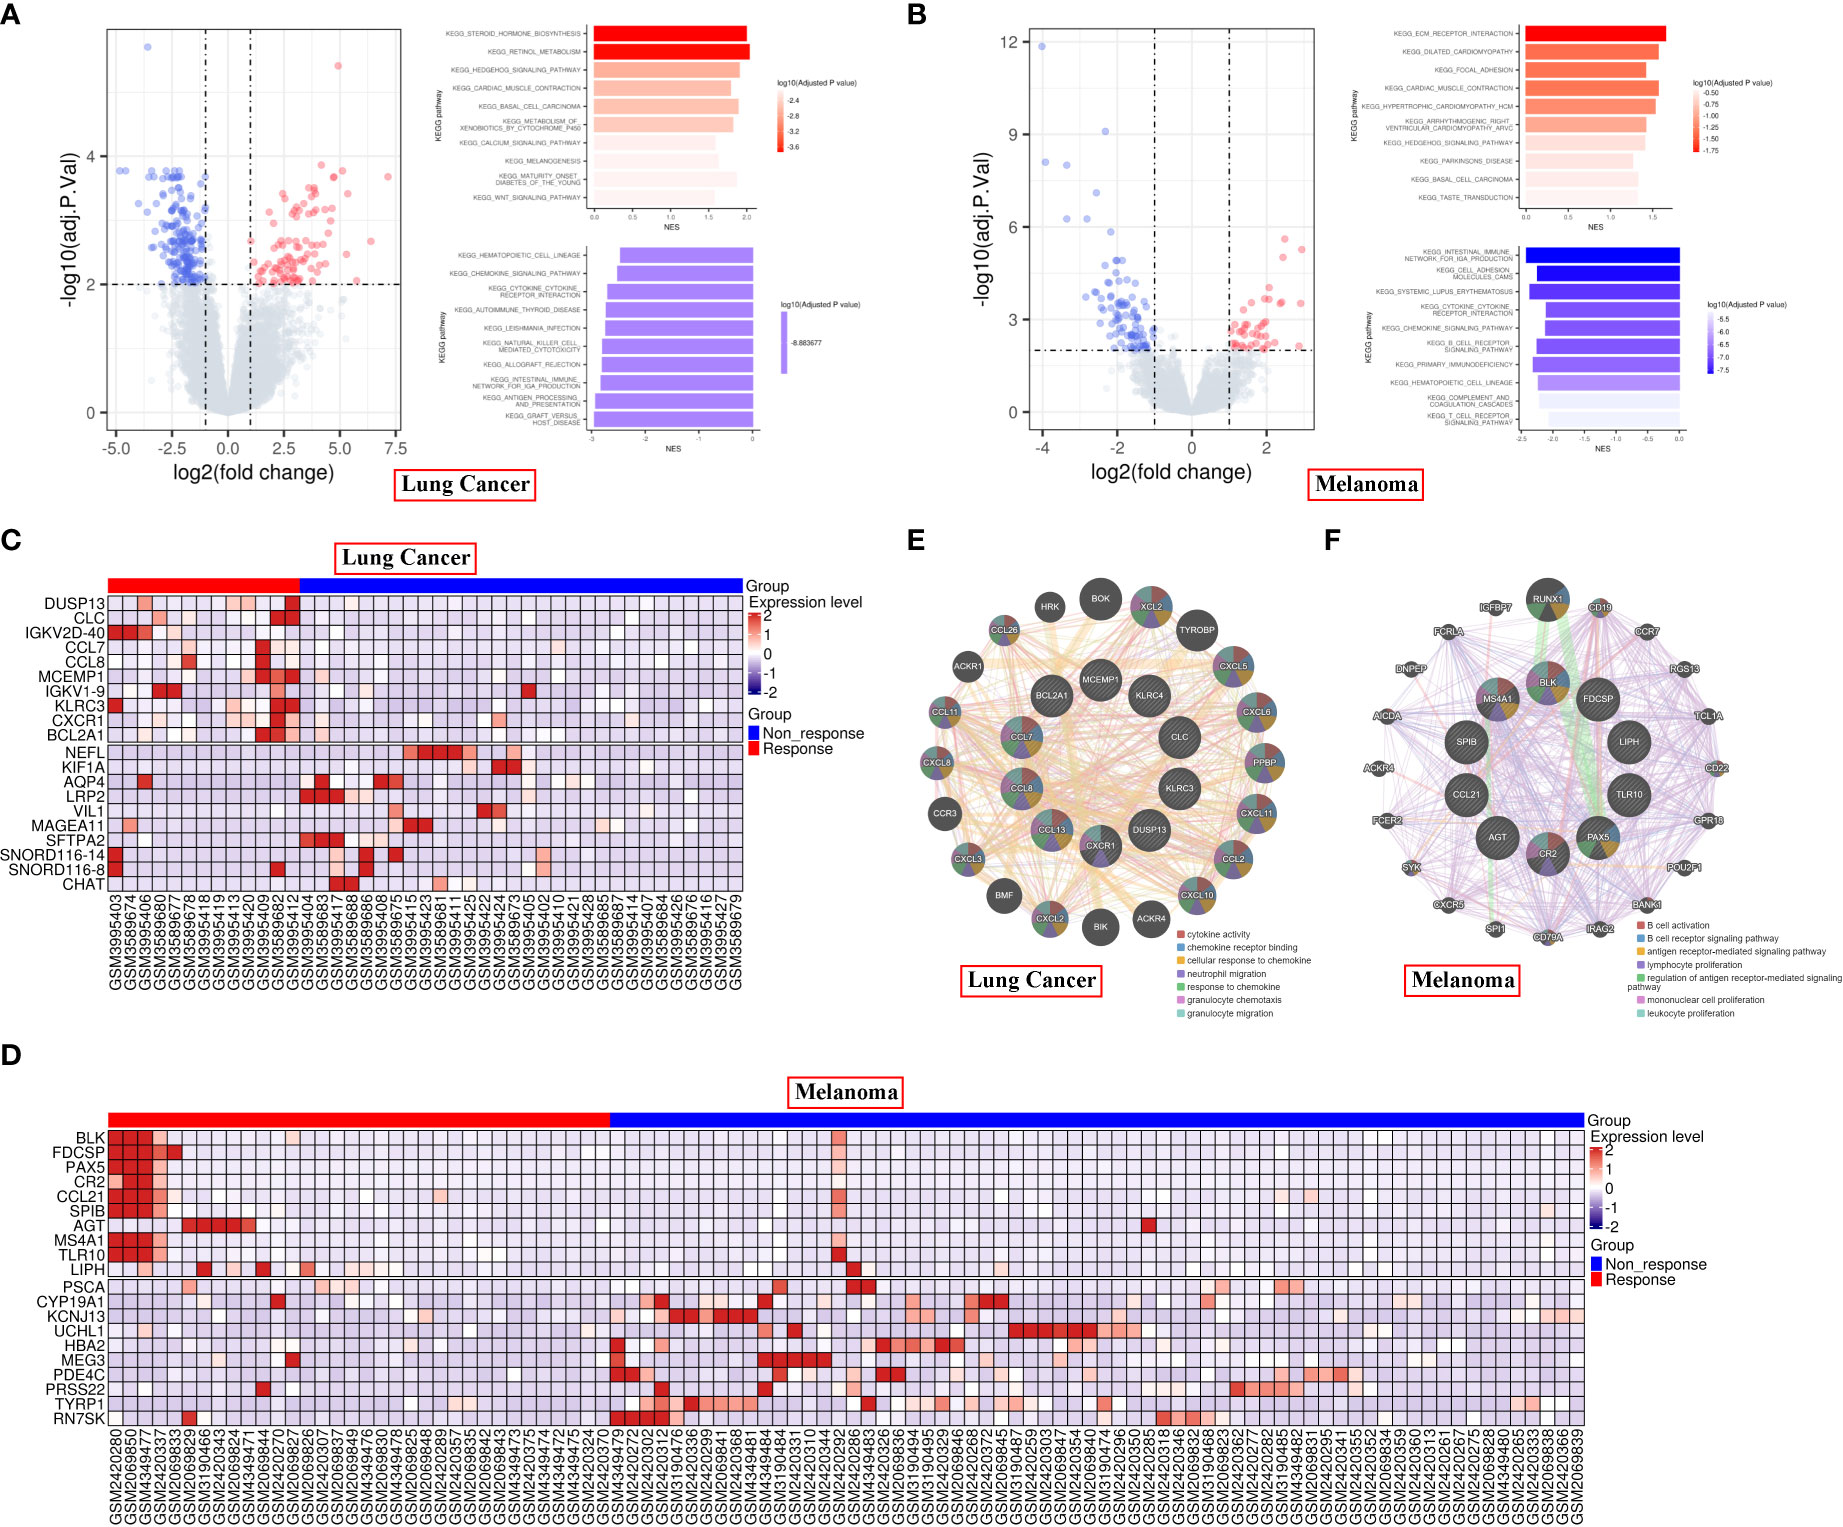
Figure 1 Differential gene expression in responder vs non-responder patients with lung cancer or melanoma. (A, B) Volcano plot and KEGG pathways of the DEGs in lung cancer (A) and melanoma (B). (C, D) Heatmap of the top 10 significantly upregulated or downregulated genes in lung cancer (C) and melanoma (D). (E, F) PPI analysis of the top 10 upregulated protein-coding genes in lung cancer (E) and melanoma (F) responders.
Next, we sought to identify potential biomarkers of pan-cancer response to PD-1/PD-L1 blockade immunotherapy. Based on the intersection, CD69, SBK1 and RN7SK were identified as candidate biomarker genes (Figure 2A). ROC analysis revealed that AUC values for the ability of CD69, SBK1 and RN7SK to predict response to PD-1/PD-L1 blockade immunotherapy in lung cancer were 0.754, 0.803, and 0.797, respectively (Figures 2B–D), while in melanoma they were 0.637, 0.668, and 0.597, respectively (Figures 2E–G). However, the ability of RN7SK to predict melanoma response was not statistically significant (Figure 2G, p=0.0957). Thus, CD69 and SBK1 were regarded as candidate biomarkers. Further analysis showed that in lung cancer responders, CD69 was upregulated while SBK1 was downregulated and that in melanoma responders, both were upregulated (Figures 2H, I).
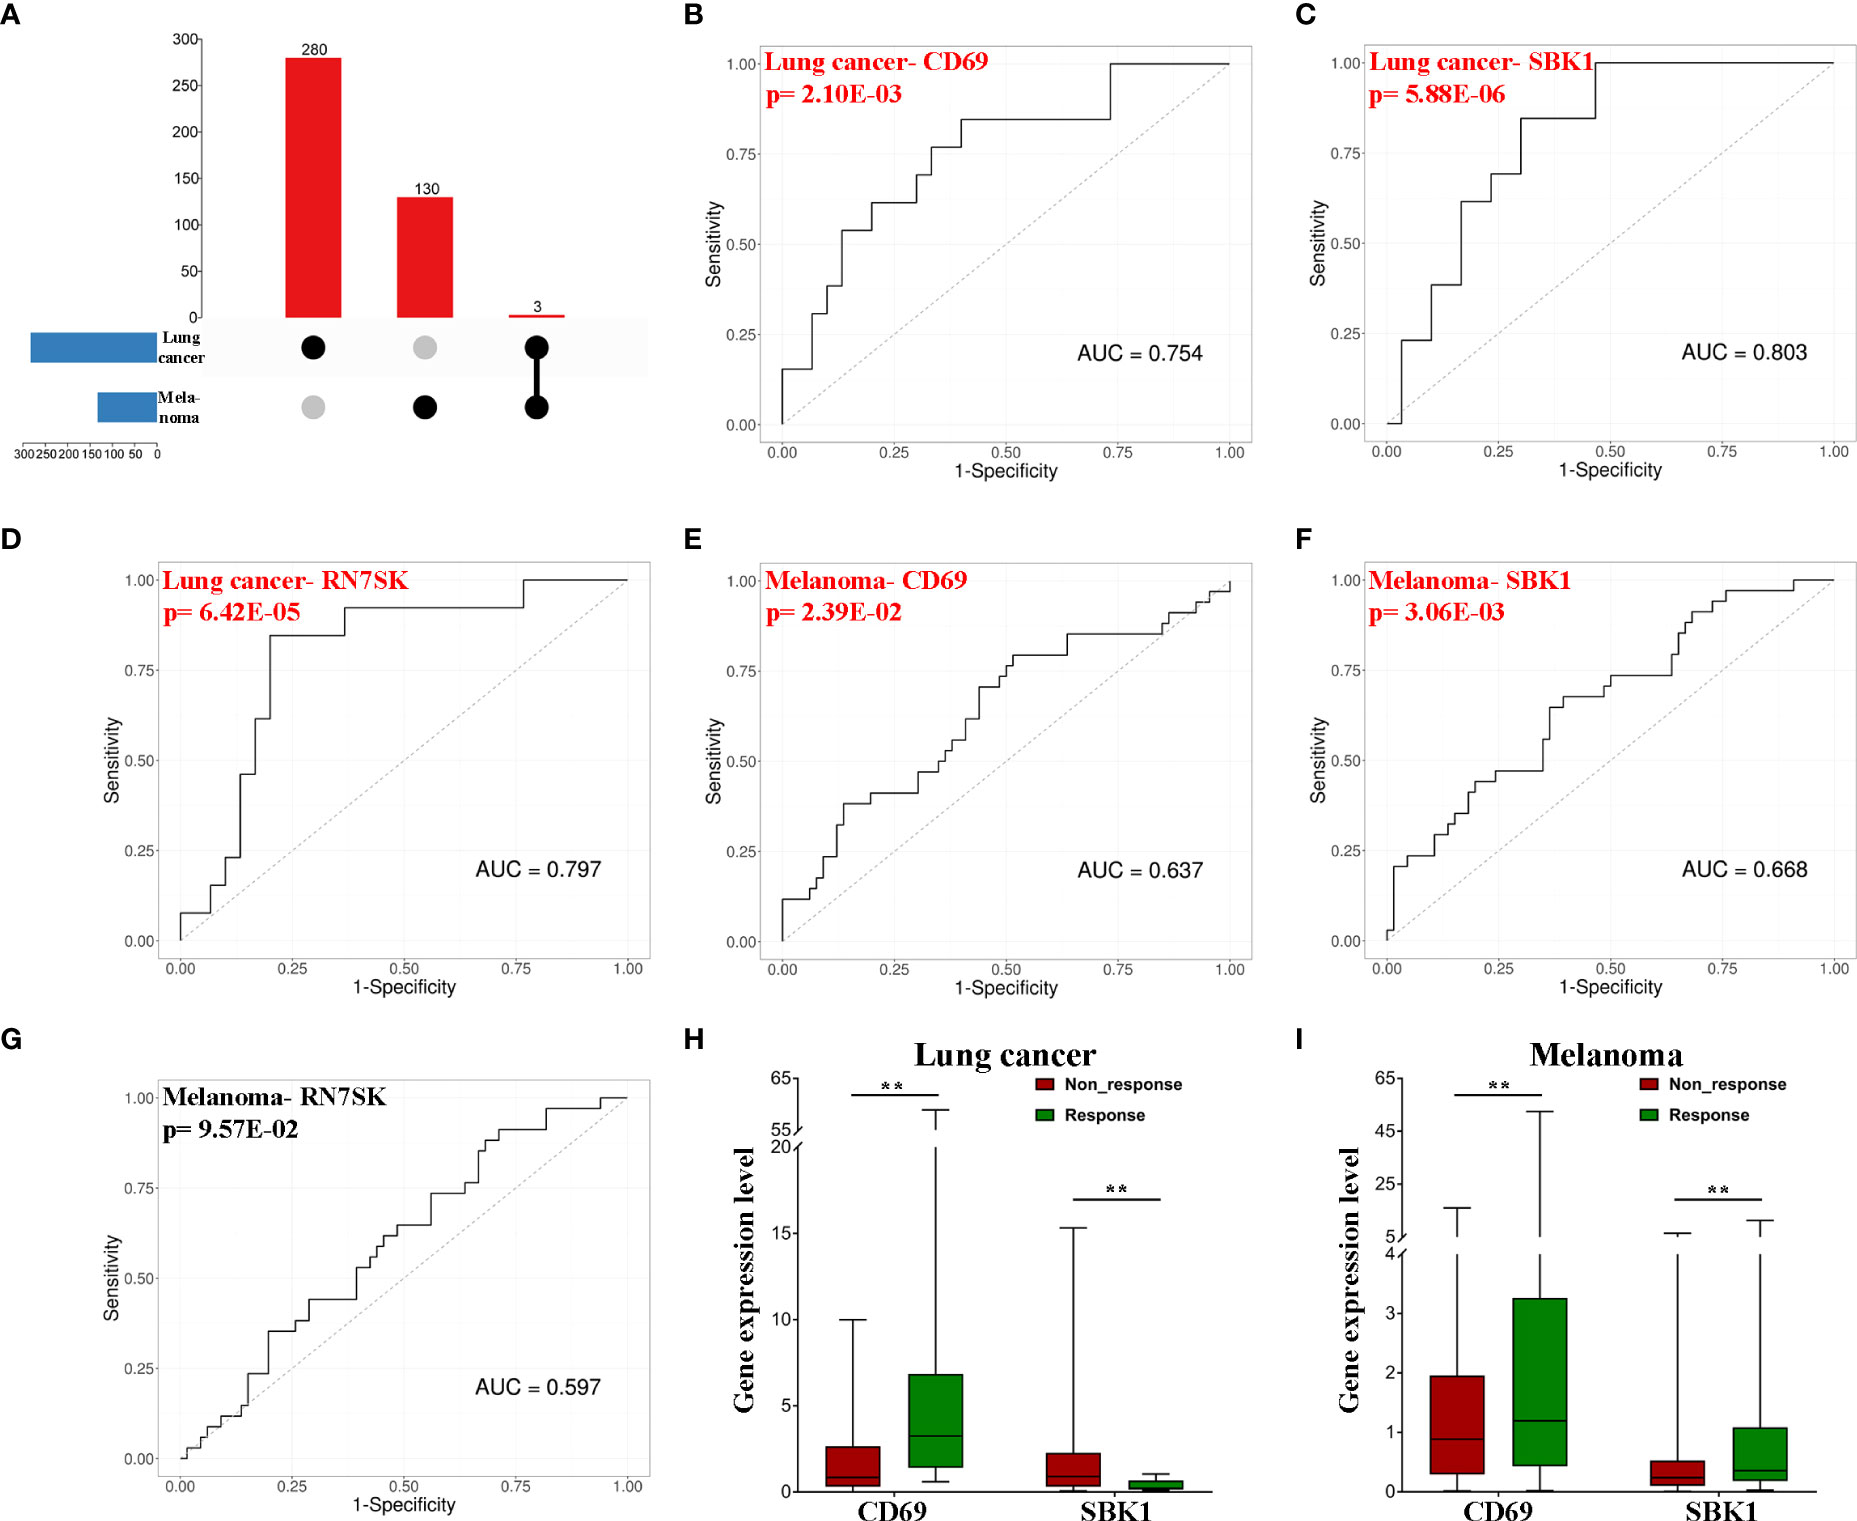
Figure 2 CD69 and SBK1 are potential biomarkers of response to PD-1/PD-L1 blockade immunotherapy. (A) Up-set of common genes between lung cancer and melanoma responders. (B–G) Separate ROC analysis of the 3 common genes in lung cancer and melanoma. (H) CD69 (|LogFC|=2.45, adjusted p-value=4.40E-03) is upregulated in lung cancer responders (responders 8.05 ± 4.33, non-response 1.84 ± 0.44), while SBK1 (|LogFC|=2.04, adjusted p-value=1.11E-03) is downregulated (responders 0.39 ± 0.09, non-response 1.80 ± 0.53). (I) both CD69 (|LogFC|=1.63, adjusted p-value=3.04E-03, responders 6.34 ± 2.47, non-response 1.76 ± 0.36) and SBK1 (|LogFC|=1.3, adjusted p-value=7.16E-03, responders 1.26 ± 0.44, non-response 0.51 ± 0.12) are upregulated in melanoma responders. ** indicates p<0.01.
We then compared the mRNA levels of CD69 and SBK1 in tumor versus normal tissues using TCGA and GTEx datasets. Analysis of TCGA lung cancer datasets (LUAD and LUSC) showed that while CD69 exhibited positive correlation with PD-1 and PD-L1, SBK1 exhibited negative correlation (Figure 3A). Similar observations were made upon pan-cancer data analysis (Figure 3C). Analysis of melanoma datasets (SKCM and UVM) showed that CD69 expression positively correlated with PD-1 and PD-L1 but the correlation between SBK1 and PD-1 or PD-L1 was not significant (Figure 3B).
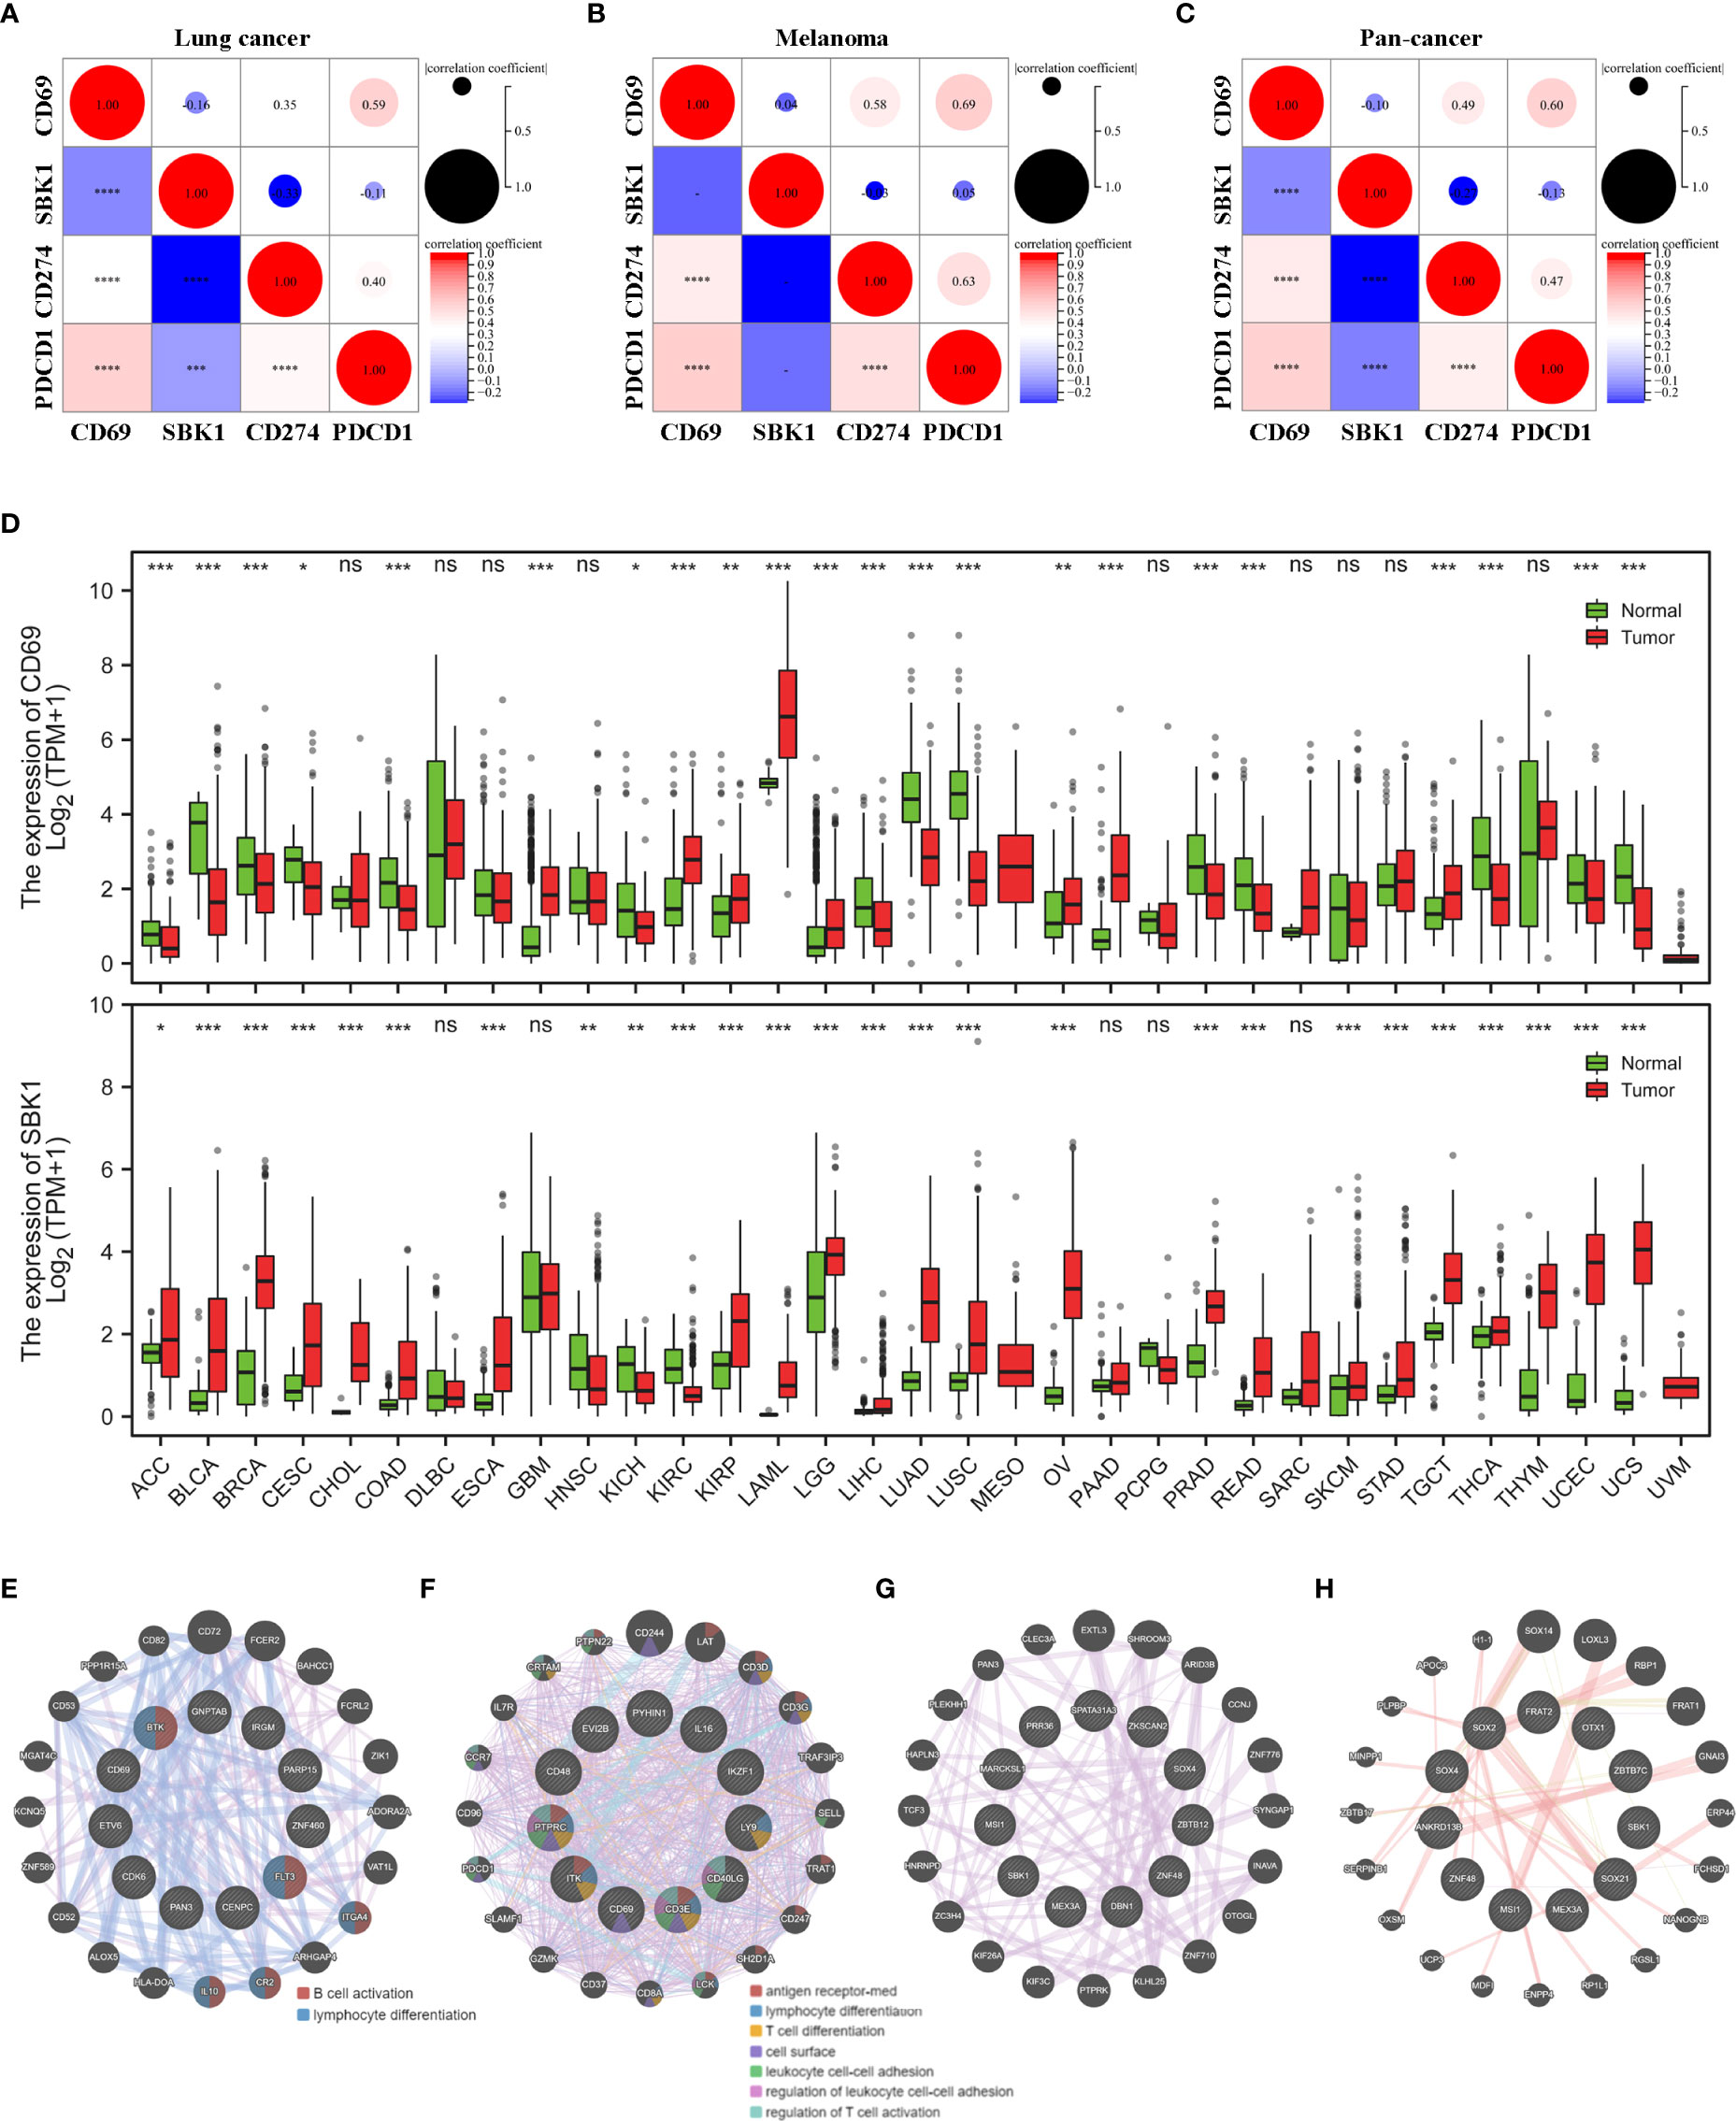
Figure 3 CD69 and SBK1 are aberrantly expressed in most TCGA tumors. (A, C) Separate analysis of correlation between CD69, SBK1, PD-L1 (CD274), and PD-1 (PDCD1) expression in TCGA lung cancer (A), melanoma (B), and pan-cancer (C). (D) Differences in the expression of CD69 and SBK1 in TCGA tumors versus corresponding normal tissues. (E, F) PPI analysis of CD69 similar genes in its 8 upregulated (E) and 14 downregulated (F) tumors. (G, H) PPI analysis of SBK1 similar genes in its 23 upregulated (G) and 3 downregulated (G) tumors. – indicates not significant (ns). * indicates p<0.05. ** indicates p<0.01. *** indicates p<0.001. **** indicates p<0.0001.
Out of 33 TCGA tumors, CD69 was upregulated in 8 and downregulated in 14, while SBK1 was upregulated in 23 and downregulated in 3 (Figure 3D). Through GEPIA2 we screened the similar expression genes of CD69 and SBK1 (Supplementary Table 2). PPI analysis showed that in tumors with upregulated CD69, the similar genes were primarily related to B cell activation and lymphocyte differentiation (Figure 3E) and that in tumors with downregulated CD69, the similar genes were primarily related to antigen receptor-mediated signaling pathway and lymphocyte differentiation (Figure 3F). However, no meaningful function entry of SBK1 similar genes was found in neither SBK1 upregulated (Figure 3G) nor downregulated (Figure 3H) tumors.
Analysis of the correlation between the mRNA levels of CD69 and SBK1, and overall survival in TCGA tumors revealed that high CD69 expression correlated with poor prognosis in LGG, STAD, and UVM, and with better prognosis in LUAD, SARC and SKCM (Figure 4A). High SBK1 levels correlated with poorer prognosis in ACC, LIHC and SARC, and with better prognosis in CESC, LGG and THYM (Figure 4B). Data on ROC analysis on tumors with p<0.01 following univariate analysis are shown in Figures 4C–H.
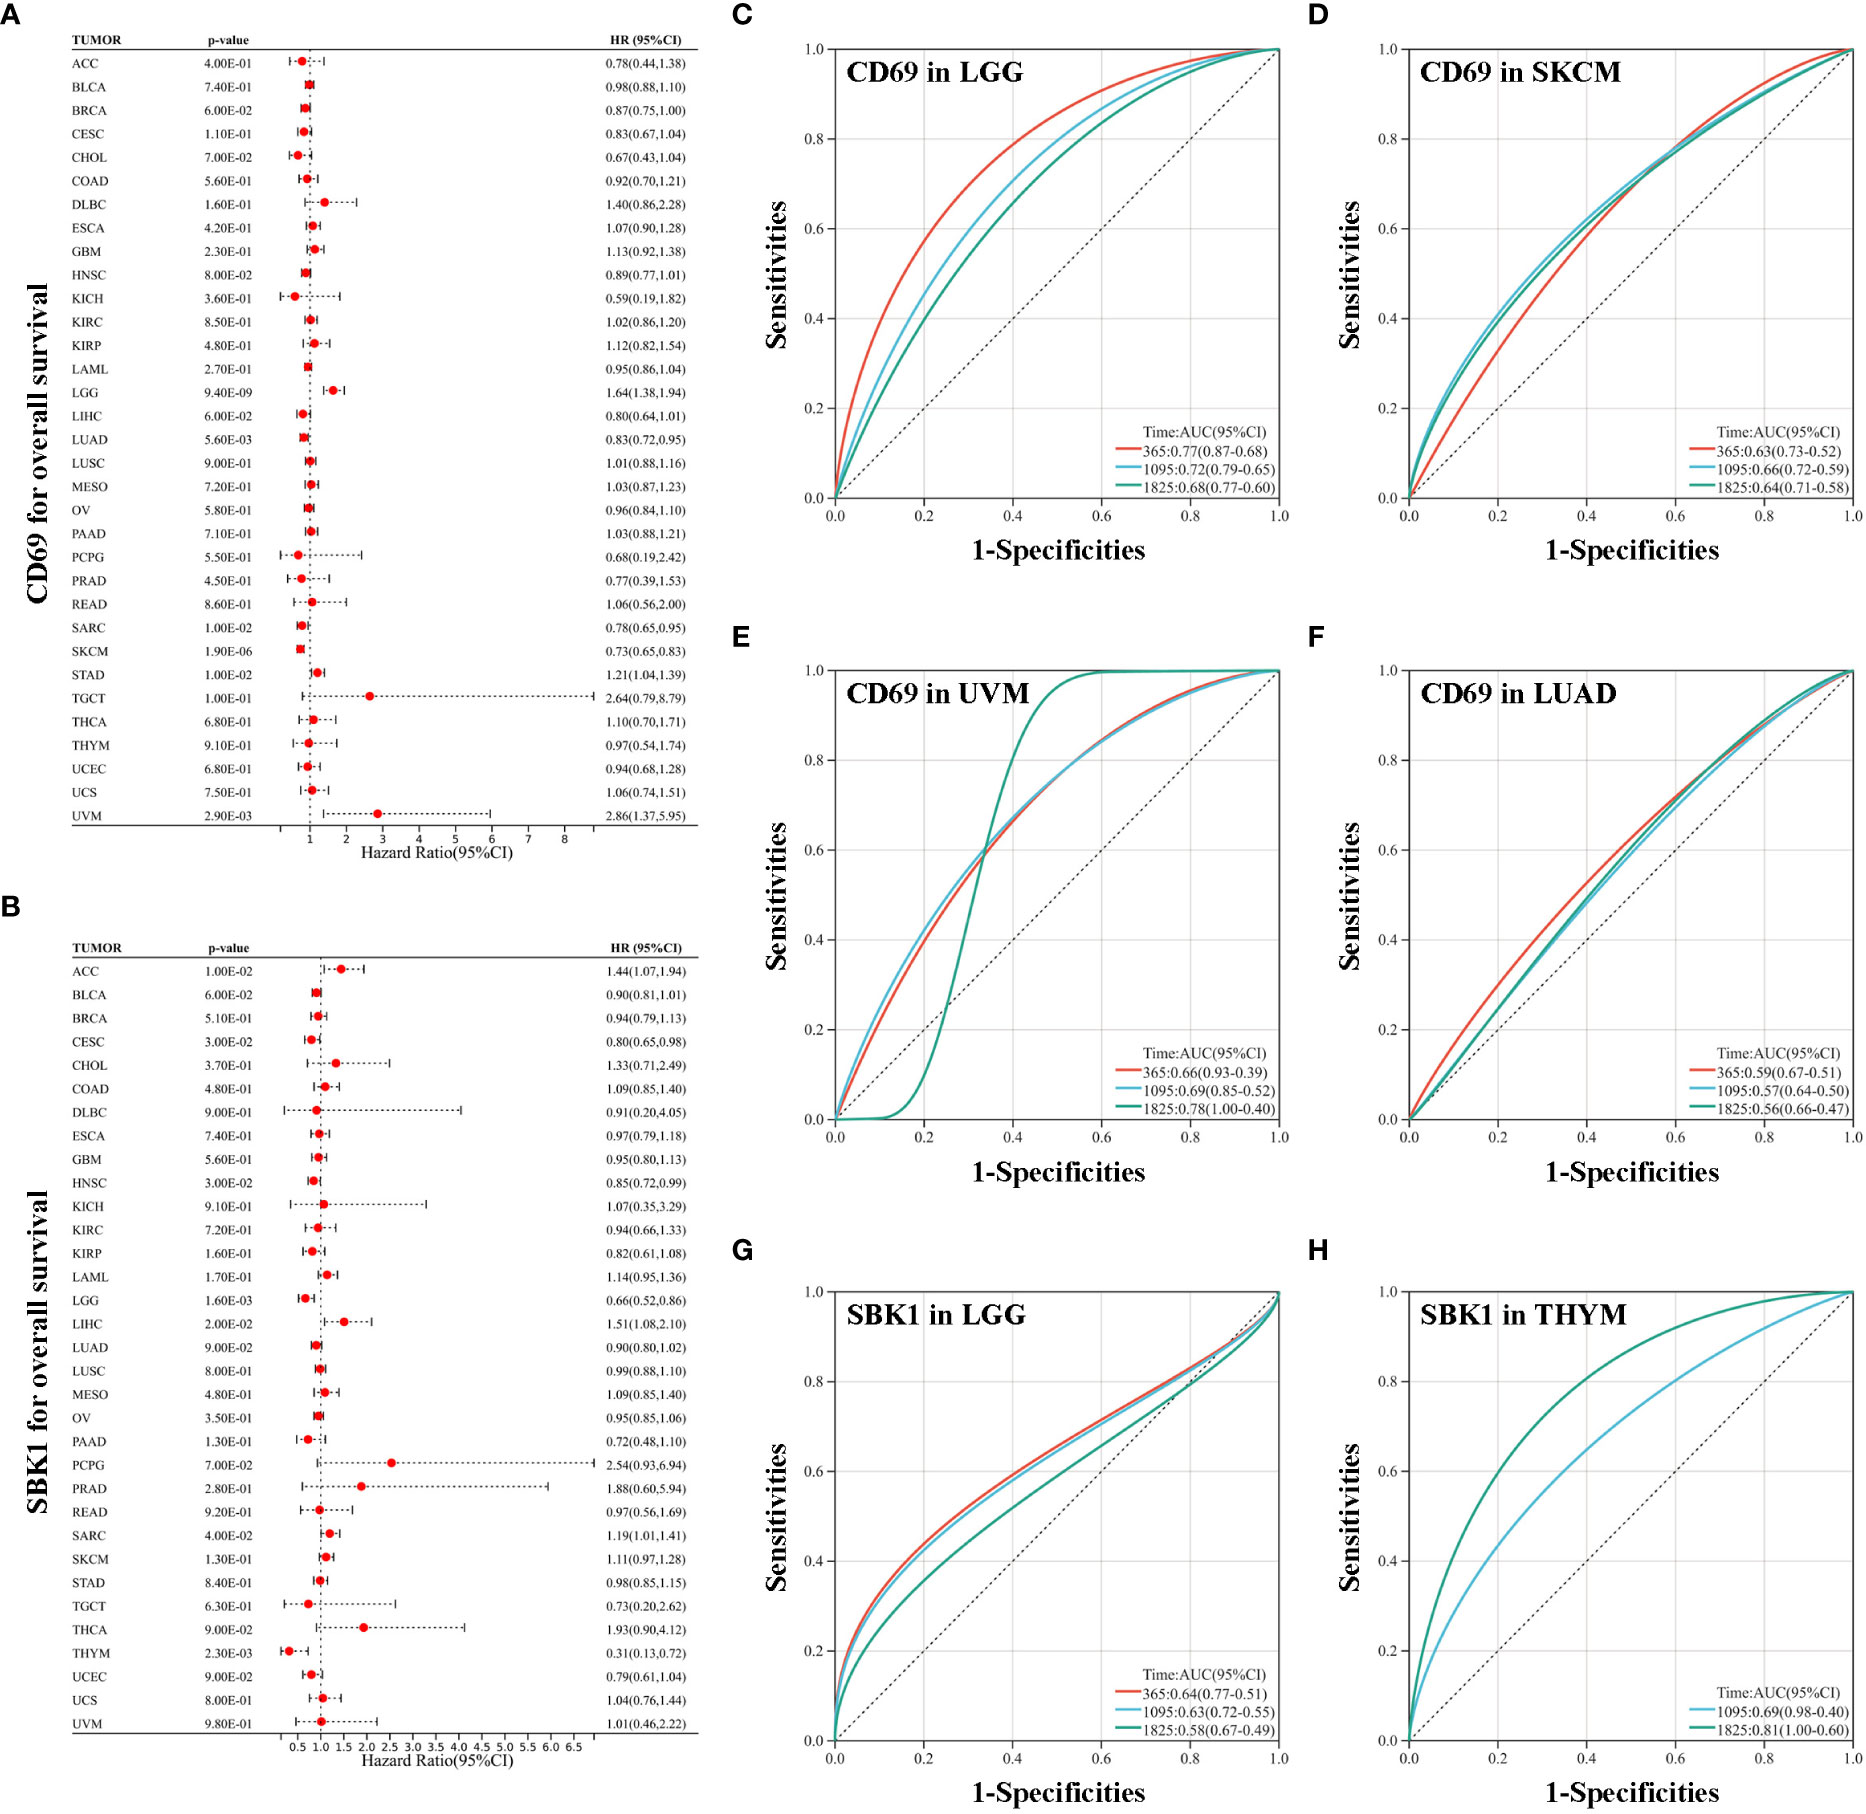
Figure 4 Analysis of the correlation between survival and the expression levels of CD69 and SBK1. (A) CD69 expression levels correlate with poor prognosis in LGG, STAD and UVM, and with improved prognosis in LUAD, SARC and SKCM. (B) SBK1 expression levels correlate with poor prognosis in ACC, LIHC and SARC, and with improved prognosis in CESC, LGG and THYM. (C–F) ROC analysis of the ability of CD69 to predict the 1-, 3-, and 5-year OS of LGG (C), SKCM (D), UVM (E), and LUAD (F). (G, H) ROC analysis of the ability of SBK1 to predict the 1-, 3-, and 5-year OS of LGG (G) and THYM (H).
Next, analysis of the correlation between the levels of CD69 and SBK1, and the levels of immune checkpoint genes revealed that CD69 mRNA levels positively correlated with the levels of most immune checkpoints in most TCGA tumors (Figure 5A, Supplementary Figure 1A, Supplementary Table 3). Interestingly, the levels of SBK1 mRNA exhibited positive or negative correlation with immune checkpoints in different tumors (Figure 5A, Supplementary Figure 1B, Supplementary Table 3). ESTIMATE analysis showed that the expression levels of CD69 correlated positively with ESTIMATE score and immune Score in 32 of 33 TCGA tumors (except LAML) (Figure 5B), and that SBK1 levels negatively correlated with ESTIMATE score and immune score in 21 of 33 tumors (Figure 5C).
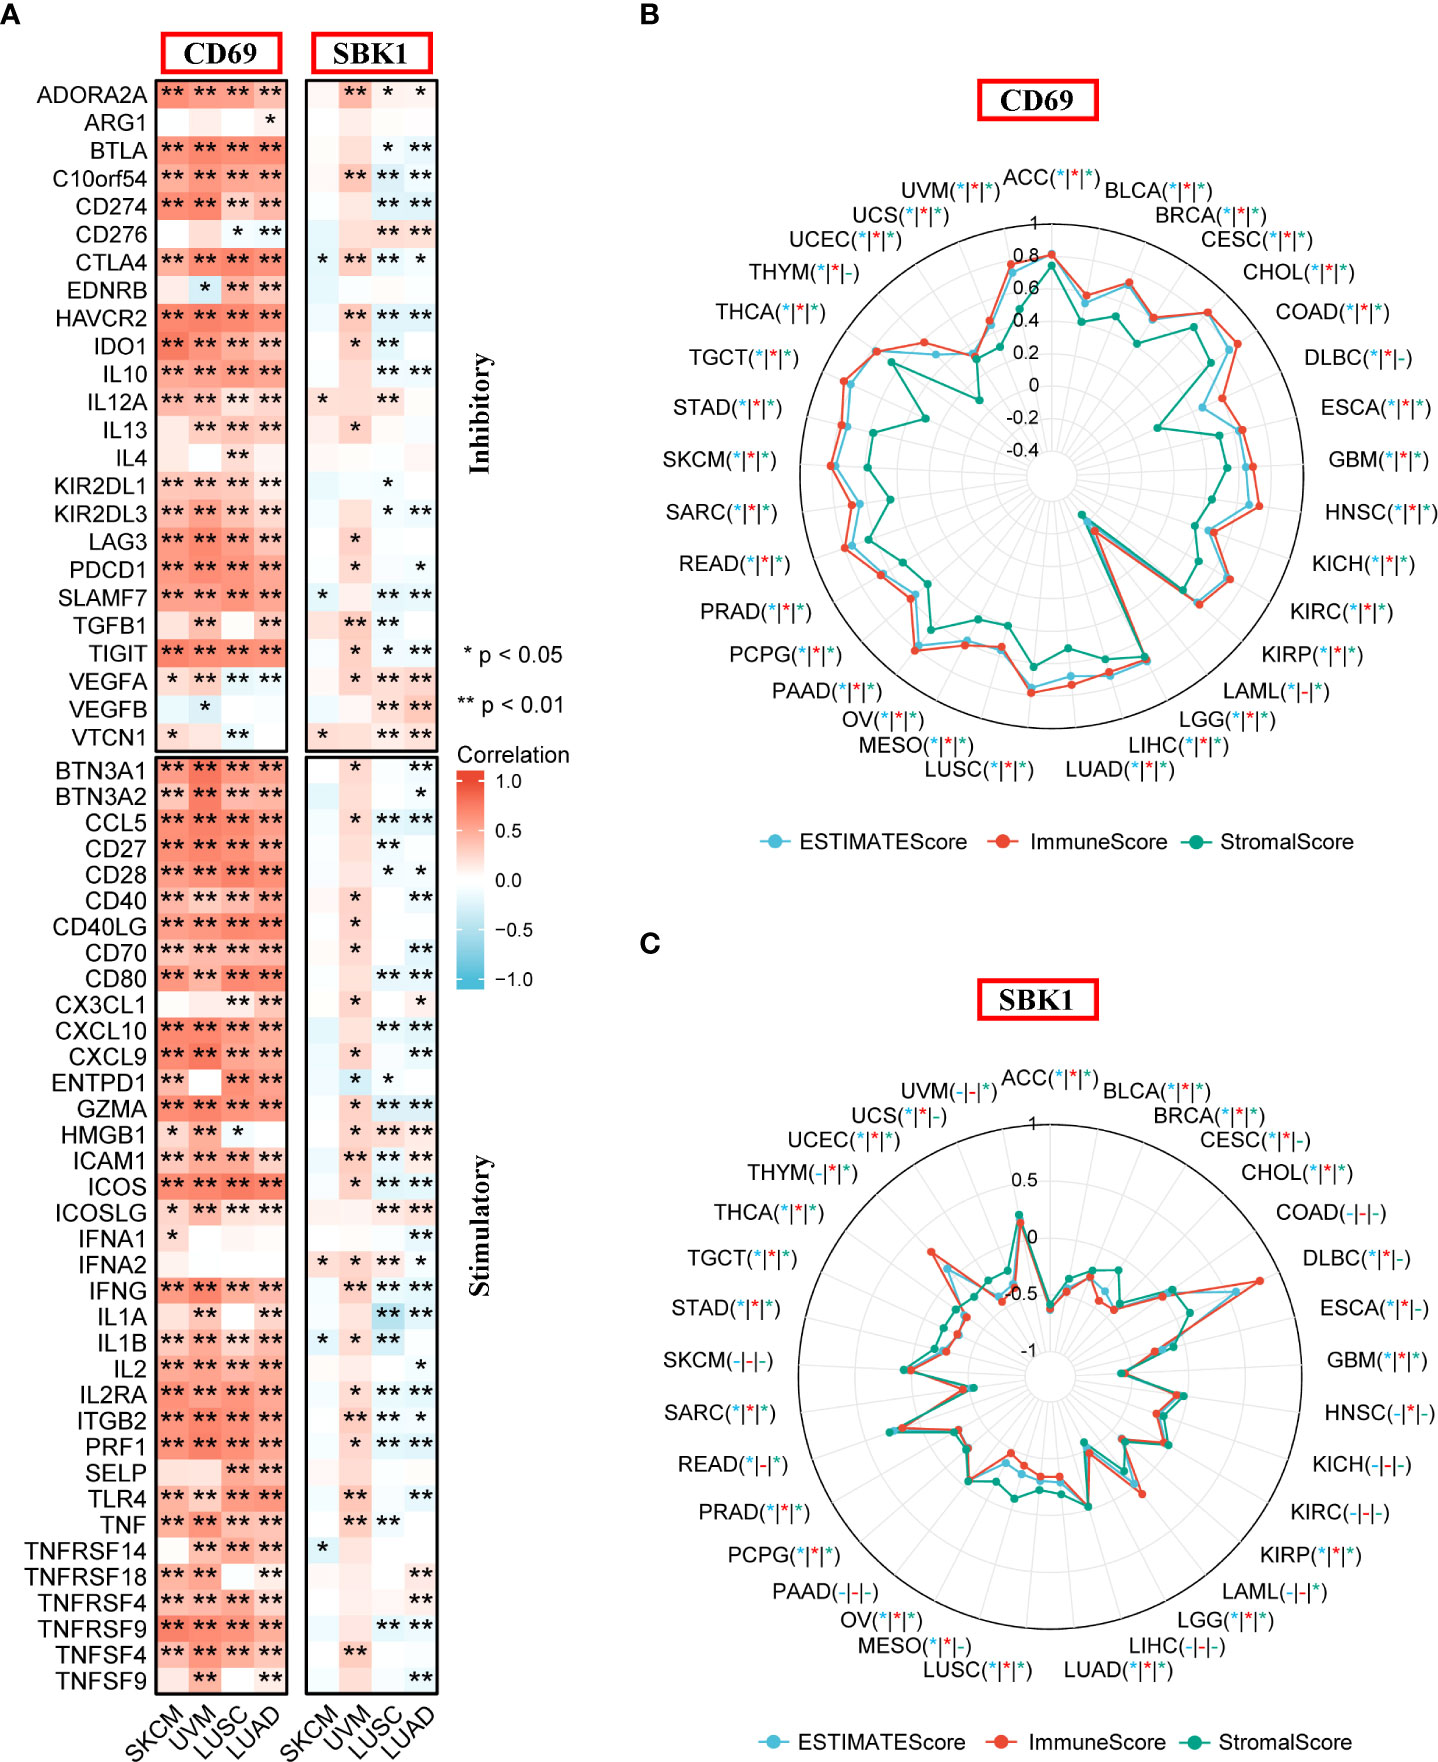
Figure 5 Analysis of the correlation between CD69 and SBK1 expression levels and immune checkpoints and ESTIMATE score. (A) Correlation between immune checkpoints and the expression levels of CD69 and SBK1 in Lung Cancer and Melanoma related TCGA cohorts. (B, C) ESTIMATE analysis of CD69 (B) and SBK1 (C) in TCGA tumors. – indicates not significant. * indicates p<0.05. ** indicates p<0.01.
Finally, we assessed the correlation between the mRNA levels of CD69 and SBK1 and infiltrating immune cells and IPS. This analysis found that CD69 mRNA levels positively correlated with immune cell infiltration levels in most tumors (Figure 6A, Supplementary Figure 2A, Supplementary Table 4), and that SBK1 mRNA levels negatively correlated with tumor infiltration by most immune cells (Figure 6A; Supplementary Figure 2B; Supplementary Table 4). Further analysis of the ability of CD69 and SBK1 to predict response to PD-1/PD-L1 blockade cancer immunotherapy using IPS showed that the levels of CD69 correlated positively with MHC and EC in 31 of 33 tumors, negatively with SC and CP in 32 of 33 tumors, and positively with IPS in 14 of 33 tumors (Figures 6B, 7A, Supplementary Table 5). SBK1 levels correlated negatively with MHC and EC in 18 of 33 tumors, positively with SC and CP in 18 of 33 tumors, and negatively with IPS in 13 of 33 tumors (Figures 6B, 7B, Supplementary Table 5). Furthermore, CD69 levels correlated positively with TMB in 4/33 tumors and negatively in 11/33 tumors (Supplementary Figure 3A), while SBK1 levels correlated positively with TMB in 2/33 tumors and negatively in 4/33 tumors (Supplementary Figure 3B).
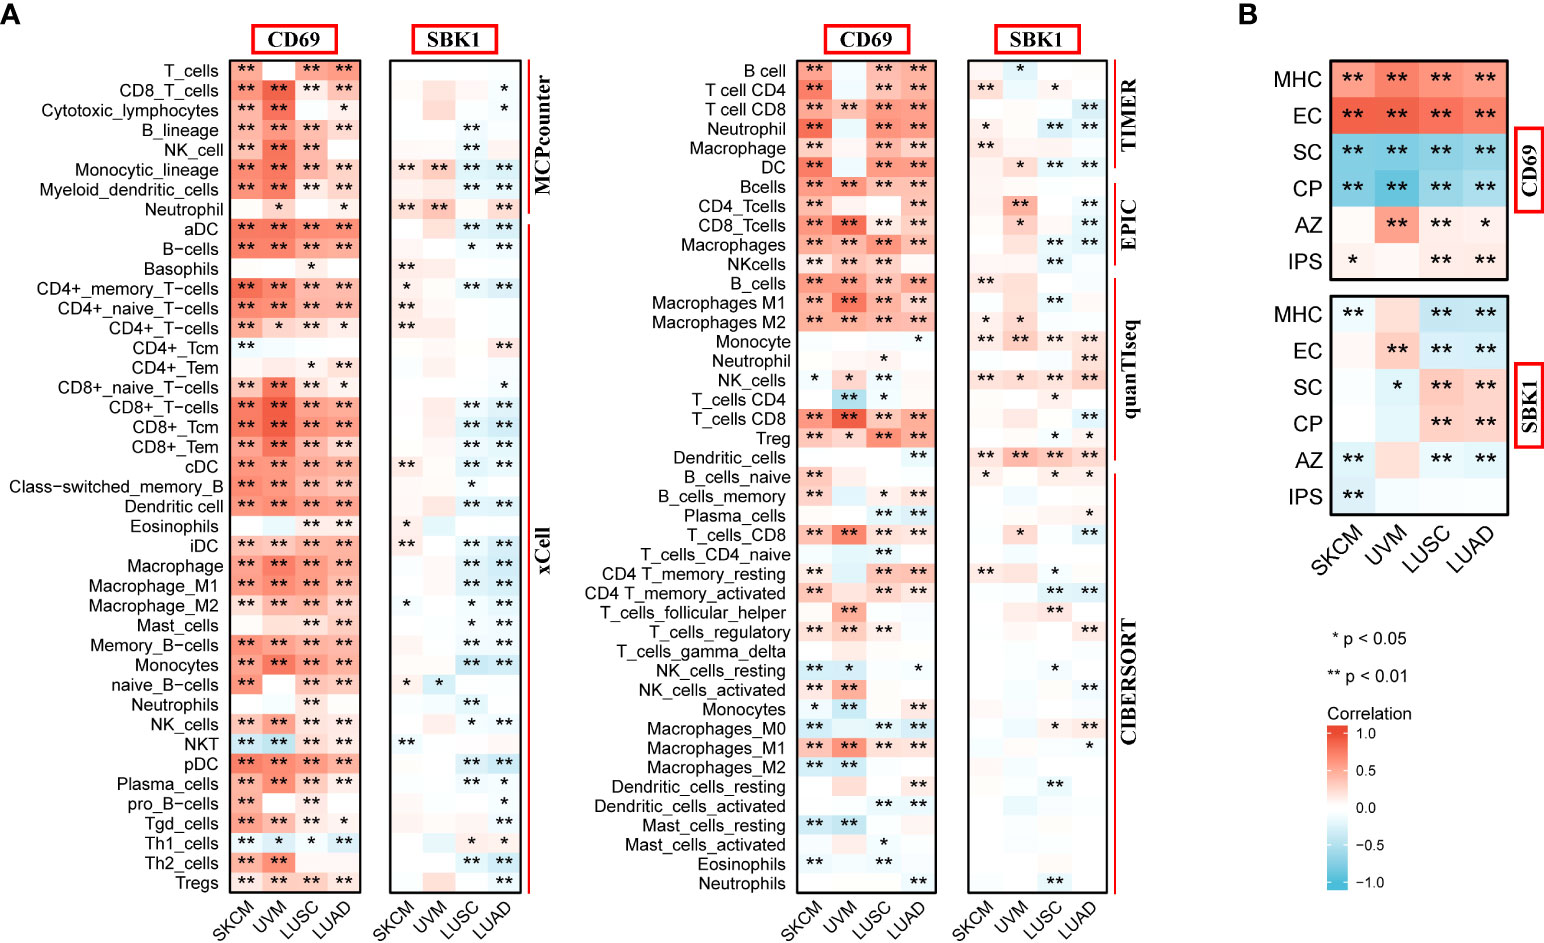
Figure 6 Analysis of correlation between the levels of CD69 and SBK1, and infiltrating immune cells and IPS. (A) CD69 positively correlates with various immune cells in SKCM, UVM, LUSC and LUAD, while SBK1 negatively correlates with various immune cells in Lung Cancer related cohorts LUSC and LUAD. (B) CD69 levels positively correlate with IPS in SKCM, LUSC and LUAD, while SBK1 levels negatively correlate with IPS in SKCM. MHC, major histocompatibility complex; CP, immune checkpoints; EC, effector cells; SC, suppressor cells; AZ, average z-scores. * indicates p<0.05. ** indicates p<0.01.
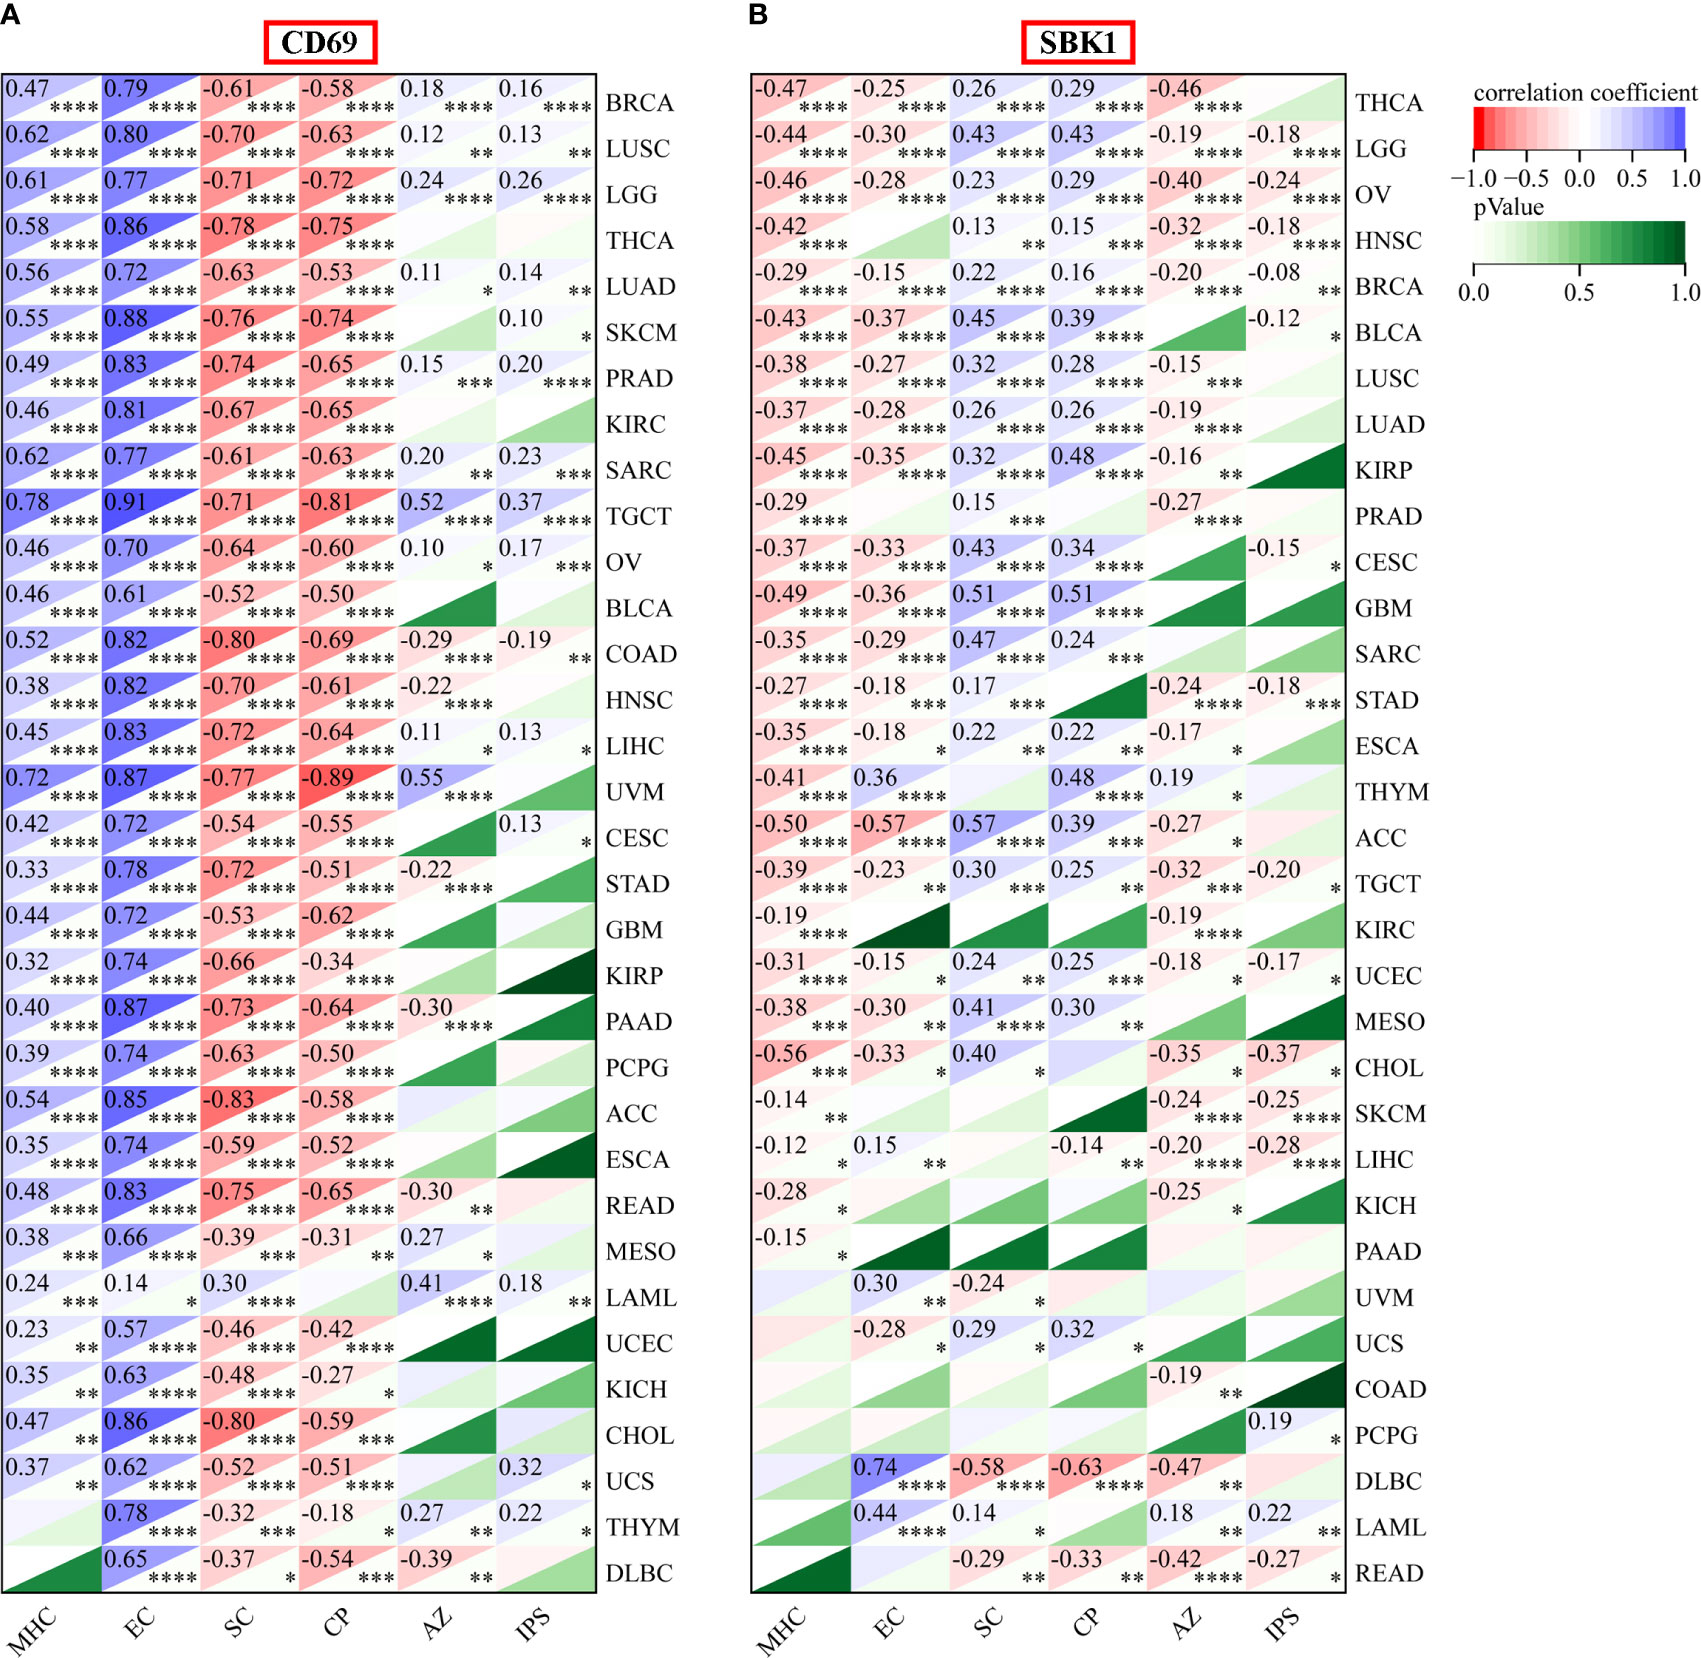
Figure 7 IPS analysis of CD69 and SBK1 in TCGA tumors. (A) CD69 levels positively correlate with IPS in various tumors. Top left corner: correlation coefficient. Lower right corner: p-value. (B) SBK1 levels negatively correlate with IPS in various tumors. MHC: major histocompatibility complex, CP, immune checkpoints; EC, effector cells; SC, suppressor cells; AZ, average z-scores. * indicates p<0.05. ** indicates p<0.01. *** indicates p<0.001. **** indicates p<0.0001.
Although PD-1/PD-L1 blockade exhibits remarkable anticancer efficacy and safety, it is estimated that it benefits less than half of applicable cancer patients (8–10). To better predict response to PD-1/PD-L1 blockade and avoid the waste of medical resources, robust biomarkers have been developed using various strategies, including imaging omics (27, 28) and patient derived biological materials (29–31). Furthermore, genomic based biomarkers, like Tumor Mutational Burden (32), Antigen Processing Machinery score (33), Tumor Immune Dysfunction and Exclusion score (34) and Gene Expression Profiles score (35) are reported as prediction biomarkers. However, the high cost and time-consuming of whole genome sequencing or whole exome sequencing hampered the utility for clinical decision-making (36). Hence, molecular markers that could be applied to improve the prediction accuracy in clinic are still urgently needed. Herein, we sought to develop effective molecular biomarkers for identifying cancer patients who are likely to benefit from PD-1/PD-L1 blockade immunotherapy.
We find that CD69 and SBK1 are differentially expressed in cancer patients who respond to PD-1/PD-L1 blockade when compared with non-responders, and that they are potential biomarkers of response to PD-1/PD-L1 blocking cancer immunotherapy. In humans, the CD69 gene, encodes a disulfide-linked homodimeric protein with two differentially glycosylated subunits (37, 38). Early studies identified CD69 as an early activation marker of various leucocytes, including B cells, T cells, and NK cells (39, 40). However, the roles of CD69 in immune reaction reported by recent studies are controversial. For example, while some studies have implicated the loss of CD69 and autoimmune diseases, others show that CD69 stimulates immune response (41). Here, analysis of CTR-DB data showed that CD69 is upregulated in lung cancer and melanoma patients who respond to PD-1/PD-L1 blockade, highlighting its potential as a predictor of pan-cancer response to anti-PD-1/PD-L1 immunotherapy.
In contrast, we found that while SBK1 levels are downregulated in lung cancer patients who respond to anti-PD-1/PD-L1 immunotherapy, it is upregulated in melanoma responders. SBK1 was first identified as a novel serine/threonine kinase in 2001 and named based on its protein structure (42). Human SBK1 has 4 exons, a 1275 bp open reading frame, and encodes a 424-amino acid protein (43). SBK1 was initially thought to be predominantly expressed in the neurons of the developing brain. However, later studies found that it is widely distributed in various human tissues, including lungs, breasts, and prostate (44). Here, using bioinformatics analysis, we identified SBK1 as a potential predictor of response to PD-1/PD-L1 blockade cancer immunotherapy. However, this finding requires experimental validation.
To better understand the functions of CD69 and SBK1 in the tumor immune microenvironment, we carried out a comprehensive pan-cancer analysis using TCGA data. This analysis showed that CD69 is aberrantly expressed in most TCGA tumors, and that its expression positively correlated with most immune checkpoints and immune cell infiltration of the tumor microenvironment. A mounting body of evidence indicates that CD69 and its ligand, Myl9, modulate immune responses (45, 46). Mita et al. showed that CD69 could induce the exhaustion of tumor-infiltrating T cells and promote immune escape through a murine 4T1 breast tumor model (47). Furthermore, its blockade might effectively enhance anti-tumor responses (46). However, CD69 expression on memory CD8 T cells is required for cancer cell elimination and the maintenance of cancer-immune equilibrium (48, 49). Thus, CD69 has a double-edged effect in tumor immunity and here, we show that it may effectively predict response to PD-1/PD-L1 blockade.
Our analysis also revealed that SBK1 upregulation negatively correlates with most tumor-infiltrating immune cells. To our knowledge, only a few studies have examined the role of SBK1 in cancer. Consistent with our findings, SBK1 is reported to be upregulated in OV and to protect OV cells from apoptosis (43). Another study reported that lncRNA ELFN1-AS1 promotes retinoblastoma progression by upregulating SBK1 expression (50). A recent study found that SBK1 plays a key role in lipid metabolism (51). Mechanistically, SBK1 is thought to promote FGF21 expression by phosphorylating Nur77 and suppressing the expression of lipid anabolism genes (51). Thus, we speculate that SBK1 affects the immune landscape by modulating lipid metabolism in the tumor microenvironment, which warrants further investigation.
Finally, we used IPS to assess immunogenicity and response to PD-1/PD-L1 blockade cancer immunotherapy. IPS can predict response to CTLA-4 and PD-1 blockade and has been used in an increasing number of studies (52–54). Here, we show that in various tumors, IPS correlates positively and negatively with CD69 and SBK1 expression levels, respectively. These results highlight CD69 and SBK1 as potential biomarkers in various cancers. However, the clinical value of this possibility requires further research.
In summary, our study indicates that CD69 and SBK1 expression levels can effectively predict cancer response to PD-1/PD-L1 blockade immunotherapy. Such biomarkers can help to guide treatment decisions and avoid the waste of medical resources.
The original contributions presented in the study are included in the article/Supplementary Material. Further inquiries can be directed to the corresponding authors.
Ethical review and approval was not required for the study on human participants in accordance with the local legislation and institutional requirements. Written informed consent from the patients/participants or patients/participants legal guardian/next of kin was not required to participate in this study in accordance with the national legislation and the institutional requirements.
Study concept: Z-WH, W-BL, W-PW. Data acquisition and processing: Y-HW, L C, W-QC. Data analysis: Z-WH, WS, R-QM. Drafting of manuscript: Z-WH. Critical review and approval of manuscript: all authors.
This study was supported by the National Natural Science Foundation of China (NSFC) grants 82020108009, 81870696 (W-PW) and 81972527 (WS), Guangdong Natural Science Foundation of China grant 2018B030312008 (W-PW), Guangdong Research Program of Key Fields in Province 2020B1111300003 (W-PW), the Key-Area Research and Development of Guangdong Province 2020B1111190001 (WPW), and China Postdoctoral Science Foundation 2021M703712 (Z-WH).
We thank The International Postdoctoral Exchange Fellowship Program (Z-WH).
The authors declare that the research was conducted in the absence of any commercial or financial relationships that could be construed as a potential conflict of interest.
The reviewer SW declared a shared affiliation with the authors to the handling editor at time of review.
All claims expressed in this article are solely those of the authors and do not necessarily represent those of their affiliated organizations, or those of the publisher, the editors and the reviewers. Any product that may be evaluated in this article, or claim that may be made by its manufacturer, is not guaranteed or endorsed by the publisher.
The Supplementary Material for this article can be found online at: https://www.frontiersin.org/articles/10.3389/fimmu.2022.952059/full#supplementary-material
Supplementary Figure 1 | Analysis of the correlation between CD69 and SBK1 expression levels and immune checkpoints in all TCGA tumors. (A) Correlation between immune checkpoints and the expression levels of CD69. (B) Correlation between immune checkpoints and the expression levels of SBK1. * indicates p<0.05.
Supplementary Figure 2 | Analysis of correlation between the levels of CD69 and SBK1, and infiltrating immune cells in all TCGA tumors. (A) CD69 positively correlates with various immune cells in most TCGA tumors. Top left corner: p-value. Lower right corner: correlation coefficient. (B) SBK1 negatively correlates with various immune cells in most TCGA tumors. * indicates (p<0.05).
Supplementary Figure 3 | Analysis of correlation between the levels of CD69 and SBK1, and TMB in all TCGA tumors. (A) Correlation between TMB and CD69 levels. (B) Correlation between TMB and SBK1 levels. * indicates p<0.05.
Supplementary Table 1 | Detailed list of DEGs in responders versus non- responders.
Supplementary Table 2 | The CD69 and SBK1similar expression gene list from GEPIA2.
Supplementary Table 3 | Detailed results of the correlation between CD69 and SBK1 expression levels and immune checkpoints.
Supplementary Table 4 | Detailed results of the correlation between CD69 and SBK1 expression levels and infiltrating immune cells.
Supplementary Table 5 | Detailed results of the correlation between CD69 and SBK1 expression levels and IPS.
ACC, Adrenocortical carcinoma; BLCA, Bladder urothelial carcinoma; BRCA, Breast invasive carcinoma; CESC, Cervical squamous cell carcinoma and endocervical adenocarcinoma; CHOL, Cholangiocarcinoma; COAD, Colon adenocarcinoma; DLBC, Lymphoid neoplasm diffuse large B-cell lymphoma; ESCA, Esophageal carcinoma; GBM, Glioblastoma multiforme; HNSC, Head and neck squamous cell carcinoma; KICH, Kidney chromophobe; KIRC, Kidney renal clear cell carcinoma; KIRP, Kidney renal papillary cell carcinoma; LAML, Acute myeloid leukemia; LGG, Brain lower grade glioma; LIHC, Liver hepatocellular carcinoma; LUAD, Lung adenocarcinoma; LUSC, Lung squamous cell carcinoma; MESO, Mesothelioma; OV, Ovarian serous cystadenocarcinoma; PAAD, Pancreatic adenocarcinoma; PCPG, Pheochromocytoma and paraganglioma; PRAD, Prostate adenocarcinoma; READ, Rectum adenocarcinoma; SARC, Sarcoma; SKCM, Skin cutaneous melanoma; STAD, Stomach adenocarcinoma; TGCT, Testicular germ cell tumors; THCA, Thyroid carcinoma; THYM, Thymoma; UCEC, Uterine corpus endometrial carcinoma; UCS, Uterine carcinosarcoma; UVM, Uveal melanoma.
1. Voabil P, de Bruijn M, Roelofsen LM, Hendriks SH, Brokamp S, van den Braber M, et al. An ex vivo tumor fragment platform to dissect response to PD-1 blockade in cancer. Nat Med (2021) 27(7):1250–61. doi: 10.1038/s41591-021-01398-3
2. Upadhaya S, Neftelinov ST, Hodge J, Campbell J. Challenges and opportunities in the PD1/PDL1 inhibitor clinical trial landscape. Nature Revs. Drug Discov (2022) 21(7):482–3. doi: 10.1038/d41573-022-00030-4
3. Luke JJ, Rutkowski P, Queirolo P, Del VM, Mackiewicz J, Chiarion-Sileni V, et al. Pembrolizumab versus placebo as adjuvant therapy in completely resected stage IIB or IIC melanoma (KEYNOTE-716): A randomised, double-blind, phase 3 trial. Lancet (2022) 399(10336):1–12. doi: 10.1016/S0140-6736(22)00562-1
4. Burtness B, Rischin D, Greil R, Soulières D, Tahara M, de Castro GJ, et al. Pembrolizumab alone or with chemotherapy for Recurrent/Metastatic head and neck squamous cell carcinoma in KEYNOTE-048: Subgroup analysis by programmed death ligand-1 combined positive score. J Clin Oncol (2022) 40(21):2321–32. doi: 10.1200/JCO.21.02198
5. Jabbour SK, Lee KH, Frost N, Breder V, Kowalski DM, Pollock T, et al. Pembrolizumab plus concurrent chemoradiation therapy in patients with unresectable, locally advanced, stage III non-small cell lung cancer: The phase 2 KEYNOTE-799 nonrandomized trial. JAMA Oncol (2021) 7(9):1–9. doi: 10.1001/jamaoncol.2021.2301
6. Cohen EEW, Soulières D, Le Tourneau C, Dinis J, Licitra L, Ahn M, et al. Pembrolizumab versus methotrexate, docetaxel, or cetuximab for recurrent or metastatic head-and-neck squamous cell carcinoma (KEYNOTE-040): A randomised, open-label, phase 3 study. Lancet (British Edition) (2019) 393(10167):156–67. doi: 10.1016/S0140-6736(18)31999-8
7. Herbst RS, Garon EB, Kim DW, Cho BC, Gervais R, Perez-Gracia JL, et al. Five year survival update from KEYNOTE-010: Pembrolizumab versus docetaxel for previously treated, programmed death-ligand 1-positive advanced NSCLC. J Thorac Oncol (2021) 16(10):1718–32. doi: 10.1016/j.jtho.2021.05.001
8. Hamid O, Robert C, Daud A, Hodi FS, Hwu WJ, Kefford R, et al. Five-year survival outcomes for patients with advanced melanoma treated with pembrolizumab in KEYNOTE-001. Ann Oncol (2019) 30(4):582–8. doi: 10.1093/annonc/mdz011
9. Doroshow DB, Bhalla S, Beasley MB, Sholl LM, Kerr KM, Gnjatic S, et al. PD-L1 as a biomarker of response to immune-checkpoint inhibitors. Nat Rev Clin Oncol (2021) 18(6):345–62. doi: 10.1038/s41571-021-00473-5
10. Gadgeel S, Rodríguez-Abreu D, Speranza G, Esteban E, Felip E, Dómine M, et al. Updated analysis from KEYNOTE-189: Pembrolizumab or placebo plus pemetrexed and platinum for previously untreated metastatic nonsquamous non-small-cell lung cancer. J Clin Oncol (2020) 38(14):1505–17. doi: 10.1200/JCO.19.03136
11. Kim CG, Kim C, Yoon SE, Kim KH, Choi SJ, Kang B, et al. Hyperprogressive disease during PD-1 blockade in patients with advanced hepatocellular carcinoma. J Hepatol (2021) 74(2):350–9. doi: 10.1016/j.jhep.2020.08.010
12. Liu Z, Liu J, Liu X, Wang X, Xie Q, Zhang X, et al. CTR-DB, an omnibus for patient-derived gene expression signatures correlated with cancer drug response. Nucleic Acids Res (2022) 50(D1):D1184–99. doi: 10.1093/nar/gkab860
13. Weinstein JN, Collisson EA, Mills GB, Shaw KRM, Ozenberger BA, Ellrott K, et al. The cancer genome atlas pan-cancer analysis project. Nat Genet (2013) 45(10SI):1113–20. doi: 10.1038/ng.2764
14. Goldman MJ, Craft B, Hastie M, Repecka K, McDade F, Kamath A, et al. Visualizing and interpreting cancer genomics data via the xena platform. Nat Biotechnol (2020) 38(6):675–8. doi: 10.1038/s41587-020-0546-8
15. Lonsdale J, Thomas J, Salvatore M, Phillips R, Lo E, Shad S, et al. The genotype-tissue expression (GTEx) project. Nat Genet (2013) 45(6):580–5. doi: 10.1038/ng.2653
16. Warde-Farley D, Donaldson SL, Comes O, Zuberi K, Badrawi R, Chao P, et al. The GeneMANIA prediction server: biological network integration for gene prioritization and predicting gene function. Nucleic Acids Res (2010) 382:W214–20. doi: 10.1093/nar/gkq537
17. Tang Z, Kang B, Li C, Chen T, Zhang Z. GEPIA2: an enhanced web server for large-scale expression profiling and interactive analysis. Nucleic Acids Res (2019) 47(1):556–60. doi: 10.1093/nar/gkz430
18. Thorsson V, Gibbs DL, Brown SD, Wolf D, Bortone DS, Yang TO, et al. The immune landscape of cancer. Immunity (2018) 48(4):812. doi: 10.1016/j.immuni.2018.03.023
19. Yoshihara K, Shahmoradgoli M, Martínez E, Vegesna R, Kim H, Torres-Garcia W, et al. Inferring tumour purity and stromal and immune cell admixture from expression data. Nat Commun (2013) 4(2612):1–11. doi: 10.1038/ncomms3612
20. Li T, Fan J, Wang B, Traugh N, Chen Q, Liu JS, et al. TIMER: A web server for comprehensive analysis of tumor-infiltrating immune cells. Cancer Res (2017) 77(21):e108–10. doi: 10.1158/0008-5472.CAN-17-0307
21. Racle J, de Jonge K, Baumgaertner P, Speiser DE, Gfeller D. Simultaneous enumeration of cancer and immune cell types from bulk tumor gene expression data. Elife (2017) 6(26476):1–25. doi: 10.7554/eLife.26476
22. Becht E, Giraldo NA, Lacroix L, Buttard B, Elarouci N, Petitprez F, et al. Estimating the population abundance of tissue-infiltrating immune and stromal cell populations using gene expression. Genome Biol (2016) 17(218):1–20. doi: 10.1186/s13059-016-1070-5
23. Aran D, Hu Z, Butte AJ. xCell: digitally portraying the tissue cellular heterogeneity landscape. Genome Biol (2017) 18(220):1–14. doi: 10.1186/s13059-017-1349-1
24. Newman AM, Liu CL, Green MR, Gentles AJ, Feng W, Xu Y, et al. Robust enumeration of cell subsets from tissue expression profiles. Nat Methods (2015) 12(5):453–7. doi: 10.1038/nmeth.3337
25. Finotello F, Mayer C, Plattner C, Laschober G, Rieder D, Hackl H, et al. Molecular and pharmacological modulators of the tumor immune contexture revealed by deconvolution of RNA-seq data. Genome Med (2019) 11(1):1–20. doi: 10.1186/s13073-019-0638-6
26. Charoentong P, Finotello F, Angelova M, Mayer C, Efremova M, Rieder D, et al. Pan-cancer immunogenomic analyses reveal genotype-immunophenotype relationships and predictors of response to checkpoint blockade. Cell Rep (2017) 18(1):248–62. doi: 10.1016/j.celrep.2016.12.019
27. Hashimoto K, Kaira K, Yamaguchi O, Shiono A, Mouri A, Miura Y, et al. Visual assessment of 18F-FDG uptake on PET to predict survival benefit to PD-1 blockade in non-small cell lung cancer. Clin Nucl Med (2022) 47(2):108–16. doi: 10.1097/RLU.0000000000004009
28. Dimitriou F, Lo SN, Tan AC, Emmett L, Kapoor R, Carlino MS, et al. FDG-PET to predict long-term outcome from anti-PD-1 therapy in metastatic melanoma. Ann Oncol (2022) 33(1):99–106. doi: 10.1016/j.annonc.2021.10.003
29. Derosa L, Routy B, Thomas AM, Iebba V, Zalcman G, Friard S, et al. Intestinal akkermansia muciniphila predicts clinical response to PD-1 blockade in patients with advanced non-small-cell lung cancer. Nat Med (2022) 28(2):315–24. doi: 10.1038/s41591-021-01655-5
30. Triozzi PL, Stirling ER, Song Q, Westwood B, Kooshki M, Forbes ME, et al. Circulating immune bioenergetic, metabolic, and genetic signatures predict melanoma patients' response to anti-PD-1 immune checkpoint blockade. Clin Cancer Res (2022) 28(6):1192–202. doi: 10.1158/1078-0432.CCR-21-3114
31. Litchfield K, Reading JL, Puttick C, Thakkar K, Abbosh C, Bentham R, et al. Meta-analysis of tumor- and T cell-intrinsic mechanisms of sensitization to checkpoint inhibition. CELL (2021) 184(3):596–614. doi: 10.1016/j.cell.2021.01.002
32. Marabelle A, Le DT, Ascierto PA, Di Giacomo AM, De Jesus-Acosta A, Delord J, et al. Efficacy of pembrolizumab in patients with noncolorectal high microsatellite Instability/Mismatch repair-deficient cancer: Results from the phase II KEYNOTE-158 study. J Clin Oncol (2020) 38(1):1–14. doi: 10.1200/JCO.19.02105
33. Thompson JC, Davis C, Deshpande C, Hwang W, Jeffries S, Huang A, et al. Gene signature of antigen processing and presentation machinery predicts response to checkpoint blockade in non-small cell lung cancer (NSCLC) and melanoma. J Immunother Cancer (2020) 8:e0009742. doi: 10.1136/jitc-2020-000974
34. Jiang P, Gu S, Pan D, Fu J, Sahu A, Hu X, et al. Signatures of T cell dysfunction and exclusion predict cancer immunotherapy response. Nat Med (2018) 24(10):1550. doi: 10.1038/s41591-018-0136-1
35. Ayers M, Lunceford J, Nebozhyn M, Murphy E, Loboda A, Kaufman DR, et al. IFN-gamma-related mRNA profile predicts clinical response to PD-1 blockade. J Clin Invest (2017) 127(8):2930–40. doi: 10.1172/JCI91190
36. Anagnostou V, Bardelli A, Chan TA, Turajlic S. The status of tumor mutational burden and immunotherapy. Nat Cancer (2022) 3(6):652–6. doi: 10.1038/s43018-022-00382-1
37. Hara T, Jung LK, Bjorndahl JM, Fu SM. Human T cell activation. III. rapid induction of a phosphorylated 28 kD/32 kD disulfide-linked early activation antigen (EA 1) by 12-o-tetradecanoyl phorbol-13-acetate, mitogens, and antigens. J Exp Med (1986) 164(6):1988–2005. doi: 10.1084/jem.164.6.1988
38. Cosulich ME, Rubartelli A, Risso A, Cozzolino F, Bargellesi A. Functional characterization of an antigen involved in an early step of T-cell activation. Proc Natl Acad Sci USA (1987) 84(12):4205–9. doi: 10.1073/pnas.84.12.4205
39. Cebrián M, Yagüe E, Rincón M, López-Botet M, de Landázuri MO, Sánchez-Madrid F. Triggering of T cell proliferation through AIM, an activation inducer molecule expressed on activated human lymphocytes. J Exp Med (1988) 168(5):1621–37. doi: 10.1084/jem.168.5.1621
40. Cibrián D, Sánchez-Madrid F. CD69: from activation marker to metabolic gatekeeper. Eur J Immunol (2017) 47(6):946–53. doi: 10.1002/eji.201646837
41. Gorabi AM, Hajighasemi S, Kiaie N, Gheibi HS, Jamialahmadi T, Johnston TP, et al. The pivotal role of CD69 in autoimmunity. J Autoimmun (2020) 111(102453):1–11. doi: 10.1016/j.jaut.2020.102453
42. Nara K, Akasako Y, Matsuda Y, Fukazawa Y, Iwashita S, Kataoka M, et al. Cloning and characterization of a novel serine/threonine protein kinase gene expressed predominantly in developing brain. Eur J Biochem (2001) 268(9):2642–51. doi: 10.1046/j.1432-1327.2001.02157.x
43. Wang P, Guo J, Wang F, Shi T, Ma D. Human SBK1 is dysregulated in multiple cancers and promotes survival of ovary cancer SK-OV-3 cells. Mol Biol Rep (2011) 38(5):3551–9. doi: 10.1007/s11033-010-0465-8
44. Ugajin A, Uchiyama H, Miyata T, Sasaki T, Yajima S, Ono M. Identification and initial characterization of novel neural immediate early genes possibly differentially contributing to foraging-related learning and memory processes in the honeybee. Insect Mol Biol (2018) 27(2):154–65. doi: 10.1111/imb.12355
45. Kimura MY, Koyama-Nasu R, Yagi R, Nakayama T. A new therapeutic target: The CD69-Myl9 system in immune responses. Semin Immunopathol (2019) 41(3):349–58. doi: 10.1007/s00281-019-00734-7
46. Nakayama T, Hirahara K, Kimura MY, Iwamura C, Kiuchi M, Kokubo K, et al. CD4+ T cells in inflammatory diseases: Pathogenic T-helper cells and the CD69-Myl9 system. Int Immunol (2021) 33(12):699–704. doi: 10.1093/intimm/dxab053
47. Esplugues E, Vega-Ramos J, Cartoixà D, Vazquez BN, Salaet I, Engel P, et al. Induction of tumor NK-cell immunity by anti-CD69 antibody therapy. Blood (2005) 105(11):4399–406. doi: 10.1182/blood-2004-10-3854
48. Park SL, Buzzai A, Rautela J, Hor JL, Hochheiser K, Effern M, et al. Tissue-resident memory CD8(+) T cells promote melanoma-immune equilibrium in skin. Nature (2019) 565(7739):366–71. doi: 10.1038/s41586-018-0812-9
49. Schreiber RD, Old LJ, Smyth MJ. Cancer immunoediting: integrating immunity's roles in cancer suppression and promotion. Science (2011) 331(6024):1565–70. doi: 10.1126/science.1203486
50. Feng W, Zhu R, Ma J, Song H. LncRNA ELFN1-AS1 promotes retinoblastoma growth and invasion via regulating miR-4270/SBK1 axis. Cancer Manag Res (2021) 13(1):1067–73. doi: 10.2147/CMAR.S281536
51. Ahuja P, Bi X, Ng CF, Tse M, Hang M, Pang B, et al. Src homology 3 domain binding kinase 1 protects against hepatic steatosis and insulin resistance through the Nur77- fibroblast growth factor 21 pathway. Hepatology (2022) 4(1):1–17. doi: 10.1002/hep.32501
52. Laumont CM, Banville AC, Gilardi M, Hollern DP, Nelson BH. Tumour-infiltrating b cells: immunological mechanisms, clinical impact and therapeutic opportunities. Nat Rev Cancer (2022) 22(7):414–30. doi: 10.1038/s41568-022-00466-1
53. Fan Y, Zhou Y, Lou M, Li X, Zhu X, Yuan K. m(6)A regulator-mediated methylation modification patterns and characterisation of tumour microenvironment infiltration in non-small cell lung cancer. J Inflammation Res (2022) 15(1):1969–89. doi: 10.2147/JIR.S356841
Keywords: CD69, SBK1, tumor microenvironment, PD-1, immunotherapy
Citation: Hu Z-W, Sun W, Wen Y-H, Ma R-Q, Chen L, Chen W-Q, Lei W-B and Wen W-P (2022) CD69 and SBK1 as potential predictors of responses to PD-1/PD-L1 blockade cancer immunotherapy in lung cancer and melanoma. Front. Immunol. 13:952059. doi: 10.3389/fimmu.2022.952059
Received: 24 May 2022; Accepted: 28 July 2022;
Published: 15 August 2022.
Edited by:
Rieneke Van De Ven, VU Medical Center, NetherlandsReviewed by:
Thomas Duhen, Earle A. Chiles Research Institute, United StatesCopyright © 2022 Hu, Sun, Wen, Ma, Chen, Chen, Lei and Wen. This is an open-access article distributed under the terms of the Creative Commons Attribution License (CC BY). The use, distribution or reproduction in other forums is permitted, provided the original author(s) and the copyright owner(s) are credited and that the original publication in this journal is cited, in accordance with accepted academic practice. No use, distribution or reproduction is permitted which does not comply with these terms.
*Correspondence: Wei-Ping Wen, d2Vud3BAbWFpbC5zeXN1LmVkdS5jbg==; Wen-Bin Lei, bGVpd2JAbWFpbC5zeXN1LmVkdS5jbg==
†These authors have contributed equally to this work
Disclaimer: All claims expressed in this article are solely those of the authors and do not necessarily represent those of their affiliated organizations, or those of the publisher, the editors and the reviewers. Any product that may be evaluated in this article or claim that may be made by its manufacturer is not guaranteed or endorsed by the publisher.
Research integrity at Frontiers
Learn more about the work of our research integrity team to safeguard the quality of each article we publish.