Corrigendum: Investigation of the association between the genetic polymorphisms of co-stimulatory system and systemic lupus erythematosus
 Ding-Ping Chen
 Wei-Tzu Lin
 Kuang-Hui Yu
- 1Department of Laboratory Medicine, Linkou Chang Gung Memorial Hospital, Taoyuan, Taiwan
- 2Department of Medical Biotechnology and Laboratory Science, College of Medicine, Chang Gung University, Taoyuan, Taiwan
- 3Division of Rheumatology, Allergy, and Immunology, Chang Gung University and Memorial Hospital, Taoyuan, Taiwan
Human leukocyte antigen genes have been shown to have the strongest association with autoimmune disease (AD). However, non-HLA genes would be risk factors of AD. Many genes encoding proteins that are related to T- and B-cell function have been identified as susceptibility genes of systemic lupus erythematosus (SLE). In this study, we explored the correlation between SLE and the genetic polymorphisms of co-stimulatory/co-inhibitory molecules, including CTLA4, CD28, ICOS, PDCD1, and TNFSF4. We found that there were nine single-nucleotide polymorphisms (SNPs) associated with SLE, namely, rs11571315 (TT vs. CT vs. CC: p < 0.001; TT vs. CT: p = 0.001; p = 0.005; TT vs. CT +CC: p < 0.001; TT+CT vs. CC: p = 0.032), rs733618 (CC vs. CT vs. TT: p = 0.002; CC vs. CT: p = 0.001; CC vs. TT: p = 0.018; CC vs. CT + TT: p = 0.001), rs4553808 (AA vs. AG: p < 0.001), rs62182595 (GG vs. AG vs. AA: p < 0.001; GG vs. AG: p < 0.001; GG vs. AG+AA: p < 0.001), rs16840252 (CC vs. CT vs. TT: p < 0.001; CC vs. CT: p < 0.001; CC vs. CT + TT: p < 0.001), rs5742909 (CC vs. CT: p = 0.027; CC vs. CT + TT: p = 0.044), rs11571319 (GG vs. AG vs. AA: p < 0.001, GG vs. AG: p < 0.001; GG vs. AG+AA: p < 0.001), rs36084323 (CC vs. CT vs. TT: p = 0.013, CC vs. TT: p = 0.004; CC vs. CT + TT: p = 0.015; CC +CT vs. TT: p = 0.015), and rs1234314 (CC vs. CG vs. GG: p = 0.005; GG vs. CC: p = 0.004; GG+ CG vs. CC: p = 0.001), but not in CD28 and ICOS by using the chi-square test. Additionally, rs62182595 and rs16840252 of CTLA and rs1234314 and rs45454293 of TNFSF4 were also associated with SLE in haplotypes. These SLE-related SNPs also had an association with several diseases. It was indicated that these SNPs may play an important role in immune regulation and pathogenic mechanisms.
Introduction
Autoimmune diseases (ADs) are a heterogeneous group of diseases that involve the connective tissues, skin, subcutaneous tissues, muscles, joints, and various internal organs. In a Taiwanese population, the incidence of systemic lupus erythematosus (SLE) was 7.2 per 100,000 person-years (1), particularly affecting the women of childbearing age. Because SLE is a complex and multifactorial disorder, its course is difficult to accurately judge. If AD cannot be treated at the first time, it will lead to poor prognosis. Moreover, data showed that the heritability of SLE was up to 43.9% (2). Thus, we tried to investigate the correlation between genetic polymorphism and SLE.
SLE is a multisystem autoimmune disease characterized by the production of autoantibodies. The inappropriate T‐cell‐dependent expansion of autoreactive B cells is considered to play a role in the production of pathogenic autoantibodies against autoantigens (3). The pathogenesis of SLE is still unclear yet. An increasing number of studies showed that the overactivation of autoreactive T cells is the main factor in AD (4, 5). In general, the autoreactive T cells that can recognize the self-antigen will go to apoptosis through positive and negative selection in the thymus (6). However, even if such a rigorous selection mechanism is complied, a small number of T cells escape into the peripheral blood after the selection, in which these escaped T cells will recognize self-antigens and attack to own cells and tissues. In the peripheral blood system, autoreactive T cells are regulated by regulatory T cells (Treg). When these autoreactive T cells cannot be controlled by Treg, also known as loss of immune tolerance, it will lead to become one of the main causes of autoimmune diseases.
To date, it has been found that human leukocyte antigen (HLA) genes generally have the strongest association with AD (7). However, other genes located outside of the HLA region may be a risk factor of AD. Several genes involved in the etiology of SLE have been widely studied, and the single-nucleotide polymorphisms (SNPs) of these genes encoding proteins related to T- and B-cell functions have been considered as the susceptibility loci of SLE. Studies showed that T-cell activation was strictly regulated by signals from co-stimulatory and co-inhibitory molecules (8). Among them, the most popular hot genes are cytotoxic T-lymphocyte-associated protein 4 (CTLA4) and CD28. CD28 is continuously expressed on naïve and mature T cells. After binding with CD80/CD86 on antigen-presenting cells (APCs), it provides a stimulatory signal to promote activation of T cells, giving them the ability to attack (9).
CTLA4 is a co-inhibitory molecule, which is induced to express on the surface of T cells after CD28 interacts with CD80/CD86 on APCs and stimulates T-cell activation. By competing with CD28 for CD80/CD86, it plays a role in inhibition of T-cell activation. Thus, the balance between CTLA4 and CD28 is an important key for T-cell activation or inhibition (10). Both programmed cell death protein 1 (PDCD1; PD1) and CTLA4 are immune checkpoints. When the PD1 protein binds to its ligand on APCs, it will induce the activation of an immune-receptor tyrosine-based inhibitory motif (ITIM) in the cytoplasmic tail of PD1, so as to inhibit the activation of T cells (11). Inducible co-stimulator (ICOS), like CD28, acts as a co-stimulatory receptor for T cells. It is essential for the activation of T cells and further promotes the humoral immune response (12). In addition, it was found that ICOS was highly expressed on T cells of SLE patients (13). When tumor necrosis factor superfamily member 4 (TNFSF4; OX40L) binds to its receptor (OX40), it can also provide a signal to promote T-cell activation, and studies have shown that OX40L can stimulate T-cell response and promote the pathogenesis of SLE (14). Therefore, these five genes were considered in the present study. Moreover, it is worth noting that the susceptible SNP of the disease has ethnic variations. Therefore, the aim of this study was to find out the SLE susceptibility loci of a Taiwanese population and apply it to the clinic to assist physicians in diagnosis.
Methods and material
Study subjects
The Institutional Review Board of Chang Gung Memorial Hospital has reviewed and approved the study. The approval ID was 202002097B0. All study subjects signed informed consent and performed in accordance with relevant guidelines and regulation. There were 75 SLE patients who participated in the present study, in which the average onset age was 32.99 ± 1.49, and there were 66 women (88%) and nine men (12%). The inclusion criteria for SLE were based on the diagnostic criteria established by the American College of Rheumatology: 1) malar rash, 2) discoid lupus erythematosus with desquamation, 3) UV sensitivity on skin, 4) oral ulcer, 5) non-erosive arthritis, 6) serositis, pleurisy, or pericarditis, 7) kidney lesions, 8) nervous system lesions, 9) hematological lesions, 10) immunological lesions, 11) positive antinuclear antibody (ANA) test. If four of the 11 items are met, they can be diagnosed as SLE. In the definition of laboratory diagnosis, it is mainly to detect autoantibodies. ANA positivity exists in more than 95% of SLE patients. However, ANA will increase with age, and normal people may also have positive results, so the clinically meaningful results of ANA need to be ≥1:160x. Furthermore, 75 volunteers without immune abnormalities were collected for a case–control study, in which the average age was 31.83 ± 0.93 and there were 60 women (80%) and 15 men (20%).
DNA extraction and sequencing
Three milliliters of peripheral blood of autoimmune disease patients and healthy controls was collected in EDTA-coated vacuum tubes, and QIAamp DNA Blood Mini Kit (Qiagen, Valencia, California, USA) was used to extract the genomic DNA. After PCR reaction, the concentration and purity of extracted DNA were measured using a UV spectrometer. The PCR mixture contained 50 ng of DNA, 7.5 µl of HotStarTaq DNA Polymerase (Qiagen GmbH, Hilden, Germany) or 2X Tag polymerase, each 1 µl of forward and reverse primers (10 μM), and 14.5 µl of ddH2O. The primer pairs of each gene region and the PCR programs are shown in Table 1. Then, the BigDye Terminator Cycle Sequencing Kit (Thermo Fisher, Waltham, Massachusetts, USA) and the ABI PRISM Genetic Analyzer (Thermo Fisher, Waltham, Massachusetts, USA) were used for direct sequencing according to the manufacturer’s instructions.
TABLE 1
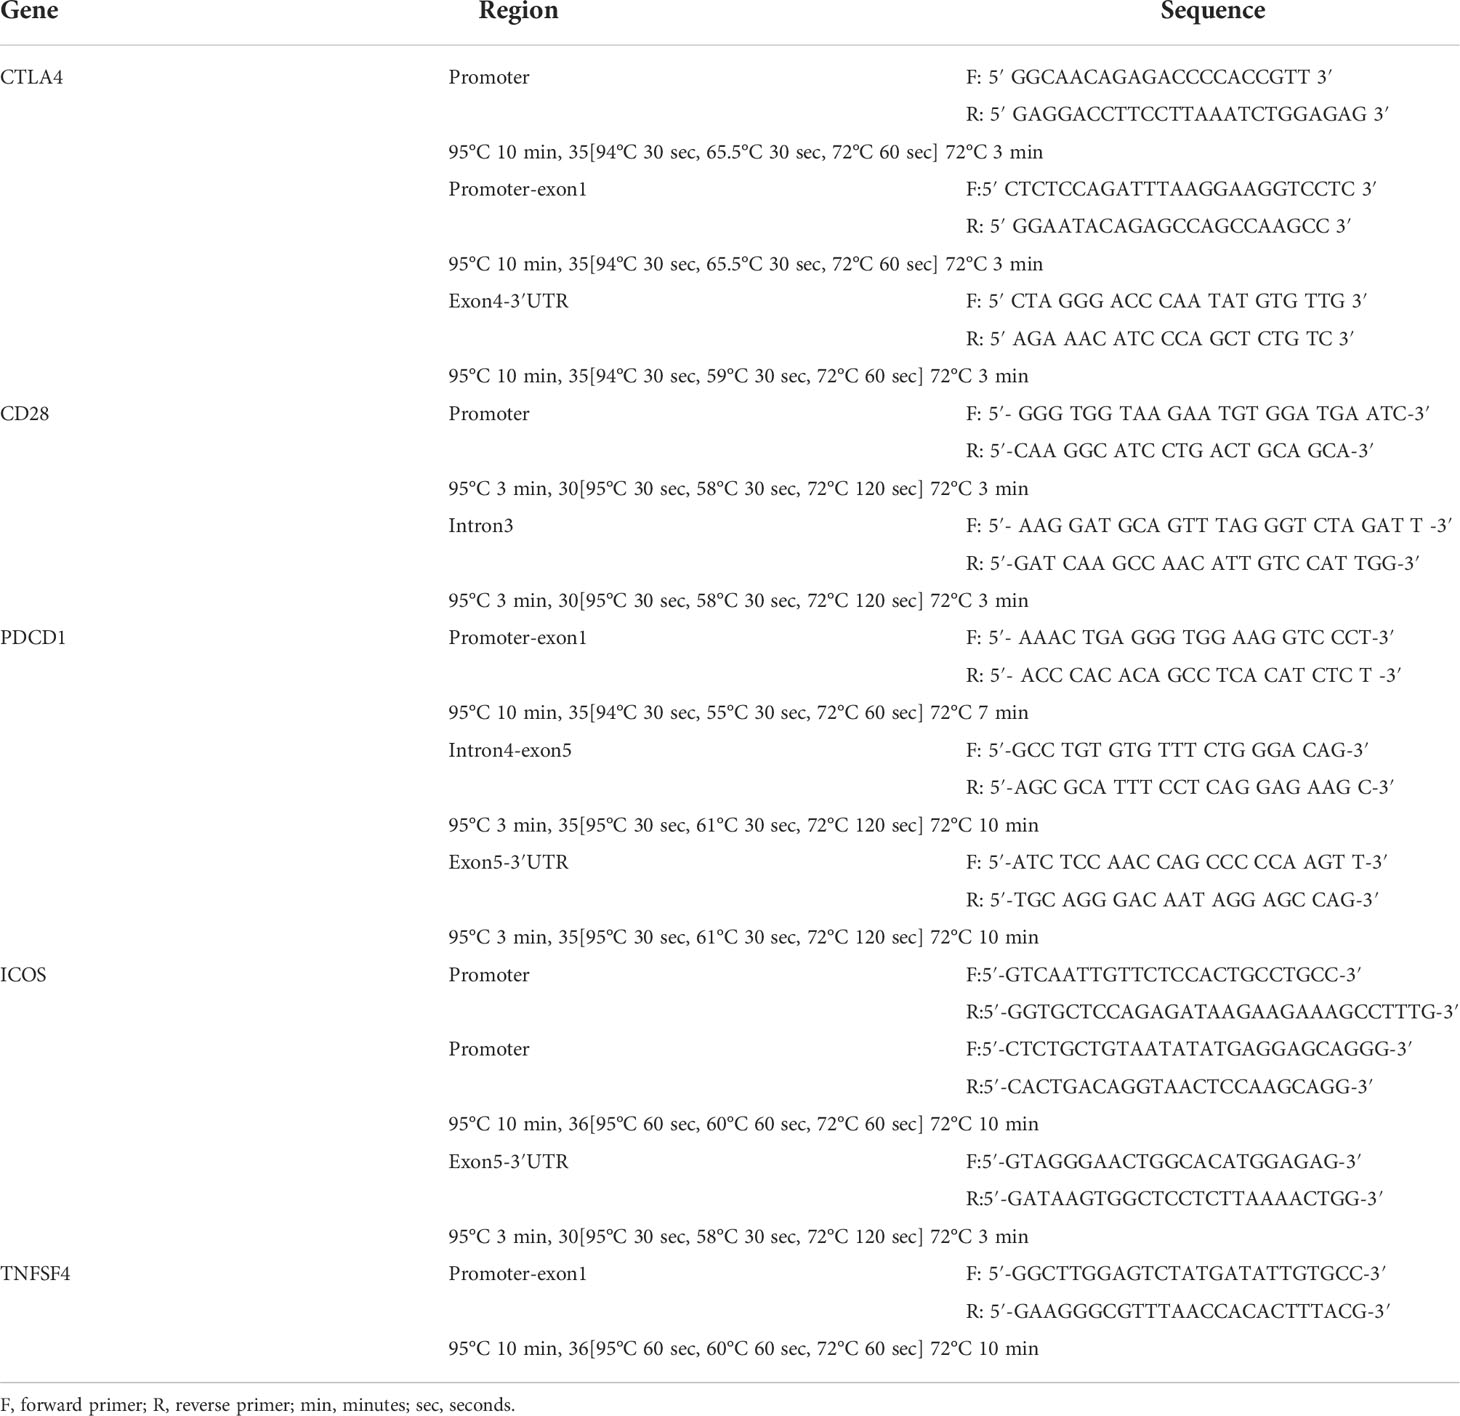
Table 1 The pair primers used for amplifying the DNA fragments in this study.
Selection of candidate SNPs
Because the abnormal expression level of co-stimulatory/co-inhibitory molecules may contribute to autoimmune diseases (15), and the SNP variation located in the promoter region may alter the expression level of mRNA expression, we focused on the promoter region to look for the SNPs related to SLE. In addition, we also searched the SNPs related to autoimmune diseases that were published in previous studies through NCBI, including rs4404254 and rs4675379 located in the three prime untranslated regions (3′UTR) of ICOS gene (16), rs2227982 located in exon 5 and rs10204525 located in the 3′UTR of PDCD1 gene (17), rs3087243 located in the 3′UTR of CTLA4 gene (18), and rs3116496 located in the intron 3 of CD28 gene (19). These SNPs were selected as candidate SNPs, and the region from the 500 bp upstream to 500 bp downstream of these candidate SNPs was amplified, so as to find the SNPs related to SLE in the Taiwanese population.
Statistical analysis
All the allele frequencies of each SNP in the control group were in accordance with the Hardy–Weinberg equilibrium (HWE) (Table 2). The allele frequency and genotype frequency between patients and healthy controls were determined by chi-squared test and Fisher’s exact test and were given an odds ratio with a 95% confidence interval. These statistical data were calculated by SPSS 17.0. D′ was used to estimate the linkage disequilibrium (LD) by comparing the observed and expected frequencies of one haplotype involved in alleles at different loci. The block was defined as it scarcely had evidence for historical recombination in this region (20). The figures of LD were produced by Haploview 4.2 (https://www.broadinstitute.org/haploview/haploview).
TABLE 2
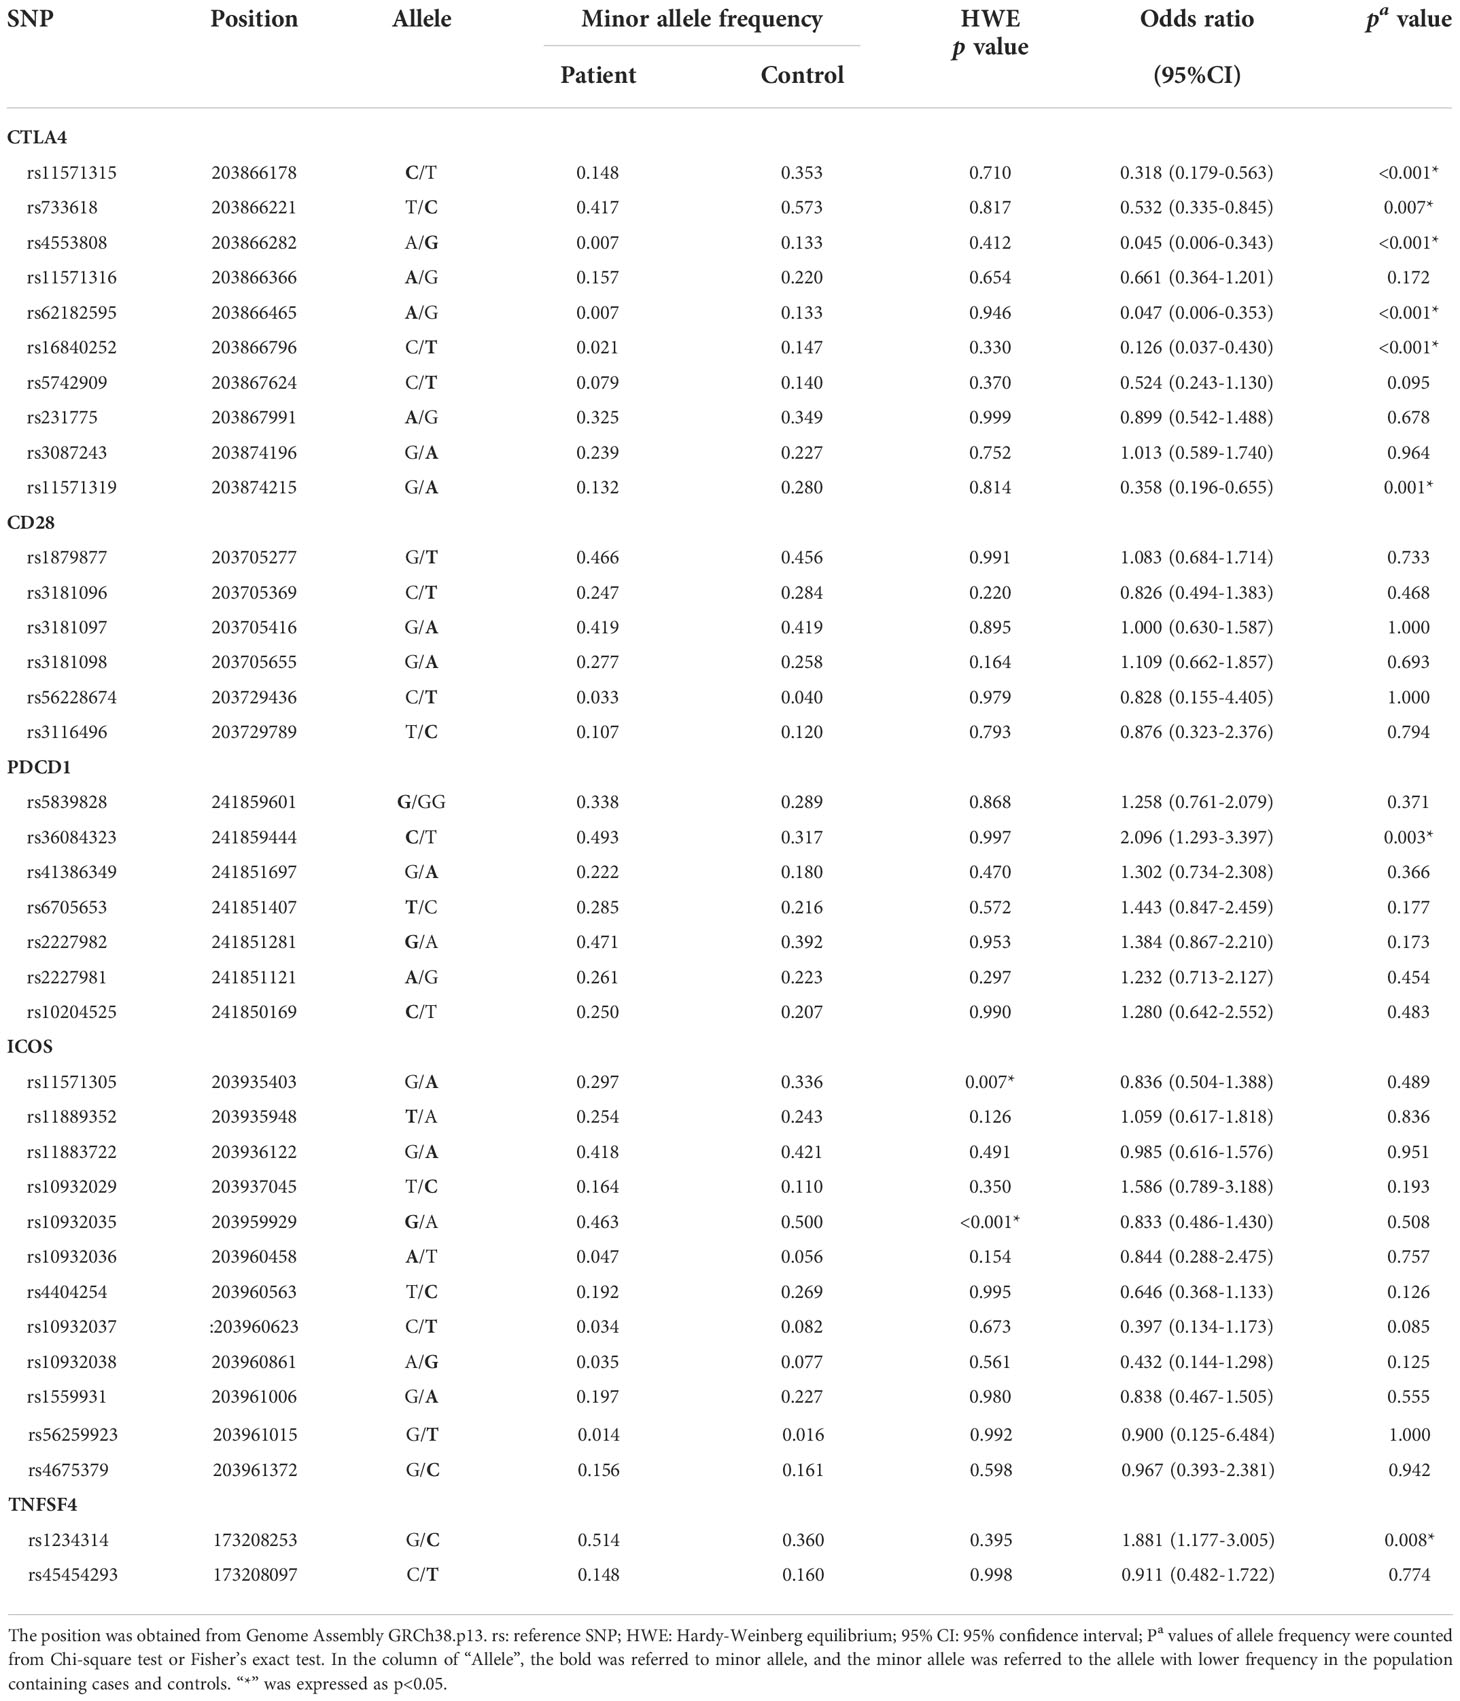
Table 2 The HWE analysis in the control group and the allele frequencies in cases and controls.
Results
Hardy–Weinberg equilibrium test
The genotype frequencies based on controls were checked for Hardy–Weinberg equilibrium (HWE). It was found that the rs11571305 and rs10932035 of ICOS violated HWE, which indicated that these SNPs were not sufficient to represent the genotype distribution of the population, so the subsequent analysis results of these SNPs were less credible (Table 2). Thus, these SNPs were not analyzed and discussed.
The analysis of allele frequencies
The allele frequencies of the six SNPs in the CTLA4 gene were significantly different between cases and controls, including those of rs11571315 (p < 0.001), rs733618 (p = 0.007), rs4553808 (p < 0.001), rs62182595 (p < 0.001), rs16840252 (p < 0.001), and rs11571319 (p = 0.001). For the subjects with a minor allele at these six loci, they had a lower risk (0.045–0.532 times) of SLE. Moreover, in the PDCD1 gene and TNFSF4 gene, each SNP had significance between the SLE group and control group, including rs36084323 (p = 0.003) and rs1234314 (p = 0.008). For the subjects with a minor allele at these two loci, they had a higher risk (1.881 and 2.096 times, respectively) of SLE (Table 2).
The analysis of genotype frequencies
There were seven SNPs in the CTLA4 gene, one SNP in the PDCD1 gene, and one SNP in the TNFSF4 gene that had statistical significance (Table 3). The genotype frequency (CC vs. CT vs. TT) of rs11571315 was significantly different between cases and controls (p < 0.001). Compared to TT, the subjects with a CT genotype at rs11571315 would have a lower risk of SLE (OR = 0.301, 95% CI = 0.142–0.641, p = 0.001), and those with CC would have a 0.17 times risk of SLE (95% CI = 0.044–0.654, p = 0.005). Additionally, the genotype frequencies were analyzed through the dominant model (AA vs. Aa +aa) and recessive model (AA +Aa vs. aa), where “A” was referred to as the allele with higher frequency in the population, also known as major allele. Based on the dominant model, the subjects who had at least one C allele (CT+CC) at rs11571315 would have a 0.267 times risk of SLE (95% CI = 0.132–0.539, p < 0.001), which also had significance based on the recessive model. The subjects with the CC genotype would have a lower risk of SLE (OR = 0.257, 95% CI = 0.068–0.962, p = 0.032) than those with at least one T-allele (TT+CT). The genotype frequency (CC vs. CT vs. TT) of rs733618 had significance (p = 0.002). Compared to CC, the subjects with the CT genotype would have a lower risk of SLE (OR = 0.241, 95% CI = 0.104–0.555, p = 0.001), and those with TT would have a 0.367 times risk of SLE (95% CI = 0.159–0.849, p = 0.018), which also had significance based on the dominant model (CC vs. CT+TT: OR = 0.295, 95% CI = 0.142–0.614, p = 0.001). The genotype frequency (AA vs. AG) of rs4553808 had significance (p < 0.001), in which there was no subject with the GG genotype at this locus. Compared to the AA genotype, the subjects with AG would have a lower risk of SLE (OR = 0.039, 95% CI = 0.005–0.298, <0.001). The genotype frequency (GG vs. AG vs. AA) of rs62182595 had significance (p < 0.001). Compared to GG, the subjects with the AG genotype would have a lower risk of SLE (OR = 0.045, 95% CI = 0.006–0.348, p < 0.001), which also had significance based on the dominant model (GG vs. AG+AA: OR = 0.043, 95% CI = 0.006–0.329, p < 0.001). The genotype frequency (CC vs. CT vs. TT) of rs16840252 was significantly different between cases and controls (p < 0.001). Compared to the CC genotype, the subjects with the CT genotype would have a 0.035 times risk of SLE (95% CI = 0.005–0.267, p < 0.001), which also had significance based on the dominant model (CC vs. CT+TT: OR = 0.070, 95% CI = 0.016–0.310, p < 0.001). The genotype frequency of rs5742909 had a strong tendency toward statistical significance (p = 0.051). Compared to the CC genotype, the subjects with the CT genotype would have a 0.386 times risk of SLE (95% CI = 0.163–0.914, p = 0.027), which also had significance based on the dominant model (CC vs. CT + TT: OR = 0.429, 95% CI = 0.185–0.991, p = 0.044). The genotype frequency (GG vs. AG vs. AA) of rs11571319 had significance (p < 0.001). Compared to GG, the subjects with the AG genotype would have a 0.049 times risk of SLE 95% CI = 0.011–0.219, p < 0.001), which also had significance based on the dominant model (GG vs. AG+AA: OR = 0.197, 95% CI = 0.088–0.443, p < 0.001). The genotype frequency (CC vs. CT vs. TT) of rs36084323 was significantly different between cases and controls (p = 0.013). Compared to the CC genotype, the subjects with the TT genotype would have a 4.466 times risk of SLE (95% CI = 1.579–12.631, p = 0.004), which also had significance based on the dominant model (CC vs. CT+TT: OR = 2.377, 95% CI = 1.177–4.798, p = 0.015) and recessive model (CC +CT vs. TT: OR = 3.105, 95% CI = 1.206–7.996, p = 0.015). The genotype frequency (CC vs. CG vs. GG) of rs1234314 was significantly different between cases and controls (p = 0.005). Compared to the GG genotype, the subjects with the CC genotype would have a 4.4 times risk of SLE (95% CI = 1.577– 12.275, p = 0.004), which also had significance based on the dominant model (GG+CG vs. CC: OR = 4.362, 95% CI = 1.727– 11.015, p = 0.001).
TABLE 3
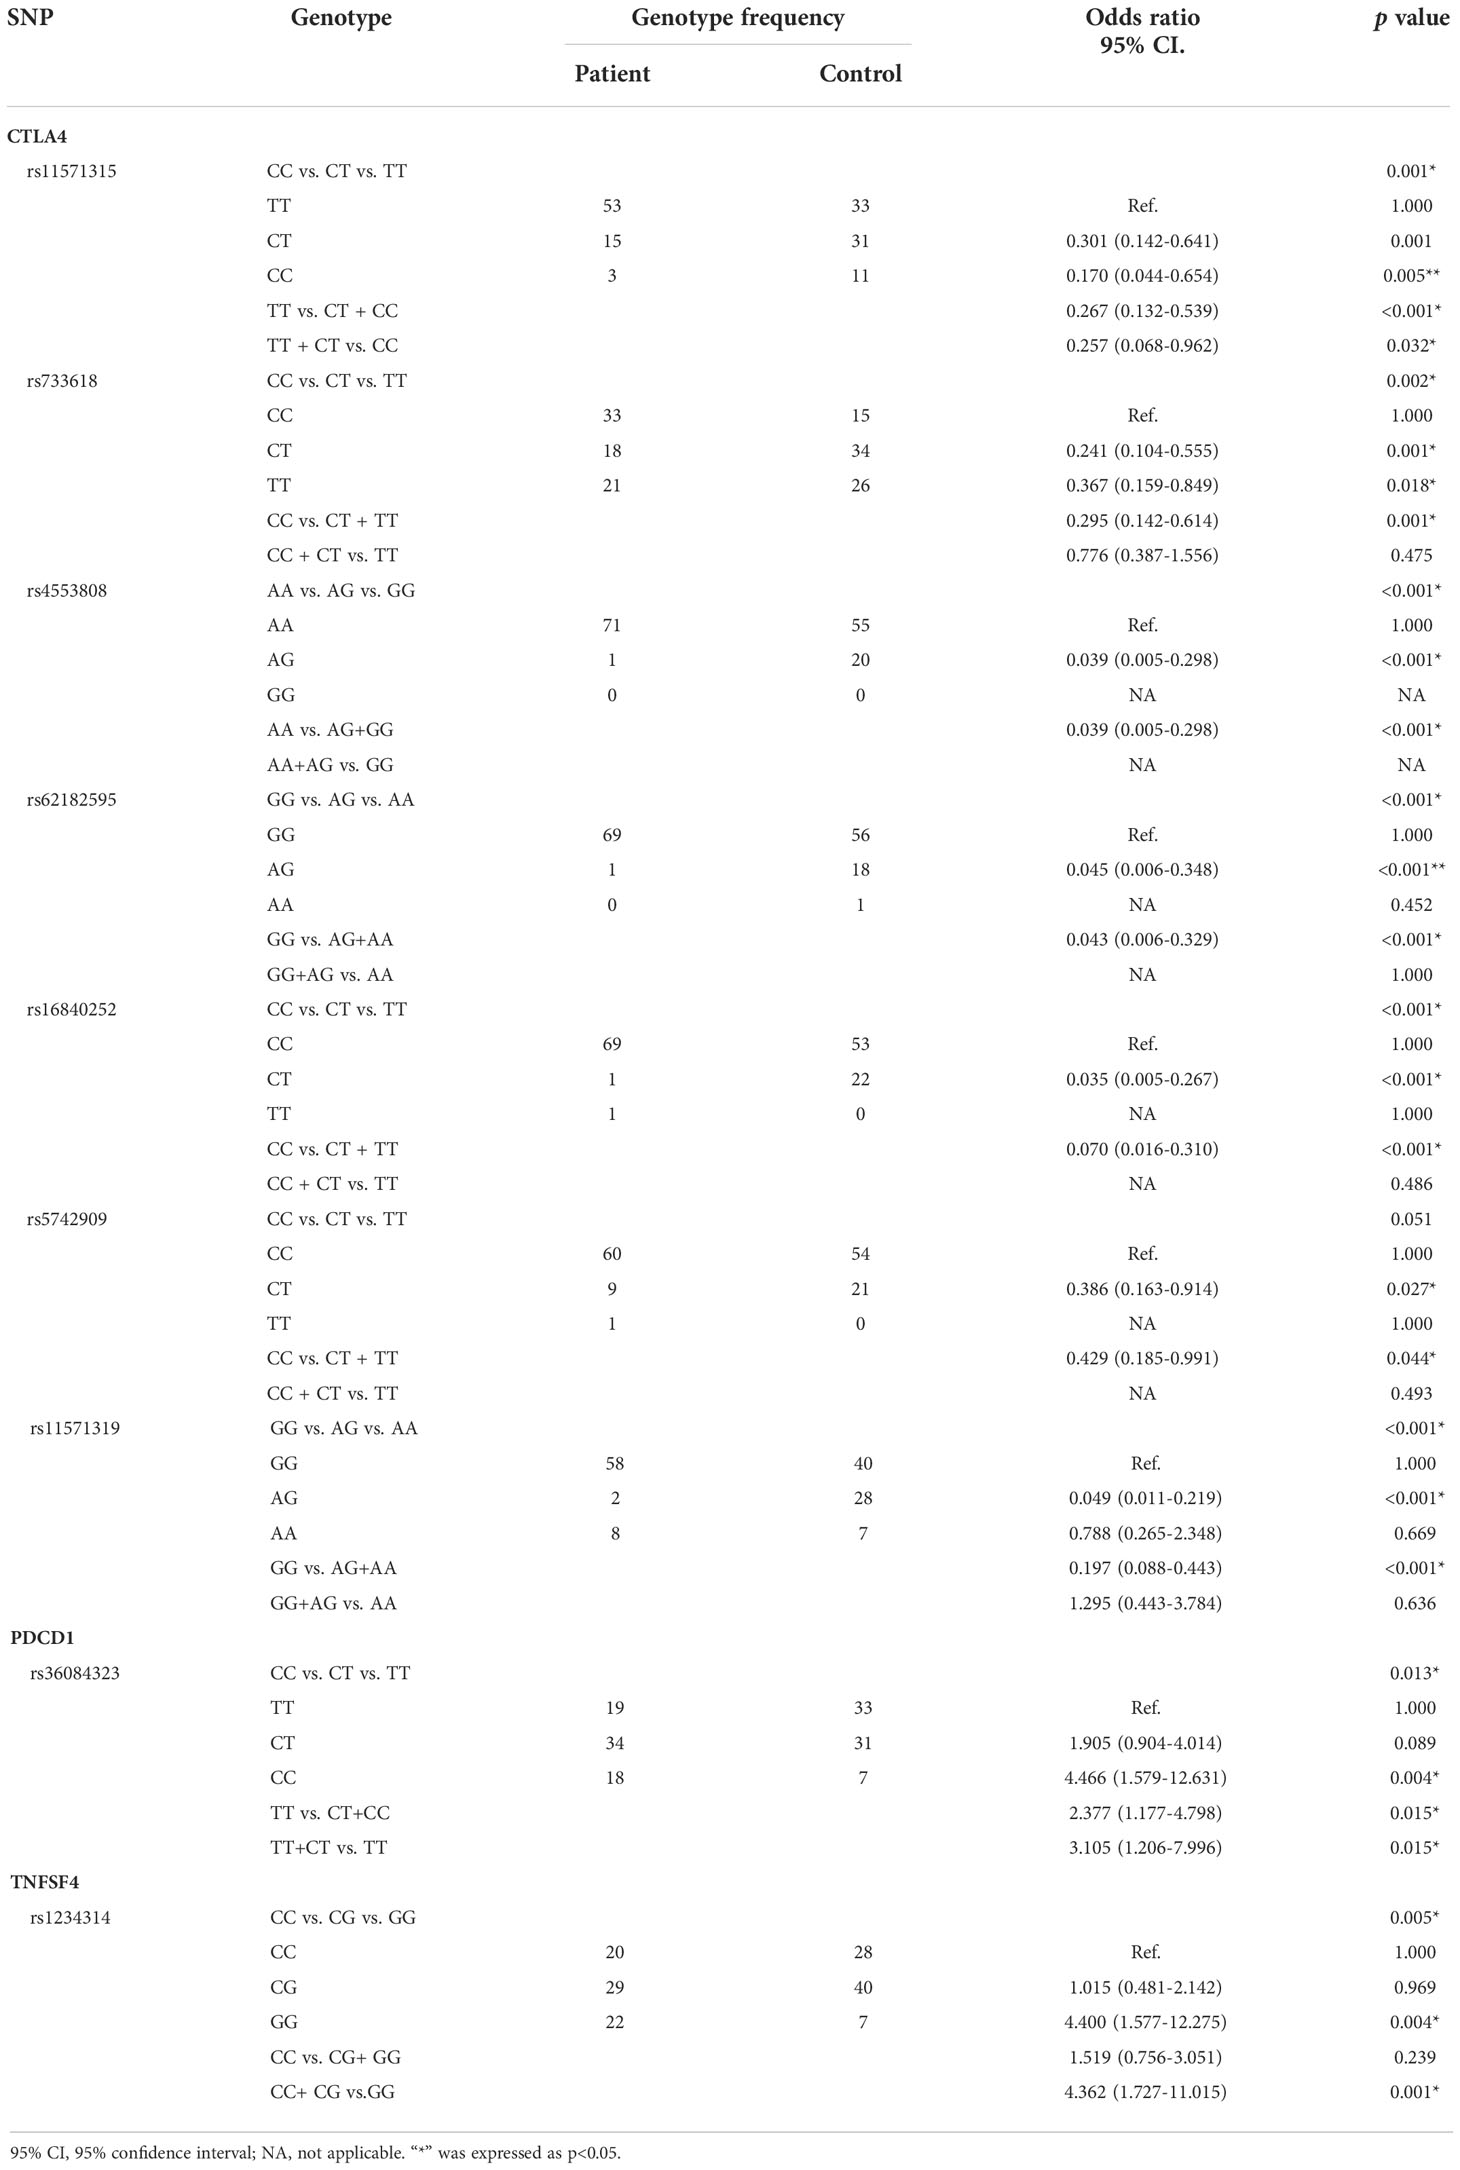
Table 3 Genotype frequencies of the significant SNPs in SLE cases and healthy controls.
Linkage disequilibrium and haplotype analysis
The candidate SNPs of the CTLA4, CD28, PDCD1, ICOS, and TNFSF4 genes were analyzed by LD (Figures 1–5). The D′ value is shown in the boxes. In the boxes, the red color means the two SNPs have high linkage, and the more the linkage decreases, the closer the color is to white; the light purple color means that they absolutely have no linkage. Haplotype analysis (Table 4) showed that CTLA4 Ars62182595Trs16840252 (OR = 0.042, 95% CI = 0.005–0.324, p < 0.001), Ars62182595Crs16840252 (OR = 0.042, 95% CI = 0.005–0.324, p < 0.001), and Grs62182595Trs16840252 (OR = 0.037, 95% CI = 0.005–0.286, p < 0.001), and TNFSF4 Grs1234314Grs45454293 (OR = 0.229, 95% CI = 0.091–0.579, p = 0.001) had a lower risk of SLE. However, the haplotypes in PDCD1, CD28, and ICOS had no significance (Table 4).
TABLE 4
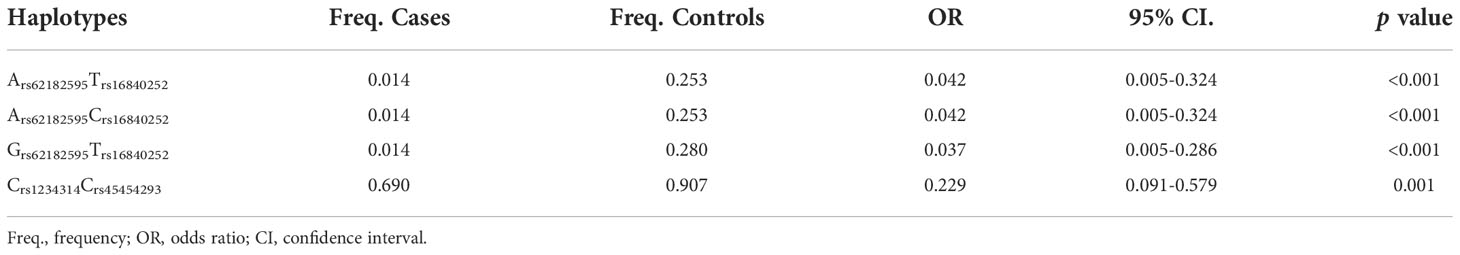
Table 4 The significant haplotypes associated with SLE.
FIGURE 1
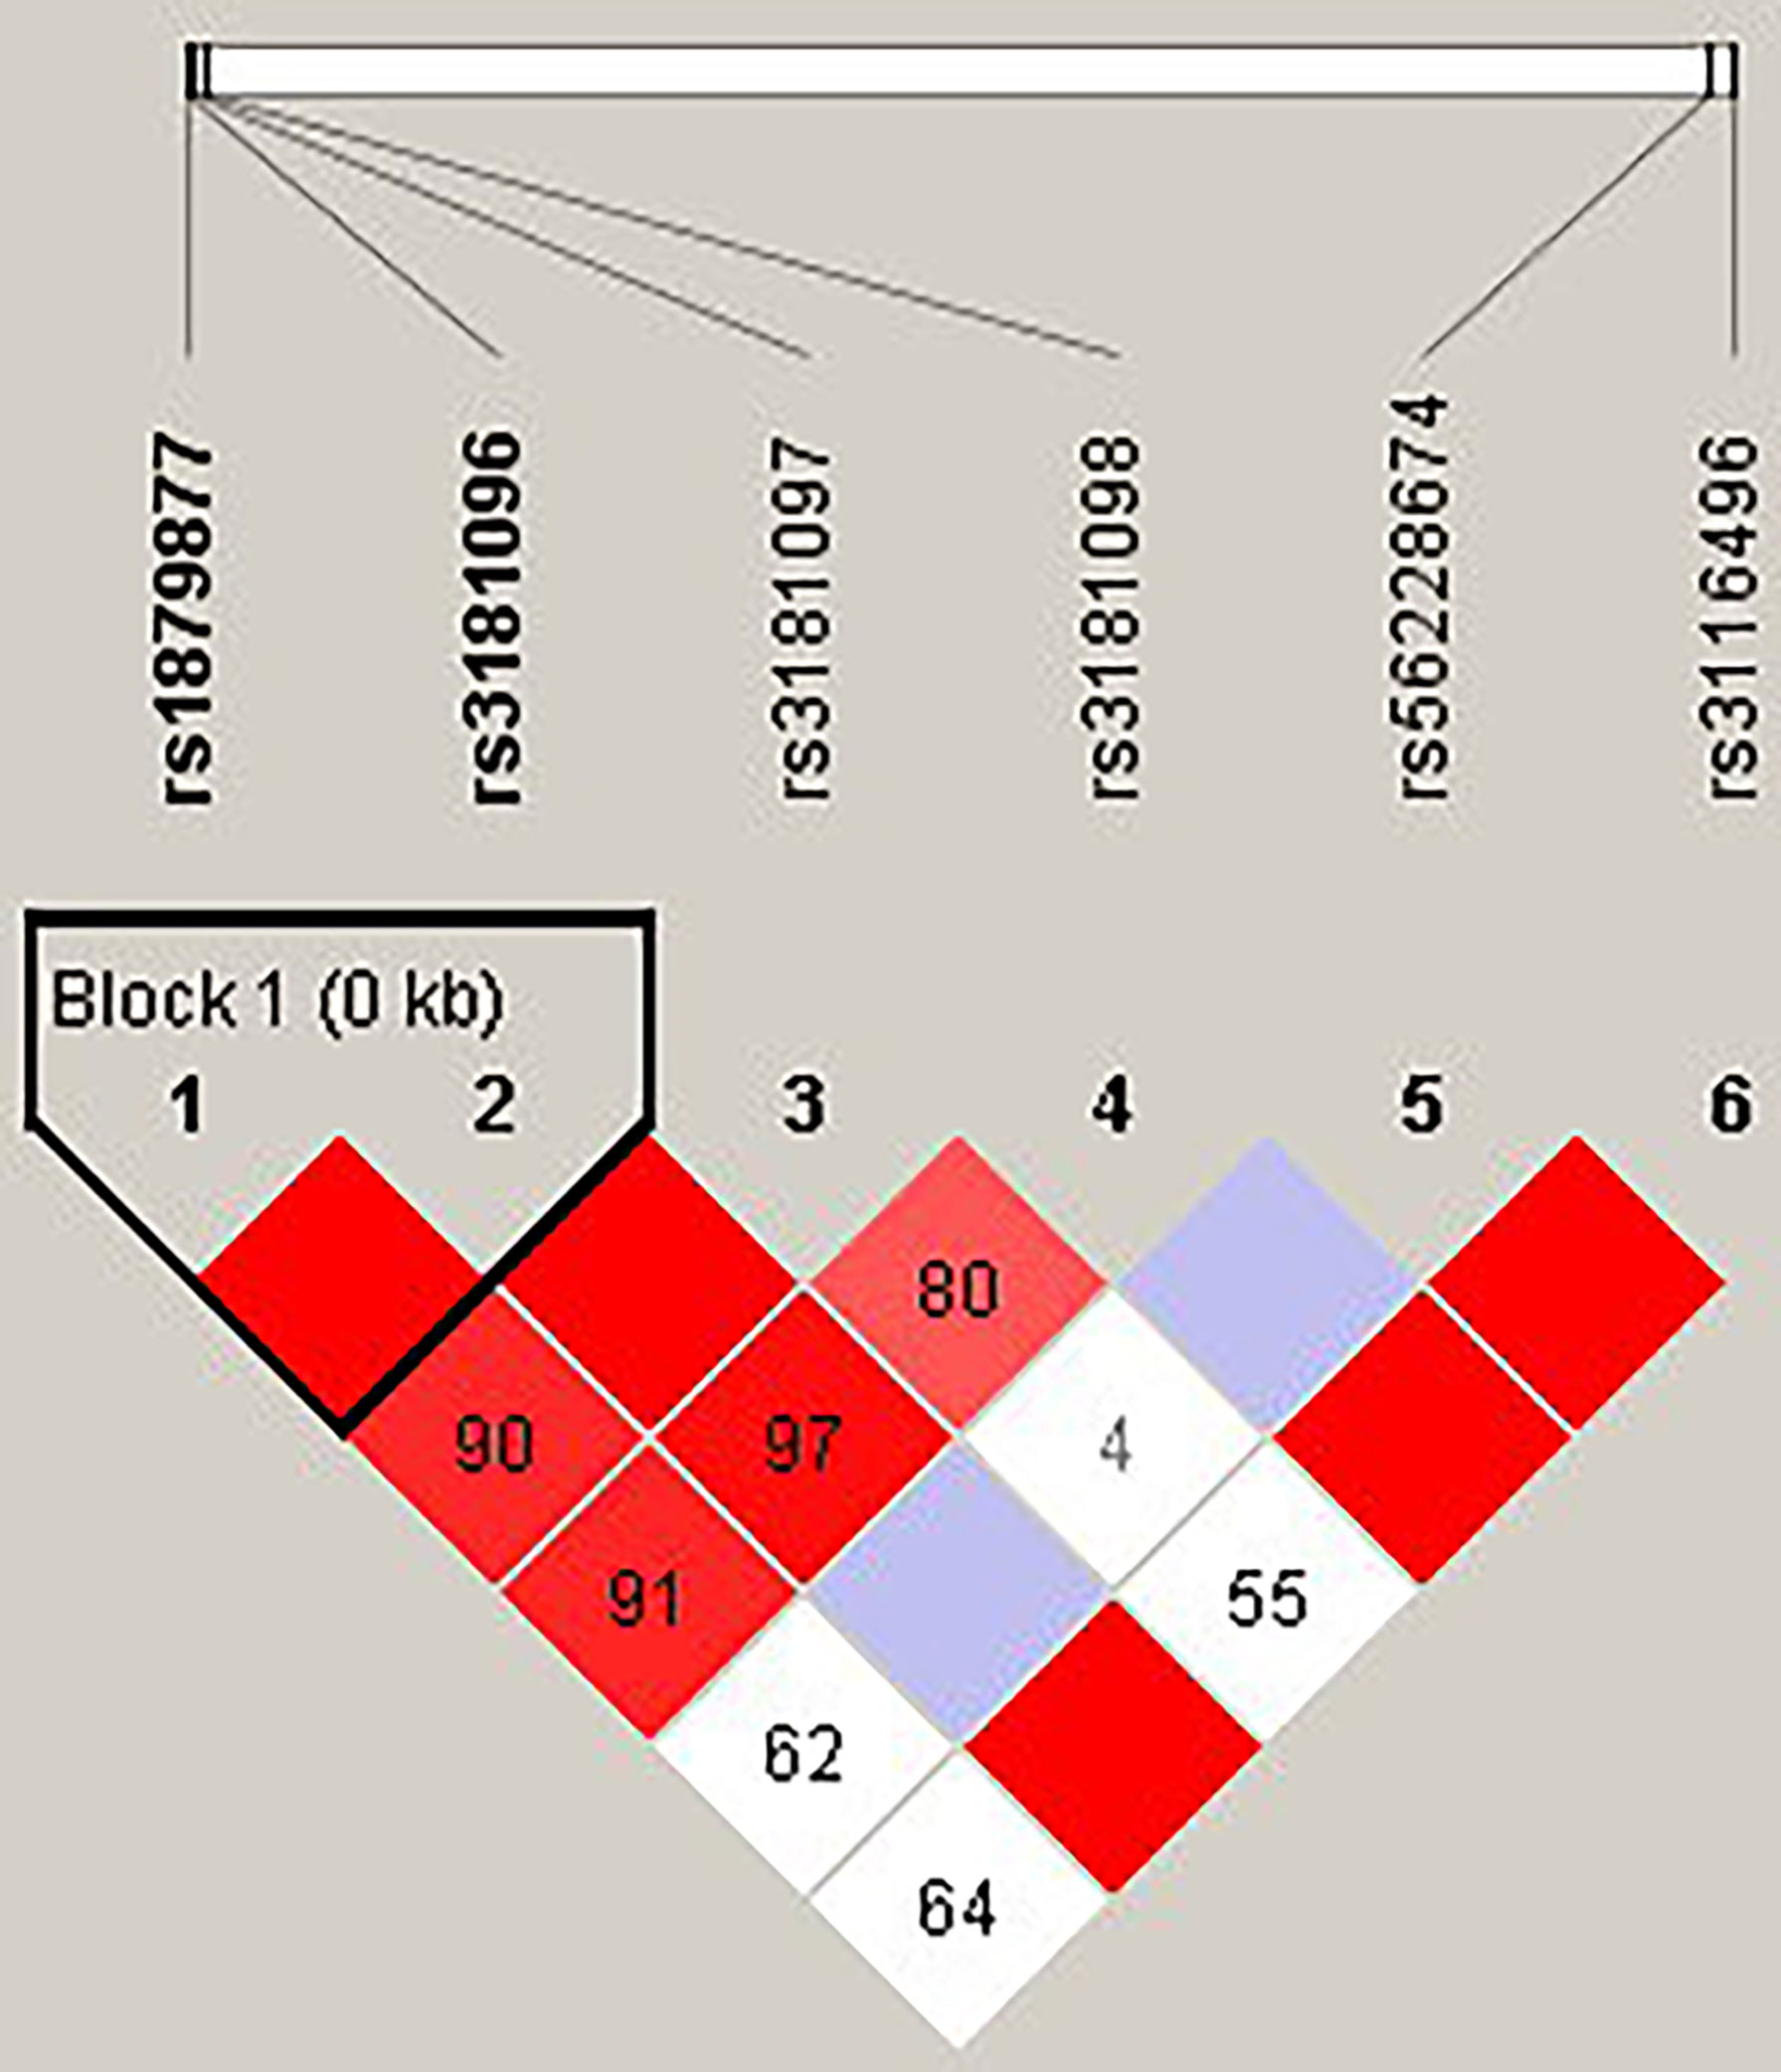
Figure 1 The linkage disequilibrium (LD) analysis of the CD28 gene. There was one haplotype block shown in the CD28 gene, including rs1879877 and rs3181096.
FIGURE 2
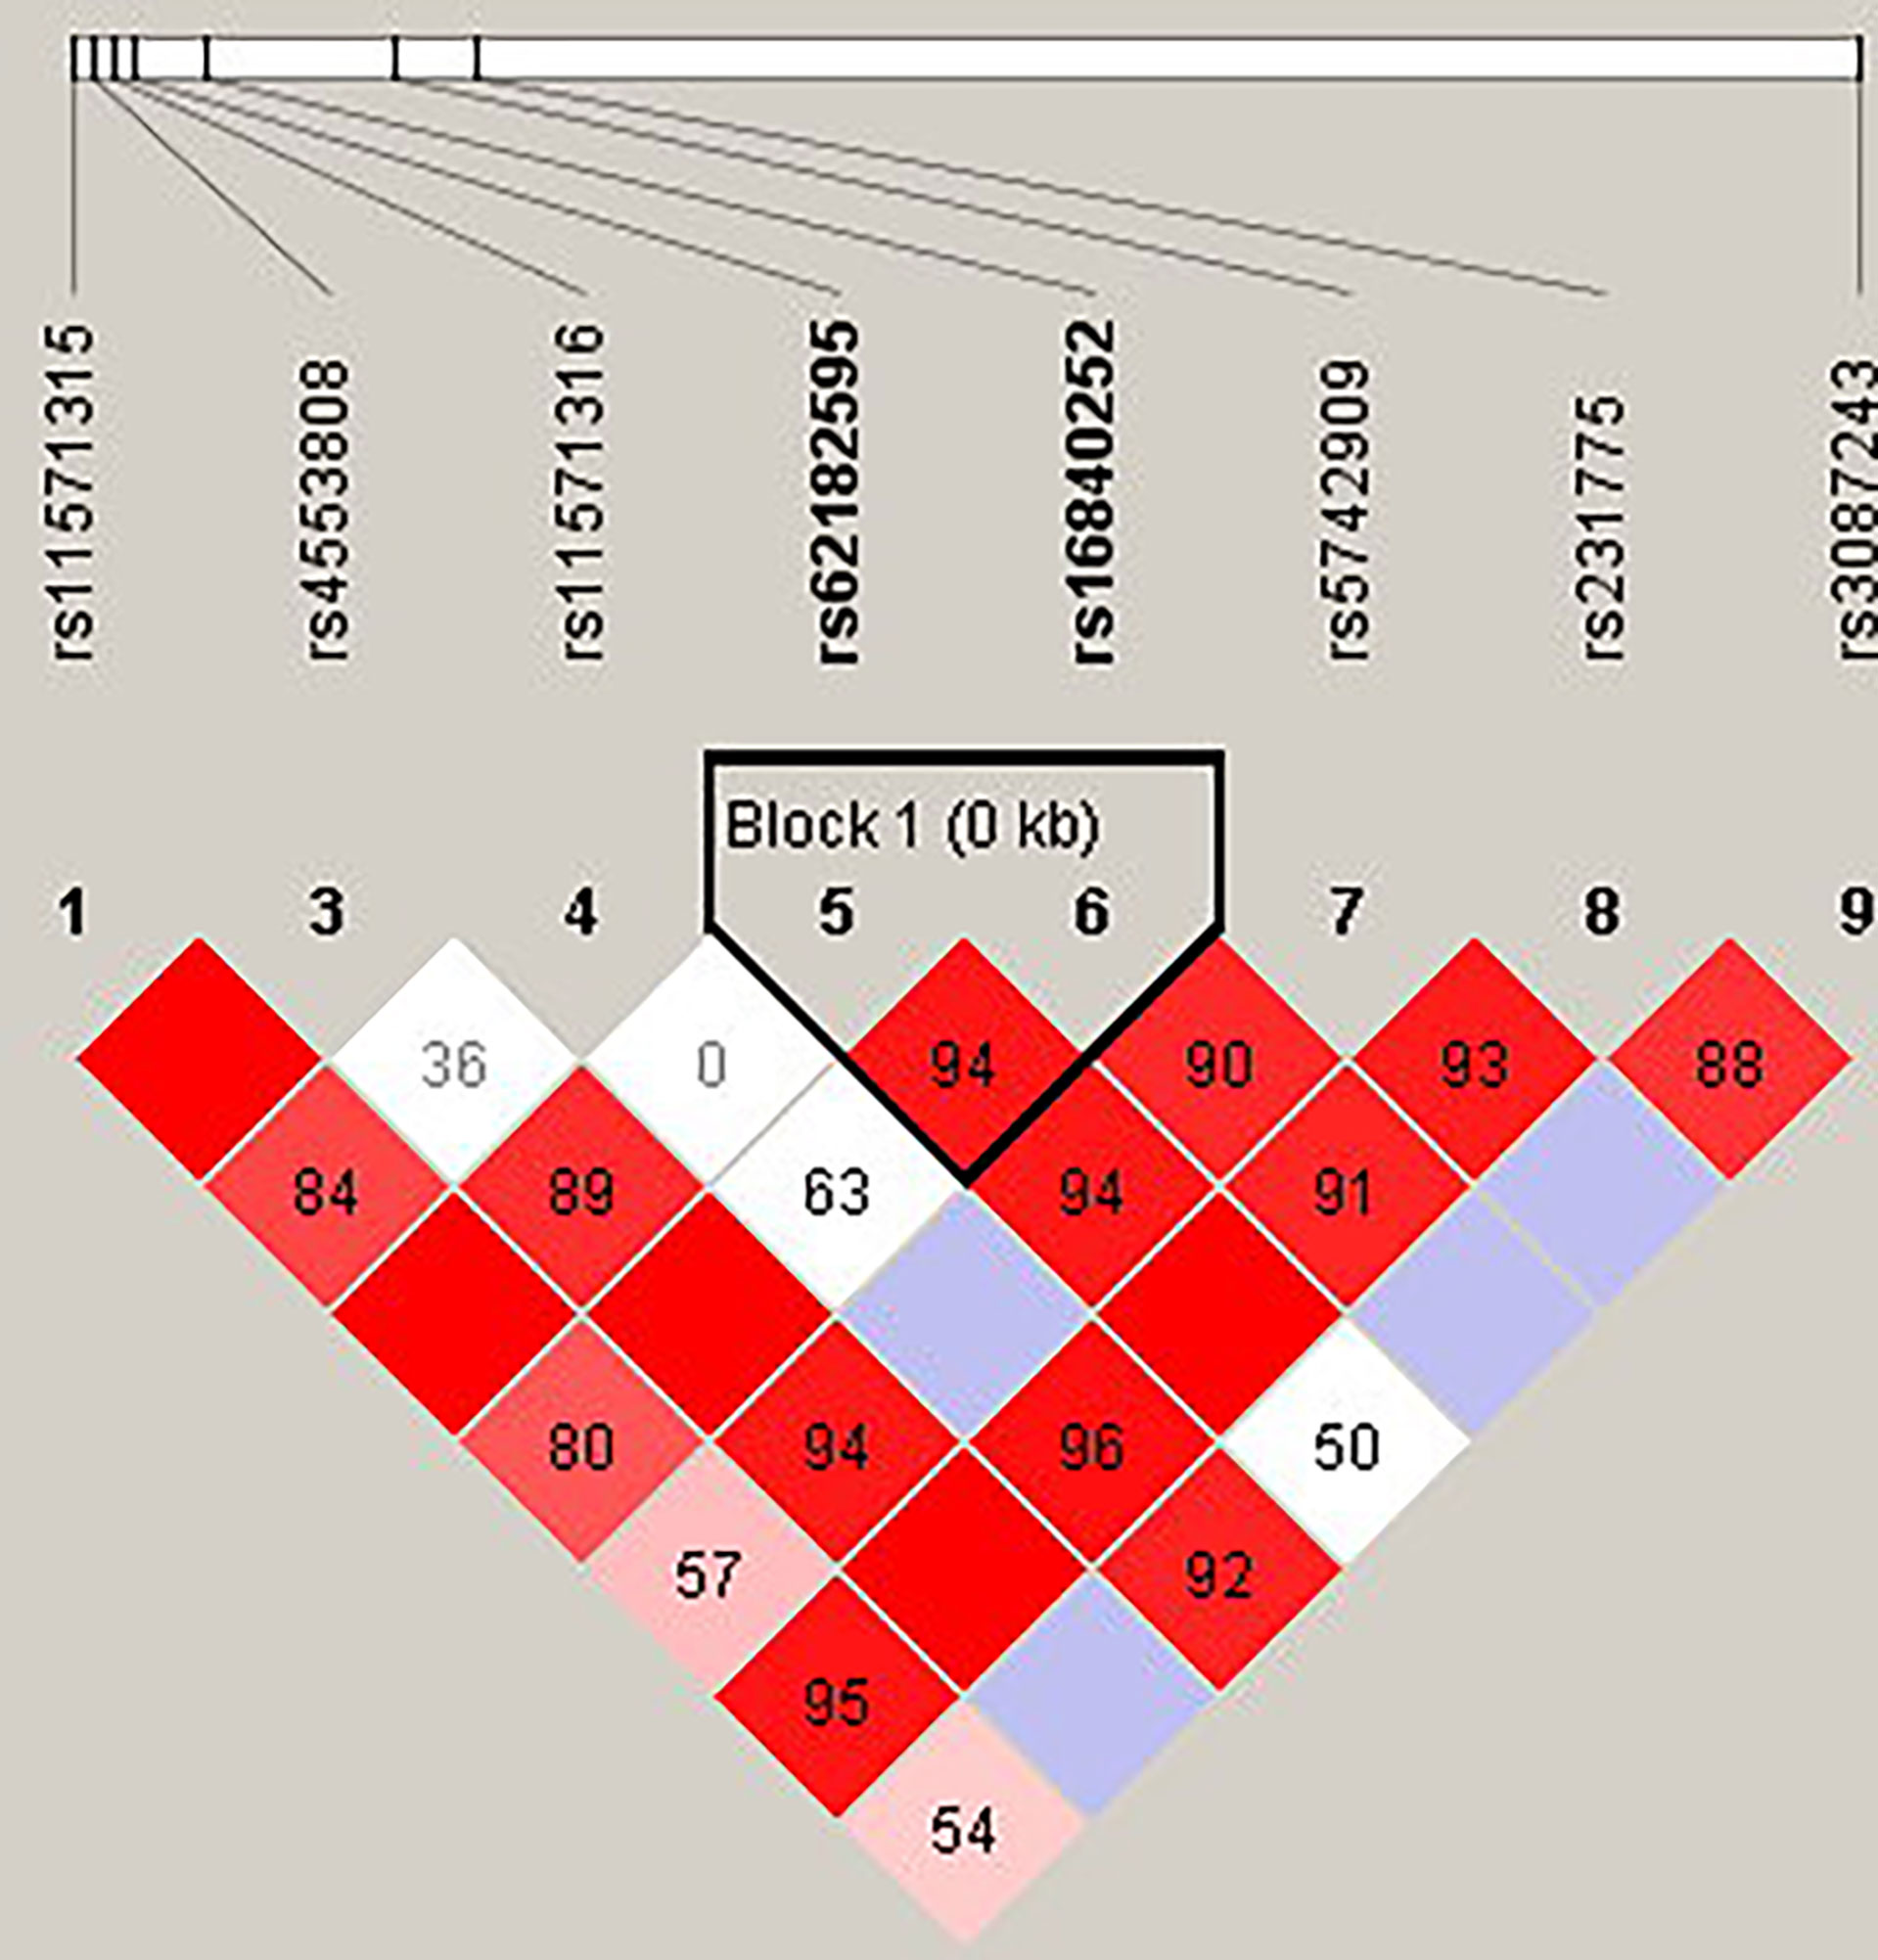
Figure 2 The linkage disequilibrium (LD) analysis of the CTLA4 gene. There was one haplotype block shown in the CTLA4 gene, including rs62182595 and rs16840252.
FIGURE 3
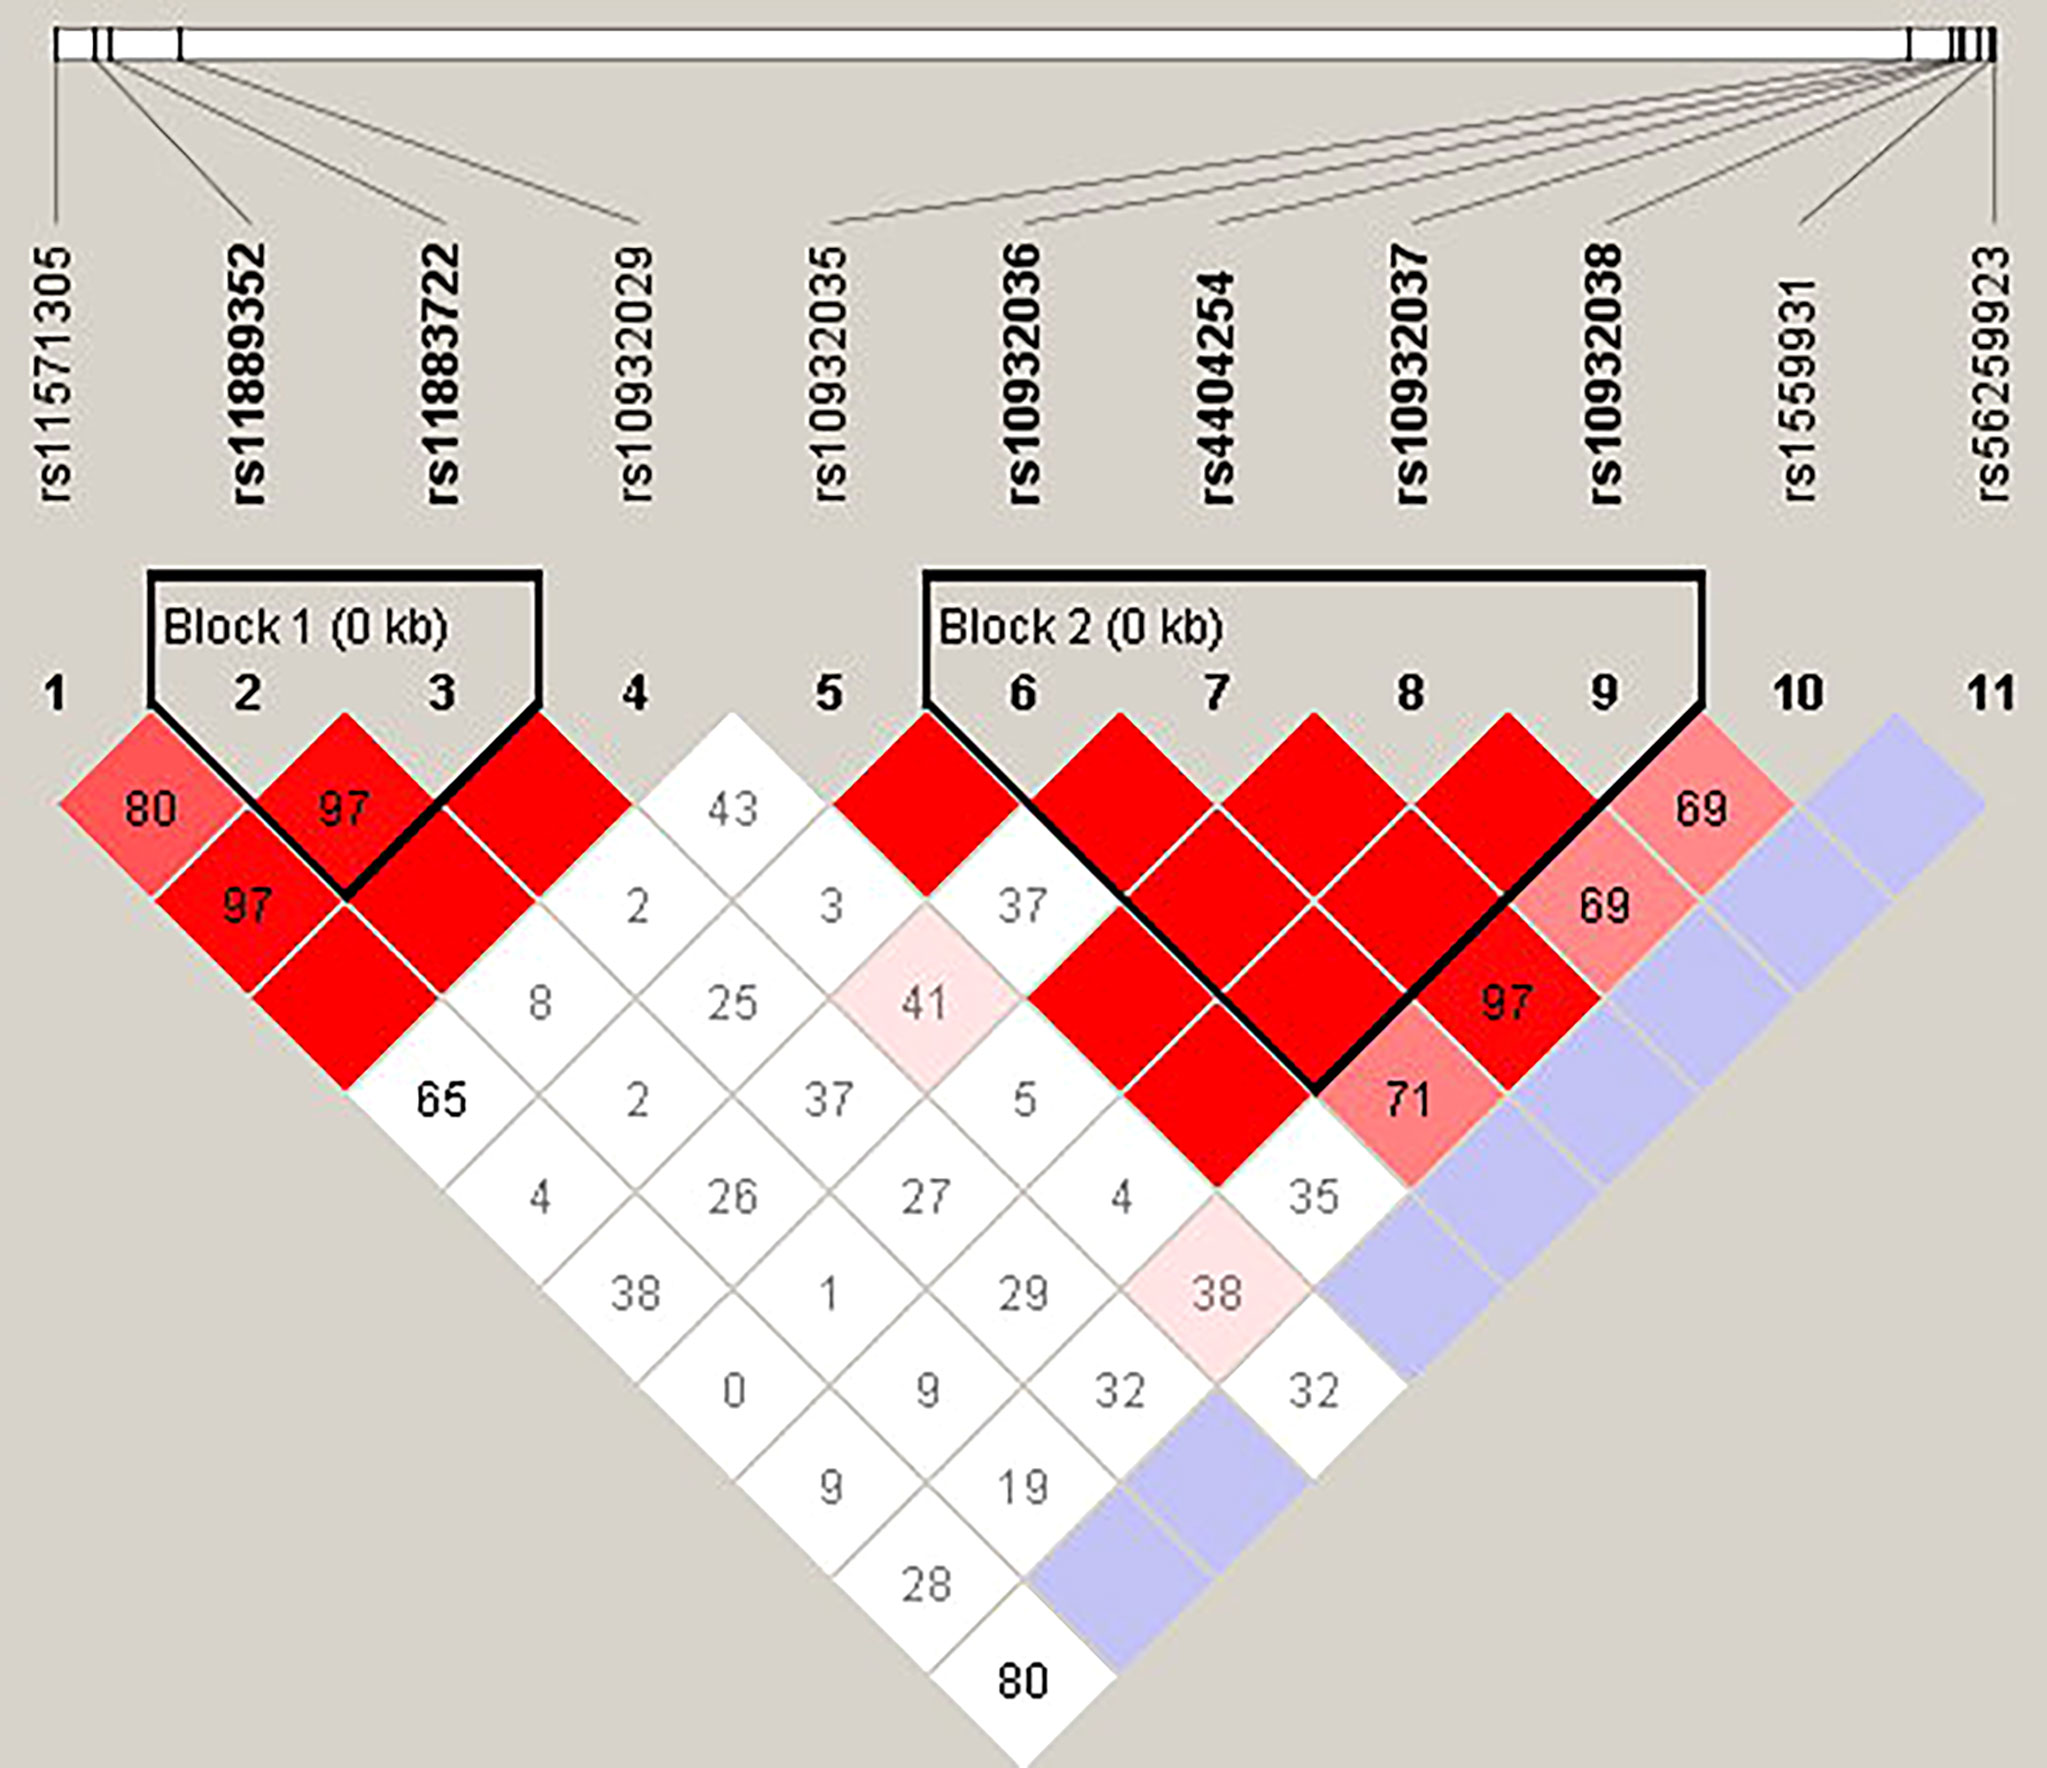
Figure 3 The linkage disequilibrium (LD) analysis of the ICOS gene. There were two haplotype blocks shown in the ICOS gene. One block included rs11889352 and rs11883722, and the other contained rs10932036, rs4404254, rs10932037, and rs10932038.
FIGURE 4
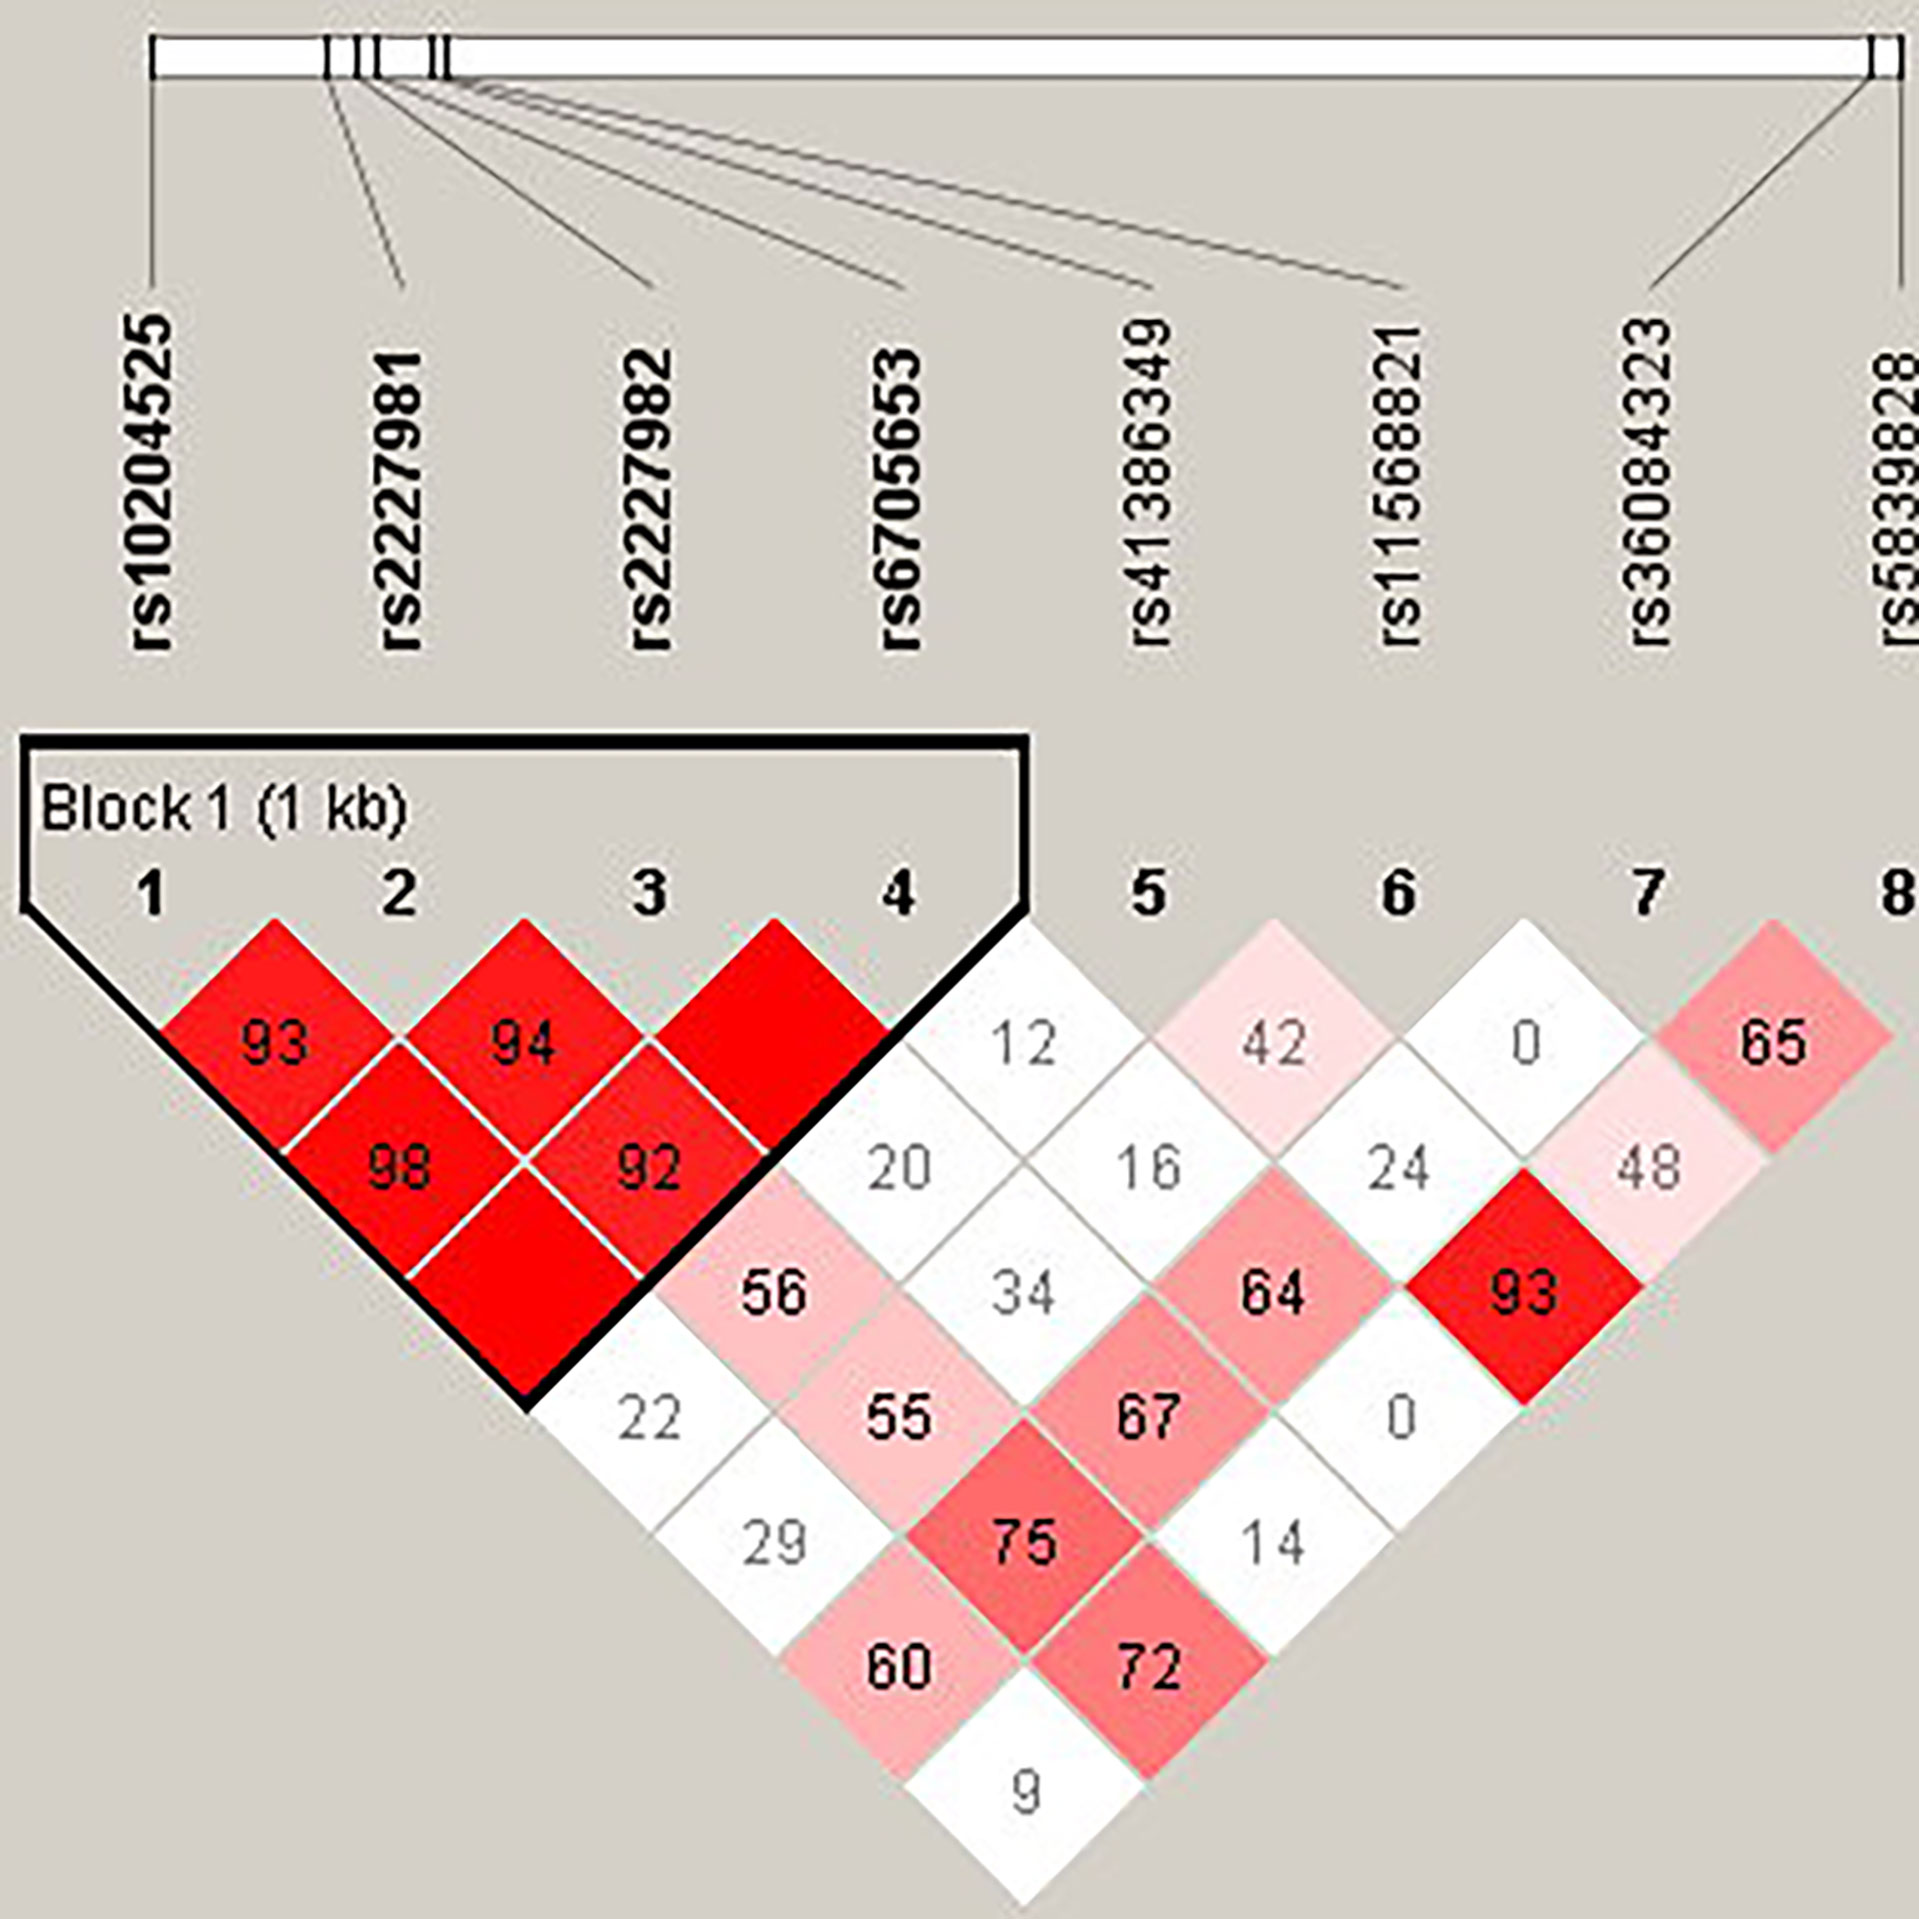
Figure 4 The linkage disequilibrium (LD) analysis of the PDCD1 gene. There was one haplotype block shown in the PDCD1 gene, including rs10204525, rs2227981, rs2227982, and rs6705653.
FIGURE 5
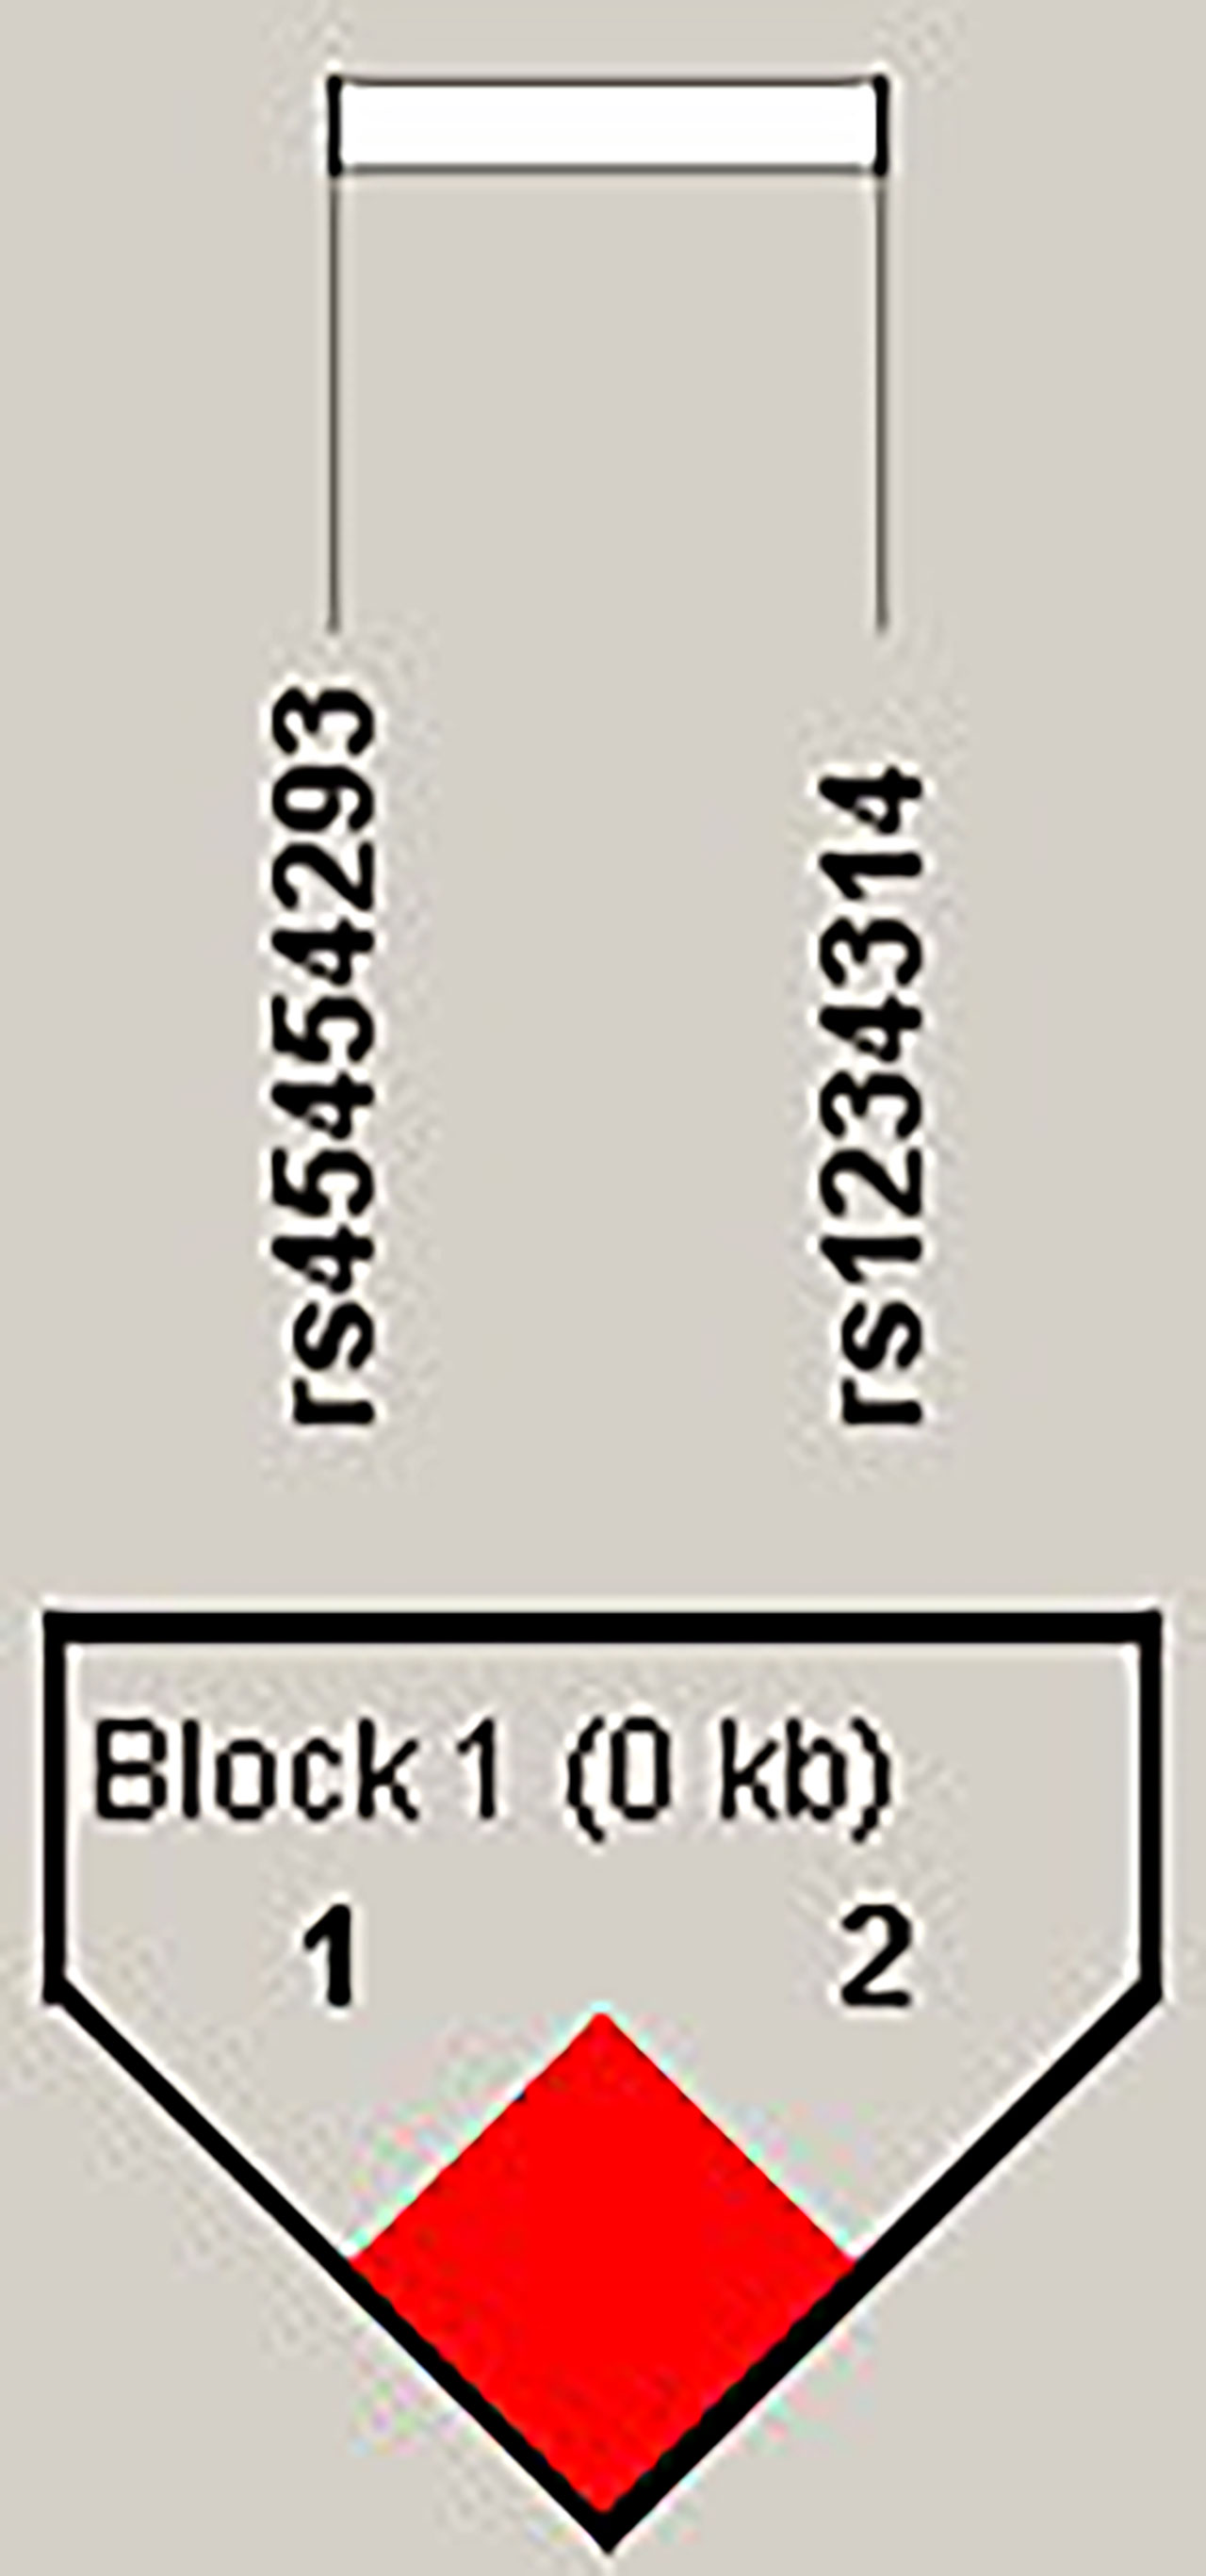
Figure 5 The linkage disequilibrium (LD) analysis of the TNFSF4 gene. There was one haplotype block shown in the TNFSF4 gene, including rs45454293 and rs1234314.
Discussion
According to the results of SNP analysis, we found that there were seven SNPs of the CTLA4 gene, one SNP of the PDCD1 gene, and one SNP of the TNFSF4 gene associated with SLE. Additionally, these SLE-related SNPs also had an association with other autoimmune disorders and cancers. The information is summarized in Supplementary Table 1. It is increasingly being appreciated that multiple autoimmune diseases share common susceptibility genes. It was indicated that these SNPs may be a key factor driving immune abnormalities in the immune regulation and pathogenic mechanism of disorders.
For CTLA4, rs11571315 was associated with transfusion reaction (21), polycystic ovary syndrome (22), etc. Yao et al. showed that rs11571315 was significant with the expression level of CTLA4 (23). rs733618 was associated with Graves’ disease (24, 25), non-small cell lung cancer (26), etc. A meta-analysis showed that the allele and genotype frequencies of rs733618 were associated with SLE. Moreover, compared to the CC genotype, people with CT+TT had a lower risk of SLE in an Asian population (27). This was similar to our results. rs4553808 was associated with several autoimmune diseases (28–30), cancers (31, 32), and prognosis post transplantation (33, 34). Wang et al. showed that the G-allele frequency of rs4553808 was higher in breast cancer patients than in controls (35). On the contrary, our result showed that the G-allele frequency was higher in SLE patients than in controls. This result suggested that rs4553808 had opposite effects on different diseases. rs62182595 was also associated with polycystic ovary syndrome (22). rs16840252 was associated with hepatocellular carcinoma (36), antineutrophil cytoplasmic antibody–associated vasculitis (37), rheumatoid arthritis (38), etc., in which rs16840252 had the most significance in haplotype. rs5742909 was associated with cervical cancer (39), schizophrenia (40), chronic liver diseases (41), Hashimoto’s thyroiditis (42), etc. Shojaa et al. showed that rs5742909 was associated with SLE pathogenesis in an Iranian population, where the CC genotype was associated with SLE, while the CT genotype and T allele were more frequent in controls than in SLE cases (43). Our result was similar to theirs. The rs11571319 located in the 3′UTR was associated with rheumatoid arthritis (44), primary biliary cirrhosis (45), asthma (46), etc. the SNPs in the 3′UTR may interfere with mRNA stability and then alter the translation level of proteins (47).
For PDCD1 and TNFSF4, rs36084323 was associated with cancer risk (48). Ishizaki et al. showed that the rs36084323 G allele had a significantly higher promoter activity than the A allele (49). rs1234314 was associated with allergic rhinitis (50), coronary artery disease (51), etc. It was shown that the CC genotype of rs1234314 provided a protective effect against allergic rhinitis (50), which was contrary to our result. These SNPs were all located in the non-coding region. Thus, they may affect the immunity by altering the expression of the gene. Additionally, the results showed that most of the significant SNPs were in the CTLA4 gene. This may be because CTLA4 is mainly expressed on Tregs. Moreover, the autoreactive T-cell response was strictly controlled by Tregs in the periphery. The abnormality of any one of the co-stimulatory/co-inhibitory signals would lead to these autoreactive T cells’ uncontrolled expansion, causing the development of AD (52). Moreover, haplotype analysis showed that Ars62182595Trs16840252, Ars62182595Crs16840252, Grs62182595Trs16840252, and Grs1234314Grs45454293 haplotypes may decrease the risk of SLE. This suggested the possibility of an interaction between the two SNPs in one haplotype in SLE susceptibility, in view of the high LD between polymorphisms.
Abnormal expression and function of co-stimulatory/co-inhibitory molecules have been described to be associated with aberrant T-cell activation in SLE patients, which results in reduction in the T-cell activation threshold and loss of peripheral immune tolerance (53). These data further advance our understanding of the complex immunopathogenesis of SLE and provide additional support for the emerging concept of shared genes in multiple autoimmune diseases.
In summary, our results showed that several SNPs of immune regulatory genes were significant with SLE, which were almost located in non-coding regions. It should be further verified whether SNP variations affect gene expression or protein function. Moreover, epigenetic markers can also affect the expression level of a gene, leading to abnormal CD4+ T-cell function, which in turn increases the risk of autoimmune disease. Consequently, epigenetic markers should be considered together in the future.
Limitation
The co-stimulatory system is involved in the regulation of T-cell activation. The expression level of co-stimulatory/co-inhibitory molecules will affect the degree of T-cell activation. Therefore, we focused on the promoter region of genes. Due to limited funds, we searched the literature related to autoimmune diseases and selected the hot SNPs related to autoimmune diseases as candidate SNPs for discussion. We explored the 500-bp flanking region of the candidate SNPs, especially on the promoter region, rather than whole-genome region. In addition, because of insufficient genomic DNA and failure of PCR reaction, not every sample had complete SNP data available.
Data availability statement
The original contributions presented in the study are included in the article/Supplementary Material. Further inquiries can be directed to the corresponding author.
Ethics statement
The Institutional Review Board of Chang Gung Memorial Hospital has reviewed and approved the study. The approval ID was 202002097B0. The patients/participants provided their written informed consent to participate in this study.
Author contributions
D-PC conceived and designed the experiments and reviewed the final draft. W-TL performed the experiments and analyzed and interpreted the data. K-HY wrote the draft of the manuscript and provided the samples. All authors read and approved the final manuscript.
Funding
This study was supported by grants to D-PC from the Ministry of Science and Technology (110-2320-B-182A-007). The funders had no role in the study design, data collection and analysis, decision to publish, or preparation of the manuscript.
Conflict of interest
The authors declare that the research was conducted in the absence of any commercial or financial relationships that could be construed as a potential conflict of interest.
Publisher’s note
All claims expressed in this article are solely those of the authors and do not necessarily represent those of their affiliated organizations, or those of the publisher, the editors and the reviewers. Any product that may be evaluated in this article, or claim that may be made by its manufacturer, is not guaranteed or endorsed by the publisher.
Supplementary material
The Supplementary Material for this article can be found online at: https://www.frontiersin.org/articles/10.3389/fimmu.2022.946456/full#supplementary-material
References
1. See LC, Kuo CF, Chou IJ, Chiou MJ, Yu KH. Sex- and age-specific incidence of autoimmune rheumatic diseases in the Chinese population: A Taiwan population-based study. Semin Arthritis Rheum (2013) 43:381–6. doi: 10.1016/j.semarthrit.2013.06.001
2. Kuo CF, Grainge MJ, Valdes AM, See LC, Luo SF, Yu KH, et al. Familial aggregation of systemic lupus erythematosus and coaggregation of autoimmune diseases in affected families. JAMA Intern Med (2015) 175:1518–26. doi: 10.1001/jamainternmed.2015.3528
3. Fu Y, Lin Q, Zhang ZR. Association of TNFSF4 polymorphisms with systemic lupus erythematosus: A meta-analysis. Adv Rheumatol (2021) 61:59. doi: 10.1186/s42358-021-00215-2
4. Bluestone JA, Bour-Jordan H, Cheng M, Anderson M. T Cells in the control of organ-specific autoimmunity. J Clin Invest (2015) 125:2250–60. doi: 10.1172/JCI78089
5. Dornmair K, Goebels N, Weltzien HU, Wekerle H, Hohlfeld R. T-Cell-mediated autoimmunity: Novel techniques to characterize autoreactive T-cell receptors. Am J Pathol (2003) 163:1215–26. doi: 10.1016/S0002-9440(10)63481-5
6. Takaba H, Takayanagi H. The mechanisms of T cell selection in the thymus. Trends Immunol (2017) 38:805–16. doi: 10.1016/j.it.2017.07.010
7. Gough SC, Simmonds MJ. The HLA region and autoimmune disease: Associations and mechanisms of action. Curr Genomics (2007) 8(7):453–65. doi: 10.2174/138920207783591690
8. Kobata T, Azuma M, Yagita H, Okumura K. Role of costimulatory molecules in autoimmunity. Rev Immunogenet (2000) 2:74–80.
9. Lenschow DJ, Walunas TL, Bluestone JA. CD28/B7 system of T cell costimulation. Annu Rev Immunol (1996) 14:233–58. doi: 10.1146/annurev.immunol.14.1.233
10. McCoy KD, Gros G. The role of CTLA-4 in the regulation of T cell immune responses. Immunol Cell Biol (1999) 77:1–10. doi: 10.1046/j.1440-1711.1999.00795.x
11. Francisco LM, Sage PT, Sharpe. AH. The PD-1 pathway in tolerance and autoimmunity. Immunol Rev (2010) 236:219–42. doi: 10.1111/j.1600-065X.2010.00923.x
12. Hutloff A, Dittrich AM, Beier KC, Eljaschewitsch B, Kraft R, Anagnostopoulos I, et al. ICOS is an inducible T-cell co-stimulator structurally and functionally related to CD28. Nature (1999) 397:263–6. doi: 10.1038/16717
13. Hutloff A, Büchner K, Reiter K, Baelde HJ, Odendahl M, Jacobi A, et al. Involvement of inducible costimulator in the exaggerated memory b cell and plasma cell generation in systemic lupus erythematosus. Arthritis Rheum (2004) 50:3211–20. doi: 10.1002/art.20519
14. Jacquemin C, Schmitt N, Contin-Bordes C, Liu Y, Narayanan P, Seneschal J, et al. OX40 ligand contributes to human lupus pathogenesis by promoting T follicular helper response. Immunity (2015) 42:1159–70. doi: 10.1016/j.immuni.2015.05.012
15. Edner NM, Carlesso G, Rush JS, Walker LSK. Targeting co-stimulatory molecules in autoimmune disease. Nat Rev Drug Discovery (2020) 19:860–83. doi: 10.1038/s41573-020-0081-9
16. Conteduca G, Rossi A, Megiorni F, Parodi A, Ferrera F, Tardito S, et al. Single-nucleotide polymorphisms in 3'-untranslated region inducible costimulator gene and the important roles of miRNA in alopecia areata. Skin Health Dis (2021) 1(2):e34. doi: 10.1002/ski2.34
17. Zhang S, Wang L, Li M, Zhang F, Zeng X. The PD-1/PD-L pathway in rheumatic diseases. J Formos Med Assoc (2021) 120(1 Pt 1):48–59. doi: 10.1016/j.jfma.2020.04.004
18. Fang W, Zhang Z, Zhang J, Cai Z, Zeng H, Chen M, et al. Association of the CTLA4 gene CT60/rs3087243 single-nucleotide polymorphisms with graves' disease. BioMed Rep (2015) 3(5):691–6. doi: 10.3892/br.2015.493
19. López-Villalobos EF, Carrillo-Ballesteros FJ, Muñoz-Valle JF, Palafox-Sánchez CA, Valle Y, Barocio G, et al. Association of CD28 and CTLA4 haplotypes with susceptibility to primary sjögren's syndrome in Mexican population. J Clin Lab Anal (2019) 33(1):e22620. doi: 10.1002/jcla.22620
20. Gabriel SB, Schaffner SF, Nguyen H, Moore JM, Roy J, Blumenstiel B, et al. The structure of haplotype blocks in the human genome. Science (2002) 296:2225–9. doi: 10.1126/science.1069424
21. Wen YH, Lin WT, Wang WT, Chiueh TS, Chen DP. Association of CTLA4 gene polymorphism with transfusion reaction after infusion of leukoreduced blood component. J Clin Med (2019) 8:1961. doi: 10.3390/jcm8111961
22. Abdul-jabbar R-a. Significance of CTL4 gene polymorphisms in susceptibility to polycystic ovary syndrome of Iraqi women. Ann R.S.C.B. (2021) 25:6624–32.
23. Yao L, Liu B, Jiang L, Zhou L, Liu X. Association of cytotoxic T-lymphocyte antigen 4 gene with immune thrombocytopenia in Chinese han children. Hematology (2019) 24:123–8. doi: 10.1080/10245332.2018.1530179
24. Chen DP, Chu YC, Wen YH, Lin WT, Hour AL, Wang WT. Investigation of the correlation between graves' ophthalmopathy and CTLA4 gene polymorphism. J Clin Med (2019) 8:1842. doi: 10.3390/jcm8111842
25. Chen PL, Fann CS, Chang CC, Wu IL, Chiu WY, Lin CY, et al. Family-based association study of cytotoxic T-lymphocyte antigen-4 with susceptibility to graves' disease in han population of Taiwan. Genes Immun (2008) 9:87–92. doi: 10.1038/sj.gene.6364445
26. Chen S, Wang Y, Chen Y, Lin J, Liu C, Kang M, et al. Investigation of cytotoxic T-lymphocyte antigen-4 polymorphisms in non-small cell lung cancer: A case-control study. Oncotarget (2017) 8:76634–43. doi: 10.18632/oncotarget.20638
27. Liu J, Zhang H. -1722T/C polymorphism (rs733618) of CTLA-4 significantly associated with systemic lupus erythematosus (SLE): A comprehensive meta-analysis. Hum Immunol (2013) 74:341–7. doi: 10.1016/j.humimm.2012.12.009
28. Kaykhaeia M, Moghadamb H, Dabiric S, Salimidg S, Jahantighb D, Tamandani DMK, et al. Association of CTLA4 (rs4553808) and PTPN22 (rs2476601) gene polymorphisms with hashimoto's thyroiditis disease: A case-control study and an in-silico analysis. Meta Gene (2020) 24:100693. doi: 10.1016/j.mgene.2020.100693
29. Yousefipour G, Erfani N, Momtahan M, Moghaddasi H, Ghaderi A. CTLA4 exon 1 and promoter polymorphisms in patients with multiple sclerosis. Acta Neurol Scand (2009) 120:424–9. doi: 10.1111/j.1600-0404.2009.01177.x
30. Bouqbis L, Izaabel H, Akhayat O, Pérez-Lezaun A, Calafell F, Bertranpetit J, et al. Association of the CTLA4 promoter region (-1661G allele) with type 1 diabetes in the south Moroccan population. Genes Immun (2003) 4:132–7. doi: 10.1038/sj.gene.6363933
31. Fang M, Huang W, Mo D, Zhao W, Huang R. Association of five SNPs in cytotoxic T-lymphocyte antigen 4 and cancer susceptibility: Evidence from 67 studies. Cell Physiol Biochem (2018) 47:414–27. doi: 10.1159/000489953
32. Li J, Wang W, Sun Y, Zhu Y. CTLA-4 polymorphisms and predisposition to digestive system malignancies: A meta-analysis of 31 published studies. World J Surg Oncol (2020) 18:55. doi: 10.1186/s12957-020-1806-2
33. Guo Y, Guo F, Wei C, Qiu J, Liu Y, Fang Y, et al. CTLA4 gene polymorphisms influence the incidence of infection after renal transplantation in Chinese recipients. PloS One (2013) 8:e70824. doi: 10.1371/journal.pone.0070824
34. Jagasia M, Clark WB, Brown-Gentry KD, Crawford DC, Fan KH, Chen H, et al. Genetic variation in donor CTLA-4 regulatory region is a strong predictor of outcome after allogeneic hematopoietic cell transplantation for hematologic malignancies. Biol Blood Marrow Transplant (2012) 18:1069–75. doi: 10.1016/j.bbmt.2011.12.518
35. Wang L, Li D, Fu Z, Li H, Jiang W, Li D. Association of CTLA-4 gene polymorphisms with sporadic breast cancer in Chinese han population. BMC Cancer (2007) 7:173. doi: 10.1186/1471-2407-7-173
36. Yang J, Liu J, Chen Y, Tang W, Liu C, Sun Y, et al. Association of CTLA-4 tagging polymorphisms and haplotypes with hepatocellular carcinoma risk: A case-control study. Med (Baltimore) (2019) 98:e16266. doi: 10.1097/MD.0000000000016266
37. Lyons PA, Rayner TF, Trivedi S, Holle JU, Watts RA, Jayne DR, et al. Genetically distinct subsets within ANCA-associated vasculitis. N Engl J Med (2012) 367:214–23. doi: 10.1056/NEJMoa1108735
38. Liu W, Yang Z, Chen Y, Yang H, Wan X, Zhou X, et al. The association between CTLA-4, CD80/86, and CD28 gene polymorphisms and rheumatoid arthritis: An original study and meta-analysis. Front Med (Lausanne) (2021) 8:598076. doi: 10.3389/fmed.2021.598076
39. Hu S, Pu D, Xia X, Guo B, Zhang C. CTLA-4 rs5742909 polymorphism and cervical cancer risk: A meta-analysis. Med (Baltimore) (2020) 99:e19433. doi: 10.1097/MD.0000000000019433
40. Sumirtanurdin R, Laksono JP, Dania H, Ramadhani FN, Perwitasari DA, Abdulah R, et al. Single-nucleotide polymorphism of CTLA-4 (rs5742909) in correlation with schizophrenia risk factor. J Pharm Bioallied Sci (2019) 11:S605–10. doi: 10.4103/jpbs.JPBS_215_19
41. Zhang S, Yang X, Wang W. Associations of genetic polymorphisms in CTLA-4 and IL-18 with chronic liver diseases: Evidence from a meta-analysis. Genomics (2020) 112:1889–96. doi: 10.1016/j.ygeno.2019.11.001
42. Narooie-Nejad M, Taji O, Kordi Tamandani DM, Kaykhaei MA. Association of CTLA-4 gene polymorphisms -318C/T and +49A/G and hashimoto's thyroidits in zahedan, Iran. BioMed Rep (2017) 6:108–12. doi: 10.3892/br.2016.813
43. Shojaa M, Aghaie M, Amoli M, Javid N, Shakeri F, Khashayar P, et al. Association between 318C/T polymorphism of the CTLA-4 gene and systemic lupus erythematosus in Iranian patients. Int J Rheum Dis (2017) 20:2040–4. doi: 10.1111/1756-185X.12275
44. Aslam MM, Jalil F, John P, Fan KH, Bhatti A, Feingold E, et al. A sequencing study of CTLA4 in Pakistani rheumatoid arthritis cases. PloS One (2020) 15:e0239426. doi: 10.1371/journal.pone.0239426
45. Juran BD, Atkinson EJ, Schlicht EM, Fridley BL, Lazaridis KN. Primary biliary cirrhosis is associated with a genetic variant in the 3' flanking region of the CTLA4 gene. Gastroenterology (2008) 135:1200–6. doi: 10.1053/j.gastro.2008.06.077
46. Choi H, Tabashidze N, Rossner P Jr., Dostal M, Pastorkova A, Kong SW, et al. Altered vulnerability to asthma at various levels of ambient Benzo[a]Pyrene by CTLA4, STAT4 and CYP2E1 polymorphisms. Environ pollut (2017) 231:1134–44. doi: 10.1016/j.envpol.2017.07.057
47. Mayr C. What are 3' UTRs doing? Cold Spring Harb Perspect Biol (2019) 11(10):a034728. doi: 10.1101/cshperspect.a034728
48. Da LS, Zhang Y, Zhang CJ, Bu LJ, Zhu YZ, Ma T, et al. The PD-1 rs36084323 A > G polymorphism decrease cancer risk in Asian: A meta-analysis. Pathol Res Pract (2018) 214:1758–64. doi: 10.1016/j.prp.2018.09.015
49. Ishizaki Y, Yukaya N, Kusuhara K, Kira R, Torisu H, Ihara K, et al. PD1 as a common candidate susceptibility gene of subacute sclerosing panencephalitis. Hum Genet (2010) 127:411–9. doi: 10.1007/s00439-009-0781-z
50. Shen Y, Liu Y, Wang XQ, Ke X, Kang HY, Hong SL. Association between TNFSF4 and BLK gene polymorphisms and susceptibility to allergic rhinitis. Mol Med Rep (2017) 16:3224–32. doi: 10.3892/mmr.2017.6954
51. Liu S, Wang X, Yu S, Yan M, Peng Y, Zhang G, et al. A meta-analysis on the association between TNFSF4 polymorphisms (rs3861950 T > c and rs1234313 a > G) and susceptibility to coronary artery disease. Front Physiol (2020) 11:539288. doi: 10.3389/fphys.2020.539288
52. Khan U, Ghazanfar H. T Lymphocytes and autoimmunity. Int Rev Cell Mol Biol (2018) 341:125–68. doi: 10.1016/bs.ircmb.2018.05.008
Keywords: systemic lupus erythematosus (SLE), co-stimulatory/co-inhibitory molecules, single nucleotide polymorphism (SNP), autoimmune disease (AD), association
Citation: Chen D-P, Lin W-T and Yu K-H (2022) Investigation of the association between the genetic polymorphisms of the co-stimulatory system and systemic lupus erythematosus. Front. Immunol. 13:946456. doi: 10.3389/fimmu.2022.946456
Received: 17 May 2022; Accepted: 15 August 2022;
Published: 06 September 2022.
Edited by:
Zhiwei Xu, The University of Queensland, AustraliaReviewed by:
Reda Djidjik, University of Algiers 1, Algeria;Muhammad Imran Khan, The University of Haripur, PakistanCopyright © 2022 Chen, Lin and Yu. This is an open-access article distributed under the terms of the Creative Commons Attribution License (CC BY). The use, distribution or reproduction in other forums is permitted, provided the original author(s) and the copyright owner(s) are credited and that the original publication in this journal is cited, in accordance with accepted academic practice. No use, distribution or reproduction is permitted which does not comply with these terms.
*Correspondence: Kuang-Hui Yu, gout@adm.cgmh.org.tw