 Wang-Dong Xu
- 1Department of Evidence-Based Medicine, Southwest Medical University, Luzhou, China
- 2Department of Rheumatology and Immunology, Affiliated Hospital of Southwest Medical University, Luzhou, China
Systemic lupus erythematosus (SLE) is a rheumatic disease. Growth differentiation factor 15 (GDF-15) is a member of transforming growth factor-β superfamily. To date, association of GDF-15 with SLE pathogenesis is not clarified. This study discussed GDF-15 serum levels and gene polymorphisms in SLE patients and lupus mouse model further demonstrated the role of GDF-15 in lupus development. We conducted two independent case-control studies for SLE patients. One is to evaluate serum levels of GDF-15 in 54 SLE patients and 90 healthy controls, and the other one is to analyze gene polymorphisms of GDF-15 in 289 SLE patients and 525 healthy controls. Serum levels of GDF-15 were detected by ELISA. GDF-15 gene polymorphisms (rs1055150, rs1058587, rs1059519, rs1059369, rs1227731, rs4808793, and rs16982345) were genotyped by the Kompetitive Allele-Specific PCR (KASP) method. Addition of recombinant GDF-15 into pristane-induced lupus mice evaluated histological and serological changes. Results showed that serum levels of GDF-15 were overexpressed in SLE patients and associated with disease activity. Polymorphisms rs1055150, rs1059369, rs1059519, and rs4808793 of GDF-15 gene were related to SLE risk. Lupus mice showed splenomegaly, severe histological scores, and high levels of autoantibodies [antinuclear antibodies (ANA) and total immunoglobulin G (IgG)], whereas administration of GDF-15 into lupus mice reduced the histological changes. Percentages of CD8+, CD11b+, CD19+, CD11C+ cells, TH2 cells, and pro-inflammatory cytokines (IL-1β, IL-2, IL-4, IL-21, and IL-22) were reduced after GDF-15 treatment in lupus mice. In conclusion, GDF-15 was related to lupus pathogenesis and inhibited lupus development.
Introduction
Systemic lupus erythematosus (SLE) is a rheumatic autoimmune disease with heterogeneous clinical manifestations. To date, etiology and pathophysiology of SLE are not fully clarified (1). Glucocorticoids and immunosuppressive drugs are non-specific therapeutic agents for SLE patients, which may lead to adverse effects (2). Therefore, searching for potential biomarkers for SLE to better prevent and early diagnose this disease and targeting the biomarkers for therapy of SLE are urgently needed.
Previous studies found many target genes related to SLE risk, such as signal transducer and activator of transcription 4 (STAT4), death-associated protein 1 (DAP1), mannose binding lectin 2 (MAB2), prostaglandins E2 (PGE2), and PIN2/TERF1-interacting telomerase inhibitor 1 (PINX1) (3–8). Growth differentiation factor 15 (GDF-15) is a member of transforming growth factor–β (TGF-β) superfamily. GDF-15 is a 25-kDa homodimer, consisting of two 112–amino acid polypeptide chains (9). In physiological conditions, expression of serum GDF-15 is modest (10), whereas it is elevated in pathological conditions, such as in patients with renal failure, chronic liver disease, and rheumatoid arthritis (RA), suggesting that GDF-15 may be a potential biomarker for diseases (9, 11). To date, the role of GDF-15 in SLE is largely unknown, although limited studies with small sample size indicated high expression of GDF-15 in SLE patients (12, 13). However, whether GDF-15 gene polymorphisms relate to SLE risk in Chinese population and whether GDF-15 regulates lupus development need to be discussed. In this study, we first discussed the serum levels of GDF-15 in SLE patients and the association of GDF-15 gene polymorphisms with SLE risk in a Chinese Han population. Second, we conducted a lupus mouse model to confirm the functional role of GDF-15 in lupus development. Last, this study revealed the potential of serum GDF-15 as a SLE biomarker and demonstrated the role of GDF-15 in inhibiting lupus pathogenesis.
Materials and methods
Patients and Controls
There are two independent case-control studies. The first one is to evaluate the serum levels of GDF-15 in SLE patients and discuss the association of GDF-15 and SLE pathogenesis, including 54 SLE patients and 90 healthy controls (sex and age matched). The second one is to discuss the association of GDF-15 gene polymorphisms in 289 SLE patients and 525 healthy controls. Clinical and laboratory features of patients with SLE were collected, mainly including arthritis, discoid rash, alopecia, oral ulcers, vasculitis, C3, C4, erythrocyte sedimentation rate (ESR), C-reactive protein (CRP), immunoglobulin G (IgG), IgA, IgM, and rheumatoid factor (RF). Activity of SLE was calculated by SLE Disease Activity Index version 2000 (SLEDAI-2K), which was divided into less active disease activity (SLEDAI < 10) and high (active) disease activity (SLEDAI ≥ 10) (14). Diagnosis of SLE patients was according to the 1997 American College of Rheumatology (ACR) criteria for SLE (15). Patients were from Department of Rheumatology and Immunology, Affiliated Hospital of Southwest Medical University. Healthy controls were from Physical Examination Center of Jiangyang District Center for Disease Control and Prevention in Luzhou, Sichuan, China. This study was admitted by Ethic Research Committee of Affiliated Hospital of Southwest Medical University, and each participant agreed and signed informed consent. The study was carried out according to The Code of Ethics of the World Medical Association (Declaration of Helsinki).
Detecting Serum Levels of GDF-15 in SLE Patients and ANA, Anti–Double-stranded DNA, Total IgG in Mice Models
Peripheral vein blood of each participant was collected and centrifuged, and serum was refrigerated at −80°C for further usage. Serum GDF-15 levels were detected by enzyme-linked immunosorbent assay (ELISA) kit (Cusabio, Houston, USA), according to the instruction of the manufacturer. Briefly, serum samples and different concentrations of standards were added to each well, covered with the adhesive strip. After incubating for 2 h at 37°C, the liquid was removed, added biotinylated antibody, and then incubated at 37°C for 1 h. After washing three times, the horseradish peroxidase–avidin was added into each well (incubating at 37°C for 1 h). After washing five times, 90 μl of TMB substrate was added and incubated at 37°C for 30 min without light. Finally, 50 ml of stop solution was added and determined optical density in microplate reader at 450 nm. The minimum detectable concentration is 1.95 pg/ml. Detecting levels of antinuclear antibodies (ANA), anti–double-stranded DNA (anti-dsDNA), and total IgG in serum from mice models was described as previously by ELISA kits (CUSABIO, Wuhan, China) (16). The minimum detecting level of ANA, anti-dsDNA, and total IgG was 7.8 pg/ml, 1.56 ng/ml, and 125 ng/ml, respectively. All samples were measured in duplicate.
Single-Nucleotide Polymorphism Selecting and Genotyping
Previous studies were systematically reviewed, and the National Center for Biotechnology Information database (NCBI; https://www.ncbi.nlm.nih.gov/) and Genome Reference Consortium Human Build 38 project (GRCh38; http://may2017.archive.ensembl.org/Homo_sapiens/Info/Index) were considered. Finally, seven GDF-15 gene polymorphisms (rs1055150, rs1058587, rs1059519, rs1059369, rs1227731, rs4808793, and rs16982345) were selected. All the loci ware according with pairwise tagging of HapMap population with r2 ≥ 0.8, a minor allele frequency ≥5%, and Chinese Han Beijing (CHB) ethnicity. Genomic DNAs were extracted and purified from peripheral blood mononuclear cells by TIANamp Blood DNA kits (Tiangen, Beijing, China). Genotyping was conducted by the Kompetitive Allele-Specific PCR (KASP) method (Gene Company, Shanghai, China). Primer information for each polymorphism was listed in Supplementary Table 1.
Mice Models and Experimental Protocol
Female C57BL/6 mice (6–8 weeks) were purchased from SiPeiFu Biotechnology (Beijing, China). Mice were kept with water and food freely (temperature, 23 ± 1°C; humidity, 50 ± 10%, 12/12-h light/dark cycle). Mice were randomly divided into six groups (seven mice per group). Five groups of mice were intraperitoneally injected with 0.5 ml of pristane (Sigma Aldrich, St Louis, USA) to induce lupus. Another group was injected with phosphate-buffered saline solution (PBS). Recombinant human GDF-15 protein (SinoBiological, Beijing, China) was dissolved into PBS for further usage. At week 19, five groups of mice injected with pristane were further injected with PBS, or 10, or 50, or 100, or 500 μg/kg of GDF-15 every other day (seven times), respectively. The mice treated with PBS were further injected with PBS every other day (seven times). At week 23, all the mice were euthanized. Heart blood was collected and centrifuged for obtaining serum. The liver, spleen, and two kidneys were weighed and photographed. Studies related to mice were approved from Animal Ethics Committee of Southwest Medical University.
Histology and Scoring
Kidneys were fixed in 10% formalin for 24 h. Then, kidneys were embedded in paraffin and cut into slices (4 μm). Finally, sections were stained with hematoxylin and eosin (HE) to evaluate the severity of glomerular lesions. Ponceau, Fuchsin, and Aniline blue (Masson) staining assessed renal fibrosis. Immunofluorescence assay evaluated immune complex (total IgG) deposition. HE and Masson scoring was conducted according to previous studies (17–19). HE staining assessed renal injury from five dimensions, including glomerular injury, tubular injury, renal interstitial inflammation, renal interstitial fibrosis, and protein tubule. Based on staining area, all five dimensions can be divided into none (<5%), mild (5%–25%), moderate (26%–50%), and severe (>50%), scored 0–3, respectively. The sum of five renal lesion scores was the HE staining score (Supplementary Table 2). For Masson trichrome staining, every kidney slice was stained with Aniline blue, Acid Fuchsin, and Ponceau S, where the collagen fibers, mucus, and cartilage are blue. Muscle fibers, cellulose, muscle, glia, and cytoplasm are red; red blood cells are orange; and nuclei are black blue. Masson score is the percentage of the staining area in the total visual field area under the 400× microscope. The average of three random fields in every mouse kidney slice is the final Masson score.
Inflammatory Cytokines Microarray
Eighteen inflammatory cytokines [IL-1 beta (IL-1β), IL-2, IL-4, IL-5, IL-6, IL-10, IL-12p70, IL-13, IL-17A, IL-17F, IL-21, IL-22, IL-23, IL-28A (IFN-lambda 2), interferon-gamma (IFNγ), macrophage inflammatory protein-3 alpha (MIP-3α), TGF-β1, and tumor necrosis factor–alpha (TNF-α)] were tested by microarray (RayBiotech, Georgia, USA) according to the manufacturer’s instruction. Briefly, slides were blocked with 100 µl of sample diluent at room temperature (30 min), and then added 100 µl of standard cytokines or samples in each well, incubating at room temperature for 2 h. Liquid was removed, washed seven times, and incubated with biotinylated antibody cocktail for 1.5 h. Then, slides were washed five times, adding Cy3 equivalent dye-conjugated streptavidin to each well for 1 h without light. Finally, fluorescence was detected by Axon GenePix 4400B Microarray Scanner (Molecular Devices, Sunnyvale, USA). Data were analyzed by GenePix Pro 6.0 software (Axon Instruments, Foster City, USA).
Cell Isolation and Flow Cytometry
Mouse spleen was collected, and ground and red blood cells were lysed (Beyotime, Shanghai, China). After obtaining leukocytes, cells were used to detect proportion of CD14+, CD11c+, CD11b+, CD19+, CD3+, CD8+, CD4+IFNγ+ (TH1), CD4+IL-4+ (TH2), CD4+IL-17A+ (TH17), and CD4+Foxp3+ (Treg) cells. The following antibodies were used for cytometry: fluorescein isothiocyanate–conjugated anti-CD3 (145-2C11), CD4 (GK1.5), CD11c (HL3), CD14 (rmC5-3); phycoerythrin (PE)–conjugated anti-Foxp3 (MF23); PE-CF594–conjugated anti-IFNγ (XMG1.2); allophycocyanin (APC)-conjugated anti-CD8 (53-6.7), CD19 (1D3), IL-4 (11B11), CD11b (M1/70); and APC-CyTM7–conjugated anti–IL-17A (TC11-18H10). All the antibodies were purchased from BD Biosciences (California, USA), and fixation buffer and permeabilization buffer were purchase from R&D Systems (Minneapolis, USA). Results were acquired by FACSVerse (BD Biosciences, Franklin Lakes, USA) and data were analyzed by FlowJo software (Tree Star Inc., Franklin Lakes, USA).
Statistics
SPSS 26.0 and GraphPad Prism 8.0 were used for statistics. Data were described by means ± standard deviation or median (interquartile range). Receiver operating characteristic (ROC) analysis explored the diagnostic ability of serum GDF-15. Sensitivity, specificity, positive and negative likelihood ratio (+LR and −LR), Youden’s index, accuracy, and positive and negative predictive value (PPV and NPV) were calculated to evaluate capacity of serum GDF-15 in discriminating SLE from healthy controls. Spearman’s rank correlation test discussed the relationship between different parameters. Bonferroni test was used to control the probability of committing a type I error when we performed multiple comparisons. Odds ratio (OR) and 95% confidence interval (CI) were calculated by a logistic regression model. Power was analyzed by G*Power 3.1.9.2 (Franz Faul, Kiel University, Germany).
Results
Association of Serum GDF-15 in SLE Patients, and Potential to be A Narker for SLE
Characteristics of patients with SLE and healthy controls were shown in Table 1. Serum levels of GDF-15 in 54 SLE patients were higher as compared to that in 90 healthy controls [565.397 (334.924–887.646) vs. 153.641 (99.583–196.645) pg/ml, P < 0.001; Figure 1A]. SLE patients with hematuria had higher serum levels of GDF-15 than that in patients without hematuria [904.140 (589.491–1498.938) vs. 452.440 (253.513–691.203), P < 0.001; Figure 1B], and patients with high disease activity (SLEDAI ≥ 10) had much higher serum levels of GDF-15 than that in patients with less active disease activity (SLEDAI < 10) [727.972 (445.530–1374.793) vs. 306.506 (230.665–515.959) pg/ml, P < 0.001; Figure 1C]. Serum GDF-15 distinguished SLE patients from healthy controls with area under the curve 0.926 (95% CI: 0.886–0.967, P < 0.001; Figure 1D). Interestingly, serum GDF-15 was related to some characteristics, including SLEDAI (rs = 0.502, P < 0.001), ESR (rs = 0.303, P = 0.032), C3 (rs = −0.391, P = 0.020), and C4 (rs = −0.297, P = 0.035) (Figures 1E–H).
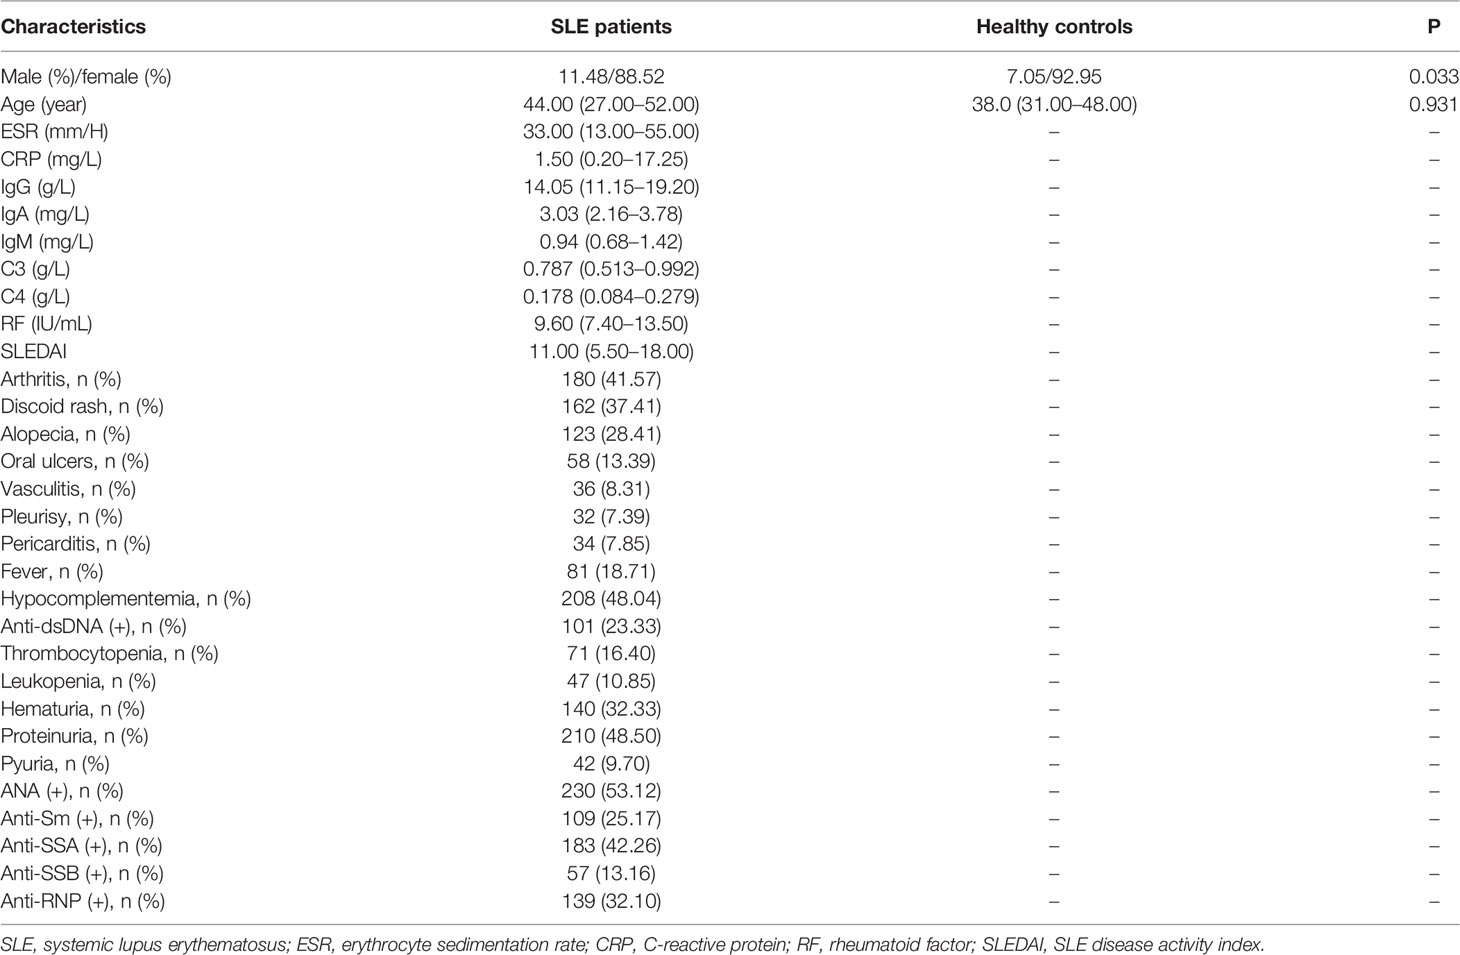
Table 1 Characteristics of SLE patients and healthy controls.
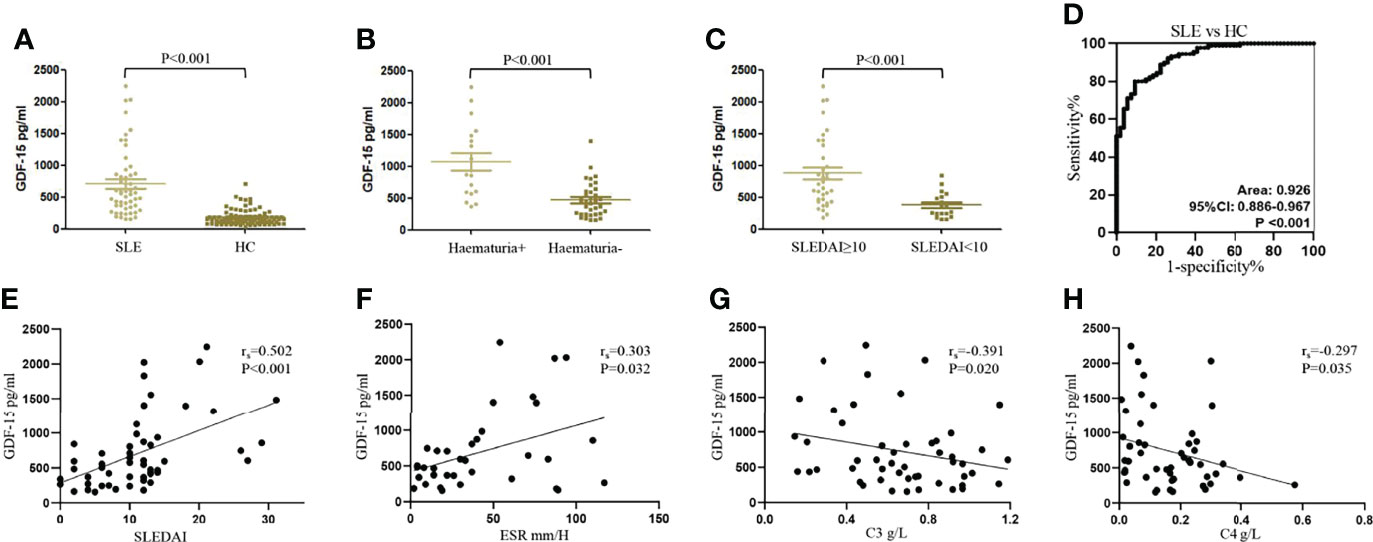
Figure 1 Increased serum levels of GDF-15 in SLE patients in training cohort. (A) Serum levels of GDF-15 in 54 systemic lupus erythematosus (SLE) patients and 90 healthy controls were detected by enzyme-linked immunosorbent assay. (B, C) GDF-15 expression in SLE patients with hematuria, different SLE disease activity index (SLEDAI). (D) Receiver operating characteristic (ROC) curve analysis of serum GDF-15 for diagnosis of SLE. (E–H) Association of serum GDF-15 with SLEDAI, erythrocyte sedimentation rate (ESR), C3, and C4. Mann–Whitney U-test discussed differences between two groups. Spearman’s non-parametric test calculated the association of parameters.
To better evaluate the capacity of serum GDF-15 in distinguishing SLE from healthy controls, the diagnostic efficiency of serum GDF-15 was calculated (Table 2). Compared with healthy controls, the sensitivity, specificity, +LR, −LR, Youden’s index, accuracy, PPV, and NPV in SLE patients were 0.907, 0.800, 4.537, 0.116, 0.707, 0.840, 0.731, and 0.935, respectively, at cutoff value 230.993 pg/ml. Thus, GDF-15 was related to SLE pathogenesis and may be a potential biomarker to distinguish SLE patients from healthy controls.
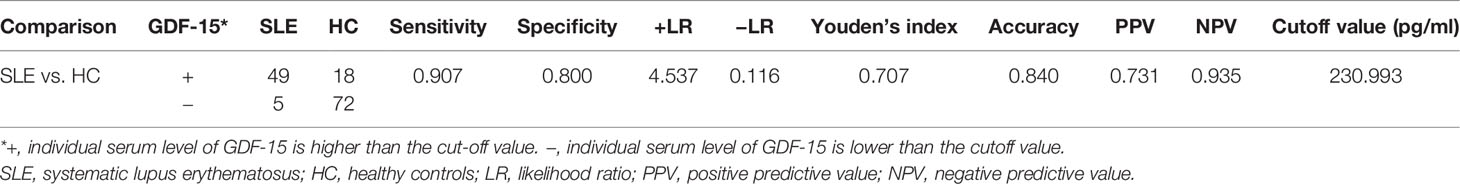
Table 2 Capacity of serum GDF-15 in distinguishing SLE from healthy controls.
GDF-15 Gene Polymorphisms Relate to SLE Risk
Seven polymorphisms were detected from 289 SLE patients and 525 healthy controls. Hardy–Weinberg equilibrium test for the seven polymorphisms was conducted (Supplementary Table 3). The powers were 0.987 for rs1055150, 0.968 for rs1058587, 0.978 for rs1059369, 0.980 for rs1059519, 0.819 for rs1227731, 0.983 for rs4808793, and 0.968 for rs16982345 to detect a 1.85-fold increased risk assuming an α value of 0.05. Because sex between SLE patients and healthy controls was not matched, association of the polymorphisms between SLE patients and controls was adjusted (Table 3). Frequencies of genotypes CC and GC of rs1055150 in SLE patients were higher than those in controls [CC vs. GG, OR (95% CI): 2.123 (1.178–3.828), P = 0.012; GC vs. GG, OR (95% CI): 2.675 (1.485–4.818), P = 0.001]. In a recessive model (GG vs. GC+CC), frequency of genotype GG of rs1055150 was lower in SLE patients (OR (95% CI): 0.420 (0.238–0.742), P = 0.003). For rs1059369, increased frequencies of TT + AT genotypes and decreased frequency of allele A were found in SLE patients [TT + AT vs. AA (dominant model), OR (95% CI): 1.454 (1.069–1.977), P = 0.017; A vs. T, OR (95% CI): 0.803 (0.653–0.986), P = 0.036]. Frequencies of GG, GC, and GG + GC genotypes for rs1059519 were higher in SLE patients when compared with those in healthy controls [GG vs. CC, OR (95% CI): 2.059 (1.141–3.715), P = 0.016; GC vs. CC, OR (95% CI): 2.729 (1.512–4.926), P = 0.001; CC vs. (GG + GC) (recessive model), OR (95% CI): 0.423 (0.239–0.749), P = 0.003]. Compared with healthy controls, frequencies of CC and CG genotypes for rs4808793 in SLE patients were elevated, and in a recessive model, frequencies of GG genotype were declined in SLE patients [CC vs. GG, OR (95% CI): 1.796 (1.004–3.210), P = 0.048; CG vs. GG, OR (95% CI): 2.414 (1.351–4.311), P = 0.003; GG vs. (CC + CG) (recessive model), OR (95% CI): 0.481 (0.275, 0.842), P = 0.010]. There was no significant difference regarding allele or genotype distribution between SLE patients and controls for rs1058587, rs1227731, and rs16982345.
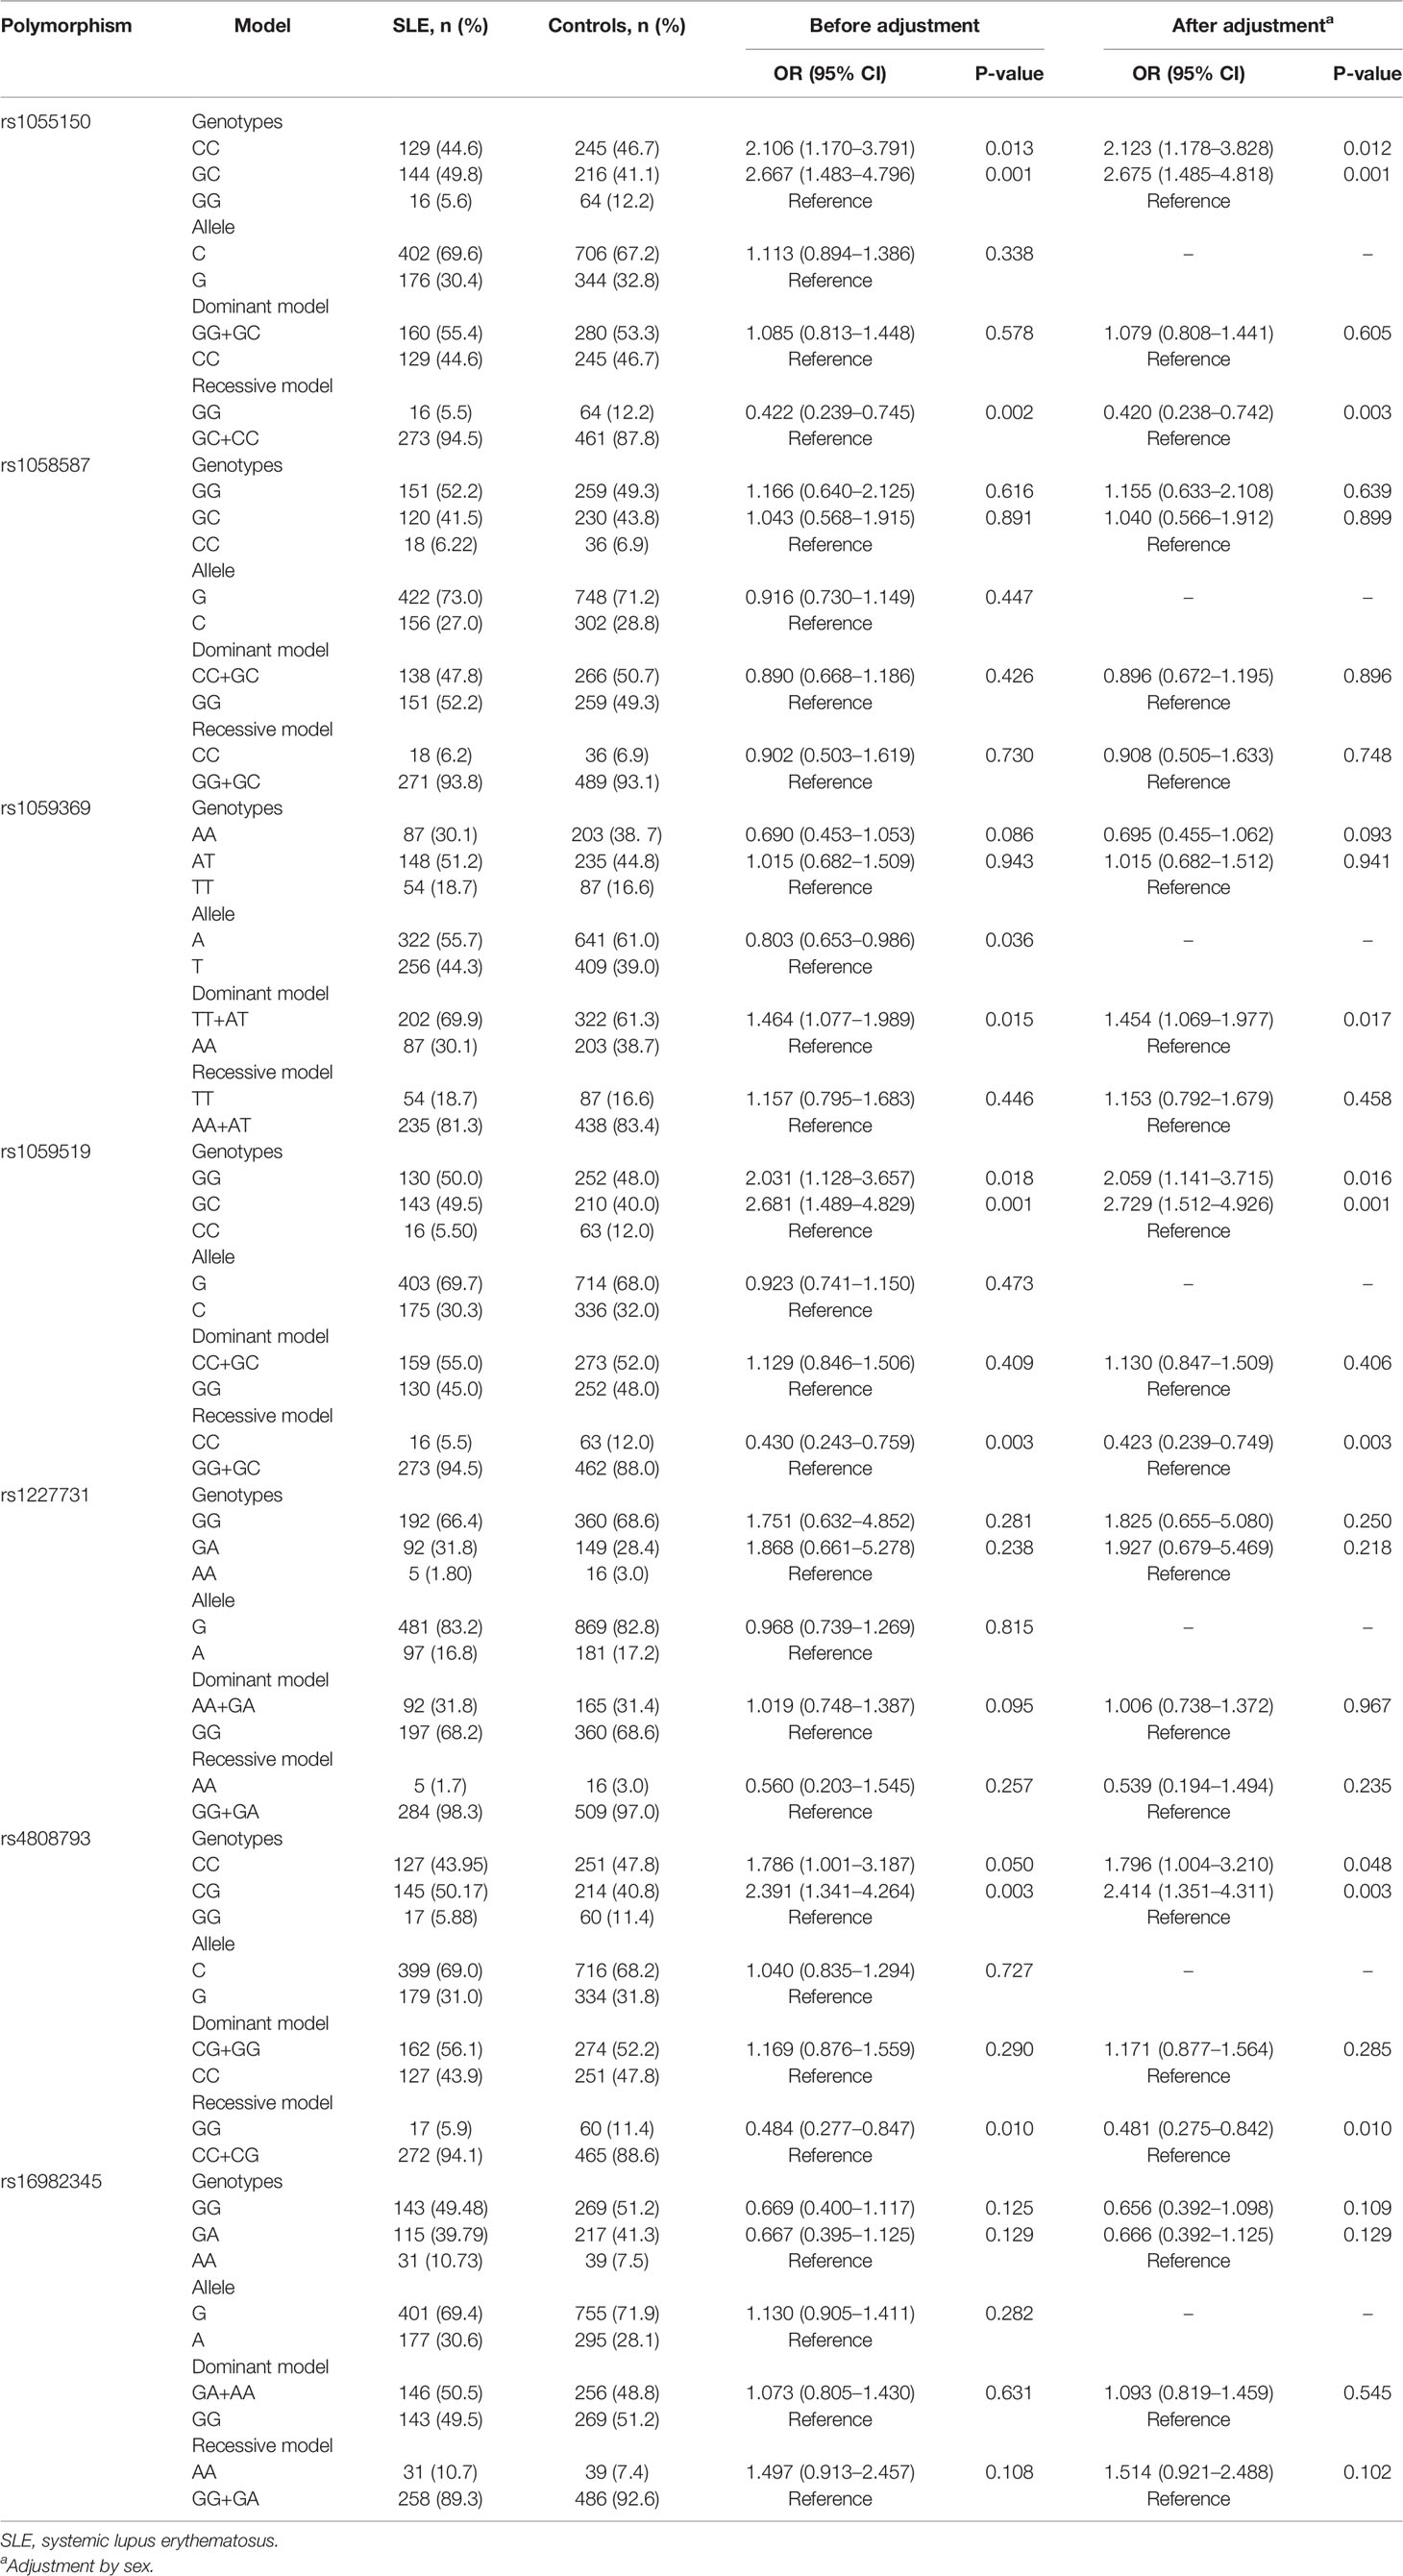
Table 3 Allele and genotype frequencies of seven GDF-15 gene polymorphisms between SLE patients and healthy controls.
Association between the seven polymorphisms and clinical and laboratory parameters of SLE patients, such as SLEDAI, C3, C4, ESR, RF, IgA, IgM, IgG, CRP, ANA, anti-SSA, anti-SSB, was discussed in Table 4, Supplementary Table 4. SLEDAI was significantly different in patients with rs1227731 GG, GA, and AA genotypes [GG vs. GA vs. AA: 10.000 (4.000–14.000) vs. 9.000 (7.000–17.000) vs. 8.000 (6.000–8.500), P = 0.037]. Serum levels of complement C4 were different in patients for rs1227731 genotypes, and patients carrying AA genotype had lower serum C4 [GG vs. GA vs. AA, P = 0.008; (GG + GA) vs. AA, P = 0.004]. Serum levels of IgG were different in patients for rs1227731 (AA vs. AT vs. TT, P = 0.026), and SLE patients with TT genotype had lower serum levels of IgG (AA + AT vs. TT, P = 0.048). There was a higher frequency of allele G of rs1227731 in patients with anti-SSA (+) and anti-SSB (+) (P = 0.037, P = 0.038). For rs1059369, serum levels of IgA were reduced in patients with TT genotype (AA + AT vs. TT, P = 0.042). SLE patients with fever, anti-SSA (+), and anti-SSB (+) showed significant differences of frequencies of rs1059369 genotypes, compared with patients without these clinical features (P = 0.047, P = 0.033, P = 0.018). There was a higher frequency of allele A of rs1059369 in patients with fever compared with the patients without fever (P = 0.016). A lower frequency of allele A of rs1059369 in SLE patients with anti-SSA (+) was noted (P = 0.011). For rs16982345, patients with GG, GA, and AA genotypes had different levels of RF (P = 0.021), and there were increased levels of RF in patients with GG genotype (GG vs. GA+AA, P = 0.009). There was a higher frequency of allele G of rs16982345 in SLE patients with anti-dsDNA (+) (P = 0.024) and anti-RNP (+) (P = 0.026). There was a higher frequency of allele C of rs4808793 in patients with anti-SSB (+), and a lower frequency of allele C of rs4808793 in patients with pleurisy compared with those in patients without the features (P = 0.043, P = 0.045). There was a lower frequency of allele G of rs1059519 in patients with pleurisy (P = 0.034).
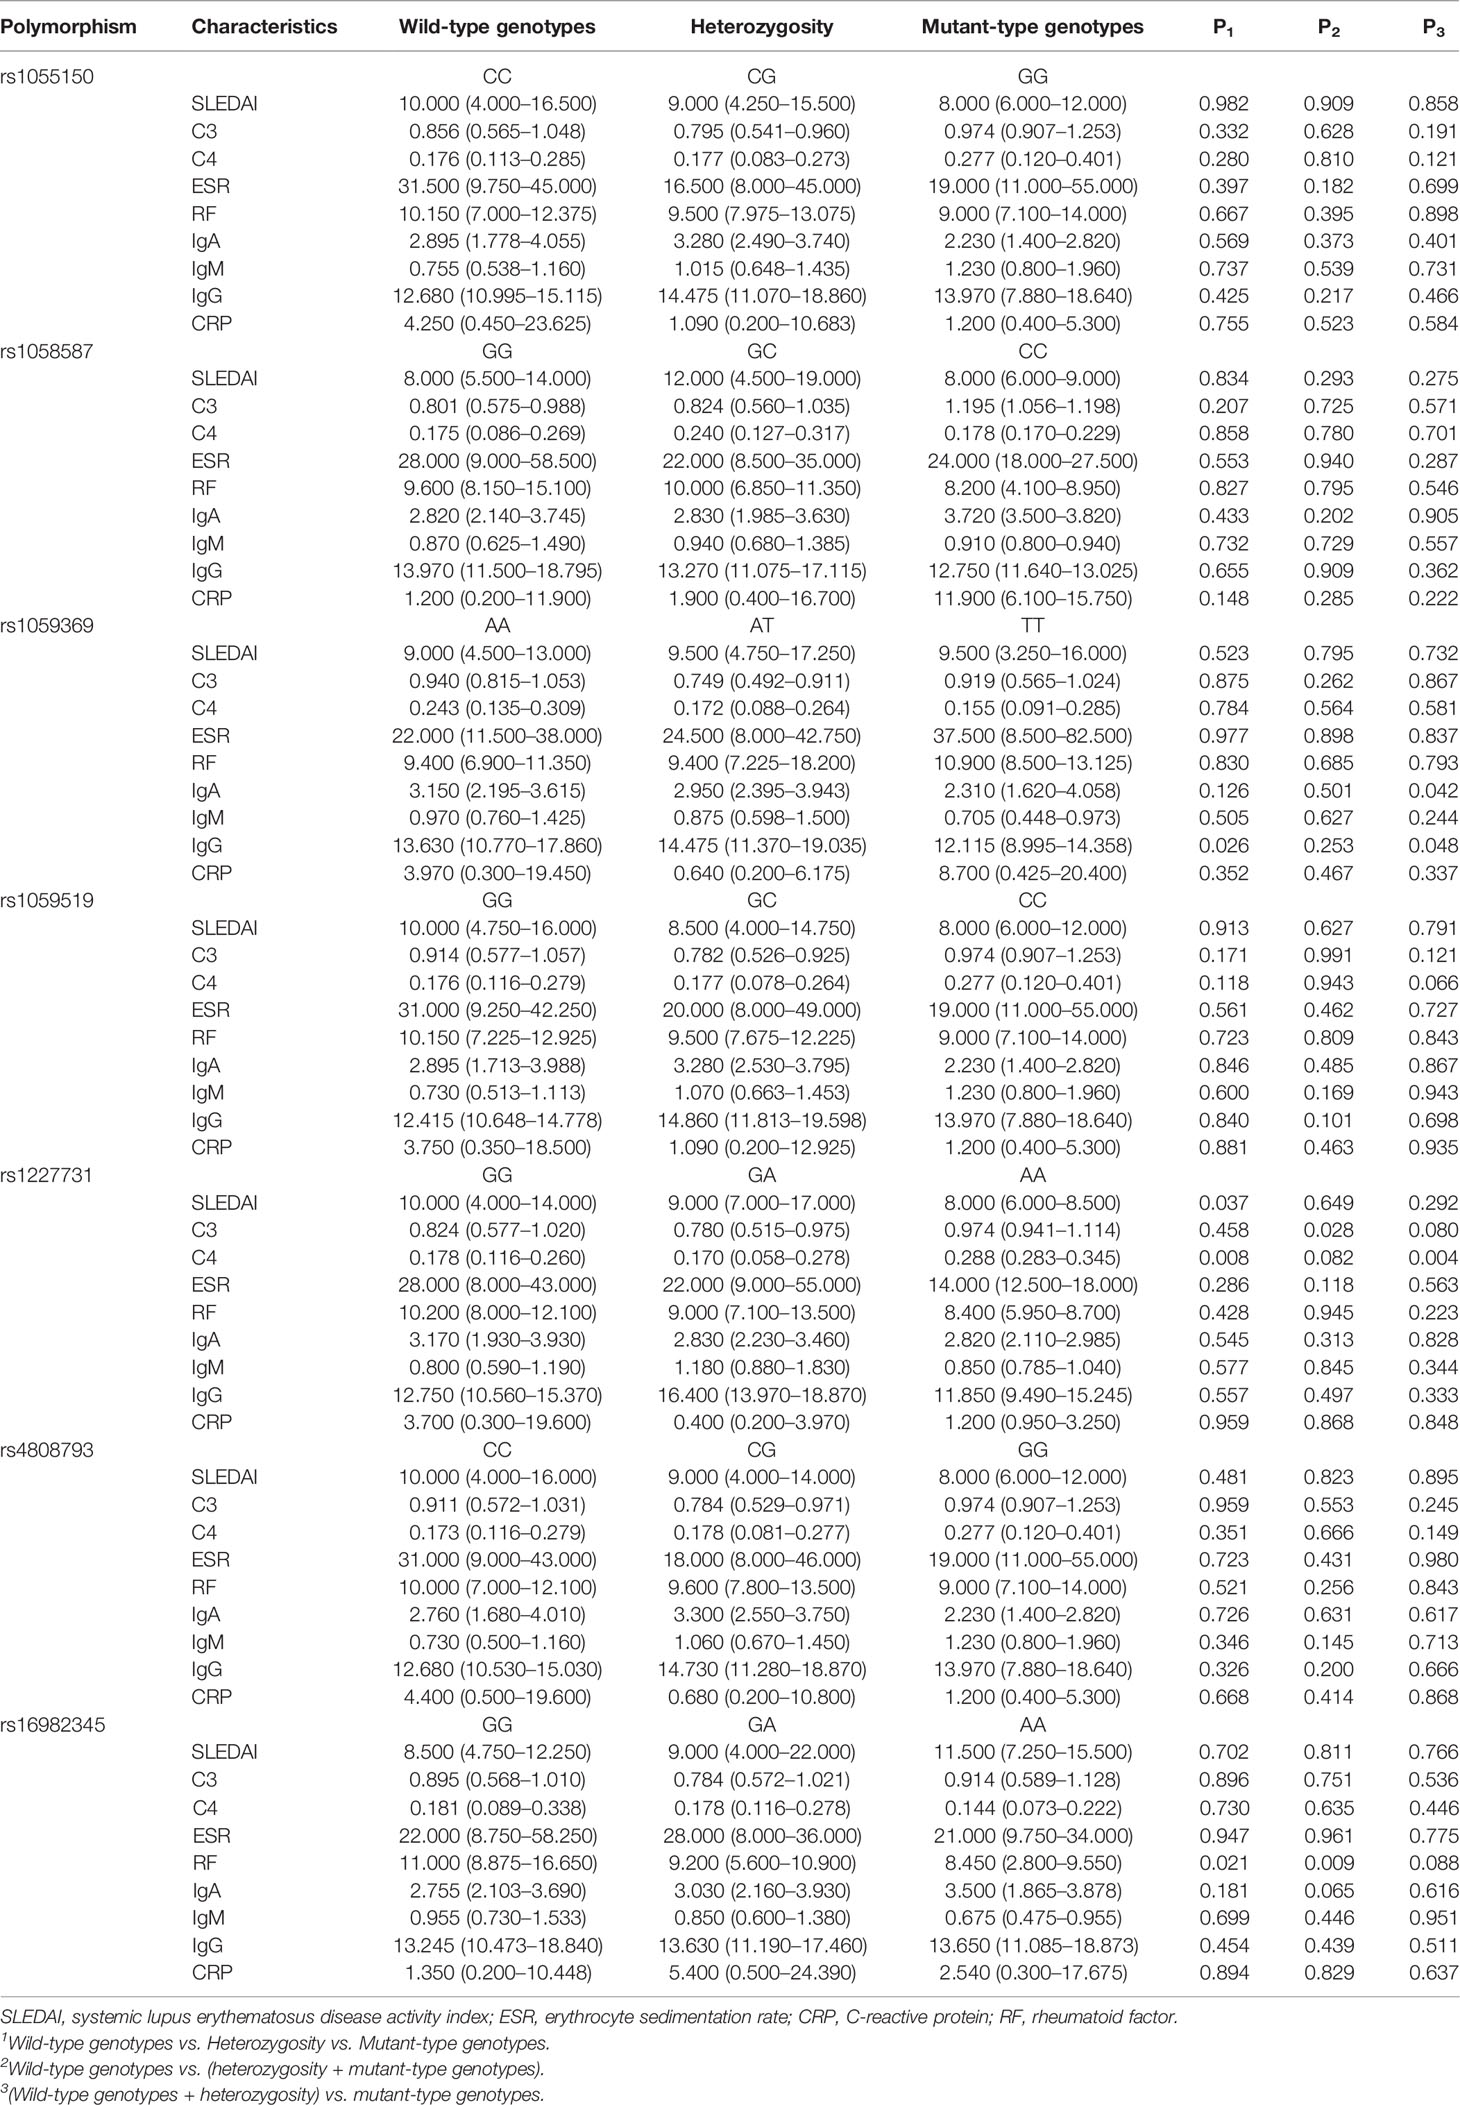
Table 4 Association of GDF-15 gene polymorphisms in SLE patients with clinical, laboratory features (quantitative variables).
Haplotype analysis was further explored with respect to association of GDF-15 haplotypes with SLE risk. Two blocks were defined. Block 1 consists of rs16982345 and rs1058587, and block 2 consists of rs4808793, rs1059519, rs1059369, and rs1227731 (Figure 2). Results showed that higher frequencies of GG and CA haplotypes and lower frequencies of GA and CG haplotypes were noted in SLE patients than those in healthy controls (All P < 0.005). Frequency of CGTG haplotype was lower in SLE patients compared with that in controls (P = 0.034, Table 5).
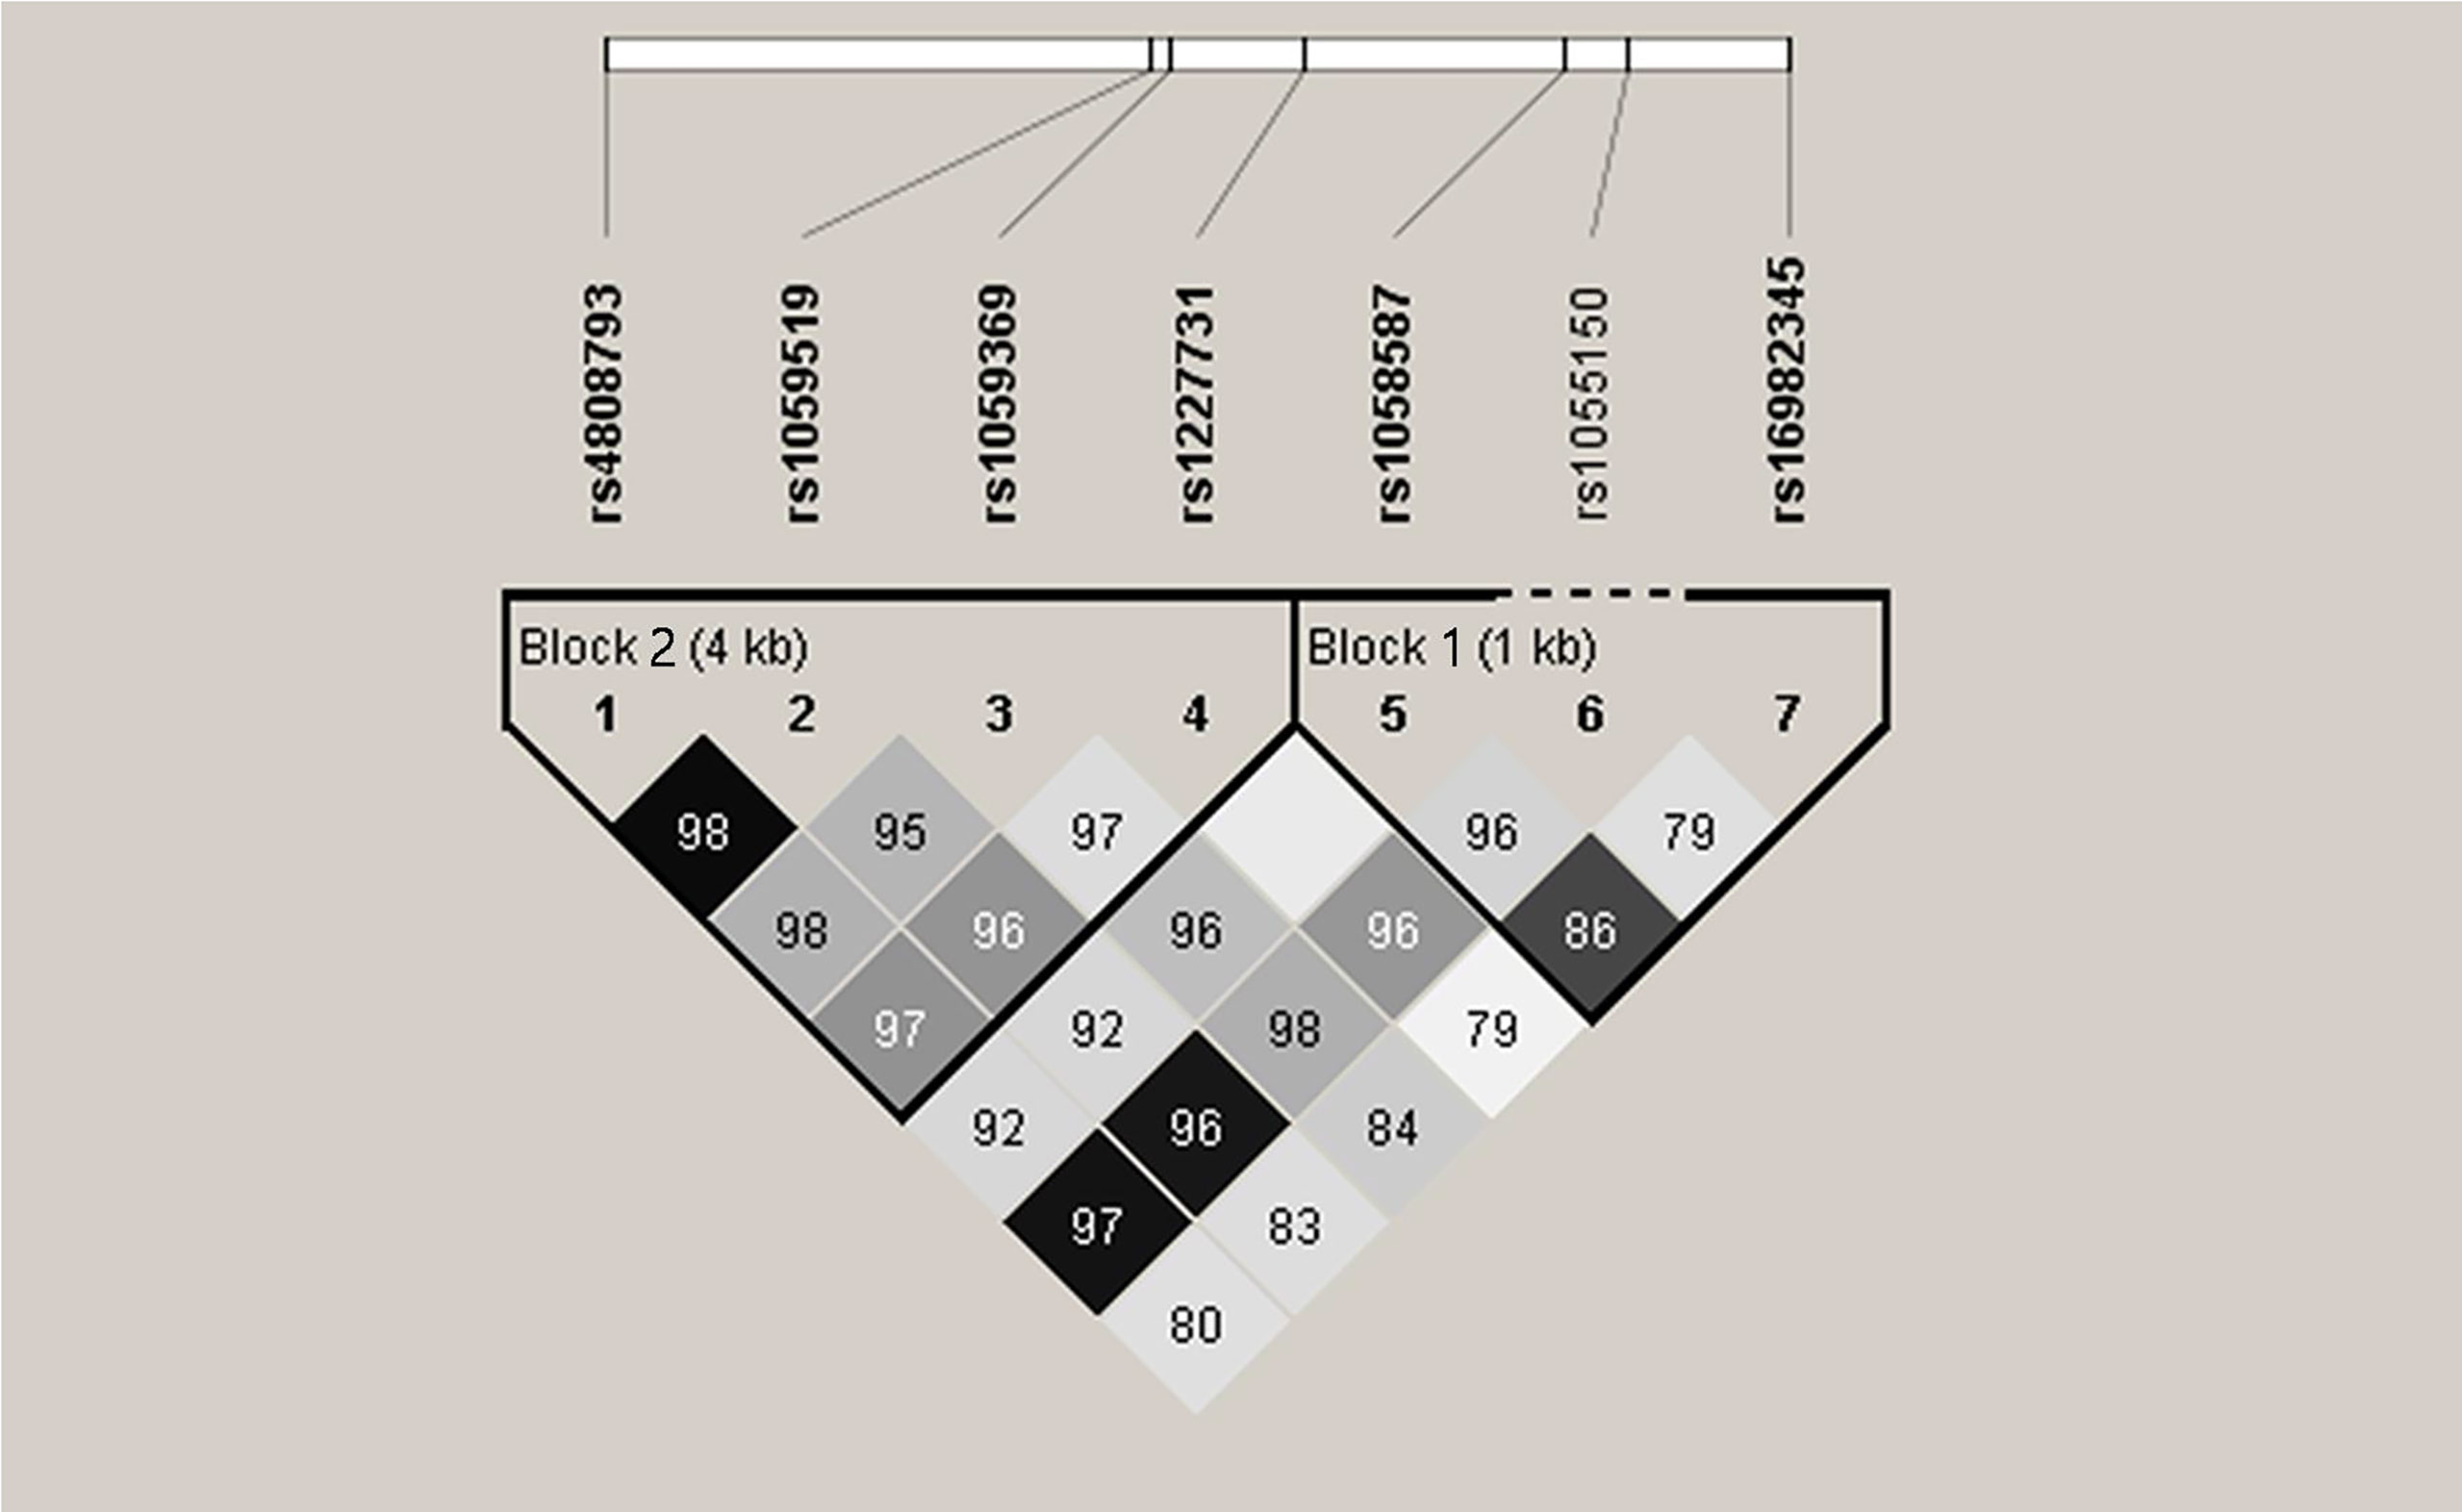
Figure 2 Linkage disequilibrium (LD) of seven single-nucleotide polymorphisms in GDF-15 gene. Intensity of linkage disequilibrium (LD) is reflected in each box by color and numeric value. The number is disequilibrium value (D′) (for example, 98 means D′ = 0.98). Correlation degree of two crossed polymorphisms is reflected by color shading: Black means r2 > 0.8; dark gray means r2 from 0.4 to 0.8; light gray means r2 < 0.4. There are two blocks. Block 1 consists of rs16982345 and rs1058587. Block 2 consists of rs4808793, rs1059519, rs1059369, and rs1227731.
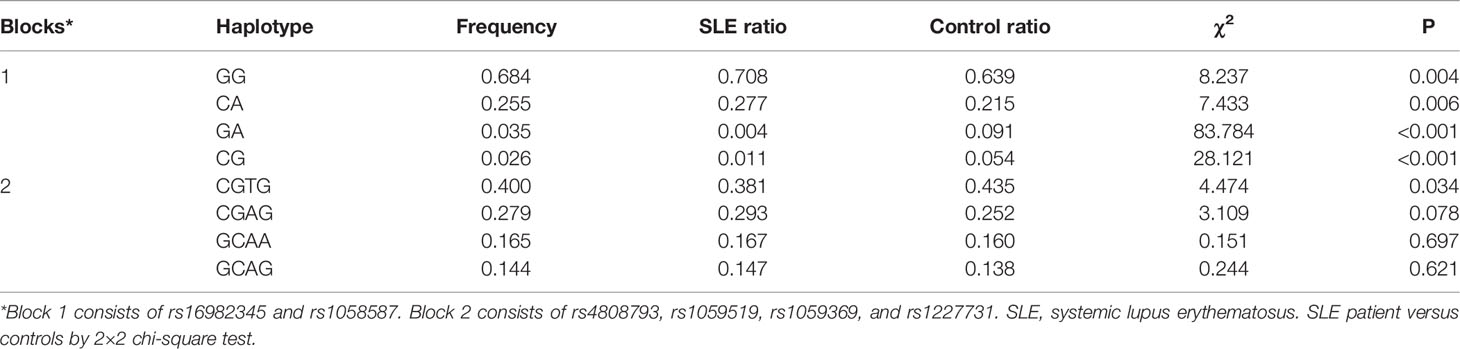
Table 5 Haplotype analysis for GDF-15 gene polymorphisms between SLE patients and healthy controls.
GDF-15 Treatment Did Not Relieve Lupus Mice Hepatomegaly and Splenomegaly
As shown in Figure 3, reduced weight of both kidneys was observed after pristane induction in WT mice, and the weight of spleen was increased in WT mice treated with pristane (all P < 0.01). GDF-15 treatment did not significantly reduce the weight of the liver, spleen, and kidneys in lupus mice (Figures 3A–C).
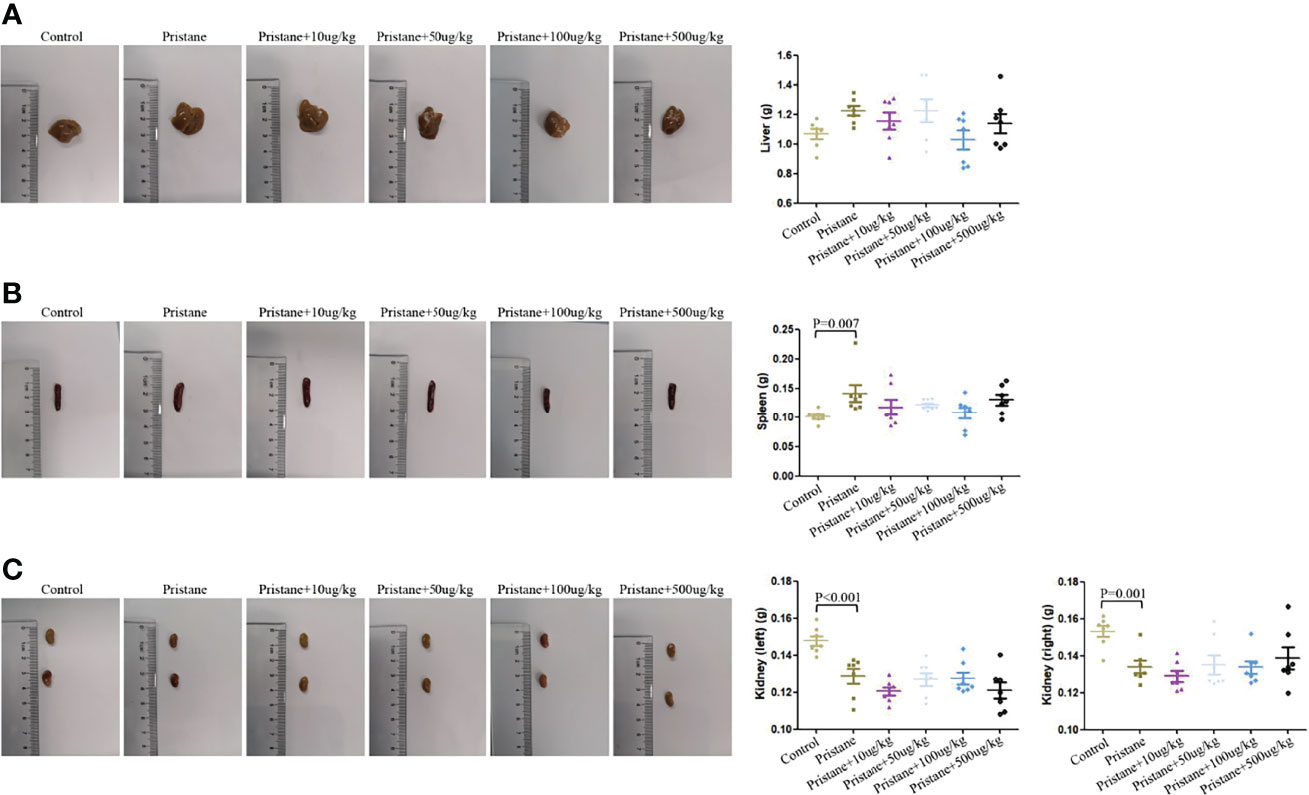
Figure 3 Hepatomegaly and splenomegaly were not relieved by GDF-15 treatment. (A–C) Weight of the individual liver, spleen, and kidneys (left and right) and representative photographs in six groups, including WT mice (injection with phosphate-buffered saline (PBS) in all experimental period), pristane-induced lupus mice with PBS injection, and pristane-induced lupus mice injected with 10, or 50, or 100, or 500 μg/kg GDF-15. Seven samples per group were analyzed by Student’s t-test. Comparison is conducted among pristane-induced lupus mice with PBS injection and other five groups. P-value < 0.01 was significant under Bonferroni correction.
Alleviated Renal Damage After GDF-15 Treatment in Lupus Mice
In pristane-induced lupus mice, glomerular atrophy and necrosis, mesangial proliferation, basement membrane thickening, capillary shrinkage, endothelial cell nuclear enlargement, renal tubular degeneration, lymphocyte infiltration, and fibrous tissue hyperplasia were observed. Similarly, the lupus mice had severe IgG deposition compared with wild-type (WT) mice. However, renal damage and IgG deposition were alleviated when lupus mice were treated with GDF-15. Scores of HE, Masson, and fluorescence intensity indicated that lupus mice injected with 100 μg/kg GDF-15 showed the highest therapeutic efficacy (Figures 4A–M).
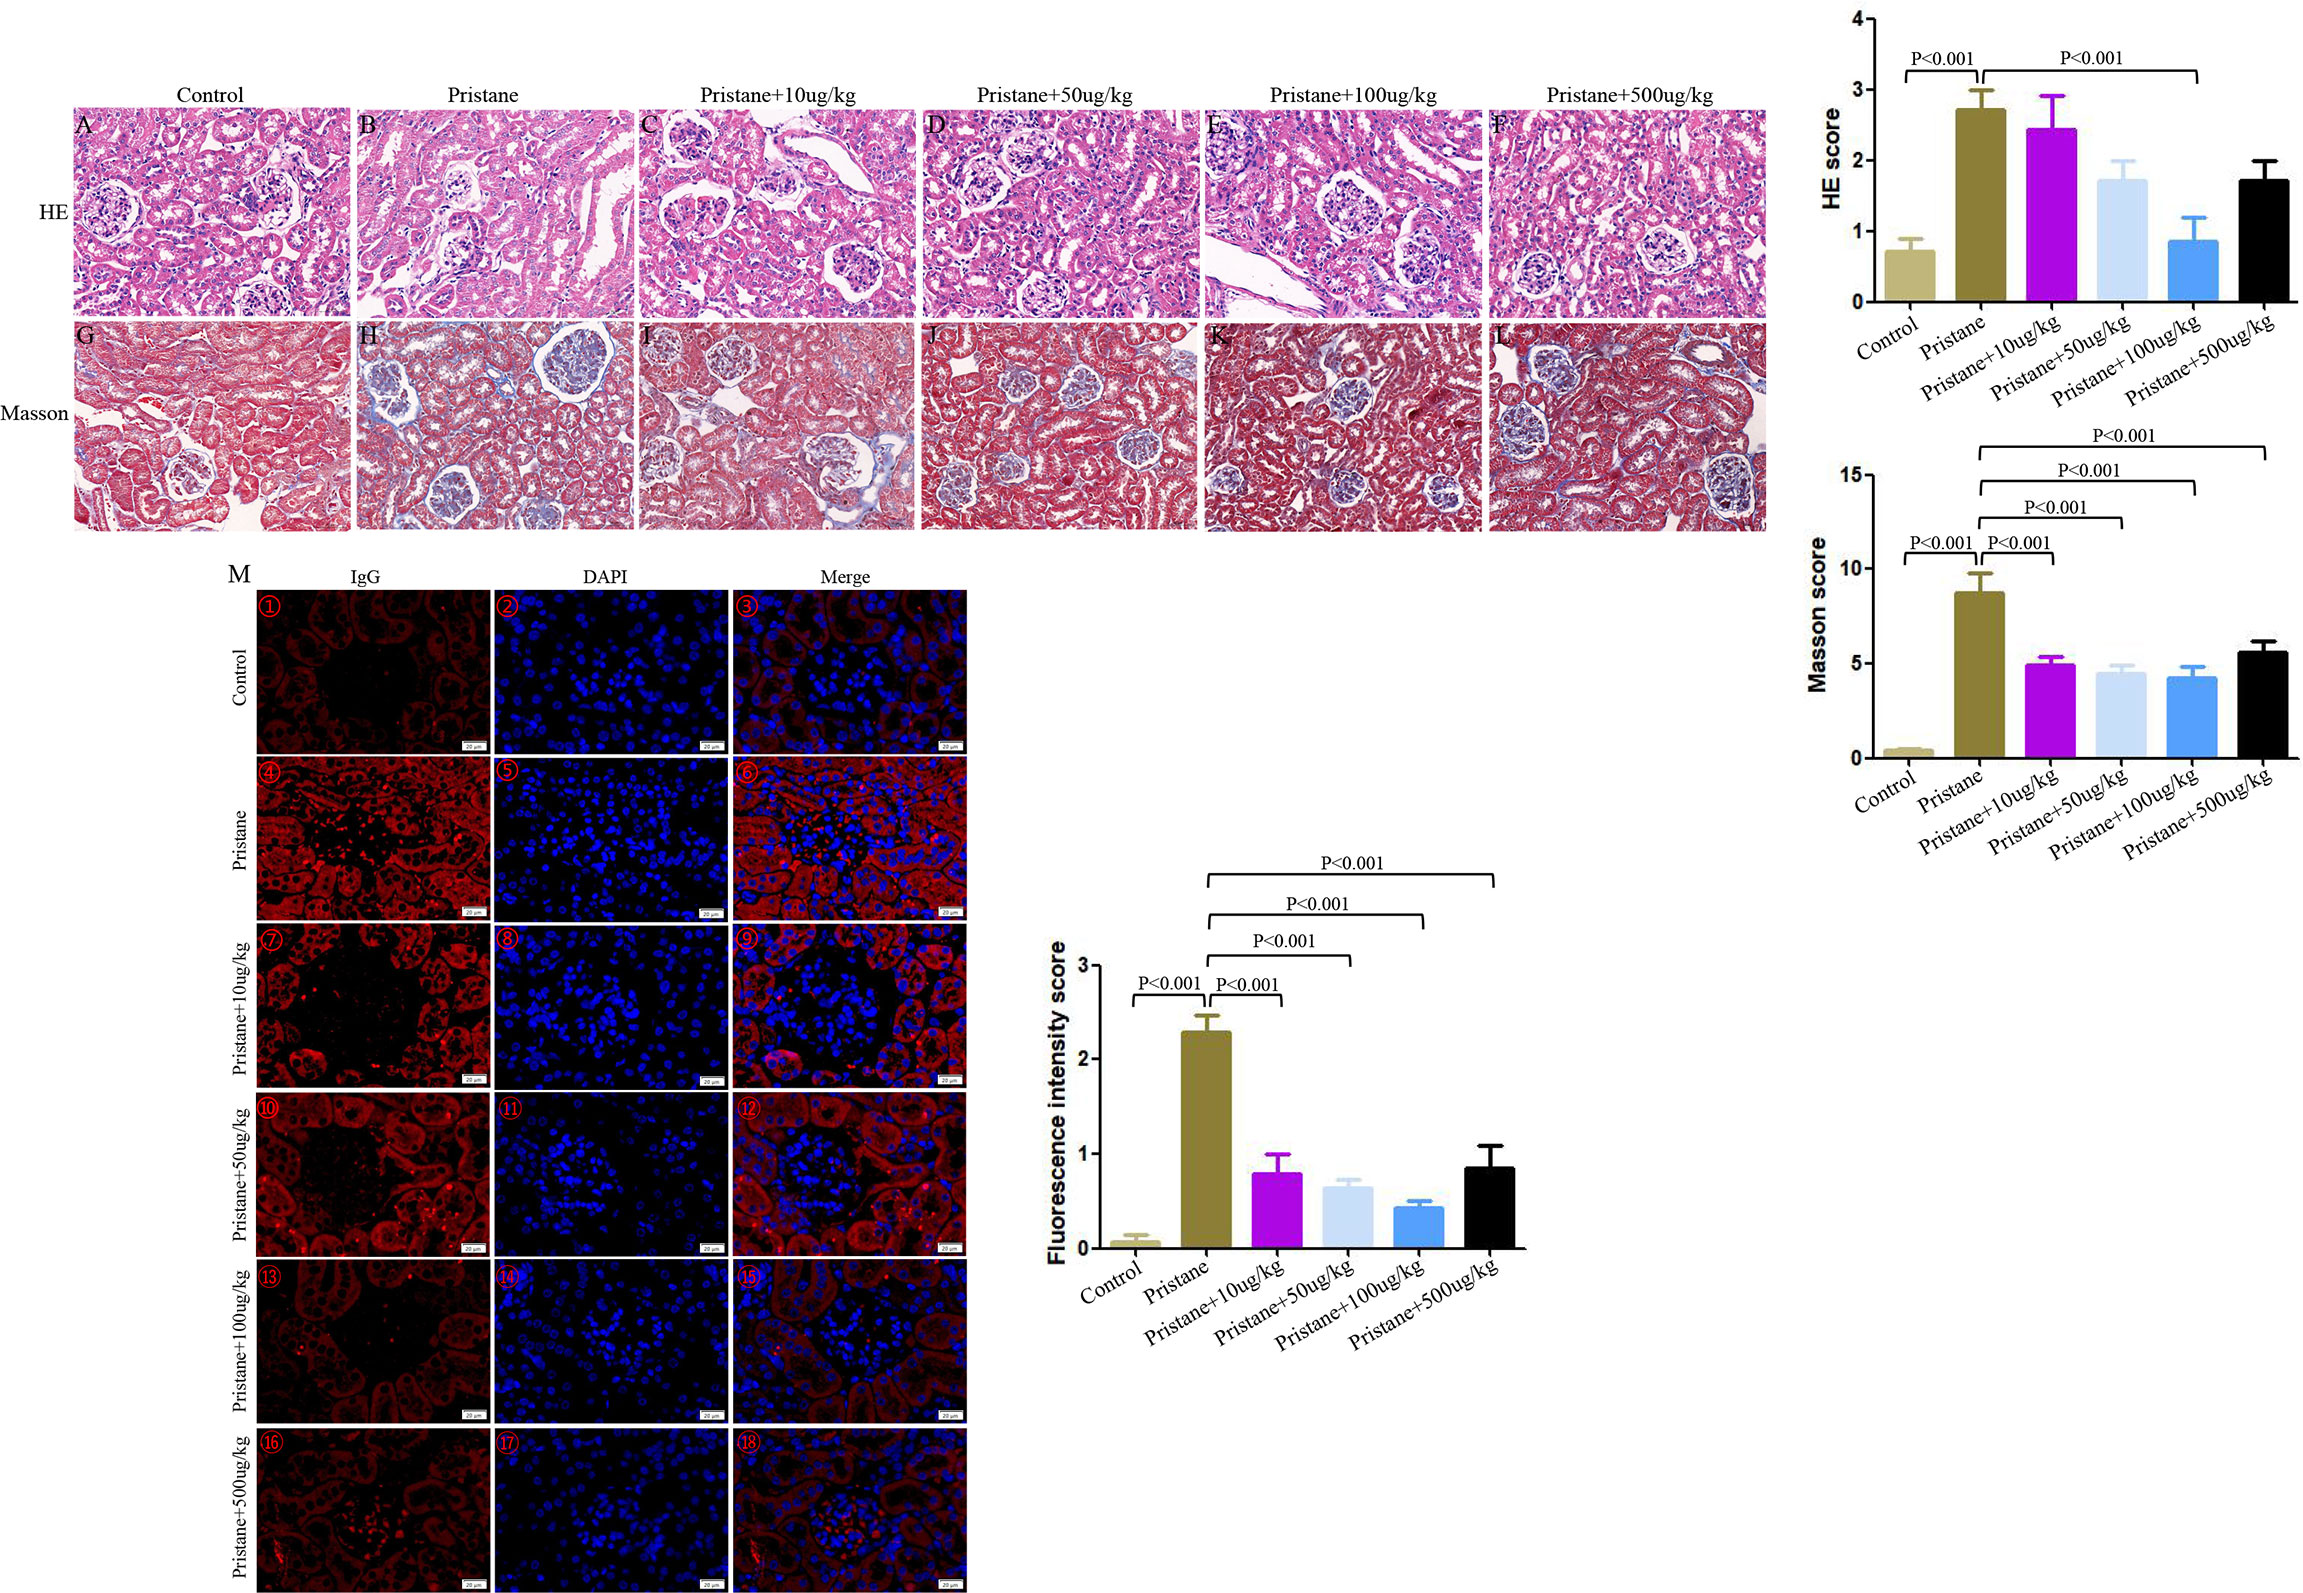
Figure 4 GDF-15 treatment alleviated renal damage of lupus mice. Photomicrographic representation of renal damage. (A–F) Hematoxylin and eosin (HE), (G–L) Masson, and (M) Immunofluorescence assay in six groups, including wild-type mice (injection with PBS in all experimental period), pristane-induced lupus mice with PBS injection, and pristane-induced lupus mice injected with 10, or 50, or 100, or 500 μg/kg GDF-15. Magnification ×400 for HE, Masson assay, immunofluorescence assay. HE and Masson scores are means ± standard deviation (SD). The fluorescence intensity scores for kidneys with symbols in right panels (M①-⑱) are means ± SD. Comparison is conducted among pristane-induced lupus mice with PBS injection and other five groups. P-value < 0.01 was significant under Bonferroni correction.
GDF-15 Treatment Reversed Immune Cells Dysregulation
Higher frequencies of CD11b+, CD19+, CD11C+, TH2, TH1, and TH17 cells and lower frequencies of Treg cells were observed in pristane-induced lupus mice than those in WT mice (Figures 5A–E). After GDF-15 treatment (100 µg/kg), CD8+, CD11b+, CD19+, CD11C+, and TH2 cells were significantly decreased compared to those in pristane-induced lupus mice, and this was the most efficient compared to what other does (Figures 5A–D).
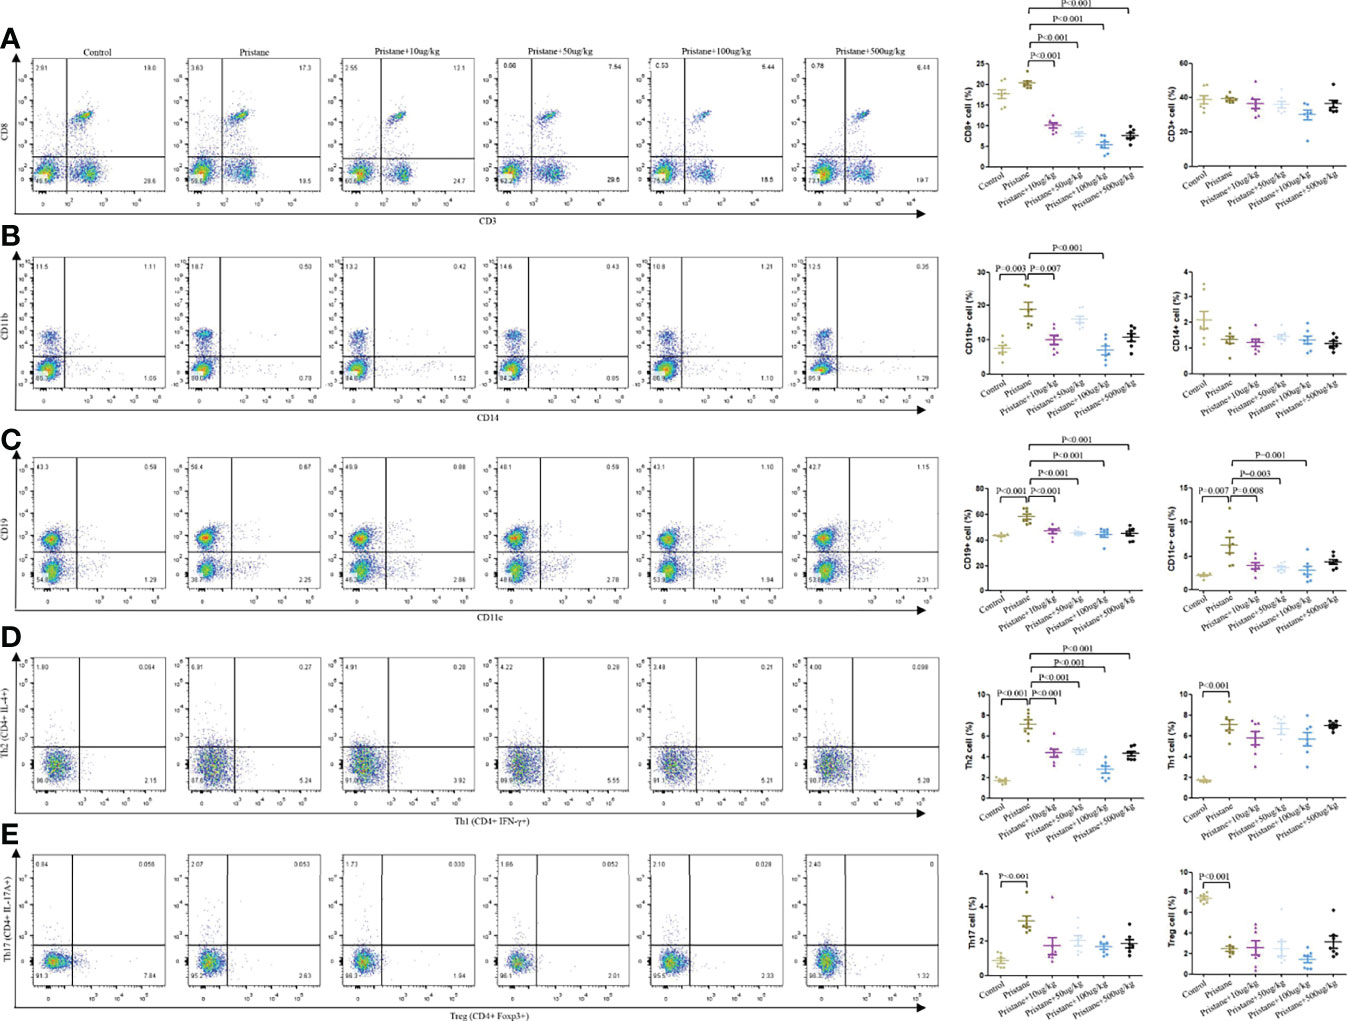
Figure 5 GDF-15 treatment reversed immune cells dysregulation. Flow cytometry analysis for different immune cells in six groups, including wild-type mice (injection with PBS in all experimental period), pristane-induced lupus mice with PBS injection, and pristane-induced lupus mice injected with 10, or 50, or 100, or 500 μg/kg GDF-15. Percentages of CD8+, CD3+, CD11b+, CD14+, CD19+, CD11c+, CD4+IFNγ+, CD4+IL-4+, CD4+IL-17A+, and CD4+Foxp3+ cells in six groups of mice (left panel). (A–E) right panel: Symbols represent individual mice. Seven samples per group were analyzed by Student’s t-test. Comparison is conducted among pristane-induced lupus mice with PBS injection and other five groups. P-value < 0.01 was significant under Bonferroni correction.
Reduced Inflammatory Cytokines and Autoantibodies Production in GDF-15–Treated Lupus Mice
As shown in Figure 6, pristane-induced lupus mice showed significantly higher serum levels of IL-1β, IL-2, IL-4, IL-13, IL-21, and IL-22 compared to those in WT mice (Figures 6A–F). GDF-15 treatment significantly reduced levels of IL-1β, IL-2, IL-4, IL-21, and IL-22 (Figures 6A–E), by which treatment of lupus mice with 100 µg/kg GDF-15 had the most efficiency. Some cytokines (IL-5, IL-6, IL-12p70, IL-17A, IL-28A, IL-17F, IFNγ, MIP-3α, TGF-β1, and TNF-α) were not detectable in some groups of mice (data not shown).
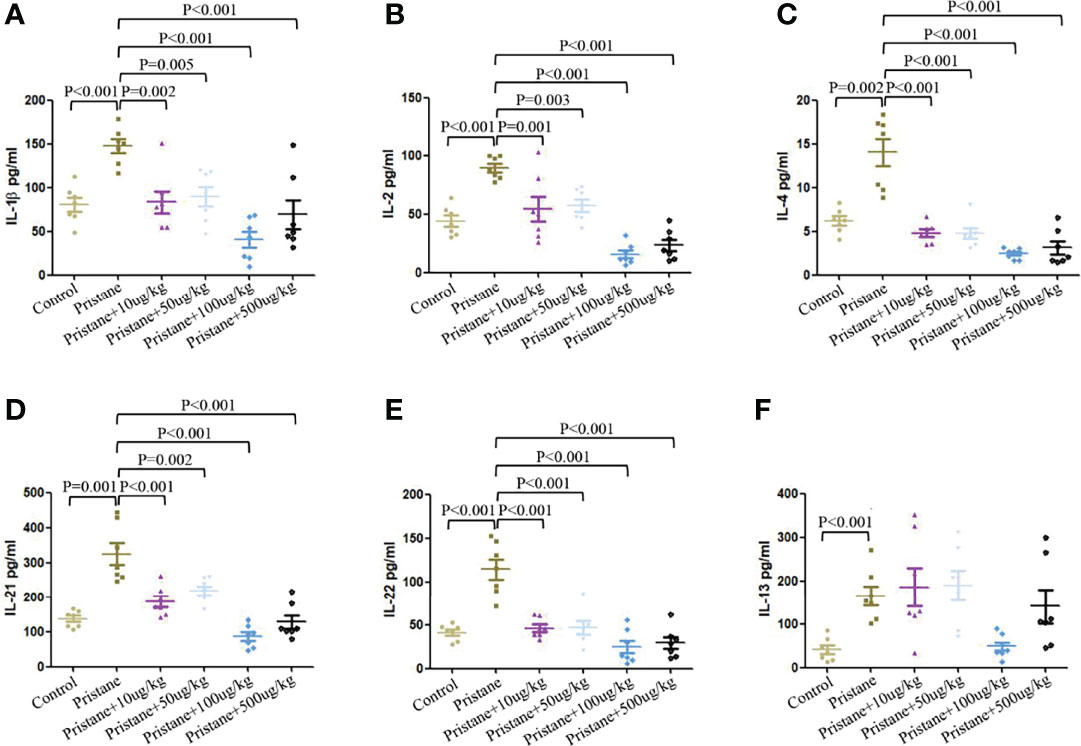
Figure 6 GDF-15 treatment reduced serum inflammatory cytokines secretion. (A–F) Serum levels of inflammatory cytokines from six groups were evaluated by microarray, including wild-type mice (injection with PBS in all experimental period), pristane-induced lupus mice with PBS injection, and pristane-induced lupus mice injected with 10, or 50, or 100, or 500 μg/kg GDF-15. Cytokines included IL-1β, IL-2, IL-4, IL-13, IL-21, and IL-22. Symbols represent individual mice. Bars show the means ± SD. A total of seven samples per group were analyzed by Student’s t-test. Comparison is conducted among pristane-induced lupus mice with PBS injection and other five groups. P-value < 0.01 was significant under Bonferroni correction.
Compared with WT mice, pristane-induced lupus mice showed significantly higher levels of ANA and total IgG (Figures 7A, B). Addition of GDF-15 treatment significantly reduced ANA and total IgG levels in lupus mice, by which 100 μg/kg GDF-15 injection had the best efficacy (Figures 7A, B). GDF-15 treatment did not significantly affect anti-dsDNA levels (Figure 7C).
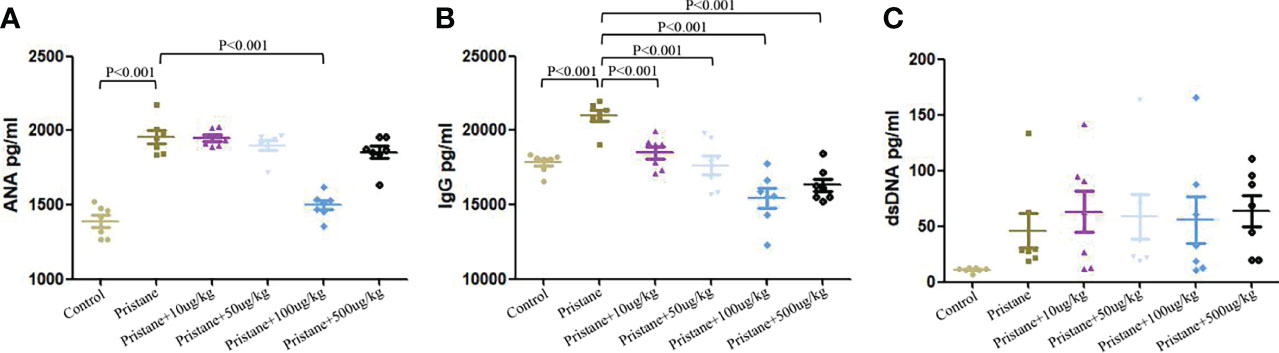
Figure 7 GDF-15 treatment reduced autoantibodies production. (A-C) Serum levels of anti-nuclear antibody (ANA), total IgG, and anti-dsDNA were examined in six groups, including wild-type mice (injection with PBS in all experimental period), pristane-induced lupus mice with PBS injection, and pristane-induced lupus mice injected with 10, or 50, or 100, or 500 μg/kg GDF-15. Symbols represent individual mice. Bars show the means ± SD. A total of seven samples per group were analyzed by Student’s t-test. Comparison is conducted among pristane-induced lupus mice with PBS injection and other five groups. P-value < 0.01 was significant under Bonferroni correction.
Discussion
In this study, two population-based case-control studies were conducted, which not only discussed the association of GDF-15 in SLE pathogenesis, the potential to be a marker for SLE, but also evaluated the GDF-15 genetic risk to SLE. Lupus mouse model further demonstrated the role of GDF-15 in lupus development.
Two studies (Greek and Chinese) with small sample sizes evaluated GDF-15 levels, which both showed higher expression of GDF-15 in SLE patients as compared to that in controls (12, 13). Our study confirmed again that serum levels of GDF-15 were much higher in SLE patients and positively correlated with hematuria, SLEDAI, and ESR, whereas negatively correlated with C3, C4. Chen et al. showed that SLE patients with active disease activity (SLEDAI > 4) had comparable GDF-15 expression with less active SLE patients and 24-h urine protein associated with GDF-15 expression (13). In our study, patients with high disease activity (SLEDAI ≥ 10) had increased levels GDF-15. These differences may relate to several reasons. The first is the source of SLE patients. Patients in our study were treatment naive, whereas patients had treatment in the other study. The second is that the criteria for active disease and less active disease are different. In our study, SLEDAI was evaluated according to the international standard. The third is that sample sizes are different. Moreover, patients with long disease duration may have chronic renal injury, such as the SLE patients recruited in the work of Chen et al. Thus, 24-h urine protein, as an indicator of chronic renal injury associated with GDF-15 expression, was reported in the work of Chen et al., but we showed that expression of GDF-15 was related to some indexes related acute renal injury, such as hematuria. Our study also found the relationship of ESR, C3, C4, and GDF-15 expression in SLE patients. All these indicated that GDF-15 may correlate with SLE pathogenesis. However, mechanisms that GDF-15 regulates the indexes to involve in lupus pathogenesis need further elucidation. Being a chronic disease, SLE is sometimes flared. Searching for potential markers to early detect SLE, or distinguish SLE from other non-SLE diseases may help to better, treats earlier SLE patients. In our study, we detected the ability of serum GDF-15 to distinguish SLE from healthy controls. Results showed good ability. Therefore, serum GDF-15 may be a biomarker to discriminate SLE patients from healthy individuals.
Genetic mutation may also be the marker for human beings. To discuss association of GDF-15 gene polymorphisms and SLE risk, a case-control study was firstly conducted in Chinese Han population. We found genotypes of rs1055150 (CC, CG), rs1059519 (GG, GC), rs1059369 (TT+AT), and rs4808793 (CC, CG) associated with SLE susceptibility and rs1059369, rs1059519, rs1227731, rs4808793, and rs16982345 associated with some clinical and laboratory characteristics of SLE patients. Patients with genotype CC or GC of rs1055150 had higher risk of SLE as compared to patients with GG genotype. Rs1055150 was located at 3’UTR. G to C mutation suggested higher risk of SLE, which may lead to increased GDF-15 mRNA expression, and increased serum levels of GDF-15 in SLE patients. Rs1059519 was located at exon, which has been reported to associate with GDF-15 expression and relate to chronic hepatitis C infection, left ventricular hypertrophy (20–22). In our study, rs1059519 polymorphism was related to SLE risk and SLE complicated with discoid and pleurisy, suggesting that rs1059519 may regulate vascular injury and inflammation. Rs1059369 was located at exon (a missense variant). A genome-wide association study showed association of rs1059369 with GDF-15 expression, multiple myeloma, hypertension, hepatitis C virus infection (20, 22). The present study found that SLE patients had higher frequencies of rs1059369 TT + AT genotypes and allele T than healthy controls, which were related to more serious disease activity, evidenced by lower IgA and IgG expression and higher expression of anti-SSA and anti-SSB in SLE patients. Rs4808793 and rs1227731 were located at intronic region, which may result in intron variants by changing transcript consequences. Then, the mutations may lead to disease pathogenesis. SLE patients with discoid or pleuritic had a higher frequency of CG genotype of rs4808793, and patients with anti-SSB (+) had a higher frequency of allele C of rs4808793 than those without these complications. For rs1227731, a lower frequency of GG genotype in SLE patients with fever and a higher frequency of allele G in SLE patients with anti-SSA (+) or anti-SSB (+) were observed. SLE patients with AA genotype of rs1227731 had higher expression of C4 than patients with AA or AT genotype. The findings indicated that GDF-15 genetic mutation correlated with SLE risk in Chinese Han population. However, how the mutations contribute to lupus pathogenesis needs to be discussed in the future, and discussing the potential of GDF-15 gene polymorphisms as genetic marker for SLE is necessary to be confirmed with multi-center, larger sample sizes.
Because GDF-15 correlated with SLE as discussed above, role of GDF-15 involved in lupus development was further demonstrated in vivo. Lupus mice treated with GDF-15 had alleviated renal damage. In pristane-induced lupus mice, there were higher frequencies of CD11b+, CD19+, CD11c+, TH1, TH2, and TH17 cells and lower frequencies of Treg cells. A previous study showed that GDF-15 expression was increased in CD11b+ cells upon lipopolysaccharide (LPS)-induced inflammatory conditions (23). In the present study, GDF-15 treatment reversed the increased percentage of CD11b+ cells in lupus mice, suggesting that there may be a negative feedback mechanism that high expression of GDF-15 could restrain CD11b+ cells proliferation. Percentage of CD11c+ cells in white adipose tissue of obese mice was reduced after GDF-15 treatment (24). In patients with prediabetes, the number of senescent CD8+ T cells was positively related to serum levels of GDF-15, implying that increased GDF-15 may accelerate CD8+ T cells aging and further reduce number of CD8+ T cells (25). Consistently, our study showed that the proportion of CD11c+ and CD8+ cells was decreased when GDF-15 was injected into lupus mice. Moreover, percentages of CD19+, CD3+, and TH2 cells were reduced in lupus mice by GDF-15 treatment. Thus, GDF-15 is required for maintaining homeostasis, which relieves lupus progression by regulating innate and adaptive immune responses.
To date, the role of GDF-15 in regulating pro- or anti-inflammatory cytokines production is controversial. In GDF-15 gene–deficient mice, serum levels of IL-1β were reduced, which inhibited inflammation accumulation and development of atherogenesis (26). WT mice treated with LPS and GDF-15 had reduced expression of IL-1β, TNF-α, and IL-6 (27). Our findings showed that IL-1β expression was higher in pristane-induced lupus mice, and expression of IL-1β was significantly inhibited by GDF-15 treatment. IL-4 and IL-13, both induced by type 2 immune responses, were overexpressed in lupus mice. Recombinant IL-4 and IL-13 stimulation increased expression of GDF-15 in primary hepatocytes (28). In this study, GDF-15 treatment reduced percentage of TH2 cell and serological levels of IL-14. Thus, GDF-15 inhibited type 2 immune responses. Moreover, increased expression of IL-2, IL-21, and IL-22 in lupus mice was downregulated by GDF-15 treatment. Autoantibodies play momentous roles in SLE progression. In this study, we did not find significant relation of serum GDF-15 with ANA, ds-DNA, and total IgG in population-based study. However, GDF-15 treatment significantly reduced levels of ANA and total IgG in lupus mice. This confirmed the role of GDF-15 in inhibiting immune complex deposition in the kidney. The findings suggested that high expression of GDF-15 can inhibit production of autoantibodies and inflammatory cytokines. However, some studies reported that GDF-15 may activate inflammatory pathways, such as phosphorylation of extracellular signal–regulated kinase and RAC-alpha serine–threonine protein kinase (AKT) (22, 29).
In this study, we found that serum levels of GDF-15 were positively associated with SLEDAI. The pristane-induced lupus mice treated with GDF-15 had alleviated disease activity. Clarifying the divergence between disease suppressing effects of GDF-15 in the mouse model and its positive correlation with SLEDAI in SLE patients is useful to understand role of GDF-15 in lupus. However, the mechanism is not clear to date. Previous studies found that anti-inflammatory cytokine IL-37 levels were increased in RA, OA, AS, and SLE patients and were positively associated with RA (30), OA (31), AS (32), and SLE (33) disease activity. The increased IL-37 could reduce disease activity of the above diseases by inhibiting production of inflammatory cytokines (30–33), limiting TH17 cell proliferation (32), and enhancing the stability and effectiveness of mesenchymal stem cells (34), which were similar to our previous studies (35, 36). All the published studies showed that there may be a negative feedback mechanism between IL-37 and the above diseases, which has not been clearly elucidated (32, 33). In our present study, based on mice models, we found that GDF-15 alleviated lupus by reducing renal damage (Figure 4), reversing CD8+, CD19+, and TH2 cells dysregulation (Figure 5), inhibiting production of IL-1β, IL-2, IL-4, IL-21, IL-22 (Figure 6), ANA, and total IgG (Figure 7). The anti-inflammatory role of GDF-15 was also discussed in the GDF-15 gene knockout mouse model (37). Therefore, it is possible that pro-inflammatory components in SLE patients may promote GDF-15 expression, and GDF-15 may mediate a negative feedback mechanism to suppress excessive pro-inflammatory response in SLE patients like the cytokine IL-37 in inflammatory rheumatic diseases. However, the hypothesis needs to be clarified in the future. For instance, which signaling or what mechanism is involved in GDF-15 negatively regulates lupus development. Moreover, in the present study, serum levels of GDF-15 levels were positively related to SLEDAI. Serum levels of GDF-15 positively related to SLEDAI are only a statistical result in the present study. Whether GDF-15 is really related to SLEDAI needs to be confirmed in the future with larger sample sizes in multiple centers. Furthermore, functional study will help to evaluate whether GDF-15 may affect SLEDAI in the future.
There are some limitations in this study. First, serum levels of GDF-15 were analyzed in 54 SLE patients and GDF-15 gene polymorphisms were genotyped in another independent 289 SLE patients, and association of polymorphisms with serum levels of GDF-15 cannot be evaluated. Therefore, we cannot conclude whether GDF-15 gene polymorphisms affect GDF-15 expression, which may participate in lupus progression. Second, because limited number of SLE patients had cardiovascular diseases, or metabolic syndrome, or antiphospholipid syndrome, therefore, we cannot discuss whether there is difference of serum levels of GDF-15 between SLE patients with cardiovascular diseases and patients without cardiovascular diseases, patients with metabolic syndrome and patients without metabolic syndrome, and patients with antiphospholipid syndrome and patients without antiphospholipid syndrome, respectively. Because we have found a significant association of serum GDF-15 levels with some clinical and laboratory characteristics in SLE patients, functional studies are needed to discuss how GDF-15 affects the features.
In conclusion, our study showed that high level of GDF-15 was related to SLE pathogenesis, and serum GDF-15 may be a biomarker for SLE diagnosis. GDF-15 gene polymorphisms were associated with SLE risk in Chinese Han population. GDF-15 treatment relieved lupus development.
Data Availability Statement
The raw data supporting the conclusions of this article will be made available by the authors, without undue reservation.
Ethics Statement
The studies involving human participants were reviewed and approved by Ethic Research Committee of Affiliated Hospital of Southwest Medical University. The patients/participants provided their written informed consent to participate in this study. The animal study was reviewed and approved by Animal Ethics Committee of Southwest Medical University. Written informed consent was obtained from the individual(s) for the publication of any potentially identifiable images or data included in this article.
Author Contributions
Study conception and design: W-DX, QH, and A-FH. Acquisition of data, analysis and interpretation of data: CY and RL. Drafting the article: W-DX, QH, and A-FH. Final approval of the version of the article to be published: all authors, and that all authors agree to be accountable for all aspects of the work.
Funding
This work was supported by grants from the Sichuan Provincial Natural Science Foundation. (2022NSFSC0697, 2022NSFSC0694).
Conflict of Interest
The authors declare that the research was conducted in the absence of any commercial or financial relationships that could be construed as a potential conflict of interest.
Publisher’s Note
All claims expressed in this article are solely those of the authors and do not necessarily represent those of their affiliated organizations, or those of the publisher, the editors and the reviewers. Any product that may be evaluated in this article, or claim that may be made by its manufacturer, is not guaranteed or endorsed by the publisher.
Supplementary Material
The Supplementary Material for this article can be found online at: https://www.frontiersin.org/articles/10.3389/fimmu.2022.926373/full#supplementary-material
Supplementary Table 1 | Information of primer for GDF-15 gene polymorphisms.
Supplementary Table 2 | Pathological grading criteria for renal injury.
Supplementary Table 3 | The Hardy-Weinberg’s expectation test in patients and controls of GDF-15 gene polymorphisms.
Supplementary Table 4 | Association of GDF-15 gene polymorphisms in SLE patients with clinical, laboratory features (qualitative variables).
Abbreviations
SLE, systemic lupus erythematosus; STAT4, signal transducer and activator of transcription 4; DAP1, death-associated protein 1; MAB2, mannose binding lectin 2; PGE2, Prostaglandins E2; PINX1, PIN2/TERF1-interacting telomerase inhibitor 1; LN, lupus nephritis; WT, wild-type; GDF-15, growth differentiation factor 15; TGF-β;, transforming growth factor-β ESR, erythrocyte sedimentation rate; ROC, receiver operating characteristic; RA, rheumatoid arthritis; OA, osteoarthritis; IFNγ, interferon-gamma.
References
1. Barber MRW, Drenkard C, Falasinnu T, Hoi A, Mak A, Kow NY, et al. Global Epidemiology of Systemic Lupus Erythematosus. Nat Rev Rheumatol (2021) 17(9):515–32. doi: 10.1038/s41584-021-00668-1
2. Tanaka Y. State-Of-the-Art Treatment of Systemic Lupus Erythematosus. Int J Rheum Dis (2020) . 23(4):465–71. doi: 10.1111/1756-185X.13817
3. Reid S, Hagberg N, Sandling JK, Alexsson A, Pucholt P, Sjöwall C, et al. Interaction Between the STAT4 Rs11889341(T) Risk Allele and Smoking Confers Increased Risk of Myocardial Infarction and Nephritis in Patients With Systemic Lupus Erythematosus. Ann Rheum Dis (2021) . 80(9):1183–9. doi: 10.1136/annrheumdis-2020-219727
4. Coke LN, Wen H, Comeau M, Ghanem MH, Shih A, Metz CN, et al. Arg206Cys Substitution in DNASE1L3 Causes a Defect in DNASE1L3 Protein Secretion That Confers Risk of Systemic Lupus Erythematosus. Ann Rheum Dis (2021) 80(6):782–7. doi: 10.1136/annrheumdis-2020-218810
5. Raj P, Song R, Zhu H, Riediger L, Jun DJ, Liang C, et al. Deep Sequencing Reveals a DAP1 Regulatory Haplotype That Potentiates Autoimmunity in Systemic Lupus Erythematosus. Genome Biol (2020) . 21(1):281. doi: 10.1186/s13059-020-02184-z
6. Yuan ZC, Xu WD, Lan YY, Wang JM, Wu Q, Zhou J, et al. Association of MBL2 Gene Polymorphisms and Systemic Lupus Erythematosus Susceptibility: A Meta-Analysis. Int J Rheum Dis (2021) . 24(2):147–58. doi: 10.1111/1756-185X.14017
7. Sandoughi M, Saravani M, Rokni M, Nora M, Mehrabani M, Dehghan A. Association Between COX-2 and 15-PGDH Polymorphisms and SLE Susceptibility. Int J Rheum Dis (2020) . 23(5):627–32. doi: 10.1111/1756-185X.13808
8. Qi YY, Liu XR, He YX, Zhou M, Ning XH, Zhai YL, et al. Association of the PINX1 Variant Rs6984094, Which Lengthens Telomeres, With Systemic Lupus Erythematosus Susceptibility in Chinese Populations. J Immunol Res (2021) 2021:7079359. doi: 10.1155/2021/7079359
9. Lockhart SM, Saudek V, O'Rahilly S. GDF15: A Hormone Conveying Somatic Distress to the Brain. Endocr Rev (2020) 41(4):bnaa007. doi: 10.1210/endrev/bnaa007
10. Tsai VW, Zhang HP, Manandhar R, Lee-Ng KKM, Lebhar H, CP M, et al. Treatment With the TGF-B Superfamily Cytokine MIC-1/GDF15 Reduces the Adiposity and Corrects the Metabolic Dysfunction of Mice With Diet-Induced Obesity. Int J Obes (Lond) (2018) 42(3):561–71. doi: 10.1038/ijo.2017.258
11. Tsai VWW, Husaini Y, Sainsbury A, Brown DA, Breit SN. The MIC-1/GDF15-GFRAL Pathway in Energy Homeostasis: Implications for Obesity, Cachexia, and Other Associated Diseases. Cell Metab (2018) 28(3):353–68. doi: 10.1016/j.cmet.2018.07.018
12. Tektonidou MG, Papassotiriou I, Sfikakis PP. Growth Differentiation Factor 15 (GDF-15) as Potential Cardiovascular Risk Biomarker in Antiphospholipid Syndrome. Rheumatol (Oxford) (2021) 61(1):394–9. doi: 10.1093/rheumatology/keab277
13. Yan C, Yu L, Zhang XL, Shang JJ, Ren J, Fan J, et al. Cytokine Profiling in Chinese SLE Patients: Correlations With Renal Dysfunction. J Immunol Res (2020) 2020:8146502. doi: 10.1155/2020/8146502
14. Gladman DD, Ibañez D, Urowitz MB. Systemic Lupus Erythematosus Disease Activity Index 2000. J Rheumatol (2002) 29(2):288–91.
15. Hochberg MC. Updating the American College of Rheumatology Revised Criteria for the Classification of Systemic Lupus Erythematosus. Arthritis Rheum (1997) 40(9):1725. doi: 10.1002/art.1780400928
16. Wang M, Zhu Z, Lin X, Li H, Wen C, Bao J, et al. Gut Microbiota Mediated the Therapeutic Efficacies and the Side Effects of Prednisone in the Treatment of MRL/lpr Mice. Arthritis Res Ther (2021) 23(1):240. doi: 10.1186/s13075-021-02620-w
17. Xu WD, Su LC, Liu XY, Wang JM, Yuan ZC, Qin Z, et al. IL-38: A Novel Cytokine in Systemic Lupus Erythematosus Pathogenesis. J Cell Mol Med (2020) 24(21):12379–89. doi: 10.1111/jcmm.15737
18. Huang C, Meng M, Li S, Liu S, Li L, Su Y, et al. Umbilical Cord Mesenchymal Stem Cells Ameliorate Kidney Injury in MRL/Ipr Mice Through the TGF-β1 Pathway. Front Cell Dev Biol (2022) 10:876054. doi: 10.3389/fcell.2022.876054
19. Zhang Q, Ji Q, Wang X, Kang L, Fu Y, Yin Y, et al. SOX9 is a Regulator of ADAMTSs-Induced Cartilage Degeneration at the Early Stage of Human Osteoarthritis. Osteoarthritis Cartilage (2015) 23(12):2259–68. doi: 10.1016/j.joca.2015.06.014
20. Li R, Hu Z, Chen H, Lu Y, Qin S, Huang C, et al. Association of Growth Differentiation Factor-15 Polymorphisms and Growth Differentiation Factor-15 Serum Levels With Susceptibility to Multiple Myeloma in a Chinese Population. Clin Lab (2021) 67(1). doi: 10.7754/Clin.Lab.2020.200341
21. Yang XJ, Wang XO, Chen Y, Ye SD. Associations of Content and Gene Polymorphism of Macrophage Inhibitory Factor-1 and Chronic Hepatitis C Virus Infection. World J Gastroenterol (2020) 26(41):6378–90. doi: 10.3748/wjg.v26.i41.6378
22. Wang X, Yang X, Sun K, Chen J, Song X, Wang H, et al. The Haplotype of the Growth-Differentiation Factor 15 Gene Is Associated With Left Ventricular Hypertrophy in Human Essential Hypertension. Clin Sci (Lond) (2009) 118(2):137–45. doi: 10.1042/CS20080637
23. Luan HH, Wang A, Hilliard BK, Carvalho F, Rosen CE, Ahasic AM, et al. GDF15 Is an Inflammation-Induced Central Mediator of Tissue Tolerance. Cell (2019) 178(5):1231–1244.e11. doi: 10.1016/j.cell.2019.07.033
24. Jung SB, Choi MJ, Ryu D, Yi HS, Lee SE, Chang JY, et al. Reduced Oxidative Capacity in Macrophages Results in Systemic Insulin Resistance. Nat Commun (2018) 9(1):1551. doi: 10.1038/s41467-018-03998-z
25. Yi HS, Kim SY, Kim JT, Lee YS, Moon JS, Kim M, et al. T-Cell Senescence Contributes to Abnormal Glucose Homeostasis in Humans and Mice. Cell Death Dis (2019) 10(3):249. doi: 10.1038/s41419-019-1494-4
26. Bonaterra GA, Zügel S, Thogersen J, Walter SA, Haberkorn U, Strelau J, et al. Growth Differentiation Factor-15 Deficiency Inhibits Atherosclerosis Progression by Regulating Interleukin-6-Dependent Inflammatory Response to Vascular Injury. J Am Heart Assoc (2012) 1(6):e002550. doi: 10.1161/JAHA.112.002550
27. Campderrós L, Moure R, Cairó M, Gavaldà-Navarro A, Quesada-López T, Cereijo R, et al. Brown Adipocytes Secrete GDF15 in Response to Thermogenic Activation. Obes (Silver Spring) (2019) 27(10):1606–16. doi: 10.1002/oby.22584
28. Lee SE, Kang SG, Choi MJ, Jung SB, Ryu MJ, Chung HK, et al. Growth Differentiation Factor 15 Mediates Systemic Glucose Regulatory Action of T-Helper Type 2 Cytokines. Diabetes (2017) 66(11):2774–88. doi: 10.2337/db17-0333
29. Yang L, Chang CC, Sun Z, Madsen D, Zhu H, Padkjær SB, et al. GFRAL is the Receptor for GDF15 and is Required for the Anti-Obesity Effects of the Ligand. Nat Med (2017) 23(10):1158–66. doi: 10.1038/nm.4394
30. Ye L, Jiang B, Deng J, Du J, Xiong W, Guan Y, et al. IL-37 Alleviates Rheumatoid Arthritis by Suppressing IL-17 and IL-17-Triggering Cytokine Production and Limiting Th17 Cell Proliferation. J Immunol (2015) 194(11):5110–9. doi: 10.4049/jimmunol.1401810
31. Ding L, Hong X, Sun B, Huang Q, Wang X, Liu X, et al. IL-37 Is Associated With Osteoarthritis Disease Activity and Suppresses Proinflammatory Cytokines Production in Synovial Cells. Sci Rep (2017) 7(1):11601. doi: 10.1038/s41598-017-11397-5
32. Chen B, Huang K, Ye L, Li Y, Zhang J, Zhang J, et al. Interleukin-37 Is Increased in Ankylosing Spondylitis Patients and Associated With Disease Activity. J Transl Med (2015) 13:36. doi: 10.1186/s12967-015-0394-3
33. Ye L, Ji L, Wen Z, Zhou Y, Hu D, Li Y, et al. IL-37 Inhibits the Production of Inflammatory Cytokines in Peripheral Blood Mononuclear Cells of Patients With Systemic Lupus Erythematosus: Its Correlation With Disease Activity. J Transl Med (2014) 12:69. doi: 10.1186/1479-5876-12-69
34. Xu J, Chen J, Li W, Lian W, Huang J, Lai B, et al. Additive Therapeutic Effects of Mesenchymal Stem Cells and IL-37 for Systemic Lupus Erythematosus. J Am Soc Nephrol (2020) 31(1):54–65. doi: 10.1681/ASN.2019050545
35. Wu Q, Zhou J, Yuan ZC, Lan YY, Xu WD, Huang AF. Association Between IL-37 and Systemic Lupus Erythematosus Risk. Immunol Invest (2021) 51(4):727–38. doi: 10.1080/08820139.2020.1869254
36. Yuan ZC, Wang JM, Huang AF, Su LC, Li SJ, Xu WD. Elevated Expression of Interleukin-37 in Patients With Rheumatoid Arthritis. Int J Rheum Dis (2019) 22(6):1123–9. doi: 10.1111/1756-185X.13539
Keywords: growth differentiation factor 15, lupus, polymorphism, inflammation, autoimmunity
Citation: Xu W-D, Huang Q, Yang C, Li R and Huang A-F (2022) GDF-15: A Potential Biomarker and Therapeutic Target in Systemic Lupus Erythematosus. Front. Immunol. 13:926373. doi: 10.3389/fimmu.2022.926373
Received: 22 April 2022; Accepted: 21 June 2022;
Published: 14 July 2022.
Edited by:
Toshihiro Nanki, Toho University, JapanCopyright © 2022 Xu, Huang, Yang, Li and Huang. This is an open-access article distributed under the terms of the Creative Commons Attribution License (CC BY). The use, distribution or reproduction in other forums is permitted, provided the original author(s) and the copyright owner(s) are credited and that the original publication in this journal is cited, in accordance with accepted academic practice. No use, distribution or reproduction is permitted which does not comply with these terms.
*Correspondence: An-Fang Huang, loutch211@163.com
†These authors have contributed equally to this work and share first authorship