
94% of researchers rate our articles as excellent or good
Learn more about the work of our research integrity team to safeguard the quality of each article we publish.
Find out more
ORIGINAL RESEARCH article
Front. Immunol., 01 July 2022
Sec. Cancer Immunity and Immunotherapy
Volume 13 - 2022 | https://doi.org/10.3389/fimmu.2022.921761
This article is part of the Research TopicCombinational Immunotherapy of Cancer: Novel Targets, Mechanisms, and StrategiesView all 85 articles
 Yue Zhao1,2,3†
 Jun Shang4†
 Jian Gao1,2,5†
 Han Han1,2,3
 Zhendong Gao1,2,3Yueren Yan1,2,3Qiang Zheng3,6
 Ting Ye1,2,3
 Fangqiu Fu1,2,3
 Chaoqiang Deng1,2,3Zelin Ma1,2,3Yang Zhang1,2,3Difan Zheng1,2,3Shanbo Zheng1,2,3
 Yuan Li3,6
 Zhiwei Cao7*‡Leming Shi2,4*‡
 Haiquan Chen1,2,3*‡
Background: The overall 5-year survival of lung cancer was reported to be only ~15%, with lung adenocarcinoma (LUAD) as the main pathological subtype. Before developing into invasive stages, LUAD undergoes pre-invasive stages of adenocarcinoma in situ (AIS) and minimally invasive adenocarcinoma (MIA), where surgical resection gives an excellent 5-year survival rate. Given the dramatic decline of prognosis from pre-invasive to invasive stages, a deeper understanding of key molecular changes driving the progression of LUAD is highly needed.
Methods: In this study, we performed whole-exome sequencing and RNA sequencing on surgically resected 24 AIS, 74 MIA, 99 LUAD specimens, and their adjacent paired normal tissues. Survival data were obtained by follow-up after surgery. Key molecular events were found by comparing the gene expression profiles of tumors with different stages. Finally, to measure the level of imbalance between tumor intrinsic growth potential and immune microenvironment, a tumor progressive (TP) index was developed to predict tumor progression and patients’ survival outcome and validated by external datasets.
Results: As tumors progressed to more invasive stages, they acquired higher growth potential, mutational frequency of tumor suppressor genes, somatic copy number alterations, and tumor mutation burden, along with suppressed immune function. To better predict tumor progression and patients’ outcome, TP index were built to measure the imbalance between tumor intrinsic growth potential and immune microenvironment. Patients with a higher TP index had significantly worse recurrence-free survival [Hazard ratio (HR), 10.47; 95% CI, 3.21–34.14; p < 0.0001] and overall survival (OS) [Hazard ratio (HR), 4.83e8; 95% CI, 0–Inf; p = 0.0013]. We used The Cancer Genome Atlas (TCGA)-LUAD dataset for validation and found that patients with a higher TP index had significantly worse OS (HR, 1.10; 95% CI, 0.83–1.45; p = 0.048), demonstrating the prognostic value of the TP index for patients with LUAD.
Conclusions: The imbalance of tumor intrinsic growth potential and immune function orchestrate the progression of LUAD, which can be measured by TP index. Our study provided new insights into predicting survival of patients with LUAD and new target discovery for LUAD through assessing the imbalance between tumor intrinsic growth potential and immune function.
Lung cancer is one of the deadliest disease worldwide, with a 5-year survival of only ~19% (1). Lung adenocarcinoma (LUAD) is the most common pathological subtype. Pre-invasive stages of LUAD, namely, adenocarcinoma in situ (AIS) and minimally invasive adenocarcinoma (MIA), have a nearly 100% 5-year survival rate after complete surgery (2, 3). The prognosis of patients would downslide dramatically once the disease progressed to invasive stages. Therefore, it is necessary to study the evolution of LUAD for discovering new targets and developing new treatments. Although there have been studies on genomic and immune profiling of patients with AIS, MIA, and LUAD, there lack a systematic study focusing on key molecular events that drive the evolution of LUAD (4–8).
As tumors progress, their radiological manifestations change. With the development of thoracic computed tomography (CT) scanning and the application of low-dose CT screening, an increasing number of small pulmonary nodules, especially subsolid nodules have been detected (9–12). The prognostic impact of solid components for LUADs presented as ground-glass opacities (GGOs) on CT scanning has been under extensive investigation, where tumors manifesting as GGOs were found to have indolent clinical course (13, 14). Our two previous studies further provided evidence on the prognostic value of LUADs, manifesting as GGOs on CT scan (15, 16). However, there still lack comprehensive genomic and transcriptomic studies comparing the differences between LUADs having GGO components and their counterparts not having GGO components on CT scan.
In this study, we performed whole-exome sequencing and RNA sequencing (RNA-seq) on 197 surgically resected LUADs and divided them into different groups by pathological characteristics and radiological manifestations, aiming to find key genetic factors that drive the evolution of LUAD. Twelve expression patterns were identified based on expression profiles, and pathway analysis was performed to reveal the biological functions for each pattern. Tumor intrinsic growth potential and immune microenvironment were assessed, and immune cell infiltration was calculated. Finally, to better predict tumor progression and patients’ outcome, we developed a tumor progressive (TP) index to measure the level of imbalance between tumor intrinsic growth potential and immune microenvironment and validated the index by external datasets.
A total of 197 patients with LUAD who underwent surgery between September 2011 and May 2016 at the Department of Thoracic Surgery, Fudan University Shanghai Cancer Center, were retrospectively included in this study (Figure 1A). None of the patients received neoadjuvant therapy. This study was approved by the Committee for Ethical Review of Research (Fudan University Shanghai Cancer Center Institutional Review Board, No. 090977-1). Informed consents of all patients for donating their samples to the tissue bank of Fudan University Shanghai Cancer Center were obtained from patients themselves or their relatives.
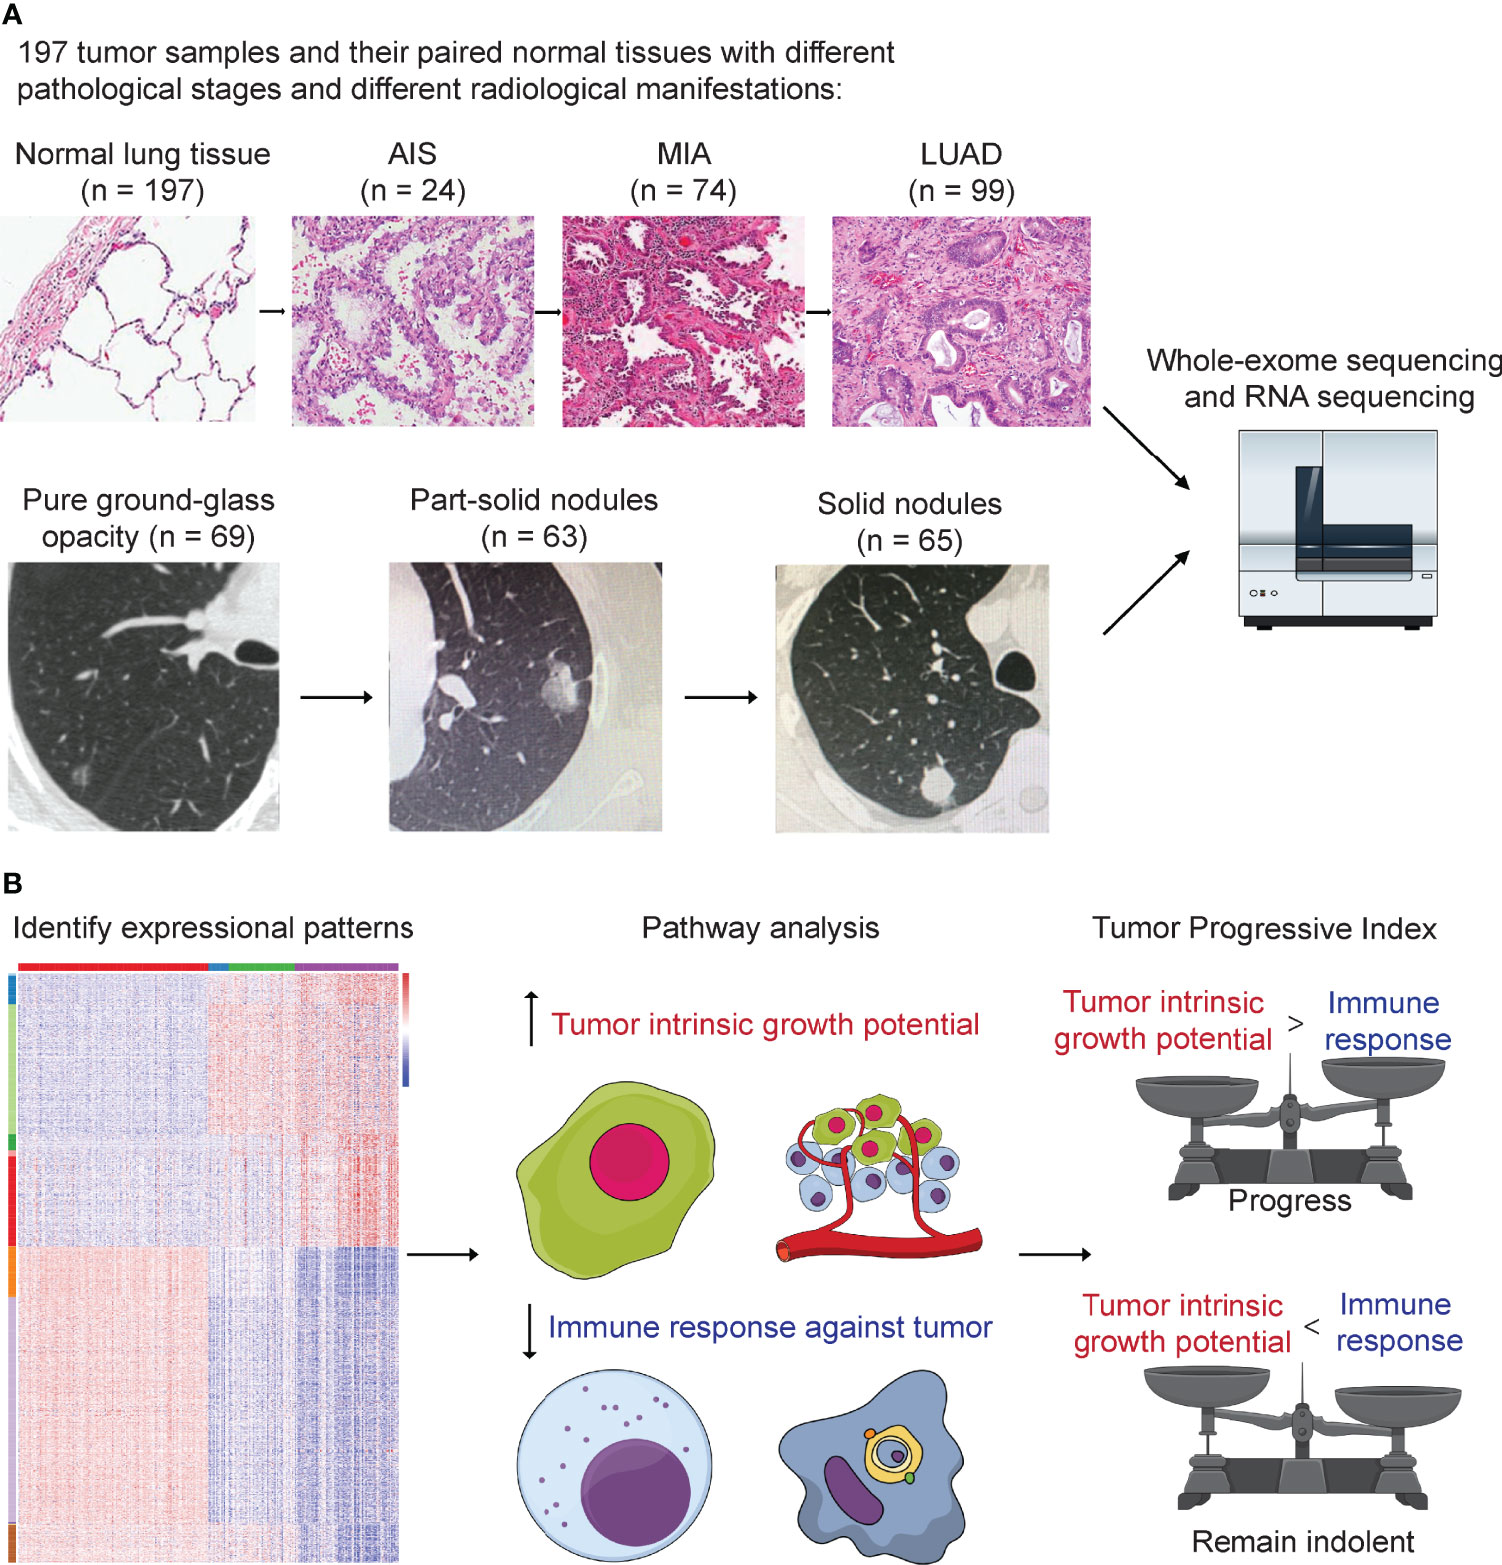
Figure 1 Study design. (A) A total number of 197 tumor samples, including 24 adenocarcinoma in situ (AIS), 74 minimally invasive adenocarcinoma (MIA), 99 lung adenocarcinoma (LUAD), and their paired adjacent normal lung tissue underwent whole-exome sequencing and RNA sequencing. Genomic and transcriptomic data were analyzed and compared among different groups. Samples were further divided into three groups according to their radiological manifestations: 69 pure ground-glass opacities (GGOs), 63 subsolid nodules, and 65 solid nodules. (B) Identification of 12 expressional patterns and development of tumor progressive index based on genomic and transcriptomic data.
Whole-lung CT scans were performed on each patient included before surgery as previously described (15). For each nodule, the maximum diameter of both the entire nodule and solid component on the single largest axial dimension was recorded on lung window. Pulmonary nodules were further divided into three groups: pure GGOs, where there was no solid component in one pulmonary nodule; subsolid nodules, where both solid and GGO components existed in one pulmonary nodule; and solid nodules, where the pulmonary nodule contained only solid component (Figure 1A). CT scans were reviewed by two radiologists independently, and interobserver and intraobserver agreements were measured to quantify the reproducibility and accuracy between the two radiologists as previously described (15).
Intraoperative frozen section diagnosis was made after the tumor was resected, and postoperative diagnosis was made after surgery by two independent pathologists. According to the IASLC/ATS/ERS classification, tumors were classified as AIS, MIA, or invasive LUAD based on their histological presentations. Invasive LUAD subtypes were further analyzed in a semi-quantitative manner, where the components of different subtypes (lepidic, acinar, papillary, micropapillary, solid, and invasive mucinous) were recorded in 5% increments. The predominant subtype was the one with the largest percentage (not necessarily 50% or higher) (17). Pathological stage of disease was determined according to the eighth TNM staging system.
Patients were followed up regularly after surgery as we previously described (15). Briefly, patients were followed up every 3 months after surgery for the first 2 years, where physical examination, chest CT scans, and abdominal ultrasonography were performed every 3 to 6 months. The follow-up interval was changed to every 6 months for the third year and once a year from then on. Brain CT or magnetic resonance imaging (MRI) and bone scintigraphy were performed every 6 months for patients with invasive adenocarcinoma in the first 3 years. In addition, positron emission tomography (PET)–CT scans were performed if necessary. Recurrence-free survival (RFS) was defined as the time between surgery and first recurrence or last follow-up. Patients with no recurrence but died from other causes were censored on that date. Overall survival (OS) was defined as the time between surgery and death or last follow-up.
Genomic DNA from tumors and paired adjacent normal tissues were extracted and prepared using the QIAamp DNA Mini Kit (Qiagen, Germany) following the manufacturer’s instructions. Exon libraries were constructed using the SureSelect XT Target Enrichment System. A total amount of 1–3 μg of genomic DNA for each samples was fragmented into an average size of ~200 bp. DNA was hybridized, captured, and amplified using SureSelect XT reagents and protocols to generate indexed, target-enriched library amplicons. Constructed libraries were then sequenced on the Illumina HiSeq X Ten platform and 150-bp paired-end reads were generated.
Sequence reads from the exome capture libraries were aligned to the reference human genome (hg19) using BWA-MEM (18). Picard tools were then used for marking Polymerase Chain Reaction (PCR) duplicated, and the Genome Analysis Toolkit was used to perform base quality recalibration and local indel re-alignments (19). Single-nucleotide variants (SNVs) were called using MuTect and MuTect2 (20). Indels were called using MuTect2 and Strelka v2.0.13 (21). Variantes were filtered if called by only one tool. After the variants were called, Oncotator v1.9.1 was used for annotating somatic mutations (22), and significantly mutated genes were identified using MutSig2CV (23). Tumor mutation burden (TMB) was calculated as the total number of non-synonymous SNVs and indels per sample divided by 30, given the total coverage of ~30 Mb. CNVkit v0.9.7 with default parameters was used to perform somatic copy number alteration (SCNA) analysis for alignment reads (24). Amplification and deletion peaks were identified using GISTIC2.0 from segment files (25). Amplification and deletion thresholds were set 0.1 and −0.1, respectively. Frequency distribution of amplification and deletion was shown using R package copy number v1.26.0 (26).
Total RNA from tumors and paired adjacent normal tissues was extracted and prepared using NucleoZOL (Macherey-Nagel, Germany) and NucleoSpin RNA Set for NucleoZOL (Macherey-Nagel, Germany) following the manufacturer’s instructions. A total amount of 3 μg of RNA per sample was used as initial material for RNA sample preparations. Ribosomal RNA was removed using Epicenter Ribo-Zero Gold Kits (Epicenter, USA). Sequencing libraries were generated using NEBNext Ultra Directional RNA Library Prep Kit for Illumina (NEB, Ipswich, USA) according to the manufacturer’s instructions. Libraries were then sequenced on the Illumina HiSeq X Ten platform and 150-bp paired-end reads were generated. As a quality-control step, only those samples with RNA integrity number (RIN) ≥ 5.0 were included in this study.
After the data were obtained, RNA-seq reads were aligned to the reference human genome (hg19) using STAR v2.5.3 (27). Expression values were normalized to the transcripts per million (TPM) estimates using RSEM v1.3.0 (28).
One-hundred fifty samples with RIN ≥ 5.0 were divided into four groups: normal (n = 150), AIS (n = 16), MIA (n = 52), and LUAD (n = 82). Analysis of variance (ANOVA) was used to determine differentially expressed genes. First, paired comparison was performed between two adjacent groups (normal vs. AIS, AIS vs. MIA, and MIA vs. LUAD), and then, genes with p < 0.0001 and |fold change| ≥ 2 in at least one of three comparisons were considered significant and put into downstream analyses. Twelve patterns of gene expression were then identified based on their trends of expression between each two adjacent groups in the study cohort (up trend, no significant change or down trend; Figures 1B, 3). Finally, KOBAS was used to perform KEGG pathway enrichment analysis for the patterns identified in the study cohort (29).
TP index was developed for quantitatively measuring the level of imbalance between tumor intrinsic growth potential and immune response. To minimize the possible confounding effect introduced by genes with low expression, we first filtered out genes with mean TPM < 1.0 across all samples. Next, genes for calculating the tumor index were selected from pattern 1, where there was a significant increase between each two adjacent groups. Genes for calculating the immune index were selected from pattern 8 where there was a significant decrease from normal tissue to AIS and from MIA to LUAD. Those genes that were both selected from pattern 8 and were in an a priori immune-related gene list containing 730 genes were used to calculate the immune index (7). For both tumor index and immune index, first, expression for those genes for each sample was log2-transformed; then, for each sample, tumor index was calculated as the mean value of log2-transformed expression of BCL2L15, COMP, CST1, and FAM83A, whereas immune index was calculated as the mean value of log2-transformed expression of ITLN2, MARCO, C8B, MASP1, CD36, TAL1, PPBP, and CDH5. Finally, TP index was calculated as the subtraction of tumor index by immune index:
Tumor progressive index = tumor index − immune index
Clinical and pathological characteristics were recorded and compared among three groups. Pearson χ (2) test and Fisher’s exact test were used to compare categorical variables wherever applicable. Non-parametric Wilcoxon signed-rank test was used to compare medians of groups of continuous variables. Kaplan–Meier survival curves and log-rank p-values were calculated for patients’ RFS and OS. All statistical analyses and graphing work were performed using R (version 3.6.0, R Foundation for Statistical Computing, Vienna, Austria). Two-tailed p < 0.05 was considered significant for all statistical analyses unless stated otherwise.
Tumor samples were divided into three groups based on their pathological characteristics: 24 AIS, 74 MIA, and 99 LUAD, and into three groups based on their radiological manifestations: 69 pure GGOs, 63 subsolid nodules, and 65 solid nodules (Figure 1A). Clinical and pathological characteristics, including sex, smoking status, tumor location, pathology, and adenocarcinoma subtypes, were compared (Table 1). Of note, we found that there was an association between radiological and pathological presentations. Sixty-six of the 69 (95.7%) of pulmonary nodules manifesting as pure GGOs on CT scan were either AIS or MIA, whereas for pulmonary nodules manifesting as pure solid nodules, only one of 65 (1.5%) was either AIS or MIA (MIA in this case). For pulmonary nodules manifesting as subsolid nodules on CT scan, 31 of 63 (49.2%) were either AIS or MIA, and 32 (50.8%) were invasive adenocarcinoma. Compared with male patients, female patients had significantly higher frequency of pure GGO lesions (p = 0.025). For predominant adenocarcinoma subtypes, lepidic subtype was significantly enriched in the pure GGO group (p < 0.001), whereas papillary subtype was significantly enriched in the pure solid group (p = 0.004). Solid subtype was only found predominant in the pure solid group. Moreover, for presenting subtypes, lepidic subtype was significantly enriched in the pure GGO group (p = 0.001), and solid subtype was significantly enriched in the pure solid group (p = 0.014). Micropapillary subtype was also more likely to be found in the pure solid group, although without a significant difference (pure GGO vs. subsolid vs. solid: 0.0% vs. 3.1% vs. 9.4%, p = 0.472). Taken together, these results demonstrated there was a link between radiological and pathological findings; therefore, radiological manifestations can, at least partly, help predict the invasiveness of LUAD.
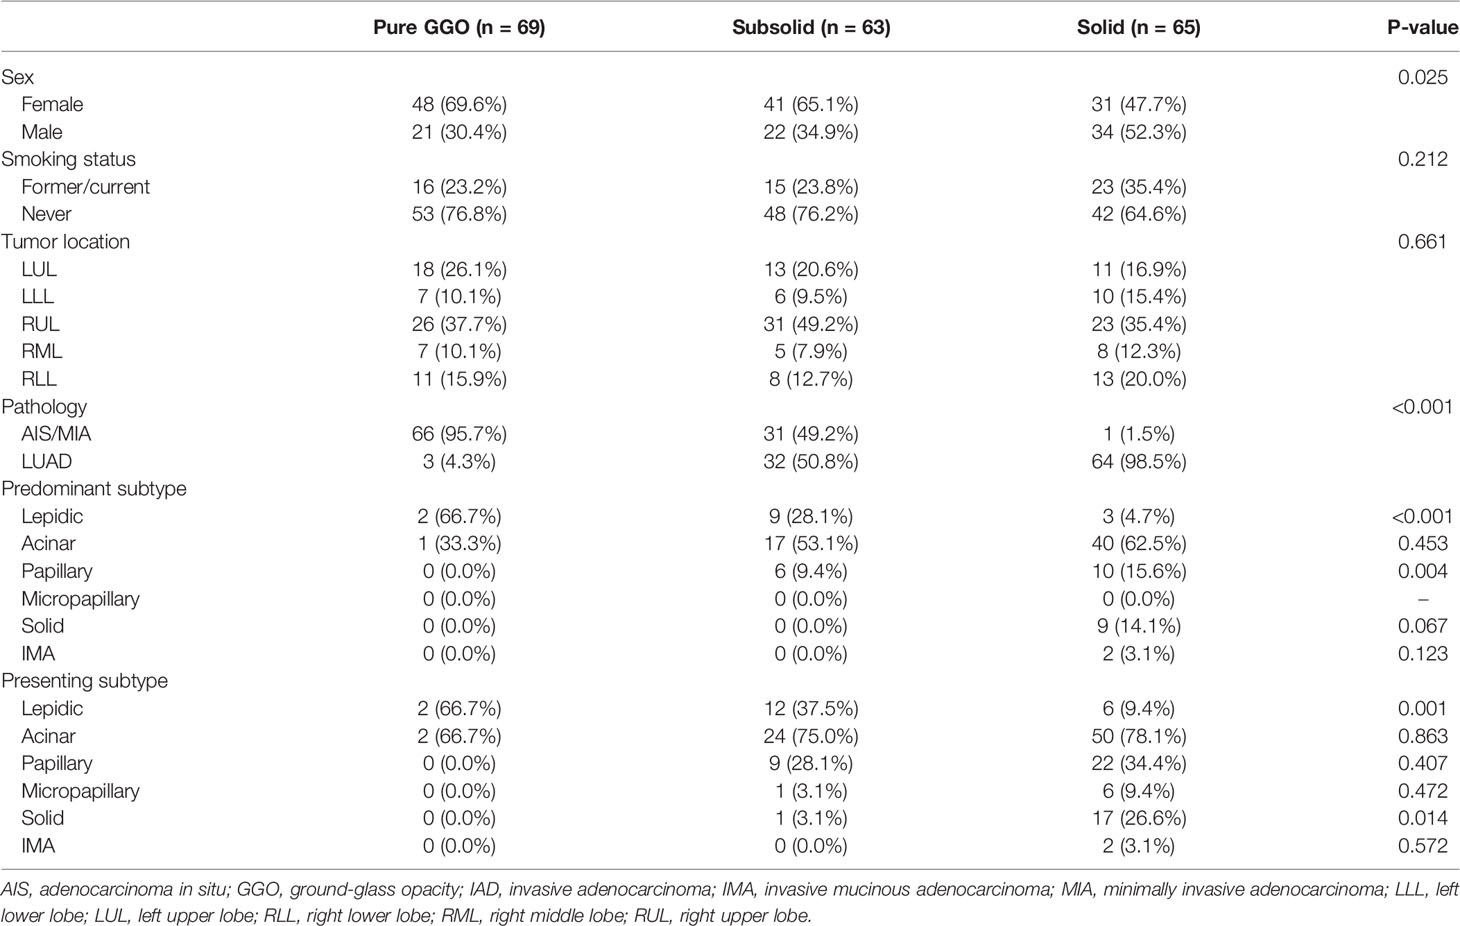
Table 1 Clinical and pathological characteristics of the study cohort (n = 197).
We next assessed the genomic alterations of tumors with different radiological manifestations. The landscape of somatic mutations for all patients included in this study was shown in Figure 2A. The most frequently mutated genes in this cohort were EGFR (50%), followed by TP53 (22%), RBM10 (8%), ERBB2 (5%), BRAF (5%), RB1 (5%), KRAS (4%), and NF1 (3%) (Figure 2A). A further comparison found that frequency of mutations in driver genes did not differ as tumor progressed, whereas frequency of mutations in tumor suppressor genes increased as tumor progressed. For individual driver genes, EGFR mutations were significantly more enriched in LUAD (p = 0.005), whereas BRAF was significantly more enriched in AIS (p = 0.028, Supplementary Table 1). ALK fusions were detected only in three LUAD samples, all of which were solid nodules on CT scan (3 of 65, p = 0.045, Supplementary Table 2). On the other hand, a significant difference was observed in the frequency of tumor suppressor genes. The number of mutations in common tumor suppressor genes was 2 (8.3%) for AIS, 4 (5.4%) for MIA, and 38 (38.4%) for LUAD (p < 0.001, Supplementary Table 1), and 7 (10.1%) for pure GGOs, 15 (23.8%) for subsolid nodules, and 37 (56.9%) for solid nodules (p < 0.001, Supplementary Table 3). For individual tumor suppressor genes, frequency of TP53 mutations was found to be significantly higher in LUAD and solid nodules (p < 0.001 and p < 0.001, respectively, Figures 2B, C and Supplementary Tables 1, 2), whereas frequency of RB1 mutations was significantly higher in solid nodules (p = 0.038) and marginally significantly higher in LUAD (p = 0.058). TMB was significantly higher in LUAD compared with AIS/MIA, and solid nodules compared with GGOs/subsolid nodules on CT scan (Supplementary Figures 1, 2).
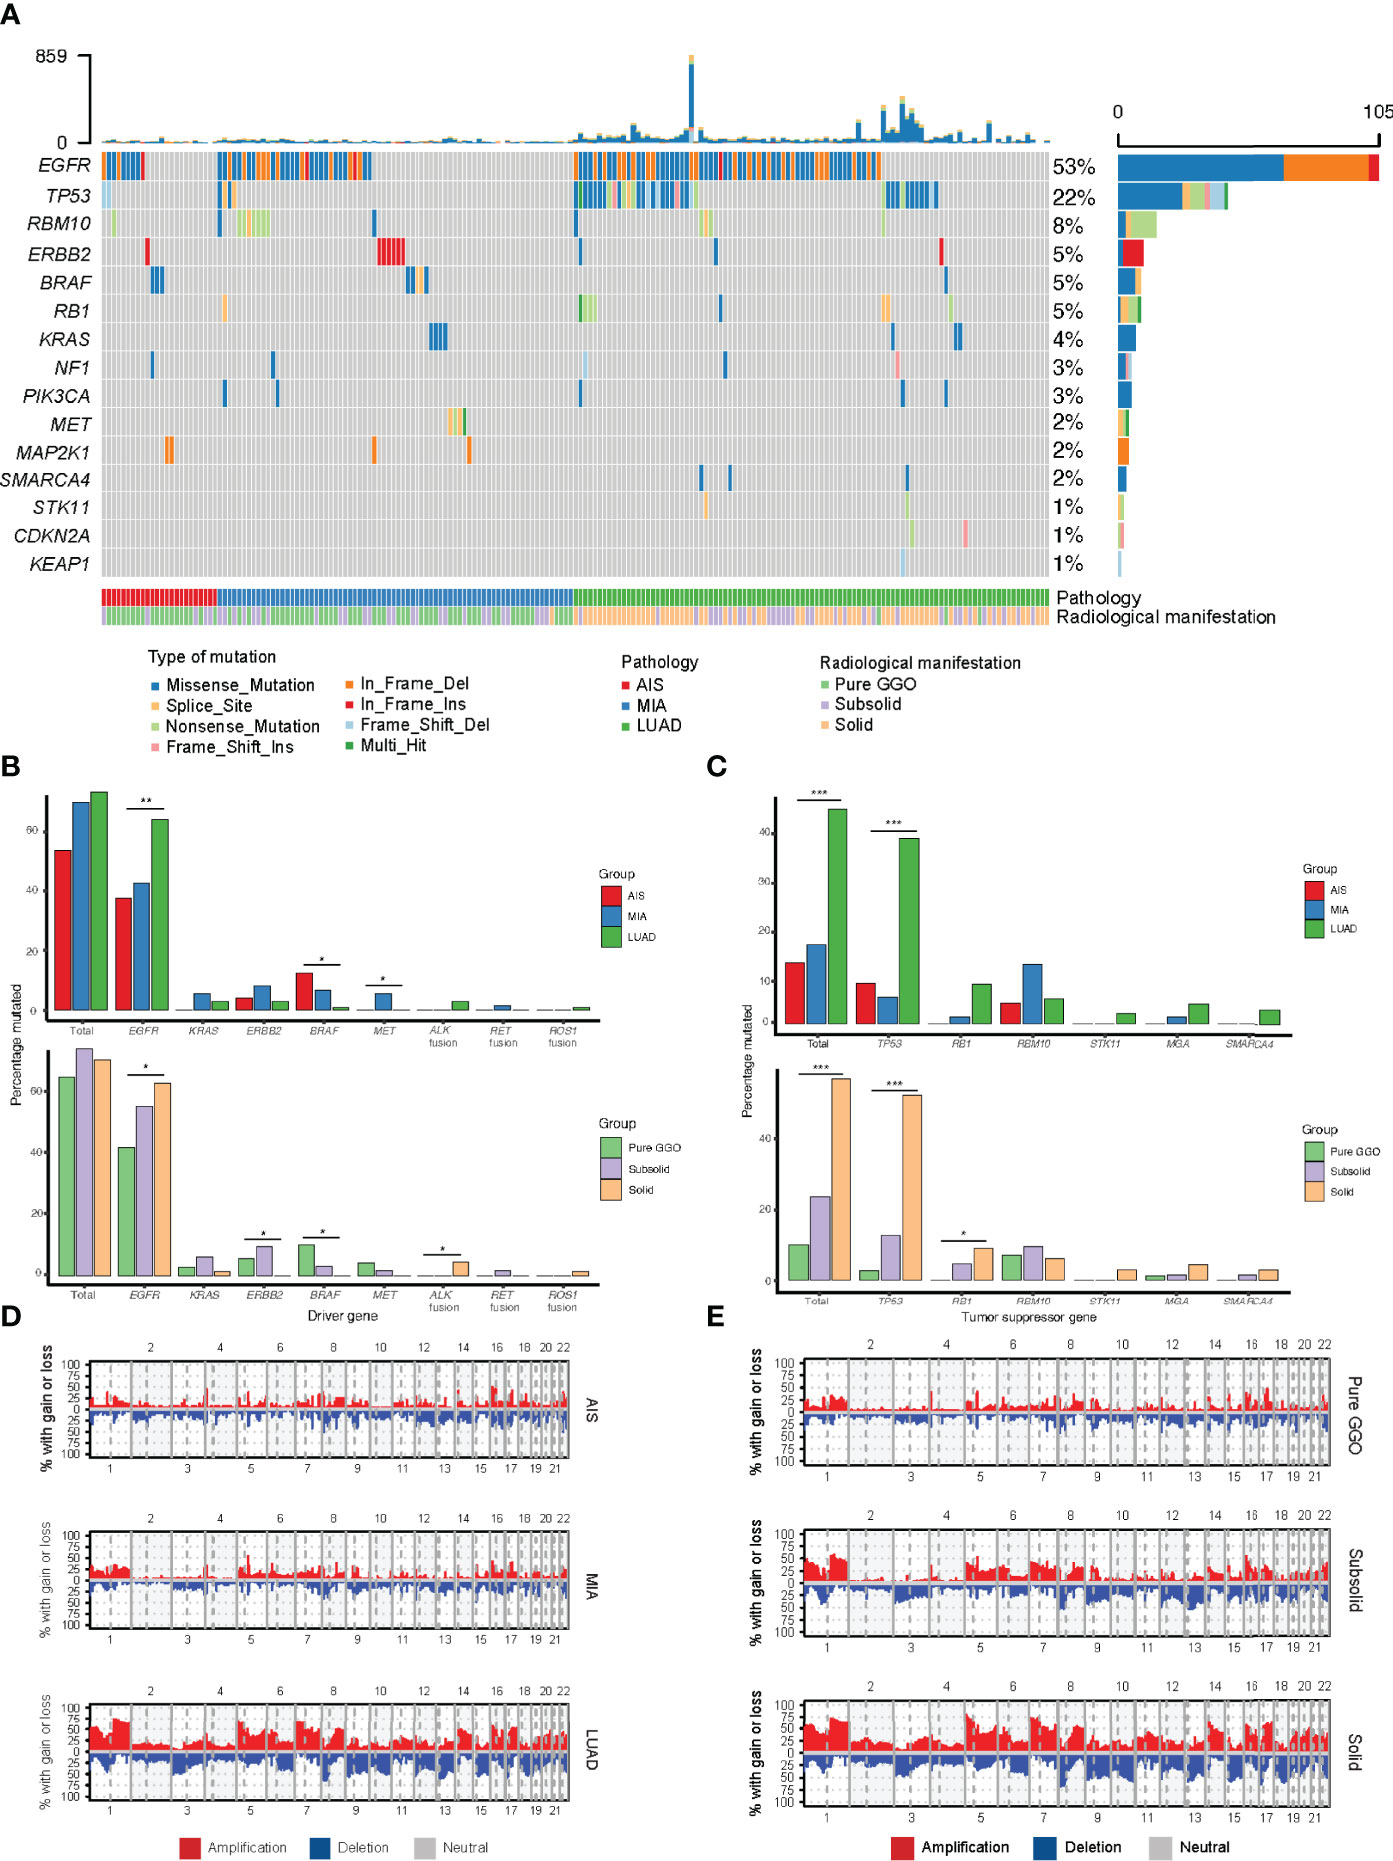
Figure 2 Comparison of genomic alterations for different pathological and radiological groups. (A) Waterfall plot showing the landscape of genomic alterations in each group. (B) Comparison of mutation frequency in major driver genes among different groups. (C) Comparison of mutation frequency in major tumor suppressor genes among different groups. (D) Comparison of somatic copy number alterations among different pathological groups. (E) Comparison of somatic copy number alterations among different radiological groups. *, p<0.05; **, p<0.01; ***, p<0.001.
To explore the SCNAs of different stages of LUAD, we identified SCNAs from raw sequencing reads of samples of different pathological and radiological groups. Notably, the SCNA frequency including amplification and deletion increased as tumors progressed (Figures 2D, E). We used GISTIC2.0 to identify significant arm-level SCNAs in samples of different groups, and the union of significant arm-level event of the three groups was used for further analysis. As a result, the ratio of amplification and deletion in arm-level SCNAs increased from AIS to MIA and LUAD and from pure GGOs to subsolid and solid nodules. These results indicated that the frequency of SCNA burden was higher as tumors progressed.
To explore whether there are any differences in immune cell infiltration as tumors progress to different stages, we next used CIBERSORT, a deconvolution method to estimate the infiltration of immune cells in different pathological stages (30). We found that the number of CD8+ T cells decreased as tumor stage increased (Figure 3A), which was consistent with Dejima et al. on the immune evolution from neoplasia to invasive lung adenocarcionma (7). Furthermore, we found that the number of Tregs increased as tumor stage increased, suggesting an enhanced immunosuppression as disease progressed (Figure 3B), which was also validated by the Dejima dataset (Figure 3C). Interestingly, we found an increased number of activated NK cells and a decreased number of resting NK cells as disease progressed and validated this result using the Dejima dataset, suggesting that NK cells might be important in the progression of LUAD (Figures 3D, E). A more detailed staging of LUAD also showed similar results, with tumors at earlier stages having more CD8+ T cells and less Tregs, whereas tumors at later stages having less CD8+ T cells and more Tregs (Supplementary Figure 3). Taken together, our findings showed that a suppressed immune microenvironment plays an important role in the progression of LUAD.
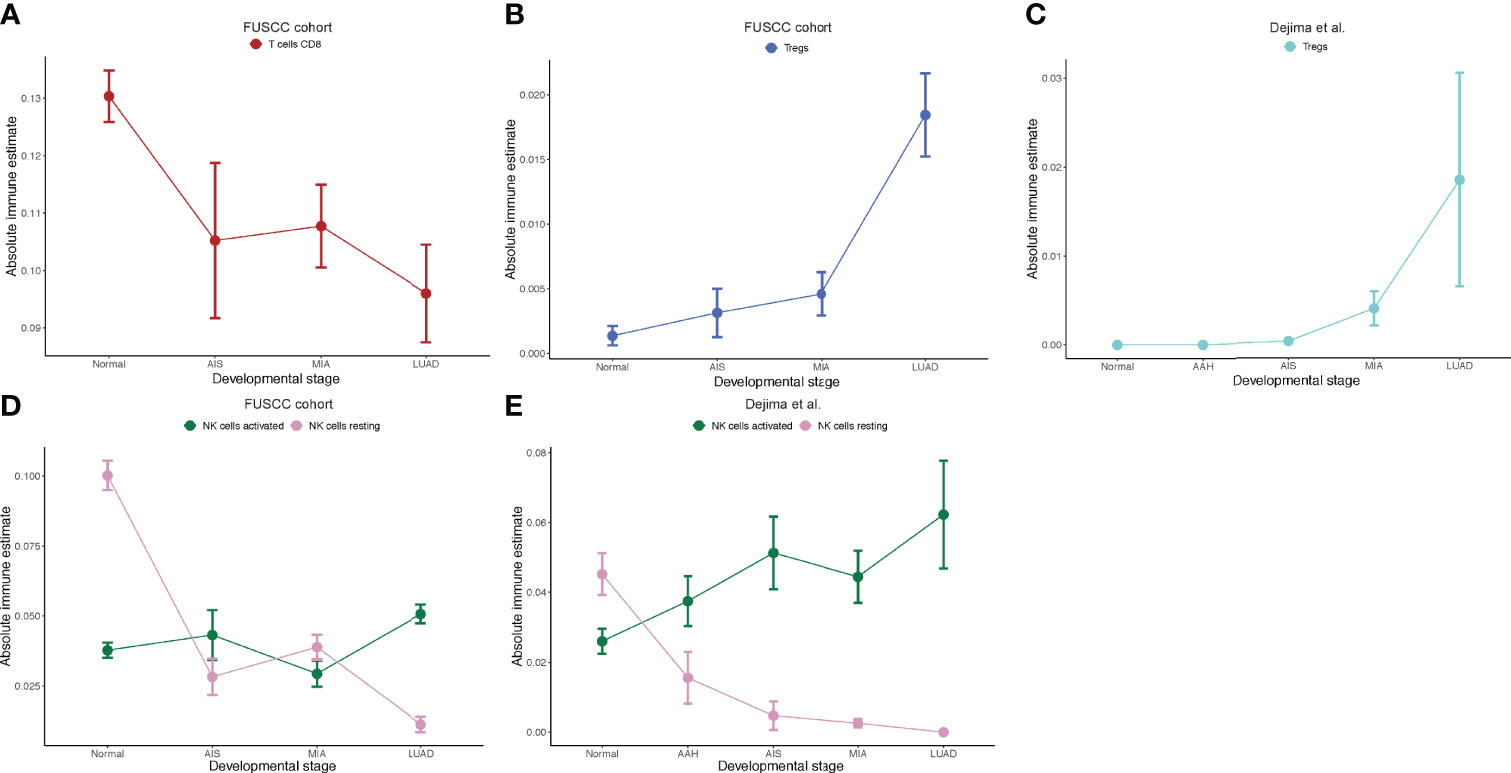
Figure 3 Immune cell infiltration inferred by CIBERSORT. (A) Prediction of number of CD8+ T cells in the Fudan University Shanghai Cancer Center (FUSCC) cohort. (B) Prediction of number of Tregs in the FUSCC cohort. (C) Prediction of number of Tregs in Dejima’s cohort. (D) Prediction of number of activated and resting natural killer (NK) cells in the FUSCC cohort. (E) Prediction of number of activated and resting NK cells in Dejima’s cohort.
Next, we defined expression patterns that correlated with tumor progression using RNA-seq data. One-hundred fifty samples with RIN ≥ 5.0 were included in this part. We developed an ANOVA model with pathological stage (normal tissue, AIS, MIA, and LUAD) as a factor and patient as a random effect. A total of 2023 genes with p < 0.0001 and |fold change| > 2 in pairwise comparisons of two adjacent groups of patients (normal tissue vs. AIS, AIS vs. MIA, and MIA vs. LUAD, respectively) were divided into 12 following patterns: pattern 1 (nine genes): increase from normal to AIS, from AIS to MIA and from MIA to LUAD; pattern 2 (97 genes): increase from normal to AIS and from MIA to LUAD, no change from AIS to MIA; pattern 3 (446 genes): increase from normal to AIS alone; pattern 4 (54 genes): no change from normal to AIS, increase from AIS to MIA and from MIA to LUAD; pattern 5 (20 genes): increase from AIS to MIA alone; pattern 6 (309 genes): increase from MIA to LUAD alone; pattern 7 (three genes): decrease from normal to AIS, from AIS to MIA and from MIA to LUAD; pattern 8 (175 genes): decrease from normal to AIS and from MIA to LUAD, no change from AIS to MIA; pattern 9 (771 genes): decrease from normal to AIS alone; pattern 10 (6 genes): no change from normal to AIS, decrease from AIS to MIA and from MIA to LUAD; pattern 11 (three genes): decrease from AIS to MIA alone; pattern 12 (130 genes): decrease from MIA to LUAD alone (Figure 4 and Supplementary Table 3). Pathway enrichment analysis showed that pathways associated with tumor invasiveness and cell growth were enriched in up-trend patterns (patterns 1 to 6). Of note, Phosphatidylinositol 3-Kinase - Protein Kinase B (PI3K-AKT) signaling pathway and NF-κB signaling pathway were upregulated in AIS compared with normal tissue, suggesting that malignant behaviors could exist in as early as AIS. Epithelial–mesenchymal transition, which was highly associated with tumor metastasis, was also found to be increased from AIS to MIA, suggesting an acquisition of metastatic potential as invasive subtypes of LUAD emerge (31). Moreover, cell cycle was found to be increased from MIA to LUAD, consistent with the fact that AIS/MIA behaved more indolent than LUAD. On the other hand, for down-trend patterns, natural killer–mediated cytotoxicity and Transforming Growth Factor-beta (TGF- β) signaling pathway were found to be decreased from normal lung tissue to AIS, suggesting an inhibited immune response against tumor. Chemokine signaling, Interleukin2-Signal Transducer and Activator of Transcription 5 (IL2-STAT5) signaling, TNF-A signaling via NF-κB and leukocyte transendothelial migration were also found to be enriched in down-trend patterns, further suggesting an impaired immune function in tumor microenvironment. Interestingly, Wnt signaling pathway, which was often upregulated in cancer, was found to be decreased from AIS to MIA and from MIA to LUAD. A deeper look into pattern 10 showed that this finding was contributed by WIF1 (Wnt inhibiting factor 1), which was an inhibitor of Wnt signaling pathway. Taken together, our results suggest that both an increased tumor intrinsic growth potential and an inhibited immune microenvironment contributed to the development and progression of LUAD.
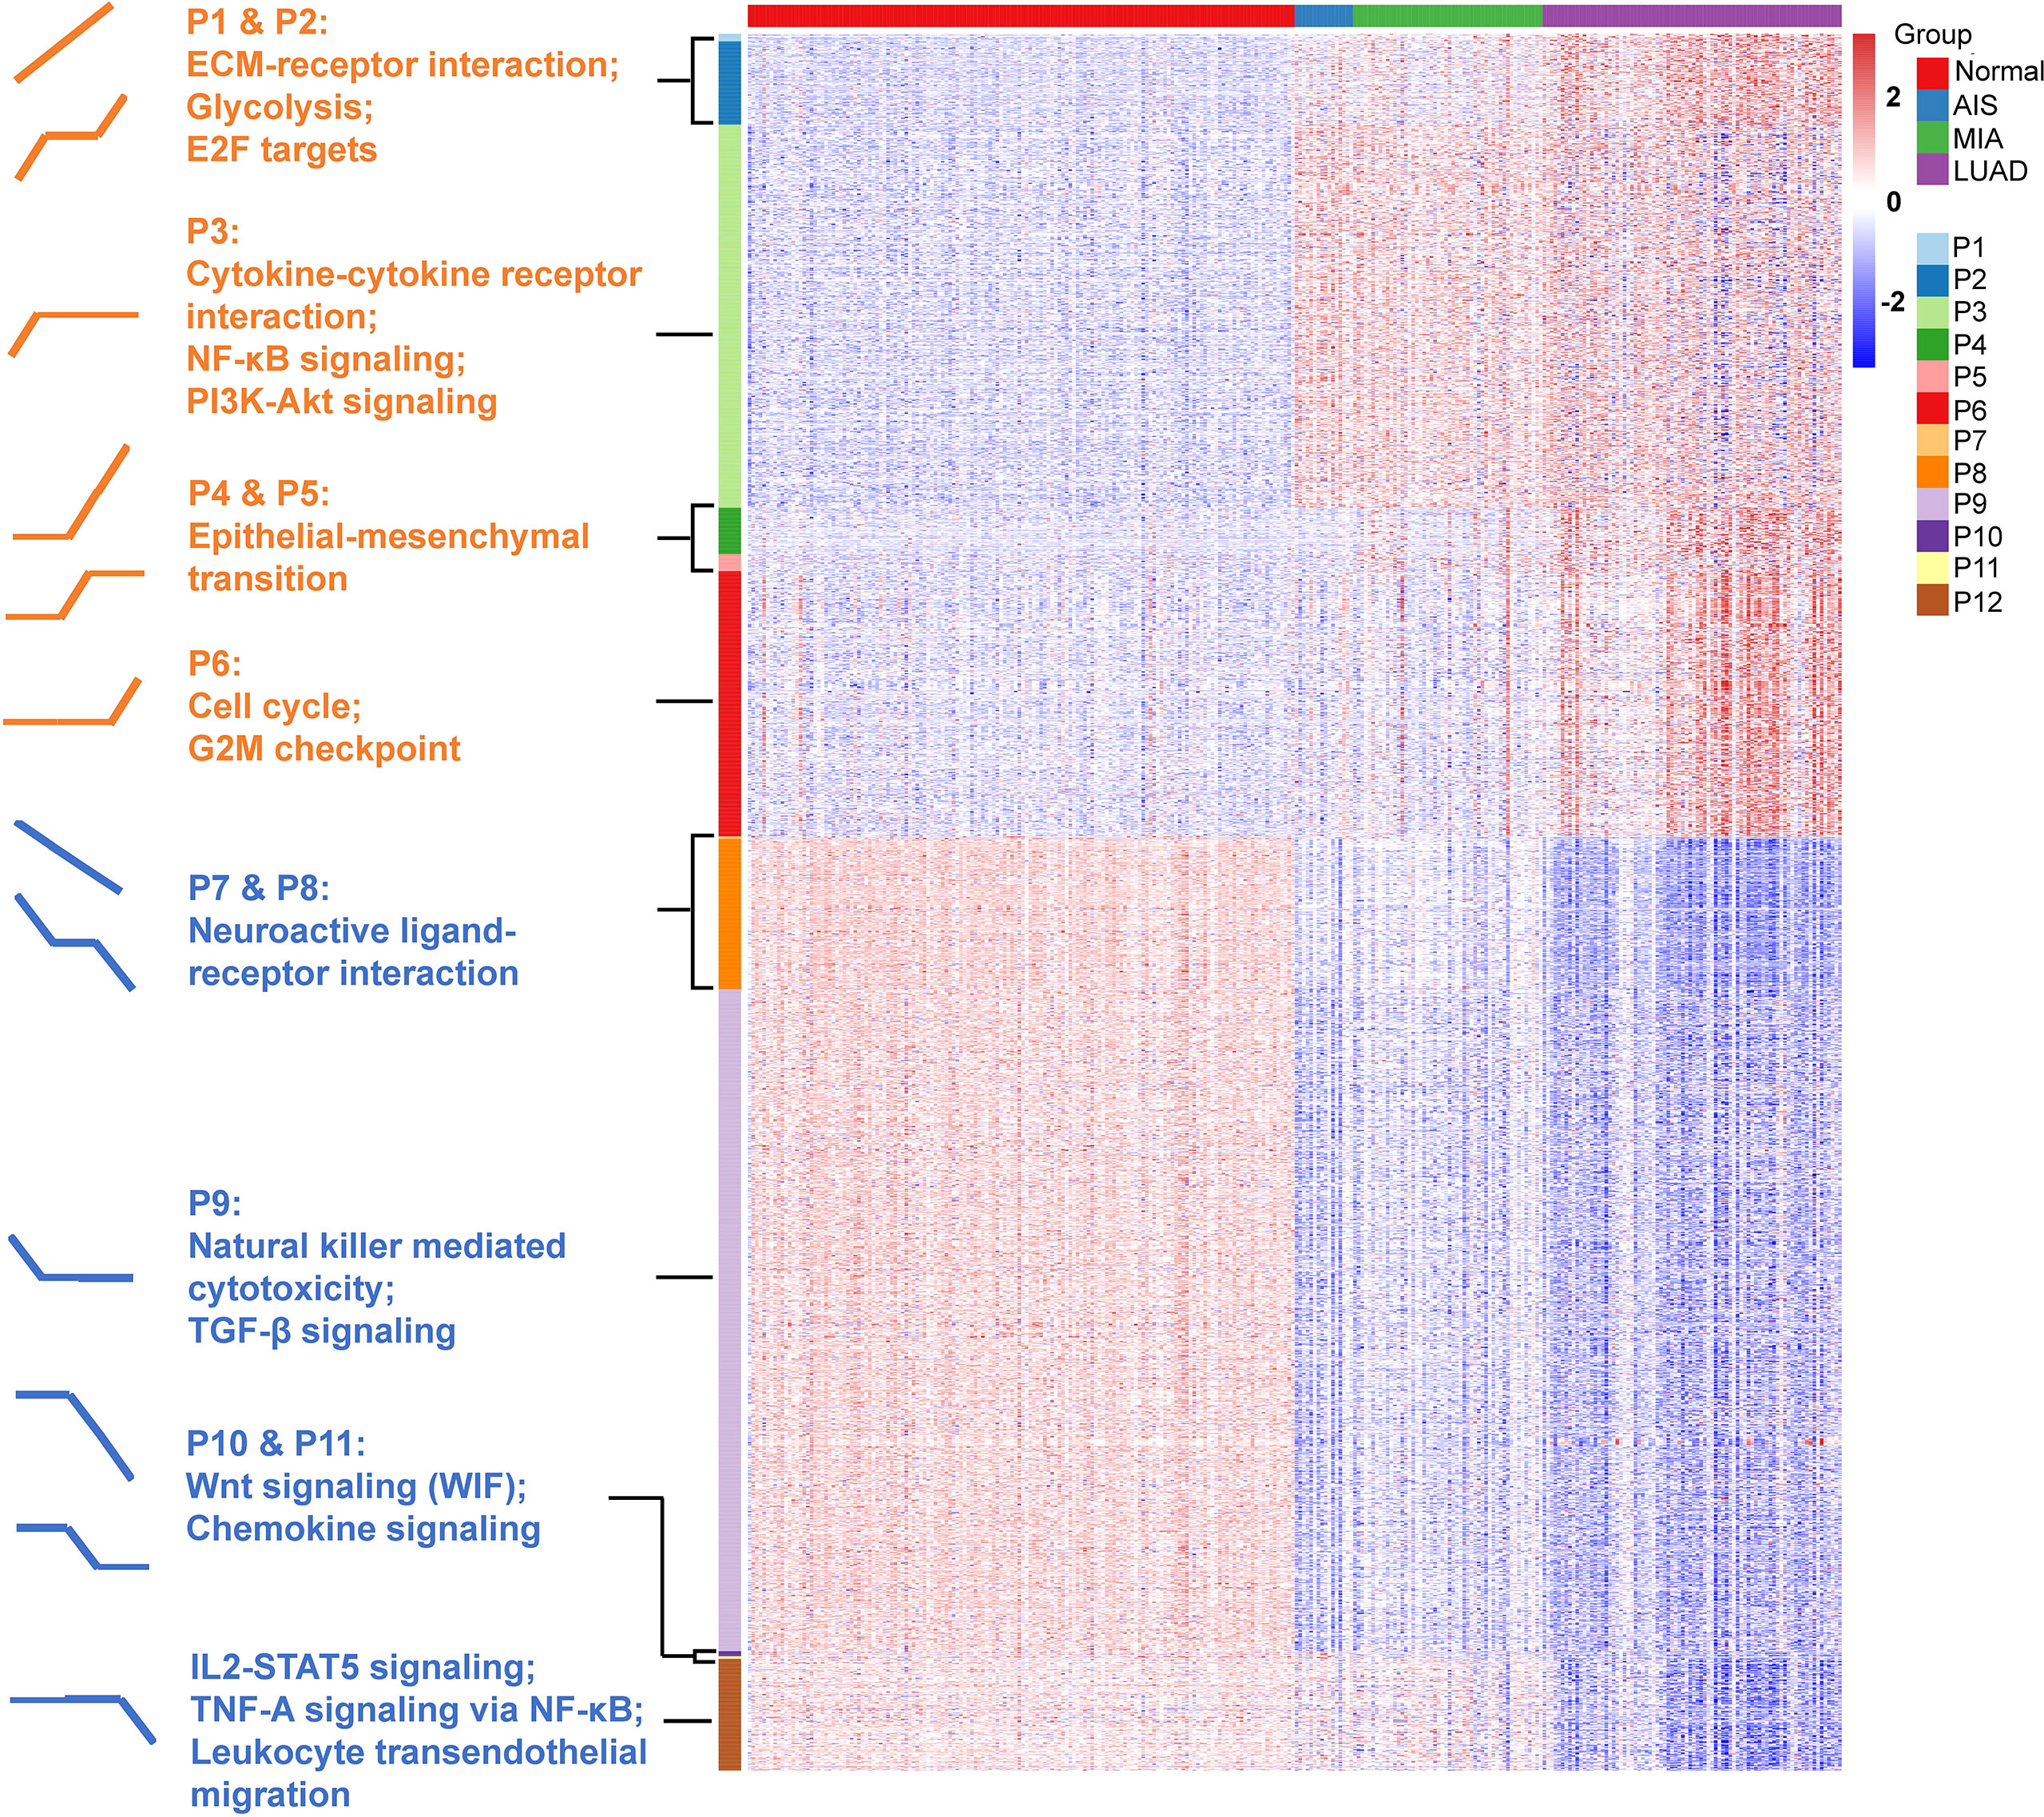
Figure 4 Identification of 12 expression patterns and prediction of immune cell infiltration. Pattern 1 (nine genes): increase from normal to AIS, from AIS to MIA and from MIA to LUAD; pattern 2 (97 genes): increase from normal to AIS and from MIA to LUAD, no change from AIS to MIA; pattern 3 (446 genes): increase from normal to AIS alone; pattern 4 (54 genes): no change from normal to AIS, increase from AIS to MIA and from MIA to LUAD; pattern 5 (20 genes): increase from AIS to MIA alone; pattern 6 (309 genes): increase from MIA to LUAD alone; pattern 7 (three genes): decrease from normal to AIS, from AIS to MIA and from MIA to LUAD; pattern 8 (175 genes): decrease from normal to AIS and from MIA to LUAD, no change from AIS to MIA; pattern 9 (771 genes): decrease from normal to AIS alone; pattern 10 (six genes): no change from normal to AIS, decrease from AIS to MIA and from MIA to LUAD; pattern 11 (three genes): decrease from AIS to MIA alone; pattern 12 (130 genes): decrease from MIA to LUAD alone. Gene set enrichment analysis (GSEA) was performed to assess the functional significance for those patterns.
To better predict tumor progression and outcome of patients, TP index were built to measure the imbalance between tumor intrinsic growth potential and immune microenvironment. On the basis of our previous findings, we used the genes in pattern 1 and immune-related genes in patterns 7 and 8 with mean TPM ≥ 1 across all samples (methods). Four genes that were associated with apoptosis, tumor metastasis and progression (BCL2L15, COMP, CST1, and FAM83A) reflected tumor intrinsic growth potential, whereas eight genes (ITLN2, MARCO, C8B, MASP1, CD36, TAL1, PPBP, and CDH5) that were associated with immune microenvironment reflected immune response against tumors. A negative TP index indicates that the immune system is competent enough to suppress the progression of tumors, whereas a positive TP index indicates that the immune system can no longer suppress the growth of tumor cells. In our study cohort, TP index was negative in normal tissues but positive in AIS and stages onward, indicating that immune escape already existed in AIS, the precursor stage of LUAD, and became more severe with the progression of disease (Figure 5A). Same increasing trend was observed in another dataset, which showed a significant increase of TP index from normal tissue to atypical adenomatous hyperplasia (AAH) then to LUAD (Figure 5B) (32). Interestingly, there was a negative TP index in the stage of AAH, where tumors could not overcome the immune system to metastasize further. Although the TCGA-LUAD dataset does not contain pre-invasive stages of LUAD, we still calculated the TP index for each sample and compared it between normal and tumor samples. Not surprisingly, tumor samples had significantly higher TP index than normal samples (Figure 5C).
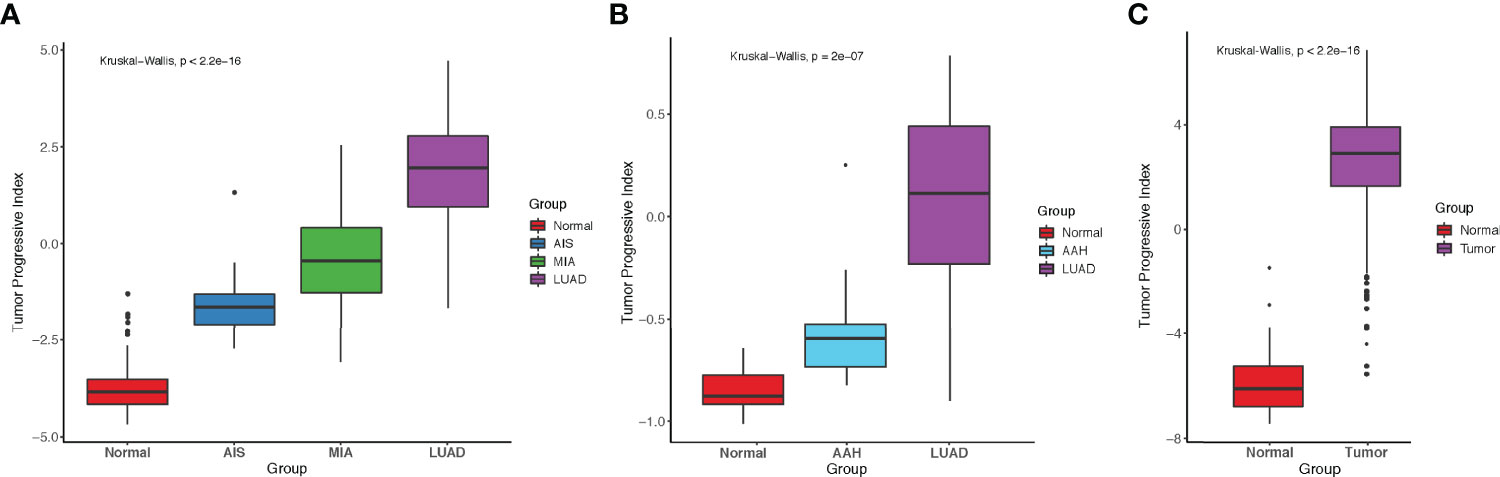
Figure 5 Comparison of tumor progressive index for different datasets. (A) Boxplot showing the index increased as tumor progressed in the FUSCC cohort. (B) Boxplot showing the index increased as tumor progressed in Dejima’s cohort. (C) Boxplot showing the difference of tumor progressive index between normal and tumor samples in the TCGA-LUAD cohort.
To investigate whether our TP index had prognostic value for patients with LUAD, survival analysis was performed on both our dataset and TCGA-LUAD dataset. Our results showed that in our dataset, patients with a high TP index had poorer RFS (HR, 10.47; 95% CI, 3.21–34.14) and OS (HR, 4.83e8; 95% CI, 0–Inf; Figures 6A, B), whereas in the TCGA-LUAD dataset, patients with a higher TP index had poorer OS (HR, 1.35; 95% CI, 1.00–1.81) but progression-free survival (PFS) was comparable for the two groups (HR, 1.10; 95% CI, 0.83–1.45; Figures 6C, D). Taken together, our results suggested that increased tumor intrinsic growth potential and impaired immune response against tumor work together to drive the progression of LUAD, and our TP index, which measures the level of imbalance between tumor intrinsic growth potential and tumor immune microenvironment, is of prognostic value for patients with LUAD (Figure 6E).
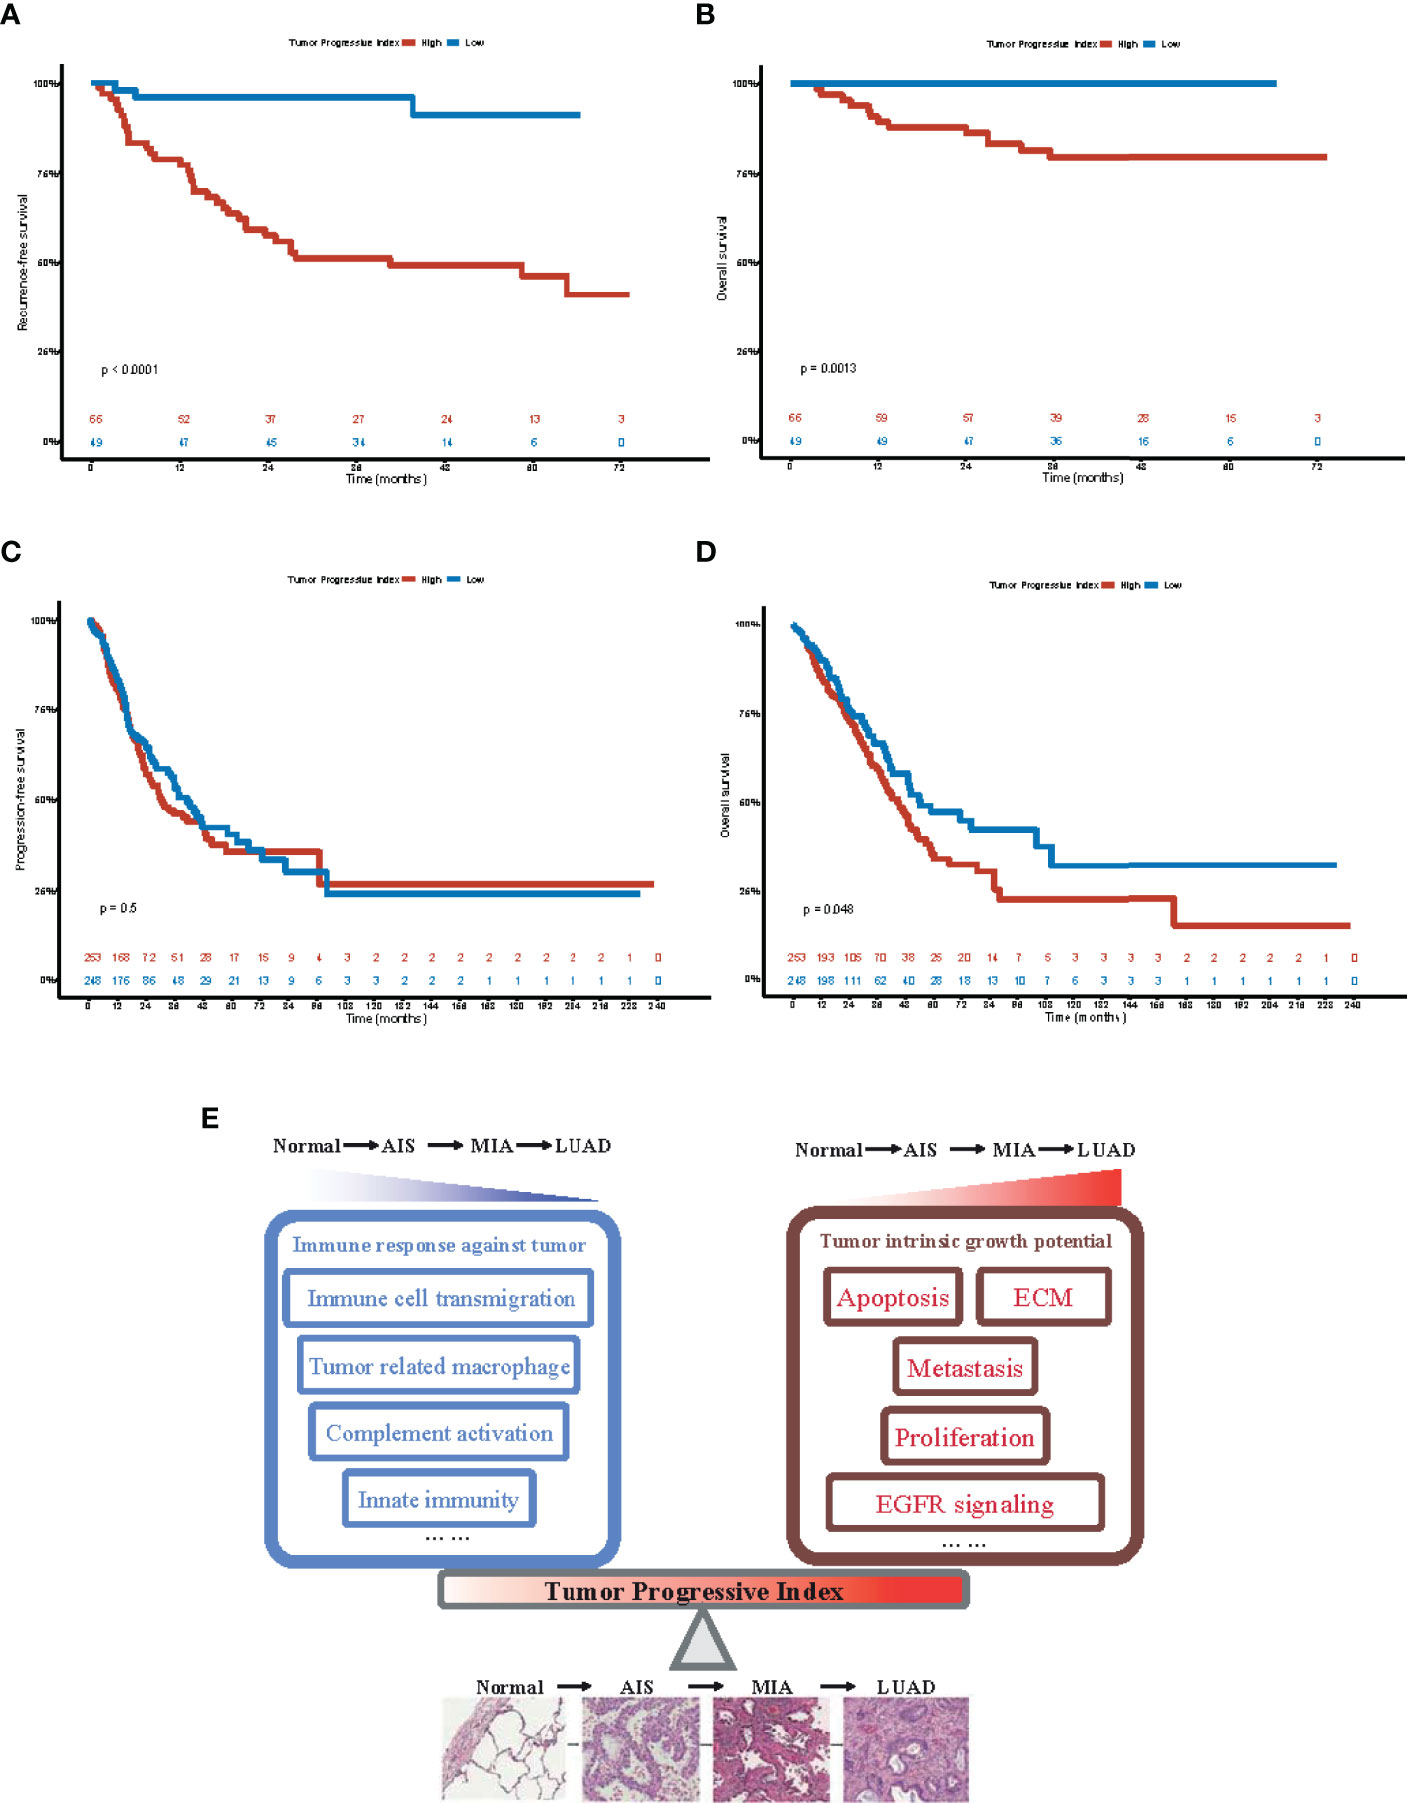
Figure 6 Prognostic value of tumor progressive index for patients with lung adenocarcinoma. (A) Recurrence-free survival for patients with tumor progressive index higher and lower than the median value across the Fudan University Shanghai Cancer Center (FUSCC) cohort. (B) Overall survival for patients with tumor progressive index higher and lower than the median value across the Fudan University Shanghai Cancer Center (FUSCC) cohort. (C) Recurrence-free survival for patients with tumor progressive index higher and lower than the median value across the TCGA-LUAD cohort. (D) Overall survival for patients with tumor progressive index higher and lower than the median value across the TCGA-LUAD cohort. (E) Schematic demonstration showing the imbalance between tumor intrinsic growth potential and immune response against tumor, which can be measured by tumor progressive index, leads to the evolution and progression of lung adenocarcinoma.
In this study, we provided a comprehensive analysis integrating clinical, radiological, pathological, genomic, and transcriptomic analysis of 197 pulmonary lesions with different radiological and pathological manifestations.
We first assessed the transcriptomic profiles of our cohort. On the basis of the differentially expressed genes between each two adjacent groups, 12 expression patterns were identified (Figure 4). Genes associated with cell cycle and G2M checkpoint were found to be significantly upregulated from MIA to LUAD, but not different from normal tissue to MIA. This indicates that pre-invasive stages of LUAD had more indolent behaviors, which might explain why AIS and MIA had a nearly 100% 5-year survival rate after surgical resection. Histologically, AIS is defined as a ≤3-cm adenocarcinoma lacking invasive patterns, whereas MIA is a ≤3-cm adenocarcinoma with invasive patterns of no more than 5 mm in size (31). PI3K-AKT signaling pathway, a classical pathway that was upregulated in various cancer types, was found to be increased from normal tissue to AIS (33). Although AIS is the precursor of LUAD, this finding shows that cells in this stage already have an increased potential for growth. On the other hand, we found that epithelial–mesenchymal transition, a biological process known to increase metastatic potential of cancer cells (34), was found to be significantly increased from AIS to MIA, consistent with histological differences between AIS and MIA. Although AIS and MIA both have a nearly perfect prognosis, our results suggest that MIA should be surgically intervened before it progresses to the next stage as invasive patterns already exist. To our surprise, several immune-related pathways were found in down-trend expression patterns, indicating a decreased or impaired immune response as tumors progress. Consistent with this finding, using CIBERSORT to deconvolute our bulk-sequencing data, we found a decrease in the number of CD8+ cytotoxic T cells and an increase in the number of Treg cells, which was also validated by another dataset that compared immune cells among normal tissue, AAH, AIS, MIA, and LUAD (7). Taken together, our results demonstrated that increased tumor intrinsic growth signals and decreased immune response orchestrate the evolution of LUAD.
We next demonstrated that there was an association between radiological and pathological presentations. Most nodules that were GGOs on CT scan were AIS or MIA, whereas most solid nodules were invasive LUAD (Table 1). This might provide explanation of why pulmonary nodules manifesting as GGOs on CT scan usually have indolent clinical courses. This result was also consistent with previous studies and provided a link between histological and radiological manifestations (35, 36). For major driver mutations, we found that frequency of neither EGFR nor KRAS mutations was significantly different among the three groups (Figure 2B and Supplementary Table 2). BRAF mutations were more enriched in the pure GGO group, whereas ALK fusion was only seen in the solid group. On the other hand, the frequency of mutations in tumor suppressor genes was significantly different among the three groups, with a sharp increase from 2 (2.9%) in the pure GGO group, to 8 (12.7%) in the subsolid group, and 33 (50.8%) in the solid group (Figure 2C and Supplementary Table 2), suggesting a pivotal role that tumor suppressor genes play in the progression of LUAD. For individual tumor suppressor genes, TP53 and RB1 were significantly different among the three groups (p < 0.001 and p = 0.038, respectively; Figure 2C and Supplementary Table 2).
Previous studies have discussed the genomic alterations in pulmonary nodules manifesting as GGO. In 2015, Kobayashi et al. evaluated EGFR, KRAS, ALK, and HER2 mutations in 104 pulmonary nodules, manifesting as GGO. They found that EGFR was mutated in 64% of all the 104 samples, whereas KRAS, ALK, and HER2 were mutated in 4%, 3%, and 4% of the samples, respectively (37). In 2018, Lu et al. reported that EGFR was mutated in 75 of 156 (48.1%) patients with LUAD, which was similar to 50% in our cohort (38). We also observed a significant difference in EGFR mutation frequency among three radiological groups (Figure 2B and Supplementary Table 2). In 2020, Li et al. performed whole-exome sequencing on 154 pulmonary subsolid nodules from 120 patients and found that EGFR was the most frequently mutated gene, followed by RBM10, TP53, STK11, and KRAS. They also found that frequency of EGFR, RBM10, and TP53 was significantly different between pure GGO and subsolid nodules (39). Although not significantly different for EGFR and RBM10 in our cohort, there was indeed a significant difference of the frequency of TP53 mutations (Figure 2C and Supplementary Table 2).
For SCNAs, we found that the frequency of SCNAs increased as tumors progressed. As the solid components increased, the genome became more unstable. Frequency of arm-level alterations also followed the same trend, where tumors at earlier stages and manifested as pure GGOs on CT scan had fewer significant arm-level events, whereas tumors at later stages and manifested as solid nodules had more significant arm-level events. Genomic instability was widely reported to be associated with increased rate of tumor proliferation and progression among different cancer types (40–42).
Tumor intrinsic growth potential and immune microenvironment are both associated with tumor evolution and progression (43, 44). On the basis of our findings, a TP index was designed to quantitatively measure the level of imbalance between tumor intrinsic growth potential and immune microenvironment. Interestingly, AAH, a stage of pre-cancerous hyperplasia, had a negative TP index, indicating some key alteration would be needed to activate the malignant transformation of cells. AIS, MIA, and LUAD all had a progressive index of more than 0, and the index increased as the tumor developed to the next stage. Furthermore, patients with a high TP index tended to have a poorer RFS and OS. Taken together, our data demonstrated that TP index can be used as a predictor for disease progression and prognosis, discovering new markers for predicting patients’ survival and potential drug targets.
In our study, surgically resected specimens were used. However, in some cases, cytology is the only available specimens. Previous studies have shown that performing next-generation sequencing on cytological samples can yield comparable results than on histological samples (45, 46). In the context of lung transplantation, donors with suspected tumors are rarely used due to the risk of transmission (47). However, as patients needing lung transplantation are increasing and pulmonary nodules are increasingly diagnosed, pulmonary nodules that are not malignant need to be excluded from the blacklist. A fast assessment based on pathology and genomics using cytological specimens might be a possible solution, shedding light on future application of molecular testing.
In summary, this study integrates the genomic alterations, transcriptomic profiles, and histological and radiological progression of LUAD, providing deeper understandings of the evolution of this disease.
The datasets presented in this study can be found in online repositories. The names of the repository/repositories and accession number(s) can be found below: European Genome-phenome Archive (EGA). Accession number: EGAS00001004006 ("https://ega-archive.org/studies/EGAS00001004006)". Source data and codes for generating the figures in this study are available at https://github.com/yuezhao97/Progression_LUAD_project.
The studies involving human participants were reviewed and approved by the Committee for Ethical Review of Research (Fudan University Shanghai Cancer Center Institutional Review Board No. 090977-1). The patients/participants provided their written informed consent to participate in this study.
HC, LS, ZC, and YuZ designed the study. YuZ, JS, and JG performed data analysis. YuZ, HH, and ZG performed experiments. QZ and YL reviewed pathological slides. YY, TY, FF, CD, ZM, YaZ, DZ, and SZ collected samples. JS and LS helped with quality control of sequencing data. YuZ, JS, and JG drafted the manuscript. All authors contributed to the article and approved the submitted version.
The design of the study and collection, analysis, and interpretation of data and in writing the manuscript were supported by the National Natural Science Foundation of China (81930073), Shanghai Science and Technology Innovation Action Project (20JC1417200), Shanghai Municipal Science and Technology Major Project (2017SHZDZX01 and VBH1323001/026), Shanghai Municipal Key Clinical Specialty Project (SHSLCZDZK02104), Pilot Project of Fudan University (IDF159045), Shanghai Sailing Program (22YF1408900), and Project supported by Shanghai Municipal Science and Technology Major Project (2017SHZDZX01).
The authors declare that the research was conducted in the absence of any commercial or financial relationships that could be construed as a potential conflict of interest.
All claims expressed in this article are solely those of the authors and do not necessarily represent those of their affiliated organizations, or those of the publisher, the editors and the reviewers. Any product that may be evaluated in this article, or claim that may be made by its manufacturer, is not guaranteed or endorsed by the publisher.
The Supplementary Material for this article can be found online at: https://www.frontiersin.org/articles/10.3389/fimmu.2022.921761/full#supplementary-material
Supplementary Figure 1 | Comparison of tumor mutation burden (TMB) for different pathological groups.
Supplementary Figure 2 | Comparison of tumor mutation burden (TMB) for different radiological groups.
Supplementary Figure 3 | Prediction of number of (A) CD8+ T cells, (B) Tregs, and (C) natural killer (NK) cells for different tumor stages.
1. Siegel RL, Miller KD, Jemal A. Cancer Statistics, 2020. CA Cancer J Clin (2020) 70:7–30. doi: 10.3322/caac.21590
2. Maeshima AM, Tochigi N, Yoshida A, Asamura H, Tsuta K, Tsuda H. Histological Scoring for Small Lung Adenocarcinomas 2 Cm or Less in Diameter: A Reliable Prognostic Indicator. J Thorac Oncol (2010) 5:333–9. doi: 10.1097/JTO.0b013e3181c8cb95
3. Borczuk AC, Qian F, Kazeros A, Eleazar J, Assaad A, Sonett JR, et al. Invasive Size is an Independent Predictor of Survival in Pulmonary Adenocarcinoma. Am J Surg Pathol (2009) 33:462–9. doi: 10.1097/PAS.0b013e318190157c
4. Izumchenko E, Chang X, Brait M, Fertig E, Kagohara LT, Bedi A, et al. Targeted Sequencing Reveals Clonal Genetic Changes in the Progression of Early Lung Neoplasms and Paired Circulating DNA. Nat Commun (2015) 6:8258. doi: 10.1038/ncomms9258
5. Murphy SJ, Wigle DA, Lima JF, Harris FR, Johnson SH, Halling G, et al. Genomic Rearrangements Define Lineage Relationships Between Adjacent Lepidic and Invasive Components in Lung Adenocarcinoma. Cancer Res (2014) 74:3157–67. doi: 10.1158/0008-5472.CAN-13-1727
6. Hu X, Fujimoto J, Ying L, Fukuoka J, Ashizawa K, Sun W, et al. Multi-Region Exome Sequencing Reveals Genomic Evolution From Preneoplasia to Lung Adenocarcinoma. Nat Commun (2019) 10:2978. doi: 10.1038/s41467-019-10877-8
7. Dejima H, Hu X, Chen R, Zhang J, Fujimoto J, Parra ER, et al. Immune Evolution From Preneoplasia to Invasive Lung Adenocarcinomas and Underlying Molecular Features. Nat Commun (2021) 12:2722. doi: 10.1038/s41467-021-22890-x
8. Chen H, Carrot-Zhang J, Zhao Y, Hu H, Freeman SS, Yu S, et al. Genomic and Immune Profiling of Pre-Invasive Lung Adenocarcinoma. Nat Commun (2019) 10:5472. doi: 10.1038/s41467-019-13460-3
9. Walter JE, Heuvelmans MA, de Bock GH, Yousaf-Khan U, Groen HJM, van derAalst CM, et al. Characteristics of New Solid Nodules Detected in Incidence Screening Rounds of Low-Dose CT Lung Cancer Screening: The NELSON Study. Thorax (2018) 73:741–7. doi: 10.1136/thoraxjnl-2017-211376
10. Horeweg N, van Rosmalen J, Heuvelmans MA, van derAalst CM, Vliegenthart R, Scholten ET, et al. Lung Cancer Probability in Patients With CT-Detected Pulmonary Nodules: A Prespecified Analysis of Data From the NELSON Trial of Low-Dose CT Screening. Lancet Oncol (2014) 15:1332–41. doi: 10.1016/S1470-2045(14)70389-4
11. McWilliams A, Tammemagi MC, Mayo JR, Roberts H, Liu G, Soghrati K, et al. Probability of Cancer in Pulmonary Nodules Detected on First Screening CT. N Engl J Med (2013) 369:910–9. doi: 10.1056/NEJMoa1214726
12. Fu F, Zhou Y, Zhang Y, Chen H. Lung Cancer Screening Strategy for non-High-Risk Individuals: A Narrative Review. Transl Lung Cancer Res (2021) 10:452–61. doi: 10.21037/tlcr-20-943
13. Hattori A, Matsunaga T, Takamochi K, Oh S, Suzuki K. Prognostic Impact of a Ground Glass Opacity Component in the Clinical T Classification of non-Small Cell Lung Cancer. J Thorac Cardiovasc Surg (2017) 154:2102–10.e2101. doi: 10.1016/j.jtcvs.2017.08.037
14. Hattori A, Suzuki K, Takamochi K, Wakabayashi M, Aokage K, Saji H, et al. Prognostic Impact of a Ground-Glass Opacity Component in Clinical Stage IA non-Small Cell Lung Cancer. J Thorac Cardiovasc Surg (2021) 161:1469–80. doi: 10.1016/j.jtcvs.2020.01.107
15. Ye T, Deng L, Wang S, Xiang J, Zhang Y, Hu H, et al. Lung Adenocarcinomas Manifesting as Radiological Part-Solid Nodules Define a Special Clinical Subtype. J Thorac Oncol (2019) 14:617–27. doi: 10.1016/j.jtho.2018.12.030
16. Fu F, Zhang Y, Wen Z, Zheng D, Gao Z, Han H, et al. Distinct Prognostic Factors in Patients With Stage I Non-Small Cell Lung Cancer With Radiologic Part-Solid or Solid Lesions. J Thorac Oncol (2019) 14:2133–42. doi: 10.1016/j.jtho.2019.08.002
17. Travis WD, Brambilla E, Noguchi M, Nicholson AG, Geisinger KR, Yatabe Y, et al. International Association for the Study of Lung Cancer/American Thoracic Society/European Respiratory Society International Multidisciplinary Classification of Lung Adenocarcinoma. J Thorac Oncol (2011) 6:244–85. doi: 10.1097/JTO.0b013e318206a221
18. Li H. Aligning Sequence Reads, Clone Sequences and Assembly Contigs With BWA-MEM (2013). Available at: https://ui.adsabs.harvard.edu/abs/2013arXiv1303.3997L.
19. DePristo MA, Banks E, Poplin R, Garimella KV, Maguire JR, Hartl C, et al. A Framework for Variation Discovery and Genotyping Using Next-Generation DNA Sequencing Data. Nat Genet (2011) 43:491–8. doi: 10.1038/ng.806
20. Cibulskis K, Lawrence MS, Carter SL, Sivachenko A, Jaffe D, Sougnez C, et al. Sensitive Detection of Somatic Point Mutations in Impure and Heterogeneous Cancer Samples. Nat Biotechnol (2013) 31:213–9. doi: 10.1038/nbt.2514
21. Saunders CT, Wong WSW, Swamy S, Becq J, Murray LJ, Cheetham RK. Strelka: Accurate Somatic Small-Variant Calling From Sequenced Tumor-Normal Sample Pairs. Bioinformatics (2012) 28:1811–7. doi: 10.1093/bioinformatics/bts271
22. Ramos AH, Lichtenstein L, Gupta M, Lawrence MS, Pugh TJ, Saksena G, et al. Oncotator: Cancer Variant Annotation Tool. Hum Mutat (2015) 36:E2423–2429. doi: 10.1002/humu.22771
23. Lawrence MS, Stojanov P, Mermel CH, Robinson JT, Garraway LA, Golub TR, et al. Discovery and Saturation Analysis of Cancer Genes Across 21 Tumour Types. Nature (2014) 505:495–501. doi: 10.1038/nature12912
24. Talevich E, Shain AH, Botton T, Bastian BC. CNVkit: Genome-Wide Copy Number Detection and Visualization From Targeted DNA Sequencing. PloS Comput Biol (2016) 12:e1004873. doi: 10.1371/journal.pcbi.1004873
25. Mermel CH, Schumacher SE, Hill B, Meyerson ML, Beroukhim R, Getz G. GISTIC2.0 Facilitates Sensitive and Confident Localization of the Targets of Focal Somatic Copy-Number Alteration in Human Cancers. Genome Biol (2011) 12:R41. doi: 10.1186/gb-2011-12-4-r41
26. Nilsen G, Liestol K, Van Loo P, Vollan HKM, Eide MB, Rueda OM, et al. Copynumber: Efficient Algorithms for Single- and Multi-Track Copy Number Segmentation. BMC Genomics (2012) 13:591. doi: 10.1186/1471-2164-13-591
27. Dobin A, Davis CA, Schlesinger F, Drenkow J, Zaleski C, Jha S, et al. STAR: Ultrafast Universal RNA-Seq Aligner. Bioinformatics (2013) 29:15–21. doi: 10.1093/bioinformatics/bts635
28. Li B, Dewey CN. RSEM: Accurate Transcript Quantification From RNA-Seq Data With or Without a Reference Genome. BMC Bioinf (2011) 12:323. doi: 10.1186/1471-2105-12-323
29. Bu D, Luo H, Huo P, Wang Z, Zhang S, He Z, et al. KOBAS-I: Intelligent Prioritization and Exploratory Visualization of Biological Functions for Gene Enrichment Analysis. Nucleic Acids Res (2021) 49:W317–25. doi: 10.1093/nar/gkab447
30. Newman AM, Liu CL, Green MR, Gentles AJ, Feng W, Xu Y, et al. Robust Enumeration of Cell Subsets From Tissue Expression Profiles. Nat Methods (2015) 12:453–7. doi: 10.1038/nmeth.3337
31. Travis WD, Brambilla E, Nicholson AG, Yatabe Y, Austin JHM, Beasley MB, et al. The 2015 World Health Organization Classification of Lung Tumors: Impact of Genetic, Clinical and Radiologic Advances Since the 2004 Classification. J Thorac Oncol (2015) 10:1243–60. doi: 10.1097/JTO.0000000000000630
32. Sivakumar S, San Lucas FA, McDowell TL, Lang W, Xu L, Fujimoto J, et al. Genomic Landscape of Atypical Adenomatous Hyperplasia Reveals Divergent Modes to Lung Adenocarcinoma. Cancer Res (2017) 77:6119–30. doi: 10.1158/0008-5472.CAN-17-1605
33. Jiang N, Dai Q, Su X, Fu J, Feng X, Peng J. Role of PI3K/AKT Pathway in Cancer: The Framework of Malignant Behavior. Mol Biol Rep (2020) 47:4587–629. doi: 10.1007/s11033-020-05435-1
34. Dongre A, Weinberg RA. New Insights Into the Mechanisms of Epithelial-Mesenchymal Transition and Implications for Cancer. Nat Rev Mol Cell Biol (2019) 20:69–84. doi: 10.1038/s41580-018-0080-4
35. Zhang Y, Fu F, Chen H. Management of Ground-Glass Opacities in the Lung Cancer Spectrum. Ann Thorac Surg (2020) 110:1796–804. doi: 10.1016/j.athoracsur.2020.04.094
36. Sun F, Xi J, Zhan C, Yang X, Wang L, Shi Y, et al. Ground Glass Opacities: Imaging, Pathology, and Gene Mutations. J Thorac Cardiovasc Surg (2018) 156:808–13. doi: 10.1016/j.jtcvs.2018.02.110
37. Kobayashi Y, Mitsudomi T, Sakao Y, Yatabe Y. Genetic Features of Pulmonary Adenocarcinoma Presenting With Ground-Glass Nodules: The Differences Between Nodules With and Without Growth. Ann Oncol (2015) 26:156–61. doi: 10.1093/annonc/mdu505
38. Lu Q, Ma Y, An Z, Zhao T, Xu Z, Chen H. Epidermal Growth Factor Receptor Mutation Accelerates Radiographic Progression in Lung Adenocarcinoma Presented as a Solitary Ground-Glass Opacity. J Thorac Dis (2018) 10:6030–9. doi: 10.21037/jtd.2018.10.19
39. Li Y, Li X, Li H, Zhao Y, Liu Z, Sun K, et al. Genomic Characterisation of Pulmonary Subsolid Nodules: Mutational Landscape and Radiological Features. Eur Respir J (2020) 55:19014091. doi: 10.1183/13993003.01409-2019
40. Coschi CH, Dick FA. Chromosome Instability and Deregulated Proliferation: An Unavoidable Duo. Cell Mol Life Sci (2012) 69:2009–24. doi: 10.1007/s00018-011-0910-4
41. Endesfelder D, Burrell R, Kanu N, McGranahan N, Howell M, Parker PJ, et al. Chromosomal Instability Selects Gene Copy-Number Variants Encoding Core Regulators of Proliferation in ER+ Breast Cancer. Cancer Res (2014) 74:4853–63. doi: 10.1158/0008-5472.CAN-13-2664
42. Watkins TBK, Lim EL, Petkovic M, Elizalde S, Birkbak NJ, Wilson GA, et al. Pervasive Chromosomal Instability and Karyotype Order in Tumour Evolution. Nature (2020) 587:126–32. doi: 10.1038/s41586-020-2698-6
43. Rosenthal R, Cadieux EL, Salgado R, Al Bakir M, Moore DA, Hiley CT, et al. Neoantigen-Directed Immune Escape in Lung Cancer Evolution. Nature (2019) 567:479–85. doi: 10.1038/s41586-019-1032-7
44. Pitt JM, Marabelle A, Eggermont A, Soria JC, Kroemer G, Zitvogel L. Targeting the Tumor Microenvironment: Removing Obstruction to Anticancer Immune Responses and Immunotherapy. Ann Oncol (2016) 27:1482–92. doi: 10.1093/annonc/mdw168
45. Pepe F, Pisapia P, Gristina V, Rocco D, Micheli M, Micheli P, et al. Tumor Mutational Burden on Cytological Samples: A Pilot Study. Cancer Cytopathol (2021) 129:460–7. doi: 10.1002/cncy.22400
46. Pisapia P, Pepe F, Iaccarino A, Sgariglia R, Nacchio M, Conticelli F, et al. Next Generation Sequencing in Cytopathology: Focus on Non-Small Cell Lung Cancer. Front Med (Lausanne) (2021) 11:633923. doi: 10.3389/fmed.2021.633923
Keywords: imbalance, tumor intrinsic growth potential, immune response, progression, lung adenocarcinoma
Citation: Zhao Y, Shang J, Gao J, Han H, Gao Z, Yan Y, Zheng Q, Ye T, Fu F, Deng C, Ma Z, Zhang Y, Zheng D, Zheng S, Li Y, Cao Z, Shi L and Chen H (2022) Increased Tumor Intrinsic Growth Potential and Decreased Immune Function Orchestrate the Progression of Lung Adenocarcinoma. Front. Immunol. 13:921761. doi: 10.3389/fimmu.2022.921761
Received: 16 April 2022; Accepted: 01 June 2022;
Published: 01 July 2022.
Edited by:
Yubin Li, University of Pennsylvania, United StatesCopyright © 2022 Zhao, Shang, Gao, Han, Gao, Yan, Zheng, Ye, Fu, Deng, Ma, Zhang, Zheng, Zheng, Li, Cao, Shi and Chen. This is an open-access article distributed under the terms of the Creative Commons Attribution License (CC BY). The use, distribution or reproduction in other forums is permitted, provided the original author(s) and the copyright owner(s) are credited and that the original publication in this journal is cited, in accordance with accepted academic practice. No use, distribution or reproduction is permitted which does not comply with these terms.
*Correspondence: Haiquan Chen, aHFjaGVuMUB5YWhvby5jb20=; Leming Shi, bGVtaW5nc2hpQGZ1ZGFuLmVkdS5jbg==; Zhiwei Cao, endjYW9AZnVkYW4uZWR1LmNu
†These authors have contributed equally to this work and share first authorship
‡These authors have contributed equally to this work
Disclaimer: All claims expressed in this article are solely those of the authors and do not necessarily represent those of their affiliated organizations, or those of the publisher, the editors and the reviewers. Any product that may be evaluated in this article or claim that may be made by its manufacturer is not guaranteed or endorsed by the publisher.
Research integrity at Frontiers
Learn more about the work of our research integrity team to safeguard the quality of each article we publish.