 Zhen Ye1,2†
 Yong-chun Cui
95% of researchers rate our articles as excellent or good
Learn more about the work of our research integrity team to safeguard the quality of each article we publish.
Find out more
ORIGINAL RESEARCH article
Front. Immunol. , 18 May 2022
Sec. Viral Immunology
Volume 13 - 2022 | https://doi.org/10.3389/fimmu.2022.905921
This article is part of the Research Topic Antiviral Innate Immune Sensing, Regulation, and Viral Immune Evasion View all 48 articles
Atherosclerosis (AS), a chronic inflammatory disease of the blood vessels, is the primary cause of cardiovascular disease, the leading cause of death worldwide. This study aimed to identify possible diagnostic markers for AS and determine their correlation with the infiltration of immune cells in AS. In total, 10 serum samples from AS patients and 10 samples from healthy subjects were collected. The original gene expression profiles of GSE43292 and GSE57691 were downloaded from the Gene Expression Omnibus database. Least absolute shrinkage and selection operator regression model and support vector machine recursive feature elimination analyses were carried out to identify candidate markers. The diagnostic values of the identified biomarkers were determined using receiver operating characteristic assays. The compositional patterns of the 22 types of immune cell fraction in AS were estimated using CIBERSORT. RT-PCR was performed to further determine the expression of the critical genes. This study identified 17 differentially expressed genes (DEGs) in AS samples. The identified DEGs were mainly involved in non-small cell lung carcinoma, pulmonary fibrosis, polycystic ovary syndrome, glucose intolerance, and T-cell leukemia. FHL5, IBSP, and SCRG1 have been identified as the diagnostic genes in AS. The expression of SCRG1 and FHL5 was distinctly downregulated in AS samples, and the expression of IBSP was distinctly upregulated in AS samples, which was further confirmed using our cohort by RT-PCR. Moreover, immune assays revealed that FHL5, IBSP, and SCRG1 were associated with several immune cells, such as CD8 T cells, naïve B cells, macrophage M0, activated memory CD4 T cells, and activated NK cells. Overall, future investigations into the occurrence and molecular mechanisms of AS may benefit from using the genes FHL5, IBSP, and SCRG1 as diagnostic markers for the condition.
Atherosclerosis (AS) is a cardiovascular disease caused by the thickening and hardening of arterial walls due to the accumulation of cells, cholesterol, and extracellular matrix (1, 2). Epidemiological research has indicated that hypertension, smoking, diabetes mellitus, and hypercholesterolemia are the main dangerous elements for AS and associated illness processes (3, 4). Besides this, according to laboratory and clinical data results, the combined impacts of aging and inflammation result in a high occurrence rate of AS (5). Though a great improvement in its treatment has been made, the danger of co-morbidities in AS is still serious (6, 7). AS is a chronic and complicated course involving many cells and molecular alterations. Furthermore, it is estimated that approximately 50% of the risk for atherosclerosis is genetically determined (8, 9). Therefore, the diagnosis of AS requires more novel biomarkers and forecasting models to be authenticated.
Data mining has been applied in many fields, containing sequence analysis, microarray gene expression, single-nucleotide polymorphism inspection as well as the analysis of genomic loss and amplification (copy number variation) (10, 11). With the help of microarrays, integration bioinformatics makes scholars confirm distinctively expressed targeted genes soon between AS specimens in one test (12, 13). AS diagnostic markers could be derived from aberrantly expressed genes. TP53, MAPK1, STAT3, HMOX1, and PTGS2 have been identified to be the underlying diagnostic biomarkers for AS according to the identification of a gene expression profile analysis (14, 15). Preclinical AS may be diagnosed using intercellular adhesion molecule-1 (16, 17). At the same time, diagnostic values will be increased by a large margin if many biomarkers are combined in one model.
In this study, the GSE43292 and GSE57691 datasets published by Bricca et al. and Erik et al. were reanalyzed (18, 19). We screened the abnormally expressed genes in AS samples from big data analysis. Machine learning algorithms were applied to screen and confirm the diagnostic biomarkers for AS. In this paper, CIBERSORT was first applied to quantify the immune cells of specimens of AS and normal tissues based on the gene expression profile. We also looked into the interaction between the detected biomarkers and the infiltrating immune cells to provide the groundwork for future studies.
The study downloaded the original gene expression profiles GSE43292 and GSE57691 from the Gene Expression Omnibus (GEO) database (https://www.ncbi.nlm.nih.gov/geo/). In total, 32 non-AS and 32 AS arterial samples were included in the GSE43292 dataset. The GSE57691 dataset included 10 non-AS and 9 AS arterial specimens.
A total of 20 patients from the Suqian First Hospital, with admission dates from 2020 to 2022 were registered and separated into the AS group (n = 10) and the control group (n = 10). Blood specimens from the two groups were gathered through venipuncture, and the serum was obtained through centrifugation at 1,500g under 4°C and then reserved under −80°C for further use. The study protocol was authorized by the clinical study ethics committee of the Suqian First Hospital. Every method used was according to the related guidelines and regulations. Every participant has signed an informed consent form.
Using the combat function of the SVA package, GSE43292 and GSE57691 were combined into a metadata cohort, and batch effects were removed. Comparing the AS arterial samples with the non-AS arterial samples, the “limma” package was applied for the identification of differentially expressed genes (DEGs) with threshold of |fold change (FC)| >1.2 and P-value <0.01.
The “ClusterProfiler” package of R software was applied in function gathering analysis, and there were significant (q-values less than 0.01) biological processes and Kyoto Encyclopedia of Genes and Genomes (KEGG) pathways used in this study (20). Disease Ontology (DO) gathering analysis was operated on DEGs with the “clusterProfiler” and DOSE packages of R.
Support vector machine recursive feature elimination (SVM-RFE) and least absolute shrinkage and selection operator (LASSO) were employed to classify the diagnostic indicators of AS. The “Glmnet” package was employed to analyze the binomial response type and 1 alpha value. In addition, as a supervised machine learning means to support vectors, the SVM explores the optimal variables by clearing the character vectors produced by the SVM. The SVM sorter of R package e1071 was used in the classification analysis of the selective markers for AS diagnosis; k = 5 was set for k-fold cross-validation. The halving parameter mentioned above was set as 100.
Gene expression matrix information was uploaded to CIBERSORT (https://cibersort.stanford.edu/) to assess the enrichment of immune invasions, and we got the immune cell infiltrate matrix. Next, the “corrplot” package was used to make a correlation heat map to see the pertinence of 22 kinds of infiltrated immune cells.
The relationship of the confirmed genes to the standards of infiltrated immune cells was found with Spearman’s rank analysis using R software. The consequent relationships were seen by chart technology using the “ggplot2” package (21).
Total RNA was separated with TRIZOL reagent based on the protocol from the manufacturer (Invitrogen). The RNA was reverse-transcribed with SuperScript First Strand cDNA System (Invitrogen) based on the instructions from the manufacturer. SYBR Green RT-PCR Master Mix and 1.0 μl of cDNA were used in the PCR amplification using Applied Biosystems 7900HT (Applied Biosystems, Takara). The results were gathered and studied by SDS2.3 Software (Applied Biosystems). The expression standard of every candidate gene was the internal standard compared with that of GAPDH. This relative quantitative data was conveyed using the 2-ΔΔCt method. Every test was repeated 3 times. The primers are shown in Supplementary Table S1.
Statistical analyses were performed with R software v3.5.0 (R Core Team, MA, USA) and GraphPad Prism v7.00 (GraphPad Software Inc., La Jolla, CA, USA). R’ “glmnet” package was used to finish the LASSO regression analysis, while the e1071 package ran the SVM algorithm. The significance of distinction in the two groups was calculated with Student’s t-test. All P <0.05 were regarded as statistically evident.
To screen the dysregulated genes in AS, we analyzed the GSE43292 and GSE57691 datasets using the “limma” package in R software. Through a volcano plot and a hierarchical cluster, we identified a total of 17 DEGs (fold change >1.2), among which 7 (FHL5, CASQ2, SCRG1, CNTN1, TPH1, CNTN4, and CNN1) were downregulated and 10 (TM4SF19, IGJ, CD36, DPP4, HMOX1, FABP4, IBSP, MMP7, MMP9, and MMP12) were upregulated (Figures 1A, B).
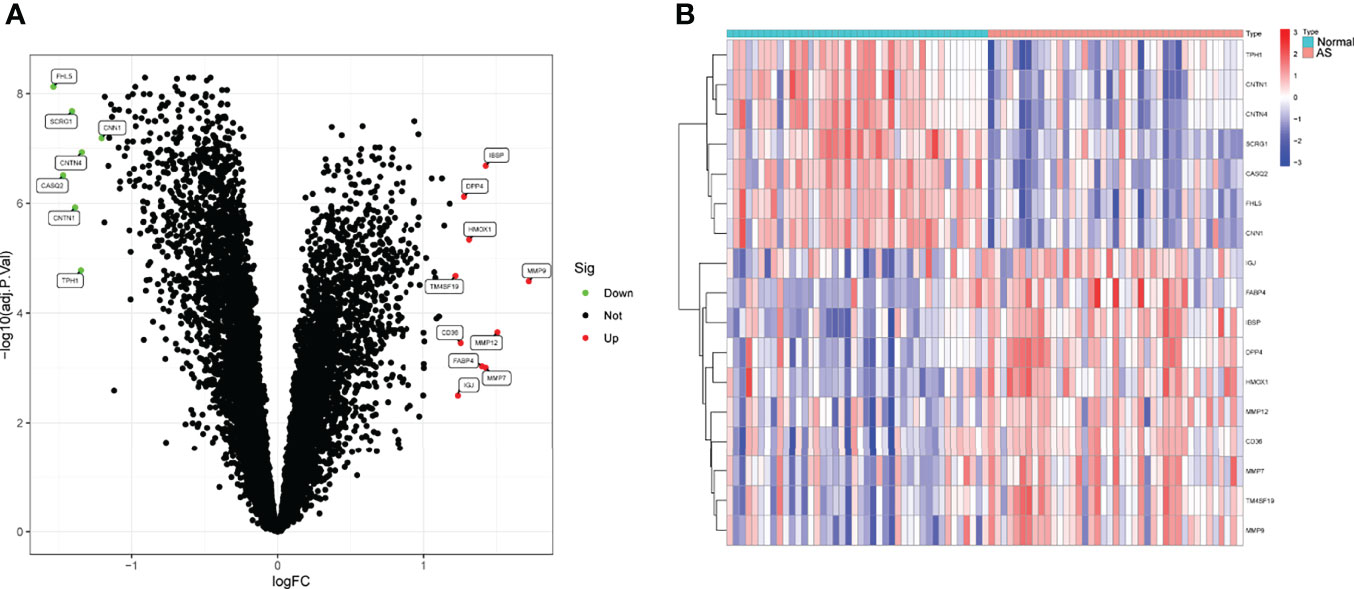
Figure 1 Differentially expressed genes (DEGs) between AS samples and control samples. (A) Volcanic map. Colored dots indicate genes that have been up- or downregulated, respectively. (B) Heat map of the DEGs.
We performed a functional correlation analysis to determine the features of the above-mentioned 17 DEGs in life activity. The consequences of the GO analysis showed that the 17 DEGs might be mainly abundant in the extracellular matrix organization, extracellular structure organization, external encapsulating structural organization, membrane raft, membrane microdomain, caveola, endopeptidase activity, serine-type endopeptidase as well as metalloendopeptidase activity (Figure 2A). The KEGG assays indicated that the 17 DEGs were mainly enriched in the PPAR signaling pathway (Figure 2B). The DO pathway enrichment analyses showed that diseases enriched by DEGs were mainly associated with non-small cell lung carcinoma, pulmonary fibrosis, polycystic ovary syndrome, glucose intolerance, and T-cell leukemia (Figure 2C).
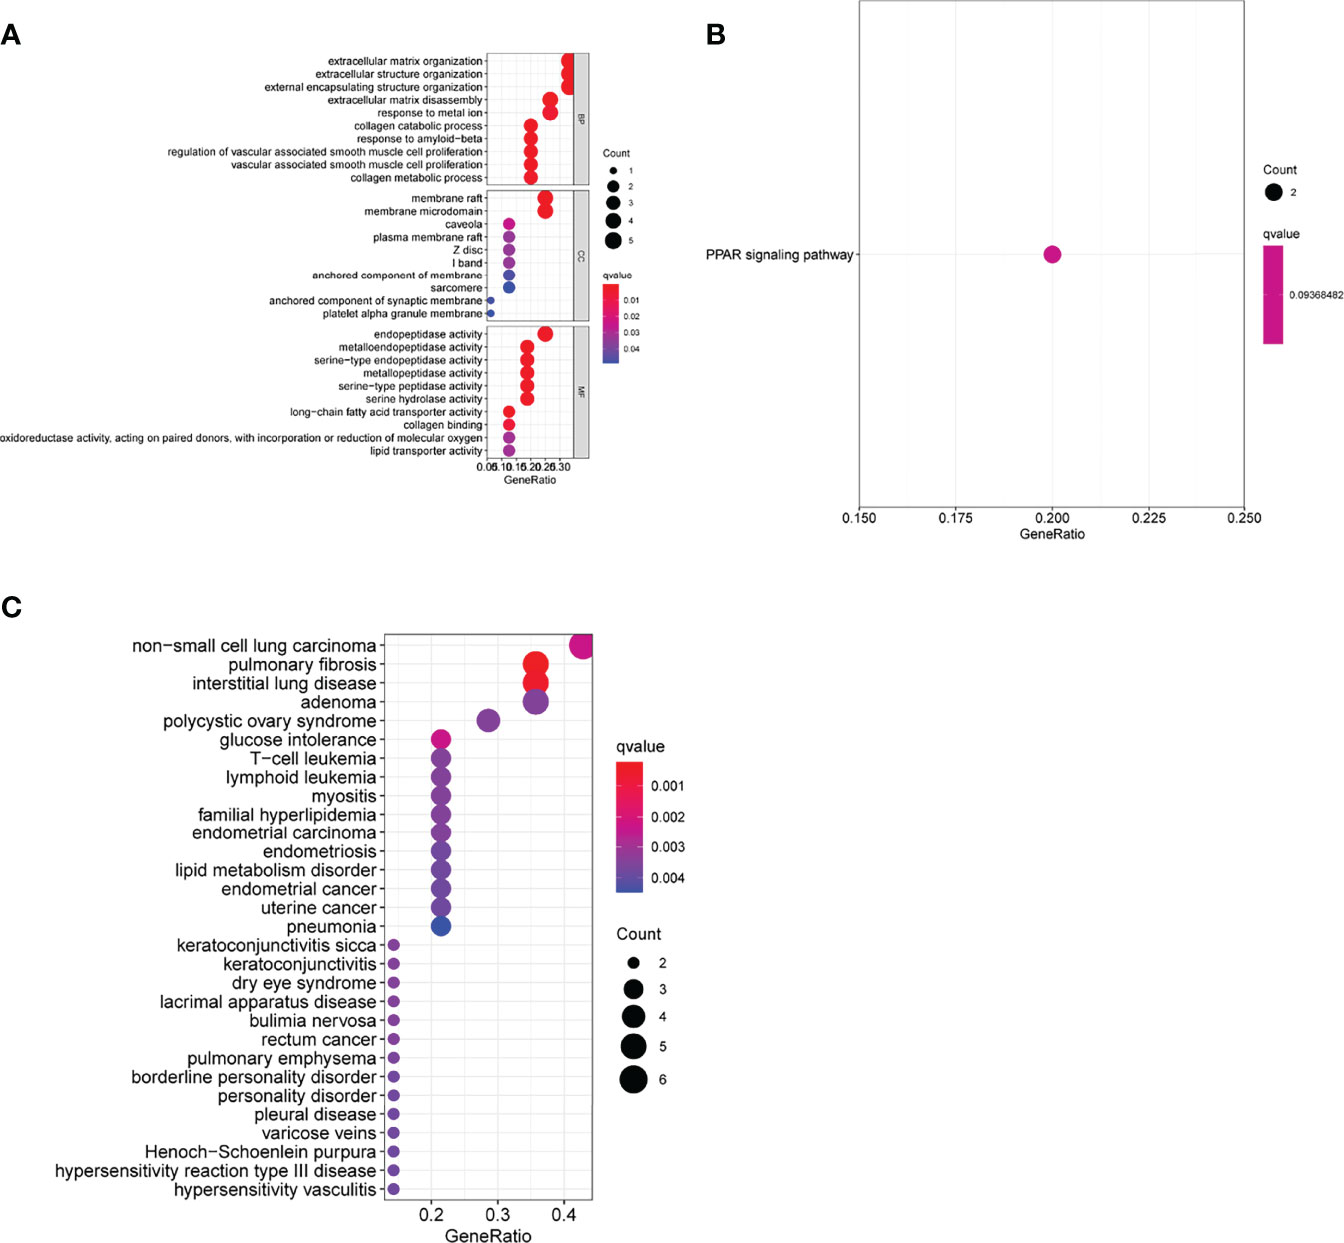
Figure 2 Function enrichment analyses of differentially expressed genes (DEGs). (A) Gene Ontology enrichment for DEGs. (B) Kyoto Encyclopedia of Genes and Genomes pathways enrichment for DEGs. (C) Enrichment study of genes differentially expressed between atherosclerosis and healthy samples using the disease ontology.
Two distinct algorithms were applied to filter underlying markers. The DEGs were decreased with the LASSO regression algorithm, which confirmed five genes to be diagnostic biomarkers of AS (Figure 3A). Apart from the five characters in the DEGs that were decided with the SVM-RFE algorithm (Figure 3B), 3 overlapping characters (FHL5, IBSP, and SCRG1) in the 2 algorithms were finally chosen (Figure 3C).
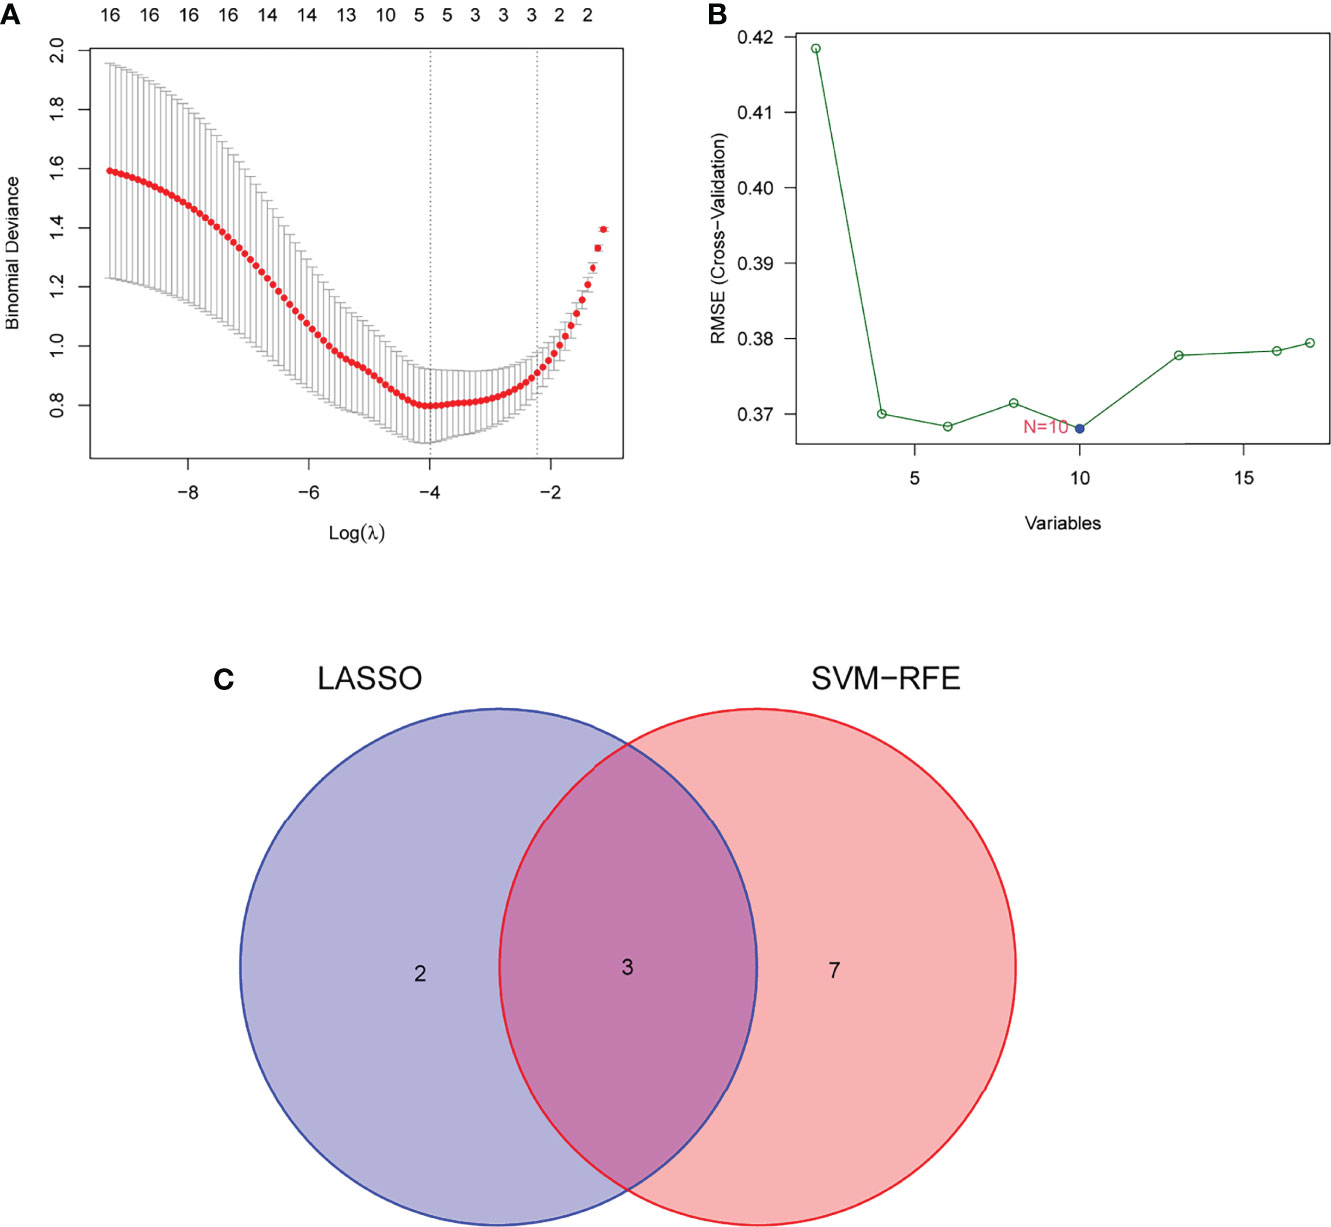
Figure 3 Filtering course in diagnostic candidates in atherosclerosis. (A) Tuning character option in the least unconditional shrinkage and option operator model. (B) A plot of biomarker option by support vector machine recursive feature elimination (SVM-RFE) algorithm. (C) The least unconditional shrinkage, option operator, and SVM-RFE algorithms all share a Venn diagram to provide three diagnostic indicators.
We observed that SCRG1 and FHL5 decreased in AS samples compared with those in control samples (Figures 4A, B), while IBSP expression was distinctly increased in AS samples (Figure 4C). In addition, according to the ROC assays, the low SCRG1 conveyed had an AUC result of 0.870 (95% CI: 0.789 to 0.940) in AS (Figure 5A), and the low FHL5 expression had an AUC result of 0.897 (95% CI: 0.821 to 0.954) in AS (Figure 5B). However, the high IBSP expression had an AUC result of 0.840 (95% CI: 0.746 to 0.914) in AS (Figure 5C). Our findings suggested that FHL5, IBSP, and SCRG1 had a high diagnostic ability.
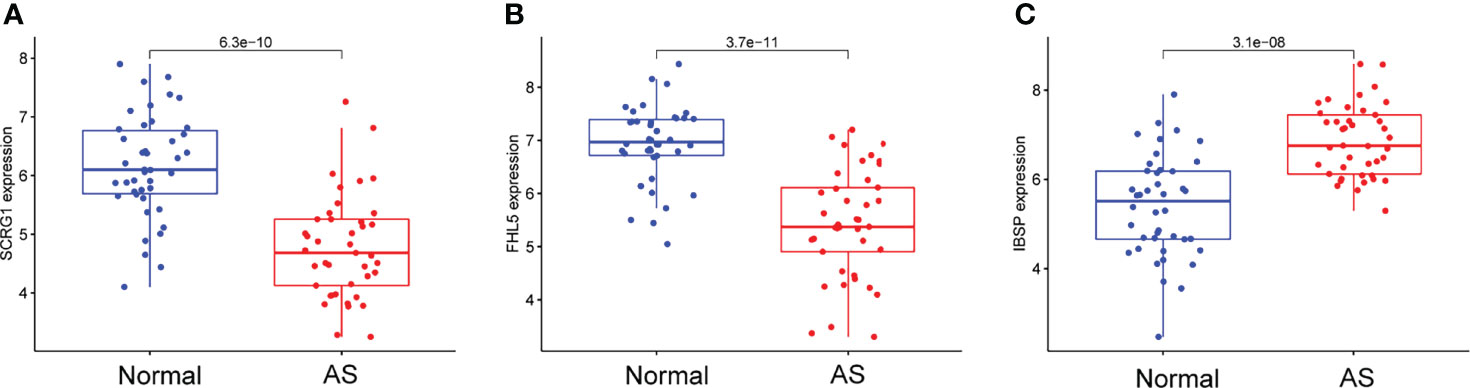
Figure 4 Expression of (A) SCRG1, (B) FHL5, and (C) IBSP, respectively, in atherosclerosis samples and healthy samples from GSE43292 and GSE57691 datasets.
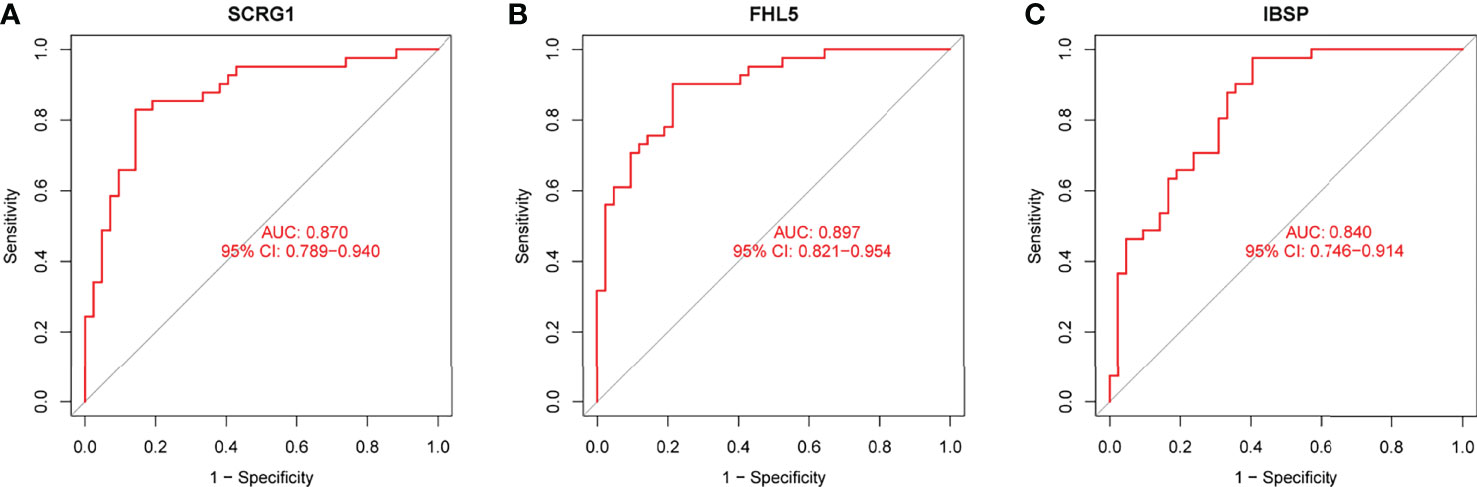
Figure 5 Receiver operating characteristic curve of the diagnostic validity of (A) SCRG1, (B) FHL5, and (C) IBSP, respectively.
To deeply identify the pertinence in FHL5, IBSP, SCRG1, and the immune microenvironment, the ratio of immune cell infiltration was studied with the CIBERSORT algorithm, and 21 types of immune cell profiling of AS persons were accomplished (Figures 6A–C). In addition, it has clear pertinence in FHL5 expression and the ratio in nine types of tumor-infiltrating immune cells (TICs), including CD8 T cells, regulatory T cells (Tregs), naïve B cells, excited NK cells, excited dendritic cells, memory B cells, plasma cells, activated memory CD4 T cells, and macrophage M0 (Figure 7A and Supplementary Figure S1). It has clear pertinence in IBSP expressions and the ratio in macrophage M0, activated memory CD4 T cells, neutrophils, memory B cells, monocytes, Tregs, naïve B cells, excited NK cells, and CD8 T cells (Figure 7B and Supplementary Figure S2). In addition, SCRG1 expression was distinctly associated with excited NK cells, CD8 T cells, resting dendritic cells, naïve B cells, macrophage M2, excited memory CD4 T cells, plasma cells, and macrophage M0 (Figure 7C and Supplementary Figure S3). These results further support the effect of FHL5, IBSP, and SCRG1 on the immune activity of the immune microenvironment.
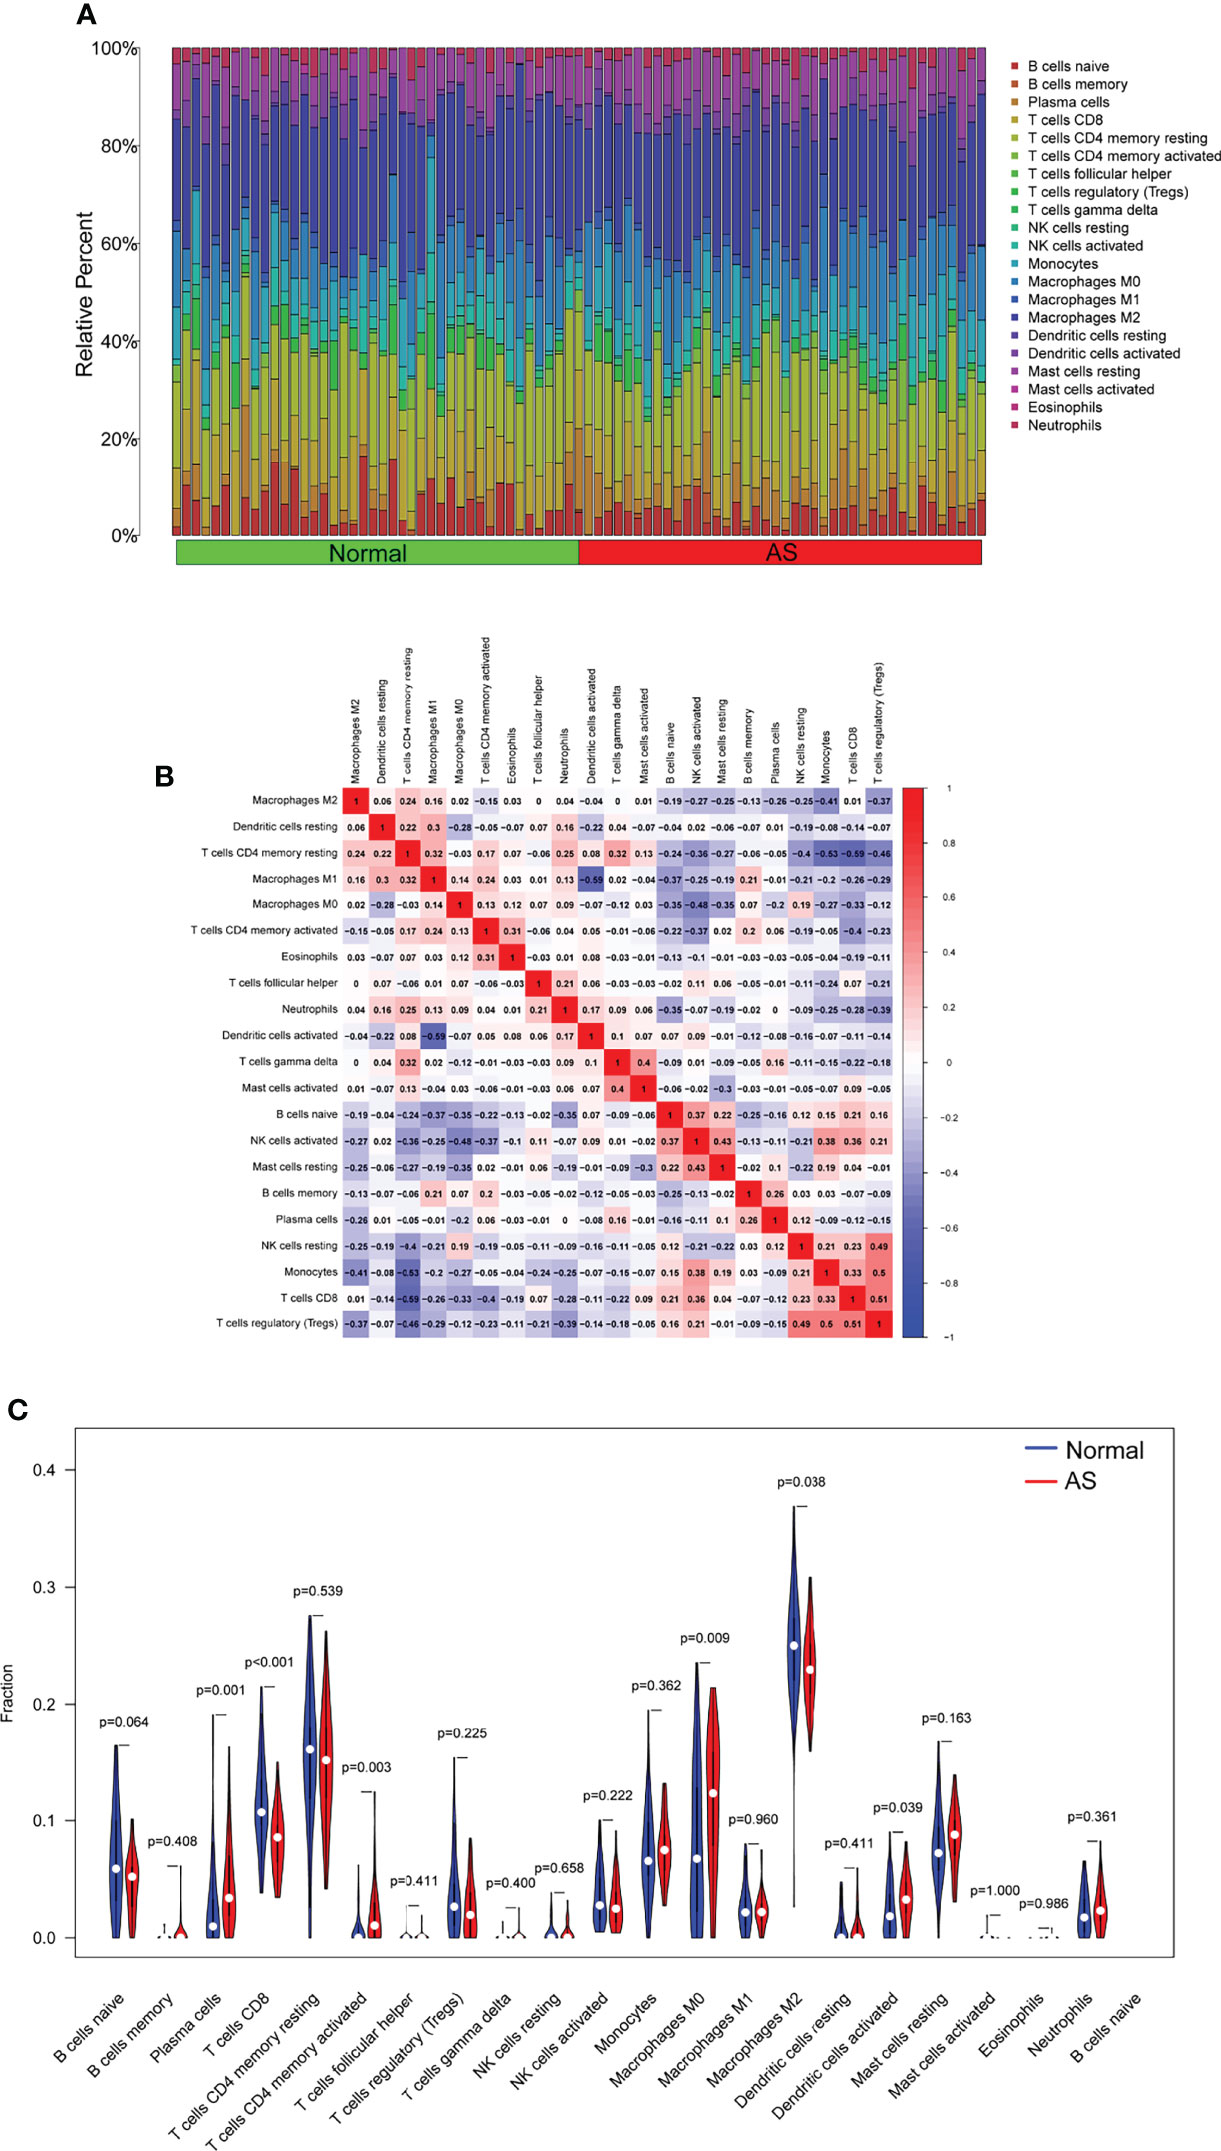
Figure 6 Profile of infiltrating immune cells. (A) The ratio of 22 different infiltrating immune cells in atherosclerosis (AS) samples is shown graphically in a bar plot. Column names, sample ID. (B) Heat map showing the relationship between 22 different types of infiltrating immune cells. (C) Violin plot displaying the variation among 22 types of infiltrating immune cells between AS specimens and healthy samples.
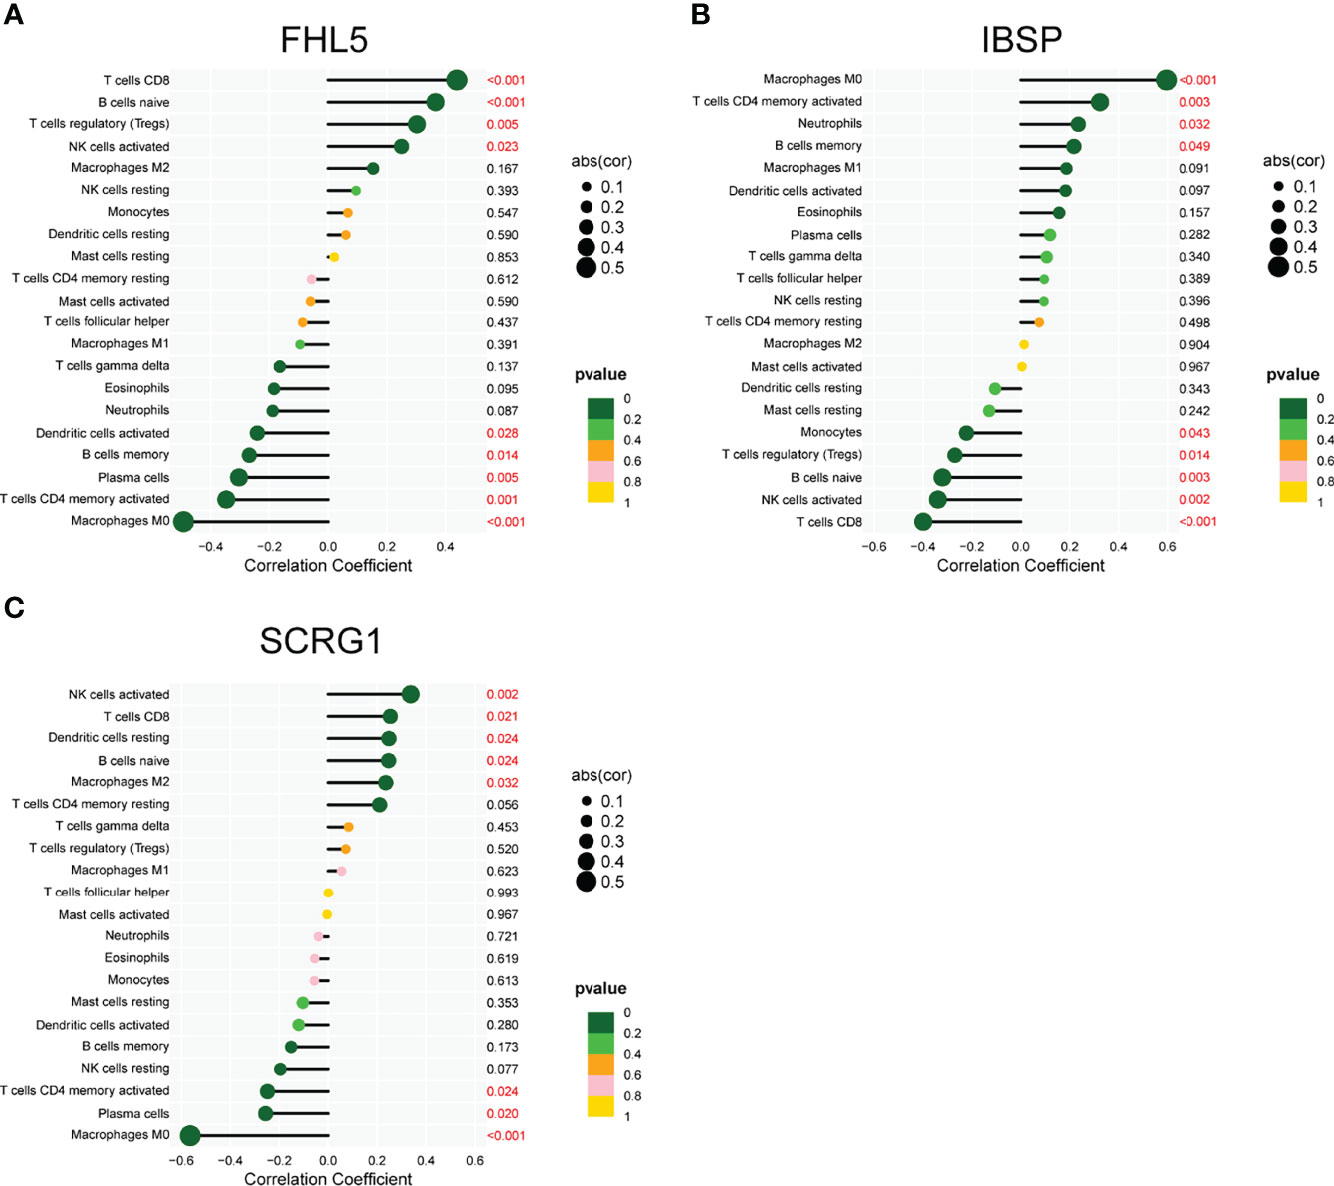
Figure 7 Pertinence between FHL5 (A), IBSP (B), SCRG1 (C), and immune cells of atherosclerosis.
To further demonstrate the expression of FHL5, IBSP, and SCRG1 in AS patients, we performed RT-PCR in 10 serum samples from AS patients and 10 healthy samples. The results showed that SCRG1 and FHL5 decreased in AS samples compared with those in healthy samples (Figures 8A, B), while IBSP expression was distinctly increased in AS samples compared with that in healthy samples (Figure 8C).
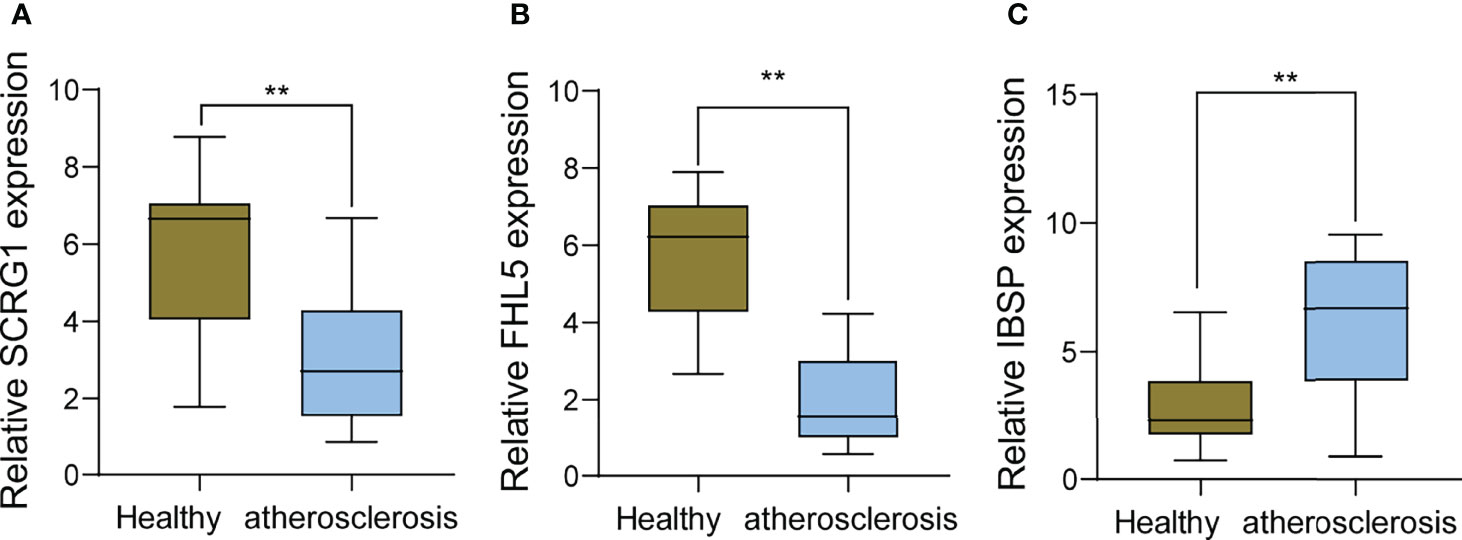
Figure 8 RT-PCR for the expression of (A) SCRG1, (B) FHL5, and (C) IBSP, respectively, in atherosclerosis specimens and healthy samples. **p < 0.01.
The number of people with atheroma plaque among 30–70-year-olds worldwide was 57.79 million in 2020, an increase of 59.13% compared with that in 2000 (1, 22). Nevertheless, effective therapy was rare, so it is urgent to identify the genes that result in the development of AS and explore possible efficient treatment targets.
The potential reason for cardiovascular incidents is AS, a chronic inflammatory illness. Accurately diagnosing and treating cardiovascular illnesses necessitated research into the probable processes of AS at the cellular level (23, 24). Because microarrays and high-throughput sequencing have supplied thousands of different gene expression data types, it has become increasingly popular to anticipate prospective treatment targets for atherosclerosis (25, 26). This study retrospectively analyzed data from 42 non-AS arterial and 41 AS arterial samples from two GEO datasets (GSE43292 and GSE57691). We identified 17 abnormally expressed genes between healthy and atherosclerotic tissues. Then, we performed KEGG assays which indicated that the above-mentioned 17 genes might be primarily enriched in the PPAR signaling pathway, which has been reported to be related to the regulation of cardiovascular illnesses (27, 28). The DO assays showed that the above-mentioned 17 genes might be primarily associated with fibrosis, familial hyperlipidemia, lipid metabolism disorder, and several cancers. Our findings suggested that the 17 abnormally expressed genes may be involved in the progression of AS.
SVM-RFE is favorable to small-specimen-size datasets. SVM-RFE also removes spare elements and keeps just the results of the involved variables (29). LASSO regression analysis is always used to screen variables to stop overfitting (30). This study used the above-mentioned two machine learning algorithms to screen possible diagnostic biomarkers for AS, and three genes were identified, including FHL5, IBSP, and SCRG1. Previously, several studies have reported that FHL5, IBSP, and SCRG1 were involved in the progression of several diseases (31–33). However, their effects on AS progression were largely indistinct. In this paper, we first put forward evidence that the expression of FHL5 and SCRG1, respectively, were distinctly decreased in AS samples compared with those in control samples, while IBSP exhibited an increased level in AS samples for the first time. The ROC assays further confirmed their diagnostic value in distinguishing AS from the healthy samples. Our findings highlighted the potential of FHL5, IBSP, and SCRG1 to be used as novel biomarkers for AS patients.
Cells of inborn and adapted immune systems consist of atherosclerotic lesions (34). Infiltrating immune cells have recently been characterized in mouse and human atherosclerosis and revealed activated, cytotoxic, and possibly dysfunctional and exhausted cell phenotypes (35, 36). The chronic accumulation of vascular occlusion plaques in the subendothelial intimal layer of large and medium arteries leads to significant stenosis that restricts blood flow and causes critical tissue hypoxia (37, 38). The autoimmune reply is determinable in human and animal models of AS. While the typical percept is that autoimmunity can be pathogenic per se, the present proof indicates that ApoB-specific CD4+ T-helper cells have already been determined among subjects without clinical atherosclerosis and with atheroprotective characters mostly. In the paper, it was indicated that FHL5 expression was distinctly related to nine types of TICs, including CD8 T cells, regulatory T cells (Tregs), naïve B cells, activated NK cells, excited dendritic cells, memory B cells, plasma cells, activated memory CD4 T cells, and macrophage M0. IBSP expression was distinctly associated with macrophage M0, activated memory CD4 T cells, neutrophils, memory B cells, monocytes, regulatory T cells (Tregs), naïve B cells, excited NK cells, and CD8 T cells. Moreover, SCRG1 expression was distinctly associated with excited NK cells, CD8 T cells, resting dendritic cells, naïve B cells, macrophage M2, excited memory CD4 T cells, plasma cells, and macrophage M0. Our findings suggested that FHL5, IBSP, and SCRG1 may influence AS progression via regulating the activity of the immune system.
Although our findings support that FHL5, IBSP, and SCRG1 have a high clinical application potential, the study faces some limitations. AS samples were limited in this study, and further demonstration by future studies is necessary. Furthermore, particular biological functions in three genes of AS progression are required to be explored experimentally. Moreover, the potential functions of FHL5, IBSP, and SCRG1 on the immune system need to be further studied.
Our study identified three diagnostic genes, including FHL5, IBSP, and SCRG1. Drugs targeting FHL5, IBSP, and SCRG1 could be potential immunotherapy for AS patients in the future. Nevertheless, other independent cohorts and functional tests for FHL5, IBSP, and SCRG1 are warranted.
The datasets presented in this study can be found in online repositories. The name of the repository and the accession numbers can be found below:
https://www.ncbi.nlm.nih.gov/, GSE43292
https://www.ncbi.nlm.nih.gov/, GSE57691
The studies involving human participants were reviewed and approved by Suqian First Hospital. The patients/participants provided their written informed consent to participate in this study.
YC conceived and designed the study. ZY, XW, and YL provided equal contributions to the research design, data analysis, and article writing. XW revised the manuscript. All authors contributed to the article and approved the submitted version.
This study was supported by the National Natural Science Foundation of China (81970387 and 81200213 to YC), Natural Science Foundation of Beijing (7172181 to YC), and Natural Science Foundation of Suqian (K201918 to ZY).
The authors declare that the research was conducted in the absence of any commercial or financial relationships that could be construed as a potential conflict of interest.
All claims expressed in this article are solely those of the authors and do not necessarily represent those of their affiliated organizations, or those of the publisher, the editors and the reviewers. Any product that may be evaluated in this article, or claim that may be made by its manufacturer, is not guaranteed or endorsed by the publisher.
The Supplementary Material for this article can be found online at: https://www.frontiersin.org/articles/10.3389/fimmu.2022.905921/full#supplementary-material
Supplementary Figure 1 | Nine different types of infiltrating immune cells were linked to FHL5 expression in a scatter plot.
Supplementary Figure 2 | Nine different types of infiltrating immune cells were linked to IBS expression in a scatter plot.
Supplementary Figure 3 | Eight different types of infiltrating immune cells were linked to SCRG1 expression in a scatter plot.
1. Libby P. The Changing Landscape of Atherosclerosis. Nature (2021) 592:524–33. doi: 10.1038/s41586-021-03392-8
2. Libby P, Ridker PM, Hansson GK. Progress and Challenges in Translating the Biology of Atherosclerosis. Nature (2011) 473:317–25. doi: 10.1038/nature10146
3. Schaftenaar F, Frodermann V, Kuiper J, Lutgens E. Atherosclerosis: The Interplay Between Lipids and Immune Cells. Curr Opin Lipidol (2016) 27:209–15. doi: 10.1097/MOL.0000000000000302
4. Frostegård J. Immunity, Atherosclerosis and Cardiovascular Disease. BMC Med (2013) 11:117. doi: 10.1186/1741-7015-11-117
5. Williams JW, Winkels H, Durant CP, Zaitsev K, Ghosheh Y, Ley K. Single Cell RNA Sequencing in Atherosclerosis Research. Circ Res (2020) 126:1112–26. doi: 10.1161/CIRCRESAHA.119.315940
6. Tedgui A, Mallat Z. Cytokines in Atherosclerosis: Pathogenic and Regulatory Pathways. Physiol Rev (2006) 86:515–81. doi: 10.1152/physrev.00024.2005
7. Lechner K, von Schacky C, McKenzie AL, Worm N, Nixdorff U, Lechner B, et al. Lifestyle Factors and High-Risk Atherosclerosis: Pathways and Mechanisms Beyond Traditional Risk Factors. Eur J Prev Cardiol (2020) 27:394–406. doi: 10.1177/2047487319869400
8. Katsiki N, Mantzoros C, Mikhailidis DP. Adiponectin, Lipids and Atherosclerosis. Curr Opin Lipidol (2017) 28:347–54. doi: 10.1097/MOL.0000000000000431
9. Barrington WT, Lusis AJ. Atherosclerosis: Association Between the Gut Microbiome and Atherosclerosis, Nature Reviews. Cardiology (2017) 14:699–700. doi: 10.1038/nrcardio.2017.169
10. Sun W, Cai Z, Li Y, Liu F, Fang S, Wang G. Data Processing and Text Mining Technologies on Electronic Medical Records: A Review. J Healthc Eng (2018) 2018:4302425. doi: 10.1155/2018/4302425
11. Alonso SG, de la Torre-Díez I, Hamrioui S, López-Coronado M, Barreno DC, Nozaleda LM, et al. Data Mining Algorithms and Techniques in Mental Health: A Systematic Review. J Med Syst (2018) 42:161. doi: 10.1007/s10916-018-1018-2
12. Su W, Zhao Y, Wei Y, Zhang X, Ji J, Yang S. Exploring the Pathogenesis of Psoriasis Complicated With Atherosclerosis via Microarray Data Analysis. Front Immunol (2021) 12:667690. doi: 10.3389/fimmu.2021.667690
13. Zhu F, Zuo L, Hu R, Wang J, Yang Z, Qi X, et al. A Ten-Genes-Based Diagnostic Signature for Atherosclerosis. BMC Cardiovasc Disord (2021) 21:513. doi: 10.1186/s12872-021-02323-9
14. Huang T, Wang K, Li Y, Ye Y, Chen Y, Wang J, et al. Construction of a Novel Ferroptosis-Related Gene Signature of Atherosclerosis. Front Cell Dev Biol (2021) 9:800833. doi: 10.3389/fcell.2021.800833
15. Chen Q, Lv J, Yang W, Xu B, Wang Z, Yu Z, et al. Targeted Inhibition of STAT3 as a Potential Treatment Strategy for Atherosclerosis. Theranostics (2019) 9:6424–42. doi: 10.7150/thno.35528
16. Preiss DJ, Sattar N. Vascular Cell Adhesion Molecule-1: A Viable Therapeutic Target for Atherosclerosis? Int J Clin Pract (2007) 61:697–701. doi: 10.1111/j.1742-1241.2007.01330.x
17. Sasikala T, Manohar SM, Bitla ARR, Sarala S, Vaikkakara S. Intercellular Adhesion Molecule-1 is a Surrogate Biomarker for Subclinical Atherosclerosis in Type 2 Diabetes Mellitus. Biomarkers Med (2021) 15:121–32. doi: 10.2217/bmm-2020-0428
18. Ayari H, Bricca G. Identification of Two Genes Potentially Associated in Iron-Heme Homeostasis in Human Carotid Plaque Using Microarray Analysis. J Biosci (2013) 38:311–5. doi: 10.1007/s12038-013-9310-2
19. Biros E, Gäbel G, Moran CS, Schreurs C, Lindeman JH, Walker PJ, et al. Differential Gene Expression in Human Abdominal Aortic Aneurysm and Aortic Occlusive Disease. Oncotarget (2015) 6:12984–96. doi: 10.18632/oncotarget.3848
20. Wu T, Hu E, Xu S, Chen M, Guo P, Dai Z, et al. Clusterprofiler 4.0: A Universal Enrichment Tool for Interpreting Omics Data. Innovation (New York N.Y.) (2021) 2:100141. doi: 10.1016/j.xinn.2021.100141
21. Ito K, Murphy D. Application of Ggplot2 to Pharmacometric Graphics. CPT: Pharmacometrics Syst Pharmacol (2013) 2:e79. doi: 10.1038/psp.2013.56
22. Bentzon JF, Otsuka F, Virmani R, Falk E. Mechanisms of Plaque Formation and Rupture. Circ Res (2014) 114:1852–66. doi: 10.1161/CIRCRESAHA.114.302721
23. Schade DS, Shey L, Eaton RP. Cholesterol Review: A Metabolically Important Molecule. Endocr Pract Off J Am Coll Endocrinol Am Assoc Clin Endocrinol (2020) 26:1514–23. doi: 10.4158/EP-2020-0347
24. Cainzos-Achirica M, Glassner K, Zawahir HS, Dey AK, Agrawal T, Quigley EMM, et al. Inflammatory Bowel Disease and Atherosclerotic Cardiovascular Disease: JACC Review Topic of the Week. J Am Coll Cardiol (2020) 76:2895–905. doi: 10.1016/j.jacc.2020.10.027
25. Liu Y, Liu N, Liu Q. Constructing a ceRNA-Immunoregulatory Network Associated With the Development and Prognosis of Human Atherosclerosis Through Weighted Gene Co-Expression Network Analysis. Aging (2021) 13:3080–100. doi: 10.18632/aging.202486
26. Chen Y, Zeng A, He S, He S, Li C, Mei W, et al. Autophagy-Related Genes in Atherosclerosis. J Healthc Eng (2021) 2021:6402206. doi: 10.1155/2021/6402206
27. Wang S, Dougherty EJ, Danner RL. Pparγ Signaling and Emerging Opportunities for Improved Therapeutics. Pharmacol Res (2016) 111:76–85. doi: 10.1016/j.phrs.2016.02.028
28. Wagner N, Wagner KD. The Role of PPARs in Disease. Cells (2020) 9:2367. (2020). doi: 10.3390/cells9112367
29. Sanz H, Valim C, Vegas E, Oller JM, Reverter F. vm-RFE: Selection and Visualization of the Most Relevant Features Through Non-Linear Kernels. S BMC Bioinf (2018) 19:432. doi: 10.1186/s12859-018-2451-4
30. Tibshirani R. The Lasso Method for Variable Selection in the Cox Model. Stat Med (1997) 16:385–95. doi: 10.1002/(SICI)1097-0258(19970228)16:4<385::AID-SIM380>3.0.CO;2-3
31. Jiang Z, Zhao L, Zhang X, Zhang W, Feng Y, Li T. Common Variants in KCNK5 and FHL5 Genes Contributed to the Susceptibility of Migraine Without Aura in Han Chinese Population. Sci Rep (2021) 11:6807. doi: 10.1038/s41598-021-86374-0
32. Wu K, Feng J, Lyu F, Xing F, Sharma S, Liu Y, et al. Exosomal miR-19a and IBSP Cooperate to Induce Osteolytic Bone Metastasis of Estrogen Receptor-Positive Breast Cancer. Nat Commun (2021) 12:5196. doi: 10.1038/s41467-021-25473-y
33. Wu JC, Luo SZ, Liu T, Lu LG, Xu MY. Linc-SCRG1 Accelerates Liver Fibrosis by Decreasing RNA-Binding Protein Tristetraprolin. FASEB J Off Publ Fed Am Soc Exp Biol (2019) 33:2105–15. doi: 10.1096/fj.201800098RR
34. Hansson GK, Hermansson A. The Immune System in Atherosclerosis. Nat Immunol (2011) 12:204–12. doi: 10.1038/ni.2001
35. Schäfer S, Zernecke A. CD8(+) T Cells in Atherosclerosis. Cells (2020) 10. doi: 10.3390/cells10010037
36. Guzik TJ, Skiba DS, Touyz RM, Harrison DG. The Role of Infiltrating Immune Cells in Dysfunctional Adipose Tissue. Cardiovasc Res (2017) 113:1009–23. doi: 10.1093/cvr/cvx108
37. Xiao Q, Li X, Li Y, Wu Z, Xu C, Chen Z, et al. Biological Drug and Drug Delivery-Mediated Immunotherapy, Acta Pharmaceutica Sinica. B (2021) 11:941–60. doi: 10.1016/j.apsb.2020.12.018
Keywords: atherosclerosis, immune infiltration, diagnosis, biomarker, GEO datasets, machine learning
Citation: Ye Z, Wang X-k, Lv Y-h, Wang X and Cui Y-c (2022) The Integrated Analysis Identifies Three Critical Genes as Novel Diagnostic Biomarkers Involved in Immune Infiltration in Atherosclerosis. Front. Immunol. 13:905921. doi: 10.3389/fimmu.2022.905921
Received: 28 March 2022; Accepted: 13 April 2022;
Published: 18 May 2022.
Edited by:
Rongtuan Lin, McGill University, CanadaReviewed by:
Zhongjie Shi, Wayne State University, United StatesCopyright © 2022 Ye, Wang, Lv, Wang and Cui. This is an open-access article distributed under the terms of the Creative Commons Attribution License (CC BY). The use, distribution or reproduction in other forums is permitted, provided the original author(s) and the copyright owner(s) are credited and that the original publication in this journal is cited, in accordance with accepted academic practice. No use, distribution or reproduction is permitted which does not comply with these terms.
*Correspondence: Yong-chun Cui, Y3VpeW9uZ2NodW5AZnV3YWkuY29t; Xin Wang, d2FuZ3hpbmZ1d2FpQDE4OC5jb20=
†These authors contributed equally to this work
Disclaimer: All claims expressed in this article are solely those of the authors and do not necessarily represent those of their affiliated organizations, or those of the publisher, the editors and the reviewers. Any product that may be evaluated in this article or claim that may be made by its manufacturer is not guaranteed or endorsed by the publisher.
Research integrity at Frontiers
Learn more about the work of our research integrity team to safeguard the quality of each article we publish.