 Takeshi Iwasaki1,2
 Ryu Watanabe3,4*
 Hiromu Ito3,5Takayuki Fujii3Kenji Okuma6,7Takuma Oku6,7Yoshitaka Hirayama6,7Koichiro Ohmura1Koichi Murata3,8
 Kosaku Murakami1
 Hiroyuki Yoshitomi9
 Masao Tanaka3Shuichi Matsuda8Fumihiko Matsuda2
 Akio Morinobu1
 Motomu Hashimoto3,4*
- 1Department of Rheumatology and Clinical Immunology, Kyoto University Graduate School of Medicine, Kyoto, Japan
- 2Center for Genomic Medicine, Kyoto University Graduate School of Medicine, Kyoto, Japan
- 3Department of Advanced Medicine for Rheumatic Diseases, Kyoto University Graduate School of Medicine, Kyoto, Japan
- 4Department of Clinical Immunology, Osaka Metropolitan University Graduate School of Medicine, Osaka, Japan
- 5Department of Orthopaedic Surgery, Kurashiki Central Hospital, Okayama, Japan
- 6Center for Innovation in Immunoregulative Technology and Therapeutics, Kyoto University Graduate School of Medicine, Kyoto, Japan
- 7Candidate Discovery Science Labs, Astellas Pharma Inc., Ibaraki, Japan
- 8Department of Orthopaedic Surgery, Kyoto University Graduate School of Medicine, Kyoto, Japan
- 9Department of Immunology, Kyoto University Graduate School of Medicine, Kyoto, Japan
The factors influencing long-term responses to a tumor necrosis factor inhibitor (TNFi) in rheumatoid arthritis (RA) patients currently remain unknown. Therefore, we herein conducted a multi-omics analysis of TNFi responses in a Japanese RA cohort. Blood samples were collected from 27 biological disease-modifying antirheumatic drug (DMARD)-naive RA patients at the initiation of and after three months of treatment with TNFi. Treatment responses were evaluated at one year. Differences in gene expression levels in peripheral blood mononuclear cells (PBMCs), plasma protein levels, drug concentrations, and the presence/absence of anti-drug antibodies were investigated, and a cell phenotypic analysis of PBMCs was performed using flow cytometry. After one year of treatment, thirteen patients achieved clinical remission (responders), while the others did not or switched to other biologics (non-responders). Differentially expressed genes related to treatment responses were enriched for the interferon (IFN) pathway. The expression of type I IFN signaling-related genes was higher in non-responders than in responders before and after treatment (P = 0.03, 0.005, respectively). The expression of type II IFN signaling-related genes did not significantly differ before treatment; however, it increased in non-responders and decreased in responders, with a significant difference being observed after three months of treatment (P = 1.2×10⁻³). The total number of lymphocytes and C-X-C Motif Chemokine Ligand 10 (CXCL10) protein levels were associated with the type I IFN signature (P = 6.7×10⁻⁷, 6.4×10⁻³, respectively). Hepatocyte growth factor (HGF) protein levels before treatment predicted fold increases in type II IFN (P = 0.03). These IFN signature-related indices (the number of lymphocytes, CXCL10, and HGF) significantly differed between responders and non-responders (P = 0.01, 0.01, and 0.04, respectively). A single-cell analysis revealed that the type I IFN signature was more highly enriched in monocytes than in other cell types. A deconvolution analysis of bulk-RNA sequence data identified CD4+ and CD8+ T cells as the main sources of the type II IFN signature in non-responders. Collectively, the present results demonstrated that the dynamics of the type I and II IFN pathways affected long-term responses to TNFi, providing information on its biological background and potential for clinical applications.
Introduction
Rheumatoid arthritis (RA) is a chronic inflammatory disease that leads to progressive joint destruction (1). Clinical remission with disease-modifying antirheumatic drugs (DMARDs) in the early stages of the disease course is the key to preventing joint destruction and maintaining the quality of life (2). Some treatment options, including tumor necrosis factor inhibitor (TNFi) therapy, are now available for RA patients who do not respond to methotrexate (MTX) (2). Although 60–70% of patients show a good to moderate response to TNFi, 30–40% have no or insufficient responses (3–5). Therefore, further studies are needed to elucidate the mechanisms underlying treatment responsiveness and identify predictive biomarkers for clinical remission in patients treated with TNFi.
Several genome-wide association studies (GWAS) have so far attempted to survey susceptible genomic regions for TNFi responses (6). However, there is still no consensus about a single gene locus with a strong effect that may be replicated across multiple studies (7). Spiliopoulou et al. reported in 2019 that the ability to predict TNF responses from genotypic scores was limited (accounting for less than 1% of treatment responses) (8). These findings suggest that downstream signals, rather than a genetic predisposition, may have an important role in treatment responsiveness to TNFi.
To address this issue, dozens of omics studies, including transcriptomics, proteomics, metabolomics, and single-cell omics studies, have been conducted (6, 9, 10). However, those results have not achieved a strong consensus. Consequently, no clinically useful predictive markers have been established to date, encompassing further studies and novel perspectives. One of the limitations of these studies is the evaluation timing of drug response. Most studies have evaluated treatment responses within a relatively short period (one to three months) after treatment initiation. Since a non-negligible number of patients eventually stop responding to treatment in the long term (11), predicting long-term responses to TNFi is essential. Another limitation is an imbalance in the study population. Only a few omics studies investigated Asian populations (6). Since ethnic differences have been reported in responses to DMARDs (12), which may be attributed in part to differences in genetic polymorphisms in drug metabolism or RA pathology, further studies on Asian populations are warranted.
In the present study, we conducted a multi-omics analysis in patients who planned to initiate TNFi treatment to identify transcriptomic and proteomic features that predict responses or resistance to TNFi in RA using a multi-omics analysis of a Japanese cohort in terms of one-year efficacy.
Materials and Methods
Study Patients
We enrolled 29 biological DMARD-naive RA patients who were enrolled in the Kyoto University Rheumatoid Arthritis Management Alliance (KURAMA) cohort (13) and received anti-TNF therapy. The KURAMA cohort is an observational cohort that was established in May 2011 at the Center for Rheumatic Disease at Kyoto University Hospital to achieve strict control of RA. RA was diagnosed according to either the 1987 revised American College of Rheumatology classification criteria (14) or the 2010 American College of Rheumatology/European League Against Rheumatism (ACR/EULAR) criteria (15). The overview of this study is shown in Figure 1. Peripheral blood was collected from patients before and approximately three months after initiating TNFi treatment using heparin and ethylenediaminetetraacetic acid (EDTA) blood collection tubes. Responses to TNFi were assessed one year after the initiation of therapy.
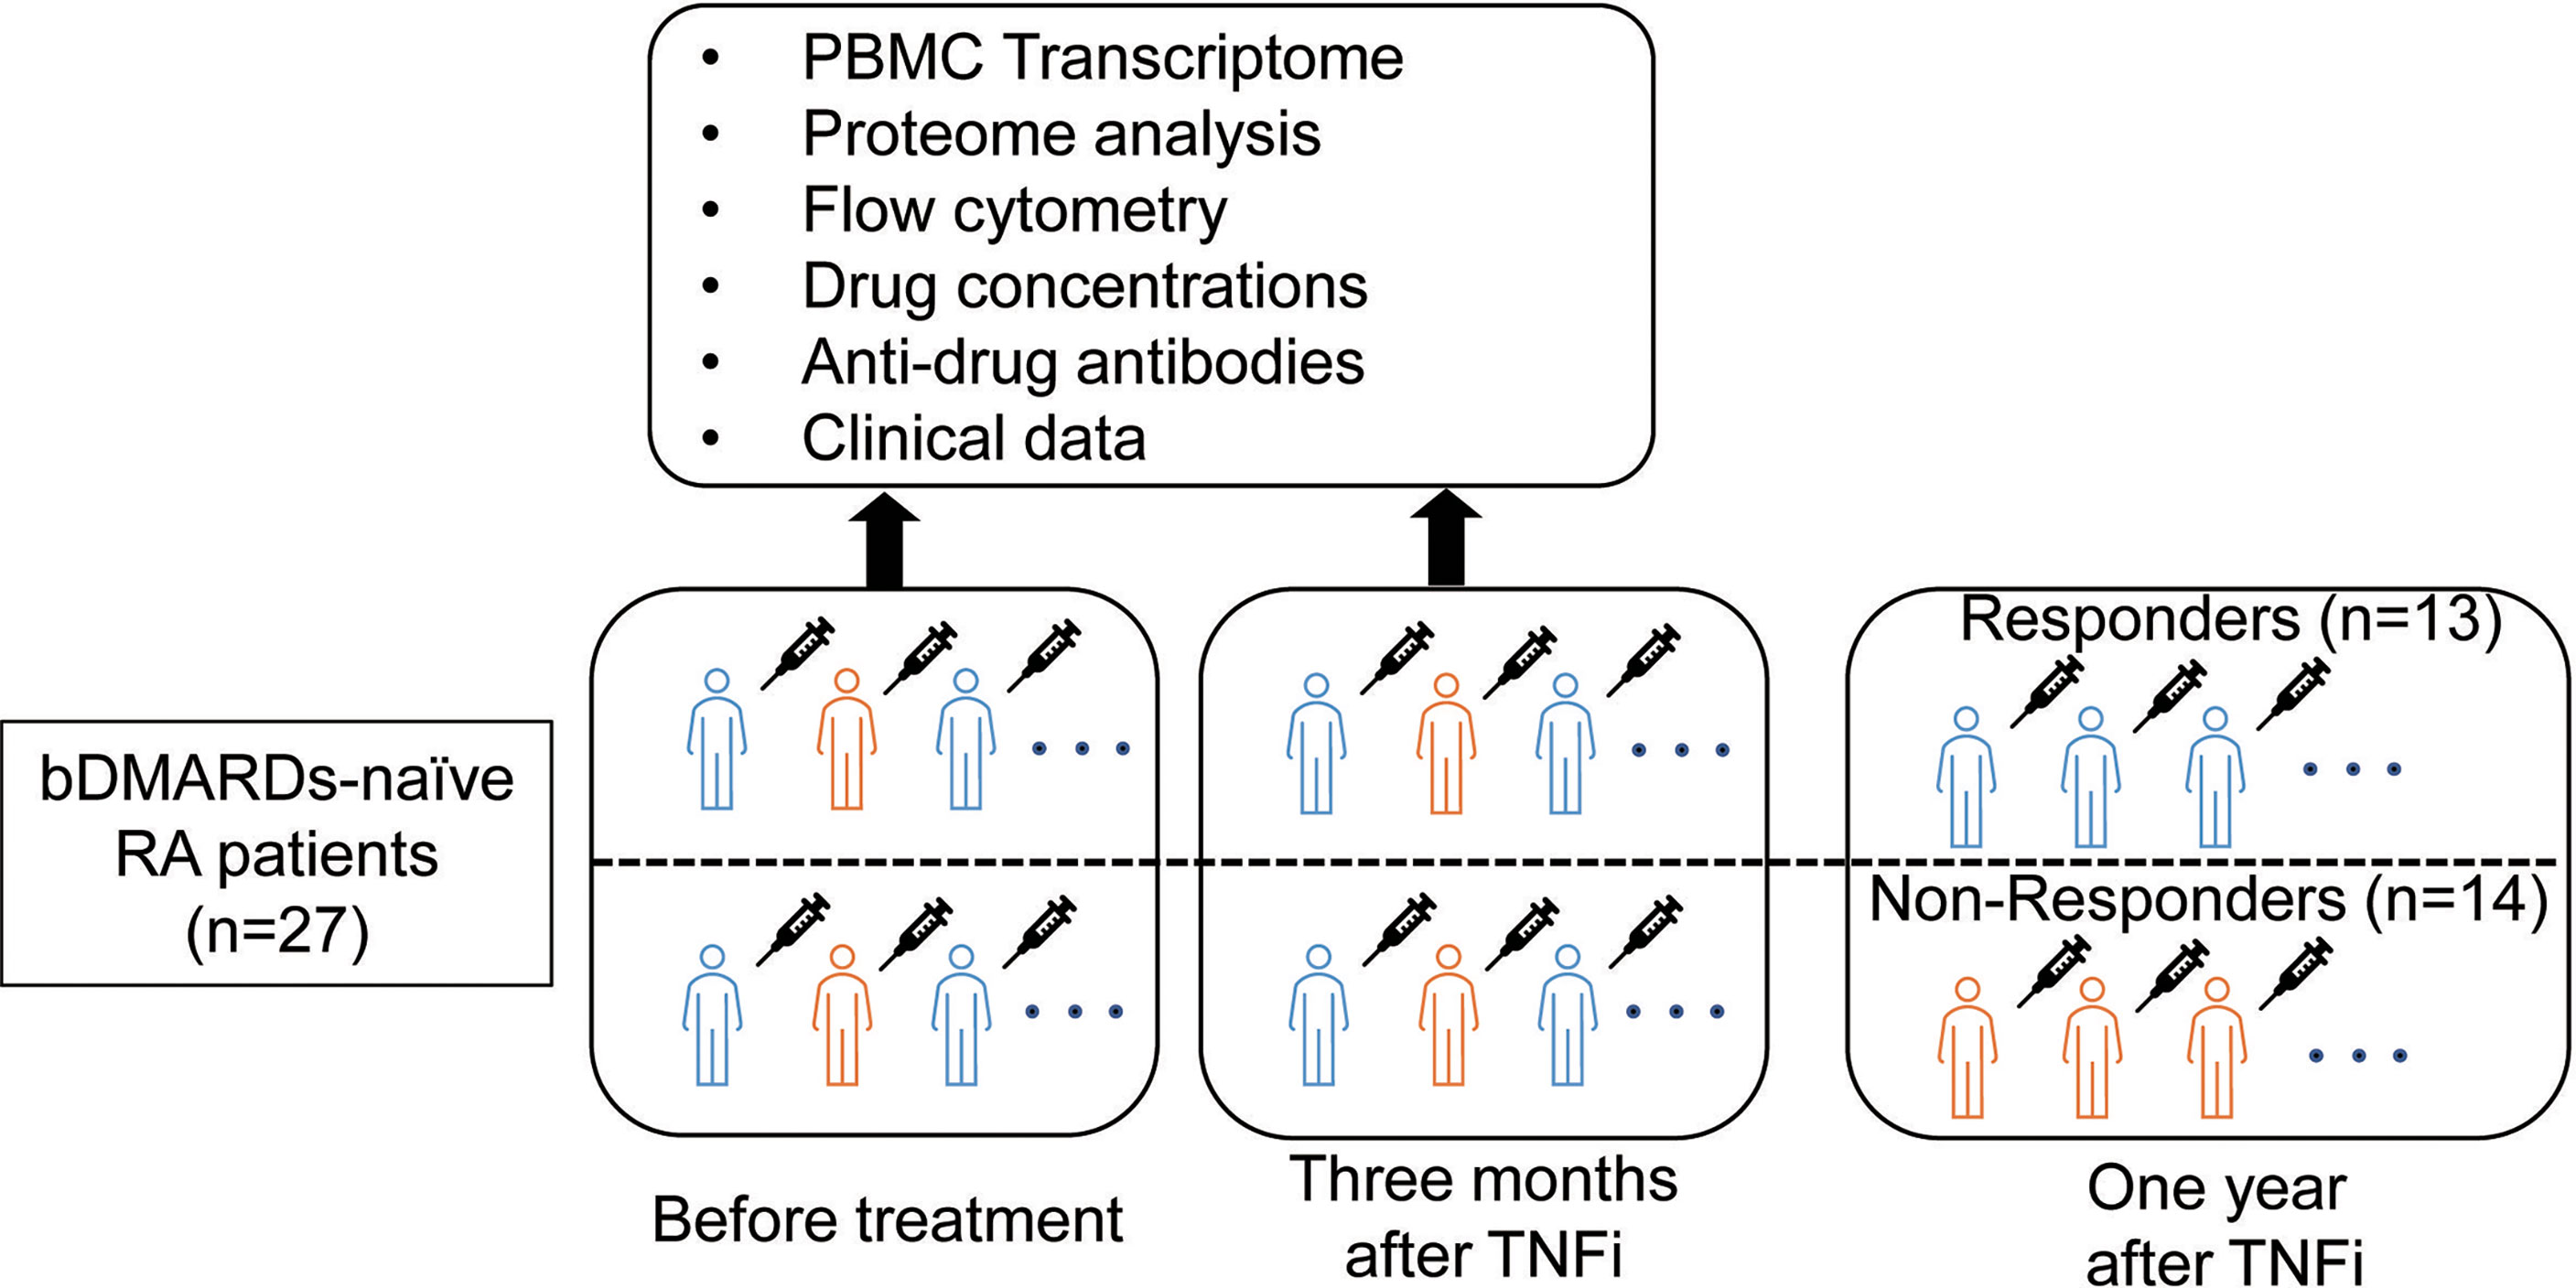
Figure 1 Overview of the present study.
Clinical Evaluation
Disease activity was evaluated using the Disease Activity Score 28-Erythrocyte sedimentation rate (DAS28-ESR) at every clinic visit. Clinical characteristics, including age, sex, body mass index (BMI), smoking history, duration of RA, the titers of rheumatoid factor (RF), anti-cyclic citrullinated peptide (CCP) antibodies, anti-nuclear antibodies (ANA), ESR, C-reactive protein (CRP) and treatment profiles [the use of MTX and prednisolone (PSL)] before the initiation of treatment, and white blood cell count, blood differential count before and three months after the initiation of treatment, were obtained from medical records.
Response Measures
We classified patients who achieved clinical remission [DAS28-ESR < 2.6 (16)] at one year as responders and those who did not or discontinued TNFi within one year due to inadequate responses as non-responders. Patients whose biologics were discontinued due to adverse events were excluded.
Measurement of TNFi Concentrations and Anti-Drug Antibody Titers Against TNFi
In patients who received adalimumab, etanercept, or infliximab, the plasma concentration of each drug and its anti-drug antibody titer were measured before and after treatment using the assay kit SHIKARI® by Matriks Biotek Laboratories. Measurements were conducted following the manufacturer’s instructions.
RNA Sequencing and Transcriptome Analysis
Peripheral blood mononuclear cells (PBMCs) were isolated from heparin collection tubes using Lymphocyte Separation Solution (Nacalai Tesque, d=1.077, cat. 20828-15). RNA was extracted from freshly isolated PBMCs by the RNAqueous-MicroKit (Ambion, AM1931), and genomic DNA was removed with the RNase-Free DNase Set (QIAGEN, 79254). Library preparation was performed using the SMARTer Ultra low RNA Kit for Illumina Sequencing (Clontech, USA). Sequencing was conducted by HiSeq 2,500 in the 150-bp paired-end mode. Sequencing reads were trimmed using Cutadapt (ver 1.1). Trimmed FASTQ files were aligned to the GRCh37 reference genome using STAR (ver. 2.7.3a) (17). Gene counts were generated by RSEM (ver. 1.3.1) (18) using Gencode v19 (19) as a reference. Gene counts were normalized by size factor implemented in DeSeq2 (20) and converted to count per million (CPM). We conducted a principal component analysis using 13,252 expressed genes (mean CPM > 1) in 54 samples (27 patients × two-time points) and confirmed the absence of outlier samples (Supplementary Figure 1). The Wald test performed a gene expression analysis using DESeq2 (20). Enrichment analysis was performed by Metascape (21) with default settings.
Type I and II interferon (IFN) scores were calculated by mean expression of genes of IFN stimulated genes (22, 23) (Supplementary Table 1). Type I IFN-stimulated genes were defined as the union of genes included in “GOBP_RESPONSE_TO_INTERFERON_ALPHA” or “GOBP_RESPONSE_TO_INTERFERON_BETA” in the Molecular Signatures Database [MSigDB ver7.4 (24)]. Type II IFN-stimulated genes were defined as those in included in “HALLMARK_INTERFERON_GAMMA_RESPONSE” in MSigDB (ver7.4) (24).
Flow Cytometry and Protein Measurements
The surface molecule expression was assessed using BD Canto™ II. The following antibodies were obtained from BD Pharmingen: allophycocyanin-conjugated anti-CD56 (341025, NCAM16); anti-CD3 (566683, OKT3), and V500-conjugated CD19 (561121, HIB19). We gated lymphocytes based on forward scatter (FSC) and side scatter (SSC) parameters and then calculated the percentage of each cell fraction in lymphocytes. The gating strategy is shown in Supplementary Figure 2. The analysis was conducted using FlowJo software. The absolute number of each cell fraction in peripheral blood (×106/mL) was calculated using the percentage and an absolute number of lymphocytes measured by the hematology analyzer MEK-7300 (Nihon Kohden®).
We isolated plasma from peripheral blood collected in EDTA-containing tubes and measured 67 proteins using ProcartaPlex Human 15-plex, ProcartaPlex Human 49-plex, Human VCAM-1 Simplex, Human sICAM-1 Simplex, and Human sCGF Simplex with Bio-Plex 200 (BIO-RAD) according to the manufacturer’s instructions.
The analysis of the usefulness of identified blood cell phenotype and proteins for differentiating responders from non-responders used receiver-operating-characteristic (ROC) curve techniques. The calculation of area under the ROC curve (AUC) and the creation of multiple linear model using ordinary least squares (OLS) were performed using the python package sklearn (ver 0.20.4).
Single-Cell Analysis
The cellular origin of the type I IFN signal was analyzed using single-cell data of PBMCs from RA patients (https://www.ncbi.nlm.nih.gov/geo/query/acc.cgi?acc=GSE159117). The R package Seurat (ver4.0) (25) was used for data scaling, transformation, clustering, and dimensionality reduction. The type I IFN score was calculated in the same manner as that for Bulk Transcriptome data. The scripts used are shown in Supplementary Note.
Deconvolution Analysis
We performed a deconvolution analysis using CIBERSORTx (26) to estimate cell type abundance in specimens and investigate the cellular origin of the type II IFN signature, which increased during the course of treatment in non-responders. As a reference, we used the findings of bulk RNA-Seq of the sorted cell subtypes of RA patients (27). These data contain gene count data for 28 different cell subtypes of RA patients (n=24). We initially converted them to counts per million (CPM) and created a signature matrix using the CPM of 26 cell subtypes (the “fraction” function), excluding neutrophils and low-density granulocytes. As an input, we used transcripts per million (TPM) for each specimen. Since it was not possible to estimate gene expression in all 26 cell populations due to lack of statistical power, we estimated gene expression in six cell subtypes (CD4+, CD8+, natural killer cell (NK), dendritic cells (DC), and monocytes) (the “hires” and “classes” functions). To increase the statistical power of the estimation, we also included the bulk-RNA Seq data of other RA patients (n=111) processed on the same platform in the KURAMA cohort. We confirmed that the estimated cell proportion correlated with real data (T cells, B cells, and NK cells defined by CD3+, CD19+, and CD 56+, respectively) obtained from FACS data (Pearson’s correlation coefficient: 0.87). We calculated the mean expression levels of the estimated type II IFN-related genes, excluding missing values, and calculated fold changes in each cell fraction after three months of treatment from before treatment. Differences in fold changes between responders and non-responders were tested by the Mann-Whitney U test.
Ethics Approval and Consent to Participate
The present study was performed in accordance with the Helsinki Declaration and was approved by the Kyoto University Graduate School and Faculty of Medicine Ethics Committee (approval number: G0511-6). Written informed consent to participate in the present study and publish the results obtained was provided by all enrolled patients.
Results
Comparison of Clinical Characteristics of Responders and Non-Responders to TNFi
Twenty-nine biological DMARD-naïve RA patients were registered from the KURAMA cohort. Two patients discontinued the use of TNFi because of an injection site reaction (7 and 10 months after treatment initiation, respectively); therefore, 27 patients were enrolled in the present study. After one year of treatment, 13 (48.1%) patients received the same TNFi and achieved remission, while 14 (51.9%) did not achieve remission or TNFi was switched to other agents. The clinical characteristics of patients are summarized in Table 1. ESR was significantly higher in non-responders than in responders (P = 0.02) before treatment. CRP and DAS28-ESR before treatment were slightly higher in non-responders (P = 0.054 and P = 0.08, respectively). No significant differences were observed in age, sex, BMI, smoking history, duration of RA, RF, anti-CCP, ANA, or the use of MTX and PSL between responders and non-responders (P > 0.05).
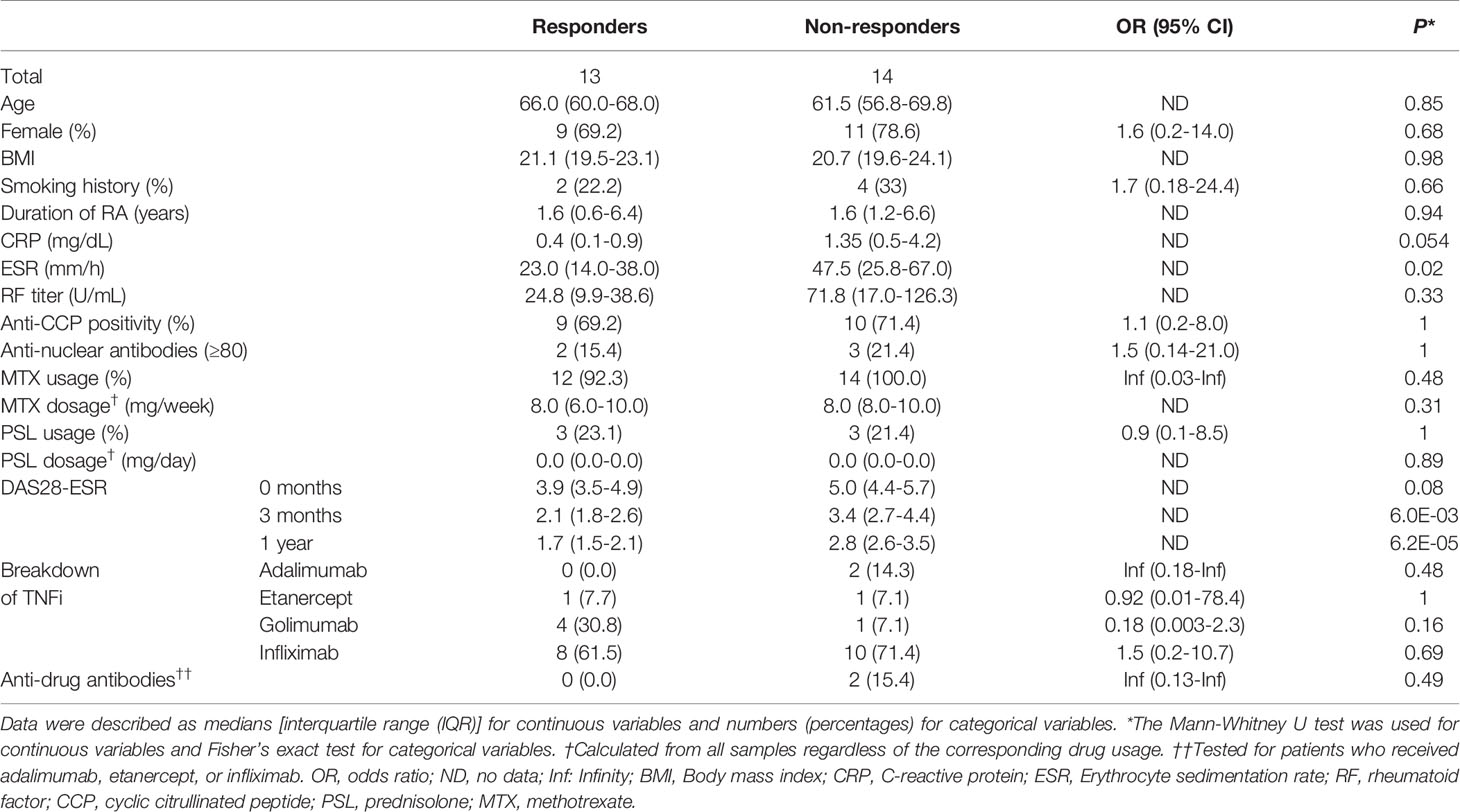
Table 1 Clinical characteristics of study patients.
Differences in Drug Concentrations, Anti-Drug Antibody Titers Between Responders and Non-Responders
Previous studies demonstrated that the efficacy of TNFi may be affected by drug concentrations and the existence of anti-drug antibodies in peripheral blood (28). To test if these previous findings can be replicated, we examined the concentrations of TNFi and anti-drug antibody titers against TNFi. We confirmed that the corresponding drug concentrations were below the detection level in all samples before treatment. After treatment, no significant differences were noted in drug concentrations between responders and non-responders (Supplementary Table 2). The anti-drug antibodies of the corresponding TNFi were not detected in patients before treatment but were found in 2 non-responders (15%) after treatment. In contrast, none of the responders had anti-drug antibodies (Fisher’s exact test, P = 0.49, Table 1).
Relationship Between Gene Expression and Responses to TNFi
We conducted a differential gene expression analysis between responders and non-responders before treatment. We identified 17 genes associated with treatment responses (False discovery rate; FDR < 0.05) (Figure 2A, Supplementary Table 3). To characterize differentially expressed genes, we conducted an over-representation analysis using MetaScape (21). Since the number of genes with FDR < 0.05 was too small, we used the 2,678 genes that showed nominal significance (P < 0.05). As a result, we found that type I IFN signaling placed 12th in the top enriched pathways (Figure 2B, Supplementary Table 4).
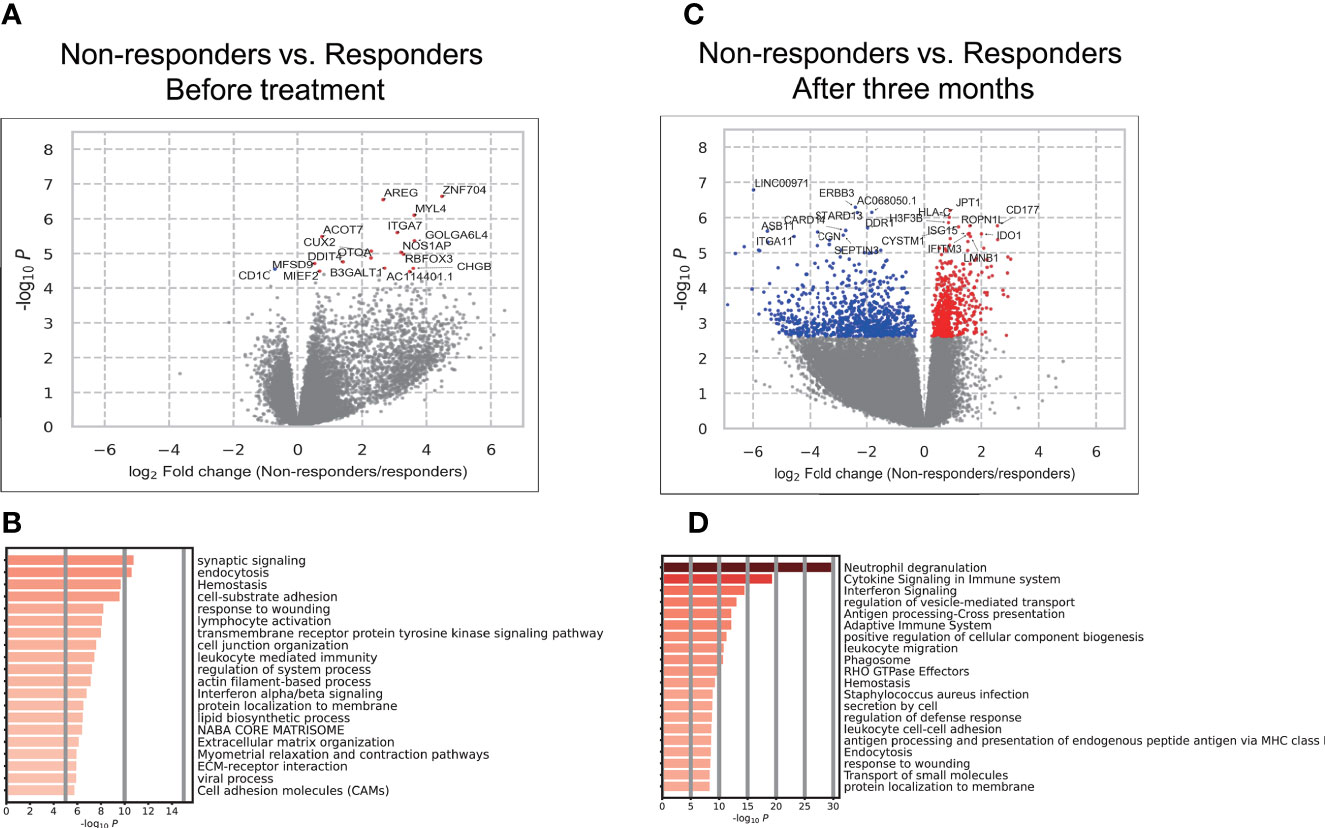
Figure 2 Results of the association analysis of gene expression. (A, C) Volcano plots showing differentially expressed genes (DEGs) in PBMCs between responders and non-responders before treatment (A). and three months after (C). Each dot indicates an individual gene, colored in red when a gene was significantly (FDR < 0.05) up-regulated in non-responders and colored in blue when a gene was significantly (FDR < 0.05) up-regulated in responders. The gene names of significant DEGs are shown; when there were more than 20 significant DEGs, the names of only the top 20 DEGs were shown. (B, D) The results of the enrichment analysis of DEGs before treatment (B) and three months after (D).
We also conducted a differential gene expression analysis between responders and non-responders after treatment. Among the 17 genes which showed a significant difference between responders and non-responders, three genes (MYL4, ACOT7, DDIT4) remained higher in non-responders with significance. The remaining 14 genes lost their significance or showed associations in the opposite directions. Overall, significant differences were observed in the expression of 1,469 genes (FDR < 0.05) (Figure 2C, Supplementary Table 5). To characterize these genes, we conducted an enrichment analysis. IFN signaling placed 3rd (Figure 2D) and the type I and II IFN signaling pathways were enriched (Supplementary Table 6). These results implicated the type I and II IFN pathways in responses to TNFi in RA patients. Although the involvement of type I IFN in short-term responses has been demonstrated (29–32), its contribution to long-term efficacy and the role of type II IFN have not yet been examined. Therefore, these results prompted us to investigate its involvement in TNFi responses in more detail.
Dynamics of IFN Signatures Related to TNFi Responses
The IFN signature is represented as the IFN score. We calculated the IFN score using the average expression of IFN-stimulated genes (22, 23) in each specimen (Figure 3). The results obtained revealed that the type I IFN score was significantly higher in non-responders before treatment (P = 0.03) and three months after treatment (P = 0.005) (Figure 3A, Supplementary Table 7). These results indicated that the presence of the type I IFN signature before treatment was associated with the poor therapeutic efficacy of TNFi, which is consistent with previous findings (29).
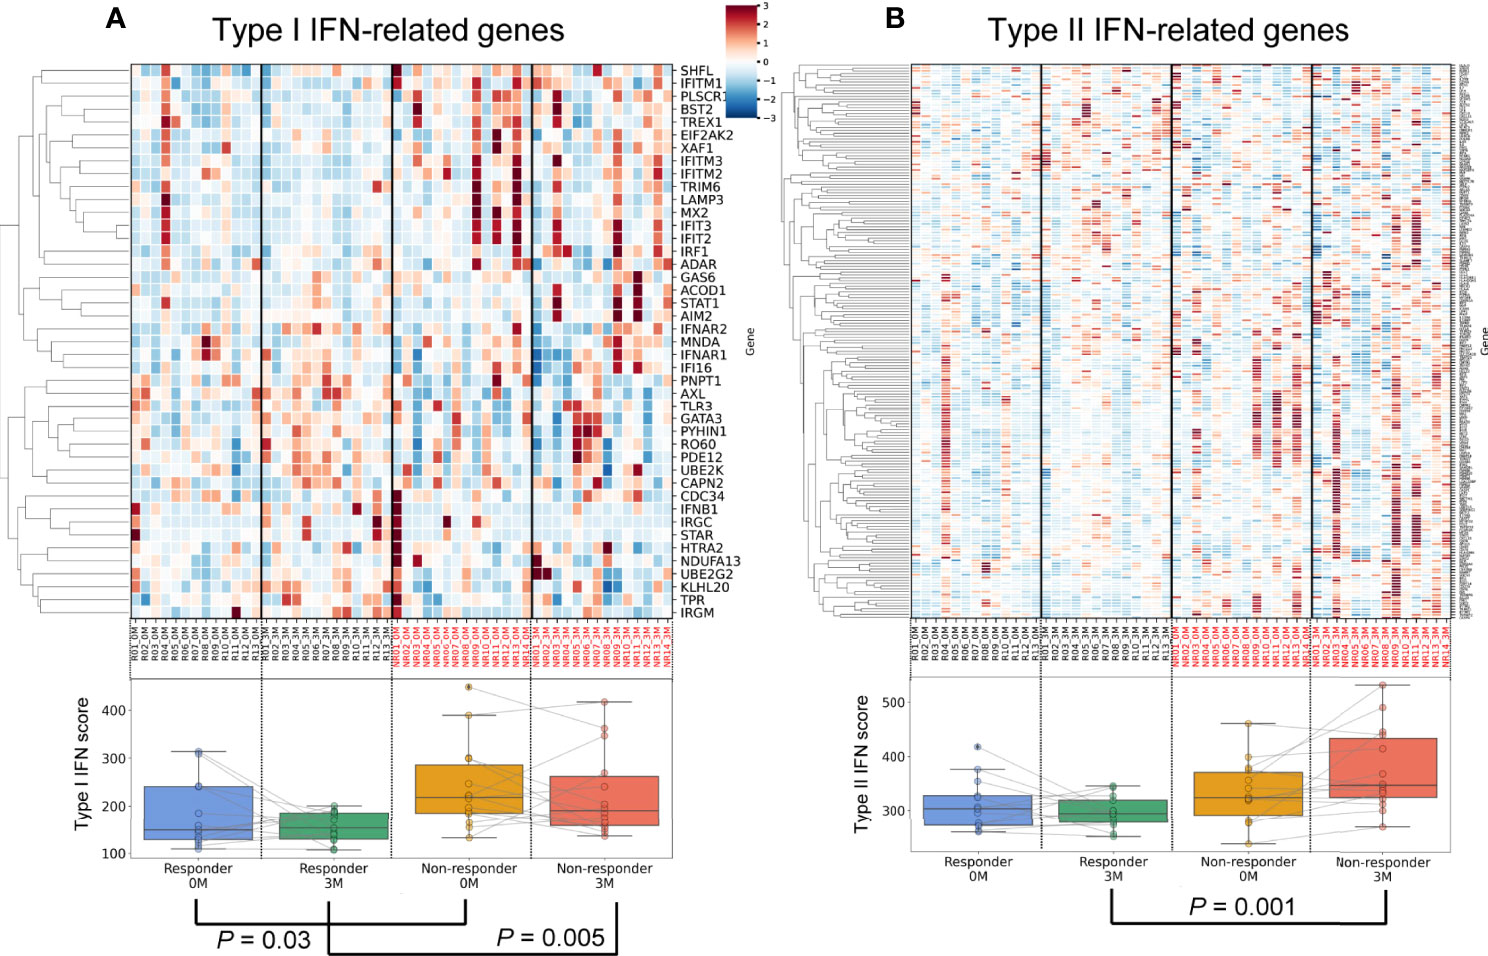
Figure 3 Differences in and dynamics of type I and II interferon signatures. An upper heatmap shows the expression of type I IFN-related genes (A) and type II IFN-related genes (B). The expression of each gene (CPM) related to the type I IFN signature was standardized across all samples, and Z scores were shown. Lower box plots show the type I IFN score (A) and type II IFN score (B) for each specimen.
Regarding type II IFN, no significant differences were observed between responders and non-responders before treatment (P = 0.11, Figure 3B, Supplementary Table 7). During treatment, type II IFN scores slightly increased in non-responders (P = 0.10), but slightly decreased in responders (P = 0.29). After three months of treatment, a significant difference was observed in type II IFN scores between responders and non-responders (P = 0.001). Collectively, transcriptomic data demonstrated that type I IFN scores to TNFi were persistently high in non-responders, while a post-treatment increase was observed in type II IFN scores. These results highlighted the contrasting dynamics of the type I and type II IFN signatures between TNFi responders and non-responders.
Identifying Alternative Biomarkers of the IFN Signature
We demonstrated the utility of IFN scores for predicting treatment responses. Since the transcriptome is generally unavailable and difficult to adopt in daily clinical practice, we examined alternative markers by investigating the relationships between IFN scores and various traits.
We initially examined the relationships between type I IFN scores and various traits using 54 specimens (27 samples × 2 time points). Type I IFN scores did not correlate with DAS28-ESR and each component (Supplementary Figures 3A–E, P > 0.05). We then investigated the relationship between type I IFN scores and the number of cells of each subpopulation. A strong negative correlation was noted between type I IFN scores and the number of lymphocytes (Figure 4A, P = 6.7E-07). This correlation was observed across each cell fraction of PBMCs (CD3+, CD19+, CD56+; P = 1.6×10⁻⁵, 3.3×10⁻⁵, 4.3×10⁻³, respectively) (Supplementary Table 8). We confirmed that non-responders had slightly lower lymphocyte counts both before (Supplementary Figure 4A) and after treatment (Supplementary Figure 4B). When we combined the results obtained, a significant difference was noted (P = 0.01, Figure 4D). We also examined relationships with 67 proteins measured in our multi-omics platform. While positive correlations (Pearson’s coefficient > 0) were observed with the proteins IFNα and IFNβ (Supplementary Table 9), the protein with the strongest correlation was C-X-C Motif Chemokine Ligand 10 (CXCL10) (Figure 4B). Although CXCL10 is generally known as a type II IFN-inducible protein, its expression was also shown to be induced by type I IFN (33). CXCL10 levels were high in non-responders before (Supplementary Figure 4C) and after three months (Supplementary Figure 4D) of treatment. When we combined results, a significant difference was observed (P = 0.01, Figure 4E). Therefore, type I IFN-associated indices appear to be useful for distinguishing non-responders from responders.
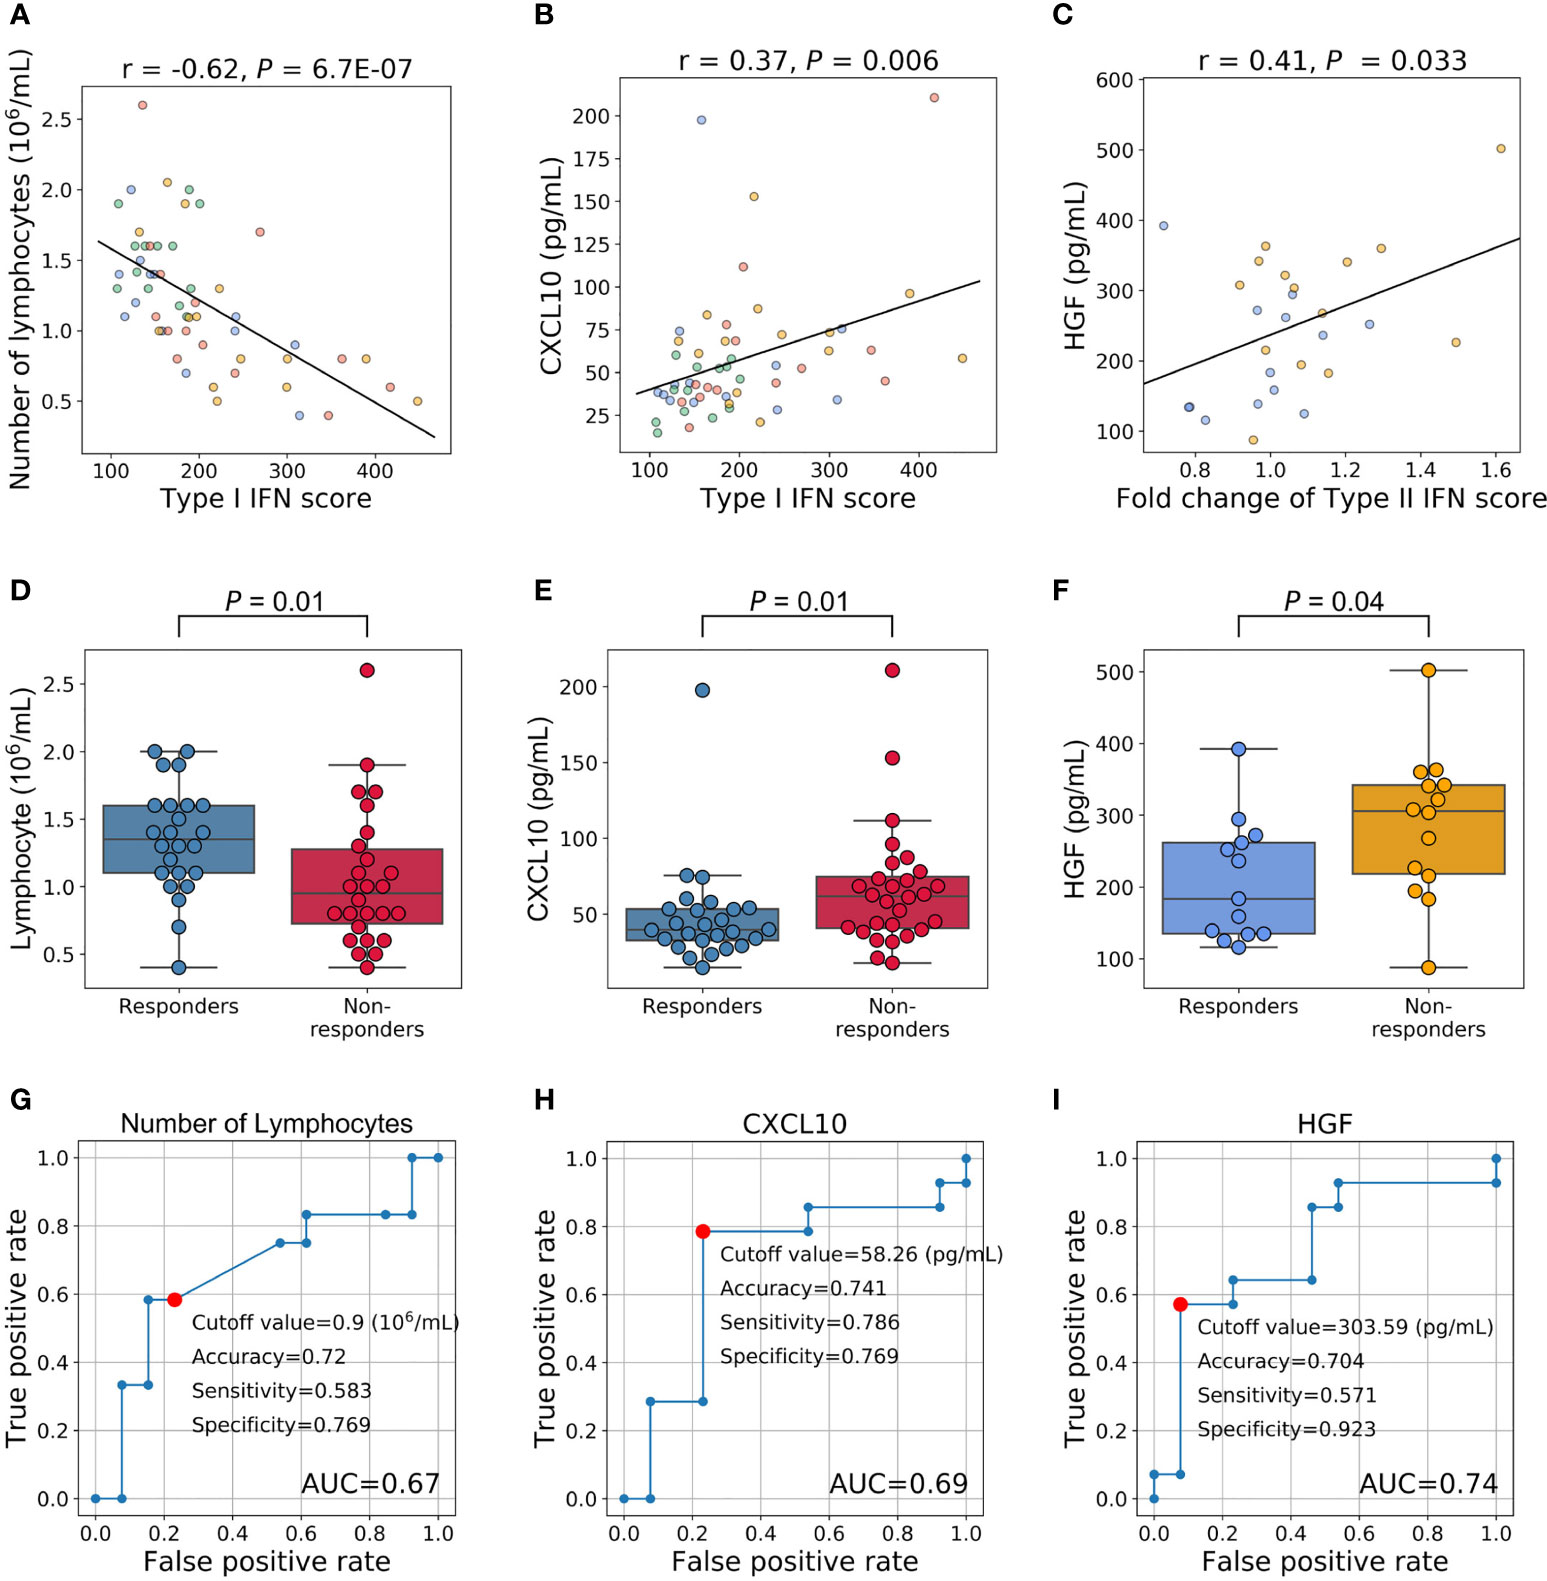
Figure 4 Relationships between the IFN signature and other phenotypes and an evaluation of their clinical utility as predictive markers. (A–C) Relationships between IFN scores and other phenotypes. Each dot represents each specimen. Blue represents responders before treatment, orange for non-responders before treatment, green for responders three months after treatment, and red for non-responders three months after treatment. (D, E) Relationships between treatment responses and the number of lymphocytes and CXCL10 levels. Fifty-four specimens (27 samples × 2 timepoints) were analyzed. (F) Relationship between HGF levels before treatment and treatment responses. (G–I) ROC curves for no response to TNFi. Red plots indicate the cut-off points at the highest accuracy (minimum false negative and false positive results) for predicting non-responders.
We also investigated whether pre-treatment traits predicted increases in the type II IFN score. To achieve this, we assessed the relationships between pre-treatment traits and fold changes in type II IFN scores (the type II IFN score after 3 months divided by the score before treatment). A correlation was not observed with DAS28-ESR and each component(P > 0.05, Supplementary Figures 3F–J). Furthermore, no significant predictive markers were identified for blood cell counts (Supplementary Table 10). However, among the proteins examined, a correlation was noted with the protein levels of hepatocyte growth factor (HGF) (P = 0.03, Figure 4C, Supplementary Table 11). HGF levels were higher in non-responders before treatment (P = 0.04, Figure 4F).
These results support the potential to predict the clinical outcomes of RA patients treated with TNFi by measuring the number of lymphocytes and the levels of CXCL10 and HGF before treatment initiation. To confirm this hypothesis, we performed a ROC analysis. AUC for these three proteins were 0.67, 0.69, and 0.74, respectively (Figures 4G–I). The most accurate cut-off levels were 0.9×10⁶/mL, 58.26 pg/mL, and 303.59 pg/mL, which had accuracies of 72.0, 74.1, and 70.4%, sensitivities of 58.3, 78.6, and 57.1%, specificities of 76.9, 76.9, and 92.3%, respectively. We have evaluated the proportion of responders and non-responders based on the cut-off values by the χ2 test and obtained significance for HGF and CXCL10 (P = 0.02, 0.01, respectively) and suggestive significance for the number of lymphocytes (P = 0.06). Furthermore, these three IFN-signature-related indices showed some degree of independence from each other (|r| < 0.4, Supplementary Figure 5). Motivated by this, we finally created multiple linear regression model (2.0×10⁻³×HGF (pg/mL) + 6.2×10⁻⁴×CXCL10 (pg/mL) - 0.13×Number of lymphocytes (106/μL) + 0.13), and obtained higher prediction accuracy (AUC = 0.76, Figure 5). Collectively, these results suggest that the IFN signature and its related phenotype are good predictors of responsiveness to TNFi.
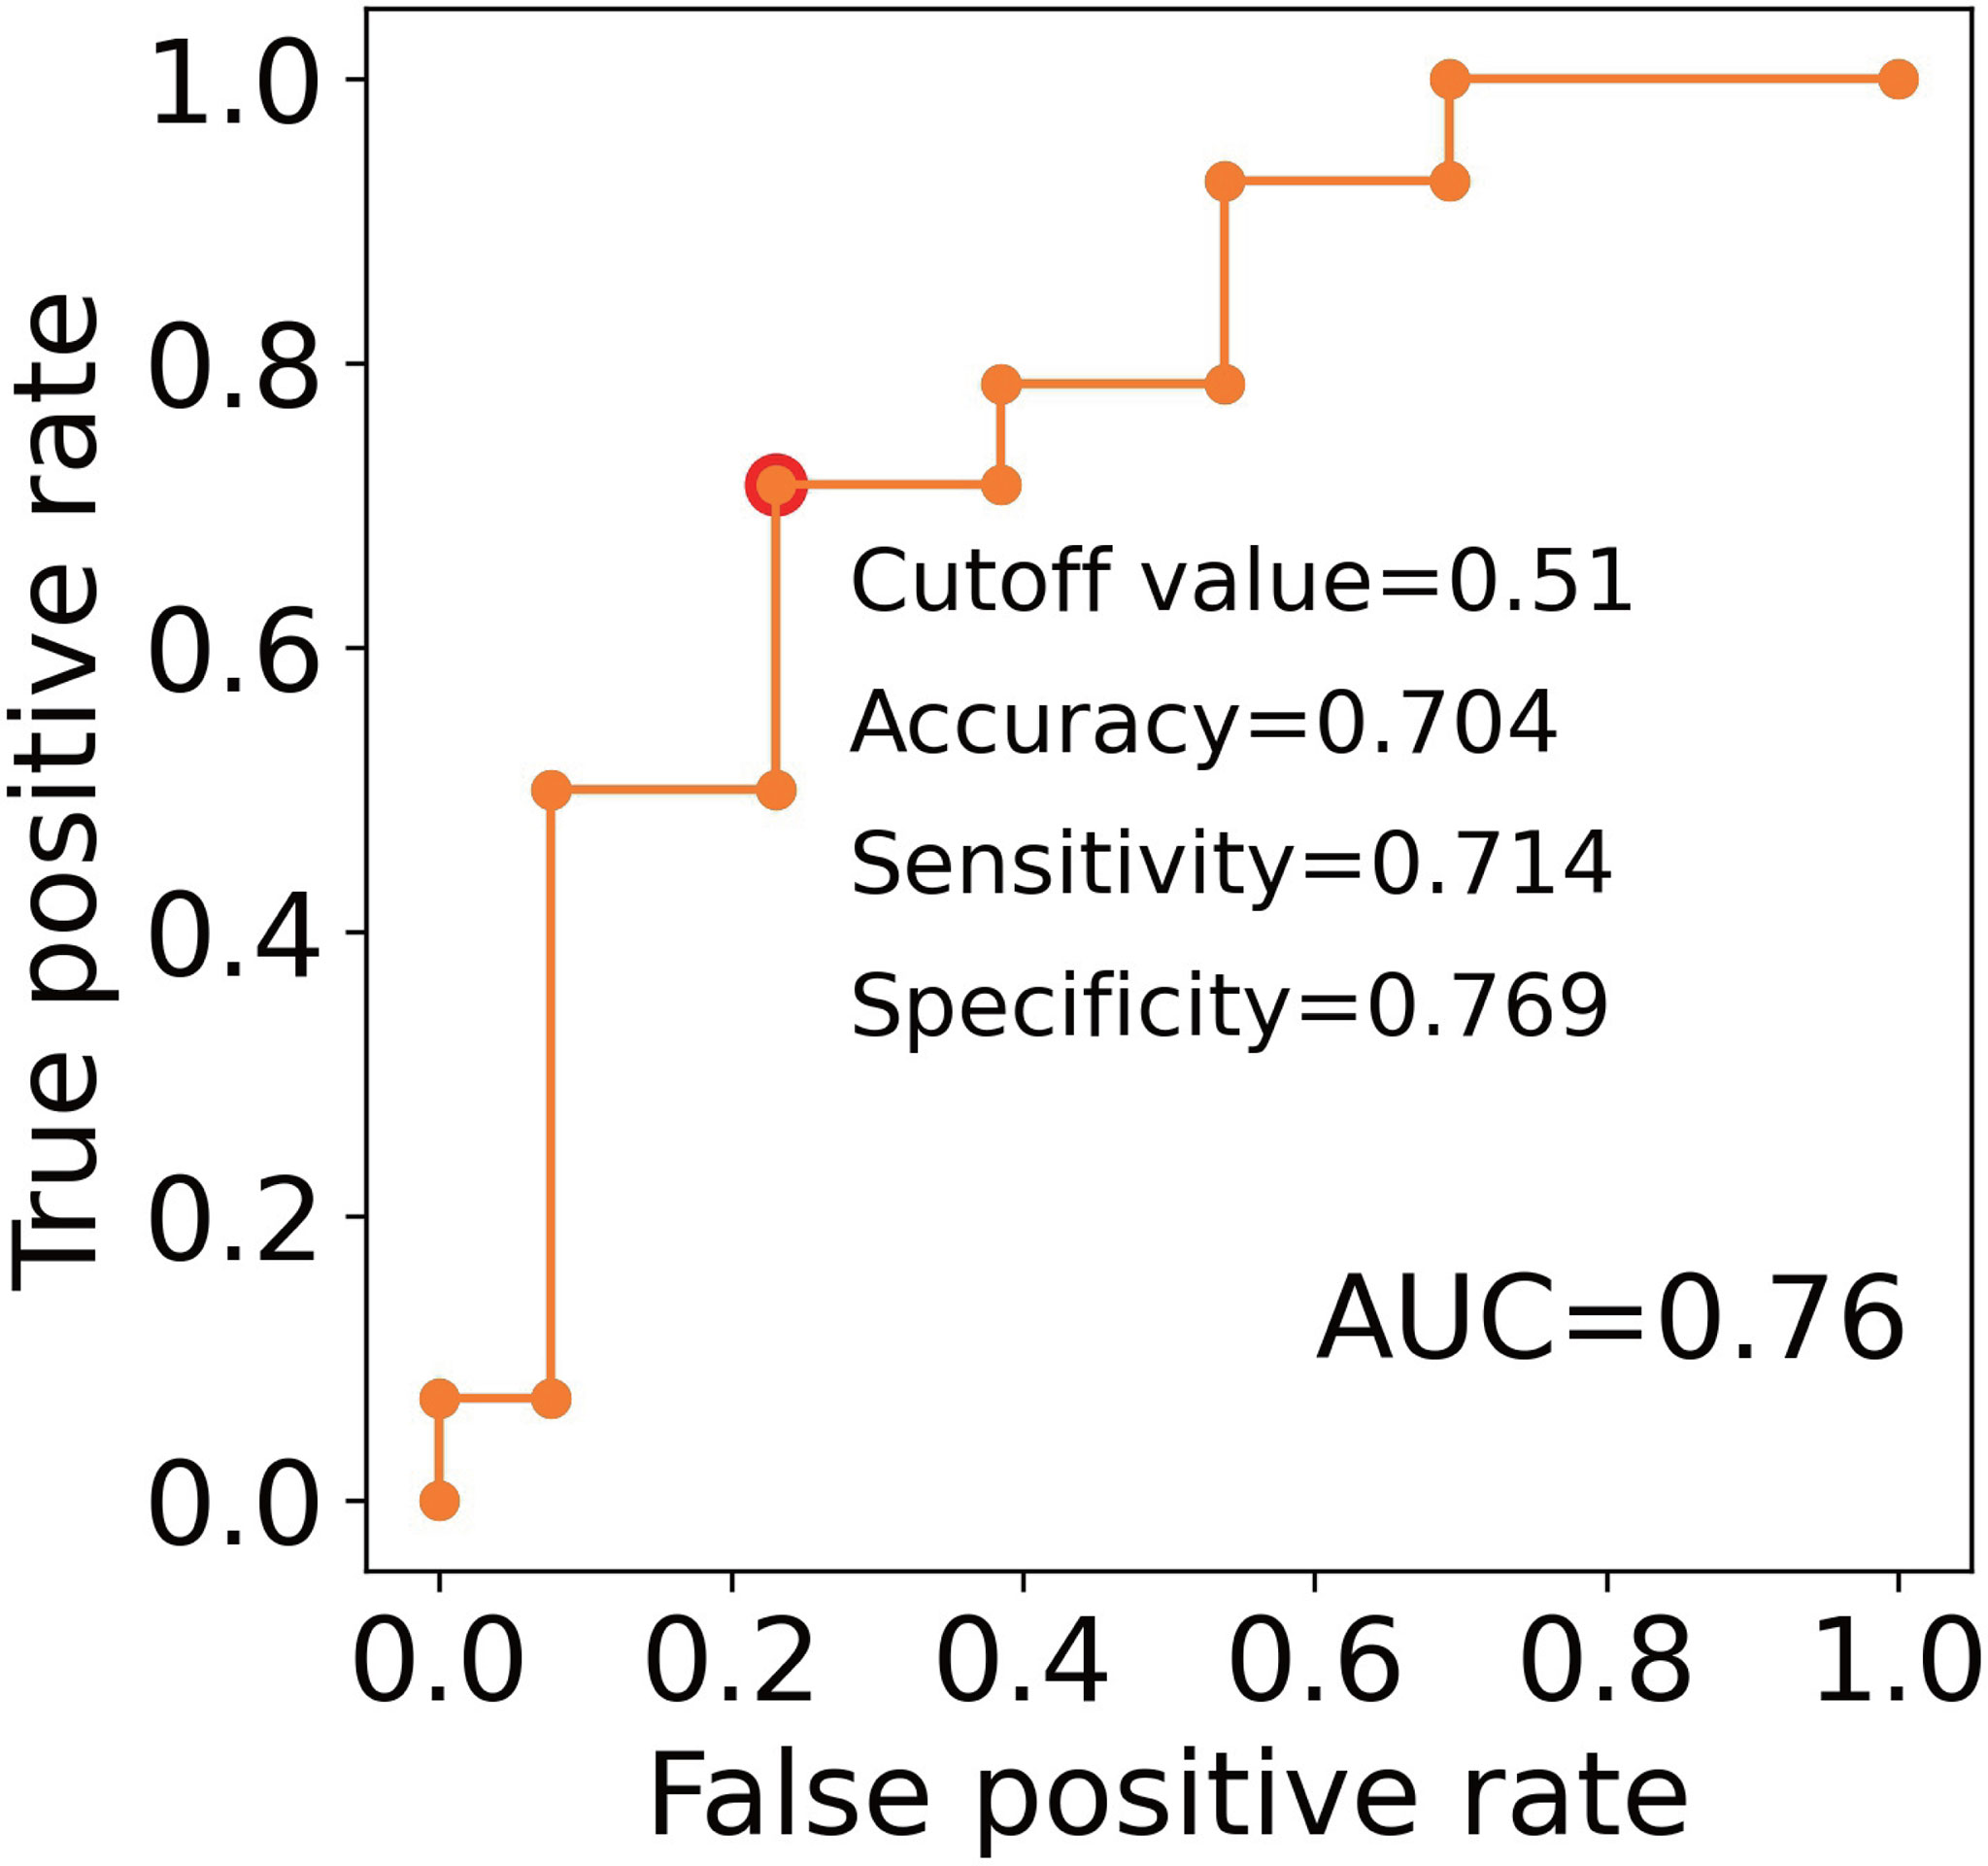
Figure 5 An evaluation of the clinical utility of the combinations of predictive markers. ROC curves for non-response to TNFi. The model created by the multiple linear regression was as follows; 2.0×10⁻³ × HGF (pg/mL) + 6.2×10⁻⁴×CXCL10 (pg/mL) - 0.13×Number of lymphocytes (106/μL) + 0.13. Red plots indicate the cut-off points at the highest accuracy (minimum false negative and false positive results) for predicting non-responders.
Cellular Origin of the IFN Signature
To identify the cellular origin of the type I and II IFN signatures uniquely detected in non-responders, we analyzed the open-access single-cell data of PBMC in RA patients. Although the type I IFN signature was ubiquitously observed across each cell type, its abundance was significantly higher in monocytes (monocytes vs. CD4+, CD8+, B, NK cells: P < 2.2×10⁻⁶, respectively; Figure 6A).
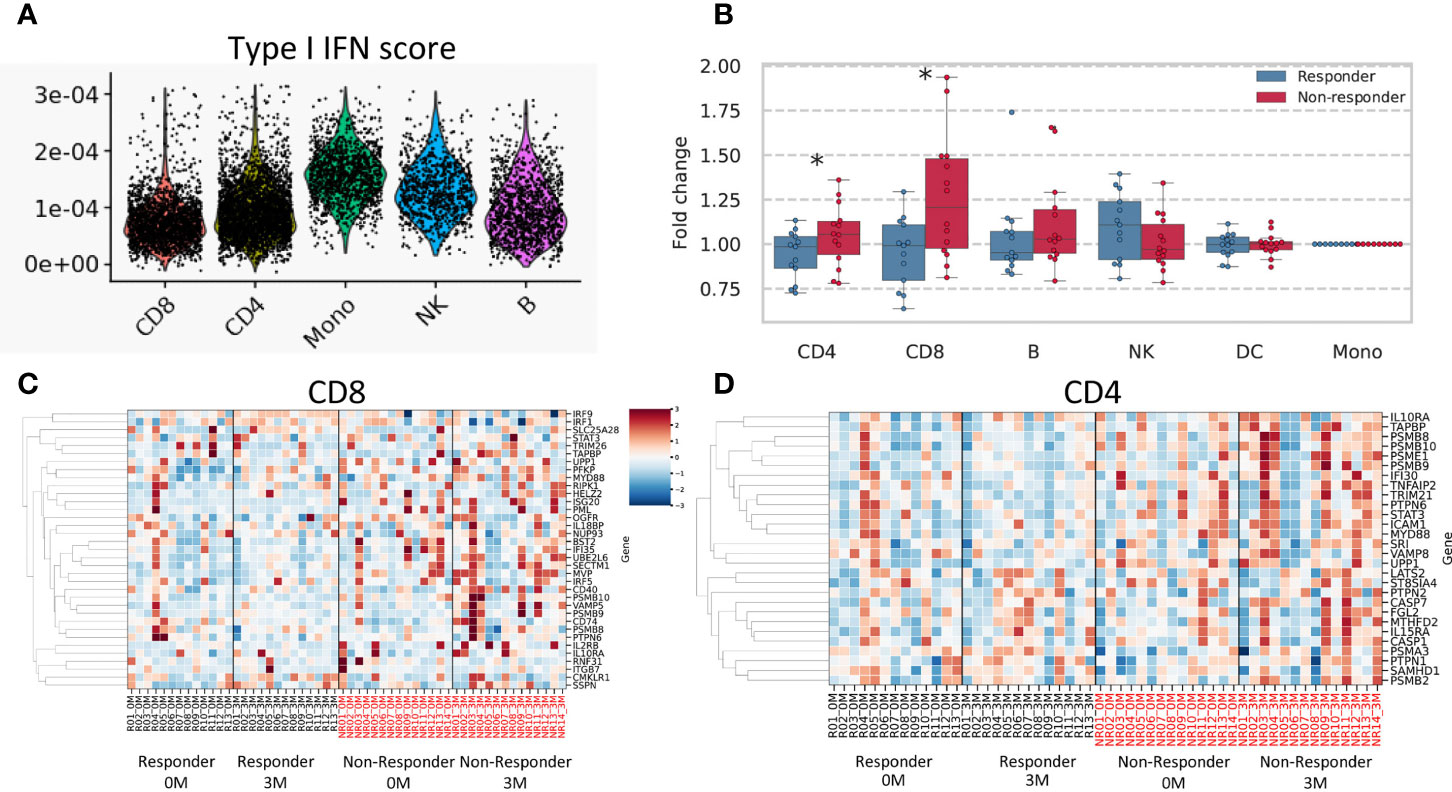
Figure 6 Results of single-cell data and a deconvolution analysis of the IFN signature. (A) Type I IFN scores for each cell subtype are shown. (B) Fold changes (after/before treatment) in the mean expression of type II IFN-related genes are shown according to each cell subtype. A heatmap of estimated expression in cells positive for CD8 (C) and CD4 (D). The estimated expression of each gene was standardized across all samples, and Z scores were shown. * stands for p < 0.05 by the Mann-Whitney U test. CD4, CD4-positive cells; CD8, CD8-positive cells; B, B cells; DC, Dendritic cells; NK, Natural killer cells.
We conducted a deconvolution analysis to dissect heterogenous PBMC transcriptomes and estimate cell type-specific type II IFN-related gene expression in each specimen using CIBERSORTx (26). We compared fold increases in type II IFN scores between responders and non-responders for each cell type. The results obtained showed that fold changes in type II IFN scores were higher in non-responders than in responders for CD4+ and CD8+ cells (P = 0.047, 0.01, respectively) (Figures 6B–D). No significant differences were observed for other cell types. These results suggested that T cells were responsible for the non-responder-specific increase in the type II IFN signature after treatment.
Discussion
In the present study, a transcriptome analysis showed that a persistently high type I IFN signature and a post-treatment increase in the type II IFN signature were features that were unique to non-responders. The number of lymphocytes and the level of CXCL10 were associated with the type I IFN signature, while the level of HGF before treatment was associated with fold changes in the type II IFN signature after the TNFi treatment. Consistent with these results, non-responders had a lower lymphocyte count and higher levels of CXCL10 and HGF before treatment. Collectively, the present results demonstrated that the dynamics of the type I and II IFN signatures affected long-term responsiveness to TNFi and that these three indices have potential as alternative biomarkers of the type I and type II IFN signatures in TNFi-treated patients.
To the best of our knowledge, this is the first study to report the involvement of the type II IFN signature in responses to TNFi. Although TNF was previously shown to regulate type I IFN (34, 35), the present results indicated that it also regulated type II IFN. The results of the deconvolution analysis suggested that an elevated type II IFN response signature was derived from T cells. Therefore, T cells activated by type II IFN may be a potential treatment target in TNFi non-responders. These results support the inhibition of Janus kinase, the downstream signal of the IFN pathway (36), being a good therapeutic option when TNFi fails.
We found a strong negative correlation between the blood type I IFN signature and lymphocytes. A previous study reported that the treatment of chronic hepatitis C patients with IFN alpha exerted suppressive effects on hematopoiesis (37). Therefore, the present results suggested that the internal type I IFN signature in RA patients also exhibited anti-proliferative activity against lymphocytes.
CXCL10, one of the IFN-inducible proteins, showed the strongest correlation with the type I IFN signature, and higher levels of CXCL10 predicted a poor response in the present study. A pathogenic role for CXCL10 in arthritis was previously demonstrated in RA patients (38) as well as in mouse models (39). Based on these findings and our results, the IFN-CXCL10 axis and its downstream signaling may not only be a useful biomarker for TNFi resistance, but also a potential therapeutic target in TNFi treatment-resistant RA.
HGF levels, which correlated with fold changes in the type II IFN score, have been shown to promote osteoclastogenesis in mice with collagen-induced arthritis (40). Furthermore, HGF has been implicated in the progression of joint damage in RA patients (41). Although it currently remains unclear whether HGF is directly involved in increases in type II IFN, it may serve as a predictive marker of responsiveness to TNFi.
Our results, together with previous knowledge, suggest a possible vicious cycle in the synovium of TNFi non-responders (Figure 7). That is, CXCL10, which is high in non-responders, recruits T cells (42), which produce Type II IFN (43, 44). It stimulates T cells (Figure 6B) as well as CXCL10 production (45). CXCL10 production may also be stimulated by the Type I IFN (Figure 4B (33),). Therefore, abatacept, which targets T cells, might be an important candidate as alternative therapy when TNFi treatment fails.
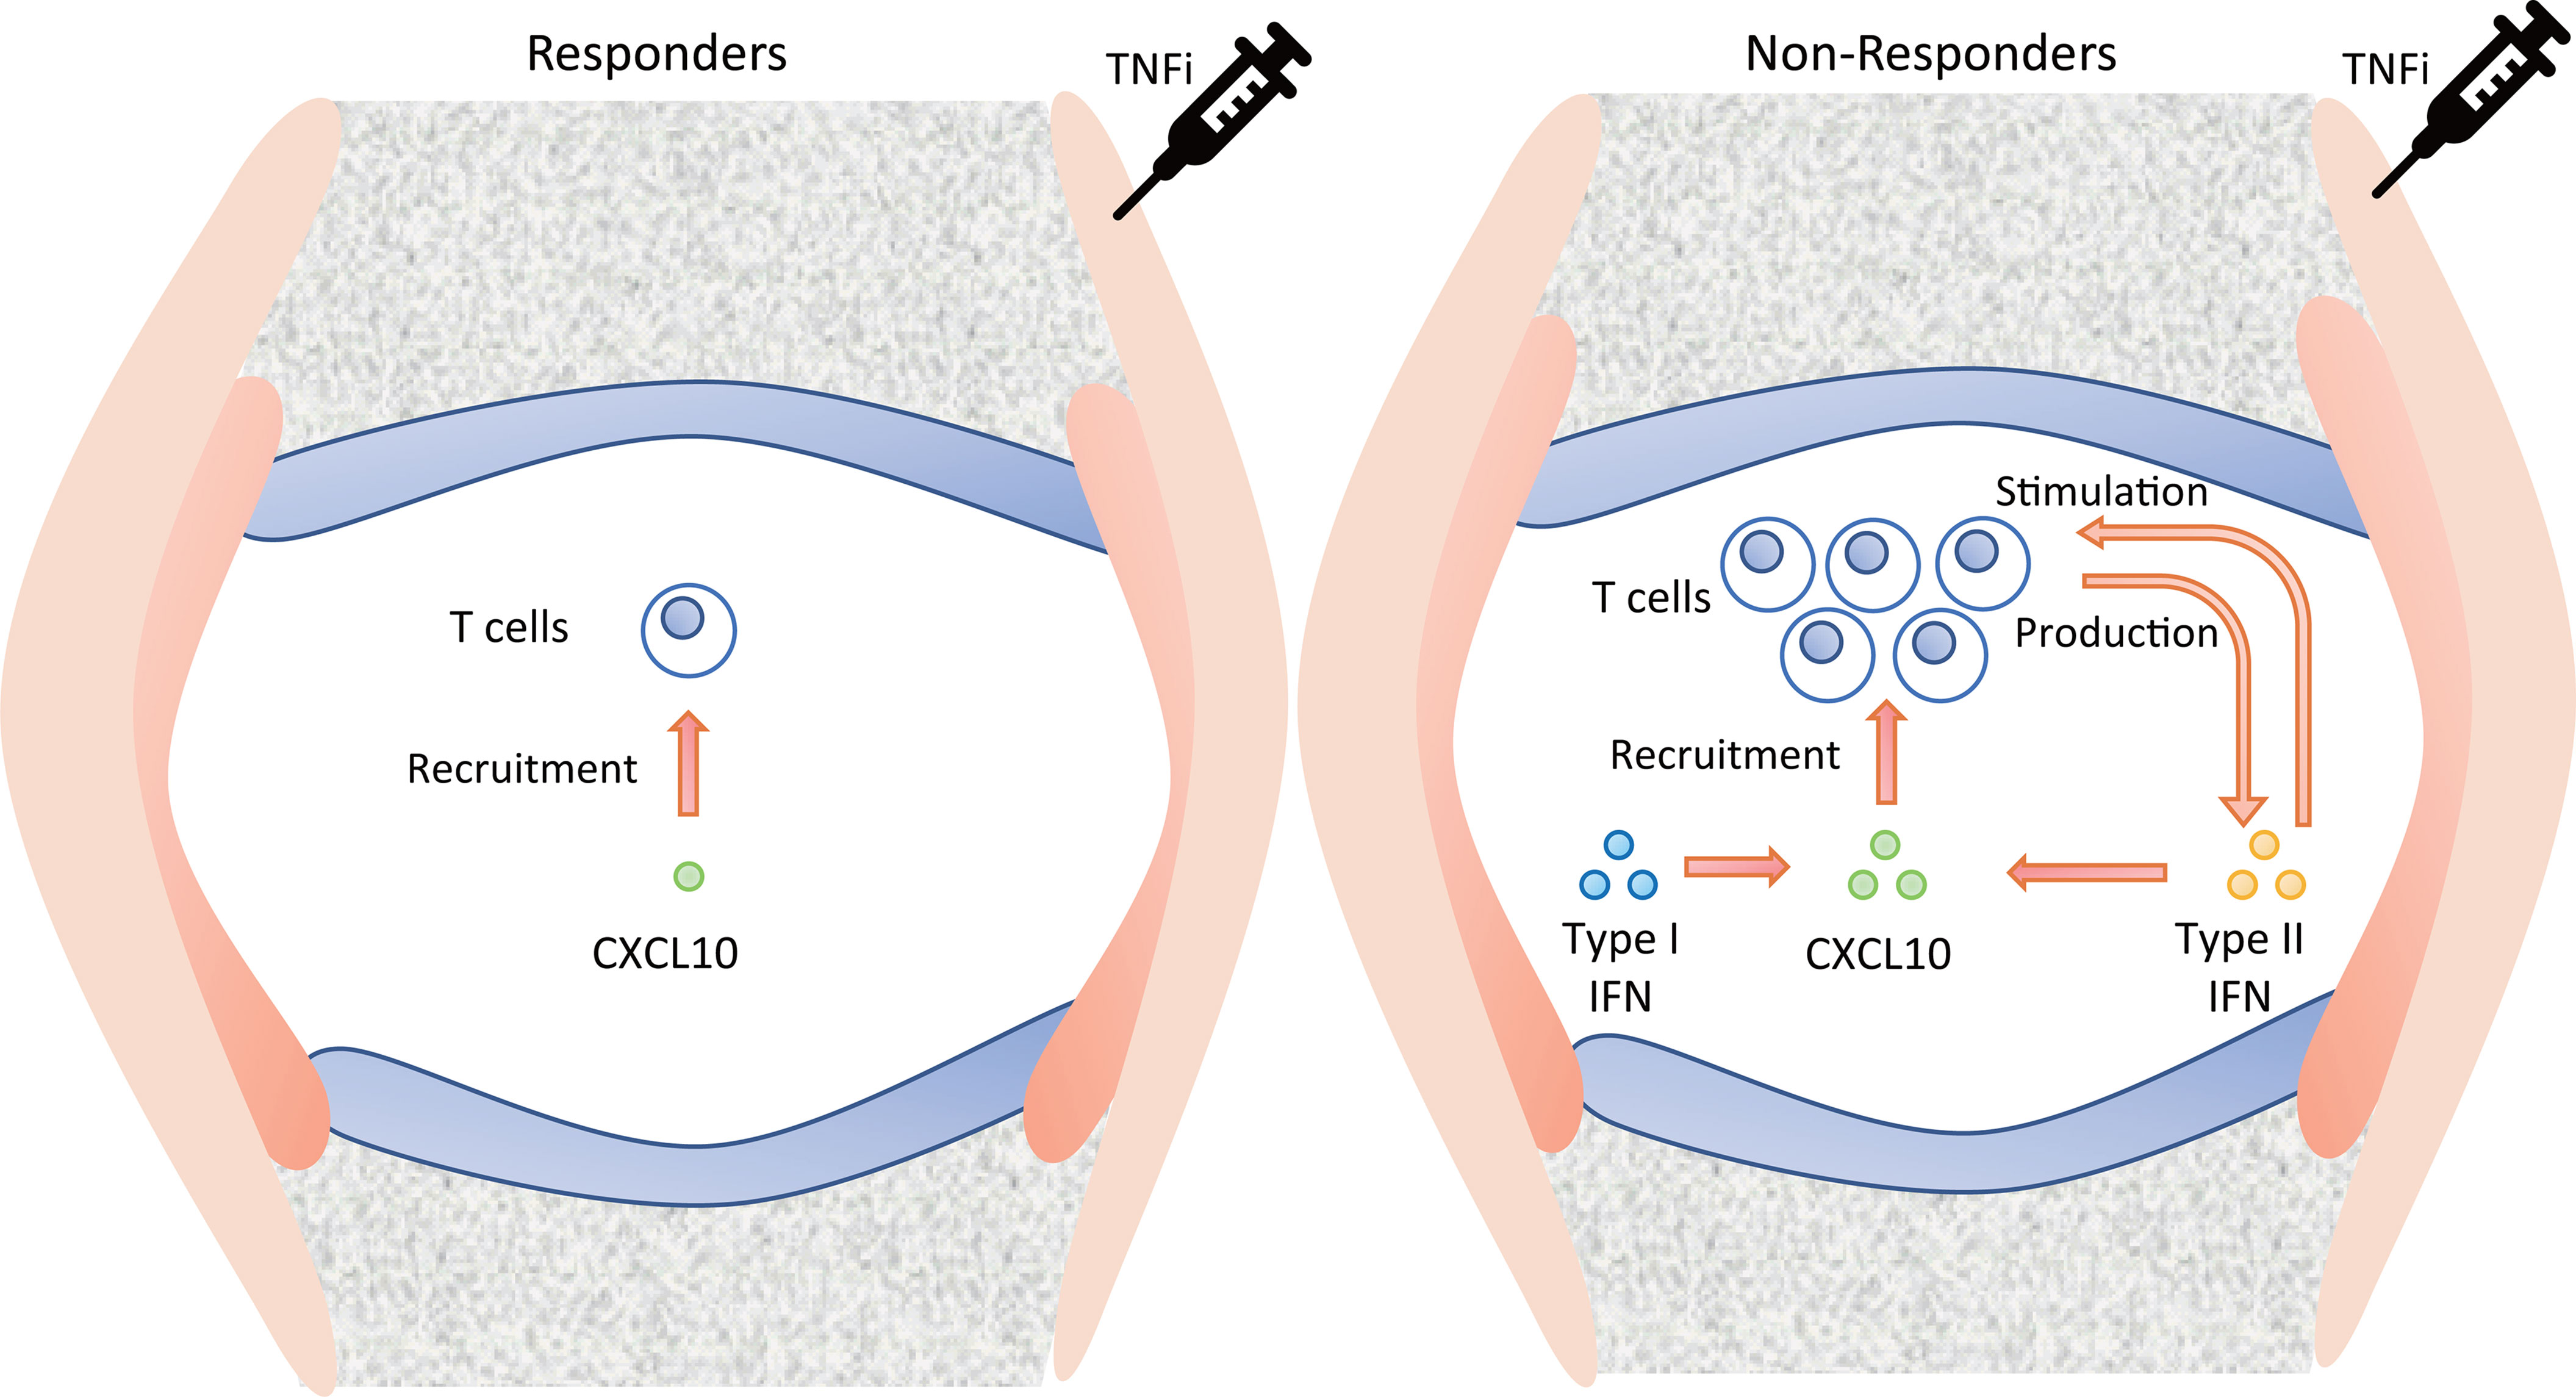
Figure 7 Suggested pathology of the synovium in TNFi responders and non-responders. TNFi, tumor necrosis factor inhibitor.
The findings of some studies are consistent with the present results, whereas others are not. The relationship observed between the high type I IFN signature before treatment and poor responses in the present study is consistent with previous findings (29, 30). On the other hand, elevated IFN signaling in neutrophils has been identified as a favorable therapeutic response (31, 32). This discrepancy may be explained as follows: 1) the timing of evaluations, with previous studies examining treatment responses at three months; 2) cell populations, with previous studies investigating the transcriptome of neutrophils; and 3) ethnicities, with previous studies enrolling Europeans. Moreover, the reported relationships between good responses and a high neutrophil-to-lymphocyte ratio (46) as well as higher levels of CXCL10 (47) are in contrast to the present results; however, the EULAR criteria were used to distinguish responders from non-responders in these studies. Since the EULAR response criteria define treatment response by ΔDAS28, patients with high disease activity might be classified as good responders. Such patients would eventually be switched to a different biologic in the long term and would be classified as non-responders by our definition. Indeed, in our study, among 13 patients who had a good response on EULAR after 3 months, approximately half (6 patients) were classified as non-responders in our definition. This drastic phenotypic change due to differences in classification algorithms might be the main reason for the discrepancy between our study and previous reports. One of the limitations of the present study is its relatively small sample size. Therefore, the results obtained need to be validated in other cohorts. Nevertheless, to the best of our knowledge, this is the first study to report long-term responses to TNFi, which provides biological insights into TNFi responses and potential therapeutic strategies for RA.
Data Availability Statement
All normalized gene counts for this study can be found in public, open access repository [ImmPort https://www.immport.org/shared/home (48)] with the accession ID SDY1924. All proteins, FACS data and table of correspondence between sample IDs in ImmPort and IDs in this paper are included in the Supplementary Table 12. Further data relating to the experiments described in this paper is available upon request; please contact the corresponding author.
Ethics Statement
The studies involving human participants were reviewed and approved by The Kyoto University Graduate School and Faculty of Medicine Ethics Committee (approval number: G0511-6). The patients/participants provided their written informed consent to participate in this study.
Author Contributions
TI wrote the first draft of the manuscript. RW revised and finalized the manuscript. All authors were involved in drafting the article or revising it critically for important intellectual content, and all authors approved the final version to be published. TI, RW, HI, MH contributed to the study conception and design. TI, RW, HI, KOk, TO, YH, KOh, KMurat, KMurak, MT, SM, AM, MH contributed to the acquisition of data. TI, RW, TF, KOh, HY, FM, MH contributed to analysis and/or interpretation of data.
Funding
This study received funding in part from the Special Coordination Funds for Promoting Science and Technology of the Japanese Government. The Department of Advanced Medicine for Rheumatic Diseases is supported by Nagahama City, Shiga, Japan, Toyooka City, Hyogo, Japan, and five pharmaceutical companies (Mitsubishi Tanabe Pharma Co., Chugai Pharmaceutical Co. Ltd, UCB Japan Co. Ltd, AYUMI Pharmaceutical Co., and Asahi Kasei Pharma Corp.). The KURAMA cohort is also supported by grant from Daiichi Sankyo Co. Ltd. The funders were not involved in the study design, collection, analysis, interpretation of data, the writing of this article or the decision to submit it for publication.
Conflict of Interest
RW received speaker fees from Mitsubishi Tanabe Pharma, Pfizer, Sanofi, AbbVie, Asahi Kasei, Eisai, Eli Lilly, Bristol-Myers Squibb, and Janssen. KOk, TO, YH are employees of Astellas Pharma Inc. KOh received research grants and/or speaker’s fees from Abbvie, Actelion, Asahikasei Pharma, Astellas, AYUMI, Bristol-Myers Squibb, Chugai, Daiichi-Sankyo, Eisai, Eli Lilly, GSK, Janssen, JB, Mitsubishi Tanabe, Nippon Kayaku, Nippon Shinyaku, Novartis, Sanofi, and Takeda. KMurat received a speaking fee from Eisai Co., Ltd., Chugai Pharmaceutical Co., Ltd.; Asahi Kasei Pharma Corp.; and Mitsubishi Tanabe Pharma Corporation. MT has received research grants and/or speaker fees from AbbVie GK, Asahi Kasei Pharma Corp., Astellas Pharma Inc., Ayumi Pharmaceutical Corp., Bristol-Myers Squibb, Chugai Pharmaceutical Co., Ltd., Eisai Co., Ltd., Eli Lilly Japan K.K., Pfizer Inc., UCB Japan Co., Ltd., Janssen Pharmaceutical K.K., Mitsubishi Tanabe Pharma Corp., Novartis Pharma K.K., Taisho Pharma Co., Ltd. AM has received research grants from AbbVie, Asahi Kasei Pharma, Chugai Pharmaceutical Co., Ltd., Ono Pharmaceutical and speaker fees from Eli Lilly, AbbVie, Ono Pharmaceutical, Pfizer, Astellas Pharmaceutical, and Chugai Pharmaceutical Co., Ltd. MH received a research grant and/or speaker’s fees from Bristol-Myers, Eisai, Eli Lilly, and Mitsubishi Tanabe Pharma.
The remaining authors declare that the research was conducted in the absence of any commercial or financial relationships that could be construed as a potential conflict of interest.
The authors declare that this study received funding from Astellas Pharma Inc. The funder had the following involvement with the study: approval of the submission for publication.
Publisher’s Note
All claims expressed in this article are solely those of the authors and do not necessarily represent those of their affiliated organizations, or those of the publisher, the editors and the reviewers. Any product that may be evaluated in this article, or claim that may be made by its manufacturer, is not guaranteed or endorsed by the publisher.
Acknowledgments
We thank all patients and physicians involved in the care of patients.
Supplementary Material
The Supplementary Material for this article can be found online at: https://www.frontiersin.org/articles/10.3389/fimmu.2022.901437/full#supplementary-material
References
1. Smolen JS, Aletaha D, McInnes IB. Rheumatoid Arthritis. Lancet (2016) 388:2023–38. doi: 10.1016/S0140-6736(16)30173-8
2. Smolen JS, Landewé RBM, Bijlsma JWJ, Burmester GR, Dougados M, Kerschbaumer A, et al. EULAR Recommendations for the Management of Rheumatoid Arthritis With Synthetic and Biological Disease-Modifying Antirheumatic Drugs: 2019 Update. Ann Rheum Dis (2020) 79:S685–99. doi: 10.1136/annrheumdis-2019-216655
3. Bek S, Bojesen AB, Nielsen JV, Sode J, Bank S, Vogel U, et al. Systematic Review and Meta-Analysis: Pharmacogenetics of Anti-TNF Treatment Response in Rheumatoid Arthritis. Pharmacogenomics J (2017) 17:403–11. doi: 10.1038/tpj.2017.26
4. Feldmann M, Maini SRN. Role of Cytokines in Rheumatoid Arthritis: An Education in Pathophysiology and Therapeutics. Immunol Rev (2008) 223:7–19. doi: 10.1111/j.1600-065X.2008.00626.x
5. Hetland ML, Christensen IJ, Tarp U, Dreyer L, Hansen A, Hansen IT, et al. Direct Comparison of Treatment Responses, Remission Rates, and Drug Adherence in Patients With Rheumatoid Arthritis Treated With Adalimumab, Etanercept, or Infliximab: Results From Eight Years of Surveillance of Clinical Practice in the Nationwide Danish DANBIO Registry. Arthritis Rheum (2010) 62:22–32. doi: 10.1002/art.27227
6. Xie X, Li F, Li S, Tian J, Chen JW, Du JF, et al. Application of Omics in Predicting Anti-TNF Efficacy in Rheumatoid Arthritis. Clin Rheumatol (2018) 37:13–23. doi: 10.1007/s10067-017-3639-0
7. Márquez A, Ferreiro-Iglesias A, Dávila-Fajardo CL, Montes A, Pascual-Salcedo D, Perez-Pampin E, et al. Lack of Validation of Genetic Variants Associated With Anti-Tumor Necrosis Factor Therapy Response in Rheumatoid Arthritis: A Genome-Wide Association Study Replication and Meta-Analysis. Arthritis Res Ther (2014) 16:R66. doi: 10.1186/ar4504
8. Spiliopoulou A, Colombo M, Plant D, Nair N, Cui J, Coenen MJH, et al. Association of Response to TNF Inhibitors in Rheumatoid Arthritis With Quantitative Trait Loci for CD40 and CD39. Ann Rheum Dis (2019) 78:1055–61. doi: 10.1136/annrheumdis-2018-214877
9. Tao W, Concepcion AN, Vianen M, Marijnissen ACA, Lafeber FPGJ, Radstake TRDJ, et al. Multiomics and Machine Learning Accurately Predict Clinical Response to Adalimumab and Etanercept Therapy in Patients With Rheumatoid Arthritis. Arthritis Rheumatol (2021) 73:212–22. doi: 10.1002/art.41516
10. OIiver J, Nair N, Orozco G, Smith S, Hyrich KL, Morgan A, et al. Transcriptome-Wide Study of TNF-Inhibitor Therapy in Rheumatoid Arthritis Reveals Early Signature of Successful Treatment. Arthritis Res Ther (2021) 23:80. doi: 10.1186/s13075-021-02451-9
11. Owczarczyk-Saczonek A, Owczarek W, Osmola-Mankowska A, Adamski Z, Placek W, Rakowska A. Secondary Failure of TNF-α Inhibitors in Clinical Practice. Dermatol Ther (2019) 32:e12760. doi: 10.1111/dth.12760
12. Helliwell PS, Ibrahim G. Ethnic Differences in Responses to Disease Modifying Drugs. Rheumatol (Oxford) (2003) 42:1197–201. doi: 10.1093/RHEUMATOLOGY/KEG354
13. Terao C, Hashimoto M, Yamamoto K, Murakami K, Ohmura K, Nakashima R, et al. Three Groups in the 28 Joints for Rheumatoid Arthritis Synovitis - Analysis Using More Than 17,000 Assessments in the KURAMA Database. PloS One (2013) 8:e59341. doi: 10.1371/journal.pone.0059341
14. Frank A, Steven E, Daniel B, Dennis M, James F, Norman C, et al. The American Rheumatism Association 1987 Revised Criteria for the Classification of Rheumatoid Arthritis. Arthritis Rheum (1988) 31:315–24. doi: 10.1002/ART.1780310302
15. Aletaha D, Neogi T, Silman AJ, Funovits J, Felson DT, Bingham CO, et al. Rheumatoid Arthritis Classification Criteria: An American College of Rheumatology/European League Against Rheumatism Collaborative Initiative. Ann Rheum Dis (2010) 69:1580–8. doi: 10.1136/ard.2010.138461
16. Fransen J, Creemers MCW, Van Riel PLCM. Remission in Rheumatoid Arthritis: Agreement of the Disease Activity Score (DAS28) With the ARA Preliminary Remission Criteria. Rheumatology (2004) 43:1252–5. doi: 10.1093/rheumatology/keh297
17. Dobin A, Davis CA, Schlesinger F, Drenkow J, Zaleski C, Jha S, et al. STAR: Ultrafast Universal RNA-Seq Aligner. Bioinformatics (2013) 29:15–21. doi: 10.1093/bioinformatics/bts635
18. Li B, Dewey CN. RSEM: Accurate Transcript Quantification From RNA-Seq Data With or Without a Reference Genome. BMC Bioinf (2011) 12:323. doi: 10.1186/1471-2105-12-323
19. Frankish A, Diekhans M, Ferreira AM, Johnson R, Jungreis I, Loveland J, et al. GENCODE Reference Annotation for the Human and Mouse Genomes. Nucleic Acids Res (2019) 47:D766–73. doi: 10.1093/nar/gky955
20. Love MI, Huber W, Anders S. Moderated Estimation of Fold Change and Dispersion for RNA-Seq Data With Deseq2. Genome Biol (2014) 15:550. doi: 10.1186/s13059-014-0550-8
21. Zhou Y, Zhou B, Pache L, Chang M, Khodabakhshi AH, Tanaseichuk O, et al. Metascape Provides a Biologist-Oriented Resource for the Analysis of Systems-Level Datasets. Nat Commun (2019) 10:1523 doi: 10.1038/s41467-019-09234-6
22. Arazi A, Rao DA, Berthier CC, Davidson A, Liu Y, Hoover PJ, et al. The Immune Cell Landscape in Kidneys of Patients With Lupus Nephritis. Nat Immunol (2019) 20:902–14. doi: 10.1038/s41590-019-0398-x
23. Szymczak F, Colli ML, Mamula MJ, Evans-Molina C, Eizirik DL. Gene Expression Signatures of Target Tissues in Type 1 Diabetes, Lupus Erythematosus, Multiple Sclerosis, and Rheumatoid Arthritis. Sci Adv (2021) 7:eabd7600. doi: 10.1126/SCIADV.ABD7600
24. Liberzon A, Subramanian A, Pinchback R, Thorvaldsdóttir H, Tamayo P, Mesirov JP. Molecular Signatures Database (MSigDB) 3.0. Bioinformatics (2011) 27:1739–40. doi: 10.1093/bioinformatics/btr260
25. Hao Y, Hao S, Andersen-Nissen E, Mauck WM, Zheng S, Butler A, et al. Integrated Analysis of Multimodal Single-Cell Data. Cell (2021) 184:3573–3587.e29. doi: 10.1016/J.CELL.2021.04.048
26. Newman AM, Steen CB, Liu CL, Gentles AJ, Chaudhuri AA, Scherer F, et al. Determining Cell Type Abundance and Expression From Bulk Tissues With Digital Cytometry. Nat Biotechnol (2019) 37:773–82. doi: 10.1038/S41587-019-0114-2
27. Ota M, Nagafuchi Y, Hatano H, Ishigaki K, Terao C, Takeshima Y, et al. Dynamic Landscape of Immune Cell-Specific Gene Regulation in Immune-Mediated Diseases. Cell (2021) 184:3006–3021.e17. doi: 10.1016/J.CELL.2021.03.056
28. Kalden JR, Schulze-Koops H. Immunogenicity and Loss of Response to TNF Inhibitors: Implications for Rheumatoid Arthritis Treatment. Nat Rev Rheumatol (2017) 13:707–18. doi: 10.1038/nrrheum.2017.187
29. Cava A L, Houen G, Ko K, Rodríguez-Carrio J, Alperi-López M, López P, et al. Heterogeneity of the Type I Interferon Signature in Rheumatoid Arthritis: A Potential Limitation for its Use as a Clinical Biomarker. Front Immunol (2018) 8:2007. doi: 10.3389/fimmu.2017.02007
30. Yukawa N, Fujii T, Kondo-Ishikawa S, Yoshifuji H, Kawabata D, Nojima T, et al. Correlation of Antinuclear Antibody and Anti-Double-Stranded DNA Antibody With Clinical Response to Infliximab in Patients With Rheumatoid Arthritis: A Retrospective Clinical Study. Arthritis Res Ther (2011) 13:R213. doi: 10.1186/ar3546
31. Wright HL, Thomas HB, Moots RJ, Edwards SW. Interferon Gene Expression Signature in Rheumatoid Arthritis Neutrophils Correlates With a Good Response to TNFi Therapy. Rheumatol (United Kingdom) (2014) 54:188–93. doi: 10.1093/rheumatology/keu299
32. Wright HL, Cox T, Moots RJ, Edwards SW. Neutrophil Biomarkers Predict Response to Therapy With Tumor Necrosis Factor Inhibitors in Rheumatoid Arthritis. J Leukoc Biol (2017) 101:785–95. doi: 10.1189/jlb.5a0616-258r
33. Vanguri P, Farber JM. Identification of CRG-2. An Interferon-Inducible mRNA Predicted to Encode a Murine Monokine. J Biol Chem (1990) 265:15049–57. doi: 10.1016/S0021-9258(18)77222-0
34. Honne K, Hallgrímsdóttir I, Wu C, Sebro R, Jewell NP, Sakurai T, et al. A Longitudinal Genome-Wide Association Study of Anti-Tumor Necrosis Factor Response Among Japanese Patients With Rheumatoid Arthritis. Arthritis Res Ther (2016) 18:12. doi: 10.1186/s13075-016-0920-6
35. Cantaert T, Baeten D, Tak PP, van Baarsen LGM. Type I IFN and Tnfα Cross-Regulation in Immune-Mediated Inflammatory Disease: Basic Concepts and Clinical Relevance. Arthritis Res Ther (2010) 12:219. doi: 10.1186/ar3150
36. Platanias LC. Mechanisms of Type-I- and Type-II-Interferon-Mediated Signalling. Nat Rev Immunol (2005) 5:375–86. doi: 10.1038/nri1604
37. PeckRadosavljevic M, Wichlas M, HomoncikKraml M, Kreil A, Hofer H, Jessner W, et al. Rapid Suppression of Hematopoiesis by Standard or Pegylated Interferon-Alpha. Gastroenterology (2002) 123:141–51. doi: 10.1053/GAST.2002.34175
38. Laragione T, Brenner M, Sherry B, Gulko PS. CXCL10 and its Receptor CXCR3 Regulate Synovial Fibroblast Invasion in Rheumatoid Arthritis. Arthritis Rheum (2011) 63:3274–83. doi: 10.1002/ART.30573
39. Lee JH, Kim B, Jin WJ, Kim HH, Ha H, Lee ZH. Pathogenic Roles of CXCL10 Signaling Through CXCR3 and TLR4 in Macrophages and T Cells: Relevance for Arthritis. Arthritis Res Ther (2017) 19:163. doi: 10.1186/S13075-017-1353-6
40. Huang C, Zheng Y, Bai J, Shi C, Shi X, Shan H, et al. Hepatocyte Growth Factor Overexpression Promotes Osteoclastogenesis and Exacerbates Bone Loss in CIA Mice. J Orthop Transl (2021) 27:9–16. doi: 10.1016/j.jot.2020.10.011
41. Grandaunet B, Syversen SW, Hoff M, Sundan A, Haugeberg G, van der Heijde D, et al. Association Between High Plasma Levels of Hepatocyte Growth Factor and Progression of Radiographic Damage in the Joints of Patients With Rheumatoid Arthritis. Arthritis Rheum (2011) 63:662–9. doi: 10.1002/ART.30163
42. Miyabe Y, Lian J, Miyabe C, Luster AD. Chemokines in Rheumatic Diseases: Pathogenic Role and Therapeutic Implications. Nat Rev Rheumatol (2019) 15:731–46. doi: 10.1038/S41584-019-0323-6
43. Zhang F, Wei K, Slowikowski K, Fonseka CY, Rao DA, Kelly S, et al. Defining Inflammatory Cell States in Rheumatoid Arthritis Joint Synovial Tissues by Integrating Single-Cell Transcriptomics and Mass Cytometry. Nat Immunol (2019) 20:928–42. doi: 10.1038/S41590-019-0378-1
44. Ivashkiv LB. Ifnγ: Signalling, Epigenetics and Roles in Immunity, Metabolism, Disease and Cancer Immunotherapy. Nat Rev Immunol (2018) 18:545–58. doi: 10.1038/S41577-018-0029-Z
45. Luster AD, Unkeless JC, Ravetch JV. Gamma-Interferon Transcriptionally Regulates an Early-Response Gene Containing Homology to Platelet Proteins. Nature (1985) 315:672–6. doi: 10.1038/315672A0
46. Farutin V, Prod T, McConnell K, Washburn N, Halvey P, Etzel CJ, et al. Molecular Profiling of Rheumatoid Arthritis Patients Reveals an Association Between Innate and Adaptive Cell Populations and Response to Anti-Tumor Necrosis Factor. Arthritis Res Ther (2019) 21:216. doi: 10.1186/s13075-019-1999-3
47. Han BK, Kuzin I, Gaughan JP, Olsen NJ, Bottaro A. Baseline CXCL10 and CXCL13 Levels are Predictive Biomarkers for Tumor Necrosis Factor Inhibitor Therapy in Patients With Moderate to Severe Rheumatoid Arthritis: A Pilot, Prospective Study. Arthritis Res Ther (2016) 18:93. doi: 10.1186/s13075-016-0995-0
Keywords: anti-TNF therapy, multi-omics analysis, rheumatoid arthritis, type I interferon signature, type II interferon signature
Citation: Iwasaki T, Watanabe R, Ito H, Fujii T, Okuma K, Oku T, Hirayama Y, Ohmura K, Murata K, Murakami K, Yoshitomi H, Tanaka M, Matsuda S, Matsuda F, Morinobu A and Hashimoto M (2022) Dynamics of Type I and Type II Interferon Signature Determines Responsiveness to Anti-TNF Therapy in Rheumatoid Arthritis. Front. Immunol. 13:901437. doi: 10.3389/fimmu.2022.901437
Received: 22 March 2022; Accepted: 28 April 2022;
Published: 06 June 2022.
Edited by:
Gaby Palmer, Université de Genève, SwitzerlandReviewed by:
Kazuhisa Nakano, University of Occupational and Environmental Health Japan, JapanShigeru Iwata, Wakayama Medical University, Japan
Copyright © 2022 Iwasaki, Watanabe, Ito, Fujii, Okuma, Oku, Hirayama, Ohmura, Murata, Murakami, Yoshitomi, Tanaka, Matsuda, Matsuda, Morinobu and Hashimoto. This is an open-access article distributed under the terms of the Creative Commons Attribution License (CC BY). The use, distribution or reproduction in other forums is permitted, provided the original author(s) and the copyright owner(s) are credited and that the original publication in this journal is cited, in accordance with accepted academic practice. No use, distribution or reproduction is permitted which does not comply with these terms.
*Correspondence: Ryu Watanabe, d2F0YW5hYmUucnl1QG1lZC5vc2FrYS1jdS5hYy5qcA==; Motomu Hashimoto, aGFzaGltb3RvLm1vdG9tdUBtZWQub3Nha2EtY3UuYWMuanA=