 Rong Tang
 Ting Zhong
 Li Fan
 Yuting Xie
 Juan Li
 Xia Li
95% of researchers rate our articles as excellent or good
Learn more about the work of our research integrity team to safeguard the quality of each article we publish.
Find out more
ORIGINAL RESEARCH article
Front. Immunol. , 23 May 2022
Sec. Autoimmune and Autoinflammatory Disorders
Volume 13 - 2022 | https://doi.org/10.3389/fimmu.2022.897047
This article is part of the Research Topic 21st Century Advances in Type 1 Diabetes Research and Immunotherapy View all 9 articles
Background: Abnormal intracellular glucose/fatty acid metabolism of T cells has tremendous effects on their immuno-modulatory function, which is related to the pathogenesis of autoimmune diseases. However, the association between the status of intracellular metabolism of T cells and type 1 diabetes is unclear. This study aimed to investigate the uptake of glucose and fatty acids in T cells and its relationship with disease progression in type 1 diabetes.
Methods: A total of 86 individuals with type 1 diabetes were recruited to detect the uptake of glucose and fatty acids in T cells. 2-NBDG uptake and expression of glucose transporter 1 (GLUT1); or BODIPY uptake and expression of carnitine palmitoyltransferase 1A(CPT1A) were used to assess the status of glucose or fatty acid uptake in T cells. Patients with type 1 diabetes were followed up every 3-6 months for 36 months, the progression of beta-cell function was assessed using generalized estimating equations, and survival analysis was performed to determine the status of beta-cell function preservation (defined as 2-hour postprandial C-peptide >200 pmol/L).
Results: Patients with type 1 diabetes demonstrated enhanced intracellular glucose uptake of T cells as indicated by higher 2NBDG uptake and GLUT1 expression, while no significant differences in fatty acid uptake were observed. The increased T cells glucose uptake is associated with lower C-peptide and higher hemoglobin A1c levels. Notably, patients with low T cell glucose uptake at onset maintained high levels of C-peptide within 36 months of the disease course [fasting C-petite and 2-hour postprandial C-peptide are 60.6 (95%CI: 21.1-99.8) pmol/L and 146.3 (95%CI: 14.1-278.5) pmol/L higher respectively], And they also have a higher proportion of beta-cell function preservation during this follow-up period (P<0.001).
Conclusions: Intracellular glucose uptake of T cells is abnormally enhanced in type 1 diabetes and is associated with beta-cell function and its progression.
Autoreactive T cells have a pivotal pathogenic role in the autoimmune process of beta-cell destruction in type 1 diabetes (T1D), making them ideal targets for immunotherapy strategies aiming to prevent or delay the disease (1, 2). However, clinical evidence witnessed refractory results to standard immunomodulatory and immunosuppressive strategies (3–5). In this sense, the identification and characterization of novel target pathways to control the T cell response to beta cells is still a strong demand (6).
There is a growing appreciation that the function and response of T cells are tightly linked to their bio-energetic metabolism (7). Resting T cells import small amounts of glucose to maintain basal energy and biosynthesis. However, immediately upon activation, T cells strongly upregulate the anabolic process of glycolysis even in the presence of oxygen (Warburg effect) (8, 9). Moreover, it should be noted that the function and metabolism of T cells are bidirectional. On the one hand, T cells with different functions have different intracellular energy metabolism (10); On the other hand, abnormal metabolism of T cells also affects their function (11, 12). In recent years, accumulating evidence demonstrated that abnormal metabolism of T cells is involved in the pathological mechanism of various diseases by regulating immune function (13–15), especially in some autoimmune diseases such as systemic lupus erythematosus and rheumatoid arthritis (16, 17). Further, a few limited animal studies indicated that metabolic inhibition is an effective strategy to weaken the T cell effect in preclinical models of autoimmunity (18–20). Especially, the use of glucose uptake pathway inhibitors can alleviate effectively insulitis in NOD mice (21–23). However, the role of T cell metabolism in T1D patients remains unclear. The possibility of intracellular metabolism of T cells as innovative targets for T1D intervention would be strengthened if the status of intracellular glucose uptake in T cells is well researched. So, we aimed to investigate the intracellular metabolism of T cells and its association with beta-cell function in clinical settings.
A total of 86 patients were recruited from a T1D cohort at the Second Xiangya Hospital, Central South University (ClinicalTrials.gov ID: NCT03610984). Inclusive criteria include 1) diagnosis of diabetes according to the 1999 world health organization (WHO) criteria (24); 2) newly diagnosed with the disease duration within 12 months; 3) positive for at least one of the three islet autoantibodies (glutamic acid decarboxylase antibody [GADA], protein tyrosine phosphatase autoantibody [IA-2A], zinc transporter 8 autoantibody [ZnT8A]; 4) clinically insulin-dependent. Participants who had severe liver/renal impairment, severe heart failure requiring treatment, a history of malignant tumor, acute or chronic infection, or receiving glucocorticoid therapy, pregnancy, and breastfeeding were excluded.
At the time of initial enrollment, demographic information and clinical indicators including gender, age at onset, height, weight, body mass index (BMI), and diabetes autoantibodies, the occurrence of diabetic ketosis/ketoacidosis (DK/DKA) at onset, daily insulin dose, hemoglobin A1c (HbA1c), fasting C-peptide (FCP), 2-hour postprandial C-peptide (2h-CP) by mixed-meal tolerance test (MMTT) were collected and measured for analysis. A standard 543.6 kcal MMTT was performed, with 44.4% of calories coming from carbohydrates, 47.7% from fat, and 7.9% from protein. Long-acting insulin and basal rates (for insulin pump users) were used normally on the day before or on the morning of the study, but their morning dose of short-acting insulin or rapid-acting insulin was withheld as previously reported (25). The MMTT was conducted at least two weeks after the correction of ketoacidosis. After 8 hours of fasting, serum C-peptide levels were tested at 0 and 120 min after a mixed meal. The C-peptide area under curve (AUC-CP) was calculated by the trapezoidal method. Beta-cell function preservation was defined as 2h-CP >200 pmol/L (25).
Participants with T1D were followed up every 3-6 months for a total of 36 months, HbA1c and FCP, 2h-CP by MMTT were measured at each visit. The termination of follow-up was determined when the C-peptide level was <16.5 pmol/L (n=8) or 36 months after onset (n=61). Of all the participants, the mean follow-up time was 28.0 ± 8.8 months, with 8 patients lost to follow-up and 9 patients cut off due to the end of this study.
Normal control (NC) was recruited through a recruitment advertisement at local medical centers. All controls underwent oral glucose tolerance test (OGTT) screening and three islet autoantibodies (GADA, IA-2A, and ZnT8A) testing. Those with normal results were eligible. Also, their medical history excludes those with a positive family history of diabetes, infection, autoimmune disease, severe liver or kidney damage, or steroid hormone therapy. We used the method of group matching, and controls were matched for gender and age with T1D patients.
This study was approved by the Ethics Committee of the Second Xiangya Hospital of Central South University, and all subjects provided written informed consent.
HbA1c was detected by automatic liquid chromatography (VARIANT II hemoglobin test system Bio-Rad Laboratories, Hercules, CA).
C-peptide levels were measured by a chemiluminescence method using the Advia Centaur System kit (Siemens, Munich, Germany). The inter- and intra-assay variation coefficients were 3.7% to 4.1% and 1.0% to 3.3%, respectively, as previously reported (26).
GADA, IA-2A, and ZnT8A were measured by radioimmune assay (RIA) as previously reported (27–29). The positive boundary values of antibodies were: GADA≥0.05 titer, IA-2A≥0.02 titer, ZnT8A≥0.011 titers. The sensitivities were 78%, 74%, and 70%, respectively. The specificity was 96.7%, 96.7%, and 98.9%, respectively. In accordance with the Islet Autoantibody Standardization Program (IASP 2012). The suspicious positive samples were confirmed by secondary testing.
5x10⁵ – 1x10⁶ cells were harvested and stained for surface and intracellular markers for flow cytometric analysis as described (30). All antibodies were purchased from BD Biosciences or Biolegend. Briefly, living cells were labeled with Fixable Viability Stain 620 dye and then incubated with Fc block for 10 minutes. Surface staining was performed at 4°C using CD4-APC-Cy7, CD8-PE, glucose transporter 1 (GLUT1)-Alexa Fluor 647 in FACS buffer (1% BSA in PBS) for 20 min. Some cells were fixed and permeabilized (BD Biosciences, 554714) for intracellular staining, and mitochondrial intima Carnitine palmitoyltransferase 1A (CPT1A)- Alexa Fluor 647 of these cells were labeled.
To measure glucose uptake or fatty acid uptake, cells were incubated in glucose-free RPMI 1640 medium containing 100 μmol/L 2NBDG (2-[N-(7-nitrobenz-2-oxa-1, 3-diaxOL-4-yl) Amino]-2-deoxyglucose, Thermo Fisher) or in PBS with 20 μmol/L FA-free BSA (A8806; Sigma-Aldrich) containing 2 μmol/L BODIPY FL C16 (4,4-Difluoro-5,7-Dimethyl-4-Bora-3a,4a-Diaza-s-Indacene-3-HexadecanoicAcid, Thermo Fisher) for 30 minutes at 37°C in a cell incubator. 2NBDG and BODIPY uptake was quenched by adding 4× volume of ice-cold PBS with 2% FBS, and flow cytometry analysis was performed after surface and intracellular staining.
For all flow cytometry studies, fluorescence was measured using a BD FACSCanto II flow cytometer and data were analyzed with FlowJo 10.0 software. The single fluorescence sample was used to calibrate the instrument regularly. Lymphocytes were circled by the forward/lateral scattering Angle (FSC-A/SSC-A), Adhesion cells were removed by FSC-A/FSC-H. The gating strategy is shown in Supplement Figure 1. The percentages of 2NDBG+, BODIPY+, GLUT1+, and CPT1A+ cells were marked to assess glucose and fatty acid uptake levels as described in previous publications (31–33).
SPSS 26.0 and GraphPad Prism 9 were used for analysis. Data are expressed when normally distributed as means ± SD and when abnormally distributed as median (25th, 75th percentiles). Comparison of means using the T test or Mann-Whitney U test. The enumerative data is expressed as a constituent ratio or rate. Frequency differences were compared using the χ2 test. Spearman or Pearson analysis was used for correlation analysis and Linear regression analysis was applied to the glucose uptake vs clinical characteristics when used as a continuous variable. The analysis of covariance (ANCOVA) was used to adjust for the course of disease. Generalized Estimating Equations (GEE) was used to analyze repeated measurement data during follow-up (25). GEE was employed to compare the C-peptide and HbA1c levels in patients with high and low T cells glucose uptake. Survival analysis of preserved beta-cell function (2h-CP>200 pmol/L) was performed using the Kaplan-Meier method. P < 0.05 was considered significant.
A total of 86 patients (48 males and 38 females) with T1D were recruited. Their median age of onset was 14.4 (11.1, 20.6) years, and the disease course was 3.4 (1.1, 6.4) months. The clinical characteristics of T1D and NC (n=45) individuals were shown in Table 1. No significant differences in gender proportion, age, and BMI were found between the two groups.
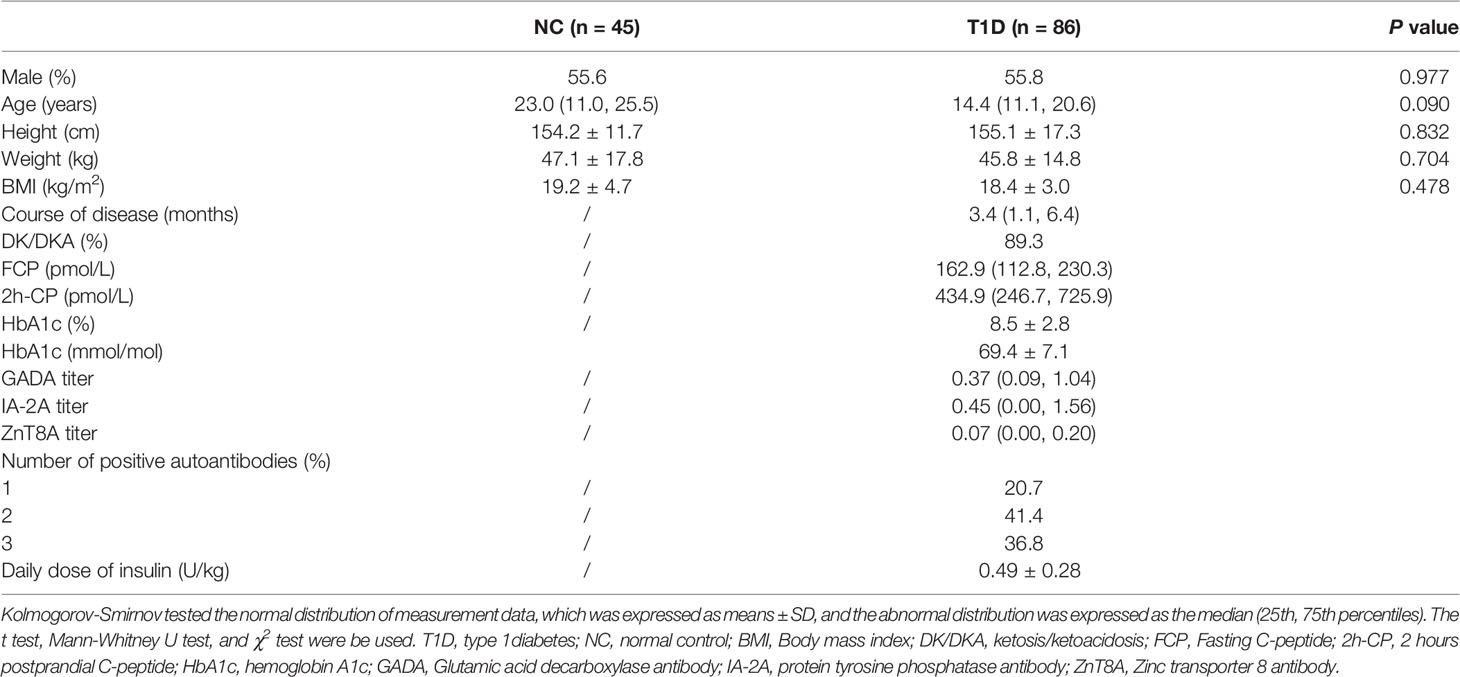
Table 1 The clinical characteristics of T1D patients and NC individuals.
The fatty acid uptake of CD4+ and CD8+ T cells was not significantly different between the T1D and NC individuals, as indicated by similar levels of BODIPY and CPT1A (Supplement Figure 2). Whereas, the upregulated of 2NBDG and GLUT1 in T cells suggested an enhanced intracellular glucose uptake in T1D patients, compared to the NC group (Figure 1).
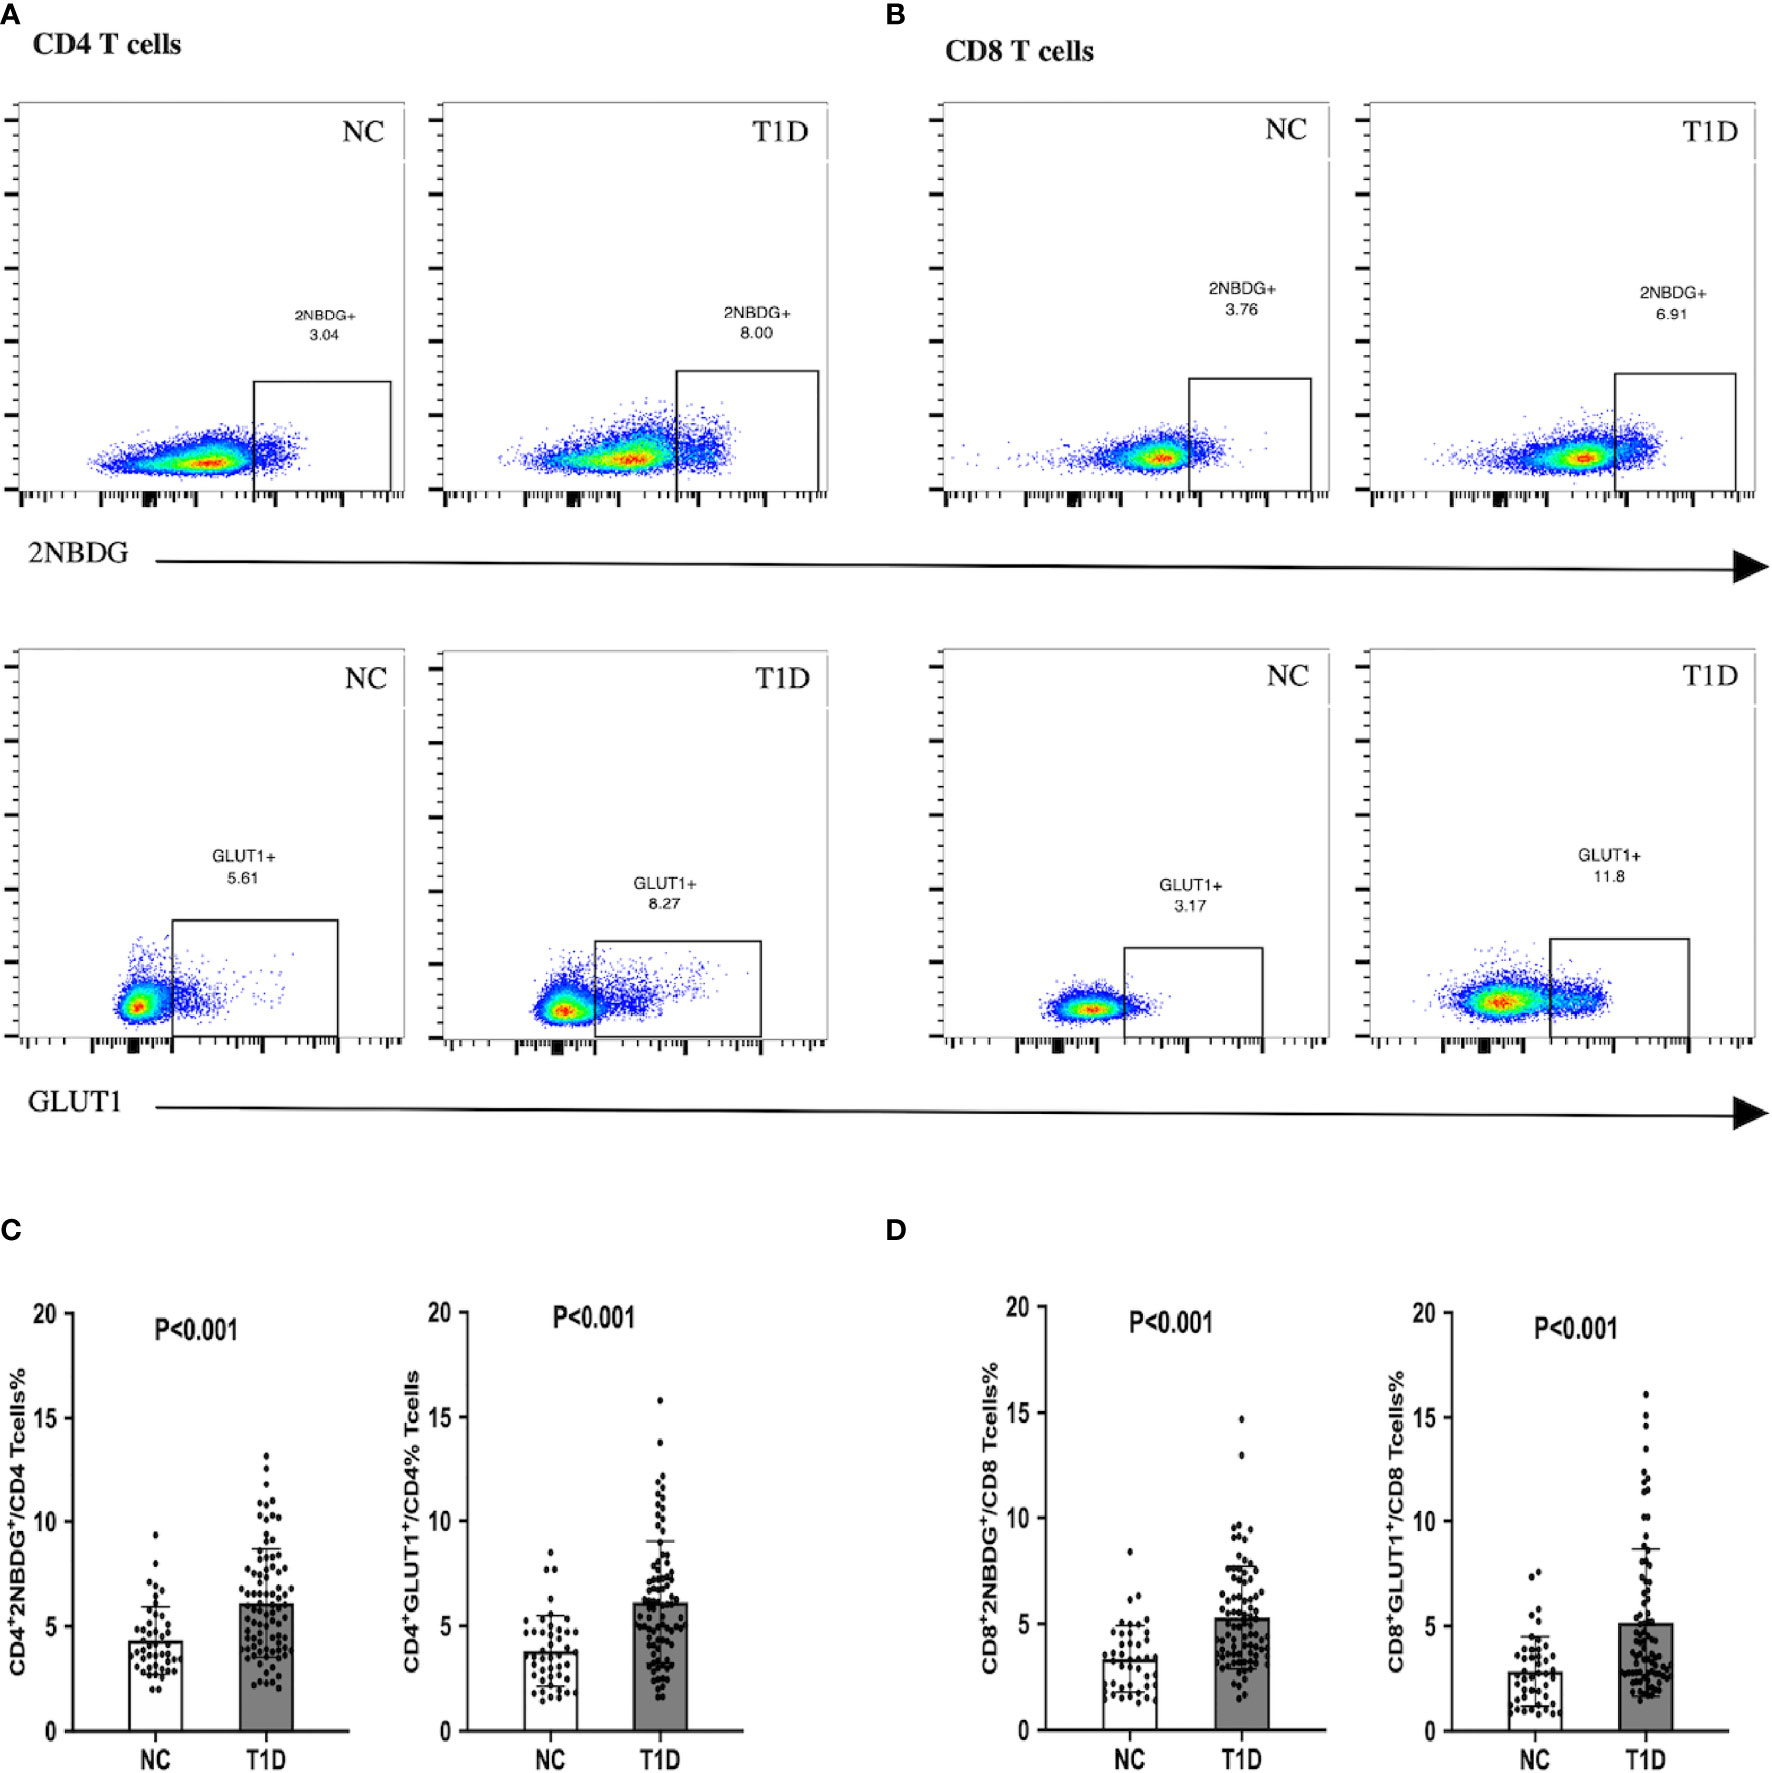
Figure 1 Glucose uptake and GLUT1 expression of CD4+/CD8+ T cells in patients with T1D. T1D patients demonstrated enhanced intracellular glucose uptake. (A, C) The proportion of 2NBDG+ and GLUT1+ cells in CD4+ cells. (B, D) The proportion of 2NBDG+ and GLUT1+ cells in CD8+ cells. The bar and error bar = mean and SD. T1D, type 1diabetes; NC, normal control; GLUT1, glucose transporter 1.
Further, the association of T cell glucose uptake (measured by 2NBDG uptake and GLUT1 expression) with clinical features in T1D was investigated. Subgroup analysis demonstrated that the patients with better beta-cell function (FCP>150.0 pmol/L or 2h-CP >450.0 pmol/L) and better glycemic control (HbA1c≤ 7.0%/53.0 mmol/mol) had lower glucose uptake of T cells (Figure 2). Subsequently, the correlation analysis confirmed that the glucose uptake of T cells was negatively correlated with FCP and 2h-CP, and positively correlated with HbA1c, as the correlation of these clinical indications with 2NBDG+ and GLUT1+ in CD4+/CD8+ T cells was consistent (Table 2). Similar results were found in regression analysis (Figure 3). There was no difference in T cell glucose uptake in the subgroup with other clinical indicators such as the age of onset, gender, BMI, the status of islet autoantibodies, etc. (Supplement Table 1). The correlation analysis of T cell fatty acid uptake (%BODIPY and CPT1A of T cells) with clinical characteristics in T1D was not statistically different as well (Supplement Table 2).
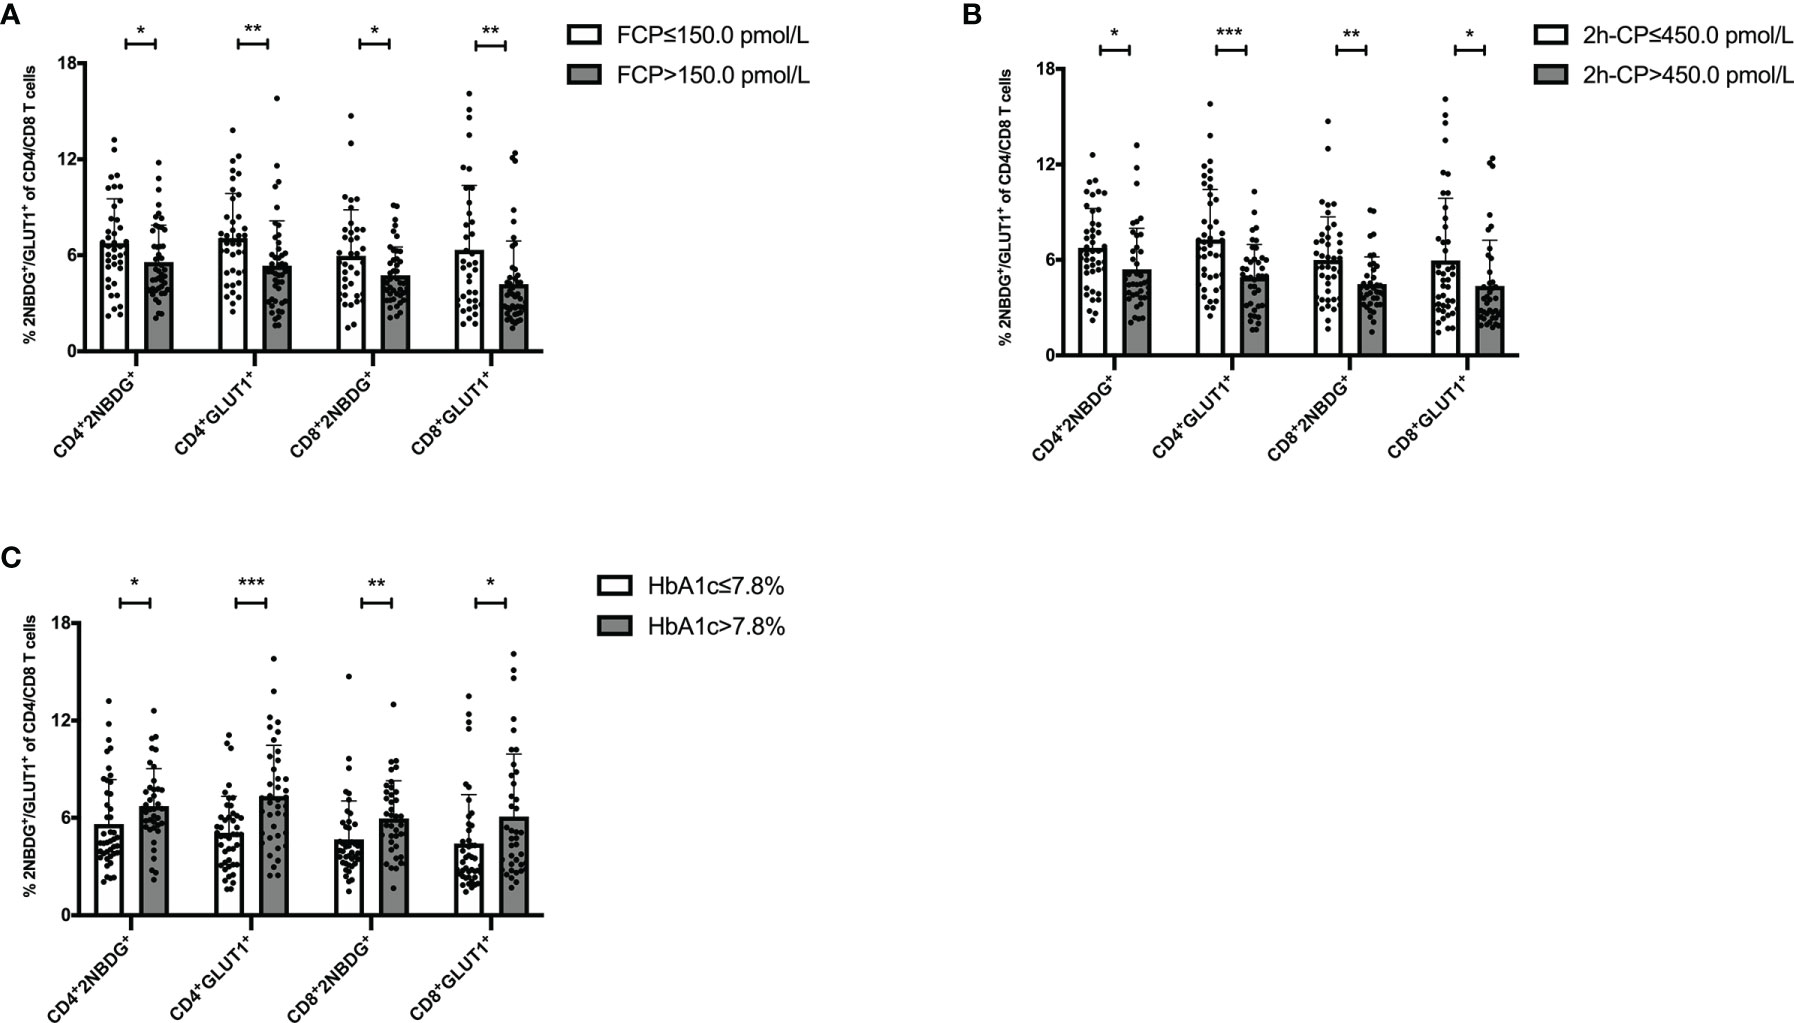
Figure 2 The status of glucose uptake in T cells is related to clinical features of T1D. Patients with FCP>150.0 pmol/L (A) 2h-CP >450.0 pmol/L (B) and HbA1c ≤ 7.0%/53.0 mmol/mol (C) had lower glucose uptake in T cells. The bar and error bar = mean and SD. FCP, Fasting C-peptide; 2h-CP, 2 hours postprandial C-peptide; HbA1c, hemoglobin A1c; 2NBDG, 2-deoxyglucose; GLUT1, glucose transporter 1. *P < 0.05, **P < 0.01, ***P < 0.001.
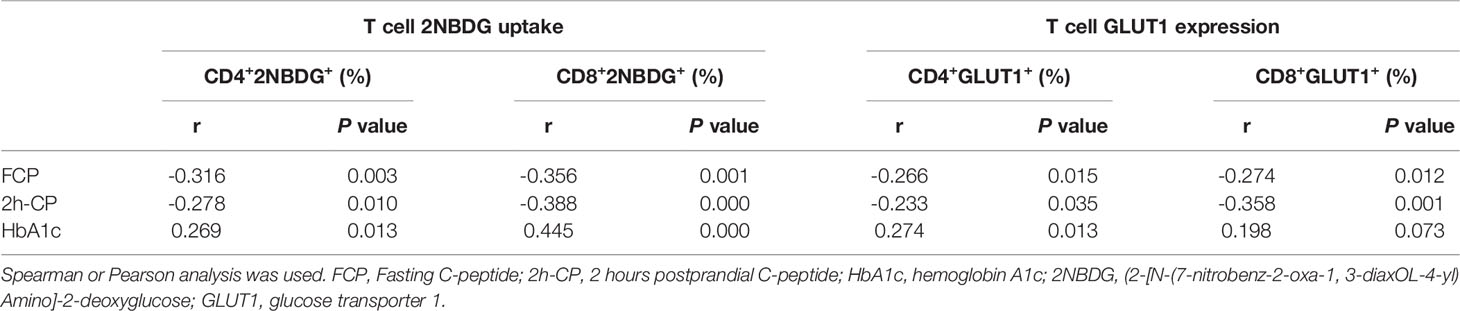
Table 2 Correlation analysis between T cell glucose uptake and clinical indicators in T1D.
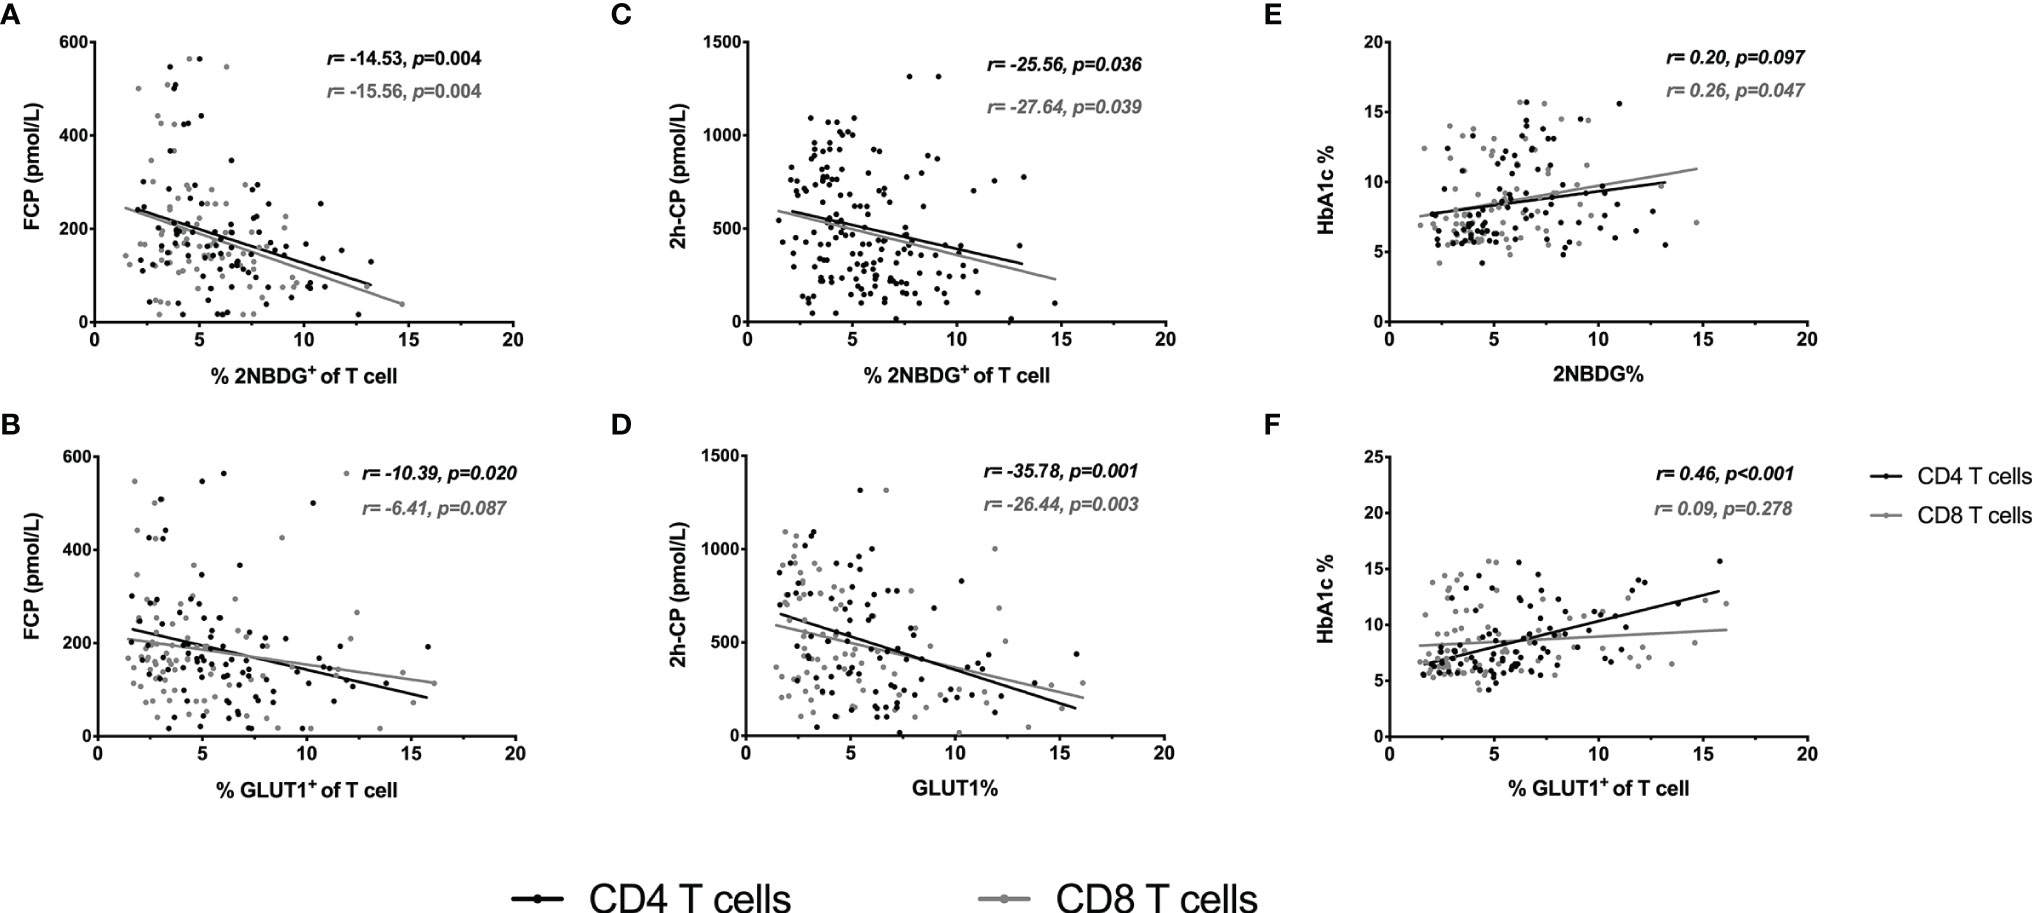
Figure 3 Regression analysis of T cell glucose uptake with clinical characteristics. Linear regression analysis of T-cell glucose uptake vs FCP (A, B), 2h-CP (C, D) and HbA1c (E, F). The black line and dots represent CD4+ T cells, the gray line and dots represent CD8+ T cells. FCP, Fasting C-peptide; 2h-CP, 2 hours postprandial C-peptide; HbA1c, hemoglobin A1c; 2NBDG, 2-deoxyglucose; GLUT1, glucose transporter 1.
In all T1D population, the median of %2NBDG of CD4+/CD8+ T cells and %GLUT1 of CD4+/CD8+ T cells were 5.81%, 5.82%, 4.88% and 3.72%, respectively. When the above 4 indicators of an individual were all higher than the median value, they were defined as the high glucose uptake group (n=37), and when they were all lower than the median value, they were defined as the low glucose uptake group (n=37). The other 12 cases were excluded from further analysis because their percentage of 2NBDG+ and GLUT1+ in CD4+/CD8+ T cells did not fulfill the above criteria (Table 3). The comparison of clinical features between the two groups showed that patients with higher T cell glucose uptake had a shorter diabetes course (1.4 months vs 5.9 months, P<0.001), lower FCP (121.8 pmol/L vs 211.3 pmol/L, P<0.001) and 2h-CP (271.8 pmol/L vs 702.4 pmol/L, P<0.001), and expected higher HbA1c levels (9.8% vs 6.6%, or 83.6 mmol/mol vs 48.6mmol/mol, P<0.001). Moreover, there were still significant differences in FCP, 2h-CP, and HbA1c between the two groups after the course of disease was corrected (Table 4).
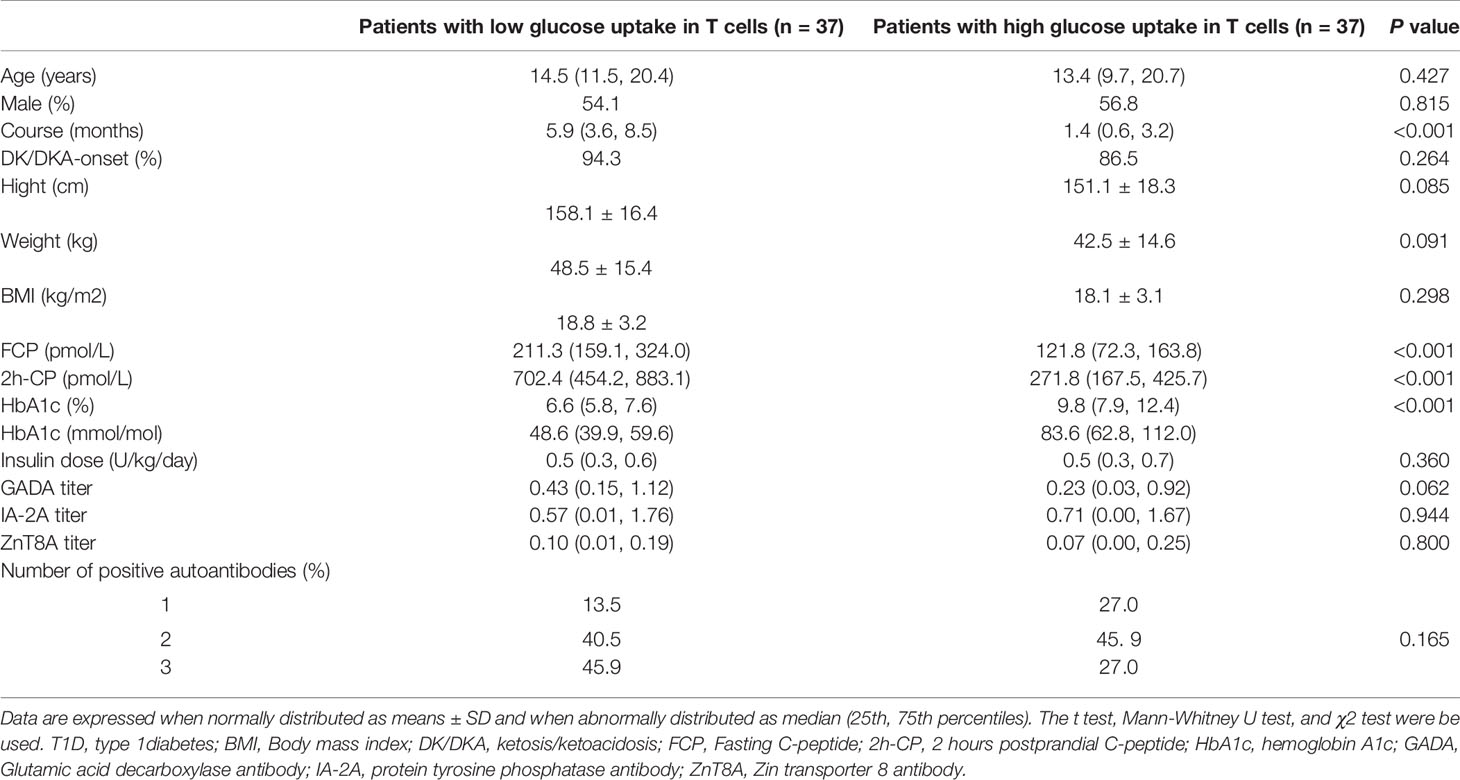
Table 3 Clinical characteristics in T1D patients with different status of glucose uptake in T cells.
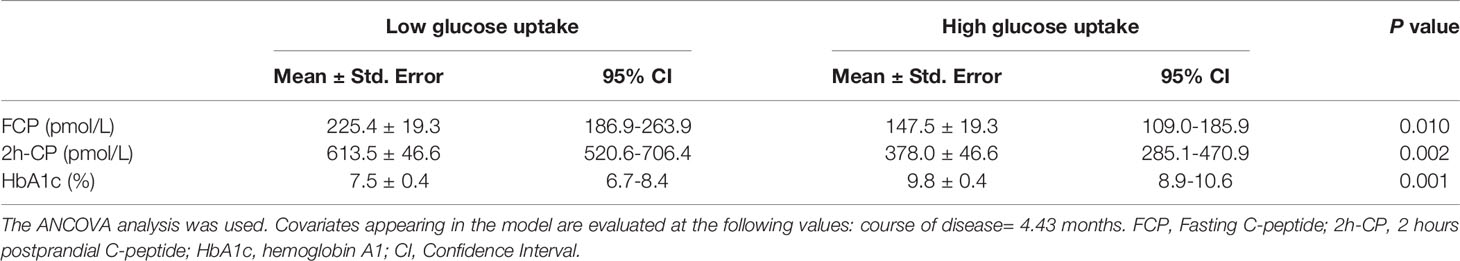
Table 4 Clinical characteristics in T1D after adjustment for disease course.
Further results on the dynamic changes in beta-cell function and HbA1c levels between the two groups were analyzed with follow-up data. It is noteworthy that the advantage of preserved beta-cell function and trajectory of glycemic control in patients with low T cells glucose uptake was maintained during the 36-month follow-up period (Figure 4). Compared with the high glucose uptake group, FCP, 2h-CP, and AUC-CP of the low glucose uptake group were 60.5 (95%CI: 21.1-99.8) pmol/L, 146.3 (95%CI: 14.1-278.5) pmol/L, and 206.4 (95%CI: 39.9-372.8) pmol/L higher, respectively, while HbA1c was 0.9 (95%CI: 0.09-1.74) % lower. In addition, this advantage of better beta-cell function in the low glucose uptake group persisted after adjustment for the course of the disease, C-peptide at onset, and HbA1c (Table 5). Furthermore, The survival analysis showed that the proportion of beta-cell preservation (defined as 2h-CP>200 pmol/L) in patients with low glucose uptake was also significantly higher than that in the high glucose uptake subgroup within 36 months after onset (Figure 5).
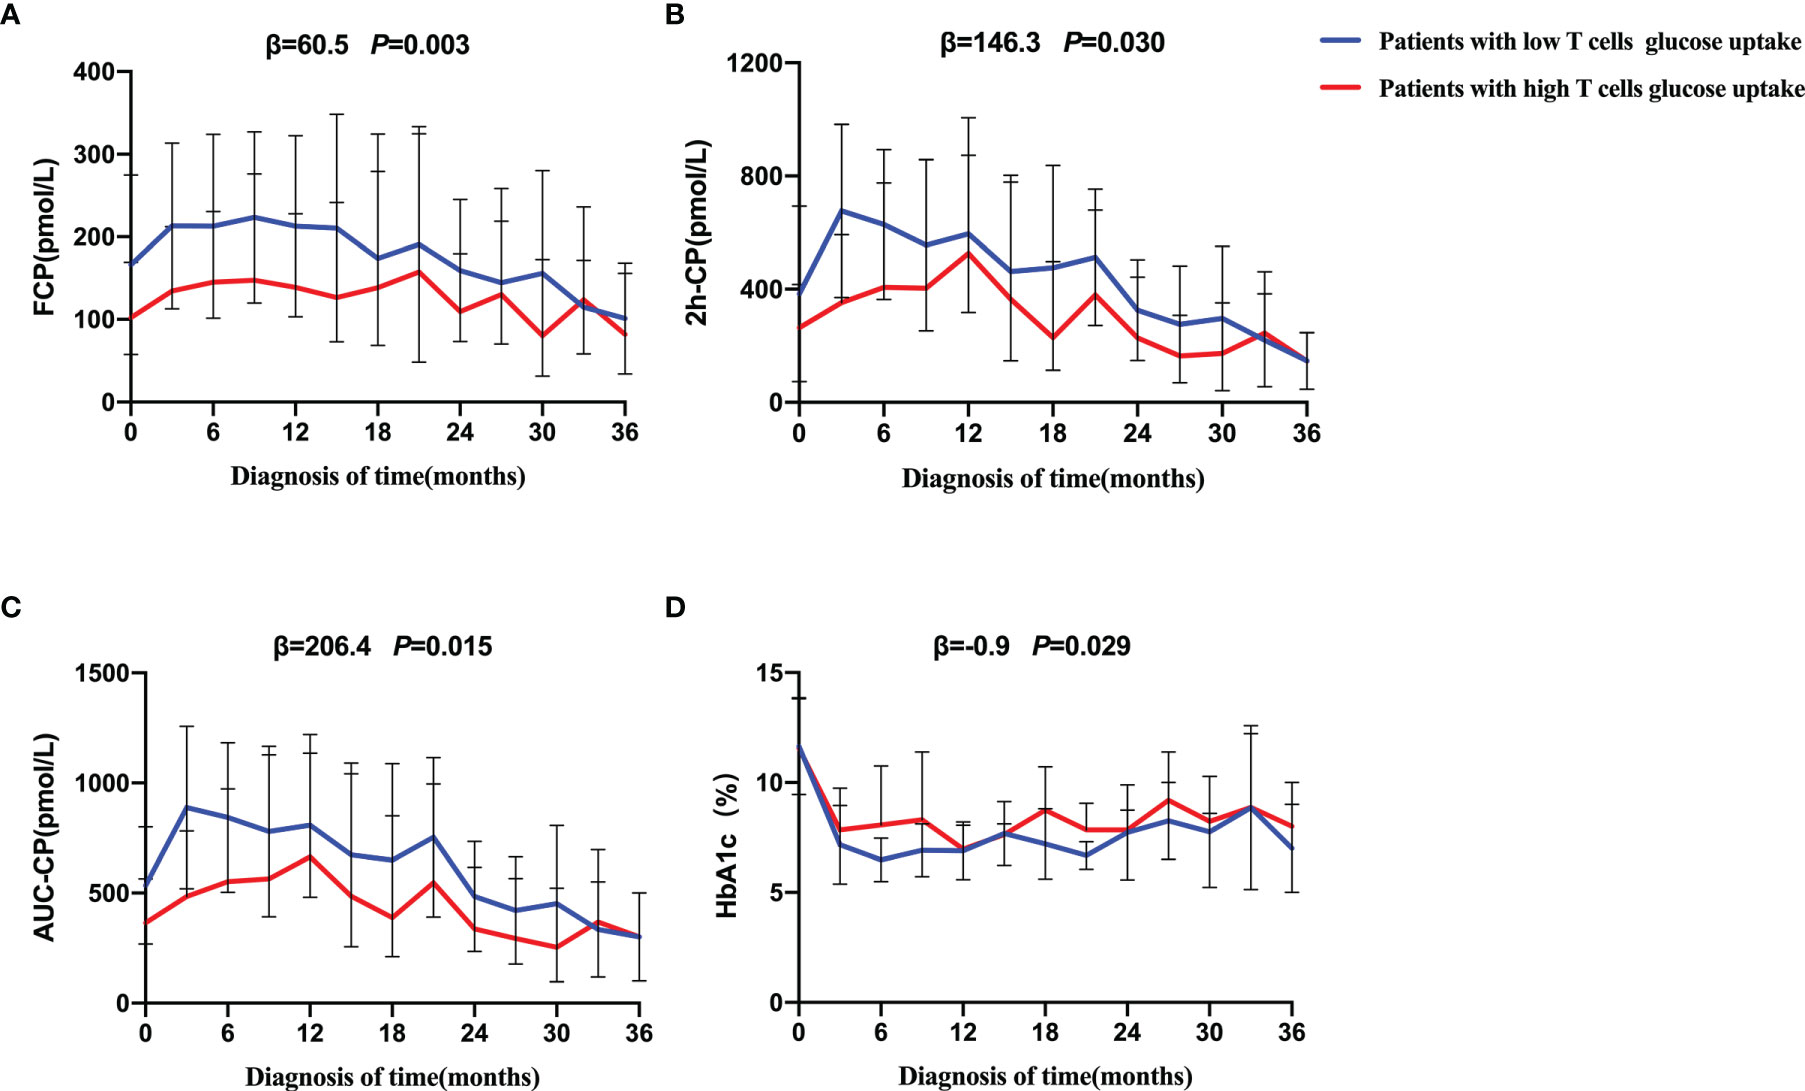
Figure 4 Progression of beta-cell function and trajectory of glycemic control in T1D during the follow-up. Generalized estimated equation (GEE) analysis was used to compare the dynamic tendency of FCP (A), 2h-CP (B), AUC-CP (C) and HbA1c (D) levels between the two groups of patients during a 36-month follow-up period. The blue line = patients with low T cells glucose uptake, red line = patients with high T cells glucose uptake. The error bar means SD. The statistical difference between the curves of the two groups was represented by P value. The low glucose group was on average β higher than that of high glucose group over a 36-month period. FCP, Fasting C-peptide; 2h-CP, 2 hours postprandial C-peptide; AUC-CP, Area under curve of C-peptide; HbA1c, hemoglobin A1c.
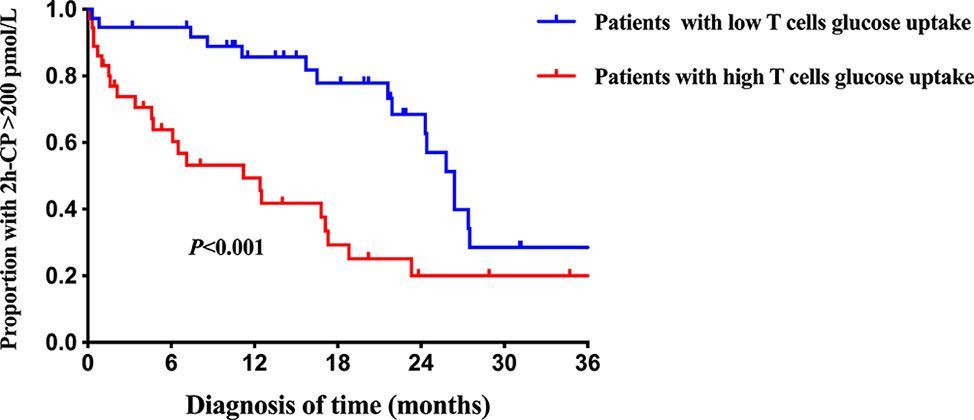
Figure 5 Survival curves of beta-cell preservation in T1D patients with different intracellular T cell glucose uptake status. The blue line = patients with low T cells glucose uptake, red line = patients with high T cells glucose uptake. 2h-CP>200 pmol/L as defined as beta-cells preservation. Log-rank survival analysis is used. 2h-CP, 2 hours postprandial C-peptide.
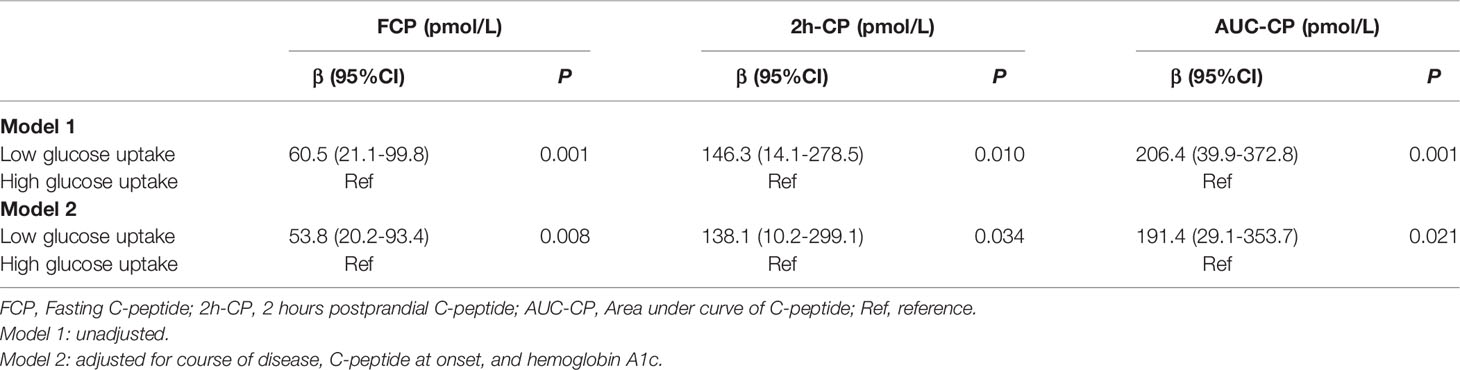
Table 5 Progression of beta-cell function in patients with different status of glucose uptake in T cells.
In this study, we showed that intracellular glucose uptake of CD4+/CD8+ T cells is abnormally enhanced in T1D and the status of glucose uptake in T cells is associated with beta-cell function and progression. To the best of our knowledge, this is the first study focusing on the association of T cell glucose uptake with clinical indicators and disease progression in T1D, providing new insights into the mechanism and intervention targets in the field of immunometabolism. It is well recognized that metabolism and the immunological state are inextricably linked (34). With the arising studies focusing on the intrinsic metabolic pathways of immune cells themselves such as glycolysis and Krebs cycle (35–37), immunometabolism has emerged as a major mechanism central to immune regulation. In this way, the metabolic signaling of immune cells drives cell fate. Considering the effect of the microenvironment on cell metabolism, immune cells can adopt programs specific for the tissues where they infiltrate and reside, highlighting opportunities of immunometabolism findings for clinical translation (38, 39).
However, puzzlingly, in the field of T1D where T cells are the primary mechanism, whether intra-T cellular metabolism is involved in the pathological process of T1D remains unclear. Through our T1D cohort study, we found the glucose uptake in T cells was significantly increased in T1D, which was mainly reflected as increased expression of GLUT1, a key transporter in the glucose metabolism pathway, and uptake of 2NBDG. Also, our results showed the abnormality of T cell glucose uptake was significantly correlated with islet function progression and glycemic control trajectory. Although no previous data has been reported about the association of intra-T cellular metabolism with beta-cell function progression, a few cross-sectional studies reported the status of T cell metabolism in T1D patients. Our results are similar to Kong BS’ research in 2021 which found that patients with T1D had enhanced CD4+ T cell glycolysis and decreased oxidative phosphorylation (40). Likewise, in NOD mice, increased 2NBDG uptake was also detected in NRP-V7-reactive T cells (a sort of diabetes pathogenic T cell) (21). A study by Vignali D found that GLUT1 was overexpressed in specific stem memory T cells by investigating the metabolic signature of naïve precursors stimulated with GAD65. And the similar metabolic signature was also found in influenza-specific T cells, indicating that this metabolic profile is not confined to autoreactive T cells (23). However, in this study, the 2NBDG uptake and mitochondrial mass and activity were similar among circulating CD8+ T cell subsets and no significant changes were found in T1D, indicating that the metabolic dysregulation of T1D not directly impact the basal metabolism of resting circulating T cell (23), which is not consistent with our results. It should be noted that the cells examined in the above studies were different. Upregulation of glucose metabolism was detected in pathogenic T cell populations with a specific antigen (NRP-V7 specific, GAD65, or influenza), but it is not uniformly in the circulating cells, which most will be of naïve phenotype, just as glucose metabolism is upregulated in CD4+ T cells (in the Kong BS study) but not in a subset of CD8+ T cells with different phenotypes (in the Vignali D study). We detected increased T cell glucose uptake in circulating CD4+ and CD8+ T cells from individuals with a large sample size with regular follow-up data, which might provide some solid information. Most importantly, our finding that abnormal glucose uptake of T cells is significantly correlated with beta-cell function and its progression. It offers potential markers for evaluating disease prognosis and suggests that the presence of a population of T cells characterized by elevated glucose metabolism enhances the immune attack on beta cells in T1D.
The causes of increased glucose uptake in T cells in T1D are unclear. Our primary consideration is hyperglycemia in the peripheral circulation of diabetes. However, there is little evidence of the relationship between hyperglycemia and the energy metabolism of immune cells. A study in a mouse model of autoimmune colitis with high glucose uptake found that hyperglycemia did not affect intracellular CD4+ T cell metabolism (41). However, it has also been reported that hyperglycemia can lead to increased glycolysis in activated T cells, resulting in increased IFN-γ production and non-antigen specific inflammation (42). Recent studies found T cell glucose metabolism decreased in patients with type 2 diabetes (33, 43) which may provide strong evidence that hyperglycemia is not the cause of changes in T cell glucose metabolism. In our study, the differential glucose uptake persists in beta-cell function progression after correction for glycation. Thus, the role of hyperglycemia may be limited. On the other hand, we consider that the enhanced glucose metabolism in T cells may be caused by susceptibility mediated by signaling pathways, oxidative stress, or immunomodulatory molecules. Enhanced T cell glucose metabolism has also been found in other autoimmune diseases including Systemic lupus erythematosus, Rheumatoid Arthritis, and Multiple Sclerosis (44–46). The metabolic abnormalities of T cells may be related to the production of autoantibodies to metabolic enzymes or the activation of the phosphoinositide 3-kinase (PI3K)-Akt and mammalian target of rapamycin (mTOR) pathway, which mediates susceptibility to immunometabolism abnormality in autoimmune diseases including T1D (16, 18). Oxidative stress and mitochondrial dysfunction have also been shown to play an important role in abnormal T cell metabolism in autoimmune diseases (47). In addition, the immune molecule programmed death 1 (PD-1) is a key regulator of T cell metabolic reprogramming, which has been found to be involved in the pathogenesis of T1D (30, 48, 49) and a study found that knocking out PD-1 on Treg cells in NOD mice significantly reduced the incidence of NOD mice by regulating intracellular metabolism (50).
Enhanced T cell metabolism was also detected in NOD mice and when prediabetic NOD mice were treated with 2-deoxyglucose to block aerobic glycolysis, islet antigen-specific T cell frequency and islet infiltrating lymphocytes decreased, beta-cell degranulation was improved (21). Similarly, in the adoptive transfer model of T1D, a competitive inhibitor of the glycolytic rate-limiting enzyme of CD4+ T cells reduced T cell responses to β cell antigen in vitro, thus reducing the immunopathological parameters associated with disease onset as 57% of animals remaining euglycemic at the end of the study period (22). Other studies also found that there are some potential immunotherapy drugs for T1D by inhibiting the T cell glucose metabolism pathway (51–53). These evidences, to some extent, suggest that T cell metabolism is an initiating factor in the pathogenesis of T1D. However, since the association between T cell metabolism and disease progression in T1D patients is poorly defined, our study provides human pathophysiological evidence for T cell glucose metabolism as a potential target.
Although the relationship between tissue infiltration and circulating immune cells is not fully understood, some evidence supports the hypothesis that effector cells migrate to the pancreas and that this autoimmune process persists in disease (54–56). The results of enhanced glucose metabolism in circulating T cells in T1D are consistent with the pathogenicity of T1D primarily caused by Th1 and Th17 and cytotoxic CD8+ T cells (54), as these cells require extensive glycolysis for energy during activation and differentiation. Furthermore, we found that changes in T cell glucose metabolism were correlated with beta-cell function progression within 36 months follow-up, suggesting that similar intracellular metabolic changes may also exist in T cells in islet infiltration. Anyway, further research will have to sort this out more completely.
Our study has some limitations, the most important of which is the failure to utilize the seahorse XF equipment to detection of intracellular glycolysis and aerobic phosphorylation pathways directly due to the limited number of cells. And the follow-up data on T cell metabolism is lacking to explore its mechanism during disease progression. Further, the intracellular glucose uptake is detected in bulk CD4+ and CD8+ T cells rather than pathogenic T cells with specific antigenic targets such as glucose-6-phosphatase catalytic subunit-related protein (IGRP) or GAD that can be detected by MHC tetramer technology as in other studies (21, 23), which is also one of our limitatons.
Overall, the association between intra-T cellular glucose uptake and progression of beta-cell function in T1D provides a promising possibility of T cell metabolism as biomarkers and potential targets. While there are trials focusing on immune intervention in T1D, the translation to specific T cell metabolism might provide a new and effective therapeutic strategy for T1D.
The original contributions presented in the study are included in the article/Supplementary Material. Further inquiries can be directed to the corresponding author.
The studies involving human participants were reviewed and approved by The Second Xiangya Hospital of Central South University. Written informed consent to participate in this study was provided by the participants’ legal guardian/next of kin.
RT and TZ performed experiments and analyzed the data. RT wrote the manuscript. YX and XL reviewed and edited the manuscript. LF and JL contributed to the data collection and discussion. XL designed the study. All authors contributed to manuscript revision, read, and approved the submitted version.
This work was supported by National Natural Science Foundation of China (Grant No 82070812), the science and technology innovation Program of Hunan Province (2020RC4044), and DMRFP_I_04 from SHMHDF.
The authors declare that the research was conducted in the absence of any commercial or financial relationships that could be construed as a potential conflict of interest.
All claims expressed in this article are solely those of the authors and do not necessarily represent those of their affiliated organizations, or those of the publisher, the editors and the reviewers. Any product that may be evaluated in this article, or claim that may be made by its manufacturer, is not guaranteed or endorsed by the publisher.
The Supplementary Material for this article can be found online at: https://www.frontiersin.org/articles/10.3389/fimmu.2022.897047/full#supplementary-material
1. Katsarou A, Gudbjörnsdottir S, Rawshani A, Dabelea D, Bonifacio E, Anderson BJ, et al. Type 1 Diabetes Mellitus. Nat Rev Dis Primers (2017) 3:17016. doi: 10.1038/nrdp.2017.16
2. Ahmed S, Cerosaletti K, James E, Long SA, Mannering S, Speake C, et al. Standardizing T-Cell Biomarkers in Type 1 Diabetes: Challenges and Recent Advances. Diabetes (2019) 68(7):1366–79. doi: 10.2337/db19-0119
3. Atkinson MA, Roep BO, Posgai A, Wheeler DCS, Peakman M. The Challenge of Modulating β-Cell Autoimmunity in Type 1 Diabetes. Lancet Diabetes Endocrinol (2019) 7(1):52–64. doi: 10.1016/S2213-8587(18)30112-8
4. Nakayama M, Michels AW. Using the T Cell Receptor as a Biomarker in Type 1 Diabetes. Front Immunol (2021) 12:777788. doi: 10.3389/fimmu.2021.777788
5. Bettini M, Bettini ML. Function, Failure, and the Future Potential of Tregs in Type 1 Diabetes. Diabetes (2021) 70(6):1211–9. doi: 10.2337/dbi18-0058
6. Bordignon C, Canu A, Dyczko A, Leone S, Monti P. T-Cell Metabolism as a Target to Control Autoreactive T Cells in β-Cell Autoimmunity. Curr Diabetes Rep (2017) 17(5):24. doi: 10.1007/s11892-017-0848-5
7. Dimeloe S, Burgener AV, Grählert J, Hess C. T-Cell Metabolism Governing Activation, Proliferation and Differentiation; a Modular View. Immunology (2017) 150(1):35–44. doi: 10.1111/imm.12655
8. Geltink RIK, Kyle RL, Pearce EL. Unraveling the Complex Interplay Between T Cell Metabolism and Function. Annu Rev Immunol (2018) 36:461–88. doi: 10.1146/annurev-immunol-042617-053019
9. Madden MZ, Rathmell JC. The Complex Integration of T-Cell Metabolism and Immunotherapy. Cancer Discovery (2021) 11(7):1636–43. doi: 10.1158/2159-8290.CD-20-0569
10. Kouidhi S, Elgaaied AB, Chouaib S. Impact of Metabolism on T-Cell Differentiation and Function and Cross Talk With Tumor Microenvironment. Front Immunol (2017) 8:270. doi: 10.3389/fimmu.2017.00270
11. Hu Z, Zou Q, Su B. Regulation of T Cell Immunity by Cellular Metabolism. Front Med (2018) 12(4):463–72. doi: 10.1007/s11684-018-0668-2
12. Patel CH, Powell JD. Targeting T Cell Metabolism to Regulate T Cell Activation, Differentiation and Function in Disease. Curr Opin Immunol (2017) 46:82–8. doi: 10.1016/j.coi.2017.04.006
13. Kolan SS, Li G, Wik JA, Malachin G, Guo S, Kolan P, et al. Cellular Metabolism Dictates T Cell Effector Function in Health and Disease. Scand J Immunol (2020) 92(5):e12956. doi: 10.1111/sji.12956
14. Bantug GR, Galluzzi L, Kroemer G, Hess C. The Spectrum of T Cell Metabolism in Health and Disease. Nat Rev Immunol (2018) 18(1):19–34. doi: 10.1038/nri.2017.99
15. Cohen S, Danzaki K, MacIver NJ. Nutritional Effects on T-Cell Immunometabolism. Eur J Immunol (2017) 47(2):225–35. doi: 10.1002/eji.201646423
16. Galgani M, De Rosa V, Matarese G. T Cell Metabolism and Susceptibility to Autoimmune Diseases. Mol Immunol (2015) 68(2 Pt C):558–63. doi: 10.1016/j.molimm.2015.07.035
17. Shan J, Jin H, Xu Y. T Cell Metabolism: A New Perspective on Th17/Treg Cell Imbalance in Systemic Lupus Erythematosus. Front Immunol (2020) 11:1027. doi: 10.3389/fimmu.2020.01027
18. Galgani M, Bruzzaniti S, Matarese G. Immunometabolism and Autoimmunity. Curr Opin Immunol (2020) 67:10–7. doi: 10.1016/j.coi.2020.07.002
19. Di Dedda C, Vignali D, Piemonti L, Monti P. Pharmacological Targeting of GLUT1 to Control Autoreactive T Cell Responses. Int J Mol Sci (2019) 20(19):4962. doi: 10.3390/ijms20194962
20. Sharabi A, Tsokos GC. T Cell Metabolism: New Insights in Systemic Lupus Erythematosus Pathogenesis and Therapy. Nat Rev Rheumatol (2020) 16(2):100–12. doi: 10.1038/s41584-019-0356-x
21. Garyu JW, Uduman M, Stewart A, Rui J, Deng S, Shenson J, et al. Characterization of Diabetogenic CD8+ T Cells: Immune Therapy With Metabolic Blockade. J Biol Chem (2016) 291(21):11230–40. doi: 10.1074/jbc.M115.713362
22. Martins CP, New LA, O’Connor EC, Previte DM, Cargill KR, Tse IL, et al. Glycolysis Inhibition Induces Functional and Metabolic Exhaustion of CD4(+) T Cells in Type 1 Diabetes. Front Immunol (2021) 12:669456. doi: 10.3389/fimmu.2021.669456
23. Vignali D, Cantarelli E, Bordignon C, Canu A, Citro A, Annoni A, et al. Detection and Characterization of CD8(+) Autoreactive Memory Stem T Cells in Patients With Type 1 Diabetes. Diabetes (2018) 67(5):936–45. doi: 10.2337/db17-1390
24. Alberti KG, Zimmet PZ. Definition, Diagnosis and Classification of Diabetes Mellitus and its Complications. Part 1: Diagnosis and Classification of Diabetes Mellitus Provisional Report of a WHO Consultation. Diabetes Med (1998) 15(7):539–53. doi: 10.1002/(SICI)1096-9136(199807)15:7<539::AIDDIA668>3.0.CO;2-S.
25. Shi M, Xie Y, Tang R, Zhong T, Zhou Z, Li X. Three-Phasic Pattern of C-Peptide Decline in Type 1 Diabetes Patients With Partial Remission. Diabetes Metab Res Rev (2021) 37(8):e3461. doi: 10.1002/dmrr.3461
26. Li X, Campbell-Thompson M, Wasserfall CH, McGrail K, Posgai A, Schultz AR, et al. Serum Trypsinogen Levels in Type 1 Diabetes. Diabetes Care (2017) 40(4):577–82. doi: 10.2337/dc16-1774
27. Huang G, Yin M, Xiang Y, Li X, Shen W, Luo S, et al. Persistence of Glutamic Acid Decarboxylase Antibody (GADA) is Associated With Clinical Characteristics of Latent Autoimmune Diabetes in Adults: A Prospective Study With 3-Year Follow-Up. Diabetes Metab Res Rev (2016) 32(6):615–22. doi: 10.1002/dmrr.2779
28. Shi X, Huang G, Wang Y, Liu Z, Deng C, Li X, et al. Tetraspanin 7 Autoantibodies Predict Progressive Decline of Beta Cell Function in Individuals With LADA. Diabetologia (2019) 62(3):399–407. doi: 10.1007/s00125-018-4799-4
29. Xiang Y, Huang G, Zhu Y, Zuo X, Liu X, Feng Q, et al. Identification of Autoimmune Type 1 Diabetes and Multiple Organ-Specific Autoantibodies in Adult-Onset non-Insulin-Requiring Diabetes in China: A Population-Based Multicentre Nationwide Survey. Diabetes Obes Metab (2019) 21(4):893–902. doi: 10.1111/dom.13595
30. Li X, Zhong T, Tang R, Wu C, Xie Y, Liu F, et al. PD-1 and PD-L1 Expression in Peripheral CD4/CD8+ T Cells Is Restored in the Partial Remission Phase in Type 1 Diabetes. J Clin Endocrinol Metab (2020) 105(6):dgaa130. doi: 10.1210/clinem/dgaa130
31. Watson MJ, Vignali PDA, Mullett SJ, Overacre-Delgoffe AE, Peralta RM, Grebinoski S, et al. Metabolic Support of Tumour-Infiltrating Regulatory T Cells by Lactic Acid. Nature (2021) 591(7851):645–51. doi: 10.1038/s41586-020-03045-2
32. Koga T, Sato T, Furukawa K, Morimoto S, Endo Y, Umeda M, et al. Promotion of Calcium/Calmodulin-Dependent Protein Kinase 4 by GLUT1-Dependent Glycolysis in Systemic Lupus Erythematosus. Arthritis Rheumatol (2019) 71(5):766–72. doi: 10.1002/art.40785
33. Lau EYM, Carroll EC, Callender LA, Hood GA, Berryman V, Pattrick M, et al. Type 2 Diabetes is Associated With the Accumulation of Senescent T Cells. Clin Exp Immunol (2019) 197(2):205–13. doi: 10.1111/cei.13344
34. Pearce EL, Poffenberger MC, Chang CH, Jones RG. Fueling Immunity: Insights Into Metabolism and Lymphocyte Function. Science (2013) 342(6155):1242454. doi: 10.1126/science.1242454
35. Chang CH, Curtis JD, Maggi LB Jr., Faubert B, Villarino AV, O’Sullivan D, et al. Posttranscriptional Control of T Cell Effector Function by Aerobic Glycolysis. Cell (2013) 153(6):1239–51. doi: 10.1016/j.cell.2013.05.016
36. Buck MD, O’Sullivan D, Klein Geltink RI, Curtis JD, Chang CH, Sanin DE, et al. Mitochondrial Dynamics Controls T Cell Fate Through Metabolic Programming. Cell (2016) 166(1):63–76. doi: 10.1016/j.cell.2016.05.035
37. Diskin C, Ryan TAJ, O’Neill LAJ. Modification of Proteins by Metabolites in Immunity. Immunity (2021) 54(1):19–31. doi: 10.1016/j.immuni.2020.09.014
38. Li X, Wenes M, Romero P, Huang SC, Fendt SM, Ho PC. Navigating Metabolic Pathways to Enhance Antitumour Immunity and Immunotherapy. Nat Rev Clin Oncol (2019) 16(7):425–41. doi: 10.1038/s41571-019-0203-7
39. Chang CH, Pearce EL. Emerging Concepts of T Cell Metabolism as a Target of Immunotherapy. Nat Immunol (2016) 17(4):364–8. doi: 10.1038/ni.3415
40. Kong BS, Min SH, Lee C, Cho YM. Mitochondrial-Encoded MOTS-C Prevents Pancreatic Islet Destruction in Autoimmune Diabetes. Cell Rep (2021) 36(4):109447. doi: 10.1016/j.celrep.2021.109447
41. Zhang D, Jin W, Wu R, Li J, Park SA, Tu E, et al. High Glucose Intake Exacerbates Autoimmunity Through Reactive-Oxygen-Species-Mediated TGF-β Cytokine Activation. Immunity (2019) 51(4):671–81.e5. doi: 10.1016/j.immuni.2019.08.001
42. Grohová A, Dáňová K, Špíšek R, Palová-Jelínková L. Cell Based Therapy for Type 1 Diabetes: Should We Take Hyperglycemia Into Account? Front Immunol (2019) 10:79. doi: 10.3389/fimmu.2019.00079
43. Nojima I, Eikawa S, Tomonobu N, Hada Y, Kajitani N, Teshigawara S, et al. Dysfunction of CD8 + PD-1 + T Cells in Type 2 Diabetes Caused by the Impairment of Metabolism-Immune Axis. Sci Rep (2020) 10(1):14928. doi: 10.1038/s41598-020-71946-3
44. Yin Y, Choi SC, Xu Z, Perry DJ, Seay H, Croker BP, et al. Normalization of CD4+ T Cell Metabolism Reverses Lupus. Sci Transl Med (2015) 7(274):274ra18. doi: 10.1126/scitranslmed.aaa0835
45. Qiu J, Wu B, Goodman SB, Berry GJ, Goronzy JJ, Weyand CM. Metabolic Control of Autoimmunity and Tissue Inflammation in Rheumatoid Arthritis. Front Immunol (2021) 12:652771. doi: 10.3389/fimmu.2021.652771
46. Kunkl M, Sambucci M, Ruggieri S, Amormino C, Tortorella C, Gasperini C, et al. CD28 Autonomous Signaling Up-Regulates C-Myc Expression and Promotes Glycolysis Enabling Inflammatory T Cell Responses in Multiple Sclerosis. Cells (2019) 8(6):575. doi: 10.3390/cells8060575
47. Chávez MD, Tse HM. Targeting Mitochondrial-Derived Reactive Oxygen Species in T Cell-Mediated Autoimmune Diseases. Front Immunol (2021) 12:703972. doi: 10.3389/fimmu.2021.703972
48. Patsoukis N, Bardhan K, Chatterjee P, Sari D, Liu B, Bell LN, et al. PD-1 Alters T-Cell Metabolic Reprogramming by Inhibiting Glycolysis and Promoting Lipolysis and Fatty Acid Oxidation. Nat Commun (2015) 6:6692. doi: 10.1038/ncomms7692
49. Tucker CG, Dwyer AJ, Fife BT, Martinov T. The Role of Programmed Death-1 in Type 1 Diabetes. Curr Diabetes Rep (2021) 21(6):20. doi: 10.1007/s11892-021-01384-6
50. Tan CL, Kuchroo JR, Sage PT, Liang D, Francisco LM, Buck J, et al. PD-1 Restraint of Regulatory T Cell Suppressive Activity is Critical for Immune Tolerance. J Exp Med (2021) 218(1):e20182232. doi: 10.1084/jem.20182232
51. Previte DM, O’Connor EC, Novak EA, Martins CP, Mollen KP, Piganelli JD. Reactive Oxygen Species are Required for Driving Efficient and Sustained Aerobic Glycolysis During CD4+ T Cell Activation. PloS One (2017) 12(4):e0175549. doi: 10.1371/journal.pone.0175549
52. Lee YS, Kim D, Lee EK, Kim S, Choi CS, Jun HS. Sodium Meta-Arsenite Prevents the Development of Autoimmune Diabetes in NOD Mice. Toxicol Appl Pharmacol (2015) 284(2):254–61. doi: 10.1016/j.taap.2014.12.016
53. Delmastro-Greenwood MM, Votyakova T, Goetzman E, Marre ML, Previte DM, Tovmasyan A, et al. Mn Porphyrin Regulation of Aerobic Glycolysis: Implications on the Activation of Diabetogenic Immune Cells. Antioxid Redox Signal (2013) 19(16):1902–15. doi: 10.1089/ars.2012.5167
54. Teniente-Serra A, Pizarro E, Quirant-Sánchez B, Fernández MA, Vives-Pi M, Martinez-Caceres EM. Identifying Changes in Peripheral Lymphocyte Subpopulations in Adult Onset Type 1 Diabetes. Front Immunol (2021) 12:784110. doi: 10.3389/fimmu.2021.784110
55. Yeo L, Woodwyk A, Sood S, Lorenc A, Eichmann M, Pujol-Autonell I, et al. Autoreactive T Effector Memory Differentiation Mirrors β Cell Function in Type 1 Diabetes. J Clin Invest (2018) 128(8):3460–74. doi: 10.1172/JCI120555
Keywords: type 1 diabetes, T cell, cellular glucose uptake, beta-cell function, immunometabolism
Citation: Tang R, Zhong T, Fan L, Xie Y, Li J and Li X (2022) Enhanced T Cell Glucose Uptake Is Associated With Progression of Beta-Cell Function in Type 1 Diabetes. Front. Immunol. 13:897047. doi: 10.3389/fimmu.2022.897047
Received: 15 March 2022; Accepted: 22 April 2022;
Published: 23 May 2022.
Edited by:
David Bleich, Rutgers, The State University of New Jersey, United StatesReviewed by:
Ronadip R. Banerjee, Johns Hopkins Medicine, United StatesCopyright © 2022 Tang, Zhong, Fan, Xie, Li and Li. This is an open-access article distributed under the terms of the Creative Commons Attribution License (CC BY). The use, distribution or reproduction in other forums is permitted, provided the original author(s) and the copyright owner(s) are credited and that the original publication in this journal is cited, in accordance with accepted academic practice. No use, distribution or reproduction is permitted which does not comply with these terms.
*Correspondence: Xia Li, bGl4aWFAY3N1LmVkdS5jbg==
Disclaimer: All claims expressed in this article are solely those of the authors and do not necessarily represent those of their affiliated organizations, or those of the publisher, the editors and the reviewers. Any product that may be evaluated in this article or claim that may be made by its manufacturer is not guaranteed or endorsed by the publisher.
Research integrity at Frontiers
Learn more about the work of our research integrity team to safeguard the quality of each article we publish.