 Amanda P. Smith1
 Evan P. Williams2
 Taylor R. Plunkett2Muneeswaran Selvaraj3†Lindey C. Lane4Lillian Zalduondo2
 Yi Xue2
 Peter Vogel5
 Rudragouda Channappanavar2,3,6†
 Colleen B. Jonsson2,6*
 Amber M. Smith1,2,6*
- 1Department of Pediatrics, University of Tennessee Health Science Center, Memphis, TN, United States
- 2Department of Microbiology, Immunology and Biochemistry, University of Tennessee Health Science Center, Memphis, TN, United States
- 3Department of Acute and Tertiary Care, University of Tennessee Health Science Center, Memphis, TN, United States
- 4College of Pharmacy, University of Tennessee Health Science Center, Memphis, TN, United States
- 5Animal Resources Center and Veterinary Pathology Core, St. Jude Children’s Research Hospital, Memphis, TN, United States
- 6Institute for the Study of Host-Pathogen Systems, University of Tennessee Health Science Center, Memphis, TN, United States
Secondary bacterial infections can exacerbate SARS-CoV-2 infection, but their prevalence and impact remain poorly understood. Here, we established that a mild to moderate infection with the SARS-CoV-2 USA-WA1/2020 strain increased the risk of pneumococcal (type 2 strain D39) coinfection in a time-dependent, but sex-independent, manner in the transgenic K18-hACE2 mouse model of COVID-19. Bacterial coinfection increased lethality when the bacteria was initiated at 5 or 7 d post-virus infection (pvi) but not at 3 d pvi. Bacterial outgrowth was accompanied by neutrophilia in the groups coinfected at 7 d pvi and reductions in B cells, T cells, IL-6, IL-15, IL-18, and LIF were present in groups coinfected at 5 d pvi. However, viral burden, lung pathology, cytokines, chemokines, and immune cell activation were largely unchanged after bacterial coinfection. Examining surviving animals more than a week after infection resolution suggested that immune cell activation remained high and was exacerbated in the lungs of coinfected animals compared with SARS-CoV-2 infection alone. These data suggest that SARS-CoV-2 increases susceptibility and pathogenicity to bacterial coinfection, and further studies are needed to understand and combat disease associated with bacterial pneumonia in COVID-19 patients.
Introduction
Throughout the coronavirus disease 2019 (COVID-19) pandemic caused by the severe acute respiratory syndrome coronavirus 2 (SARS-CoV-2), there have been case reports, multi-center cohort studies, systematic reviews, and meta-analyses assessing the extent and severity of coinfections with secondary pathogens including viruses, fungi, and bacteria (1–31). Although coinfection rates varied across studies, some studies suggested that coinfecting respiratory bacteria were predictors of severe SARS-CoV-2-related disease and mortality (23–31). Bacterial pathogens that were detected included Mycoplasma pneumoniae, Legionella pneumophila, Chlamydophila pneumoniae, Klebsiella pneumoniae, Pseudomonas aeruginosa, Haemophilus influenzae, Acinetobacter baumanii, Staphylococcus aureus, and Streptococcus pneumoniae (pneumococcus). Pneumococcus, which is a major cause of community-acquired pneumonia (32–34), was detected by throat swab in 0.8% (8) to 7.2% (5) of hospitalized COVID-19 patients not requiring intensive care unit (ICU) admission or invasive respiratory support, while the frequency tended to be higher [6.5% (24) to 59.5% (4)] in patients with severe respiratory distress. Because bacterial transmission has largely been dampened by non-pharmaceutical measures (e.g., masking and physical distancing), it is important to understand whether SARS-CoV-2 infection predisposes individuals to bacterial infections and, if so, what clinical and immunological changes occur as a result of coinfection.
In general, viral-bacterial coinfections are not uncommon, where S. aureus and pneumococcus are widely documented as complicating pathogens during infection with other viruses, most notably influenza A virus (IAV) [Reviewed in (35–46)]. During influenza pandemics, 45-95% of the mortality has been attributed to bacterial coinfections (47–50). Fortunately, the impact of these complications has appeared to be lower during the SARS-CoV-2 pandemic, but these could increase as novel variants arise and as SARS-CoV-2 becomes endemic. IAV and SARS-CoV-2 both cause infections that range from asymptomatic to severe, but SARS-CoV-2 has a longer incubation period, longer and more varied duration of viral shedding and symptoms, and more pathological effects on tissues outside of the respiratory tract [Reviewed in (51–54)]. Although viral burden does not directly correlate to disease (55–61), both viruses can induce significant lung damage [Reviewed in (52–54)]. Some host responses also differ in timing and magnitude, including the delayed type I interferon (IFN-α,β), increased proinflammatory cytokines like TNF-α and IL-6, and reduced immune regulation that have been detected in COVID-19 patients (62–66). Further, neutrophils and macrophages, which are important for efficient bacterial clearance during viral-bacterial coinfection (67–72), are dysregulated during COVID-19 (73–75). Thus, the potential for bacterial invasion during SARS-CoV-2 infection may also differ from that observed in influenza infection with respect to timing and host-pathogen mechanisms.
While the investigation of viral and immune dynamics in the lower respiratory tract is difficult to assess in humans, they have been clarified in animal models. One study using SARS-CoV-1 suggested that bacteria can enhance pathogenicity of coronaviruses (76), and numerous studies of influenza-bacterial coinfection indicate that susceptibility and pathogenicity of bacterial coinfections are time-dependent with the greatest mortality observed when bacteria is initiated at 7 d pvi (77). The progressive increase in susceptibility to bacterial coinfection during influenza is largely due to the depletion and/or dysfunction of resident alveolar macrophages (AMΦ) during IAV infection, which is dynamic throughout the infection (55, 67) and maximal at 7 d pvi (55, 67–69). Following bacterial establishment, dysfunction of neutrophils (78–81), which may be in part facilitated by bacterial metabolic interactions (82) and type I IFNs (71, 82, 83), and additional depletion of AMΦ (55) contribute to bacterial growth and coinfection pathogenesis [Reviewed in (39–41, 45, 84, 85)]. Currently, the effect of SARS-CoV-2 infection on AMΦs remains somewhat unclear, although human, murine, and in vitro data indicate that AMΦs become productively infected with SARS-CoV-2, leading to altered cytokine production and responsiveness (86–89). In addition, SARS-CoV-2 seems particularly adept at delaying and avoiding innate immune responses, resulting in delayed or decreased T cell responses, accumulation of neutrophils and inflammatory monocytes, and enhanced lung pathology [Reviewed in (90–93)]. IAV also has mechanisms of immune evasion [Reviewed in (94, 95)] but induces a robust CD8+ T cell response in the lungs that efficiently clears virus. During IAV-pneumococcal coinfection, CD8+ T cells are depleted (96), and viral loads rebound (55, 68, 82). Mechanisms for both of these are being investigated, but direct viral-bacterial interactions (97) that allow the virus to enter new areas of the lung in addition to a bacterial-mediated increase in virus production (55, 68, 98) contribute to the increased viral loads. However, these effects are overshadowed by the robust bacterial growth and bacterial-mediated effects on host responses. Given these potential mechanisms and the reported myeloid dysfunction (73–75), delayed IFN responses (62–66), and CD8+ T cell depletion (99–103) during SARS-CoV-2, a better understanding of the potential for bacterial invasion and the effects of coinfection on immune cell, viral, and pathological dynamics is needed and the focus of this study. To assess bacterial susceptibility during COVID-19 and determine whether a synergism exists between SARS-CoV-2 and pneumococcus, we infected K18-hACE2 mice with a low dose of SARS-CoV-2 to initiate a mild-moderate infection and coinfected the animals 3, 5, or 7 days later with pneumococcus. Bacteria were unable to establish at 3 d post-virus infection (pvi), but coinfections at 5 or 7 d pvi resulted in increased lethality in a sex-independent manner. Although viral dynamics and lung pathology were unchanged within the first 24 h of coinfection, select immune cells and proinflammatory cytokines were decreased in the lungs of animals coinfected at 5 d pvi but not at 7 d pvi. These findings support the increased susceptibility of SARS-CoV-2-infected individuals to bacteria and highlight numerous distinct features from other viral-bacterial coinfections.
Results
Time-Dependent Increases in Lethality During SARS-CoV-2-Pneumococcal Coinfection
To examine the susceptibility and pathogenicity of pneumococcus coinfection during SARS-CoV-2 infection, K18-hACE2 mice (male and female, 10 to 13 weeks old) were infected with 250 PFU of SARS-CoV-2 or PBS followed by 103 CFU of pneumococcal strain D39 (coinfected) or PBS (mock coinfected) at either 3, 5, or 7 d pvi. During mock coinfection, the selected viral dose was lethal in 35% of mice (Figure 1A) and caused weight loss from 5 to 11 d pvi with maximum weight loss (average 7%) at 8 d pvi (Figure 1B) and clinical scores peaking at 6 d pvi (Figure 1C). In the absence of viral infection, the selected bacterial dose was lethal in 1/6 mice (17% lethality) at 4 d post bacterial infection (pbi) (Figure S1A) and caused only mild, transient weight loss (~3%) (Figure S1B) and increased temperatures (Figure S1C) after 1 to 2 d pbi.
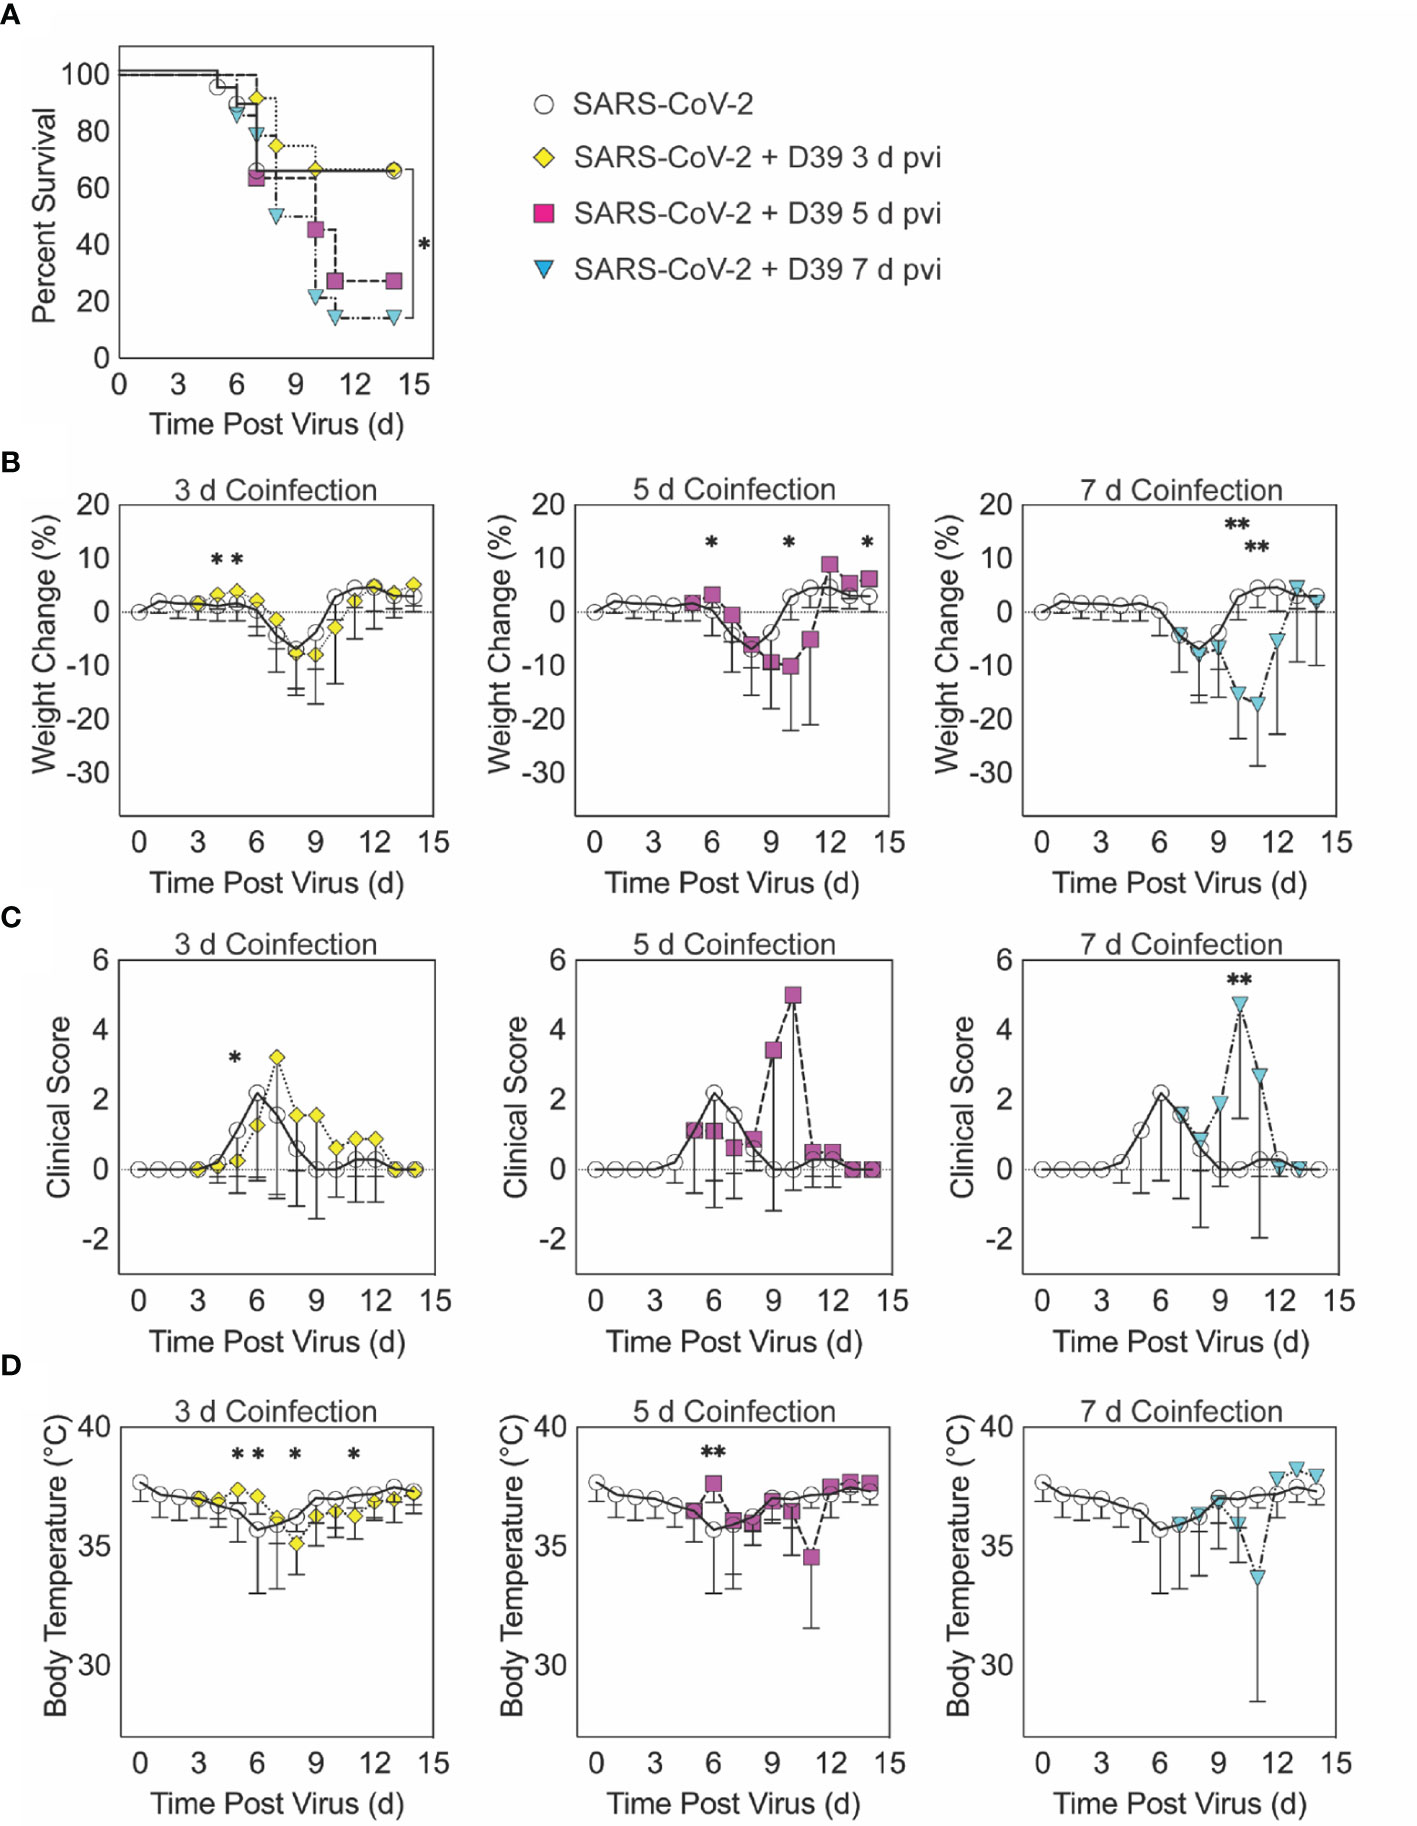
Figure 1 SARS-CoV-2-pneumococcal coinfection in K18-hACE2 mice. Kaplan-Meier survival curves (A), percent weight loss (B), cumulative clinical score (C), and temperature (D) of mice infected with SARS-CoV-2 (250 PFU; white circles, solid lines) followed by 103 CFU D39 at 3 d (yellow diamonds, dotted lines), 5 d (magenta squares, dashed lines), or 7 d (cyan triangles, dash-dotted lines) pvi. Data are shown as the mean ± standard deviation (SD) and significant differences are indicated by *,P < 0.05; **,P < 0.01 for comparisons between SARS-CoV-2 infection and SARS-CoV-2-pneumococcal coinfection.
When the bacterial coinfection was initiated at 3 d pvi, lethality was not enhanced (P = 0.73) (Figure 1A). Interestingly, weight loss in coinfected animals was reduced at 1 d (P = 0.03) and 2 d (P = 0.04) pbi (Figure 1B) and the cumulative clinical score was lower at 2 d pbi (P = 0.03) (Figure 1C) compared with mock coinfected controls. In addition, the temperature of coinfected animals was higher at 2 d (P = 0.003) and 3 d (P = 0.01) pbi and lower at 5 d (P = 0.02) and 8 d (P = 0.045) pbi (Figure 1D). A coinfection initiated at 5 d pvi was slightly more lethal than the SARS-CoV-2 infection alone, where additional mortality was observed at 5 to 6 d pbi, but this was not statistically significant (P = 0.14) (Figure 1A). The average weight loss was reduced (P = 0.01) and temperature was increased (P = 0.001) at 1 d pbi in the coinfected animals (Figures 1B, D). Coinfected animals lost more weight than animals infected with SARS-CoV-2 alone at 5 d pbi (P = 0.03) (Figure 1B), but no significant difference in their clinical scores was detected (Figure 1C). Comparatively, a coinfection at 7 d pvi was significantly more severe than SARS-CoV-2 infection alone (P = 0.03) and resulted in additional lethality at earlier times than the coinfection at 5 d pvi, with additional animals succumbing to the infection within 1, 3, or 4 d pbi (Figure 1A). Significantly more weight loss at 3 d (P < 0.001) and 4 d (P = 0.002) pbi (Figure 1B) and higher clinical scores at 3 d pbi (P = 0.01) (Figure 1C) occurred without altering temperature (Figure 1D).
SARS-CoV-2 Coinfection Increased Bacterial Loads but Not Viral Loads
To evaluate whether SARS-CoV-2-bacterial coinfection alters pathogen burden, we measured viral loads in the lung and bacterial loads in the lung and blood of infected animals. In mice infected with bacteria alone or with SARS-CoV-2 followed by bacteria at 3 d pvi, no bacteria were recovered from the lungs of 7/8 mice at 24 h pbi (Figures 2A, S1D). However, when the bacteria was introduced at 5 d pvi, bacterial loads in the lung remained at a level similar to the inoculum in 7/8 mice and was cleared in 1/8 mice (Figure 2A). Bacteria were not detected in the blood of mice infected with bacteria alone (data not shown) or SARS-CoV-2-bacteria coinfected at 3 or 5 d pvi (Figure 2B). However, in mice coinfected at 7 d pvi, significant bacterial growth occurred in the lungs of all animals (P = 0.02; Mann-Whitney test) and the blood of some animals (3/7) with titers reaching 4.4 to 7.9 log10 CFU/lung (Figure 2A) and 4.1 to 6.6 log10 CFU/mL (Figure 2B), respectively, within 24 h pbi.
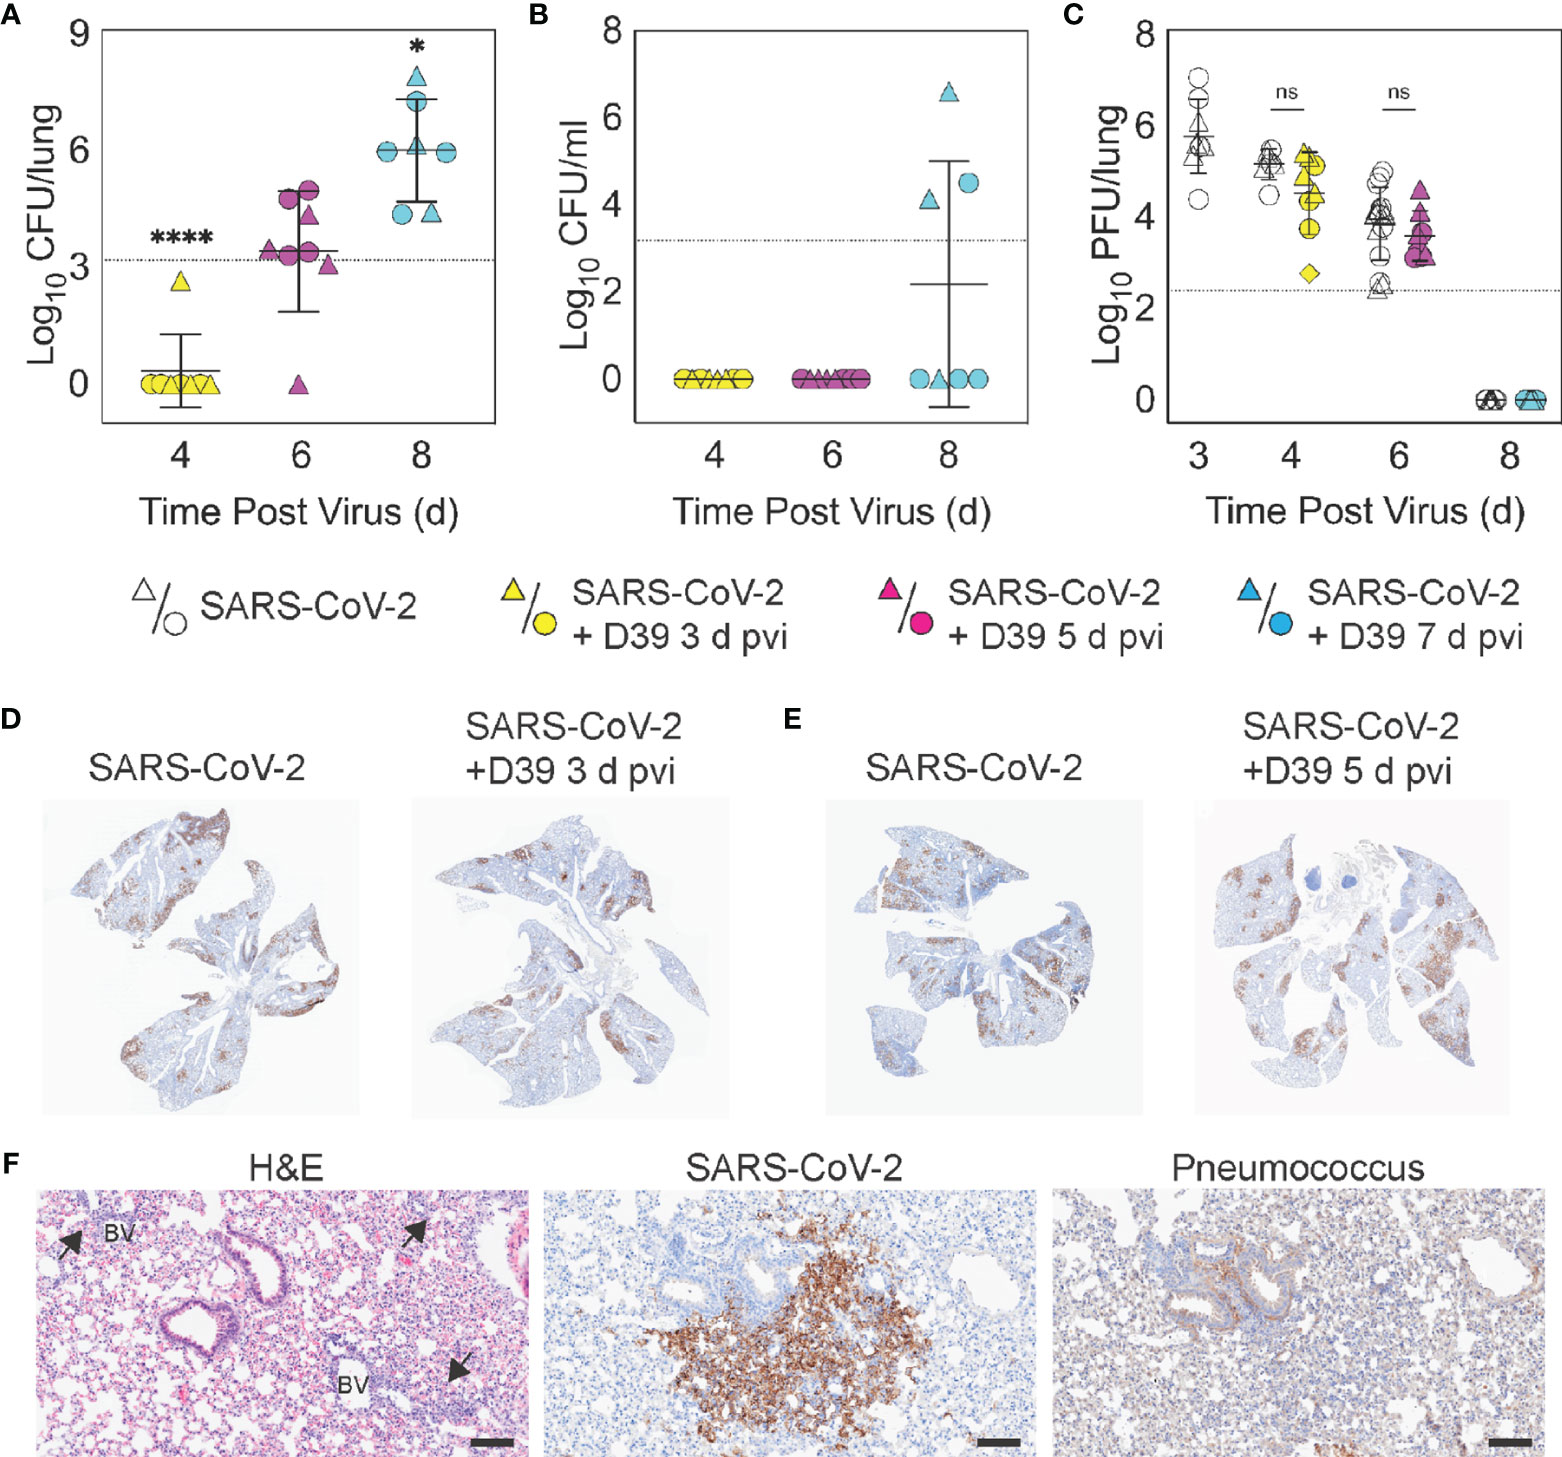
Figure 2 Dynamics of pathogen loads during SARS-CoV-2 infection and pneumococcal coinfection. Lung bacterial loads (CFU/lung) (A), blood bacterial loads (B), and lung viral loads (PFU/lung) (C) in female (circles) and male (triangles) mice infected with SARS-CoV-2 (250 PFU; white) followed 103 CFU D39 at 3 d (yellow), 5 d (magenta), or 7 d (cyan) pvi. Each symbol represents a single mouse and the mean ± standard deviation (SD) are for combined male and female groups. Significant differences are indicated by ns, not significant; *P < 0.05; ****P < 0.0001. For bacterial titers, comparison was with the inoculum (dotted line). (D, E) Representative immunohistochemical (IHC) staining for SARS-CoV-2 nucleocapsid protein in whole lung sections following (24 h pbi) infection with SARS-CoV-2 (250 PFU) then PBS or 103 CFU D39 at 3 d (D) or 5 d (E) pvi. (F) Representative lung sections stained with H&E, SARS-CoV-2 nucleocapsid protein, or pneumococcus from infection with SARS-CoV-2 (250 PFU) followed by 103 CFU D39 at 5 d pvi. Lesions with perivascular inflammatory cell infiltration are indicated by arrows; blood vessel (BV). Scale bar = 100 µm.
Pulmonary viral loads were unchanged by bacterial coinfection whether coinfection was initiated at 3 d (P = 0.12) or 5 d (P = 0.18) pvi (Figure 2C) and the amount and distribution of viral antigen in the lung tissue were also unchanged (Figures 2D, E). Although some areas of the lung contained colocalized virus and bacteria, both intracellular and extracellular bacterial antigen were detected in areas containing no viral antigen (Figure 2F). The virus had cleared by 8 d pvi in the groups that were mock coinfected or bacterial coinfected at 7 d pvi (Figure 2C). No significant differences were found in viral or bacterial loads between males and females.
Select Changes in Pulmonary Immune Responses After SARS-CoV-2-Pneumococcal Coinfection
To investigate whether bacterial coinfection altered immune response dynamics, several immune cells, cytokines, and chemokines were quantified in the lung 24 h after mock coinfection or bacterial coinfection in SARS-CoV-2 infected mice (Figures 3, 4, S3, S6). In animals infected with SARS-CoV-2 only, natural killer (NK) T cells (Figure S3D) and total CD19+ B cells (Figure 3E) were reduced at 4 d pvi compared with naïve (P = 0.007 and P = 0.018, respectively). The absolute numbers of other cells were unchanged at this time point (Figures 3, S3); however, increases in the proportion of activated (CD69+) immune cells were evident (Figure S4). SARS-CoV-2 infection also resulted in many cytokines and chemokines above baseline levels (all P < 0.05) throughout the infection, including IFN-γ, IL-1β, IL-4, IL-28, CXCL10, GM-CSF, LIF, CCL2, CCL7, MIP-1α, MIP-1β, RANTES, IFN-α, and IFN-β. IL-5, IL-6, IL-15, IL-18, M-CSF, and TNF-α were elevated at both 4 d and 6 d pvi while CXCL5, CXCL1, G-CSF, IL-3, IL-13, and IL-17A were increased only at 6 d pvi. MIP-2α, IL-2, and IL-22 were elevated at 6 d and 10 d pvi, and increased IL-10 and IL-23 were detected only at 8 d pvi (absolute values of cytokines are in Figure 4, S5; log2 changes over naïve in Figure S6).
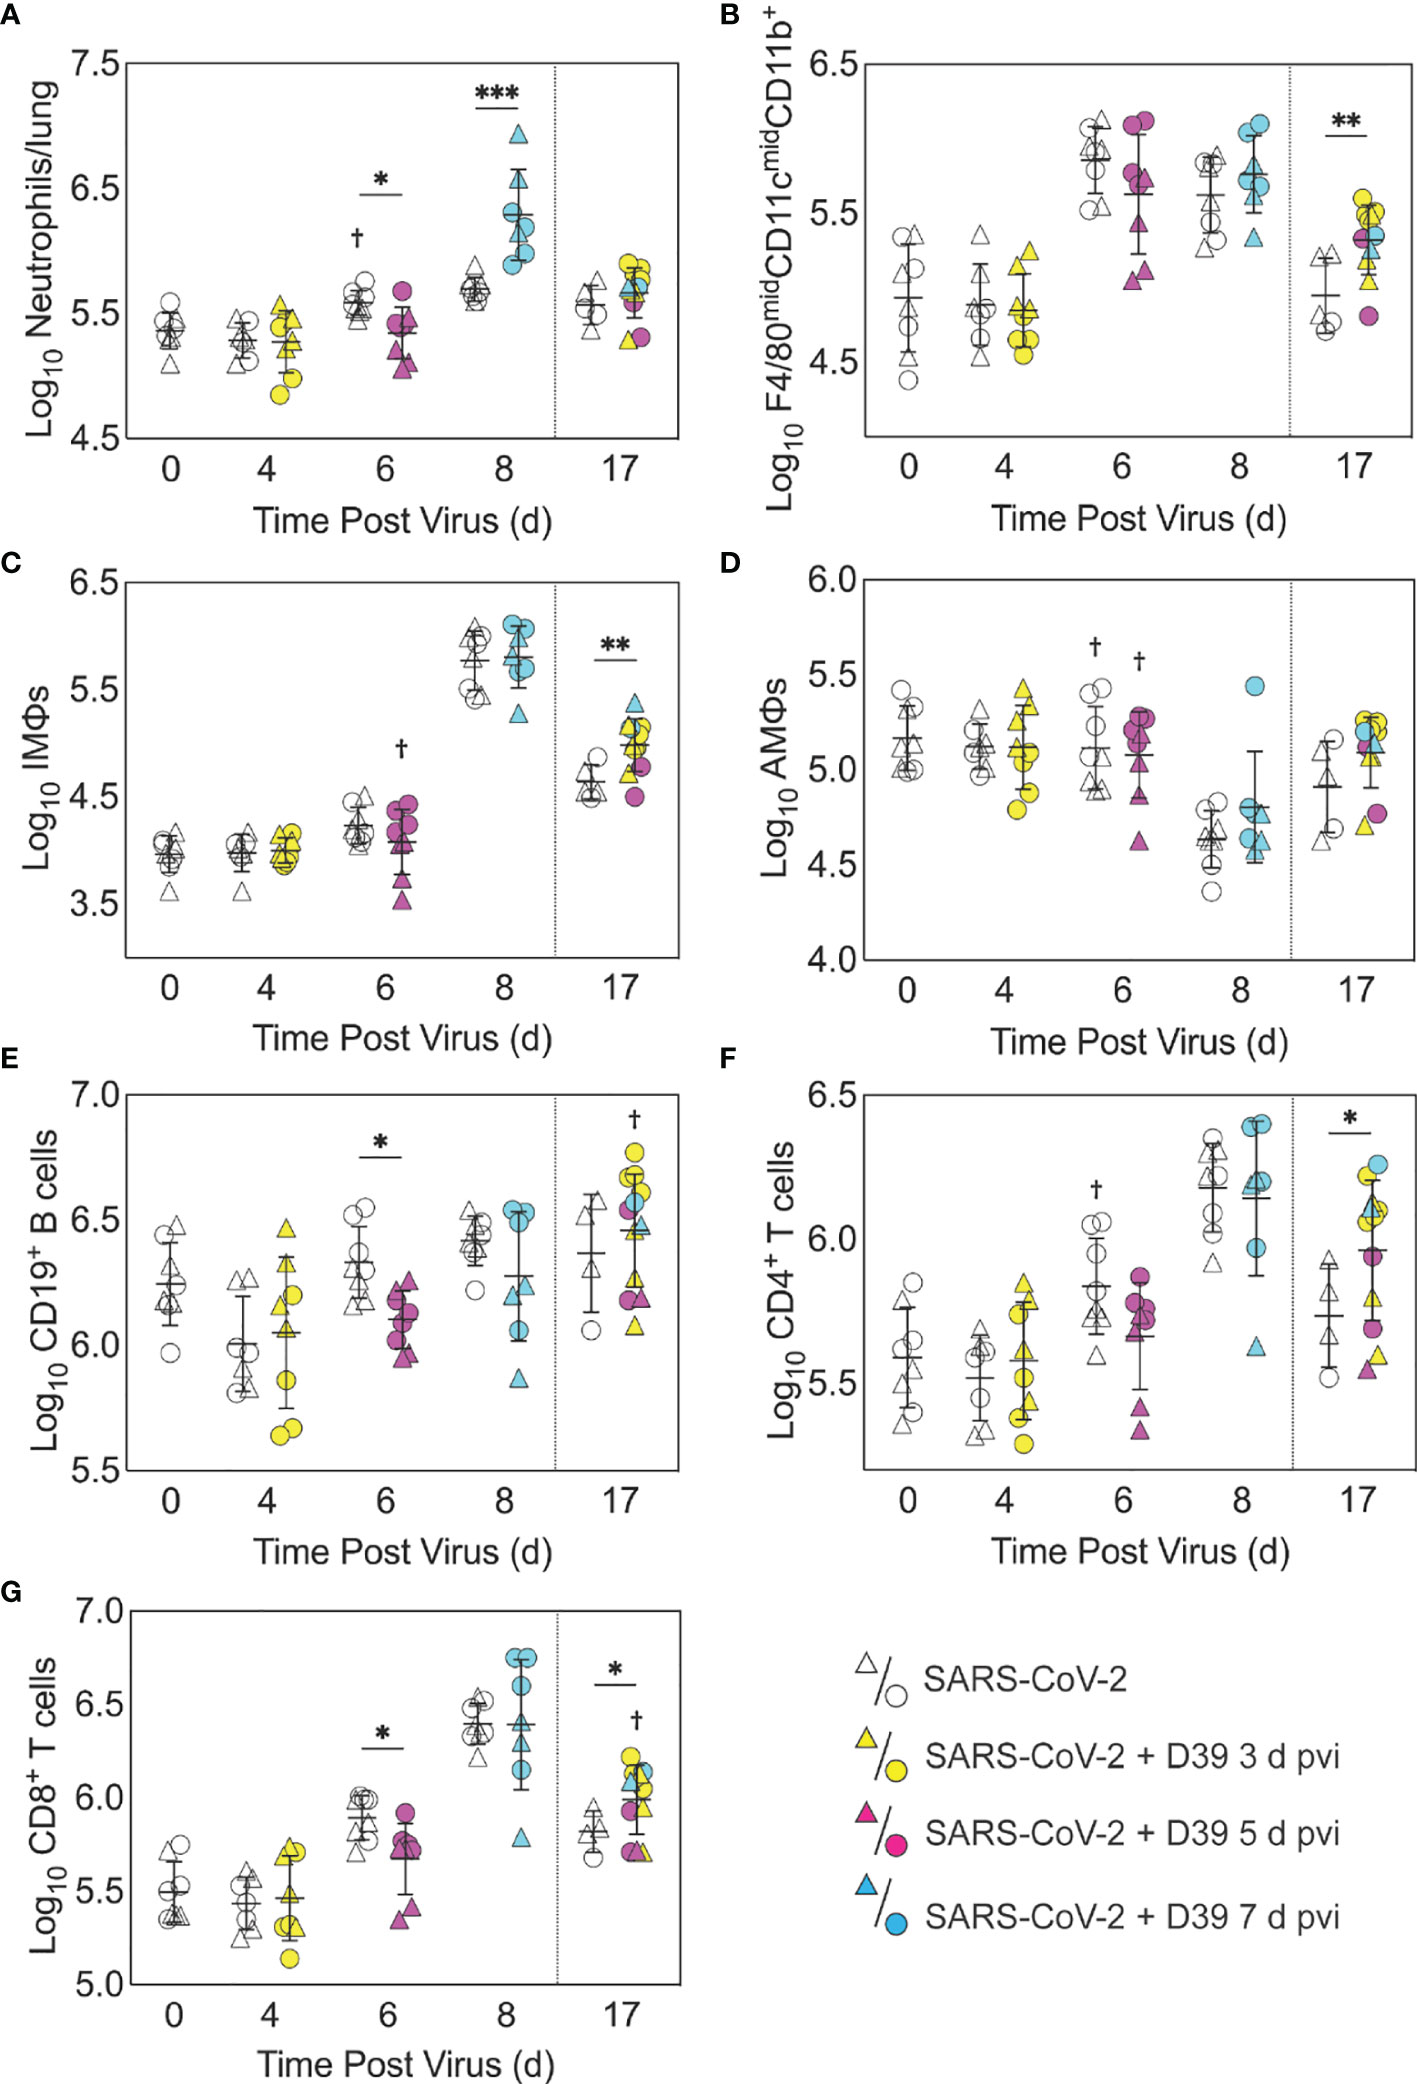
Figure 3 Immune cell dynamics during SARS-CoV-2 infection and pneumococcal coinfection. Total neutrophils (A), F4/80midCD11cmidCD11b+ monocytes/macrophages (B), inflammatory macrophages (iMΦ) (F4/80hiCD11chiCD11b+) (C), alveolar macrophages (AMΦ) (F4/80hiCD11chiCD11b-MHC-IIlow/-) (D), CD19+ B cells (E), CD4+ T cells (F), and CD8+ T cells (G) in the lungs of female (circles) and male (triangles) mice infected with SARS-CoV-2 (250 PFU; open symbols) followed by 103 CFU D39 at 3 d (yellow), 5 d (magenta), or 7 d (cyan) pvi. Each symbol represents a single mouse and the mean ± standard deviation (SD) are for combined male and female groups. Significant differences are indicated by *,P < 0.05; **,P < 0.01; ***,P < 0.001 for comparisons between indicated groups and by †,P < 0.05 for differences between males and females within a group or between coinfection times within 17 d group.
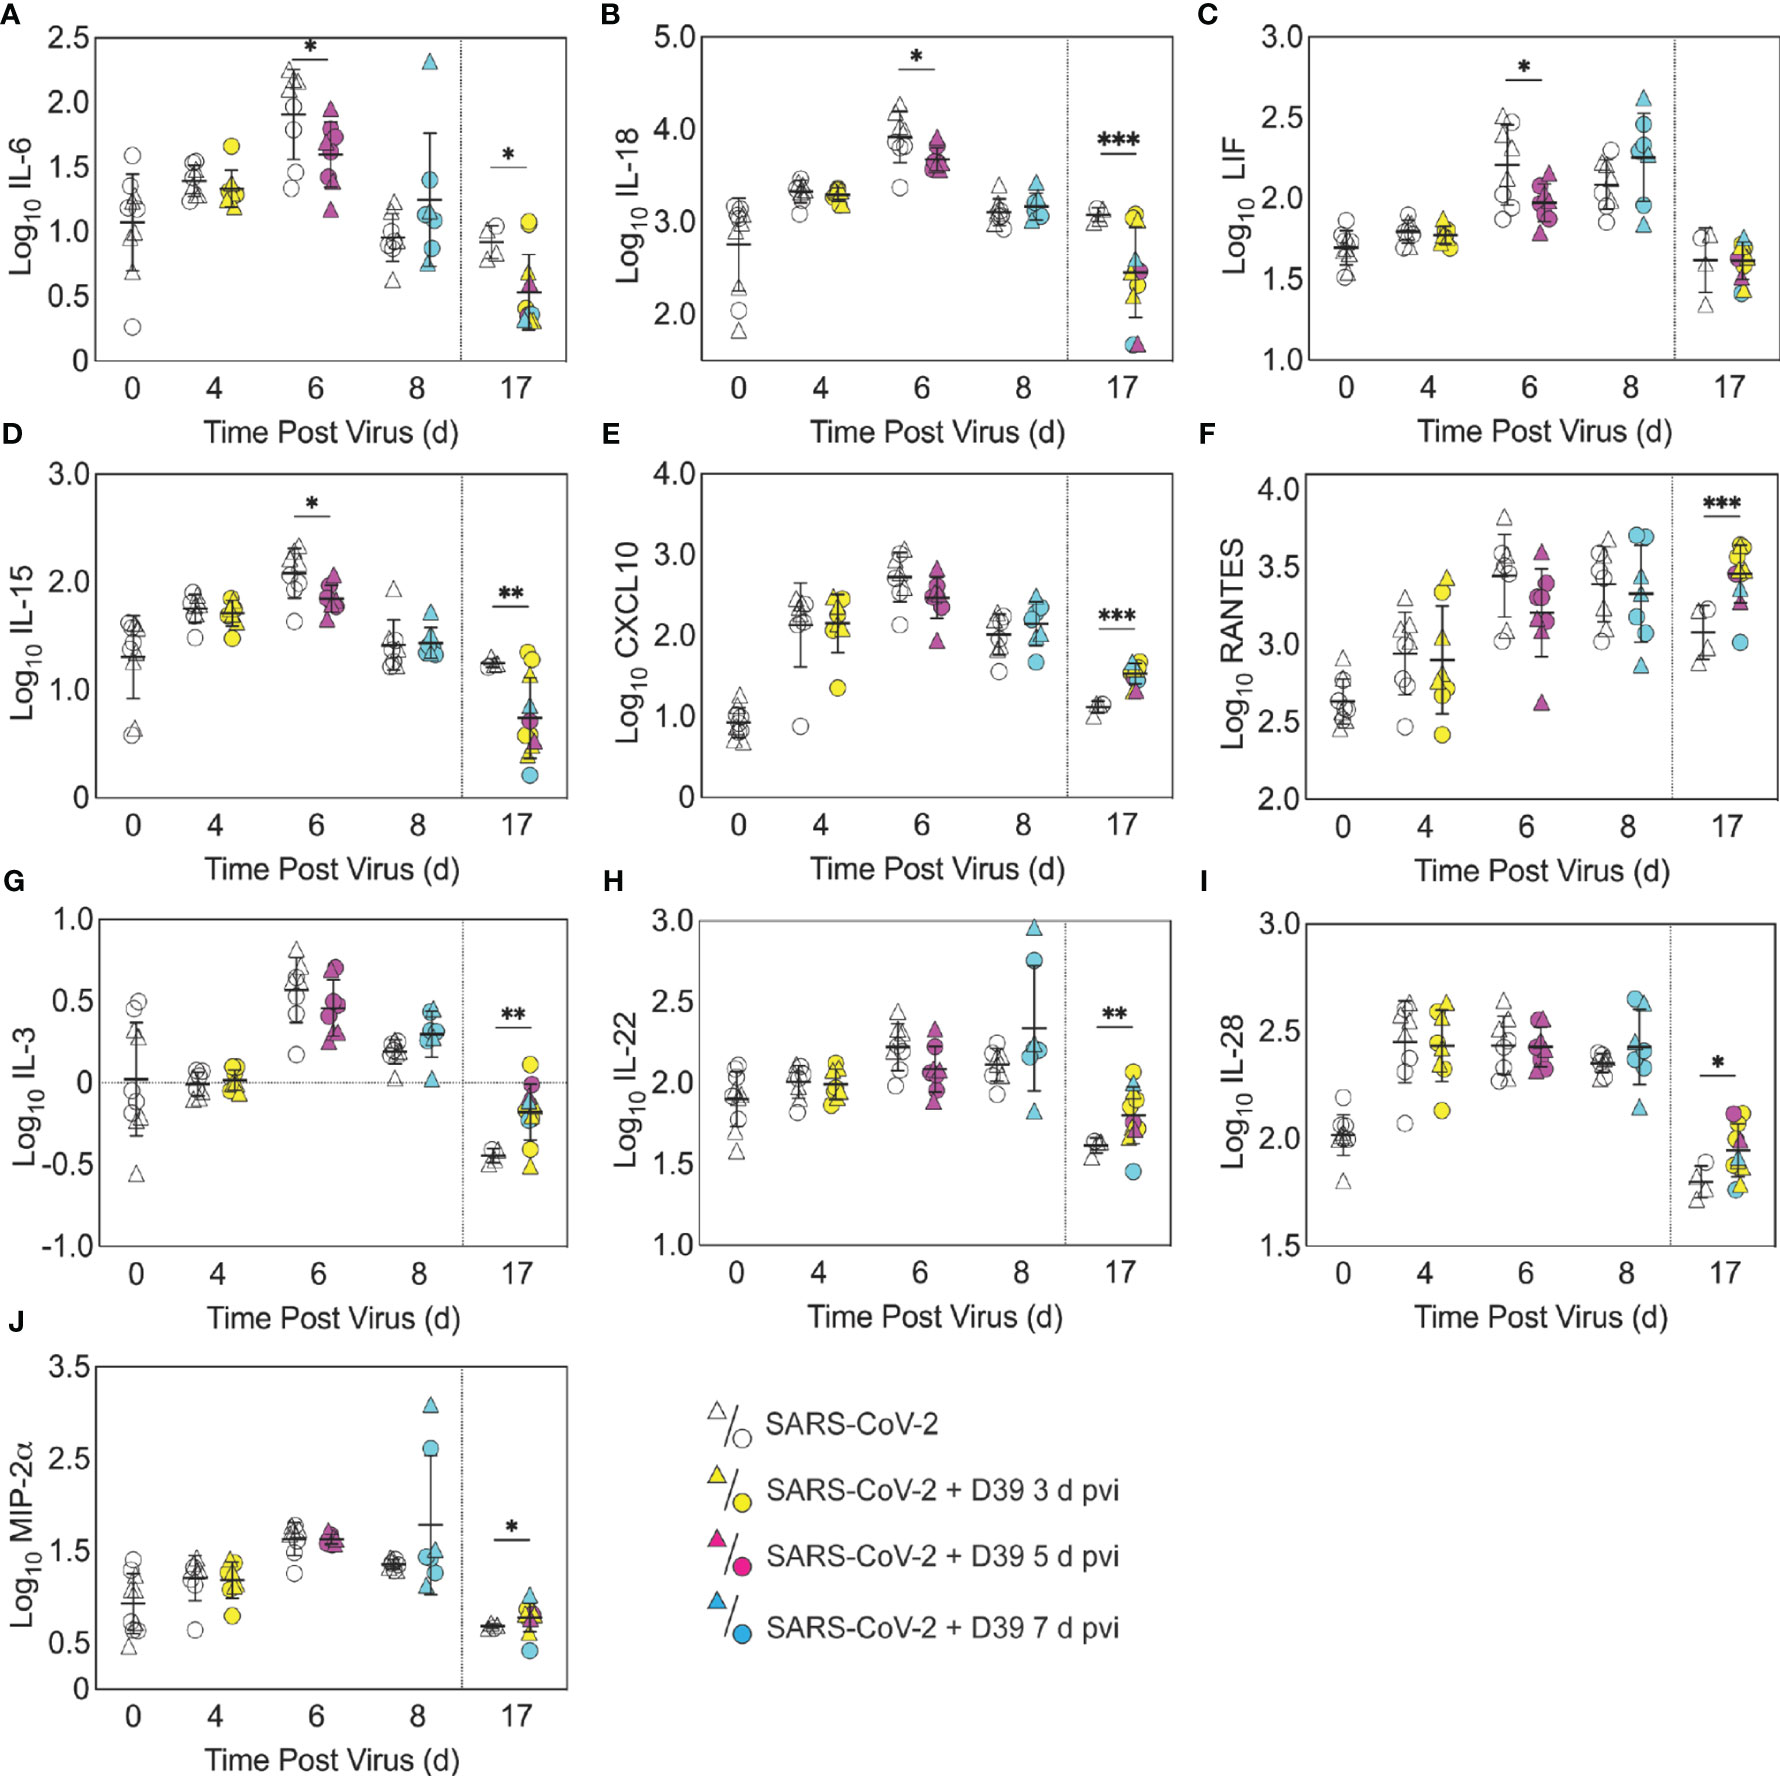
Figure 4 Pulmonary cytokines and chemokines during SARS-CoV-2 infection and SARS-CoV-2-pneumococcal coinfection. Total IL-6 (A), IL-18 (B), LIF (C), IL-15 (D), CXCL10 (E), RANTES (F), IL-3 (G), IL-22 (H), IL-28 (I), and MIP-2α (J) in the lungs of female (circles) and male (triangle) mice infected with SARS-CoV-2 (250 PFU; white) followed by infection with 103 CFU D39 at 3 d (yellow), 5 d (magenta), or 7 d (cyan) pvi. Each symbol represents a single mouse and the mean ± standard deviation (SD) are for combined male and female groups. Significant differences are indicated by *,P < 0.05; **,P < 0.01; ***,P < 0.001 for comparisons between indicated groups. Plots depicting additional cytokine and chemokine quantities (absolute log10 picograms) are in Figure S5 and a heatmap representing the normalized quantity (average log2 change over naïve) is in Figures S6.
As expected, a significant influx of CD45+ immune cells was evident at 6 and 8 d pvi in animals infected with SARS-CoV-2 only (both P < 0.001) (Figure S3A), including neutrophils (Ly6Ghi; both P < 0.01; Figure 3A), the F4/80midCD11cmidCD11b+ monocyte/macrophage subset (both P < 0.001; Figure 3B), inflammatory macrophages (F4/80hiCD11chiCD11b+, iMΦ; P = 0.02 and P < 0.001, respectively; Figure 3C), F4/80midCD11c- cells (both P < 0.001; Figure S3B), NK cells (both P < 0.001; Figure S3C), CD4+ T cells (P = 0.02 and P < 0.001, respectively; Figure 3F), and CD8+ T cells (both P < 0.001; Figure 3G). Unlike the pathogen loads, some of the immune cells were different between males and female that were mock coinfected at 5 d pvi, including neutrophils (P = 0.047), resident alveolar macrophages (F4/80hiCD11chiCD11b-MHC-IIlow/-, AMΦ; P = 0.047), CD4+ T cells (P = 0.02), NK cells (P = 0.03), and NK T cells (P = 0.02), which were higher in females than males.
In the groups coinfected with bacteria at 3 d pvi, no changes were observed in the absolute number (Figures 3, S3) or activation (Figure S4) of any quantified immune cell subset or the amount of cytokines and cytokines (Figures 4, S5) within 24 h pbi compared with mock coinfection. A bacterial coinfection at 5 d pvi resulted in fewer total CD45+ cells (P = 0.03; Figure S3A), including neutrophils (Figure 3A), CD19+ B cells (Figure 3E), CD8+ T cells (Figure 3G), and F4/80midCD11c- cells (Figure S3B) (all P < 0.05) compared with the mock coinfected groups. In addition, iMΦ (P = 0.01) and AMΦ (P = 0.047) were again higher in females than males following coinfection at 5 d pvi (Figures 3C, D). The extent of activation was not different between the mock coinfection and bacterial coinfection at 5 d pvi (Figure S4), but reduced IL-6, IL-18, LIF (all P = 0.04), and IL-15 (P = 0.02) was observed at 24 h pbi (Figures 4A-D).
Coinfection at 7 d pvi induced a significant increase in neutrophils at 24 h pbi (P < 0.001) (Figure 3A) without altering the number or activation of any other immune cell quantified (Figures 3, S3, S4). AMΦ were reduced in the mock coinfected group compared with naïve animals (P = 0.001) but were not different between the mock coinfection and bacterial coinfection (P = 0.29) (Figure 3D). Absolute cell numbers and activation did not differ between male and female mice following coinfection at 7 d pvi (Figures 3, S3, S4). Perhaps unexpectedly, none of the measured cytokines were significantly different between animals that were mock coinfected and animals that were bacterial coinfected at 7 d pvi (Figure 4 and Figure S5).
Pneumococcal Coinfection Resulted in Sustained Increases in Pulmonary Immune Responses After Recovery
To investigate whether bacterial coinfection altered immune cell dynamics and activation in recovered animals, pulmonary immune cells, cytokines, and chemokines were quantified at 17 d pvi following mock coinfection or bacterial coinfection at 3, 5, or 7 d pvi. The number of iMΦ (P = 0.01) (Figure 3C) and CD8+ T cells (P = 0.02) (Figure 3G), as well as the activated proportion of iMΦ (P = 0.004), CD8+ T cells (P = 0.001), CD4+ T cells P 0.001), and CD19+ B cells (P = 0.005) (Figure S4), remained increased above naïve levels in the lungs of animals that recovered from SARS-CoV-2 infection alone. These changes were accompanied by elevated IFN-γ, CXCL10, and RANTES (P = 0.01, P = 0.03, and P = 0.04, respectively) at 17 d pvi compared to naïve (Figures 4, S5, S6). However, many measured cytokines and chemokines were below naive levels at 17 d pvi in the lungs of animals infected with SARS-CoV-2 only, including eotaxin, IL-2, IL-3, IL-17A, IL-22, IL-27, IL-28, M-CSF, and MIP-2α (all P < 0.05) (Figures 4, S5, S6).
A sustained increase in immune cell accumulation and activation was evident in animals that recovered from SARS-CoV-2-pneumococcal coinfection. At 17 d pvi, an increased absolute number and activated proportion of F4/80midCD11cmidCD11b+ monocytes/macrophages (P = 0.01; Figures 3B, 4B), iMΦ (P = 0.01; Figures 3C, S4C), and CD4+ and CD8+ T cells (P = 0.03 and 0.02, respectively; Figures 3F, G, S4F, G) were present in coinfected mice compared with mock coinfected mice. Comparison between the coinfected groups indicated that more CD8+ T cells were present at 17 d pvi in mice that were coinfected at 3 d or 7 d pvi than those coinfected at 5 d pvi (both P = 0.02; Figure 3G). In addition, animals that recovered from a coinfection at 7 d pvi had more activated neutrophils or iMΦ than those who recovered from a coinfection at 3 d pvi (P = 0.04) or 5 d pvi (P = 0.03), respectively (Figures S4A, C). These changes were accompanied by higher levels of CXCL-10 (P < 0.001), MIP-2α (P = 0.04), IL-3 (P = 0.001), IL-22 (P < 0.008), IL-28 (P = 0.01), and RANTES (P < 0.001) in the lungs of mice that had recovered from a bacterial coinfection compared with those recovered from SARS-CoV-2 alone (17 d pvi; Figure 4E–J). In addition, select cytokines and chemokines were reduced in animals that recovered from bacterial coinfection compared with those that were mock coinfected, including CXCL-1 (P = 0.01), IL-1α (P = 0.04), IL-6 (P = 0.03), IL-9 (P = 0.03), IL-10 (P < 0.001), IL-13 (P < 0.001), IL-15 (P = 0.001), IL-18 (P < 0.001), G-CSF (P = 0.03), and TNF-α (P =0.02) (17 d pvi; Figures 4, S5). These cytokines, except for IL-1α (P = 0.19) and IL-18 (P = 0.09), were also below baseline levels (all P < 0.05). In addition, IL-2 (P = 0.02), IL-5 (P = 0.02), IL-17A (P = 0.04), and eotaxin (P = 0.01) were below baseline in both the bacterial coinfected and mock coinfected groups (Figures 4, S5).
Bacterial Coinfection Did Not Enhance Lung Pathology
To examine whether lung pathology was enhanced during SARS-CoV-2-pneumococcal coinfection, we assessed seven pathological features (endothelial hypertrophy/margination, peribronchiolar/perivascular lymphoid cells, interstitial inflammation/septal thickening, alveolar inflammation, alveolar edema/hemorrhage, the extent of alveolar involvement, and consolidation (Figure 5). There were no significant differences in any of these measurements between mock coinfected animals and those coinfected with bacteria at 3 or 5 d pvi at either 24 h pbi or 17 d pvi.
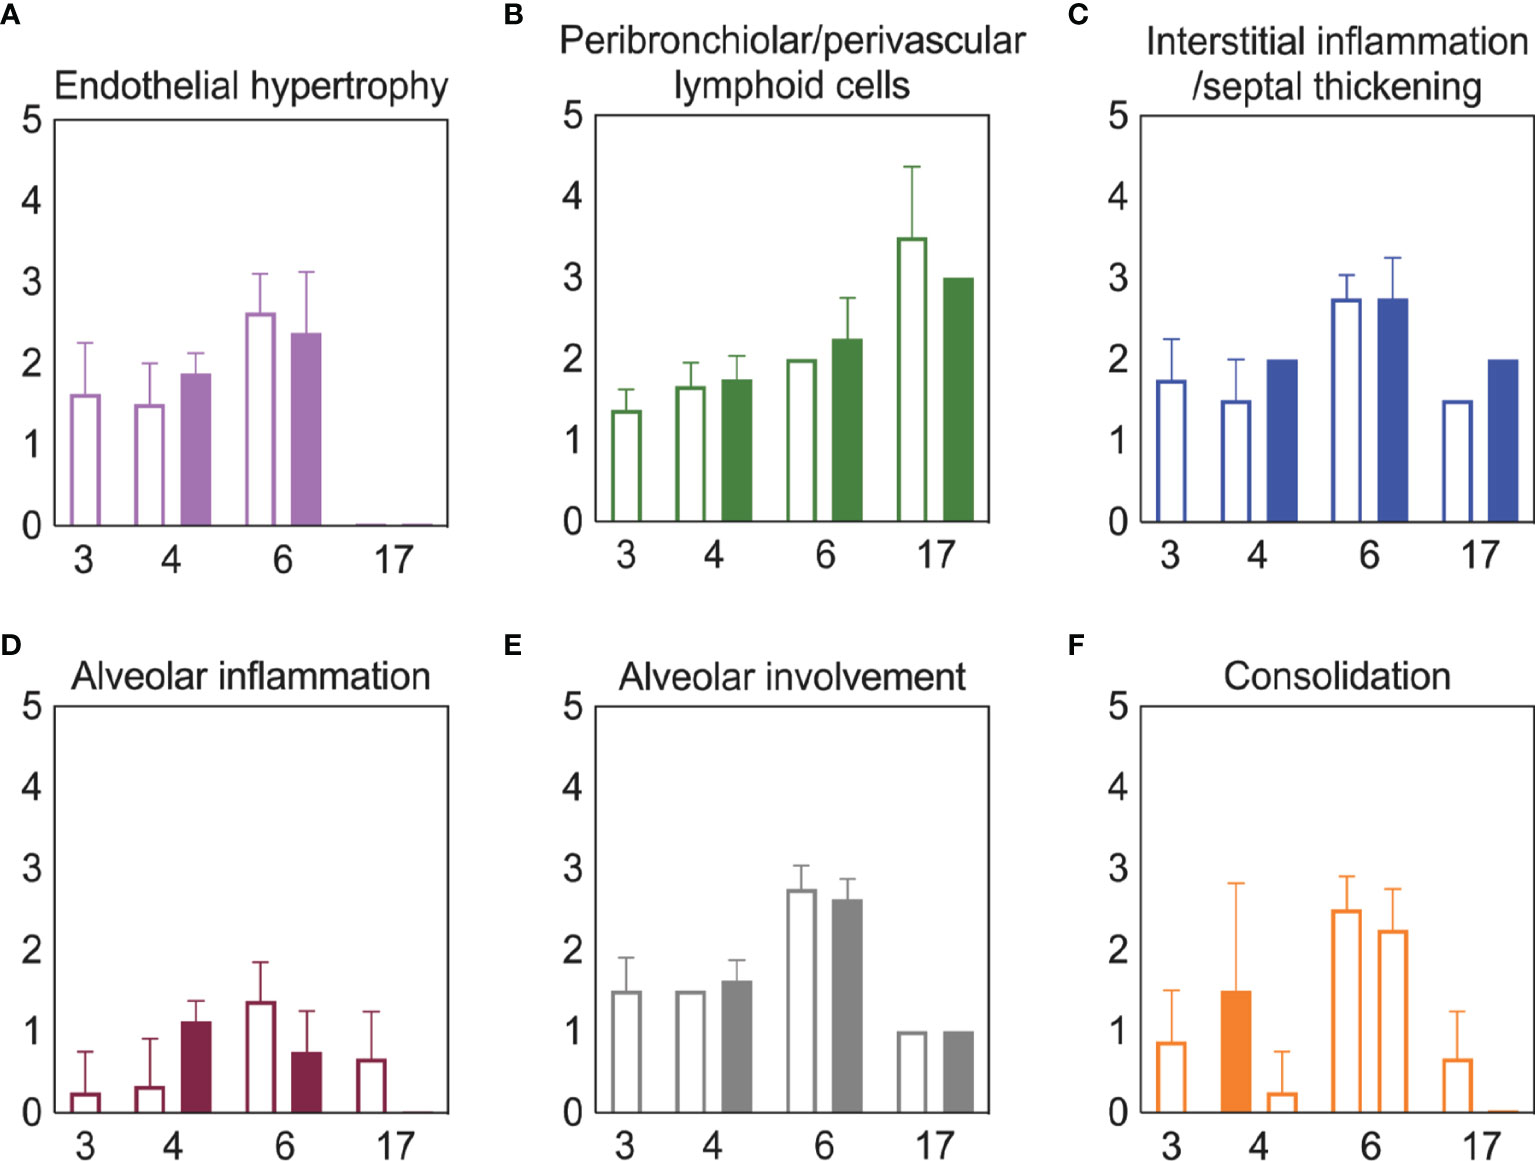
Figure 5 Lung pathology during SARS-CoV-2 infection and pneumococcal coinfection. Average endothelial hypertrophy (A), peribronchiolar/perivascular lymphoid cells (B), interstitial inflammation/septal thickening (C), alveolar inflammation (D), extent of alveolar involvement (E), and consolidation (F) in lungs of mice infected with SARS-CoV-2 (250 PFU; open bars) followed by 103 CFU D39 at 3 or 5 d pvi (filled bars). Plots represent the mean ± standard deviation (SD) bars for combined male and female groups.
Discussion
Currently, clinical data suggests variable, but moderate, frequency of bacterial coinfections in hospitalized COVID-19 patients (1–29). The wide range of reported rates is, at least in part, due to heterogeneous study designs, variability in the disease severity, age, and/or comorbidities of each cohort, the collection and detection methods used, and the panel of pathogens screened. Further, the reduced transmission of many pathogens (104–108) might have kept the rates of SARS-CoV-2-related bacterial pneumonia at an artificially low level during the COVID-19 pandemic. The results from this study suggest that we might expect more complications from bacterial pathogens going forward even in mild SARS-CoV-2 scenarios, which are becoming more common due to vaccine availability (109–111).
Here, we used the K18-hACE2 mouse model to establish that SARS-CoV-2 infection increases the risk of bacterial coinfection in a time-dependent manner with increased disease severity, pulmonary bacterial burden, bacteremia, and neutrophilia. This time dependency is similar to that of influenza-bacterial coinfections, but the lethality during the SARS-CoV-2-pneumococcal coinfection (Figure 1) was delayed comparatively (77) and some animals survived. In contrast, influenza-pneumococcal coinfections at similar doses consistently result in 100% lethality within 1-3 d pbi (77). Although further studies are needed to assess the potential for more severe coinfections at later time points, this may indicate a larger window for administration of antibacterial therapies in coinfected patients.
Mechanisms that contribute to increased risk and severity of bacterial coinfection during acute pulmonary diseases are complex and varied [Reviewed in (36, 39–41, 45, 84, 85, 112)]. While the mechanisms for SARS-CoV-2-bacterial coinfections remain unknown, the similar time-dependent susceptibility during influenza may yield insight. We and others have shown that viral-induced changes to the number (67, 69, 70) or functionality (70, 72, 113–115) of AMΦs, which may be mediated by IFN-γ (55, 115, 116), render these cells less capable of clearing bacteria. Here, SARS-CoV-2-pneumococcal coinfection did coincide with a virally induced reduction in AMΦ (Figure 3), which may suggest a contribution of these cells to the acquisition of bacteria during COVID-19 particularly when paired with evidence of a dysfunctional myeloid response in patients with severe infections (75). Further studies to determine how a productive SARS-CoV-2 infection of AMΦ alters infection dynamics, their production of IFN, and their phagocytic capacity (86–89) are needed. In addition, IFN-independent mechanisms of macrophage dysfunction should also be investigated because some studies suggest that RSV coinfection severity is mediated by Gas6/Axl polarization of AMΦ to non-antibacterial (M2) type cells (117). Other mechanisms, including viral-mediated changes in bacterial receptor expression and binding (77, 118–121) and the degradation of epithelial tight junction integrity (122, 123) may also promote bacterial adherence during IAV or RSV infections, and some evidence suggests that these also occur during SARS-CoV-2 infection (124–126). However, the limited colocalization of pneumococcus with SARS-CoV-2 suggests a limited role (Figure 2).
Several studies have found that neutrophil dysfunction contributes to pathogenicity of IAV-pneumococcal coinfection, and this seems to be mediated by bacterial metabolism (82) and type I IFNs (71, 83, 127). However, unlike IAV-pneumococcal coinfections, type I IFNs were unchanged after SARS-CoV-2-pneumococcal coinfection (Figure S5) and neutrophil infiltration was only observed in coinfection at 7 d pvi (Figure 3A), suggesting that there may be different mechanisms underlying the enhanced pathogenicity of SARS-CoV-2 pneumococcal coinfection. This may, in part, be related to the low dose used here, where some studies have found that the SARS-CoV-related alterations to the IFN and iMФ responses occur during more severe infections (128). It was intriguing to see here that cytokine production was largely unchanged at 24 h pbi (Figures 4, S5), which is in contrast with the robust proinflammatory cytokine/chemokine production during other viral-bacterial coinfections (39–41, 45, 84, 85). Perhaps unexpectedly, several cytokines associated with severe COVID-19 and damaging cytokine overproduction (IL-6, IL-15, and IL-18) (129, 130) were reduced following coinfection at 5 d pvi (Figure 4).
Although coinfections are typically thought to be hyperinflammatory with enhanced disease severity, tissue inflammation does not seem to be altered during SARS-CoV-2-pneumococcal (Figure 5) or influenza-pneumococcal (55) coinfections even with large neutrophil infiltrations (55, 82) (Figure 3A), at least within the first few days of coinfection. This may be owed to the nonlinearities between host immune responses, tissue inflammation, and disease severity (55, 56). Although the pathogenicity was increased during the coinfections at 5 d and 7 d pvi, there seemed to be little contribution from SARS-CoV-2, where the burden and distribution did not change within the first 24 h pbi (Figure 2) despite reduced CD8+ T cells in some groups (Figure 3G). In IAV-pneumococcal coinfections, invading bacteria result in robustly increased viral loads (55, 68, 82, 131–133) regardless of timing (55) and viral dissemination in the lung is increased by 30-50% (55). Our prior work (55) suggests this is due to a combination of direct viral-bacterial interactions (97) that lead to viral access to new areas of the lung in addition to increased virus production rates (68) that may be mediated by alterations to the antiviral IFN response (98). The lack of detection of SARS-CoV-2 in new areas of the lung and the lack of significant colocalization of virus and bacteria (Figure 2) may suggest that SARS-CoV-2 cannot as readily attach to pneumococcus like other viruses (97, 134), which is positive news given that pneumococci easily invade the blood [Reviewed in (135)] and SARS-CoV-2 affects numerous other organs (51–54).
Although the long-term effects of viral-bacterial coinfections are not well studied, these data suggest they may be important where the SARS-CoV-2-bacterial coinfection resulted in lasting immunologic changes in recovered individuals. The higher macrophages and T cells (Figure 3) and their associated cytokines (Figures 4, S5) at 17 d pvi in animals recovered from bacterial coinfection is intriguing and suggests sustained immunopathology (55, 56, 136, 137). Many of the elevated responses are indicators of acute respiratory distress syndrome (ARDS) (138, 139) and are upregulated to promote tissue recovery and reduce pathology (140–143). This was reflected in the slightly greater interstitial inflammation 17 d pvi (Figure 5) in coinfected animals. However, several cytokines were lower in animals that had recovered from bacterial coinfection with some below that of a naïve animal (Figures S5 and S6), which may support a remodeling environment induced, in part, by hyporesponsive epithelial cells downregulating inflammatory cytokine production to minimize local immune activation [Reviewed in (144)]. In addition, the reductions in Th2 cytokines (e.g., IL-13, IL-5, and IL-9) may be an attempt to improve lung function (145–148) while limiting hyperreactivity and further damage. Nevertheless, our results suggest a lengthy recovery of the lung from both SARS-CoV-2 and SARS-CoV-2-related secondary bacterial infections.
Vaccinating against SARS-CoV-2 is likely to prove important for reducing the incidence and severity of bacterial coinfections as it has for influenza (149). The robust efficacy of the SARS-CoV-2 vaccines is encouraging (150–153), but infection is still possible with viral replication in the nasopharynx in some vaccinated individuals (154–157). This could present an opportunity for bacterial pathogens to invade and worsen the infection. With few vaccines available for coinfecting bacteria (149), the interactions within the nasopharynx between this virus and both commensal and pathogenic bacteria will be important to study.
In summary, we used the transgenic K18-hACE2 mouse model (158) to establish that a low dose SARS-CoV-2 infection increases the risk of pneumococcal coinfection in a time-dependent manner. The data importantly highlight many differences with other viral-bacterial coinfections and the need for further studies to clarify the host-pathogen interplay that enhance susceptibility and pathogenicity during SARS-CoV-2-bacterial coinfection. This information may be crucial going forward, particularly because a sustained immune activation following coinfection suggests an increased risk of developing ARDS even in patients with mild COVID-19. In addition, as new SARS-CoV-2 variants emerge and nonpharmaceutical measures, such as wearing masks and physical distancing, become less common, we might anticipate an increase in risk of bacterial transmission and acquisition in COVID-19-infected individuals.
Materials and Methods
Mice
Adult (10-13 week old) male and female K18-hACE2 transgenic mice (B6.Cg-Tg(K18-ACE2)2Prlmn/J) were obtained from Jackson Laboratories (Bar Harbor, ME). Mice were housed in groups of 4 in solid–bottom polysulfone individually ventilated cages (Allentown BCU) in rooms maintained on a 12:12-hour light:dark cycle at 22 ± 2°C with 30-70% humidity in the Regional Biocontainment Laboratory (animal biosafety level 3 facility) at UTHSC (Memphis, TN). Mice were acclimated for 1 day before being lightly anesthetized with 2% inhaled isoflurane (Baxter, Deerfield, IL) and implanted subcutaneously with an IPTT300 transponder (Bio Medic Data Systems, Seaford, DE) for identification and temperature monitoring, followed by an additional 3 days of acclimation before inclusion in the experiments. Envigo irradiated rodent diet (catalog no. 7912) and autoclaved water were available ad libitum during the acclimation and study periods; gel food and hydrogel were provided at the time of infection. All experimental procedures were performed under protocol 20-0132 approved by the Institutional Animal Care and Use Committee at University of Tennessee Health Science Center (UTHSC) under relevant institutional and American Veterinary Medical Association (AVMA) guidelines and were performed in a animal biosafety level 3 facility that is accredited by the American Association for Laboratory Animal Science (AALAS).
Infection Experiments
All experiments were done using 2019-nCoV/USA-WA1/2020 (BEI Resources NR-52281) (SARS-CoV-2) and type 2 pneumococcal strain D39. The viral infectious dose [plaque forming units (PFU)] was determined by plaque assay of serial dilutions on Vero E6 cells. Virus seed stocks were sequenced using next-generation sequencing with ARTIC primers on the Illumina MiSeq. Bacterial infectious dose [colony forming units (CFU)] was determined by using serial dilutions on tryptic soy agar plates supplemented with 3% sheep erythrocytes (TSA). Doses of virus and bacteria were selected that elicited mild-moderate disease independently to ensure that changes in disease severity following coinfection would be evident. Frozen stocks were diluted in sterile PBS and administered intranasally to groups of 4 mice, lightly anesthetized with 2.5% inhaled isoflurane (Baxter, Deerfield, IL) in a total volume of 50 µl (25 µl per nostril). Mice were inoculated with either PBS or SARS-CoV-2 at day 0 then with 103 CFU of D39 or PBS, either 3 or 5 days later. Assessment of symptom severity was performed twice daily after the onset of symptoms by assigning a score (scale 0-3) to clinical features, including weight loss (0, <15%; 1, 15-20%; 2, 21-25%; 3, >25%), temperature change (0, >34°C; 1, 34-31°C; 2, 30-26°C; 3, <26°C), body condition/appearance (0, normal; 1, roughened fur; 2, roughened fur, hunched posture, mild grimace, active; 3, roughened fur, hunched posture, grimace, inactive, conjunctivitis, head-tilt), respiratory effort (0, normal; 2, increased respiratory rate and effort; 3, weak, intermittent breathing), behavior (0, normal; 1, slow, unprovoked movement; 2, slow, provoked movement; 3, minimal response/unresponsive or spinning), and dehydration (0, normal; 1, ≤ 2 second skin tent, mildly sunken eyes; 2, 2-3 second skin tent, sunken eyes; 3, > 3 second skin tent, sunken eyes). Mice were euthanized if they lost >25% of their starting body weight or became moribund based on clinical scores (a score of 3 in any single category or a cumulative score of ≥9 in respiratory effort, dehydration, temperature reduction, behavior, body condition/appearance).
Harvest and Processing of Lungs and Blood
Mice were euthanized by 33% isoflurane inhalation. Lungs were aseptically harvested, washed in PBS, and fixed in 10% neutral buffered formalin for histology or digested with collagenase (1 mg/ml, Sigma C0130) and physical homogenization against a 40 µm cell strainer for immune cell staining. Lung digest supernatants were used to quantify cytokines and chemokines and to determine viral and bacterial titers as above; bacterial titers were also measured in peripheral blood. Following red blood cell lysis, lung cells were washed in staining buffer (PBS, 5mM EDTA, 10mM HEPES, and 0.5% bovine serum albumin), counted with trypan blue exclusion using a Cell Countess System (Invitrogen, Grand Island, NY), and prepared for flow cytometric analysis as described below.
Flow Cytometric Analysis
Flow cytometry (BD FACSAria; San Jose, CA) was performed on single cell suspensions after Fc receptor blocking (TruStainFcX, Biolegend) and viability staining (Zombie Violet Fixable Viability, Biolegend), 25 min surface staining, and fixation (BD Cytofix). The followed anti-mouse antibody panels were used for cell subset analysis: CD45 (clone 30-F11, Pe-Cy7, Biolegend), CD3e (clone 145-2C11, FITC, Biolegend), CD4 (clone RM4-5, V500, BD Biosciences), CD8α (clone 53-6.7, PerCP-Cy5.5, Biolegend), CD19 (clone 6D5, PE, Biolegend), CD335 (clone 29A1.4, APC-Fire750, Biolegend), and CD69 (clone H1.2F3, APC, Biolegend) or CD45 (clone 30-F11, Pe-Cy7, Biolegend), Ly6G (clone 1A8, PerCP-Cy5.5, Biolegend), F4/80 (clone BM8, PE, eBioscience), CD11b (clone M1/70, V500, BD Biosciences), CD11c (clone N418, APC-Fire750, Biolegend), MHC-II (clone I-A/I-E, FITC, eBioscience), and CD69 (clone H1.2F3, APC, Biolegend). The data were analyzed using FlowJo 10.7.2 (Tree Star, Ashland, OR). Data were cleaned using the flowAI application (159) followed by gating viable cells from a forward scatter/side scatter plot, singlet inclusion, and viability dye exclusion. CD45+ cells were selected for further analyses. Neutrophils (Ly6Ghi), alveolar macrophages (AMΦ) (F4/80hiCD11chiCD11b-MHC-IIlow/-), inflammatory/exudate macrophages (iMΦ) (F4/80hiCD11chiCD11b+MHC-IImid/hi), other monocyte/macrophage populations (F4/80midCD11cmidCD11b+ and F4/80midCD11c-CD11b+/-), NK cells (CD3e-CD19-CD335+), CD4 T cells (CD3+CD8-CD4+CD335-), CD8 T cells (CD3+CD8+CD4-CD335-), NK T cells (CD3e+CD335+), B cells (CD3e-CD19+), and recently activated subsets thereof (CD69+) were gated as in Figure S2.
Cytokine and Chemokine Quantification
Cytokines G-CSF (CSF-3), GM-CSF, IFN-γ, IL-1α, IL-1β, IL-2, IL-3, IL-4, IL-5, IL-6, IL-9, IL-10, IL-12p70, IL-13, IL-15/IL-15R, IL-17A (CTLA-8), IL-18, IL-22, IL-23, IL-27, IL-28, IL-31, LIF, MCP-3 (CCL7), M-CSF, TNF-α) and chemokines (ENA-78 (CXCL5), eotaxin (CCL11), GROα (CXCL1), IP-10 (CXCL10), MCP-1 (CCL2), MIP-1α (CCL3), MIP-1β (CCL4), MIP-2α (CXCL2), RANTES (CCL5) were measured in lung supernatant by Luminex and ELISA (IFN-α,β). Before use, cell debris and aggregates were removed by centrifugation at 4°C, 400 x g. ProcartaPlex magnetic bead cytokine/chemokine plates (Invitrogen) were prepared according to the manufacturer’s instructions. Data were acquired using a MagPix (Luminex) with Luminex xPonent software (v4.2) and analyzed with the ProcartaPlex Analysis App (ThermoFisher Connect). ELISAs for IFNα and IFNβ (PBL Assay Science) were prepared according to the manufacturer’s instructions, read at 450 nm, and analyzed using GraphPad Prism 9.2.0. Mean concentrations of duplicate samples were calculated by the construction of standard curves using a weighted 5PL and 4PL regression for the ProcartaPlex and ELISA data, respectively. Absolute quantities of each cytokine/chemokine were calculated based on the mean concentration of replicate samples normalized to the lung supernatant volume collected during tissue processing. Internal plate controls were used to adjust values obtained between plates and fold changes in cytokine and chemokine quantities were calculated for each animal, normalized to the average of naïve controls (pooled males/females).
Histology
Following euthanasia and tissue removal as above, lungs were continually fixed in 10% neutral-buffered formalin solution (NBF; ThermoFisher Scientific, Waltham, MA) before being embedded in paraffin, sectioned at 4μm, and mounted on positively charged glass slides (Superfrost Plus; Thermo Fisher Scientific, Waltham, MA). Tissue sections were stained with hematoxylin and eosin (H&E) or subjected to immunohistochemical (IHC) staining to detect SARS-CoV-2 antigen or pneumococcus. Tissue sections were deparaffinized and rehydrated before undergoing antigen retrieval in a citrate-based solution (pH 6.0) at 97°C for SARS-CoV-2 detection or a tris-based solution (pH 9.0) for pneumococcal detection (Vector Laboratories, Burlingame, CA). For IHC, a primary monoclonal antibody against SARS-CoV-2 nucleoprotein (NP) (Sino Biological, Wayne, PA) or a rabbit polyclonal antibody against pneumococcus (Novus Biologicals, Littleton, CO) was used at 1:1000 followed by a biotinylated anti-rabbit antibody (Vector Laboratories, Burlingame, CA) at 1:200, the Vectastain Elite ABC-HRP kit (Vector Laboratories, Burlingame, CA), and 3,3’-Diaminobenzidine (DAB) solution development. Stained sections were counterstained with hematoxylin, dehydrated, and examined by a pathologist blinded to the experimental group assignments. Pathology was scored on a scale from 0-5, where 0 = normal, no tissue affected; 1 = minimal: rare or inconspicuous lesions; 2 = mild: multifocal or small, focal, or widely separated, but conspicuous lesions; 3 = moderate: multifocal, prominent lesions; 4 = marked: extensive to coalescing lesions or areas of inflammation with some loss of structure; 5 = severe: diffuse lesion with effacement of normal structure. Intermediate severity grades were assigned where necessary. To quantify the extent of viral infection in the lungs, digital images of whole lung sections stained for viral antigen were first captured using the Aperio ScanScope XT Slide Scanner (Aperio Technologies, Inc., Vista, CA). The areas of both the entire lung parenchyma (alveoli and bronchioles) and the virus-positive regions were outlined manually with areas determined using ImageScope software (Aperio Technologies, Inc.). Representative images and quantitative analyses of viral spread and lung pathology during infection are shown in Figures 2, 5, respectively.
Statistical Analysis
Significant differences in Kaplan-Meier survival curves were calculated using the log-rank test. Linear values of lung and blood bacterial loads, viral loads, immune cells, and cytokines/chemokines were compared using an unpaired t test with Welch correction except where the Mann-Whitney test was used due to unequal variances (GraphPad Prism 9.2.0 and Rv4.0.3). The confidence interval of significance was set to 95%, and P ≤ 0.05 was considered significant.
Data Availability Statement
The original contributions presented in the study are included in the article/Supplementary Material. Further inquiries can be directed to the corresponding authors. The following reagent was deposited by the Centers for Disease Control and Prevention and obtained through BEI Resources, NIAID, NIH: SARS-Related Coronavirus 2, Isolate USA-WA1/2020, NR-52281.
Ethics Statement
The animal study was reviewed and approved by Institutional Animal Care and Use Committee at the University of Tennessee Health Science Center.
Author Contributions
APS, RC, CJ, and AMS conceived and designed the experiments. APS, EW, TP, MS, LL, LZ, and YX performed the experiments. YX and PV performed histological analysis. APS and AMS wrote the manuscript with input from all authors. All authors contributed to the article and approved the submitted version.
Funding
This work was supported by the UTHSC Institute for the Study of Host Pathogen Systems, the University of Tennessee Research Foundation, and NIH grant number AI139088.
Conflict of Interest
The authors declare that the research was conducted in the absence of any commercial or financial relationships that could be construed as a potential conflict of interest.
Publisher’s Note
All claims expressed in this article are solely those of the authors and do not necessarily represent those of their affiliated organizations, or those of the publisher, the editors and the reviewers. Any product that may be evaluated in this article, or claim that may be made by its manufacturer, is not guaranteed or endorsed by the publisher.
Acknowledgments
We thank the staff of the Regional Biocontainment Laboratory and Deidre Daria, Ph.D. for technical support, and Jyothi Parvathareddy and Dong Yang for the generation and characterization of viral stocks.
Supplementary Material
The Supplementary Material for this article can be found online at: https://www.frontiersin.org/articles/10.3389/fimmu.2022.894534/full#supplementary-material
References
1. Toombs JM, Van den Abbeele K, Democratis J, Mandal AKJ, Missouris CG. Pneumococcal Coinfection in COVID-19 Patients. J Med Virol (2021) 93:177–9. doi: 10.1002/jmv.26278
2. Tsukamoto T, Nakajima N, Sakurai A, Nakajima M, Sakurai E, Sato Y, et al. Lung Pathology of Mutually Exclusive Co-Infection With SARS-CoV-2 and Streptococcus Pneumoniae. Emerg Infect Dis (2021) 27:919–23. doi: 10.3201/eid2703.204024
3. Adler H, Ball R, Fisher M, Mortimer K, Vardhan MS. Low Rate of Bacterial Co-Infection in Patients With COVID-19. Lancet Microbe (2020) 1:e62. doi: 10.1016/S2666-5247(20)30036-7
4. Zhu X, Ge Y, Wu T, Zhao K, Chen Y, Wu B, et al. Co-Infection With Respiratory Pathogens Among COVID-2019 Cases. Virus Res (2020) 285:198005. doi: 10.1016/j.virusres.2020.198005
5. He F, Xia X, Nie D, Yang H, Jiang Y, Huo X, et al. Respiratory Bacterial Pathogen Spectrum Among COVID-19 Infected and Non-COVID-19 Virus Infected Pneumonia Patients. Diagn Microbiol Infect Dis (2020) 98:115199. doi: 10.1016/j.diagmicrobio.2020.115199
6. Garcia-Vidal C, Sanjuan G, Moreno-Garcia E, Puerta-Alcalde P, Garcia-Pouton N, Chumbita M, et al. Incidence of Co-Infections and Superinfections in Hospitalized Patients With COVID-19: A Retrospective Cohort Study. Clin Microbiol Infect (2021) 27:83–8. doi: 10.1016/j.cmi.2020.07.041
7. Kreitmann L, Monard C, Dauwalder O, Simon M, Argaud L. Early Bacterial Co-Infection in ARDS Related to COVID-19. Intensive Care Med (2020) 46:1787–9. doi: 10.1007/s00134-020-06165-5
8. Bordi L, Nicastri E, Scorzolini L, Di Caro A, Capobianchi MR, Castilletti C, et al. Differential Diagnosis of Illness in Patients Under Investigation for the Novel Coronavirus (SARS-CoV-2), Italy, February 2020. Euro Surveill (2020) 25(8):2000170. doi: 10.2807/1560-7917.ES.2020.25.8.2000170
9. Chen N, Zhou M, Dong X, Qu J, Gong F, Han Y, et al. Epidemiological and Clinical Characteristics of 99 Cases of 2019 Novel Coronavirus Pneumonia in Wuhan, China: A Descriptive Study. Lancet (2020) 395:507–13. doi: 10.1016/S0140-6736(20)30211-7
10. Kim D, Quinn J, Pinsky B, Shah NH, Brown I. Rates of Co-Infection Between SARS-CoV-2 and Other Respiratory Pathogens. JAMA (2020) 323:2085–6. doi: 10.1001/jama.2020.6266
11. Nowak MD, Sordillo EM, Gitman MR, Paniz Mondolfi AE. Coinfection in SARS-CoV-2 Infected Patients: Where Are Influenza Virus and Rhinovirus/Enterovirus? J Med Virol (2020) 92:1699–700. doi: 10.1002/jmv.25953
12. Zhou S, Yang Y, Zhang X, Li Z, Liu X, Hu C, et al. Clinical Course of 195 Critically Ill COVID-19 Patients: A Retrospective Multicenter Study. Shock (2020) 54:644–51. doi: 10.1097/SHK.0000000000001629
13. Hazra A, Collison M, Pisano J, Kumar M, Oehler C, Ridgway JP, et al. Coinfections With SARS-CoV-2 and Other Respiratory Pathogens. Infect Control Hosp Epidemiol (2020) 41:1228–9. doi: 10.1017/ice.2020.322
14. Koehler P, Cornely OA, Bottiger BW, Dusse F, Eichenauer DA, Fuchs F, et al. COVID-19 Associated Pulmonary Aspergillosis. Mycoses (2020) 63:528–34. doi: 10.1111/myc.13096
15. Hughes S, Troise O, Donaldson H, Mughal N, Moore LSP. Bacterial and Fungal Coinfection Among Hospitalized Patients With COVID-19: A Retrospective Cohort Study in a UK Secondary-Care Setting. Clin Microbiol Infect (2020) 26:1395–9. doi: 10.1016/j.cmi.2020.06.025
16. Massey BW, Jayathilake K, Meltzer HY. Respiratory Microbial Co-Infection With SARS-CoV-2. Front Microbiol (2020) 11:2079. doi: 10.3389/fmicb.2020.02079
17. Lai CC, Wang CY, Hsueh PR. Co-Infections Among Patients With COVID-19: The Need for Combination Therapy With Non-Anti-SARS-CoV-2 Agents? J Microbiol Immunol Infect (2020) 53:505–12. doi: 10.1016/j.jmii.2020.05.013
18. Langford BJ, So M, Raybardhan S, Leung V, Westwood D, MacFadden DR, et al. Bacterial Co-Infection and Secondary Infection in Patients With COVID-19: A Living Rapid Review and Meta-Analysis. Clin Microbiol Infect (2020) 26:1622–9. doi: 10.1016/j.cmi.2020.07.016
19. Richardson S, Hirsch JS, Narasimhan M, Crawford JM, McGinn T, Davidson KW, et al. Presenting Characteristics, Comorbidities, and Outcomes Among 5700 Patients Hospitalized With COVID-19 in the New York City Area. JAMA (2020) 323:2052–9. doi: 10.1001/jama.2020.6775
20. Singh V, Upadhyay P, Reddy J, Granger J. SARS-CoV-2 Respiratory Co-Infections: Incidence of Viral and Bacterial Co-Pathogens. Int J Infect Dis (2021) 105:617–20. doi: 10.1016/j.ijid.2021.02.087
21. Guan Z, Chen C, Li Y, Yan D, Zhang X, Jiang D, et al. Impact of Coinfection With SARS-CoV-2 and Influenza on Disease Severity: A Systematic Review and Meta-Analysis. Front Public Health (2021) 9:773130. doi: 10.3389/fpubh.2021.773130
22. Amin-Chowdhury Z, Aiano F, Mensah A, Sheppard C, Litt D, Fry NK, et al. Impact of the COVID-19 Pandemic on Invasive Pneumococcal Disease and Risk of Pneumococcal Coinfection With SARS-CoV-2: Prospective National Cohort Study, England. Clin Infect Dis (2020) 72(5):e65–75. doi: 10.1093/cid/ciaa1728
23. Shafran N, Shafran I, Ben-Zvi H, Sofer S, Sheena L, Krause I, et al. Secondary Bacterial Infection in COVID-19 Patients is a Stronger Predictor for Death Compared to Influenza Patients. Sci Rep (2021) 11:12703. doi: 10.1038/s41598-021-92220-0
24. Contou D, Claudinon A, Pajot O, Micaelo M, Longuet Flandre P, Dubert M, et al. Bacterial and Viral Co-Infections in Patients With Severe SARS-CoV-2 Pneumonia Admitted to a French ICU. Ann Intensive Care (2020) 10:119. doi: 10.1186/s13613-020-00736-x
25. Sharifipour E, Shams S, Esmkhani M, Khodadadi J, Fotouhi-Ardakani R, Koohpaei A, et al. Evaluation of Bacterial Co-Infections of the Respiratory Tract in COVID-19 Patients Admitted to ICU. BMC Infect Dis (2020) 20:646. doi: 10.1186/s12879-020-05374-z
26. Mirzaei R, Goodarzi P, Asadi M, Soltani A, Aljanabi HAA, Jeda AS, et al. Bacterial Co-Infections With SARS-CoV-2. IUBMB Life (2020) 72:2097–111. doi: 10.1002/iub.2356
27. Musuuza JS, Watson L, Parmasad V, Putman-Buehler N, Christensen L, Safdar N. Prevalence and Outcomes of Co-Infection and Superinfection With SARS-CoV-2 and Other Pathogens: A Systematic Review and Meta-Analysis. PloS One (2021) 16:e0251170. doi: 10.1371/journal.pone.0251170
28. Rodriguez-Nava G, Yanez-Bello MA, Trelles-Garcia DP, Chung CW, Egoryan G, Friedman HJ. A Retrospective Study of Coinfection of SARS-CoV-2 and Streptococcus Pneumoniae in 11 Hospitalized Patients With Severe COVID-19 Pneumonia at a Single Center. Med Sci Monit (2020) 26:e928754. doi: 10.12659/MSM.928754
29. Feldman C, Anderson R. The Role of Co-Infections and Secondary Infections in Patients With COVID-19. Pneumonia (Nathan) (2021) 13:5. doi: 10.1186/s41479-021-00083-w
30. Rawson TM, Moore LSP, Zhu N, Ranganathan N, Skolimowska K, Gilchrist M, et al. Bacterial and Fungal Coinfection in Individuals With Coronavirus: A Rapid Review To Support COVID-19 Antimicrobial Prescribing. Clin Infect Dis (2020) 71:2459–68. doi: 10.1093/cid/ciaa530
31. Bengoechea JA, Bamford CG. SARS-CoV-2, Bacterial Co-Infections, and AMR: The Deadly Trio in COVID-19? EMBO Mol Med (2020) 12:e12560. doi: 10.15252/emmm.202012560
32. Bartlett JG, Mundy LM. Community-Acquired Pneumonia. N Engl J Med. (1995) 333(24):1618–24. doi: 10.1056/NEJM199512143332408
33. Ruiz-Gonzalez A, Falguera M, Nogues A, Rubio-Caballero M. Is Streptococcus Pneumoniae the Leading Cause of Pneumonia of Unknown Etiology? A Microbiologic Study of Lung Aspirates in Consecutive Patients With Community-Acquired Pneumonia. Am J Med (1999) 106:385–90. doi: 10.1016/s0002-9343(99)00050-9
34. Bartlett JG, Dowell SF, Mandell LA, File Jr. TM, Musher DM, Fine MJ. Practice Guidelines for the Management of Community-Acquired Pneumonia in Adults. Infectious Diseases Society of America. Clin Infect Dis (2000) 31:347–82. doi: 10.1086/313954
35. Brundage JF. Interactions Between Influenza and Bacterial Respiratory Pathogens: Implications for Pandemic Preparedness. Lancet Infect Dis (2006) 6:303–12. doi: 10.1016/S1473-3099(06)70466-2
36. McCullers JA. The Co-Pathogenesis of Influenza Viruses With Bacteria in the Lung. Nat Rev Microbiol (2014) 12:252–62. doi: 10.1038/nrmicro3231
37. Morris DE, Cleary DW, Clarke SC. Secondary Bacterial Infections Associated With Influenza Pandemics. Front Microbiol (2017) 8:1041. doi: 10.3389/fmicb.2017.01041
38. Cawcutt K, Kalil AC. Pneumonia With Bacterial and Viral Coinfection. Curr Opin Crit Care (2017) 23:385–90. doi: 10.1097/MCC.0000000000000435
39. Smith AM, McCullers JA. Secondary Bacterial Infections in Influenza Virus Infection Pathogenesis. In: Compans R, Oldstone M (eds) Influenza Pathogenesis and Control - Volume I. Current Topics in Microbiology and Immunology, vol 385. Cham: Springer (2014). doi: 10.1007/82_2014_394
40. Short KR, Habets MN, Hermans PWM, Diavatopoulos DA. Interactions Between Streptococcus Pneumoniae and Influenza Virus: A Mutually Beneficial Relationship? Future Microbiol (2012) 7:609–24. doi: 10.2217/fmb.12.29
41. Metzger DW, Sun K. Immune Dysfunction and Bacterial Coinfections Following Influenza. J Immunol (2013) 191:2047–52. doi: 10.4049/jimmunol.1301152
42. Smith AM. Host-Pathogen Kinetics During Influenza Infection and Coinfection: Insights From Predictive Modeling. Immunol Rev (2018) 285:97–112. doi: 10.1111/imr.12692
43. Weinberger DM, Simonsen L, Jordan R, Steiner C, Miller M, Viboud C. Impact of the 2009 Influenza Pandemic on Pneumococcal Pneumonia Hospitalizations in the United States. J Infect Dis (2012) 205:458–65. doi: 10.1093/infdis/jir749
44. Robinson KM, Kolls JK, Alcorn JF. The Immunology of Influenza Virus-Associated Bacterial Pneumonia. Curr Opin Immunol (2015) 34:59–67. doi: 10.1016/j.coi.2015.02.002
45. Rynda-Apple A, Robinson KM, Alcorn JF. Influenza and Bacterial Superinfection: Illuminating the Immunologic Mechanisms of Disease. Infect Immun (2015) 83:3764–70. doi: 10.1128/IAI.00298-15
46. Bellinghausen C, Rohde GGU, Savelkoul PHM, Wouters EFM, Stassen FRM. Viral-Bacterial Interactions in the Respiratory Tract. J Gen Virol (2016) 97:3089–102. doi: 10.1099/jgv.0.000627
47. Chien Y-W, Klugman KP, Morens DM. Bacterial Pathogens and Death During the 1918 Influenza Pandemic. N Engl J Med (2009) 361:2582–3. doi: 10.1056/NEJMc0908216
48. MacIntyre CR, Chughtai AA, Barnes M, Ridda I, Seale H, Toms R, et al. The Role of Pneumonia and Secondary Bacterial Infection in Fatal and Serious Outcomes of Pandemic Influenza a(H1N1)Pdm09. BMC Infect Dis (2018) 18:637. doi: 10.1186/s12879-018-3548-0
49. Gill JR, Sheng Z, Ely SF, Guinee DG, Beasley MB, Suh J, et al. Pulmonary Pathologic Findings of Fatal 2009 Pandemic Influenza A/H1N1 Viral Infections. Arch Pathol Lab Med (2010) 134:235–43. doi: 10.1043/1543-2165-134.2.235
50. Morens, David M, Taubenberger, Jeffery K, Fauci AS. Predominant Role of Bacterial Pneumonia as a Cause of Death in Pandemic Influenza: Implications for Pandemic Influenza Preparedness. J Infect Dis (2008) 198:962–70. doi: 10.1086/591708
51. Petersen E, Koopmans M, Go U, Hamer DH, Petrosillo N, Castelli F, et al. Comparing SARS-CoV-2 With SARS-CoV and Influenza Pandemics. Lancet Infect Dis (2020) 20:e238–44. doi: 10.1016/S1473-3099(20)30484-9
52. Abdelrahman Z, Li M, Wang X. Comparative Review of SARS-CoV-2, SARS-CoV, MERS-CoV, and Influenza A Respiratory Viruses. Front Immunol (2020) 11:552909. doi: 10.3389/fimmu.2020.552909
53. Simmonds P, Williams S, Harvala H. Understanding the Outcomes of COVID-19 - Does the Current Model of an Acute Respiratory Infection Really Fit? J Gen Virol (2021) 102(3):001545. doi: 10.1099/jgv.0.001545
54. Flerlage T, Boyd DF, Meliopoulos V, Thomas PG, Schultz-Cherry S. Influenza Virus and SARS-CoV-2: Pathogenesis and Host Responses in the Respiratory Tract. Nat Rev Microbiol (2021) 19:425–41. doi: 10.1038/s41579-021-00542-7
55. Smith AP, Lane LC, Ramirez Zuniga I, Moquin D, Vogel P, Smith AM. Increased Virus Dissemination Leads to Enhanced Lung Injury But Not Inflammation During Influenza-Associated Secondary Bacterial Infection.
56. Myers MA, Smith AP, Lane LC, Moquin DJ, Aogo R, Woolard S, et al. Dynamically Linking Influenza Virus Infection Kinetics, Lung Injury, Inflammation, and Disease Severity. Elife (2021) 10:e68864. doi: 10.7554/eLife.68864
57. Granados A, Peci A, McGeer A, Gubbay JB. Influenza and Rhinovirus Viral Load and Disease Severity in Upper Respiratory Tract Infections. J Clin Virol (2017) 86:14–9. doi: 10.1016/j.jcv.2016.11.008
58. Oshansky CM, Gartland AJ, Wong SS, Jeevan T, Wang D, Roddam PL, et al. Mucosal Immune Responses Predict Clinical Outcomes During Influenza Infection Independently of Age and Viral Load. Am J Respir Crit Care Med (2014) 189:449–62. doi: 10.1164/rccm.201309-1616OC
59. Lee CK, Lee HK, Loh TP, Lai FY, Tambyah PA, Chiu L, et al. Comparison of Pandemic (H1N1) 2009 and Seasonal Influenza Viral Loads, Singapore. Emerg Infect Dis (2011) 17:287–91. doi: 10.3201/eid1702.100282
60. Abdulrahman A, Mallah SI, Alqahtani M. COVID-19 Viral Load Not Associated With Disease Severity: Findings From a Retrospective Cohort Study. BMC Infect Dis (2021) 21:688. doi: 10.1186/s12879-021-06376-1
61. Cocconcelli E, Castelli G, Onelia F, Lavezzo E, Giraudo C, Bernardinello N, et al. Disease Severity and Prognosis of SARS-CoV-2 Infection in Hospitalized Patients Is Not Associated With Viral Load in Nasopharyngeal Swab. Front Med (Lausanne) (2021) 8:714221. doi: 10.3389/fmed.2021.714221
62. Mudd PA, Crawford JC, Turner JS, Souquette A, Reynolds D, Bender D, et al. Distinct Inflammatory Profiles Distinguish COVID-19 From Influenza With Limited Contributions From Cytokine Storm. Sci Adv (2020) 6(50):eabe3024. doi: 10.1126/sciadv.abe3024
63. Paget C, Trottein F. COVID-19 and Flu: Conserved or Specific Immune Signature? Cell Mol Immunol (2021) 18:245–6. doi: 10.1038/s41423-020-00595-3
64. Zhu L, Yang P, Zhao Y, Zhuang Z, Wang Z, Song R, et al. Single-Cell Sequencing of Peripheral Mononuclear Cells Reveals Distinct Immune Response Landscapes of COVID-19 and Influenza Patients. Immunity (2020) 53:685–696 e683. doi: 10.1016/j.immuni.2020.07.009
65. Lee JS, Park S, Jeong HW, Ahn JY, Choi SJ, Lee H, et al. Immunophenotyping of COVID-19 and Influenza Highlights the Role of Type I Interferons in Development of Severe COVID-19. Sci Immunol (2020) 5(49):eabd1554. doi: 10.1126/sciimmunol.abd1554
66. Galani IE, Rovina N, Lampropoulou V, Triantafyllia V, Manioudaki M, Pavlos E, et al. Untuned Antiviral Immunity in COVID-19 Revealed by Temporal Type I/III Interferon Patterns and Flu Comparison. Nat Immunol (2021) 22:32–40. doi: 10.1038/s41590-020-00840-x
67. Ghoneim HE, Thomas PG, McCullers JA. Depletion of Alveolar Macrophages During Influenza Infection Facilitates Bacterial Superinfections. J Immunol (2013) 191:1250–9. doi: 10.4049/jimmunol.1300014
68. Smith AM, Adler FR, Ribeiro RM, Gutenkunst RN, McAuley JL, McCullers JA, et al. Kinetics of Coinfection With Influenza A Virus and Streptococcus Pneumoniae. PloS Pathog (2013) 9:e1003238. doi: 10.1371/journal.ppat.1003238
69. Smith AM, Smith AP. A Critical, Nonlinear Threshold Dictates Bacterial Invasion and Initial Kinetics During Influenza. Sci Rep (2016) 6(1):38703. doi: 10.1038/srep38703
70. Califano D, Furuya Y, Metzger DW. Effects of Influenza on Alveolar Macrophage Viability Are Dependent on Mouse Genetic Strain. J Immunol (2018) 201:134–44. doi: 10.4049/jimmunol.1701406
71. Shahangian A, Chow EK, Tian X, Kang JR, Ghaffari A, Liu SY, et al. Type I IFNs Mediate Development of Postinfluenza Bacterial Pneumonia in Mice. J Clin Invest (2009) 119:1910–20. doi: 10.1172/JCI35412
72. McNamee LA, Harmsen AG. Both Influenza-Induced Neutrophil Dysfunction and Neutrophil-Independent Mechanisms Contribute to Increased Susceptibility to a Secondary Streptococcus Pneumoniae Infection. Infect Immun (2006) 74:6707–21. doi: 10.1128/IAI.00789-06
73. Knoll R, Schultze JL, Schulte-Schrepping J. Monocytes and Macrophages in COVID-19. Front Immunol (2021) 12:720109. doi: 10.3389/fimmu.2021.720109
74. Reusch N, De Domenico E, Bonaguro L, Schulte-Schrepping J, Baßler K, Schultze JL, et al. Neutrophils in COVID-19. Front Immunol (2021) 12:652470. doi: 10.3389/fimmu.2021.652470
75. Schulte-Schrepping J, Reusch N, Paclik D, Baßler K, Schlickeiser S, Zhang B, et al. Severe COVID-19 Is Marked by a Dysregulated Myeloid Cell Compartment. Cell (2020) 182:1419–1440 e1423. doi: 10.1016/j.cell.2020.08.001
76. Ami Y, Nagata N, Shirato K, Watanabe R, Iwata N, Nakagaki K, et al. Co-Infection of Respiratory Bacterium With Severe Acute Respiratory Syndrome Coronavirus Induces an Exacerbated Pneumonia in Mice. Microbiol Immunol (2008) 52:118–27. doi: 10.1111/j.1348-0421.2008.00011.x
77. McCullers JA, Rehg JE. Lethal Synergism Between Influenza Virus and Streptococcus Pneumoniae: Characterization of a Mouse Model and the Role of Platelet-Activating Factor Receptor. J Infect Dis (2002) 186:341–50. doi: 10.1086/341462
78. Abramson JS, Lewis JC, Lyles DS, Heller KA, Mills EL, Bass DA, et al. Inhibition of Neutrophil Lysosome-Phagosome Fusion Associated With Influenza Virus Infection In Vitro. Role in Depressed Bactericidal Activity. J Clin Invest (1982) 69:1393–7. doi: 10.1172/JCI110580
79. Abramson JS, Wheeler JG. Virus-Induced Neutrophil Dysfunction: Role in the Pathogenesis of Bacterial Infections. Pediatr Infect Dis J (1994) 13:643–52. doi: 10.1097/00006454-199407000-00012
80. Colamussi ML, White MR, Crouch E, Hartshorn KL. Influenza A Virus Accelerates Neutrophil Apoptosis and Markedly Potentiates Apoptotic Effects of Bacteria. Blood (1999) 93:2395–403. doi: 10.1182/blood.V93.7.2395
81. Engelich G, White M, Hartshorn KL. Neutrophil Survival Is Markedly Reduced by Incubation With Influenza Virus and Streptococcus Pneumoniae: Role of Respiratory Burst. J Leukoc Biol (2001) 69:50–6. doi: 10.1189/jlb.69.1.50
82. Smith AP, Lane LC, van Opijnen T, Woolard S, Carter R, Iverson A, et al. Dynamic Pneumococcal Genetic Adaptations Support Bacterial Growth and Inflammation During Coinfection With Influenza. Infect Immun (2021) 89:e0002321. doi: 10.1128/IAI.00023-21
83. Shepardson KM, Larson K, Morton RV, Prigge JR, Schmidt EE, Huber VC, et al. Differential Type I Interferon Signaling Is a Master Regulator of Susceptibility to Postinfluenza Bacterial Superinfection. MBio (2016) 7(3):e00506-16. doi: 10.1128/mBio.00506-16
84. McCullers JA. Insights Into the Interaction Between Influenza Virus and Pneumococcus. Clin Microbiol Rev (2006) 19:571–82. doi: 10.1128/CMR.00058-05
85. Kash JC, Taubenberger JK. The Role of Viral, Host, and Secondary Bacterial Factors in Influenza Pathogenesis. Am J Pathol (2015) 185:1528–36. doi: 10.1016/j.ajpath.2014.08.030
86. Chu H, Chan JF, Wang Y, Yuen TT, Chai Y, Hou Y, et al. Comparative Replication and Immune Activation Profiles of SARS-CoV-2 and SARS-CoV in Human Lungs: An Ex Vivo Study With Implications for the Pathogenesis of COVID-19. Clin Infect Dis (2020) 71:1400–9. doi: 10.1093/cid/ciaa410
87. Lv J, Wang Z, Qu Y, Zhu H, Zhu Q, Tong W, et al. Distinct Uptake, Amplification, and Release of SARS-CoV-2 by M1 and M2 Alveolar Macrophages. Cell Discov (2021) 7:24. doi: 10.1038/s41421-021-00258-1
88. Dalskov L, Møhlenberg M, Thyrsted J, Blay-Cadanet J, Poulsen ET, Folkersen BH, et al. SARS-CoV-2 Evades Immune Detection in Alveolar Macrophages. EMBO Rep (2020) 21:e51252. doi: 10.15252/embr.202051252
89. Grant RA, Morales-Nebreda L, Markov NS, Swaminathan S, Querrey M, Guzman ER, et al. Circuits Between Infected Macrophages and T Cells in SARS-CoV-2 Pneumonia. Nature (2021) 590:635–41. doi: 10.1038/s41586-020-03148-w
90. Taefehshokr N, Taefehshokr S, Hemmat N, Heit B. Covid-19: Perspectives on Innate Immune Evasion. Front Immunol (2020) 11:580641. doi: 10.3389/fimmu.2020.580641
91. Beyer DK, Forero A. Mechanisms of Antiviral Immune Evasion of SARS-CoV-2. J Mol Biol (2021) 167265. doi: 10.1016/j.jmb.2021.167265
92. Lazarevic I, Pravica V, Miljanovic D, Cupic M. Immune Evasion of SARS-CoV-2 Emerging Variants: What Have We Learnt So Far? Viruses (2021) 13(7):1192. doi: 10.3390/v13071192
93. Sette A, Crotty S. Adaptive Immunity to SARS-CoV-2 and COVID-19. Cell (2021) 184:861–80. doi: 10.1016/j.cell.2021.01.007
94. Schmolke M, Garcia-Sastre A. Evasion of Innate and Adaptive Immune Responses by Influenza A Virus. Cell Microbiol (2010) 12:873–80. doi: 10.1111/j.1462-5822.2010.01475.x
95. Kikkert M. Innate Immune Evasion by Human Respiratory RNA Viruses. J Innate Immun (2020) 12:4–20. doi: 10.1159/000503030
96. Blevins LK, Wren JT, Holbrook BC, Hayward SL, Swords WE, Parks GD, et al. Coinfection With Streptococcus Pneumoniae Negatively Modulates the Size and Composition of the Ongoing Influenza-Specific CD8 + T Cell Response. J Immunol (2014) 193:5076–87. doi: 10.4049/jimmunol.1400529
97. Rowe HM, Meliopoulos VA, Iverson A, Bomme P, Schultz-Cherry S, Rosch JW. Direct Interactions With Influenza Promote Bacterial Adherence During Respiratory Infections. Nat Microbiol (2019) 4:1328–36. doi: 10.1038/s41564-019-0447-0
98. Warnking K, Klemm C, Löffler B, Niemann S, van Krüchten A, Peters G, et al. Super-Infection With S Taphylococcus Aureus Inhibits Influenza Virus-Induced Type I IFN Signalling Through Impaired STAT1-STAT2 Dimerization: Influenza Virus- and S. Aureus -Mediated Signalling. Cell Microbiol (2015) 17:303–17. doi: 10.1111/cmi.12375
99. Mathew D, Giles JR, Baxter AE, Oldridge DA, Greenplate AR, Wu JE, et al. Deep Immune Profiling of COVID-19 Patients Reveals Distinct Immunotypes With Therapeutic Implications. Science (2020) 369:1210. doi: 10.1126/science.abc8511
100. Song JW, Zhang C, Fan X, Meng P, Xu Z, Xia P, et al. Immunological and Inflammatory Profiles in Mild and Severe Cases of COVID-19. Nat Commun (2020) 11:3410. doi: 10.1038/s41467-020-17240-2
101. Kuri-Cervantes L, Pampena MB, Meng W, Rosenfeld AM, Ittner CAG, Weisman AR, et al. Comprehensive Mapping of Immune Perturbations Associated With Severe COVID-19. Sci Immunol (2020) 5:eabd7114. doi: 10.1126/sciimmunol.abd7114
102. Zheng HY, Zhang M, Yang CX, Zhang N, Wang XC, Yang XP, et al. Elevated Exhaustion Levels and Reduced Functional Diversity of T Cells in Peripheral Blood May Predict Severe Progression in COVID-19 Patients. Cell Mol Immunol (2020) 17:541–3. doi: 10.1038/s41423-020-0401-3
103. Diao B, Wang C, Tan Y, Chen X, Liu Y, Ning L, et al. Reduction and Functional Exhaustion of T Cells in Patients With Coronavirus Disease 2019 (COVID-19). Front Immunol (2020) 11:827. doi: 10.3389/fimmu.2020.00827
104. Brueggemann AB, Jansen van Rensburg MJ, Shaw D, McCarthy ND, Jolley KA, Maiden MCJ, et al. Changes in the Incidence of Invasive Disease Due to Streptococcus Pneumoniae, Haemophilus Influenzae, and Neisseria Meningitidis During the COVID-19 Pandemic in 26 Countries and Territories in the Invasive Respiratory Infection Surveillance Initiative: A Prospective Analysis of Surveillance Data. Lancet Digit Health (2021) 3:e360–70. doi: 10.1016/S2589-7500(21)00077-7
105. Huh K, Kim Y, Ji W, Kim DW, Lee E, Kim J, et al. Decrease in Hospital Admissions for Respiratory Diseases During the COVID-19 Pandemic: A Nationwide Claims Study. Thorax (2021) 76:939–41. doi: 10.1136/thoraxjnl-2020-216526
106. Rodgers L, Sheppard M, Smith A, Dietz S, Jayanthi P, Yuan Y, Bull L, et al. Changes in Seasonal Respiratory Illnesses in the United States During the Coronavirus Disease 2019 (COVID-19) Pandemic. Clin Infect Dis (2021) 73:S110–7. doi: 10.1093/cid/ciab311
107. Olsen SJ, Winn AK, Budd AP, Prill MM, Steel J, Midgley CM, et al. Changes in Influenza and Other Respiratory Virus Activity During the COVID-19 Pandemic-United States, 2020-2021. Am J Transplant (2021) 21:3481–6. doi: 10.1111/ajt.16049
108. Huang QS, Wood T, Jelley L, Jennings T, Jefferies S, Daniells K, et al. Impact of the COVID-19 Nonpharmaceutical Interventions on Influenza and Other Respiratory Viral Infections in New Zealand. Nat Commun (2021) 12:1001. doi: 10.1038/s41467-021-21157-9
109. Antonelli M, Penfold R, Merino J, Sudre C, Molteni E, Berry S, et al. Risk Factors and Disease Profile of Post-Vaccination SARS-CoV-2 Infection in UK Users of the COVID Symptom Study App: A Prospective, Community-Based, Nested, Case-Control Study. Lancet Infect Dis (2021) 22(1):43–55. doi: 10.1016/S1473-3099(21)00460-6
110. Tenforde MW, Self WH, Adams K, Gaglani M, Ginde AA, McNeal T, et al. Association Between mRNA Vaccination and COVID-19 Hospitalization and Disease Severity. JAMA (2021) 326(20):2043–54. doi: 10.1001/jama.2021.19499
111. National Center for Immunization and Respiratory Diseases (NCIRD), D. o. V. D. The Possibility of COVID-19 After Vaccination: Breakthrough Infections (2021). Available at: https://www.cdc.gov/coronavirus/2019-ncov/vaccines/effectiveness/why-measure-effectiveness/breakthrough-cases.html.
112. Hament JM, Kimpen JL, Fleer A, Wolfs TF. Respiratory Viral Infection Predisposing for Bacterial Disease: A Concise Review. FEMS Immunol Med Microbiol (1999) 26:189–95. doi: 10.1111/j.1574-695X.1999.tb01389.x
113. Karlström Å, Heston SM, Boyd KL, Tuomanen EI, McCullers JA. Toll-Like Receptor 2 Mediates Fatal Immunopathology in Mice During Treatment of Secondary Pneumococcal Pneumonia Following Influenza. J Infect Dis (2011) 204:1358–66. doi: 10.1093/infdis/jir522
114. LeVine AM, Koeningsknecht V, Stark JM. Decreased Pulmonary Clearance of S. Pneumoniae Following Influenza A Infection in Mice. J Virol Methods (2001) 94:173–86. doi: 10.1016/S0166-0934(01)00287-7
115. Verma AK, Bansal S, Bauer C, Muralidharan A, Sun K. Influenza Infection Induces Alveolar Macrophage Dysfunction and Thereby Enables Noninvasive Streptococcus Pneumoniae to Cause Deadly Pneumonia. J Immunol (2020) 205:1601–7. doi: 10.4049/jimmunol.2000094
116. Hang do TT, Choi EJ, Song JY, Kim SE, Kwak J, Shin YK, et al. Differential Effect of Prior Influenza Infection on Alveolar Macrophage Phagocytosis of Staphylococcus Aureus and Escherichia Coli: Involvement of Interferon-Gamma Production. Microbiol Immunol (2011) 55:751–9. doi: 10.1111/j.1348-0421.2011.00383.x
117. Shibata T, Makino A, Ogata R, Nakamura S, Ito T, Nagata K, et al. Respiratory Syncytial Virus Infection Exacerbates Pneumococcal Pneumonia via Gas6/Axl-Mediated Macrophage Polarization. J Clin Invest (2020) 130:3021–37. doi: 10.1172/JCI125505
118. McCullers JA, Bartmess KC. Role of Neuraminidase in Lethal Synergism Between Influenza Virus and Streptococcus Pneumoniae. J Infect Dis (2003) 187:1000–9. doi: 10.1086/368163
119. Plotkowski MC, Puchelle E, Beck G, Jacquot J, Hannoun C. Adherence of Type I Streptococcus Pneumoniae to Tracheal Epithelium of Mice Infected With Influenza A/PR8 Virus. Am Rev Respir Dis (1986) 134:1040–4. doi: 10.1164/arrd.1986.134.5.1040
120. Avadhanula V, Rodriguez CA, Devincenzo P, Wang Y, Webby RJ, Ulett GC, et al. Respiratory Viruses Augment the Adhesion of Bacterial Pathogens to Respiratory Epithelium in a Viral Species- and Cell Type-Dependent Manner. J Virol (2006) 80:1629–36. doi: 10.1128/JVI.80.4.1629-1636.2006
121. Stark JM, Stark MA, Colasurdo GN, LeVine AM. Decreased Bacterial Clearance From the Lungs of Mice Following Primary Respiratory Syncytial Virus Infection. J Med Virol (2006) 78:829–38. doi: 10.1002/jmv.20631
122. Rezaee F, DeSando SA, Ivanov AI, Chapman TJ, Knowlden SA, Beck LA, et al. Sustained Protein Kinase D Activation Mediates Respiratory Syncytial Virus-Induced Airway Barrier Disruption. J Virol (2013) 87:11088–95. doi: 10.1128/JVI.01573-13
123. Ruan T, Sun J, Liu W, Prinz RA, Peng D, Liu X, Xu X, et al. H1N1 Influenza Virus Cross-Activates Gli1 to Disrupt the Intercellular Junctions of Alveolar Epithelial Cells. Cell Rep (2020) 31:107801. doi: 10.1016/j.celrep.2020.107801
124. Shepley-McTaggart A, Sagum CA, Oliva I, Rybakovsky E, DiGuilio K, Liang J, et al. SARS-CoV-2 Envelope (E) Protein Interacts With PDZ-Domain-2 of Host Tight Junction Protein ZO1. PloS One (2021) 16:e0251955. doi: 10.1371/journal.pone.0251955
125. De Maio F, Lo Cascio E, Babini G, Sali M, Della Longa S, Tilocca B, et al. Improved Binding of SARS-CoV-2 Envelope Protein to Tight Junction-Associated PALS1 Could Play a Key Role in COVID-19 Pathogenesis. Microbes Infect (2020) 22:592–7. doi: 10.1016/j.micinf.2020.08.006
126. Teoh KT, Siu YL, Chan WL, Schlüter MA, Liu CJ, Peiris JS, et al. The SARS Coronavirus E Protein Interacts With PALS1 and Alters Tight Junction Formation and Epithelial Morphogenesis. Mol Biol Cell (2010) 21:3838–52. doi: 10.1091/mbc.E10-04-0338
127. Nakamura S, Davis KM, Weiser JN. Synergistic Stimulation of Type I Interferons During Influenza Virus Coinfection Promotes Streptococcus Pneumoniae Colonization in Mice. J Clin Invest (2011) 121:3657–65. doi: 10.1172/JCI57762
128. Channappanavar R, Fehr AR, Vijay R, Mack M, Zhao J, Meyerholz DK, et al. Dysregulated Type I Interferon and Inflammatory Monocyte-Macrophage Responses Cause Lethal Pneumonia in SARS-CoV-Infected Mice. Cell Host Microbe (2016) 19:181–93. doi: 10.1016/j.chom.2016.01.007
129. Zhou Z, Ren L, Zhang L, Zhong J, Xiao Y, Jia Z, et al. Heightened Innate Immune Responses in the Respiratory Tract of COVID-19 Patients. Cell Host Microbe (2020) 27:883–890 e882. doi: 10.1016/j.chom.2020.04.017
130. Blanco-Melo D, Nilsson-Payant BE, Liu WC, Uhl S, Hoagland D, Møller R, et al. Imbalanced Host Response to SARS-CoV-2 Drives Development of COVID-19. Cell (2020) 181:1036–1045 e1039. doi: 10.1016/j.cell.2020.04.026
131. Weeks-Gorospe JN, Hurtig HR, Iverson AR, Schuneman MJ, Webby RJ, McCullers JA, et al. Naturally Occurring Swine Influenza A Virus PB1-F2 Phenotypes That Contribute to Superinfection With Gram-Positive Respiratory Pathogens. J Virol (2012) 86:9035–43. doi: 10.1128/JVI.00369-12
132. Iverson AR, Boyd KL, McAuley JL, Plano LR, Hart ME, McCullers JA, et al. Influenza Virus Primes Mice for Pneumonia From Staphylococcus Aureus. J Infect Dis (2011) 203:880–8. doi: 10.1093/infdis/jiq113
133. Tashiro M, Ciborowski P, Klenk HD, Pulverer G, Rott R. Role of Staphylococcus Protease in the Development of Influenza Pneumonia. Nature (1987) 325:536–7. doi: 10.1038/325536a0
134. Hament JM, Aerts PC, Fleer A, van Dijk H, Harmsen T, Kimpen JL, et al. Direct Binding of Respiratory Syncytial Virus to Pneumococci: A Phenomenon That Enhances Both Pneumococcal Adherence to Human Epithelial Cells and Pneumococcal Invasiveness in a Murine Model. Pediatr Res (2005) 58:1198–203. doi: 10.1203/01.pdr.0000188699.55279.1b
135. Weiser JN, Ferreira DM, Paton JC. Streptococcus Pneumoniae: Transmission, Colonization and Invasion. Nat Rev Microbiol (2018) 16:355–67. doi: 10.1038/s41579-018-0001-8
136. Hoffmann J, Machado D, Terrier O, Pouzol S, Messaoudi M, Basualdo W, et al. Viral and Bacterial Co-Infection in Severe Pneumonia Triggers Innate Immune Responses and Specifically Enhances IP-10: A Translational Study. Sci Rep (2016) 6:38532. doi: 10.1038/srep38532
137. Machado D, Hoffmann J, Moroso M, Rosa-Calatrava M, Endtz H, Terrier O, et al. RSV Infection in Human Macrophages Promotes CXCL10/IP-10 Expression During Bacterial Co-Infection. Int J Mol Sci (2017) 18:2654. doi: 10.3390/ijms18122654
138. Taghavi S, Jackson-Weaver O, Abdullah S, Wanek A, Drury R, Packer J, et al. Interleukin-22 Mitigates Acute Respiratory Distress Syndrome (ARDS). PloS One (2021) 16:e0254985. doi: 10.1371/journal.pone.0254985
139. Xu F, Liu Q, Lin S, Shen N, Yin Y, Cao J, et al. IL-27 Is Elevated in Acute Lung Injury and Mediates Inflammation. J Clin Immunol (2013) 33:1257–68. doi: 10.1007/s10875-013-9923-0
140. Pociask DA, Scheller EV, Mandalapu S, McHugh KJ, Enelow RI, Fattman CL, et al. IL-22 is Essential for Lung Epithelial Repair Following Influenza Infection. Am J Pathol (2013) 182:1286–96. doi: 10.1016/j.ajpath.2012.12.007
141. Liu FD, Kenngott EE, Schröter MF, Kühl A, Jennrich S, Watzlawick R, et al. Timed Action of IL-27 Protects From Immunopathology While Preserving Defense in Influenza. PloS Pathog (2014) 10:e1004110. doi: 10.1371/journal.ppat.1004110
142. Ivanov S, Renneson J, Fontaine J, Barthelemy A, Paget C, Fernandez EM, et al. Interleukin-22 Reduces Lung Inflammation During Influenza A Virus Infection and Protects Against Secondary Bacterial Infection. J Virol (2013) 87:6911–24. doi: 10.1128/JVI.02943-12
143. Barthelemy A, Sencio V, Soulard D, Deruyter L, Faveeuw C, Le Goffic R, et al. Interleukin-22 Immunotherapy During Severe Influenza Enhances Lung Tissue Integrity and Reduces Secondary Bacterial Systemic Invasion. Infect Immun (2018) 86:e00706-17. doi: 10.1128/IAI.00706-17
144. Weitnauer M, Mijosek V, Dalpke AH. Control of Local Immunity by Airway Epithelial Cells. Mucosal Immunol (2016) 9:287–98. doi: 10.1038/mi.2015.126
145. Atamas SP, Chapoval SP, Keegan AD. Cytokines in Chronic Respiratory Diseases. F1000 Biol Rep (2013) 5:3. doi: 10.3410/B5-3
146. Gieseck RL 3rd, Wilson MS, Wynn TA. Type 2 Immunity in Tissue Repair and Fibrosis. Nat Rev Immunol (2018) 18:62–76. doi: 10.1038/nri.2017.90
147. Fulkerson PC, Fischetti CA, Hassman LM, Nikolaidis NM, Rothenberg ME. Persistent Effects Induced by IL-13 in the Lung. Am J Respir Cell Mol Biol (2006) 35:337–46. doi: 10.1165/rcmb.2005-0474OC
148. Marone G, Granata F, Pucino V, Pecoraro A, Heffler E, Loffredo S, et al. The Intriguing Role of Interleukin 13 in the Pathophysiology of Asthma. Front Pharmacol (2019) 10:1387. doi: 10.3389/fphar.2019.01387
149. Smith AM, Huber VC. The Unexpected Impact of Vaccines on Secondary Bacterial Infections Following Influenza. Viral Immunol (2018) 31:159–73. doi: 10.1089/vim.2017.0138
150. Haas EJ, Angulo FJ, McLaughlin JM, Anis E, Singer SR, Khan F, et al. Impact and Effectiveness of mRNA BNT162b2 Vaccine Against SARS-CoV-2 Infections and COVID-19 Cases, Hospitalisations, and Deaths Following a Nationwide Vaccination Campaign in Israel: An Observational Study Using National Surveillance Data. Lancet (2021) 397:1819–29. doi: 10.1016/S0140-6736(21)00947-8
151. Polack FP, Thomas SJ, Kitchin N, Absalon J, Gurtman A, Lockhart S, et al. Safety and Efficacy of the BNT162b2 mRNA Covid-19 Vaccine. N Engl J Med (2020) 383:2603–15. doi: 10.1056/NEJMoa2034577
152. Dagan N, Barda N, Kepten E, Miron O, Perchik S, Katz MA, et al. BNT162b2 mRNA Covid-19 Vaccine in a Nationwide Mass Vaccination Setting. N Engl J Med (2021) 384:1412–23. doi: 10.1056/NEJMoa2101765
153. Baden LR, El Sahly HM, Essink B, Kotloff K, Frey S, Novak R, et al. Efficacy and Safety of the mRNA-1273 SARS-CoV-2 Vaccine. N Engl J Med (2021) 384:403–16. doi: 10.1056/NEJMoa2035389
154. Bergwerk M, Gonen T, Lustig Y, Amit S, Lipsitch M, Cohen C, et al. Covid-19 Breakthrough Infections in Vaccinated Health Care Workers. N Engl J Med (2021) 385:1474–84. doi: 10.1056/NEJMoa2109072
155. Lipsitch M, Krammer F, Regev-Yochay G, Lustig Y, Balicer RD. SARS-CoV-2 Breakthrough Infections in Vaccinated Individuals: Measurement, Causes and Impact. Nat Rev Immunol (2022) 22:57–65. doi: 10.1038/s41577-021-00662-4
156. Brown C, Vostok J, Johnson H, Burns M, Gharpure R, Sami S, et al. Outbreak of SARS-CoV-2 Infections, Including COVID-19 Vaccine Breakthrough Infections, Associated With Large Public Gatherings - Barnstable County, Massachusetts, July 2021. MMWR Morb Mortal Wkly Rep (2021) 70:1059–62. doi: 10.15585/mmwr.mm7031e2
157. Hacisuleyman E, Hale C, Saito Y, Blachere NE, Bergh M, Conlon EG, et al. Vaccine Breakthrough Infections With SARS-CoV-2 Variants. N Engl J Med (2021) 384:2212–8. doi: 10.1056/NEJMoa2105000
158. McCray Jr PB, Pewe L, Wohlford-Lenane C, Hickey M, Manzel L, Shi L, et al. Lethal Infection of K18-Hace2 Mice Infected With Severe Acute Respiratory Syndrome Coronavirus. J Virol (2007) 81:813–21. doi: 10.1128/JVI.02012-06
Keywords: SARS-CoV-2, COVID-19, Streptococcus pnemoniae, pneumococcus, immune response, coinfection
Citation: Smith AP, Williams EP, Plunkett TR, Selvaraj M, Lane LC, Zalduondo L, Xue Y, Vogel P, Channappanavar R, Jonsson CB and Smith AM (2022) Time-Dependent Increase in Susceptibility and Severity of Secondary Bacterial Infections During SARS-CoV-2. Front. Immunol. 13:894534. doi: 10.3389/fimmu.2022.894534
Received: 11 March 2022; Accepted: 11 April 2022;
Published: 12 May 2022.
Edited by:
Penghua Wang, University of Connecticut Health Center, United StatesReviewed by:
Zhanbo Zhu, Heilongjiang Bayi Agricultural University, ChinaErez Bar-Haim, Israel Institute for Biological Research (IIBR), Israel
Copyright © 2022 Smith, Williams, Plunkett, Selvaraj, Lane, Zalduondo, Xue, Vogel, Channappanavar, Jonsson and Smith. This is an open-access article distributed under the terms of the Creative Commons Attribution License (CC BY). The use, distribution or reproduction in other forums is permitted, provided the original author(s) and the copyright owner(s) are credited and that the original publication in this journal is cited, in accordance with accepted academic practice. No use, distribution or reproduction is permitted which does not comply with these terms.
*Correspondence: Amber M. Smith, YW1iZXIuc21pdGhAdXRoc2MuZWR1; Colleen B. Jonsson, Y2pvbnNzb25AdXRoc2MuZWR1
†Present address: Muneeswaran Selvarajc, Department of Veterinary Pathobiology, Oklahoma State University, Stillwater, OK, United States
Rudragouda Channappanavar, Department of Veterinary Pathobiology, Oklahoma State University, Stillwater, OK, United States