
95% of researchers rate our articles as excellent or good
Learn more about the work of our research integrity team to safeguard the quality of each article we publish.
Find out more
ORIGINAL RESEARCH article
Front. Immunol. , 07 July 2022
Sec. Viral Immunology
Volume 13 - 2022 | https://doi.org/10.3389/fimmu.2022.891816
This article is part of the Research Topic Definition of the Immune Parameters Related to COVID-19 Severity View all 45 articles
 Hamid Reza Ghasemi Basir1
 Mohammad Mahdi Majzoobi2
 Samaneh Ebrahimi3Mina Noroozbeygi3Seyed Hamid Hashemi2Fariba Keramat2Mojgan Mamani2Peyman Eini2Saeed Alizadeh4
 Ghasem Solgi3*
 Da Di5*
An important number of studies have been conducted on the potential association between human leukocyte antigen (HLA) genes and COVID-19 susceptibility and severity since the beginning of the pandemic. However, case–control and peptide-binding prediction methods tended to provide inconsistent conclusions on risk and protective HLA alleles, whereas some researchers suggested the importance of considering the overall capacity of an individual’s HLA Class I molecules to present SARS-CoV-2-derived peptides. To close the gap between these approaches, we explored the distributions of HLA-A, -B, -C, and -DRB1 1st-field alleles in 142 Iranian patients with COVID-19 and 143 ethnically matched healthy controls, and applied in silico predictions of bound viral peptides for each individual’s HLA molecules. Frequency comparison revealed the possible predisposing roles of HLA-A*03, B*35, and DRB1*16 alleles and the protective effect of HLA-A*32, B*58, B*55, and DRB1*14 alleles in the viral infection. None of these results remained significant after multiple testing corrections, except HLA-A*03, and no allele was associated with severity, either. Compared to peptide repertoires of individual HLA molecules that are more likely population-specific, the overall coverage of virus-derived peptides by one’s HLA Class I molecules seemed to be a more prominent factor associated with both COVID-19 susceptibility and severity, which was independent of affinity index and threshold chosen, especially for people under 60 years old. Our results highlight the effect of the binding capacity of different HLA Class I molecules as a whole, and the more essential role of HLA-A compared to HLA-B and -C genes in immune responses against SARS-CoV-2 infection.
The ongoing Coronavirus Disease 2019 (COVID-19) pandemic caused by severe acute respiratory syndrome coronavirus 2 (SARS‐CoV‐2) has caused global public health and economic disasters. By March of 2022, SARS‐CoV‐2 spread in more than 200 countries with over 270 million cases, leading to 5.9 million deaths (1). Currently, researchers are putting all their efforts to better understand this novel viral infectious disease, which varies in terms of geographical distribution, mortality, and severity of symptoms around the world (2). Older age, male sex, and comorbidities were identified as important risk factors of COVID-19 pathogenesis (3), and its outcome may also be shaped by both the genetic landscape of an individual and the population (4, 5).
The human leukocyte antigen (HLA) gene complex on the short arm of chromosome 6 contains the most polymorphic gene cluster of the human genome and plays a substantial role in induction of immune responses against pathogens. In the case of viral infections, classical HLA Class I (HLA-A, -B, and -C) molecules on the surfaces of infected cells present virus-derived peptides to CD8+ cytotoxic T lymphocytes, leading to their elimination by the latter, whereas classical HLA Class II (HLA-DR, HLA-DP, and HLA-DQ) molecules display such degradation products for stimulation of CD4+ helper T lymphocytes, generating production of neutralizing antibodies and inflammatory cytokines (6). Conformational variation of HLA molecules, especially in the peptide-binding cleft, affects more or less the binding repertoire of virus-derived peptides. It is thus unsurprising that a great number of HLA alleles and SNPs have been associated with viral infections (7, 8).
In this context, a large body of studies have already been accomplished on the potential association of HLA genes with COVID-19 since the outbreak of this pandemic (9). Based on their in silico predictions of HLA binding affinity to SARS-CoV-2 peptides, Nguyen et al. (10) compared the numbers of predicted bound peptides among HLA Class I molecules and argued that HLA-B*46:01 might be the most susceptible allele for SARS-CoV-2 infection, whereas B*15:03 might be the most protective one. However, among the dozens of case–control studies investigating potential HLA–COVID-19 association, few results have explicitly supported the prediction data. Through frequency comparisons between patients and controls, multiple HLA Class I and Class II alleles were reported as risk or protective factors in these studies, strongly depending on populations, and most results became insignificant after multiple testing corrections (11–16). In contrast, no significant association between HLA alleles and the disease was observed in studies focusing on South Asia, Brazil, Italy, Spain, and Germany (17–20). Likewise, using a large Ashkenazi sample, Ben Shachar et al. (21) did not find any significant association among 66 most common HLA-A, -B, -C, -DQB1, and -DRB1 alleles, and concluded that if any HLA association exists with the disease, it would be very weak.
At the population level, models on HLA evolution suggested that HLA homozygosity might be associated with poorer disease resistance (22). Thereby, de Marco et al. (17) noticed that homozygosity at HLA-A locus was associated with COVID-19 susceptibility but not severity, and Iturrieta-Zuazo et al. (23) observed a higher proportion of HLA-A and -C homozygotes in patients with severe COVID-19 than in those with the moderate form of the disease. For them, what matters might not be any particular HLA polymorphism, but rather the overall capacity of HLA molecules to bind SARS-CoV-2-derived peptides. Among HLA genes, La Porta and Zappeti (24) identified two sets of haplotypes with strong and weak predicted binding capacity. Shkurnikov et al. (15) further developed a principal component-based risk score to measure the aggregate capacity of HLA Class I molecules to present SARS-CoV-2 peptides for each individual, and showed a significantly higher score in the group of relatively younger deceased COVID-19 patients (≤60 years old) compared to elderly ones (>60 years old). However, a direct link between one’s overall repertoire of different HLA molecules and COVID-19 susceptibility and severity was yet to be established. It was also necessary to close the gap between case–control results and prediction data, as did Arora et al. (25) for HIV-1. Here, we explored the distributions of HLA Class I and Class II alleles and haplotypes in 285 Iranian patients with COVID-19 and healthy controls. In addition, to direct comparisons of allele and haplotype frequencies between patients and controls and between patient subgroups defined by disease severity, we paid more attention to the genetic diversity, and studied the overall viral peptide repertoire of individuals using predicted binding-affinity data.
This retrospective cohort study was conducted with the approval of the institutional Ethics Committee, Hamadan University of Medical Sciences (IR.UMSHA.REC.1399.005). Blood samples were collected from 142 COVID-19 patients who were admitted to Sina University Hospital of Hamadan in the northwestern part of Iran between July and August 2020. As controls, 143 ethnically matched healthy volunteers were recruited among blood donors during the same period and from the same geographic area. Among them, 135 were negative for IgG antibody (Quanti SARS-CoV-2 Anti-spike IgG antibody, Pishtazteb Co. Tehran, Iran) and without any symptoms related to COVID-19, and the 8 others not being tested did not have any symptoms since the beginning of the pandemic.
Diagnosis and confirmation of SARS-CoV-2 infection were carried out based on the presence of viral RNA in the nasopharyngeal swab samples (laboratory confirmed disease) and/or observation of the radiological changes in CT scan as well as known clinical presentations of COVID-19 for the suspected cases. In terms of disease severity, the patients were classified into three subgroups, namely, 46 hospitalized cases with the moderate form of the disease but not requiring admission at the intensive care unit (ICU) and not requiring supplemental oxygen (“mild/moderate” subgroup), 52 patients with severe COVID-19 who require supplemental oxygen at the ICU (“severe” subgroup), and 44 patients with critical COVID-19 at the ICU that required invasive mechanical ventilation (“critical” subgroup). Classification of the patients was based on the local guidelines and radiological findings as follows: The radiologist evaluated all five lobes of both lungs for the presence of inflammatory abnormalities including ground-glass opacities, mixed ground-glass opacities, and consolidation, according to the method presented by Li et al. (26) and Li et al. (27). In terms of the percentage of involvement, a score of 0.0 to 4.0 was considered for each lobe: 0 (0%), 1 (1%–25%), 2 (26%–50%), 3 (51%–75%), or 4 (76%–100%). Then, the total severity score (TSS) was calculated by summing the points of the five lobes, which ranges from 0 to 20. A TSS equal to or less than 3 was considered as mild involvement; 4 to 7, moderate; and ≥ 8, severe (28). Moreover, in the presence of imaging criteria of acute respiratory distress syndrome (ARDS) including ground-glass attenuation associated with traction bronchiolectasis or bronchiectasis, airspace consolidation associated with traction bronchiolectasis or bronchiectasis, crazy-paving pattern, and honeycombing, or in the presence of complications such as pneumothorax, a TSS equal to or more than 8 was considered as critical disease (27). Due to their similarities, the severe and critical subgroups were also combined as Severe/Critical for some analyses.
Age and sex information were recorded for both controls and patients. The main clinical characteristics and information of comorbidities (e.g., diabetes, renal disease, liver disease, hypertension, cardiovascular disease, malignancies, and other infectious diseases) were documented using medical records for all patients (Supplementary Table 1).
Primarily, genomic DNA was extracted from EDTA containing peripheral blood samples by implementing an improved salting-out method. In the next step, genotypes of HLA-A, -B, -C, and -DRB1 loci for all COVID-19 patients and HLA-A, -B, and -DRB1 loci for healthy controls were determined by polymerase chain reaction with a sequence-specific primer (PCR-SSP) method using low-resolution HLA-A-B-C and HLA-A-B-DR SSP kits (Olerup SSP®A-B-C and Olerup SSP®A-B-DR SSP Combi Trays, Stockholm, Sweden) according to the manufacturer’s protocols. Unfortunately, HLA-C locus was not typed for controls. Specific HLA-A, -B, -C, and -DRB1 allele families (1st-field, which will be referred to as “alleles” for reason of simplicity) were determined by SCORE software, v5.00.80.02 T/07 provided by the company (29). The HLA-DRB1 data of patients have already been reported recently (12) in comparison with a different set of controls.
To study the difference in binding repertoires of viral peptides between HLA molecules, we extracted the whole proteome of a B.4 SARS-CoV-2 variant (30) submitted to GenBank (MT994849.1). This variant was identified to be the major viral cluster during March–July 2020 in the area (31). A total of 9,660 different 9-mer and 9,594 different 15-mer peptides were obtained, the two lengths representing the most common binders of HLA Class I and Class II molecules, respectively. According to a list of 2nd-field HLA alleles we prepared, the binding affinity of each corresponding Class I molecule (HLA-A, -B, and -C) to each 9-mer peptide and that of each Class II molecule (HLA-DR) to each 15-mer peptide were predicted by applying the state-of-the-art prediction tools netMHCpan 4.1 (32) and netMHCIIpan 4.0 (32, 33), respectively.
The list of our 2nd-field HLA alleles includes all those considered as “commonly” distributed in worldwide population (observed in at least five populations) that we defined in a previous study (34). In order to adapt the prediction results for 2nd-field alleles to our 1st-field data of patients and controls, we assigned each observed 1st-field allele to the most probable 2nd-field one, using as a reference a set of 2nd-field HLA-A, -B, and -DRB1 allele frequency data recently reported for 90 Iranians from Yazd province in the center of Iran (35), who share similar ethno-linguistic background with Hamadan people (Supplementary Table 2). To avoid sampling bias, we also performed a random assignment procedure, during which each observed 1st-field allele was assigned to a random common 2nd-field allele sharing the same 1st-field number.
Data of two indices, i.e., IC50 and %Rank, measuring binding affinity were retrieved from the raw output of netMHCpan and netMHCIIpan, respectively. Both indices may be used to determine if a specific peptide can be considered as a binder to an HLA molecule. Based on the thresholds suggested for IC50 and %Rank to define weak (IC50: 500 nm; %Rank: 2 for Class I molecules, 10 for Class II molecules) and strong binders (IC50: 50 nm; %Rank: 0.5 for Class I molecules, 2 for Class II molecules), we computed for each HLA molecule the numbers of predicted weak and strong bound peptides derived from SARS-CoV-2 proteome. We kept the results from both indices and both thresholds to control possible bias introduced by the choice of these thresholds, which may actually vary among HLA molecules (36, 37). In reality, IC50 has been used in most of the aforementioned prediction studies focusing on HLA–COVID-19 associations, whereas %Rank seems to be more realistic according to recent arguments (38, 39). Number of distinct weak and strong binders predicted for each HLA molecule was then computed according to each of the two indices. To measure the overall HLA capacity to bind SARS-CoV-2-derived peptides, we further computed, for each patient and control, the cumulative numbers of weak and strong binders, namely, the overall viral peptide repertoire sizes of her/his HLA molecules encoded by (1) both HLA-A alleles (nA), (2) both HLA-B alleles (nB), (3) all four HLA-A and -B alleles (nAB), and (4) both HLA-DR (nDR) alleles. For each patient, since the HLA-C genotype was available, those numbers for (5) both HLA-C alleles (nC) and (6) all six HLA-A, -B, and -C (nABC) alleles were equally included.
By the use of the GENE[RATE] tools available on HLA-net (40), we first tested Hardy–Weinberg equilibrium in the control group for each locus, then estimated allele frequencies as well as two-locus haplotype frequencies. We further computed, for each locus, two slightly different measures of genetic diversity (41), i.e., heterozygosity index (h) and frequency of homozygotes.
A general comparison of HLA allele distribution between the patient and control groups was performed by computing pairwise F statistics (FST) using Arlequin (42) v3.5.2.2, the significance of which is accessed by a procedure of 10,000 permutations. Considered as two samples, patients and controls were also compared to the Yazd Iranian sample (43). Comparisons of the frequencies of specific HLA genotypes, alleles, and haplotypes between patient and control groups and among patient subgroups were performed using Fisher’s exact test (44), and their corresponding odds ratio (OR) was estimated with 95% confidence interval. p-value less than 0.05 was considered as statistically significant, and the Benjamini–Hochberg method for multiple comparisons was used to control the false discovery rate (45).
Distributions of the numbers of predicted bound peptides (nA, nB, nAB, nDR, nC, and nABC) were summarized by using kernel density estimation (46), and their difference was compared by using two-tailed Wilcoxon test (47). The relationship between severity and the overall repertoires of HLA molecules was further studied through generalized linear models (48).
To study the influence of age, the widely observed risk factor of COVID-19, comparisons between patients and controls and between patient subgroups were also performed for individuals under 60 years old.
All analyses were performed with R (49) v4.1.2 implemented in RStudio (50) unless otherwise specified. Data visualization was accomplished by using the ggplot2 package (51) v3.3.5.
Significant difference was found for age (p < 0.0001) between patients and controls, which was not the case for sex (p > 0.05), though more male patients were found among patients (77/142 vs. 68/143). Since the healthy controls had no comorbidities, comparison of the main clinical features and demographic factors was only performed between the three patient subgroups (Supplementary Table 1). Significant differences were also observed for age (p < 0.001) and most clinical indices and comorbidities, but not for sex, either. It is interesting to note that there is a much higher proportion of patients with olfactory dysfunction (OD) as well as a decreased proportion of patients with negative PCR results in the critical subgroup, the former being in contrast with previous reports that show that OD appeared to be more prevalent in patients with mild-to-moderate symptoms (52).
At the within-population level, no deviation from Hardy–Weinberg equilibrium was observed in the control group for any locus we analyzed (Supplementary Table 3). At a first glance, the patient group had lower heterozygosity (h) for all three HLA loci (Table 1), and the differences became more visible when displaying the distribution of HLA frequencies in the two groups (Figure 1). With the observed alleles ranked by frequency for each locus, patients had more alleles with high frequencies and less alleles with intermediate frequencies than controls, implying an excess of homozygosity. Accordingly, a higher proportion of homozygotes was found among patients than controls for HLA-A and -B, which was not the case, however, for HLA-DRB1 (Table 1), and none of these differences in numbers was significant according to Fisher’s exact test. Interestingly, when looking at genotypes of specific alleles, we noticed that the homozygotes of some specific alleles were unevenly distributed in patients and controls, with an obvious concentration of A*03, A*24, and B*35 homozygotes in the patient group (Supplementary Figure 1).
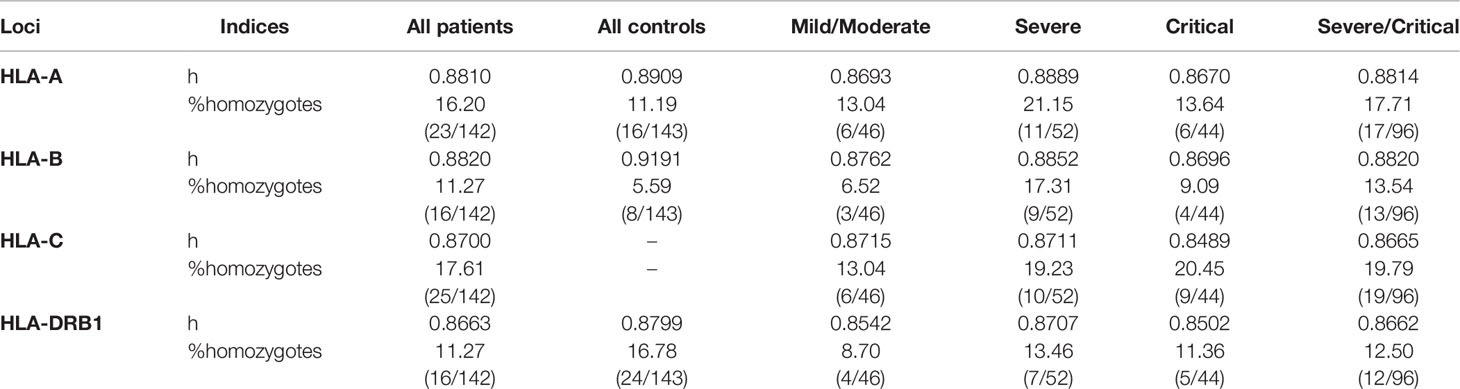
Table 1 Heterozygosity and proportion of homozygotes at each HLA locus computed for each group and subgroup.
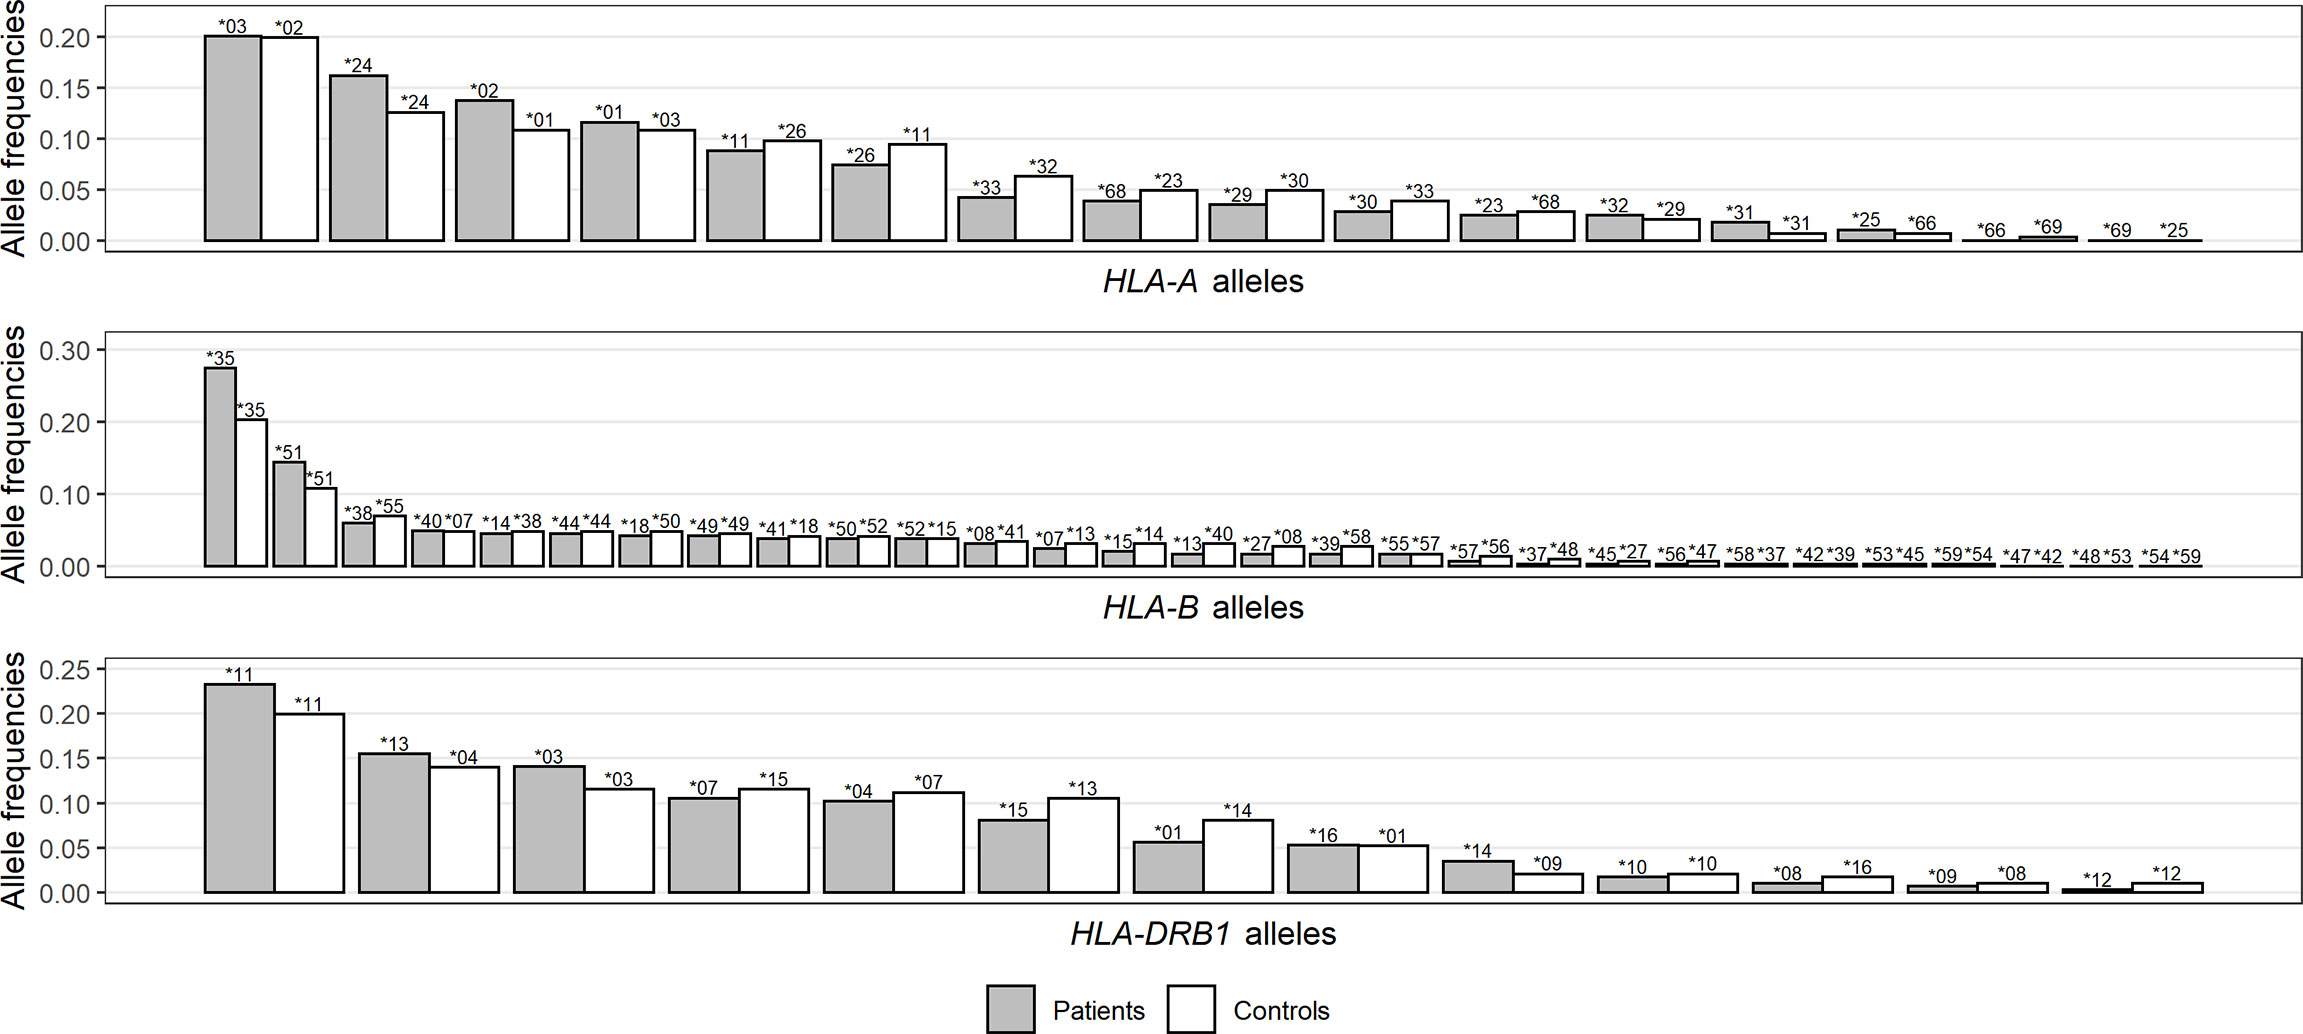
Figure 1 Distribution comparison of allele frequencies for HLA-A (A), -B (B), and -DRB1 (C) loci between patients and controls. Noting that HLA alleles for each group are ranked by frequencies and represented by bars of different lengths with their names on top, each bar pair does not necessarily correspond to the same allele pair.
Among patient subgroups, heterozygosity did not show any consistent difference. In contrast, proportions of HLA-A, -B, -C, and -DRB1 homozygotes all increased with severity, especially when severe and critical subgroups were combined (Table 1). Homozygotes of specific alleles were not compared among subgroups because of low counting numbers.
At the among-population level, when we looked at the pairwise FST between patients, controls, and Yazd Iranians (Supplementary Table 4), the highest values were found between patients and Yazd Iranians for the three loci, and all with significant p-values. The controls were genetically closer to Yazd Iranians, much clearer for HLA-A, where the FST was not significant, but less obvious for HLA-DRB1.
Figure 2 visualizes odds ratios with 95% confidence interval estimated for HLA-A, -B, and -DRB1 alleles and results of Fisher’s exact test between patients and controls (detailed results are listed in Supplementary Table 5). Among HLA alleles, A*03 (OR = 2.06, p = 0.0025), B*35 (OR = 1.49, p = 0.0494), and DRB1*16 (OR = 3.13, p = 0.0237) were significantly more frequent in the patient group (susceptible), whereas A*32 (OR = 0.38, p = 0.0388), B*55 (OR = 0.24, p = 0.0033), B*58 (OR = 0.12, p = 0.0376), and DRB1*14 (OR = 0.42, p = 0.0300) were significantly more prevalent in the control group (protective). After multiple testing corrections, only the result for A*03 (pC = 0.0403) remained significant. Concerning severity, A*03, A*32, B*27, B*39, B*55, and DRB1*16 showed differences among the control group and patient subgroups, the frequencies of which did not, however, seem to be associated with severity (Supplementary Figure 2).
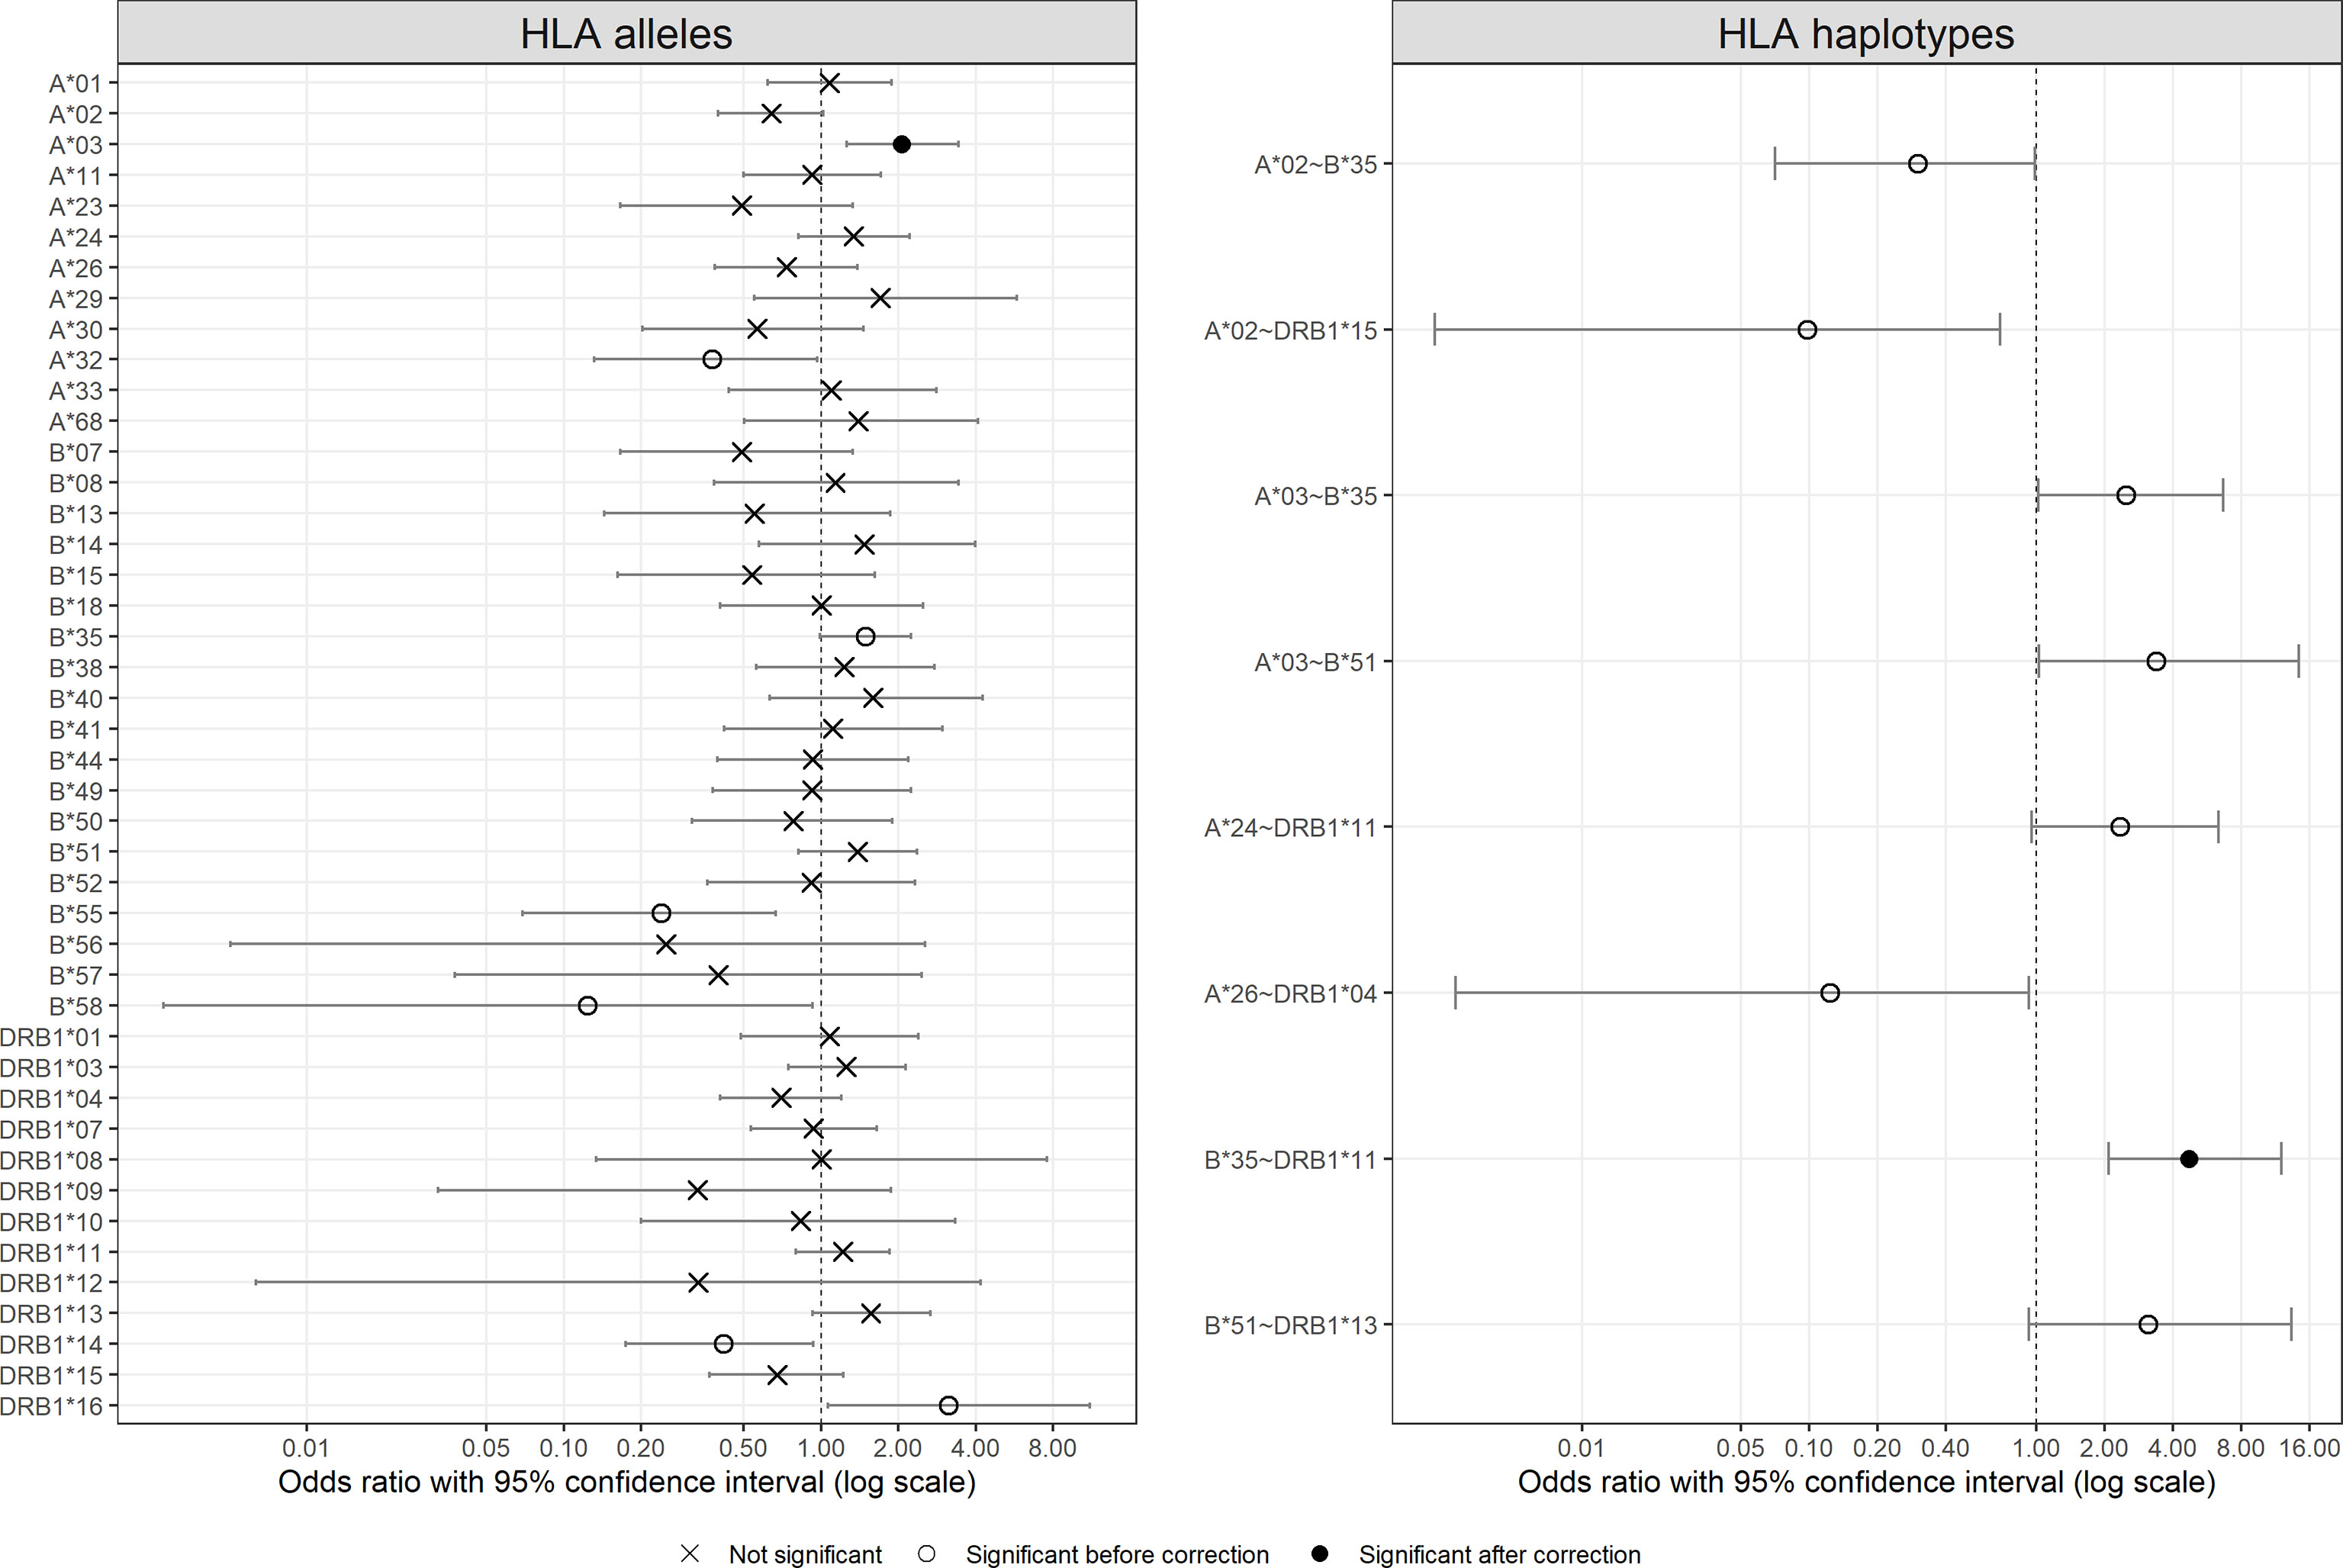
Figure 2 Odds ratio with 95% confident intervals for HLA alleles and HLA two-locus haplotypes. For haplotypes, only those with significant results are shown. Significance is represented by different symbols: crosses for non-significant results; circles for significant results before correction and dots for significant results after correction.
In the same way, Figure 2 also shows the odds ratios with 95% confidence interval for HLA-A~B, B~DRB1, and A~DRB1 haplotypes more frequent than 1% in at least one group (detailed results are listed in Supplementary Table 6, and a full list of estimated two-locus haplotype frequencies is available in Supplementary Table 7). The majority of the haplotypes with significant results were composed of one or two of the aforementioned alleles with different frequencies in the two groups, such as A*02~B*35, A*03~B*35, and B*35~DRB1*11. Only the result for B*35~DRB1*11 (pC = 0.0010) remained significant after multiple testing corrections. Concerning patient subgroups, no haplotype showed an interesting association between frequency and severity (results not shown).
When HLA alleles were ranked according to the numbers of predicted bound peptides derived from SARS-CoV-2 proteome, none of the corresponding alleles detected by frequency comparisons showed any particularity, without extremely low or high values, respectively (Supplementary Figure 3; values for each HLA molecule are available in Supplementary Table 8). For example, the only allele with significant result after corrections, namely, HLA-A*03, was medium ranked in IC50-based lists and low ranked in %Rank-based lists. Actually, the ranking lists depended strongly on indices and thresholds chosen and differed considerably between the results from %Rank and IC50.
In contrast, by comparing cumulative numbers of different SARS-CoV-2-derived bound peptides at the individual level, patients and controls did show remarkable differences, which were more consistent among indices and thresholds chosen. Figure 3 visualizes density distributions of these numbers for each of the two groups, taking %Rank index and threshold for weak binders as example, and density charts with different indices and/or thresholds are found in Supplementary Figures 4–6. Indeed, a higher proportion of patients carried HLA-A molecules predicted to bind only 500 to 750 different viral peptides, whereas more controls carried HLA-A molecules predicted to bind more than 750 different viral peptides. When considered as a risk factor, nA less than 750 had an odds ratio of 2.04 (95% CI: 1.20 to 3.50; Fisher’s exact test p = 0.0084). In contrast, the HLA-B molecules showed less difference between the two groups, and the controls only showed a very slightly higher proportion of values around 700. Considering HLA-A and HLA-B together (nAB), the patients also show less bound peptides (peak at approximately 1,400) compared to controls (peak at approximately 1,600). As for HLA-DR molecules, the distribution for patients seemed more concentrated compared to controls. Wilcoxon test confirmed significant difference for nA (p = 0.0002) but not for nB, nAB, and nDR (Table 2). More interestingly, when only younger (under 60 years old) individuals were included in the comparisons did numbers of predicted bound peptides differ more apparently between patients and controls for nA and nAB (Figure 3 and Supplementary Table 4). In this case, the odds ratio for nA less than 750 increased to 3.01 (95% CI: 1.54 to 5.93; Fisher’s exact test p = 0.0014).
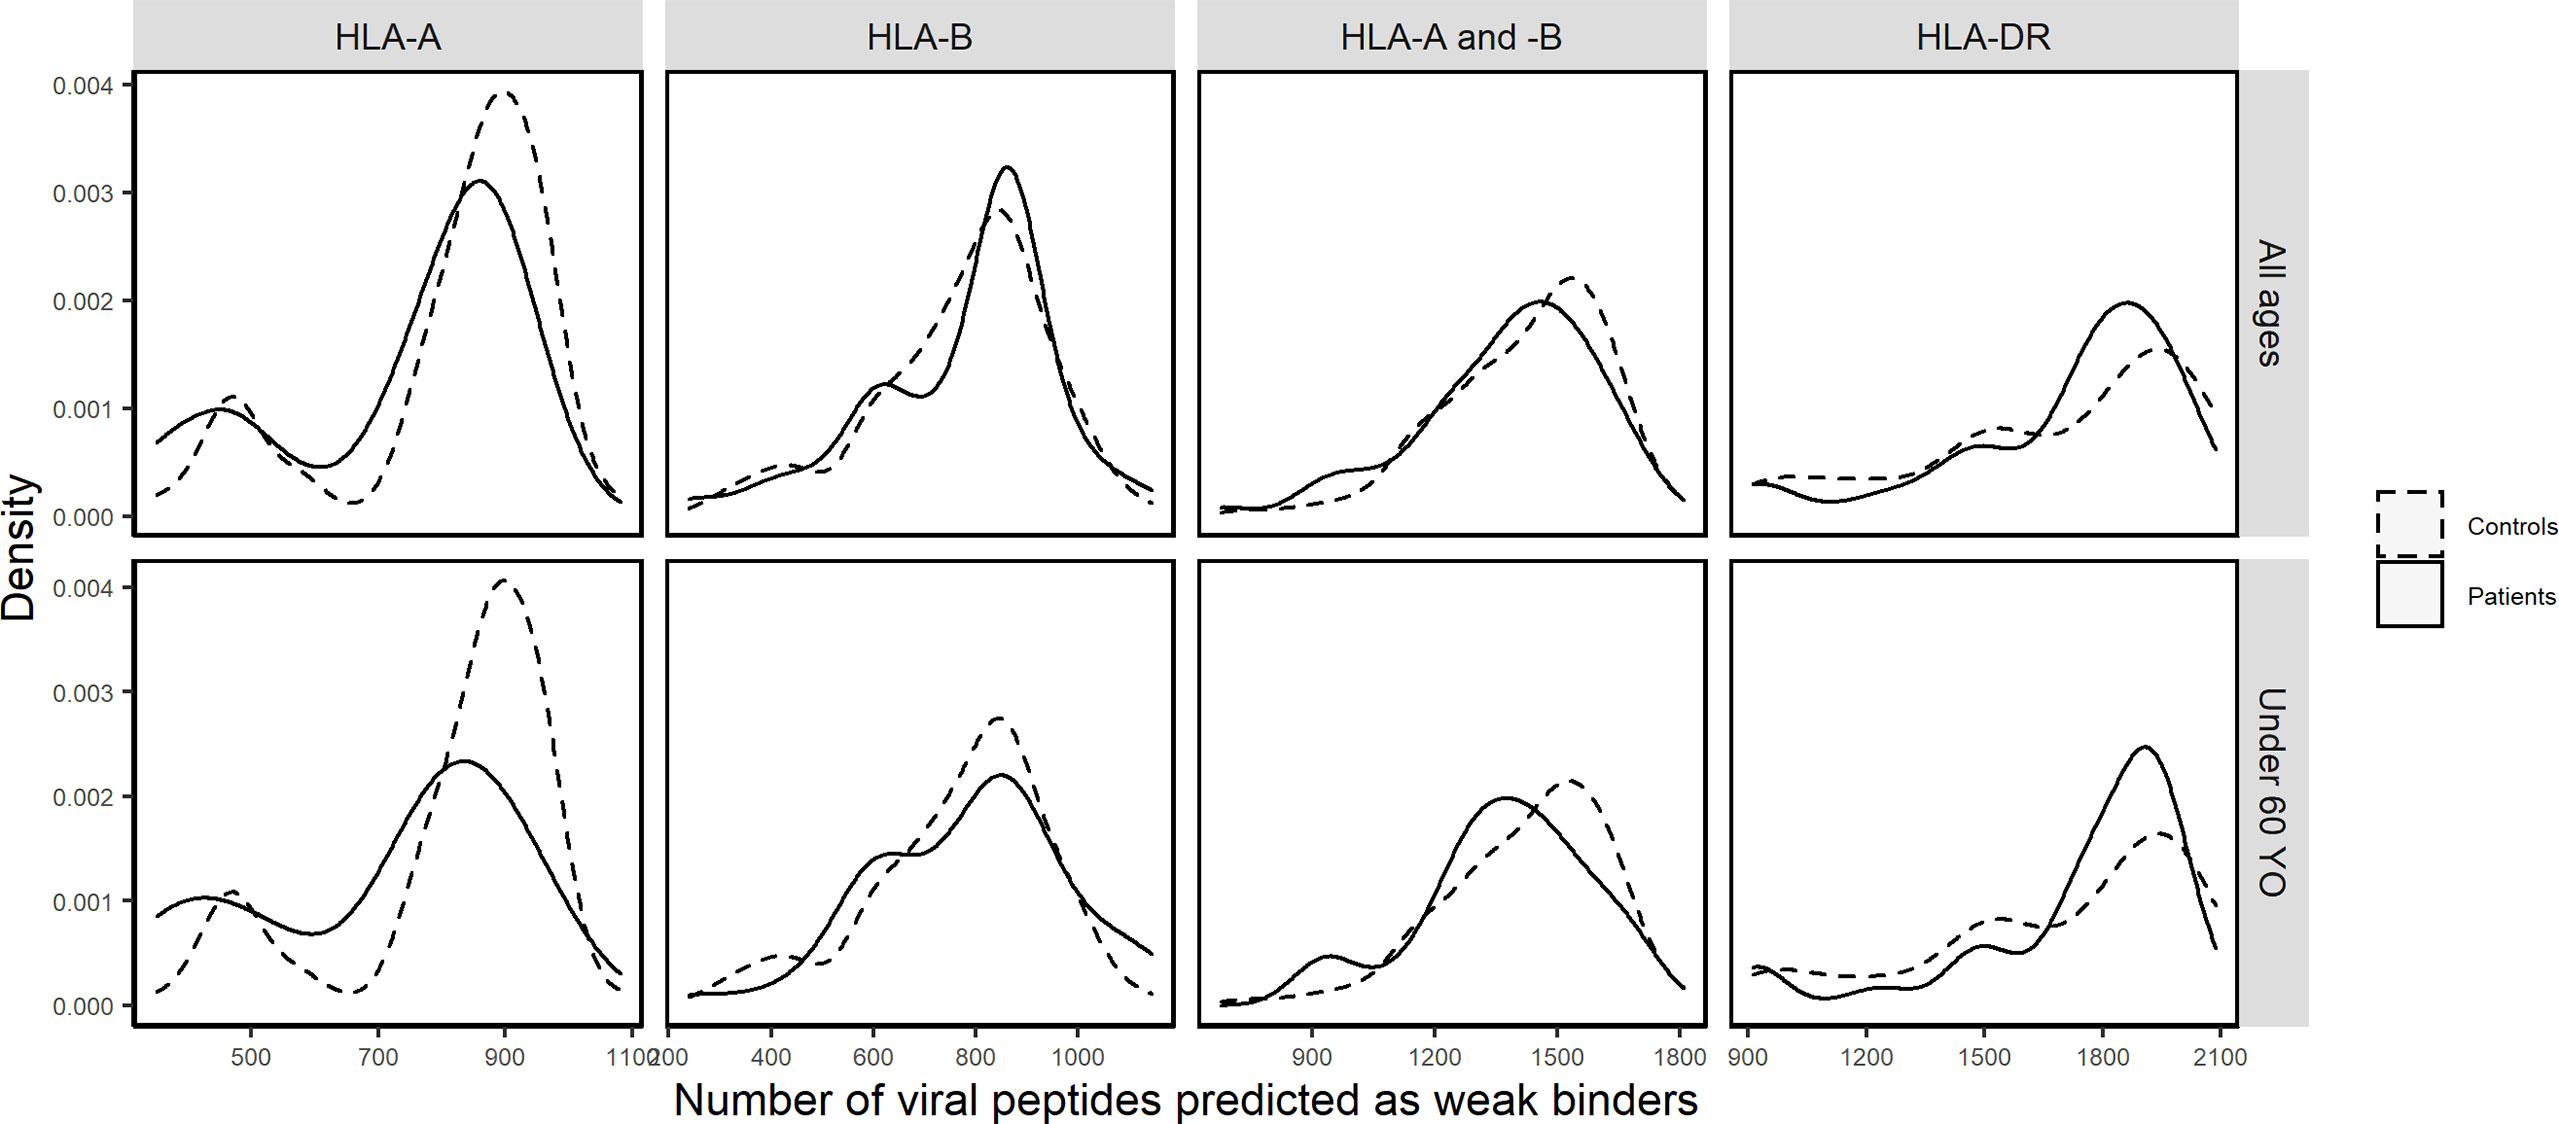
Figure 3 Density distributions of the numbers of SARS-CoV-2-derived peptides predicted by %Rank as weak binders to HLA-A (nA), HLA-B (nB), HLA-A and -B (nAB), and HLA-DR (nDR) molecules in patients (solid curves) and controls (dashed curves) of all ages and in those under 60 years old, respectively.

Table 2 p-values (p < 0.05 in bold) from the two two-tailed Wilcoxon test between patients and controls of all ages or those under 60 years old on numbers of SARS-CoV-2-derived peptides predicted as weak binders of HLA molecules (HLA-A: nA; HLA-B: nB; HLA-A and HLA-B: nAB; HLA-DR: nDR) according to %Rank.
Among the control group and patient subgroups, a smaller HLA-A overall repertoire also seemed to differ, especially when severe and critical subgroups were combined (Figure 4 for %Rank-based weak binders). Generalized linear models revealed a significant association between nA and severity (p = 0.0337, Table 3). This is also compatible with IC50-based weak and strong binders (p = 0.264 and p = 0.311, respectively), and with %Rank-based strong binders for which the result was marginally significant (p = 0.053; see Supplementary Table 10). Visible but not always significant differences were also observed for nAB, nC, and nABC, and for individuals under 60 years old (Table 3 and Supplementary Table 10).
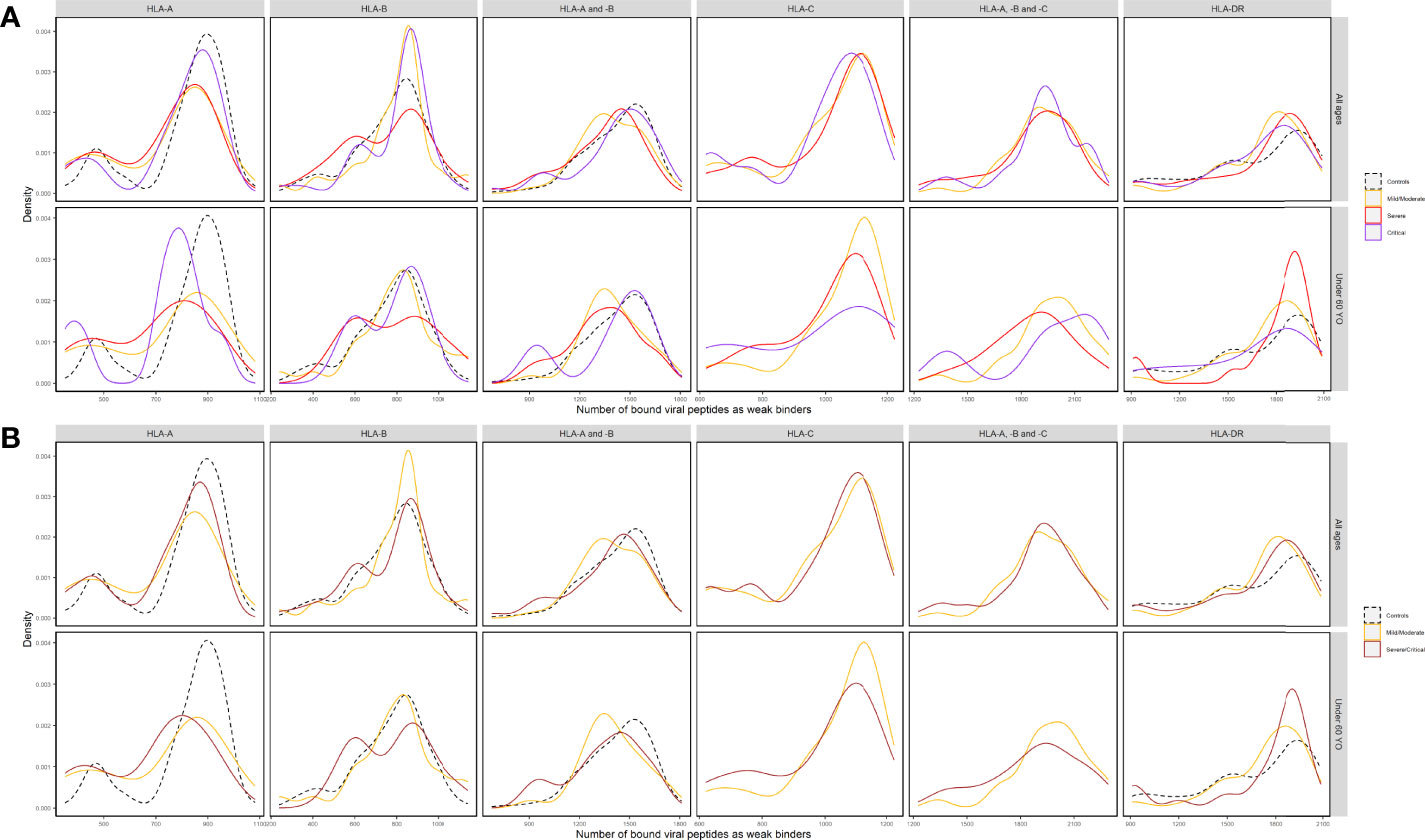
Figure 4 Density distributions of the numbers of SARS-CoV-2-derived peptides predicted by %Rank as as weak binders to HLA-A (nA), HLA-B (nB), HLA-A and -B (nAB), HLA-C (nC), HLA-A, -B and -C (nABC), and HLA-DR (nDR) molecules (A) in three subgroups of patients (Mild/Moderate: solid curves in yellow; Severe: solid curves in red; Critical: solid curves in purple) and controls (dashed curves in black) and (B) in two subgroups of patients (Mild/Moderate: solid curves in yellow; Severe/Critical: solid curves in rose) and controls (dashed curves in black) of all ages and in those under 60 years old, respectively. Note that nC and nABC data were not available for controls.
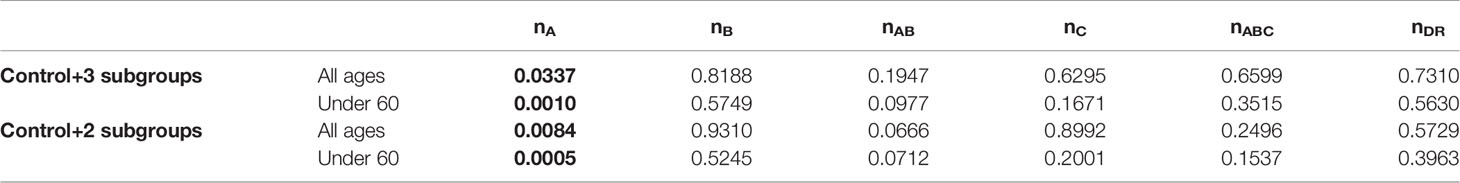
Table 3 p-values (p < 0.05 in bold) from generalized linear models (GLM) between severity (control + 3 patient subgroups or control + 2 subgroups) and numbers of SARS-CoV-2-derived peptides predicted as weak binders of HLA molecules (HLA-A: nA; HLA-B: nB; HLA-A and -B: nAB; HLA -C: nC; HLA-A, -B and -C: nABC; HLA-DR: nDR) according to %Rank for individuals of all ages or those under 60 years old.
Despite minor differences, the repetition of these analyses after the random assignment procedure we designed did not change the results of comparisons (results not shown).
In the present study, we investigated potential associations between HLA Class I and Class II genes and susceptibility and/or severity based on a sample of Iranian patients with COVID-19. At a first glance to the sample, older age and comorbidities were both confirmed as major risk factors associated with COVID-19 susceptibility and/or severity (Supplementary Table 1), as reported in previous studies.
Direct comparison of allele frequencies between patients and controls revealed possible predisposing roles in SARS-CoV-2 infection for HLA-A*03, B*35, and DRB1*16 alleles and a possible protective effect of HLA-A*32, B*55, B*58, and DRB1*14 alleles. However, among these alleles, HLA-A*03 was the only allele with a significant result after multiple testing correction (Figure 2), and none of them seemed to be significantly associated with COVID-19 severity (Supplementary Figure 2). Looking into the literature, HLA-A*03 was characterized as a risk factor, along with other alleles that do not correspond to those found in this study, of COVID-19 severity in Spanish (13), Arabic (19), and Iranian patients (53). In contrast, Shkurnikov et al. (15) depicted that A*03:01 decreased the risk of COVID-19. For HLA-DRB1*04, it was suggested to be significantly associated with either susceptibility (19) or severity (54) in different population samples, besides our previous report on HLA-DRB1 with the same patients but totally different controls (12). Such inconsistency among studies has been attributed to various factors including sampling bias due to small sample sizes, inaccuracy of prediction algorithms, and different genetic background of populations (12). Already noted in previous studies, it also led to the conclusion by some authors that HLA might play a small role in COVID-19 susceptibility (20, 21).
From a more general perspective, both FST and heterozygosity index (h) indicated different distribution patterns of HLA-A, -B, and -DRB1 alleles in patients and controls. Patients were significantly differentiated from controls for all loci, whereas the controls were much more similar to Yazd reference population (Supplementary Table 4). Compared to controls, patients showed lower genetic diversity at all three loci (Table 1), noticeable through their HLA allele frequency distribution with an excess of alleles with intermediate frequencies (Figure 1), which was more or less reflected by higher proportions of homozygotes for both HLA-A and -B (Table 1 and Supplementary Figure 1). These results are also compatible with previous findings by Iturrieta-Zuazo et al. (23) and de Marco et al. (17) suggesting lower HLA-A diversity in patients. As for severity, homozygote proportions also differed patient subgroups (Table 1).
In view of predicted HLA binding affinity, our list of HLA molecules ranked by repertoire of SARS-CoV-2-derived bound peptides (Supplementary Figure 3) is in agreement with previous studies (10, 55–57) only when using IC50, whereas the ranking list based on %Rank is considerably different. Moreover, the HLA molecules predicted to bind the most and the least peptides do not correspond to the ones detected by frequency comparisons (Figure 2 and Supplementary Figure 1). On the other hand, by computing the aggregate number of different bound viral peptides by one’s HLA molecules, namely, the overall viral peptide repertoire, a significantly higher proportion of patients’ HLA-A molecules were predicted to present less SARS-CoV-2-derived peptides (nA) compared to controls. A similar tendency was also visible but less significant for HLA-A and -B overall repertoire (nAB), but not for HLA-B overall repertoire (nB; Table 2, Supplementary Table 9, Figure 3 and Supplementary Figures 4–6). When considered as a risk factor, nA less than 750 (%Rank-based weak binders) had an odds ratio of 2.04, higher than that computed for most specific HLA alleles. Furthermore, nA was associated with disease severity (Figure 4A), confirmed by significant correlation from linear modelling (p < 0.05), especially when severe and critical subgroups were combined (Figure 4B). Though not significant, HLA-A and -B (nAB), HLA-C (nC), and HLA-A, -B, and -C (nABC) also showed slightly lower numbers of binders in patients (Figures 3, 4). These results support, independently from indices and thresholds, the hypothesis that the overall peptide repertoire of HLA Class I molecules may be a more influencing factor compared to any specific HLA allele on both SARS-CoV-2 infection and disease development, and suggest a more prominent role of HLA-A compared to HLA-B and -C.
In contrast, HLA-DRB1 overall repertoire did not seem to be associated with either COVID-19 susceptibility or severity (Figures 3, 4), which is consistent with previous studies (15, 54) and compatible with the fact that HLA Class II molecules are less directly involved with initial reactions against viral infections.
More interestingly, when only younger (<60 years old) individuals were included in the comparisons, the overall repertoires differed more visibly between patients and controls and patient subgroups for nA and nAB, though the difference was not always more significant, probably due to reduced individual numbers (Figures 3, 4, Supplementary Figures 4–9, Tables 2, 3, Supplementary Tables 9, 10). The odds ratio for nA less than 750 increased to 3.01 (p = 0.0014), indicating that for younger people, smaller overall repertoire might be a more important risk factor. Actually, age itself is an essential factor on the HLA peptide binding capacity since HLA expression was reported to be negatively associated with age (58). Among elderly people, larger binding repertoires would barely compensate for their decreased absolute numbers of HLA molecules expressed on cell surface. In addition, most elderly people in patients suffered from one or several comorbidities (Supplementary Table 1). These might be among the main reasons why the overall repertoire of one’s HLA-A molecules became a more prominent factor among younger people.
It has long been documented that the current HLA variation has been the result of long-term pathogen-mediated balancing selection (59–61). Consequently, molecular and functional divergency is both remarkable among HLA alleles observed in modern human populations (34, 62), making the system surprisingly resistant to potential loss of gene diversity (63). The smaller overall viral peptide repertoire predicted for HLA-A and other Class I molecules in a higher proportion of patients would rather be due to a concentration of specific alleles (Supplementary Figure 1) with lower binding capacity than the slightly lower genetic diversity or homozygote proportions (17, 23).
To sum up, we suggest that a smaller overall viral peptide repertoire would be a more general risk factor to viral infection, whereas the risk or protective effect of specific HLA molecule(s) might be both population- and pathogen-specific. In a population, each individual may be inevitably more vulnerable to certain specific pathogens due to the lower overall binding capacity for one or several HLA genes, but more resistant to others, making the population as a whole more resistant against any diseases, as demonstrated by the results of Barquera et al. (55). As a result, at the population level, it would be more difficult to detect evolutionary signatures on particular HLA alleles associated with either susceptibility or resistance to diseases, due to selection from multiple pathogens simultaneously (64, 65).
Unfortunately, in the current study, higher-resolution-level HLA data were not available, and HLA-C was not typed for controls. In this context, we designed a procedure of assignment to adapt the 1st-field genotype data to 2nd-field prediction results, using high-resolution HLA data from a Yazd Iranian population as reference. As for HLA-C, the gene was previously suggested to be much less expressed and display less unique peptide repertoire compared to HLA-A and -B (34, 63), and the latter was again confirmed by the overall number of binders to HLA-A, -B, and -C molecules (nABC; Figures 4, Supplementary Figures 7–9). Nevertheless, synthetic analyses including high-resolution HLA Class I case–control data from different populations will be necessary. It will also be interesting to consider virus immunogenic epitopes and the expression level of different viral proteins to better estimate the overall binding capacity of HLA molecules to SARS-CoV-2-derived peptides.
In conclusion, despite the fact that several specific HLA Class I and Class II alleles/haplotypes, notably HLA-A*03, have been identified to be associated with COVID-19 infection in the Iranian cohort we studied, the overall repertoire of one’s HLA-A molecules and, to a lesser extent, that of one’s HLA Class I molecules to present SARS-CoV-2-derived peptides seem to be a more prominent factor in both susceptibility and severity of the disease, especially for younger people. Inconsistent reports from different studies would have been more related to population-specific combination patterns of HLA alleles than to variations in patients’ clinical features and experimental approaches. These findings would also be enlightening to review, from a functional aspect, previously reported associations between HLA alleles and other pathogens, particularly human viruses.
The datasets presented in this study can be found in online repositories. The names of the repository/repositories and accession number(s) can be found in the article/Supplementary Material.
This retrospective cohort study was conducted with the approval of the institutional Ethics Committee, Hamadan University of medical sciences (IR.UMSHA.REC.1399.005). The patients/participants provided their written informed consent to participate in this study.
HB, GS, and MMM launched the project. GS, SE, MN, and DD designed the study. MMM, SH, FK, MM, and PE collected and provided the samples. SE and MN performed laboratory testing and HLA typing work. GS performed case–control comparisons and DD completed binding predictions and other analyses. DD, GS, and HB wrote the manuscript. HB acquired the funding. All authors contributed to the article and approved the submitted version.
This work was supported financially by Vice-Chancellor for Research and Technology, Hamadan University of Medical Sciences (Grant No: 14000207868), Hamadan, Iran, and the Swiss National Science Foundation (Grant Nos. #31003A_144180 and #310030_188820 to Alicia Sanchez-Mazas), Switzerland.
The authors declare that the research was conducted in the absence of any commercial or financial relationships that could be construed as a potential conflict of interest.
All claims expressed in this article are solely those of the authors and do not necessarily represent those of their affiliated organizations, or those of the publisher, the editors and the reviewers. Any product that may be evaluated in this article, or claim that may be made by its manufacturer, is not guaranteed or endorsed by the publisher.
We are grateful to Dr. Jose Manuel Nunes for his assistance in statistical issues and the use of GENE[RATE] tools.
The Supplementary Material for this article can be found online at: https://www.frontiersin.org/articles/10.3389/fimmu.2022.891816/full#supplementary-material
Supplementary Figure 1 | Comparison of homozygote proportions for each HLA-A (red), -B (blue), and -DRB1 (grey) allele in patients and controls.
Supplementary Figure 2 | Comparison of frequencies of HLA-A*03, A*32, B*27, B*39, B*55 and DRB1*16 alleles showing significant differences among control group (black) and patient subgroups (mild/moderate: yellow; severe: red; critical: purple).
Supplementary Figure 3 | Ranking of HLA-A (red), -B (blue) and -C (yellow) alleles observed in Iranian case-control cohort according to %Rank-based weak binders, %Rank-based strong binders, IC50-based weak binders and IC50-based strong binders, respectively.
Supplementary Figure 4 | Density distributions of the numbers of SARS-CoV-2-derived peptides predicted by %Rank as strong binders to HLA-A (nA), HLA-B (nB), HLA-A and -B (nAB), and HLA-DR (nDR) molecules in patients (solid curves) and controls (dashed curves) of all ages and in those under 60 YO, respectively.
Supplementary Figure 5 | Density distributions of the numbers of SARS-CoV-2-derived peptides predicted by IC50 (nm) as weak binders to HLA-A (nA), HLA-B (nB), HLA-A and -B (nAB), and HLA-DR (nDR) molecules in patients (solid curves) and controls (dashed curves) of all ages and in those under 60 YO, respectively.
Supplementary Figure 6 | Density distributions of the numbers of SARS-CoV-2-derived peptides predicted by IC50 (nm) as strong binders to HLA-A (nA), HLA-B (nB), HLA-A and -B (nAB), and HLA-DR (nDR) molecules in patients (solid curves) and controls (dashed curves) of all ages and in those under 60 YO, respectively.
Supplementary Figure 7 | Density distributions of the numbers of SARS-CoV-2-derived peptides predicted by %Rank as strong binders to HLA-A (nA), HLA-B (nB), HLA-A and -B (nAB), HLA-C (nC), HLA-A, -B and -C (nABC), and HLA-DR (nDR) molecules (A) in three subgroups of patients (Mild/Moderate: solid curves in yellow; Severe: solid curves in red; Critical: solid curves in purple) and controls (dashed curves in black) and (B) in two subgroups of patients (Mild/Moderate: solid curves in yellow; Severe/Critical: solid curves in rose) and controls (solid curves in black) of all ages and in those under 60 YO, respectively. Note that nC and nABC data were not available for controls.
Supplementary Figure 8 | Density distributions of the numbers of SARS-CoV-2-derived peptides predicted by IC50 as strong binders to HLA-A (nA), HLA-B (nB), HLA-A and -B (nAB), HLA-C (nC), HLA-A, -B and -C (nABC), and HLA-DR (nDR) molecules (A) in three subgroups of patients (Mild/Moderate: solid curves in yellow; Severe: solid curves in red; Critical: solid curves in purple) and controls (dashed curves in black) and (B) in two subgroups of patients (Mild/Moderate: solid curves in yellow; Severe/Critical: solid curves in rose) and controls (solid curves in black) of all ages and in those under 60 YO, respectively. Note that nC and nABC data were not available for controls.
Supplementary Figure 9 | Density distributions of the numbers of SARS-CoV-2-derived peptides predicted by IC50 as weak binders to HLA-A (nA), HLA-B (nB), HLA-A and -B (nAB), HLA-C (nC), HLA-A, -B and -C (nABC), and HLA-DR (nDR) molecules (A) in three subgroups of patients (Mild/Moderate: solid curves in yellow; Severe: solid curves in red; Critical: solid curves in purple) and controls (dashed curves in black) and (B) in two subgroups of patients (Mild/Moderate: solid curves in yellow; Severe/Critical: solid curves in rose) and controls (dashed curves in black) of all ages and in those under 60 YO, respectively. Note that nC and nABC data were not available for controls.
1. Who Coronavirus Dashboard. Geneva: World Health Organization (2022). Available at: https://covid19.who.int/ (Accessed 2022).
2. Esakandari H, Nabi-Afjadi M, Fakkari-Afjadi J, Farahmandian N, Miresmaeili SM, Bahreini E. A Comprehensive Review of COVID-19 Characteristics. Biol Proced Online (2020) 22:19. doi: 10.1186/s12575-020-00128-2
3. Peckham H, De Gruijter NM, Raine C, Radziszewska A, Ciurtin C, Wedderburn LR, et al. Male Sex Identified by Global COVID-19 Meta-Analysis as a Risk Factor for Death and ITU Admission. Nat Commun (2020) 11:6317. doi: 10.1038/s41467-020-19741-6
4. Debnath M, Banerjee M, Berk M. Genetic Gateways to COVID-19 Infection: Implications for Risk, Severity, and Outcomes. FASEB J (2020) 34:8787–95. doi: 10.1096/fj.202001115R
5. Seyedalinaghi S, Mehrtak M, Mohssenipour M, Mirzapour P, Barzegary A, Habibi P, et al. Genetic Susceptibility of COVID-19: A Systematic Review of Current Evidence. Eur J Med Res (2021) 26:46. doi: 10.1186/s40001-021-00516-8
6. Blackwell JM, Jamieson SE, Burgner D. HLA and Infectious Diseases. Clin Microbiol Rev (2009) 22:370–85. doi: 10.1128/CMR.00048-08
7. Matzaraki V, Kumar V, Wijmenga C, Zhernakova A. The MHC Locus and Genetic Susceptibility to Autoimmune and Infectious Diseases. Genome Biol (2017) 18:76. doi: 10.1186/s13059-017-1207-1
8. Tian C, Hromatka BS, Kiefer AK, Eriksson N, Noble SM, Tung JY, et al. Genome-Wide Association and HLA Region Fine-Mapping Studies Identify Susceptibility Loci for Multiple Common Infections. Nat Commun (2017) 8:599. doi: 10.1038/s41467-017-00257-5
9. Douillard V, Castelli EC, Mack SJ, Hollenbach JA, Gourraud PA, Vince N, et al. Current HLA Investigations on SARS-CoV-2 and Perspectives. Front Genet (2021) 12:774922. doi: 10.3389/fgene.2021.774922
10. Nguyen A, David JK, Maden SK, Wood MA, Weeder BR, Nellore A, et al. Human Leukocyte Antigen Susceptibility Map for Severe Acute Respiratory Syndrome Coronavirus 2. J Virol (2020) 94. doi: 10.1128/JVI.00510-20
11. Correale P, Mutti L, Pentimalli F, Baglio G, Saladino RE, Sileri P, et al. HLA-B*44 and C*01 Prevalence Correlates With Covid19 Spreading Across Italy. Int J Mol Sci (2020) 21. doi: 10.3390/ijms21155205
12. Ebrahimi S, Ghasemi-Basir HR, Majzoobi MM, Rasouli-Saravani A, Hajilooi M, Solgi G. HLA-DRB1*04 may Predict the Severity of Disease in a Group of Iranian COVID-19 Patients. Hum Immunol (2021) 82:719–25. doi: 10.1016/j.humimm.2021.07.004
13. Lorente L, Martín MM, Franco A, Barrios Y, Cáceres JJ, Solé-Violán J, et al. HLA Genetic Polymorphisms and Prognosis of Patients With COVID-19. Med Intensiva (Engl Ed) (2021) 45:96–103. doi: 10.1016/j.medin.2020.08.004
14. Schindler E, Dribus M, Duffy BF, Hock K, Farnsworth CW, Gragert L, et al. HLA Genetic Polymorphism in Patients With Coronavirus Disease 2019 in Midwestern United States. Hla (2021) 98:370–9. doi: 10.1111/tan.14387
15. Shkurnikov M, Nersisyan S, Jankevic T, Galatenko A, Gordeev I, Vechorko V, et al. Association of HLA Class I Genotypes With Severity of Coronavirus Disease-19. Front Immunol (2021) 12:641900. doi: 10.3389/fimmu.2021.641900
16. Weiner J, Suwalski P, Holtgrewe M, Rakitko A, Thibeault C, Müller M, et al. Increased Risk of Severe Clinical Course of COVID-19 in Carriers of HLA-C*04:01. EClinicalMedicine (2021) 40:101099. doi: 10.1016/j.eclinm.2021.101099
17. De Marco R, Faria TC, Mine KL, Cristelli M, Medina-Pestana JO, Tedesco-Silva H, et al. HLA-A Homozygosis Is Associated With Susceptibility to COVID-19. HLA (2021) 98:122–31. doi: 10.1111/tan.14349
18. Gutiérrez-Bautista JF, Rodriguez-Nicolas A, Rosales-Castillo A, López-Ruz M, Martín-Casares AM, Fernández-Rubiales A, et al. Study of HLA-A, -B, -C, -DRB1 and -DQB1 Polymorphisms in COVID-19 Patients. J Microbiol Immunol Infect (2021). doi: 10.1016/j.jmii.2021.08.009
19. Naemi FMA, Al-Adwani S, Al-Khatabi H, Al-Nazawi A. Frequency of HLA Alleles Among COVID-19 Infected Patients: Preliminary Data From Saudi Arabia. Virology (2021) 560:1–7. doi: 10.1016/j.virol.2021.04.011
20. Schetelig J, Heidenreich F, Baldauf H, Trost S, Falk B, Hoßbach C, et al. Individual HLA-A, -B, -C, and -DRB1 Genotypes Are No Major Factors Which Determine COVID-19 Severity. Front Immunol (2021) 12:698193. doi: 10.3389/fimmu.2021.698193
21. Ben Shachar S, Barda N, Manor S, Israeli S, Dagan N, Carmi S, et al. MHC Haplotyping of SARS-CoV-2 Patients: HLA Subtypes Are Not Associated With the Presence and Severity of COVID-19 in the Israeli Population. J Clin Immunol (2021) 41:1154–61. doi: 10.1007/s10875-021-01071-x
22. Penn DJ, Damjanovich K, Potts WK. MHC Heterozygosity Confers a Selective Advantage Against Multiple-Strain Infections. Proc Natl Acad Sci U.S.A. (2002) 99:11260–4.
23. Iturrieta-Zuazo I, Rita CG, Garcia-Soidan A, De Malet Pintos-Fonseca A, Alonso-Alarcon N, Pariente-Rodriguez R, et al. Possible Role of HLA Class-I Genotype in SARS-CoV-2 Infection and Progression: A Pilot Study in a Cohort of Covid-19 Spanish Patients. Clin Immunol (2020) 219:108572. doi: 10.1016/j.clim.2020.108572
24. La Porta C, Zapperi S. Estimating the Binding of Sars-CoV-2 Peptides to HLA Class I in Human Subpopulations Using Artificial Neural Networks. Cell Syst (2020) 11:412–417.e412. doi: 10.1016/j.cels.2020.08.011
25. Arora J, Pierini F, Mclaren PJ, Carrington M, Fellay J, Lenz TL. HLA Heterozygote Advantage Against HIV-1 Is Driven by Quantitative and Qualitative Differences in HLA Allele-Specific Peptide Presentation. Mol Biol Evol (2020) 37:639–50. doi: 10.1093/molbev/msz249
26. Li K, Fang Y, Li W, Pan C, Qin P, Zhong Y, et al. CT Image Visual Quantitative Evaluation and Clinical Classification of Coronavirus Disease (COVID-19). Eur Radiol (2020) 30:4407–16. doi: 10.1007/s00330-020-06817-6
27. Li K, Wu J, Wu F, Guo D, Chen L, Fang Z, et al. The Clinical and Chest CT Features Associated With Severe and Critical COVID-19 Pneumonia. Invest Radiol (2020) 55:327–31. doi: 10.1097/RLI.0000000000000672
28. Wasilewski PG, Mruk B, Mazur S, Poltorak-Szymczak G, Sklinda K, Walecki J. COVID-19 Severity Scoring Systems in Radiological Imaging - A Review. Pol J Radiol (2020) 85:e361–8. doi: 10.5114/pjr.2020.98009
29. Helmberg W, Lanzer G, Zahn R, Weinmayr B, Wagner T, Albert E. Virtual DNA Analysis–a New Tool for Combination and Standardised Evaluation of SSO, SSP and Sequencing-Based Typing Results. Tissue Antigens (1998) 51:587–92. doi: 10.1111/j.1399-0039.1998.tb03000.x
30. Shahabzadeh Z, Hosseinzadeh Gharajeh N, Hashemian SM, Barati O. "Genomic Identification of the Coronaviruses Isolated From the Patients of Iran During COVID-19 Outbreak". In: GenBank (2020).
31. Fattahi Z, Mohseni M, Jalalvand K, Aghakhani Moghadam F, Ghaziasadi A, Keshavarzi F, et al. SARS-CoV-2 Outbreak in Iran: The Dynamics of the Epidemic and Evidence on Two Independent Introductions. Transbound Emerg Dis (2021). doi: 10.1111/tbed.14104
32. Reynisson B, Alvarez B, Paul S, Peters B, Nielsen M. NetMHCpan-4.1 and NetMHCIIpan-4.0: Improved Predictions of MHC Antigen Presentation by Concurrent Motif Deconvolution and Integration of MS MHC Eluted Ligand Data. Nucleic Acids Res (2020) 48:W449–54.
33. Reynisson B, Barra C, Kaabinejadian S, Hildebrand WH, Peters B, Nielsen M. Improved Prediction of MHC II Antigen Presentation Through Integration and Motif Deconvolution of Mass Spectrometry MHC Eluted Ligand Data. J Proteome Res (2020) 19:2304–15. doi: 10.1021/acs.jproteome.9b00874
34. Di D, Nunes JM, Jiang W, Sanchez-Mazas A. Like Wings of a Bird: Functional Divergence and Complementarity Between HLA-A and HLA-B Molecules. Mol Biol Evol (2021) 38:1580–94. doi: 10.1093/molbev/msaa325
35. Nikbin B, Nicknam MH, Hadinedoushan H, Ansaripour B, Moradi B, Yekaninejad M, et al. Human Leukocyte Antigen (HLA) Class I and II Polymorphism in Iranian Healthy Population From Yazd Province. Iran J Allergy Asthma Immunol (2017) 16:1–13.
36. Paul S, Weiskopf D, Angelo MA, Sidney J, Peters B, Sette A. HLA Class I Alleles Are Associated With Peptide-Binding Repertoires of Different Size, Affinity, and Immunogenicity. J Immunol (2013) 191:5831–9. doi: 10.4049/jimmunol.1302101
37. Bonsack M, Hoppe S, Winter J, Tichy D, Zeller C, Küpper MD, et al. Performance Evaluation of MHC Class-I Binding Prediction Tools Based on an Experimentally Validated MHC-Peptide Binding Data Set. Cancer Immunol Res (2019) 7:719–36. doi: 10.1158/2326-6066.CIR-18-0584
38. Jurtz V, Paul S, Andreatta M, Marcatili P, Peters B, Nielsen M. NetMHCpan-4.0: Improved Peptide-MHC Class I Interaction Predictions Integrating Eluted Ligand and Peptide Binding Affinity Data. J Immunol (2017) 199:3360–8. doi: 10.4049/jimmunol.1700893
39. Reardon B, Koşaloğlu-Yalçın Z, Paul S, Peters B, Sette A. Allele-Specific Thresholds of Eluted Ligands for T-Cell Epitope Prediction. Mol Cell Proteomics (2021) 20:100122. doi: 10.1016/j.mcpro.2021.100122
40. Nunes JM, Buhler S, Roessli D, Sanchez-Mazas A. The HLA-Net GENE[RATE] Pipeline for Effective HLA Data Analysis and Its Application to 145 Population Samples From Europe and Neighbouring Areas. Tissue Antigens (2014) 83:307–23. doi: 10.1111/tan.12356
41. Lachance J. A Fundamental Relationship Between Genotype Frequencies and Fitnesses. Genetics (2008) 180:1087–93. doi: 10.1534/genetics.108.093518
42. Excoffier L, Lischer HE. Arlequin Suite Ver 3.5: A New Series of Programs to Perform Population Genetics Analyses Under Linux and Windows. Mol Ecol Resour (2010) 10:564–7. doi: 10.1111/j.1755-0998.2010.02847.x
43. Holsinger KE, Weir BS. Genetics in Geographically Structured Populations: Defining, Estimating and Interpreting F(ST). Nat Rev Genet (2009) 10:639–50. doi: 10.1038/nrg2611
45. Benjamini Y, Hochberg Y. Controlling the False Discovery Rate: A Practical and Powerful Approach to Multiple Testing. J R Statist Soc B (1995) 57:289–300. doi: 10.1111/j.2517-6161.1995.tb02031.x
46. Sheather SJ, Jones MC. A Reliable Data-Based Bandwidth Selection Method for Kernel Density Estimation. J R Stat Society: Ser B (Methodological) (1991) 53:683–90. doi: 10.1111/j.2517-6161.1991.tb01857.x
47. Bauer DF. Constructing Confidence Sets Using Rank Statistics. J Am Stat Assoc (1972) 67:687–90. doi: 10.1080/01621459.1972.10481279
49. R Core Team. "R: A Language and Environment for Statistical Computing. In: R Foundation for Statistical Computing. Vienna (2018). Available at: https://www.R-project.org/.
52. Wei G, Gu J, Gu Z, Du C, Huang X, Xing H, et al. Olfactory Dysfunction in Patients With Coronavirus Disease 2019: A Review. Front Neurol (2021) 12:. doi: 10.3389/fneur.2021.783249
53. Saadati M, Chegni H, Ghaffari AD, Mohammad Hassan Z. The Potential Association of Human Leukocyte Antigen (HLA)-A and -B With COVID-19 Mortality: A Neglected Risk Factor. Iran J Public Health (2020) 49:2433–4. doi: 10.18502/ijph.v49i12.4837
54. Langton DJ, Bourke SC, Lie BA, Reiff G, Natu S, Darlay R, et al. The Influence of HLA Genotype on the Severity of COVID-19 Infection. HLA (2021) 98:14–22. doi: 10.1111/tan.14284
55. Barquera R, Collen E, Di D, Buhler S, Teixeira J, Llamas B, et al. Binding Affinities of 438 HLA Proteins to Complete Proteomes of Seven Pandemic Viruses and Distributions of Strongest and Weakest HLA Peptide Binders in Populations Worldwide. HLA (2020) 96:277–98. doi: 10.1111/tan.13956
56. Pretti M, Galvani RG, Vieira GF, Bonomo A, Bonamino MH, Boroni M. Class I HLA Allele Predicted Restricted Antigenic Coverages for Spike and Nucleocapsid Proteins Are Associated With Deaths Related to COVID-19. Front Immunol (2020) 11:565730. doi: 10.3389/fimmu.2020.565730
57. Tomita Y, Ikeda T, Sato R, Sakagami T. Association Between HLA Gene Polymorphisms and Mortality of COVID-19: An in Silico Analysis. Immun Inflammation Dis (2020) 8:684–94. doi: 10.1002/iid3.358
58. Le Morvan C, Cogné M, Drouet M. HLA-A and HLA-B Transcription Decrease With Ageing in Peripheral Blood Leucocytes. Clin Exp Immunol (2001) 125:245–50. doi: 10.1046/j.1365-2249.2001.01610.x
59. Hedrick PW, Thomson G. Evidence for Balancing Selection at HLA. Genetics (1983) 104:449–56. doi: 10.1093/genetics/104.3.449
60. Meyer D, Thomson G. How Selection Shapes Variation of the Human Major Histocompatibility Complex: A Review. Ann Hum Genet (2001) 65:1–26. doi: 10.1046/j.1469-1809.2001.6510001.x
61. Solberg OD, Mack SJ, Lancaster AK, Single RM, Tsai Y, Sanchez-Mazas A, et al. Balancing Selection and Heterogeneity Across the Classical Human Leukocyte Antigen Loci: A Meta-Analytic Review of 497 Population Studies. Hum Immunol (2008) 69:443–64. doi: 10.1016/j.humimm.2008.05.001
62. Pierini F, Lenz TL. Divergent Allele Advantage at Human MHC Genes: Signatures of Past and Ongoing Selection. Mol Biol Evol (2018) 35:2145–58. doi: 10.1093/molbev/msy116
63. Buhler S, Nunes JM, Sanchez-Mazas A. HLA Class I Molecular Variation and Peptide-Binding Properties Suggest a Model of Joint Divergent Asymmetric Selection. Immunogenetics (2016) 68:401–16. doi: 10.1007/s00251-016-0918-x
64. Dendrou CA, Petersen J, Rossjohn J, Fugger L. HLA Variation and Disease. Nat Rev Immunol (2018) 18:325–39. doi: 10.1038/nri.2017.143
Keywords: COVID-19, HLA, overall binding repertoire, SARS-CoV-2-derived peptides, HLA binding prediction
Citation: Basir HRG, Majzoobi MM, Ebrahimi S, Noroozbeygi M, Hashemi SH, Keramat F, Mamani M, Eini P, Alizadeh S, Solgi G and Di D (2022) Susceptibility and Severity of COVID-19 Are Both Associated With Lower Overall Viral–Peptide Binding Repertoire of HLA Class I Molecules, Especially in Younger People. Front. Immunol. 13:891816. doi: 10.3389/fimmu.2022.891816
Received: 08 March 2022; Accepted: 10 June 2022;
Published: 07 July 2022.
Edited by:
Giulia Carla Marchetti, University of Milan, ItalyReviewed by:
Ingrid Fricke-Galindo, Instituto Nacional de Enfermedades Respiratorias-México (INER), MexicoCopyright © 2022 Basir, Majzoobi, Ebrahimi, Noroozbeygi, Hashemi, Keramat, Mamani, Eini, Alizadeh, Solgi and Di. This is an open-access article distributed under the terms of the Creative Commons Attribution License (CC BY). The use, distribution or reproduction in other forums is permitted, provided the original author(s) and the copyright owner(s) are credited and that the original publication in this journal is cited, in accordance with accepted academic practice. No use, distribution or reproduction is permitted which does not comply with these terms.
*Correspondence: Ghasem Solgi, Z2guc29sZ2lAdW1zaGEuYWMuaXI=; Da Di, ZGEuZGlAdW5pZ2UuY2g=
Disclaimer: All claims expressed in this article are solely those of the authors and do not necessarily represent those of their affiliated organizations, or those of the publisher, the editors and the reviewers. Any product that may be evaluated in this article or claim that may be made by its manufacturer is not guaranteed or endorsed by the publisher.
Research integrity at Frontiers
Learn more about the work of our research integrity team to safeguard the quality of each article we publish.