
94% of researchers rate our articles as excellent or good
Learn more about the work of our research integrity team to safeguard the quality of each article we publish.
Find out more
REVIEW article
Front. Immunol. , 27 June 2022
Sec. Autoimmune and Autoinflammatory Disorders
Volume 13 - 2022 | https://doi.org/10.3389/fimmu.2022.889296
This article is part of the Research Topic Understanding the Concept of Pre-Clinical Autoimmunity View all 15 articles
 Chachrit Khunsriraksakul1,2†
 Havell Markus1,2†
 Nancy J. Olsen3
 Laura Carrel4
 Bibo Jiang5‡
 Dajiang J. Liu2,5*‡
Genome-wide association studies (GWAS) have identified hundreds of genetic variants associated with autoimmune diseases and provided unique mechanistic insights and informed novel treatments. These individual genetic variants on their own typically confer a small effect of disease risk with limited predictive power; however, when aggregated (e.g., via polygenic risk score method), they could provide meaningful risk predictions for a myriad of diseases. In this review, we describe the recent advances in GWAS for autoimmune diseases and the practical application of this knowledge to predict an individual’s susceptibility/severity for autoimmune diseases such as systemic lupus erythematosus (SLE) via the polygenic risk score method. We provide an overview of methods for deriving different polygenic risk scores and discuss the strategies to integrate additional information from correlated traits and diverse ancestries. We further advocate for the need to integrate clinical features (e.g., anti-nuclear antibody status) with genetic profiling to better identify patients at high risk of disease susceptibility/severity even before clinical signs or symptoms develop. We conclude by discussing future challenges and opportunities of applying polygenic risk score methods in clinical care.
There are nearly 100 autoimmune diseases, many of which are rare with prevalence of less than 5 per 100,000 individuals (1, 2). Yet, the prevalence of autoimmune diseases is increasing in recent years. The National Institutes of Health estimates that 14.7-23.5 million people (around 4-7% of the population) are affected in the United States overall (3).
Autoimmune diseases arise from a combination of genetic predispositions and environmental factors that result in the loss of self-tolerance and may cause the immune system to mount a response against the body’s own healthy cells and tissues (4). Genetic effects can alter both the innate and adaptive immune systems (5). Likewise, altered immune responses can be triggered by environmental factors like microbial antigens or environmental toxins, although triggers in many of these disorders, remain unclear. This often leads to the production of autoantibodies and activation of cell-mediated autoimmunity. Some autoimmune diseases target specific cell types (e.g., pancreatic ß-cells in type-1 diabetes or thyroid-stimulating hormone (TSH) receptor in Hashimoto thyroiditis), while others can target a common antigen present in a wide range of cell types (e.g., nuclear antigens in systemic lupus erythematous or systemic sclerosis) (6).
The clinical presentation and severity of most autoimmune diseases are heterogenous due to their complex etiology (7). Moreover, symptoms of different disorders can overlap. As a result, autoimmune disease diagnosis remains challenging. Misdiagnoses of autoimmune diseases are common (8–10) and a correct diagnosis can take several years and multiple physician visits (e.g., rheumatology, endocrinology, hematology, etc.). Delayed diagnoses and treatment can allow disease to progress to advanced stages, affecting multiple organ systems, and even leading to fatality. As a result, early diagnosis and proper treatment management of autoimmune diseases is a clinical necessity.
In this review, we discuss the current states of genome wide association studies for a number of autoimmune diseases and how we can leverage those results to develop polygenic risk scores (PRS) for disease risk prediction based on one’s genetic information. We discuss various methods and strategies used to derive PRS models. Finally, in the era of precision using electronic health records, we discuss the clinical utility of combining conventional lab tests with genetic data to improve risk prediction.
Genome wide association studies (GWAS) have significantly changed our understanding of the genetic landscape underpinning autoimmune diseases. In this review, we look into 16 autoimmune diseases or traits: ankylosing spondylitis (AS), celiac disease (CEL), Crohn’s disease (CD), Grave’s disease (GD), Hashimoto thyroiditis (HT), multiple sclerosis (MS), primary biliary cirrhosis (PBC), psoriasis vulgaris (PSO), psoriatic arthritis (PSOAR), rheumatoid arthritis (RA), Sjögren’s syndrome (SS), systemic lupus erythematous (SLE), systemic sclerosis (SSC), type 1 diabetes (T1D), ulcerative colitis (UC), and vitiligo (VIT). At the time of this review, there are 179 published GWAS studies that have identified over 350 loci across these 17 autoimmune traits (11).
Due to linkage disequilibrium, significantly associated variants may be correlated and dependent. To properly count GWAS discoveries, we define loci iteratively using the following algorithm. For a given trait, we first rank variants with p-values < 5 × 10⁻⁸ from the GWAS catalog based on their p-values, from small to large. We define the first locus as a 1 million basepair window surrounding the most significant variant. We then remove all variants in the locus from the list of significant variants and repeat the above procedure to define the next locus until we exhaust all significant variants for the trait. SLE and MS have the most loci identified (159 and 155 loci respectively), while PSOAR and SS have the least (9 and 10 loci respectively) (Figure 1A). This disparity could be due to the number of reported studies, sample sizes of each study, heritability of the disorder. It also depends on the effect sizes of causative genetic variants. Some variants involved in certain disorders may have large effect sizes. Individuals carrying the variants will almost surely develop disease. Most other variants have moderate effect sizes, and only slightly increase the disease risk.
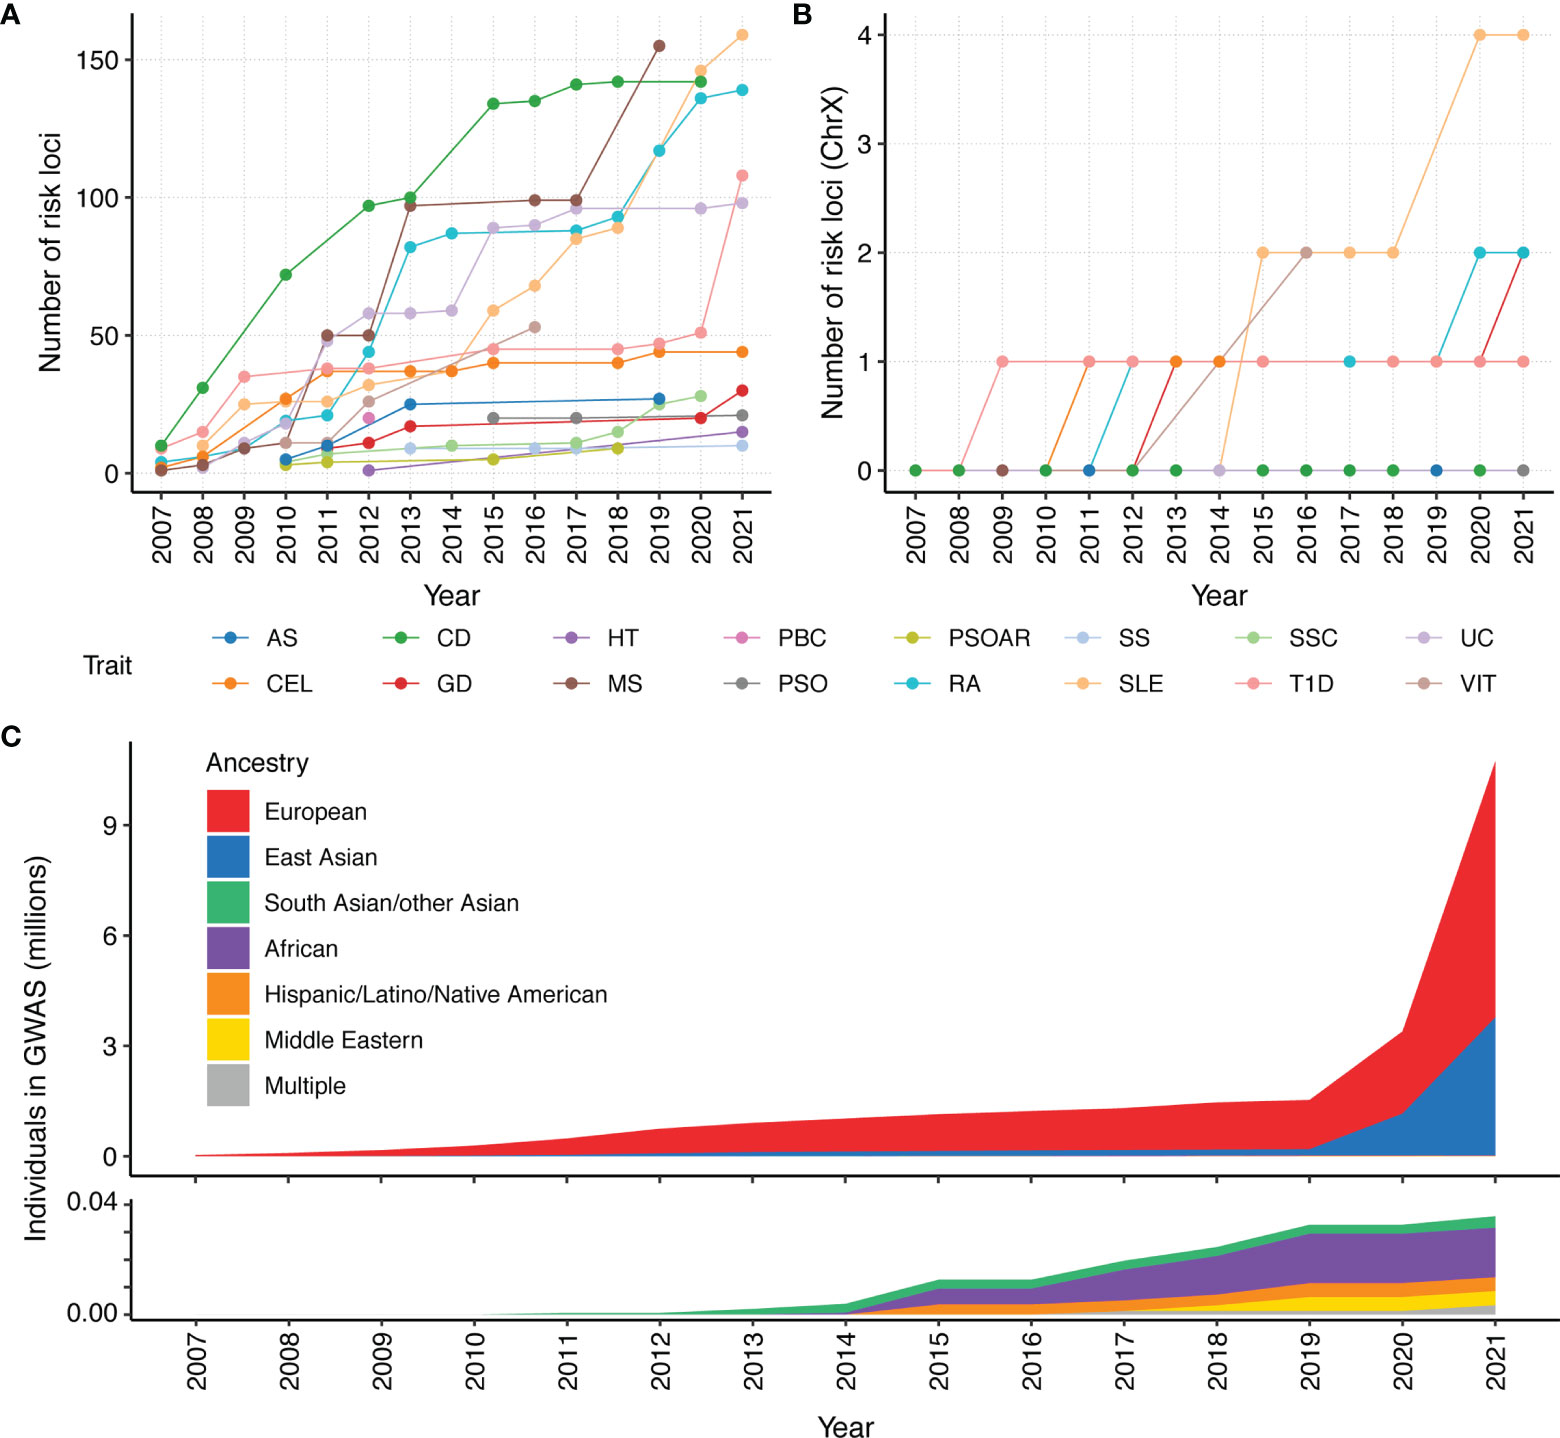
Figure 1 Number of risk loci identified by GWAS for 16 autoimmune traits and ancestry composition per year since 2007. We count the cumulative number of reported loci in GWAS catalog. Each locus is defined as a 1 million basepair window surrounding a genome-wide association signal (p < 5×10⁻⁸). All significant variants within a 1 million basepair window are attributed to a single locus. The cumulative number of unique loci that were identified in a year were calculated for the (A) whole genome and (B) chromosome X. Given that the X chromosome represents approximately 5% of the genome, the paucity of X GWAS loci for most autoimmune disorders makes it clear that the X chromosome is understudied. (C) Cumulative assessment of GWAS participants by ancestry over time, according to GWAS catalog. A majority of current GWAS studies are from European ancestry. As people of European ancestry only account for 16% of the population, the non-European population remain under-represented.
GWAS have found pervasively shared genetic basis among autoimmune traits (12, 13). This finding has led to great interest in jointly analyzing GWAS results from different autoimmune traits. For example, Acosta-Herrera et al. conducted the first cross-disease meta-analysis of seropositive rheumatic diseases (SSC, SLE, RA, and idiopathic inflammatory myopathies) (14). This joint analysis enabled identification of five shared immune-related loci that had not been previously associated with these individual diseases. As another example, Márquez et al. performed meta-analysis on data from CEL, RA, SSC, and T1D. This not only allowed them to identify novel genome-wide associations, but also to propose new candidate treatments through drug repositioning analysis (15).
GWAS has also helped reveal the genetic etiology of disease subtypes, which is important given the extensive clinical heterogeneity. For example, Chung et al. performed a GWAS to identify risk loci associated with anti-dsDNA autoantibody production in SLE patients (16). They observed that previously identified SLE susceptibility loci are associated with higher autoantibody production in anti-dsDNA positive SLE patients compared to anti-dsDNA negative SLE patients. This study also importantly underscores the need to identify genetic loci and non-genetic factors in autoantibody-negative SLE patients.
Despite the success of GWAS in characterizing autoimmune diseases, there are areas for further improvement. For example, it is important to identify sex-specific variants, particularly as many autoimmune diseases have a sex bias that are not fully explained by hormonal differences between males and females. For example, the incidence of SS, SLE, HT, GD, scleroderma, myasthenia gravis, PBC, and RA are female biased (17), while T1D and AS are male biased (18). There are also disorders that are not sex biased, such as UC and CD (19). Currently, most studies still pool both sexes together, with little effort to identify whether there is heterogeneity in disease susceptibility variants between female and male (20). Very few studies include chromosome X in their analysis, which is an important omission that needs to be further studied (Figure 1B). Inclusion and in-depth analysis of chromosome X and its relation to autoimmune diseases are especially important for sex-biased diseases, e.g., most of SLE and SS cases are females.
In addition, current GWAS studies primarily focused on samples of European ancestry, and thus lack ancestral diversity (Figure 1C). This is a rather unfortunate omission, as many autoimmune diseases are more prevalent in non-European populations (21). The lack of diversity hinders our understanding of the etiology of autoimmune diseases. Multi-ancestry genetic studies are in great need for further discovery and refinement of disease-associated loci (22). There have been limited multi-ancestry meta-analysis efforts for SLE, RA, CEL, SSC, and T1D. These studies have helped identify novel risk loci (15, 23–32) and improve our understanding of these autoimmune diseases (23, 26, 30, 33).
Advances in GWAS of autoimmune diseases have helped reveal biological mechanisms underlying autoimmunity. Another application for GWAS results is to predict whether an individual is at a risk of developing a disease using his/her genotype. A polygenic risk score (PRS) aggregates many risk variants identified from GWAS to formulate a score that predicts an individual’s risk for a certain disease. If the score is high in comparison to the population of healthy individuals, the patient has a high probability of developing the disease. Identifying individuals at risk can influence clinical decisions, including frequent monitoring, early detection and/or early intervention before the disease fully develops.
Several methods and strategies existed for creating PRS models (Figure 2 and Table 1). In general, a base GWAS summary statistic and ancestry-matched linkage disequilibrium (LD) reference panel are necessary to develop the ancestry-specific PRS model. When LD information is not available for the individuals analyzed in the GWAS, a LD reference panel from major public genomic resources [e.g. 1000 Genomes Project (61), Haplotype Reference Consortium (62)] can be used as a proxy. Some PRS methods require estimating tuning parameters, thus need an additional validation dataset (Table 1).
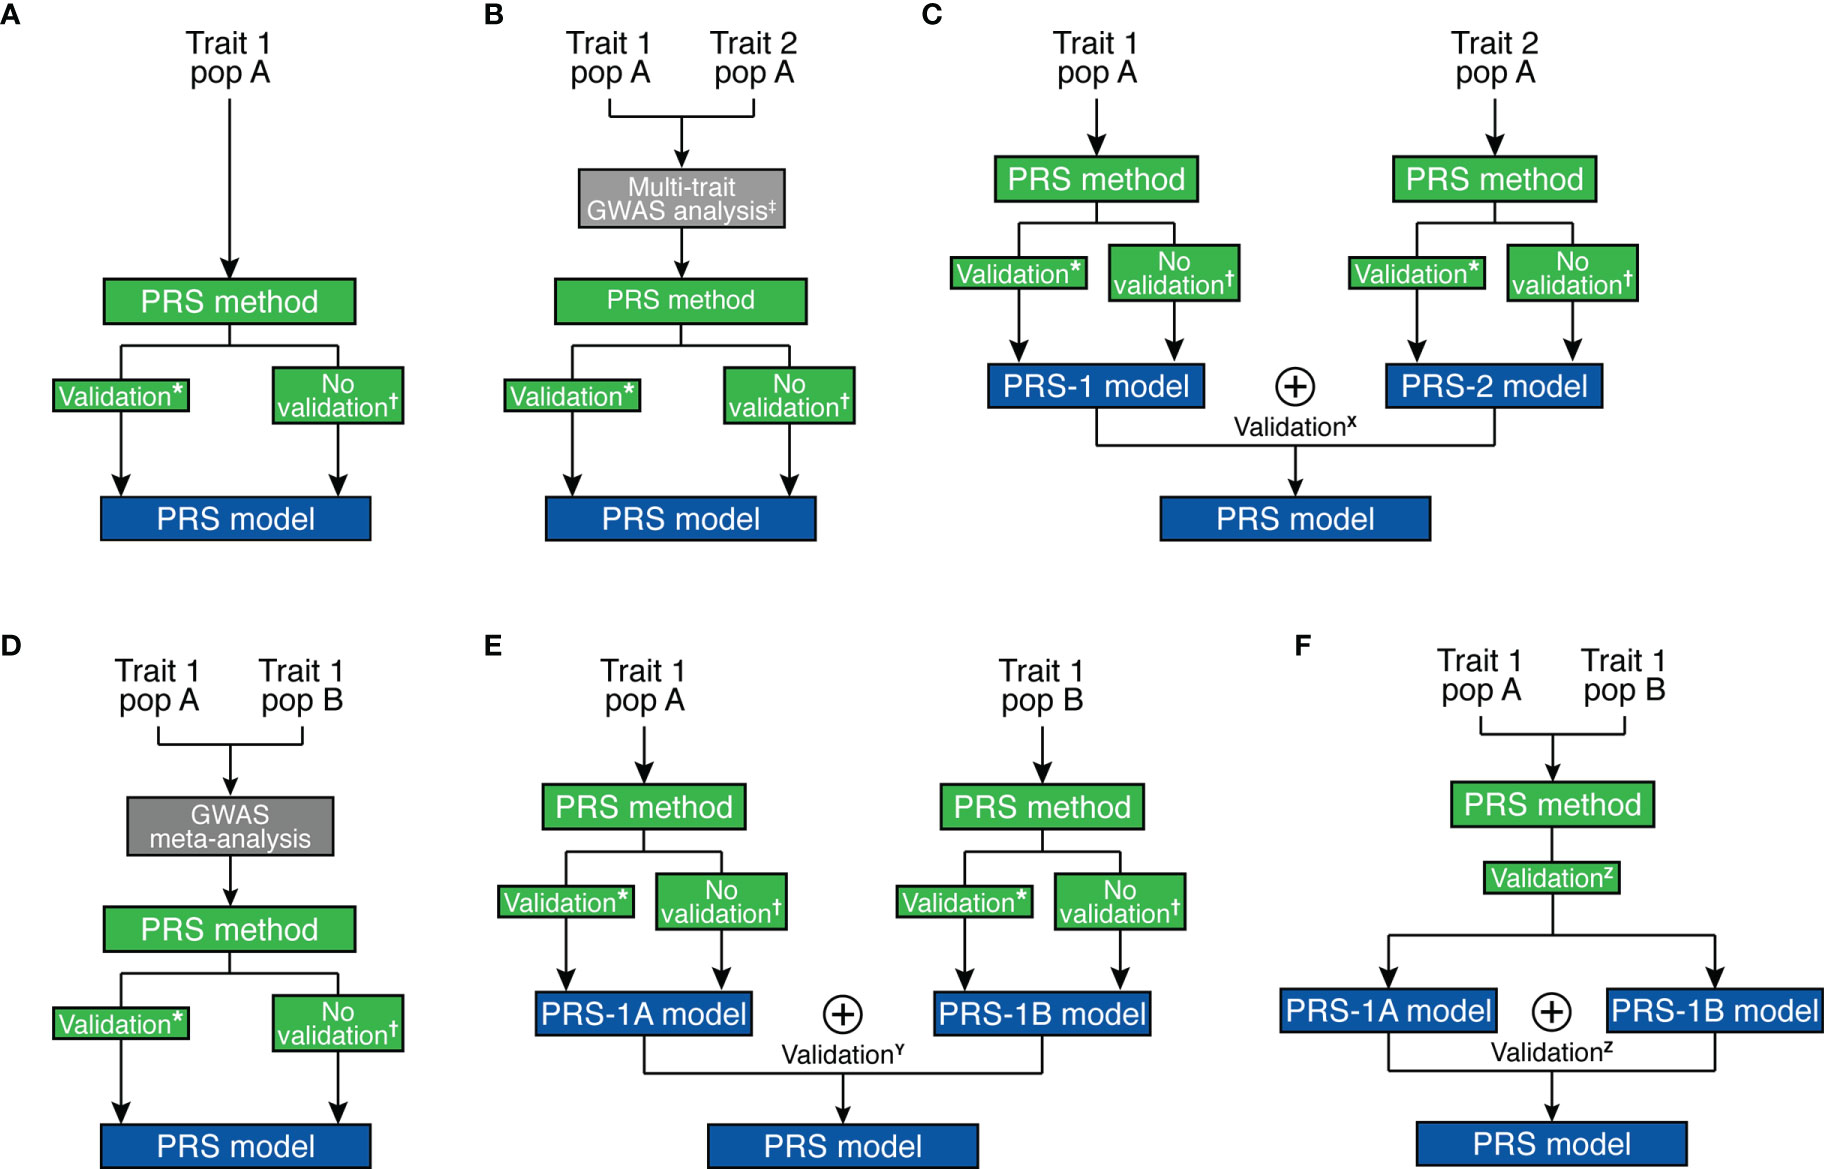
Figure 2 Overview of strategies for polygenic risk score model development. (A) Single-trait and single-ancestry framework. (B) Multi-trait (at GWAS level) and single-ancestry framework. (C) Multi-trait (at PRS model level) and single-ancestry framework. (D) Single-trait and multi-ancestry (at GWAS level) framework. (E) Single-trait and multi-ancestry (at PRS model level) framework. (F) Single-trait and multi-ancestry (at both levels) framework. *Pruning and Thresholding, PRSice, Pruning and Thresholding with functionally-informed LASSO shrinkage, AnnoPred, BayesR, GBLUP, JAMPRED, LDpred/LDpred2, LDpred-funct, PRS-CS, LASSOSUM. †PUMAS, GCTA/SBLUP, GCTB/SBayesR, LDpred-inf, LDpred-funct-inf, PRS-CS-auto, LASSOSUM-pseudovalidation. ‡MTAG, wMT-GWAS, Genomic SEM. X MPS, wMT-SBLUP. Y MultiPRS, PolyPred+. Z PRS-CSx. ⊕ represents the “stacking” method to combine different risk scores.
Table 1 A list of polygenic risk score and other relevant methods.
For the remaining of the section, we will review some methodological advances and challenges of the calculation of PRS for interested readers. Readers who are more interested in applications can safely ignore them and advance to the next section.
The most basic PRS method is pruning and thresholding, also known as clumping and thresholding, which involves two filtering steps. Specifically, the algorithm iteratively: 1) removes variants that are correlated with the top variant within the locus [pruning (37)] and 2) removes variants with a P-value larger than a certain threshold [thresholding (38)]. More sophisticated methods, such as LDpred (46), LDpred2 (47), BayesR (43), and PRS-CS (49) also perform shrinkage estimation by fitting the model using Bayesian methods and using a prior to model the effect size distribution of SNPs in the genome, which allows borrowing strength across different variants. More recently, AnnoPred (42) and LDpred-funct (48) methods further allow incorporation of functional priors to prioritize SNPs located within functionally-annotated regions. Another important class of methods uses penalized regression to build prediction models [e.g. LASSO regression in LASSOSUM (50)], which can be computationally more efficient than Bayesian methods.
Due to the pervasive genetic sharing between different autoimmune diseases, incorporating GWAS datasets from genetically correlated traits may improve the accuracy of genetic effect estimates, which will in turn improve the prediction accuracy of the PRS model. This is particularly appealing for autoimmune diseases with low prevalence. As it is often difficult to collect enough number of cases for less prevalent disorders, borrowing strength from other genetically-correlated autoimmune diseases is beneficial. For example, SLE is a rare autoimmune disease that is clinically and genetically known to overlap with RA and SSC (63, 64). Multi-trait PRS analysis can be performed at two different stages. First, multi-trait association methods [e.g., MTAG (34), wMT-GWAS (35), Genomic SEM (36)] can be used to improve marginal effect estimates, which we can use with other prediction methods to improve prediction accuracy (Figure 2B). Alternatively, “stacking” based methods create a weighted combination of PRS for different traits to enhance prediction accuracy, e.g., MPS (57), wMT-SBLUP (35). Stacking-based methods require a validation dataset to estimate weights to combine different PRS (Figure 2C).
Another important aspect of the PRS model is the transferability of the model across all populations. Currently, ~79% of all GWAS participants are of European descent (Figure 1C), which only make up for 16% of the global population. The PRS models developed for individuals of European ancestry often have reduced accuracy for prediction in non-European ancestries (65). Poor PRS transferability may be due to linkage disequilibrium differences, allele frequency differences, causal effect-size differences, and heritability differences between ancestries (59). There is great interest to develop transferable PRS integrating multi-ancestry genetic studies. There are several approaches to integrate multi-ancestry datasets for PRS prediction.
First, multi-ancestry meta-analysis of GWAS can improve marginal genetic effect estimates, which is used for a prediction model to improve prediction accuracy (Figure 2D). A second possible approach also uses “stacking” methods to combine PRS models [e.g., MultiPRS (58), PolyPred+ (59)] similar to multi-phenotype analysis (Figure 2E). Finally, multi-ancestry meta-analysis and stacking methods can both be applied [e.g., PRS-CSx (60)] (Figure 2F). The transferability of PRS depends on the target population and can be improved by prioritizing functional variants (66). For example, Ishigaki et al. demonstrated that the PRS performance for rheumatoid arthritis is comparable between European and East Asian populations when incorporating functional information to prioritize causal variants (67). Importantly, it still remains an open question how to best combine multi-ancestry genetic data to create a better and more transferable PRS model. Despite the advances brought by these methodologies, it is essential to enlarge non-European GWAS sample sizes. For further discussion on development, evaluation, and application of PRS, readers may refer to more thorough reviews on this topic, e.g., Chatterjee et al. (68) and Choi et al. (69).
At the time of this review, 48 PRS models have been deposited in Polygenic Score (PGS) Catalog for risk prediction for 16 autoimmune traits (Figure 3) (70). CEL, T1D, and SLE have the most PRS models, while to date ATD has no PRS models yet (Figure 3A). The most commonly used method for building the PRS model across these studies is penalized regression (50, 71–73), followed by weighted sum of the variants from established genes (e.g., from variants that reach genome-wide significance, candidate genes, etc., in contrast to scores constructed based on all variants from GWAS) (Figure 3B). The least used methods were pruning and thresholding (37, 38) (Figure 3B). Lastly, depending on the method, the number of SNPs used in the PRS model varied. LDpred2, a method assuming polygenicity, retained the most SNPs, ranging from 22,026 to as many as 566,637, while other variable selection methods used less than 2,000 SNPs in the PRS. The number of retained SNPs also critically depends on the genetic architecture of the disease. PRS of highly polygenic traits tend to contain many SNPs, while the traits that are more similar to a monogenic disorder use fewer SNPs in the PRS (Figure 4). Using GWAS data from UK biobank (74) along with LASSOSUM method (50), we demonstrated that the Spearman’s correlations between number of loci and number of genetic variants in polygenic risk score models are significantly and positively correlated for both quantitative/ordinal traits (Figure 4A; Spearman’s correlation = 0.74, p<2.2×10⁻¹⁶) and binary/categorical traits (Figure 4B; Spearman’s correlation = 0.29, p=4.8×10⁻¹⁰). Interestingly, a few outlier traits have many SNPs in the PRS model but relatively few GWAS loci. They are often the ones that were not extensively studied, and the sample sizes are relatively smaller. Thus, the number of known loci were relatively modest.
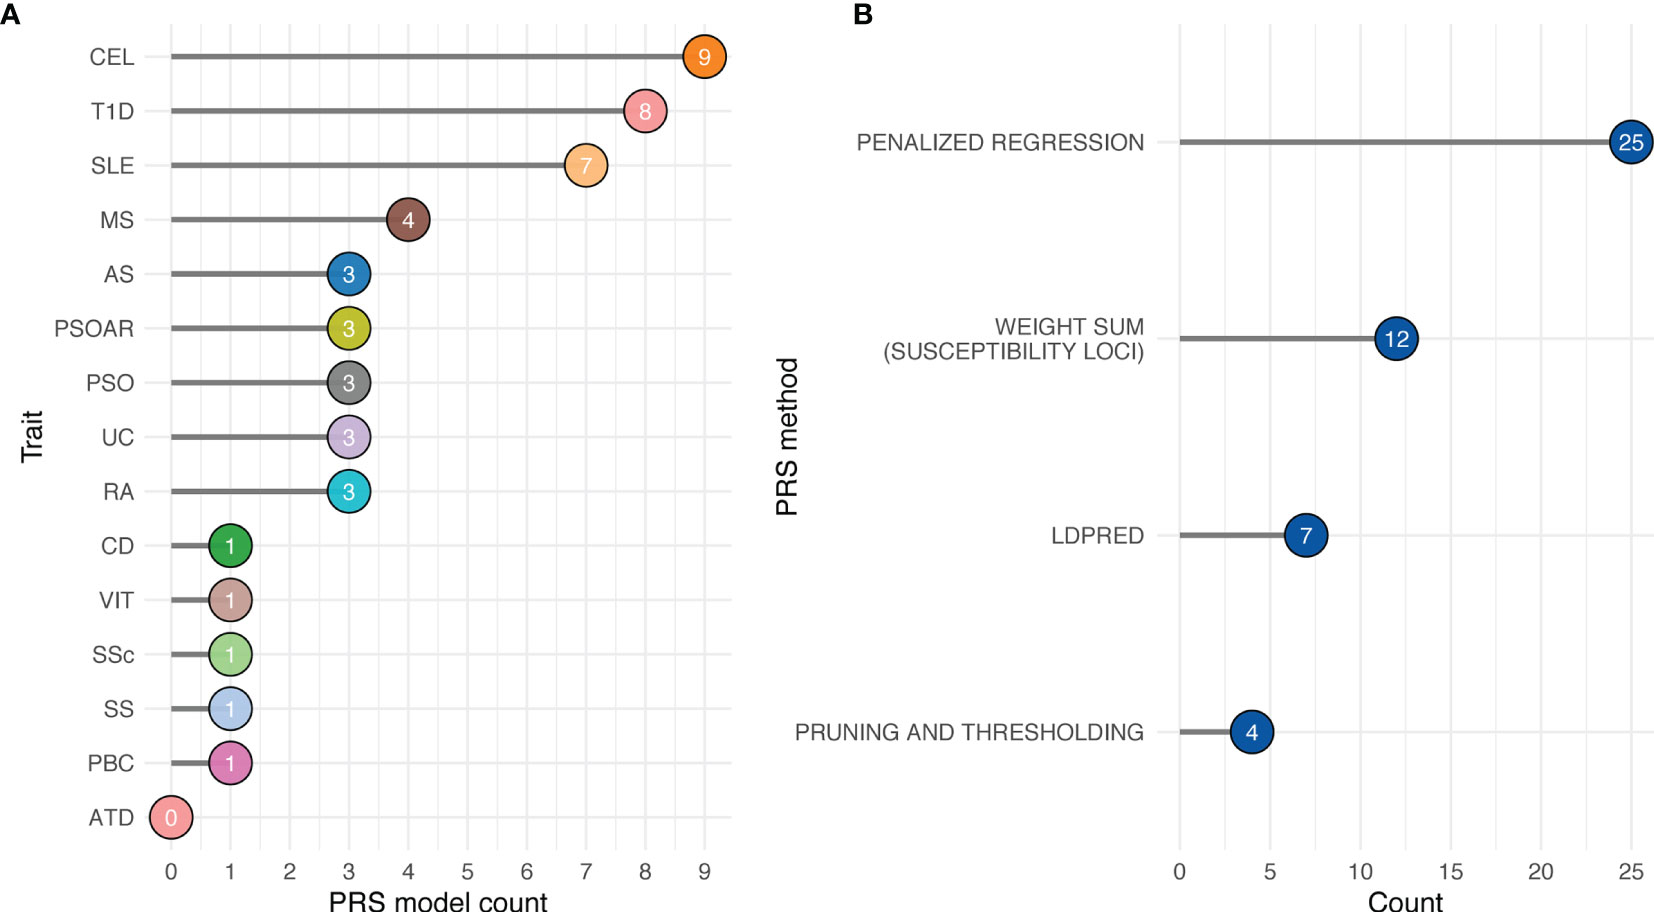
Figure 3 Availability of autoimmune PRS models from Polygenic Score Catalog. (A) Number of available PRS models by trait. (B) Number of available PRS models by PRS method. Penalized regression: LASSOSUM, snpnet, L1-penalized support vector machine. Weighted sum (susceptibility loci): GWAS significant variants, HLA-specific significant variants, GWAS fine-mapped variants, and SNPs curated from literatures. LDpred: LDpred and LDpred2.
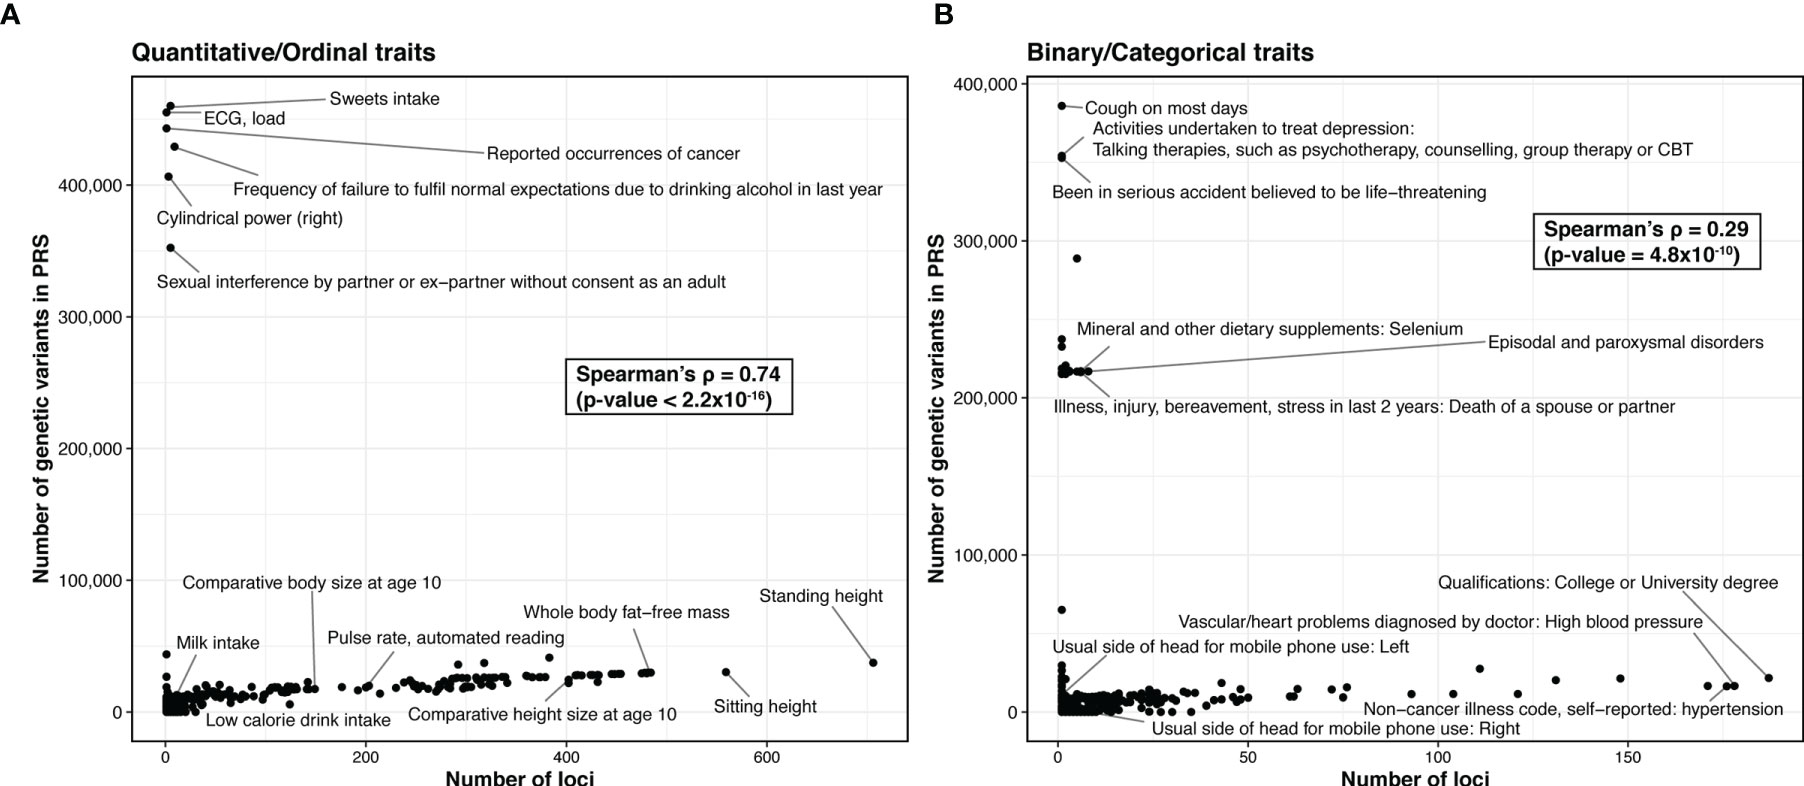
Figure 4 Comparison of the trait polygenicity and the PRS model size. (A) Quantitative/ordinal traits. (B) Binary/categorical traits. We apply LASSOSUM across GWAS analysis of the UK biobank data (round 2) from http://www.nealelab.is/uk-biobank/. We exclude traits that have no significant variant (p < 5×10⁻⁸). For binary/categorical traits, we further excluded traits with number of cases ≤5000. In total, we created polygenic risk score models for 338 quantitative/ordinal traits and 454 binary/categorical traits. We used number of loci identified in UK Biobank as a proxy for the degree of trait polygenicity.
The most common PRS model performance metric reported is classification accuracy, as measured by the area under the curve of receiver-operating characteristic curve (ROC-AUC). Other studies report risk prediction performance as odds ratio or fold change of the proportion of cases to control in the top Xth percentile (e.g., top 20th percentile) of the PRS distribution and compare it with the middle or bottom Xth percentile of the PRS distribution. Odds ratio or fold change are hard to compare between studies, as different studies use different percentile thresholds. We will only discuss PRS model performance for the studies that reported ROC-AUC.
The PRS models for T1D and CEL showed the best performance when compared to other diseases, which can be attributable to their relatively simple genetic architectures. Every PRS model of T1D had a ROC-AUC greater than 0.75, and some models had a ROC-AUC value greater than 0.9. PRS models for other autoimmune traits had moderate performance, with ROC-AUC that were greater than 0.6 but usually below 0.75. Almost all PRS models included age, sex, array type (when available), and genetic principal components as covariates in their models.
In addition to utilizing PRS for predicting disease incidence, there is also great interest in investigating the association between a high PRS and disease severity. Reid et al. observed that a high PRS for SLE was associated with earlier disease onset, increased risk of organ damage, renal dysfunction, and all-cause mortality (75). Chen et al. also observed that a high PRS for SLE correlates with poorer prognostic factors like earlier age-of-onset and lupus nephritis (76). Oram et al. observed the PRS for T1D predicted progression to insulin deficiency in diabetic young adults (77). These studies validate the clinical utility of PRS to identify individuals with high risk and susceptible to poor outcomes.
The performance of the PRS models should be interpreted with caution. Most of the PRS models were developed and evaluated using data from European ancestry populations. Due to this bias, several studies have reported decreased predictive performance when applying PRS models from European ancestry to other ancestries. Wang et al. conducted a GWAS for SLE using the Chinese population with a sample size that matches the levels of European studies (78). They developed Chinese and European specific PRS models, and these ancestry-matched models significantly outperformed ancestry-mismatched models by an average ROC-AUC of 0.14. Similarly, a PRS for T1D developed using a European ancestry population performed comparably in non-Hispanic European and Hispanic ancestries (ROC-AUC 0.86 and 0.90 respectively), but it did not perform as well in African Americans (ROC-AUC 0.75) (79). Following this observation, Onengut-Gumuscu et al. conducted a GWAS for T1D on African-ancestry participants and an African-specific PRS model improved prediction (ROC-AUC 0.87) compared to a European-based PRS model (80). Privé et al. investigated the portability of PRS models for 245 traits developed using individuals from Northwestern European ancestry in 9 different ancestry groups (72). Their analysis included several autoimmune traits: hypothyroidism, T1D, MS, UC, CD, SLE, and PSO. They observed an overall significant reduction in the accuracy of PRS models when applied to individuals from other ancestries and the performance systematically decreased as the ancestries became genetically distant from the training data used to train PRS models. Furthermore, some studies had a small number of cases in the external validation dataset (less than 100 samples). Performance metrics like ROC-AUC could be unreliable when there is a substantial imbalance between cases and controls.
GWAS to date have identified numerous loci associated with different autoimmune diseases, most of which have small effect sizes. PRS enabled by large GWAS have provided an essential tool for early diagnosis and risk prediction. However, PRS only accounts for a portion of the genetic contribution, and does not fully capture other demographic, lifestyle, environmental, and clinical risk factors that may influence disease risk over time.
Besides PRS, it is also important to incorporate other clinical and demographic variables in the prediction models. For example, many autoimmune diseases have different prevalence between sexes, age group, and ancestries (81): CD and UC affect men and women equally, while SS, SLE, GD, HT, RA, and MS have a greater incidence in female (17). CD and UC have a high incidence in Caucasians and Hispanics (82), while GD is more frequent in the Asian population and less in Sub-Saharan Africans (83). Lifestyle and environmental features also modulate autoimmune disease risk. For instance, cigarette smoking is associated with increased risk of developing GD (84), SLE (85), RA (86), CD (87), and AS (88), but has shown to be associated with reduced risk of SS (89), UC (90), and CEL (91). Other factors like alcohol consumption and exercise habits also play an important role in the risk of developing autoimmune disorders (92). Some of these data are included in electronic health records (EHRs) that are now being adopted worldwide. EHRs are also a valuable source of patient history and clinical data, especially measurements for biological features that are associated with over disease onset. Physical measurements like blood pressure or body mass index, or serological measurements of antibodies or protein biomarkers provide a set of complementary information that we can use to predict the risk of disease development in addition to genetics. We believe integration of these factors with PRS could provide further improvement in estimation of disease risk.
Although limited, efforts are already underway to integrate clinical risk factors with PRS. Knevel et al. developed genetic probability tool (G-PROB) to calculate the genetic-probability (G-probabilities) of multiple related inflammatory arthritis-causing conditions (rheumatoid arthritis, systemic lupus erythematosus, spondyloarthropathy, psoriatic arthritis, and gout) in patients with unexplained joint swelling, as these patients are often misdiagnosed (10). By jointly analyzing probabilities from all diseases, their method was able to attain a reasonable diagnostic accuracy with ROC-AUC of 0.84. They further observed 35% of the patients were misclassified at the initial visit. In comparison, in 53% of patients, the disease with the highest G-probability corresponded to the final diagnosis. In 77% of patients, the final diagnosis was within the top two diseases with highest G-probabilities. This demonstrated that integration of their method with clinical information could significantly improve differential diagnosis.
Similarly, by combining a PRS of SSC with demographic and immunological parameters, Castillo et al. increased model performance by achieving ROC-AUC = 0.787 compared to ROC-AUC = 0.673 with PRS alone (93). Abraham et al. developed a PRS for CEL specific to high-risk individuals with HLA-DQ2.5 risk haplotypes, a marker that is sensitive but not specific (94). The targeted PRS model (ROC-AUC = 0.718) outperformed a PRS model that had been constructed to distinguish all CEL patients (ROC-AUC = 0.679). These studies demonstrate the utility of integrating additional risk factors with PRS, as it allows stratification of the population into different risk categories that will allow better and personalized clinical decision making.
Finally, we have provided a list of routine clinical biomarkers that are typically screened to help autoimmune disease diagnosis (Table 2). Systematic integration of PRS with routine clinical biomarkers is an important next step for PRS to become a useful clinical screening tool.
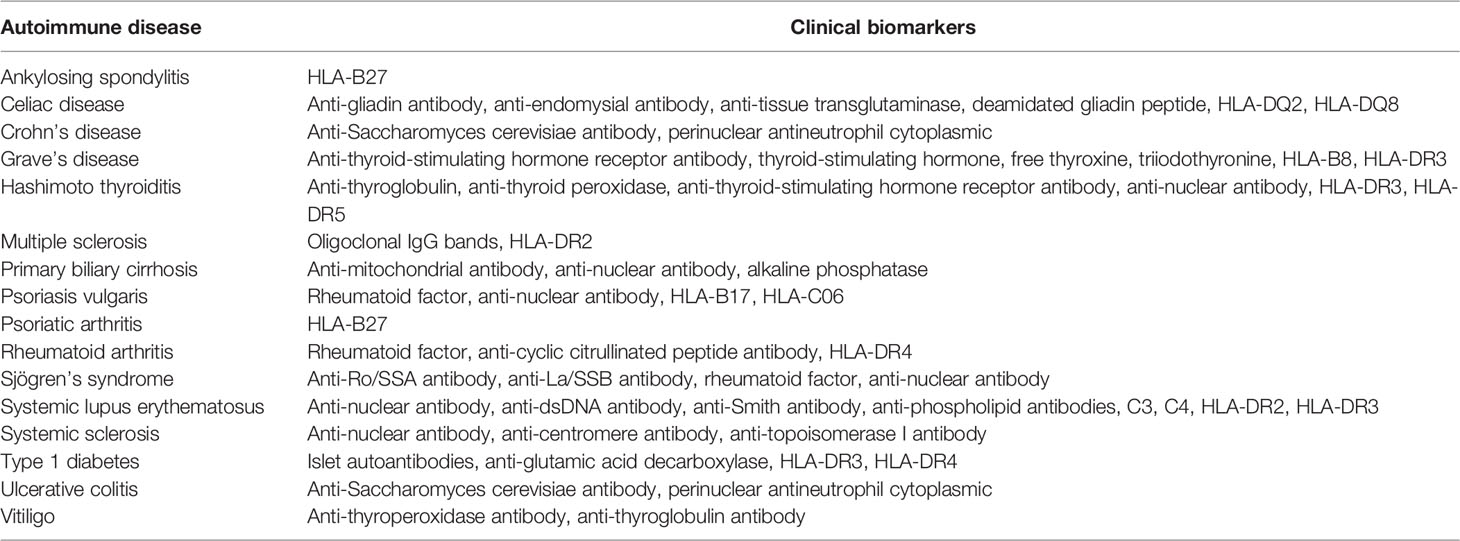
Table 2 A list of clinical biomarkers for each autoimmune disease.
CK, HM, and DL wrote the first draft of the manuscript. LC, NO, and BJ wrote sections of the manuscript. All authors contributed to manuscript revision, read, and approved the submitted version.
This work was supported by the National Institutes of Health grants R56HG011035, R01GM126479, R21AI160138, R03OD032630, T32GM118294, T32LM012415, and U01AR071077. This work was also funded by Lupus Research Alliance and CURE funds from the Pennsylvania Department of Health. This work was also funded in part by generous support from Robert and Sevia Finkelstein. The funders were not involved in the study design, collection, analysis, interpretation of data, the writing of this article or the decision to submit it for publication.
The authors declare that the research was conducted in the absence of any commercial or financial relationships that could be construed as a potential conflict of interest.
All claims expressed in this article are solely those of the authors and do not necessarily represent those of their affiliated organizations, or those of the publisher, the editors and the reviewers. Any product that may be evaluated in this article, or claim that may be made by its manufacturer, is not guaranteed or endorsed by the publisher.
1. Wang L, Wang FS, Gershwin ME. Human Autoimmune Diseases: A Comprehensive Update. J Intern Med (2015) 278(4):369–95. doi: 10.1111/joim.12395
2. Cooper GS, Stroehla BC. The Epidemiology of Autoimmune Diseases. Autoimmun Rev (2003) 2(3):119–25. doi: 10.1016/s1568-9972(03)00006-5
3. National Institutes of Health (the Autoimmune Diseases Coordinating Committee). Progress in Autoimmune Diseases Research. (Bethesda, Maryland: National Institutes of Health) (2005).
4. Goodnow CC, Sprent J, Fazekas de St Groth B, Vinuesa CG. Cellular and Genetic Mechanisms of Self Tolerance and Autoimmunity. Nature (2005) 435(7042):590–7. doi: 10.1038/nature03724
5. Kuchroo VK, Ohashi PS, Sartor RB, Vinuesa CG. Dysregulation of Immune Homeostasis in Autoimmune Diseases. Nat Med (2012) 18(1):42–7. doi: 10.1038/nm.2621
6. Janeway CA, Travers Jr P, Walport M, Shlomchik MJ. Immunobiology. In: The Immune System in Health and Disease, 5th Edition. (New York: Garland Science) (2001).
7. Cho JH, Feldman M. Heterogeneity of Autoimmune Diseases: Pathophysiologic Insights From Genetics and Implications for New Therapies. Nat Med (2015) 21(7):730–8. doi: 10.1038/nm.3897
8. Gardner TB, Levy MJ, Takahashi N, Smyrk TC, Chari ST. Misdiagnosis of Autoimmune Pancreatitis: A Caution to Clinicians. Am J Gastroenterol (2009) 104(7):1620–3. doi: 10.1038/ajg.2008.89
9. Narain S, Richards HB, Satoh M, Sarmiento M, Davidson R, Shuster J, et al. Diagnostic Accuracy for Lupus and Other Systemic Autoimmune Diseases in the Community Setting. Arch Intern Med (2004) 164(22):2435–41. doi: 10.1001/archinte.164.22.2435
10. Knevel R, le Cessie S, Terao CC, Slowikowski K, Cui J, Huizinga TWJ, et al. Using Genetics to Prioritize Diagnoses for Rheumatology Outpatients With Inflammatory Arthritis. Sci Transl Med (2020) 12(545):eaay1548. doi: 10.1126/scitranslmed.aay1548
11. Buniello A, MacArthur JAL, Cerezo M, Harris LW, Hayhurst J, Malangone C, et al. The Nhgri-Ebi Gwas Catalog of Published Genome-Wide Association Studies, Targeted Arrays and Summary Statistics 2019. Nucleic Acids Res (2019) 47(D1):D1005–d12. doi: 10.1093/nar/gky1120
12. Richard-Miceli C, Criswell LA. Emerging Patterns of Genetic Overlap Across Autoimmune Disorders. Genome Med (2012) 4(1):6. doi: 10.1186/gm305
13. Zhernakova A, van Diemen CC, Wijmenga C. Detecting Shared Pathogenesis From the Shared Genetics of Immune-Related Diseases. Nat Rev Genet (2009) 10(1):43–55. doi: 10.1038/nrg2489
14. Acosta-Herrera M, Kerick M, González-Serna D, Wijmenga C, Franke A, Gregersen PK, et al. Genome-Wide Meta-Analysis Reveals Shared New Loci in Systemic Seropositive Rheumatic Diseases. Ann Rheum Dis (2019) 78(3):311–9. doi: 10.1136/annrheumdis-2018-214127
15. Márquez A, Kerick M, Zhernakova A, Gutierrez-Achury J, Chen WM, Onengut-Gumuscu S, et al. Meta-Analysis of Immunochip Data of Four Autoimmune Diseases Reveals Novel Single-Disease and Cross-Phenotype Associations. Genome Med (2018) 10(1):97. doi: 10.1186/s13073-018-0604-8
16. Chung SA, Taylor KE, Graham RR, Nititham J, Lee AT, Ortmann WA, et al. Differential Genetic Associations for Systemic Lupus Erythematosus Based on Anti-Dsdna Autoantibody Production. PloS Genet (2011) 7(3):e1001323. doi: 10.1371/journal.pgen.1001323
17. Billi AC, Kahlenberg JM, Gudjonsson JE. Sex Bias in Autoimmunity. Curr Opin Rheumatol (2019) 31(1):53–61. doi: 10.1097/bor.0000000000000564
18. Rubtsova K, Marrack P, Rubtsov AV. Sexual Dimorphism in Autoimmunity. J Clin Invest (2015) 125(6):2187–93. doi: 10.1172/JCI78082
19. Ngo ST, Steyn FJ, McCombe PA. Gender Differences in Autoimmune Disease. Front Neuroendocrinol (2014) 35(3):347–69. doi: 10.1016/j.yfrne.2014.04.004
20. Porcu E, Medici M, Pistis G, Volpato CB, Wilson SG, Cappola AR, et al. A Meta-Analysis of Thyroid-Related Traits Reveals Novel Loci and Gender-Specific Differences in the Regulation of Thyroid Function. PloS Genet (2013) 9(2):e1003266. doi: 10.1371/journal.pgen.1003266
21. Roberts MH, Erdei E. Comparative United States Autoimmune Disease Rates for 2010-2016 by Sex, Geographic Region, and Race. Autoimmun Rev (2020) 19(1):102423. doi: 10.1016/j.autrev.2019.102423
22. Ishigaki K, Akiyama M, Kanai M, Takahashi A, Kawakami E, Sugishita H, et al. Large-Scale Genome-Wide Association Study in a Japanese Population Identifies Novel Susceptibility Loci Across Different Diseases. Nat Genet (2020) 52(7):669–79. doi: 10.1038/s41588-020-0640-3
23. Morris DL, Sheng Y, Zhang Y, Wang YF, Zhu Z, Tombleson P, et al. Genome-Wide Association Meta-Analysis in Chinese and European Individuals Identifies Ten New Loci Associated With Systemic Lupus Erythematosus. Nat Genet (2016) 48(8):940–6. doi: 10.1038/ng.3603
24. Alarcón-Riquelme ME, Ziegler JT, Molineros J, Howard TD, Moreno-Estrada A, Sánchez-Rodríguez E, et al. Genome-Wide Association Study in an Amerindian Ancestry Population Reveals Novel Systemic Lupus Erythematosus Risk Loci and the Role of European Admixture. Arthritis Rheumatol (2016) 68(4):932–43. doi: 10.1002/art.39504
25. Yang W, Tang H, Zhang Y, Tang X, Zhang J, Sun L, et al. Meta-Analysis Followed by Replication Identifies Loci in or Near Cdkn1b, Tet3, Cd80, Dram1, and Arid5b as Associated With Systemic Lupus Erythematosus in Asians. Am J Hum Genet (2013) 92(1):41–51. doi: 10.1016/j.ajhg.2012.11.018
26. Ha E, Bae SC, Kim K. Large-Scale Meta-Analysis Across East Asian and European Populations Updated Genetic Architecture and Variant-Driven Biology of Rheumatoid Arthritis, Identifying 11 Novel Susceptibility Loci. Ann Rheum Dis (2021) 80(5):558–65. doi: 10.1136/annrheumdis-2020-219065
27. Stahl EA, Raychaudhuri S, Remmers EF, Xie G, Eyre S, Thomson BP, et al. Genome-Wide Association Study Meta-Analysis Identifies Seven New Rheumatoid Arthritis Risk Loci. Nat Genet (2010) 42(6):508–14. doi: 10.1038/ng.582
28. Zhernakova A, Stahl EA, Trynka G, Raychaudhuri S, Festen EA, Franke L, et al. Meta-Analysis of Genome-Wide Association Studies in Celiac Disease and Rheumatoid Arthritis Identifies Fourteen Non-HLA Shared Loci. PloS Genet (2011) 7(2):e1002004. doi: 10.1371/journal.pgen.1002004
29. López-Isac E, Acosta-Herrera M, Kerick M, Assassi S, Satpathy AT, Granja J, et al. Gwas for Systemic Sclerosis Identifies Multiple Risk Loci and Highlights Fibrotic and Vasculopathy Pathways. Nat Commun (2019) 10(1):4955. doi: 10.1038/s41467-019-12760-y
30. Terao C, Kawaguchi T, Dieude P, Varga J, Kuwana M, Hudson M, et al. Transethnic Meta-Analysis Identifies Gsdma and Prdm1 as Susceptibility Genes to Systemic Sclerosis. Ann Rheum Dis (2017) 76(6):1150–8. doi: 10.1136/annrheumdis-2016-210645
31. Bradfield JP, Qu HQ, Wang K, Zhang H, Sleiman PM, Kim CE, et al. A Genome-Wide Meta-Analysis of Six Type 1 Diabetes Cohorts Identifies Multiple Associated Loci. PloS Genet (2011) 7(9):e1002293. doi: 10.1371/journal.pgen.1002293
32. Barrett JC, Clayton DG, Concannon P, Akolkar B, Cooper JD, Erlich HA, et al. Genome-Wide Association Study and Meta-Analysis Find That Over 40 Loci Affect Risk of Type 1 Diabetes. Nat Genet (2009) 41(6):703–7. doi: 10.1038/ng.381
33. González-Serna D, Ochoa E, López-Isac E, Julià A, Degenhardt F, Ortego-Centeno N, et al. A Cross-Disease Meta-Gwas Identifies Four New Susceptibility Loci Shared Between Systemic Sclerosis and Crohn's Disease. Sci Rep (2020) 10(1):1862. doi: 10.1038/s41598-020-58741-w
34. Turley P, Walters RK, Maghzian O, Okbay A, Lee JJ, Fontana MA, et al. Multi-Trait Analysis of Genome-Wide Association Summary Statistics Using Mtag. Nat Genet (2018) 50(2):229–37. doi: 10.1038/s41588-017-0009-4
35. Maier RM, Zhu Z, Lee SH, Trzaskowski M, Ruderfer DM, Stahl EA, et al. Improving Genetic Prediction by Leveraging Genetic Correlations Among Human Diseases and Traits. Nat Commun (2018) 9(1):989. doi: 10.1038/s41467-017-02769-6
36. Grotzinger AD, Rhemtulla M, de Vlaming R, Ritchie SJ, Mallard TT, Hill WD, et al. Genomic Structural Equation Modelling Provides Insights Into the Multivariate Genetic Architecture of Complex Traits. Nat Hum Behav (2019) 3(5):513–25. doi: 10.1038/s41562-019-0566-x
37. Stahl EA, Wegmann D, Trynka G, Gutierrez-Achury J, Do R, Voight BF, et al. Bayesian Inference Analyses of the Polygenic Architecture of Rheumatoid Arthritis. Nat Genet (2012) 44(5):483–9. doi: 10.1038/ng.2232
38. Purcell SM, Wray NR, Stone JL, Visscher PM, O'Donovan MC, Sullivan PF, et al. Common Polygenic Variation Contributes to Risk of Schizophrenia and Bipolar Disorder. Nature (2009) 460(7256):748–52. doi: 10.1038/nature08185
39. Euesden J, Lewis CM, O'Reilly PF. Prsice: Polygenic Risk Score Software. Bioinformatics (2015) 31(9):1466–8. doi: 10.1093/bioinformatics/btu848
40. Choi SW, O'Reilly PF. Prsice-2: Polygenic Risk Score Software for Biobank-Scale Data. GigaScience (2019) 8(7):1–6 doi: 10.1093/gigascience/giz082
41. Shi J, Park JH, Duan J, Berndt ST, Moy W, Yu K, et al. Winner's Curse Correction and Variable Thresholding Improve Performance of Polygenic Risk Modeling Based on Genome-Wide Association Study Summary-Level Data. PloS Genet (2016) 12(12):e1006493. doi: 10.1371/journal.pgen.1006493
42. Hu Y, Lu Q, Powles R, Yao X, Yang C, Fang F, et al. Leveraging Functional Annotations in Genetic Risk Prediction for Human Complex Diseases. PloS Comput Biol (2017) 13(6):e1005589. doi: 10.1371/journal.pcbi.1005589
43. Moser G, Lee SH, Hayes BJ, Goddard ME, Wray NR, Visscher PM. Simultaneous Discovery, Estimation and Prediction Analysis of Complex Traits Using a Bayesian Mixture Model. PloS Genet (2015) 11(4):e1004969. doi: 10.1371/journal.pgen.1004969
44. VanRaden PM. Efficient Methods to Compute Genomic Predictions. J Dairy Sci (2008) 91(11):4414–23. doi: 10.3168/jds.2007-0980
45. Newcombe PJ, Nelson CP, Samani NJ, Dudbridge F. A Flexible and Parallelizable Approach to Genome-Wide Polygenic Risk Scores. Genet Epidemiol (2019) 43(7):730–41. doi: 10.1002/gepi.22245
46. Vilhjálmsson BJ, Yang J, Finucane HK, Gusev A, Lindström S, Ripke S, et al. Modeling Linkage Disequilibrium Increases Accuracy of Polygenic Risk Scores. Am J Hum Genet (2015) 97(4):576–92. doi: 10.1016/j.ajhg.2015.09.001
47. Privé F, Arbel J, Vilhjálmsson BJ. Ldpred2: Better, Faster, Stronger. Bioinformatics (2020) 36(22-23):5424–31. doi: 10.1093/bioinformatics/btaa1029
48. Márquez-Luna C, Gazal S, Loh P-R, Kim SS, Furlotte N, Auton A, et al. Incorporating Functional Priors Improves Polygenic Prediction Accuracy in Uk Biobank and 23andme Data Sets. Nat Commun (2021) 12(1):6052. doi: 10.1038/s41467-021-25171-9
49. Ge T, Chen CY, Ni Y, Feng YA, Smoller JW. Polygenic Prediction Via Bayesian Regression and Continuous Shrinkage Priors. Nat Commun (2019) 10(1):1776. doi: 10.1038/s41467-019-09718-5
50. Mak TSH, Porsch RM, Choi SW, Zhou X, Sham PC. Polygenic Scores Via Penalized Regression on Summary Statistics. Genet Epidemiol (2017) 41(6):469–80. doi: 10.1002/gepi.22050
51. Zhao Z, Yi Y, Song J, Wu Y, Zhong X, Lin Y, et al. Pumas: Fine-Tuning Polygenic Risk Scores With Gwas Summary Statistics. Genome Biol (2021) 22(1):257. doi: 10.1186/s13059-021-02479-9
52. Yang J, Lee SH, Goddard ME, Visscher PM. Gcta: A Tool for Genome-Wide Complex Trait Analysis. Am J Hum Genet (2011) 88(1):76–82. doi: 10.1016/j.ajhg.2010.11.011
53. Robinson MR, Kleinman A, Graff M, Vinkhuyzen AAE, Couper D, Miller MB, et al. Genetic Evidence of Assortative Mating in Humans. Nat Hum Behav (2017) 1(1):16. doi: 10.1038/s41562-016-0016
54. Zeng J, de Vlaming R, Wu Y, Robinson MR, Lloyd-Jones LR, Yengo L, et al. Signatures of Negative Selection in the Genetic Architecture of Human Complex Traits. Nat Genet (2018) 50(5):746–53. doi: 10.1038/s41588-018-0101-4
55. Lloyd-Jones LR, Zeng J, Sidorenko J, Yengo L, Moser G, Kemper KE, et al. Improved Polygenic Prediction by Bayesian Multiple Regression on Summary Statistics. Nat Commun (2019) 10(1):5086. doi: 10.1038/s41467-019-12653-0
56. Zhou G, Zhao H. A Fast and Robust Bayesian Nonparametric Method for Prediction of Complex Traits Using Summary Statistics. PloS Genet (2021) 17(7):e1009697. doi: 10.1371/journal.pgen.1009697
57. Krapohl E, Patel H, Newhouse S, Curtis CJ, von Stumm S, Dale PS, et al. Multi-Polygenic Score Approach to Trait Prediction. Mol Psychiatry (2018) 23(5):1368–74. doi: 10.1038/mp.2017.163
58. Márquez-Luna C, Loh PR, Price AL. Multiethnic Polygenic Risk Scores Improve Risk Prediction in Diverse Populations. Genet Epidemiol (2017) 41(8):811–23. doi: 10.1002/gepi.22083
59. Weissbrod O, Kanai M, Shi H, Gazal S, Peyrot WJ, Khera AV, et al. Leveraging Fine-Mapping and Multipopulation Training Data to Improve Cross-Population Polygenic Risk Scores. Nat Genet (2022) 54(4):450–8. doi: 10.1038/s41588-022-01036-9
60. Ruan Y, Anne Feng Y-C, Chen C-Y, Lam M, Stanley Global Asia I, Sawa A, et al. Improving Polygenic Prediction in Ancestrally Diverse Populations. Nature Genetics (2022) 54:573–80 doi: 10.1038/s41588-022-01054-7
61. Auton A, Brooks LD, Durbin RM, Garrison EP, Kang HM, Korbel JO, et al. A Global Reference for Human Genetic Variation. Nature (2015) 526(7571):68–74. doi: 10.1038/nature15393
62. McCarthy S, Das S, Kretzschmar W, Delaneau O, Wood AR, Teumer A, et al. A Reference Panel of 64,976 Haplotypes for Genotype Imputation. Nat Genet (2016) 48(10):1279–83. doi: 10.1038/ng.3643
63. Pouget JG, Han B, Wu Y, Mignot E, Ollila HM, Barker J, et al. Cross-Disorder Analysis of Schizophrenia and 19 Immune-Mediated Diseases Identifies Shared Genetic Risk. Hum Mol Genet (2019) 28(20):3498–513. doi: 10.1093/hmg/ddz145
64. Jury EC, D'Cruz D, Morrow WJ. Autoantibodies and Overlap Syndromes in Autoimmune Rheumatic Disease. J Clin Pathol (2001) 54(5):340–7. doi: 10.1136/jcp.54.5.340
65. Martin AR, Kanai M, Kamatani Y, Okada Y, Neale BM, Daly MJ. Clinical Use of Current Polygenic Risk Scores May Exacerbate Health Disparities. Nat Genet (2019) 51(4):584–91. doi: 10.1038/s41588-019-0379-x
66. Amariuta T, Ishigaki K, Sugishita H, Ohta T, Koido M, Dey KK, et al. Improving the Trans-Ancestry Portability of Polygenic Risk Scores by Prioritizing Variants in Predicted Cell-Type-Specific Regulatory Elements. Nat Genet (2020) 52(12):1346–54. doi: 10.1038/s41588-020-00740-8
67. Ishigaki K, Sakaue S, Terao C, Luo Y, Sonehara K, Yamaguchi K, et al. Trans-Ancestry Genome-Wide Association Study Identifies Novel Genetic Mechanisms in Rheumatoid Arthritis. medRxiv (2021) (2021), 12.01.21267132. doi: 10.1101/2021.12.01.21267132
68. Chatterjee N, Shi J, García-Closas M. Developing and Evaluating Polygenic Risk Prediction Models for Stratified Disease Prevention. Nat Rev Genet (2016) 17(7):392–406. doi: 10.1038/nrg.2016.27
69. Choi SW, Mak TS, O'Reilly PF. Tutorial: A Guide to Performing Polygenic Risk Score Analyses. Nat Protoc (2020) 15(9):2759–72. doi: 10.1038/s41596-020-0353-1
70. Lambert SA, Gil L, Jupp S, Ritchie SC, Xu Y, Buniello A, et al. The Polygenic Score Catalog as an Open Database for Reproducibility and Systematic Evaluation. Nat Genet (2021) 53(4):420–5. doi: 10.1038/s41588-021-00783-5
71. Abraham G, Tye-Din JA, Bhalala OG, Kowalczyk A, Zobel J, Inouye M. Accurate and Robust Genomic Prediction of Celiac Disease Using Statistical Learning. PloS Genet (2014) 10(2):e1004137. doi: 10.1371/journal.pgen.1004137
72. Privé F, Aschard H, Carmi S, Folkersen L, Hoggart C, O'Reilly PF, et al. Portability of 245 Polygenic Scores When Derived From the Uk Biobank and Applied to 9 Ancestry Groups From the Same Cohort. Am J Hum Genet (2022) 109(1):12–23. doi: 10.1016/j.ajhg.2021.11.008
73. Qian J, Tanigawa Y, Du W, Aguirre M, Chang C, Tibshirani R, et al. A Fast and Scalable Framework for Large-Scale and Ultrahigh-Dimensional Sparse Regression With Application to the Uk Biobank. PloS Genet (2020) 16(10):e1009141. doi: 10.1371/journal.pgen.1009141
74. UK Biobank GWAS. Available at: http://www.nealelab.is/uk-biobank/
75. Reid S, Alexsson A, Frodlund M, Morris D, Sandling JK, Bolin K, et al. High Genetic Risk Score Is Associated With Early Disease Onset, Damage Accrual and Decreased Survival in Systemic Lupus Erythematosus. Ann Rheum Dis (2020) 79(3):363–9. doi: 10.1136/annrheumdis-2019-216227
76. Chen L, Wang YF, Liu L, Bielowka A, Ahmed R, Zhang H, et al. Genome-Wide Assessment of Genetic Risk for Systemic Lupus Erythematosus and Disease Severity. Hum Mol Genet (2020) 29(10):1745–56. doi: 10.1093/hmg/ddaa030
77. Oram RA, Patel K, Hill A, Shields B, McDonald TJ, Jones A, et al. A Type 1 Diabetes Genetic Risk Score Can Aid Discrimination Between Type 1 and Type 2 Diabetes in Young Adults. Diabetes Care (2016) 39(3):337–44. doi: 10.2337/dc15-1111
78. Wang YF, Zhang Y, Lin Z, Zhang H, Wang TY, Cao Y, et al. Identification of 38 Novel Loci for Systemic Lupus Erythematosus and Genetic Heterogeneity Between Ancestral Groups. Nat Commun (2021) 12(1):772. doi: 10.1038/s41467-021-21049-y
79. Perry DJ, Wasserfall CH, Oram RA, Williams MD, Posgai A, Muir AB, et al. Application of a Genetic Risk Score to Racially Diverse Type 1 Diabetes Populations Demonstrates the Need for Diversity in Risk-Modeling. Sci Rep (2018) 8(1):4529. doi: 10.1038/s41598-018-22574-5
80. Onengut-Gumuscu S, Chen WM, Robertson CC, Bonnie JK, Farber E, Zhu Z, et al. Type 1 Diabetes Risk in African-Ancestry Participants and Utility of an Ancestry-Specific Genetic Risk Score. Diabetes Care (2019) 42(3):406–15. doi: 10.2337/dc18-1727
81. Ramos PS, Shedlock AM, Langefeld CD. Genetics of Autoimmune Diseases: Insights From Population Genetics. J Hum Genet (2015) 60(11):657–64. doi: 10.1038/jhg.2015.94
82. Dahlhamer JM, Zammitti EP, Ward BW, Wheaton AG, Croft JB. Prevalence of Inflammatory Bowel Disease Among Adults Aged ≥18 Years — United States, 2015. In: MMWR Morb Mortal Wkly Rep (2016) (Washington, D.C.:U.S. Department of Health and Human Services). Available at: https://www.cdc.gov/mmwr/volumes/65/wr/mm6542a3.htm.
83. Antonelli A, Ferrari SM, Ragusa F, Elia G, Paparo SR, Ruffilli I, et al. Graves' Disease: Epidemiology, Genetic and Environmental Risk Factors and Viruses. Best Pract Res Clin Endocrinol Metab (2020) 34(1):101387. doi: 10.1016/j.beem.2020.101387
84. Prummel MF, Wiersinga WM. Smoking and Risk of Graves' Disease. Jama (1993) 269(4):479–82. doi: 10.1001/jama.1993.03500040045034
85. Majka DS, Holers VM. Cigarette Smoking and the Risk of Systemic Lupus Erythematosus and Rheumatoid Arthritis. Ann Rheum Dis (2006) 65(5):561–3. doi: 10.1136/ard.2005.046052
86. Costenbader KH, Feskanich D, Mandl LA, Karlson EW. Smoking Intensity, Duration, and Cessation, and the Risk of Rheumatoid Arthritis in Women. Am J Med (2006) 119(6):503:e1-9. doi: 10.1016/j.amjmed.2005.09.053
87. Cottone M, Rosselli M, Orlando A, Oliva L, Puleo A, Cappello M, et al. Smoking Habits and Recurrence in Crohn's Disease. Gastroenterology (1994) 106(3):643–8. doi: 10.1016/0016-5085(94)90697-1
88. Averns HL, Oxtoby J, Taylor HG, Jones PW, Dziedzic K, Dawes PT. Smoking and Outcome in Ankylosing Spondylitis. Scand J Rheumatol (1996) 25(3):138–42. doi: 10.3109/03009749609080003
89. Stone DU, Fife D, Brown M, Earley KE, Radfar L, Kaufman CE, et al. Effect of Tobacco Smoking on the Clinical, Histopathological, and Serological Manifestations of Sjögren's Syndrome. PloS One (2017) 12(2):e0170249. doi: 10.1371/journal.pone.0170249
90. Green JT, Rhodes J, Ragunath K, Thomas GA, Williams GT, Mani V, et al. Clinical Status of Ulcerative Colitis in Patients Who Smoke. Am J Gastroenterol (1998) 93(9):1463–7. doi: 10.1111/j.1572-0241.1998.00464.x
91. Vazquez H, Smecuol E, Flores D, Mazure R, Pedreira S, Niveloni S, et al. Relation Between Cigarette Smoking and Celiac Disease: Evidence From a Case-Control Study. Am J Gastroenterol (2001) 96(3):798–802. doi: 10.1111/j.1572-0241.2001.03625.x
93. Bossini-Castillo L, Villanueva-Martin G, Kerick M, Acosta-Herrera M, López-Isac E, Simeón CP, et al. Genomic Risk Score Impact on Susceptibility to Systemic Sclerosis. Ann Rheum Dis (2021) 80(1):118–27. doi: 10.1136/annrheumdis-2020-218558
Keywords: autoimmune diseases, genome wide association studies (GWAS), multi-ancestry genetic study, polygenic risk score (PRS), electronic health record (EHR)
Citation: Khunsriraksakul C, Markus H, Olsen NJ, Carrel L, Jiang B and Liu DJ (2022) Construction and Application of Polygenic Risk Scores in Autoimmune Diseases. Front. Immunol. 13:889296. doi: 10.3389/fimmu.2022.889296
Received: 04 March 2022; Accepted: 25 April 2022;
Published: 27 June 2022.
Edited by:
Janine Lamb, The University of Manchester, United KingdomReviewed by:
Yong-Fei Wang, The University of Hong Kong, Hong Kong SAR, ChinaCopyright © 2022 Khunsriraksakul, Markus, Olsen, Carrel, Jiang and Liu. This is an open-access article distributed under the terms of the Creative Commons Attribution License (CC BY). The use, distribution or reproduction in other forums is permitted, provided the original author(s) and the copyright owner(s) are credited and that the original publication in this journal is cited, in accordance with accepted academic practice. No use, distribution or reproduction is permitted which does not comply with these terms.
*Correspondence: Dajiang J. Liu, ZGFqaWFuZy5saXVAcHN1LmVkdQ==
†These authors have contributed equally to this work and share first authorship
‡These authors have contributed equally to this work
Disclaimer: All claims expressed in this article are solely those of the authors and do not necessarily represent those of their affiliated organizations, or those of the publisher, the editors and the reviewers. Any product that may be evaluated in this article or claim that may be made by its manufacturer is not guaranteed or endorsed by the publisher.
Research integrity at Frontiers
Learn more about the work of our research integrity team to safeguard the quality of each article we publish.