
94% of researchers rate our articles as excellent or good
Learn more about the work of our research integrity team to safeguard the quality of each article we publish.
Find out more
ORIGINAL RESEARCH article
Front. Immunol., 29 July 2022
Sec. Antigen Presenting Cell Biology
Volume 13 - 2022 | https://doi.org/10.3389/fimmu.2022.889175
 Stephanie C. Talker1,2*
 G. Tuba Barut1,2
 Heidi E.L. Lischer3
 Reto Rufener4Lilly von Münchow5
 Rémy Bruggmann3
 Artur Summerfield1,2
Similar to human monocytes, bovine monocytes can be split into CD14highCD16- classical, CD14highCD16high intermediate and CD14-/dimCD16high nonclassical monocytes (cM, intM, and ncM, respectively). Here, we present an in-depth analysis of their steady-state bulk- and single-cell transcriptomes, highlighting both pronounced functional specializations and transcriptomic relatedness. Bulk gene transcription indicates pro-inflammatory and antibacterial roles of cM, while ncM and intM appear to be specialized in regulatory/anti-inflammatory functions and tissue repair, as well as antiviral responses and T-cell immunomodulation. Notably, intM stood out by high expression of several genes associated with antigen presentation. Anti-inflammatory and antiviral functions of ncM are further supported by dominant oxidative phosphorylation and selective strong responses to TLR7/8 ligands, respectively. Moreover, single-cell RNA-seq revealed previously unappreciated heterogeneity within cM and proposes intM as a transient differentiation intermediate between cM and ncM.
With their high functional plasticity (1, 2), monocytes are a central component of the mononuclear phagocyte system (MPS). Although their delineation from bona fide macrophages and bona fide dendritic cells has proved challenging, especially in tissues, monocytes and monocyte-derived cells are now fully appreciated as a separate lineage (2–4). In blood of humans and cattle, monocytes can be subdivided into at least two different subsets based on the expression of CD14 and CD16 (5–7): classical monocytes (cM; CD14highCD16-) and nonclassical monocytes (ncM; CD14-/dimCD16high). In mice, analogous subsets can be defined by Ly6C expression (8). A third intermediate monocyte subset (intM; CD14highCD16+/high) is less well defined and has been shown to transcriptionally resemble ncM in both humans and cattle (5, 6, 9). In these two species, cM are described as the dominant subset in peripheral blood comprising about 80% of all monocytes, while ncM and intM comprise only small fractions (about 10% each) (2, 7). In mice, however, ncM (Ly6C-) are reported to be as frequent as cM (Ly6C+) in peripheral blood (8).
Classical monocytes are known for their pro-inflammatory function especially in bacterial infections (10), however the role of intM and ncM is less well described. Nonclassical monocytes are generally viewed as anti-inflammatory and vasoprotective (11), as they were found to crawl along vascular endothelium (8, 12) and sustain vascular integrity by orchestrating endothelial renewal (13). The prominent transcription of genes for endothelial adhesion in bovine ncM (7, 9) suggests a similar role in cattle. In response to TLR7 stimulation, murine ncM have been shown to recruit neutrophils to the endothelium and to clear neutrophil-induced focal necrosis (13). Also in humans, ncM were shown to be specialized in sensing nucleic acids via TLR7 and TLR8 (14) and are proposed to function in antiviral immunity (15). Murine ncM have furthermore been described as biased progenitors of wound healing macrophages (16).
Monocytes in general are known to be capable of antigen presentation to T cells, however whether they are as potent as dendritic cells remains controversial (1). Notably, TLR7 stimulation, but not TLR3 or TLR4 stimulation, has been shown to promote cross-presenting abilities in murine Ly6C+ cM (17). Bovine monocytes, particularly ncM, were reported to induce allogeneic T-cell responses in vitro (18).
We have previously reported pronounced transcriptomic differences between bovine cM and ncM, as determined by bulk RNA-seq and principal component analysis (9). The present study explores these transcriptomic differences in greater detail: we performed in-depth gene-by-gene analysis of bulk- and single-cell transcriptomes, as well as analyses of TLR responsiveness and metabolic activity. Taken together, our data indicate subset-specific functions in acute inflammation, antibacterial and antiviral responses, as well as in T-cell modulation, resolution of inflammation, and tissue repair. Furthermore, the unsupervised clustering of our single-cell RNA-seq data confirms the CD14/CD16-based subset definition, but also supports continuous differentiation of bovine monocyte subsets – yet another feature presumably shared with their human counterparts (19).
Blood of female cattle (Bos taurus; various breeds; aged 6.5 months to 9 years) was collected at the Clinic for Ruminants (Vetsuisse Faculty, University of Bern, Switzerland) or at the animal facility of the Institute of Virology and Immunology (Mittelhäusern, Switzerland) by puncturing the jugular vein, using citrate-based Alsever’s solution (1.55 mM of C6H12O6, 408 mM of Na3C6H5O7·2H2O, 1.078 mM of NaCl, and 43 mM of C6H8O7, pH 6.2) as an anticoagulant. Blood sampling was performed in compliance with the Swiss animal protection law and approved by the cantonal veterinary authority (license numbers BE102/15, BE104/17, and BE131/17).
For peripheral blood mononuclear cell (PBMC) isolation, blood was centrifuged at 1000 x g for 20 min (20°C), the buffy coat was collected, diluted with PBS to a ratio of 1 to 1 (room temperature), and layered onto lymphocyte separation medium (1.077 g/mL; GE Healthcare). After centrifugation (800 x g, 25 min, 20°C), PBMC were collected and washed twice (400 x g, 8 min, 4°C) with cold PBS containing 1 mM UltraPure™ EDTA (ThermoFisher). In order to remove platelets, a final washing step was performed at 250 x g (8 min, 4°C).
Phenotyping of bovine monocyte subsets was performed with freshly isolated PBMC in 96-well. U-bottom microtiter plates (1 x 10⁷ cells per sample). Antibodies used for the two-step five-color stainings are shown in Table 1. Incubations were performed for 20 min at 4°C. Washing steps between incubations (400 x g, 4 min, 4°C) were done with Cell Wash (BD Biosciences). Prior to staining, PBMC were incubated with bovine IgG in order to block Fc receptors (50 µg/mL; Bethyl laboratories). For detection of dead cells, Live/Dead Near-IR stain (ThermoFisher) was included in the last incubation step. Compensation was calculated by FACSDiva software using single-stained samples. For each marker to be examined on monocyte subsets, a fluorescence-minus-one (FMO) control was included. Samples were acquired with a FACSCanto II flow cytometer (BD Biosciences) equipped with three lasers (405, 488, and 633 nm). At least 5 x 10⁵ cells were recorded in the “large-cell” gate.
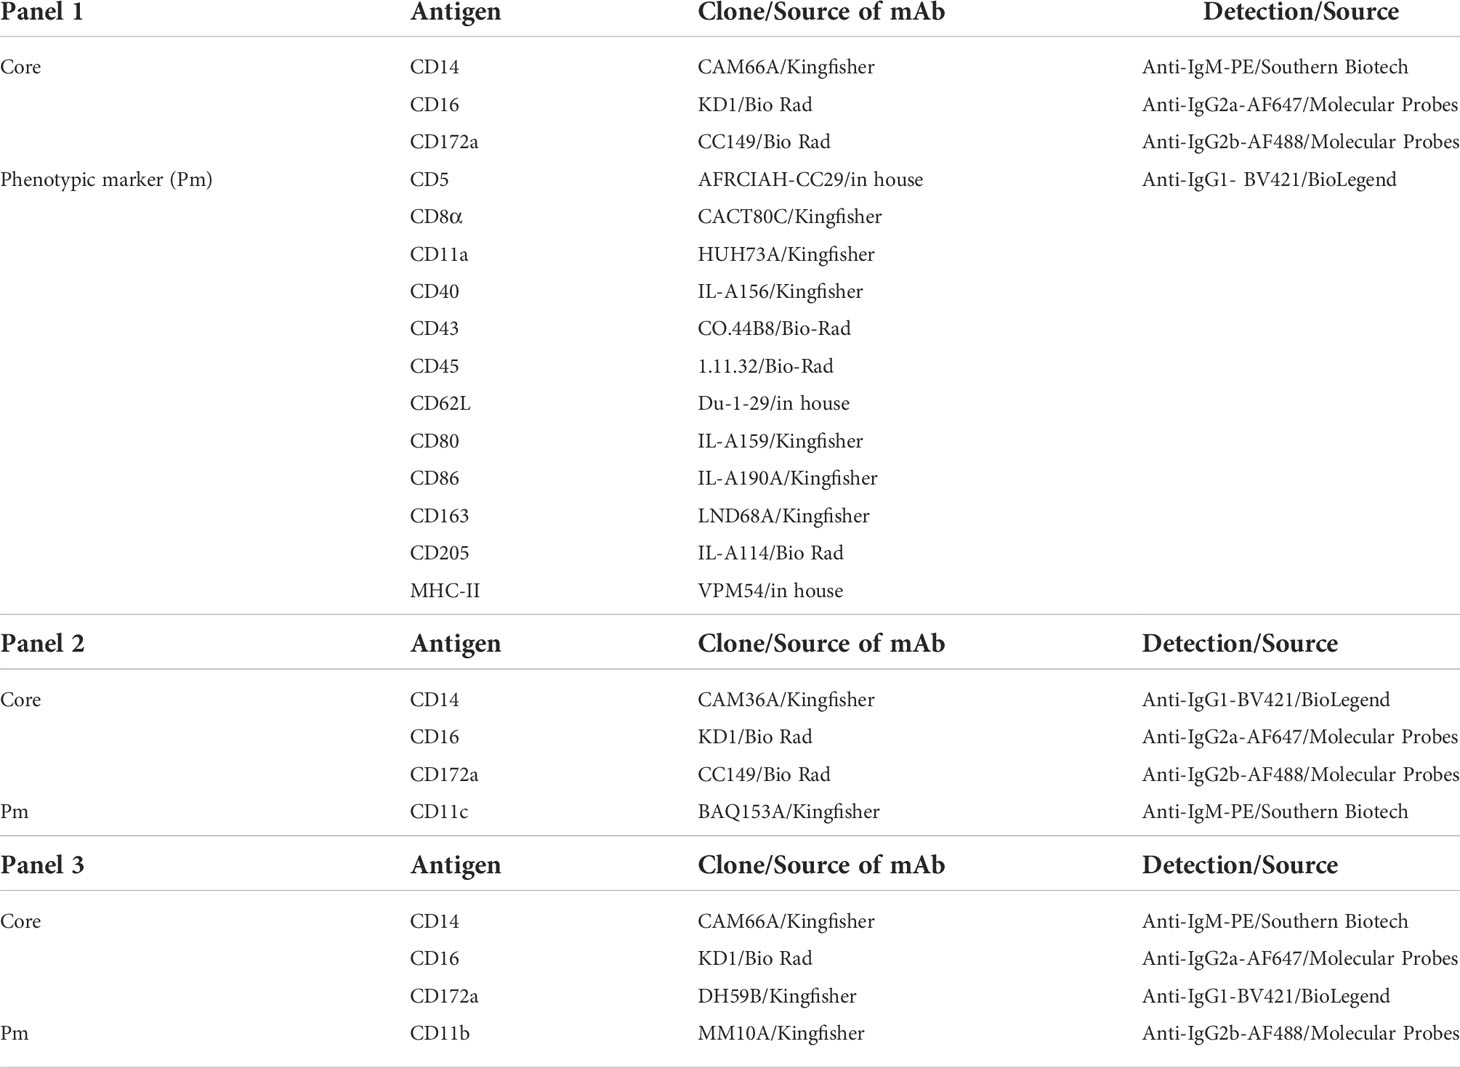
Table 1 Antibodies used for flow-cytometric phenotyping of bovine monocyte subsets.
Bulk RNA sequencing data of sorted monocyte subsets are derived from previous experiments, described in Talker et al. (9). Experimental procedures are therefore described only briefly and the reader is referred to our previous publication for more details. In order to sort bovine monocyte subsets for Illumina sequencing, a two-step staining was performed with 3 x 10⁸ freshly isolated PBMC. Classical monocytes (cM) were sorted as CD172ahighCD14highCD16-, intM as CD172ahighCD14highCD16high and ncM as CD172ahighCD14-/dimCD16high using a FACS Aria (BD Biosciences). All sorted subsets had a purity of at least 97%. Per subset, at least 1 x 10⁵ sorted cells were frozen in TRIzol (ThermoFisher) for later RNA extraction (Nucleospin RNA kit, Macherey Nagel). High-quality RNA (approximately 500 ng; RIN> 8) was used for nondirectional paired-end mRNA library preparation (TruSeq Sample Preparation Kit; Illumina).
Sequencing was performed on the Illumina HiSeq3000 platform using 100 bp single-end sequencing, yielding between 25.2 and 41.1 million read pairs per sample. Reads were mapped to the Bos taurus reference genome (UMD3.1) with Hisat2 v. 2.1.0, and FeatureCounts from Subread v. 1.5.3 was used to count the number of reads overlapping with each gene, as specified in the Ensembl annotation (release 91). Raw counts of the sequencing data previously published in Talker et al., 2018 (9) were re-analyzed with the Bioconductor package DESeq2 (20), including only data for the three monocyte subsets and considering the factor “animal” in the design formula. Raw counts were normalized to account for differences in sequencing depth between samples. Gene length was not considered. Lists of differentially expressed genes were obtained by performing pairwise comparisons with DESeq2 (adjusted p-value < 0.05). Gene lists were manually screened for genes of interest using the human gene database GeneCards® and literature research via PubMed®. Principal component analysis was performed with normalized and rlog-transformed counts of the 1000 most variable genes across monocyte samples. Heatmaps were prepared following log2 transformation of normalized counts. Prior to log2 transformation, a pseudocount of 1 was added to the values to avoid zeros. All analyses were performed using R version 3.6.1.
For gene set enrichment analysis (GSEA) we used genes ranked based on the DESeq2 output (cM vs. ncM, filtered for p_adj < 0.05) according to the “stat” value representing the Wald statistics. We employed the GSEA software from UC San Diego and Broad Institute (21, 22) with the C5:GO:BP gene sets (Gene Ontology, biological process, file c5.go.bp.v7.5.1.symbols.gmt) that are integrated into the software (MSigDB v7.4) (22, 23). The following parameters were used: gene set size “15-500”; scoring scheme “weighted”, normalization “meandiv”, mode “mean of probes”, number of permutations “1000”.
The bulk-RNA-seq datasets are available in the European Nucleotide Archive (http://www.ebi.ac.uk/ena) under the accession number PRJEB28324.
The following TLR ligands were used at a final concentration of 10 μg/mL to assess TLR responsiveness of bovine monocyte subsets: Pam2CSK4 [C65H126N10O12S • 3TFA] (InvivoGen), high-molecular-weight (HMW) polyinosinic-polycytidylic acid [Poly(I:C)] (InvivoGen), LPS from E. coli strain K12 [LPS-EK] (InvivoGen), Gardiquimod (Sigma-Aldrich), Resiquimod (Sigma-Aldrich).
Stimulation with TLR ligands and staining for phosphorylated p38 MAPK was performed as reported previously (24). Prior to stimulation, cell surface staining was performed. Following Fc-receptor blocking with purified bovine IgG (50 µg/mL; Bethyl laboratories), defrosted and CD3-depleted bovine PBMC were stained with anti-CD172a (CC149, IgG2b), anti-CD14 (CAM36A, IgG1), and anti-CD16 (KD1, IgG2a), followed by incubation with anti-IgG2b-AF488 (Molecular Probes), anti-IgG1-biotin (Southern Biotech) and anti-IgG2a-PE (Southern Biotech). In a fourth step, ChromPure mouse IgG (Jackson ImmunoResearch) was added together with Streptavidin-BV421 (BD Biosciences) and Live/Dead™ Fixable Near-IR stain (Thermo Fisher Scientific). Stained cells were incubated for 15 minutes with respective TLR ligands in PBS or with PBS alone (waterbath at 37°C). Immediately after this incubation period, cells were fixed with BD Cytofix/Cytoperm™ fixation buffer (BD Biosciences; 12 min at 37°C) and thereafter stained with anti-p38 MAPK-AF647 (BD Phosflow; 30 min at 37°C). Samples were acquired with a FACSCanto II flow cytometer (BD Biosciences) equipped with three lasers (405, 488, and 633 nm). At least 1.5 × 10⁶ cells were recorded in the “large-cell” gate. Compensation was calculated by FACSDiva software using single-stained samples.
For metabolic assays using a Seahorse Extracellular Flux Analyzer (denominated “Seahorse assays”; Agilent Technologies Inc.), bovine monocyte subsets were FACS-sorted from magnetically enriched CD172a+ PBMC. Combined staining for magnetic selection and FACS was performed in 50 mL centrifugation tubes and included five incubation steps, each carried out at 4°C for 20 min. Staining, and washing (400 x g, 8 min, 4°C) in-between each incubation step, was performed in PBS containing 1 mM EDTA and 5% (v/v) heat-inactivated FBS (GIBCO, Life Technologies). In a first step, freshly isolated PBMC (4 x 10⁸) were incubated with bovine IgG (50 µg/mL; Bethyl laboratories) to block Fc receptors. This was followed by incubation with the primary antibodies anti-CD172a (CC149, IgG2b), anti-CD14 (CAM36A, IgG1), and anti-CD16 (KD1, IgG2a) and the secondary antibodies anti-IgG1-AF647 (Molecular Probes) and anti-IgG2a-PE (Southern Biotech). In a fourth step, anti-mouse IgG magnetic beads (Miltenyi Biotec) were added, and cells were loaded onto two LS columns (Miltenyi Biotec) for magnetic enrichment of CD172a expressing cells. In a fifth step, anti-IgG2b-AF488 (Molecular Probes) was added, resulting in a dim staining of CD172a for FACS. Enriched monocytes were sorted on a MoFlo Astrios EQ cell sorter (Beckman Coulter) equipped with five lasers at the Flow Cytometry and Cell Sorting Facility (FCCS) of the University of Bern. Purity of subsets was confirmed by re-analysis of samples and was shown to be at least 98%. Following sorting, cells were resuspended in pH-optimized Seahorse assay medium (Agilent Seahorse XF DMEM Medium supplemented with 10 mM Agilent Seahorse XF Glucose, 1mM Agilent Seahorse XF Pyruvate, and 2mM Agilent Seahorse XF Glutamine) and 5 x 10⁵ cells (ex vivo) or 1 x 10⁵ cells (after 6-day culture) were seeded in duplicates or triplicates into an 8-well Seahorse plate (Agilent Seahorse XFp FluxPak). Two wells served as background controls. During manual cell counting, viability of sorted subsets was confirmed to be above 95% by trypan blue staining. Cells not immediately used for Seahorse assays, were incubated for six days at 37°C (5% CO2) to allow for differentiation into monocyte-derived macrophages. Specifically, remaining cells were seeded into a 12-well plate with 1 x 10⁶ cells per well in 2 mL culture medium consisting of DMEM-GlutaMAX™ (Gibco, ref.no: 31966-021), supplemented with penicillin (50 I.U./mL), streptomycin (50 µg/mL), 10% heat-inactivated FBS, and 1% M-CSF (produced in house; titrated to optimize viability of monocytes in culture). After six days of incubation, cells were harvested, resuspended in Seahorse assay medium, counted, and processed as described above. Viability of harvested cells was above 90% as assessed microscopically by the trypan blue exclusion test.
Seahorse preparations and measurements were performed according to the manufacturer’s instructions. For measurements with the Agilent Seahorse XFp Analyzer, the standard settings of the XFp Real-Time ATP Rate Assay were used. Following basal measurements, oligomycin (final concentration 9 µM), an inhibitor of ATP synthase (complex V of the electron transport chain), was added. After another measurement phase, a mastermix of rotenone (final concentration 8 µM), an inhibitor of complex I, and antimycin A (final concentration 8 µM), an inhibitor of complex III, was added. Inhibitors of the electron transport chain were purchased from Sigma-Aldrich (cat. no. O4876, R8875, A8674) and titrated on bovine cM to determine optimal concentrations. For establishment of the procedure, Agilent Seahorse XFp Real-Time ATP Rate Assay Kit (cat. no. 103591-100) was used according to manufacturer’s instructions, but with an increased final concentration (6 µM) of the provided oligomycin, according to prior titration on bovine cM. Data were analyzed using the Seahorse Wave Desktop Software version 2.6.1 (Agilent).
For scRNA-seq, PBMC from two cows (6.5 months old; #CH4431 and #CH4432) were isolated as described above. Cell counting and viability assessments were carried out microscopically using the trypan blue exclusion test. Thereafter, cells were delivered to the Next Generation Sequencing Platform at the University of Bern and processed as follows: GEM generation & barcoding, reverse transcription, cDNA amplification and 3’ gene expression library generation steps were all performed according to the Chromium Single Cell 3’ Reagent Kits v3 User Guide (10x Genomics CG000183 Rev B) with all stipulated 10x Genomics reagents. Generally, 16.0 µL of each cell suspension (600-800 cells/µL) and 30.6 µL of nuclease-free water were used for a targeted cell recovery of 10’000 cells. GEM generation was followed by a GEM-reverse transcription incubation, a clean-up step and 11 cycles of cDNA amplification. The resulting cDNA was evaluated for quantity and quality using a Thermo Fisher Scientific Qubit 3.0 fluorometer with the Qubit dsDNA HS Assay Kit (Thermo Fisher Scientific, Q32851) and an Advanced Analytical Fragment Analyzer System using a Fragment Analyzer NGS Fragment Kit (Agilent, DNF-473), respectively. Thereafter, 3′ gene expression libraries were constructed using a sample index PCR step of 16 cycles. The generated cDNA libraries were tested for quantity and quality using fluorometry and capillary electrophoresis as described above. The cDNA libraries were pooled and sequenced with a loading concentration of 300, paired end and single indexed, on an illumina NovaSeq 6000 sequencer using a NovaSeq 6000 SP Reagent Kit v1 (100 cycles; illumina, 20027464). The read set-up was as follows: read 1: 28 cycles, i7 index: 8 cycles, i5: 0 cycles and read 2: 91 cycles. The quality of the sequencing runs was assessed using illumina Sequencing Analysis Viewer (illumina version 2.4.7) and all base call files were demultiplexed and converted into FASTQ files using illumina bcl2fastq conversion software v2.20. More than 36’000 reads/cell were generated for each sample.
Mapping and counting of UMIs was performed using Cell Ranger (version 3.0.2, 10x Genomics) with the reference genome ARS-UCD1.2 from Ensembl to build the necessary index files. Subsequent analysis was performed in R (version 4.0.2) (25). The Scater package (version 1.16.2) (26) was used to assess the proportion of ribosomal and mitochondrial genes as well as the number of detected genes. Cells were considered as outliers and filtered out if the value of the proportion of expressed mitochondrial genes or the number of detected genes deviated more than three median absolute deviations from the median across all cells. Additionally, all ribosomal genes were removed. After quality control, the sample from cow #CH4431 retained 6165 cells and the sample from cow #CH4432 retained 6401 cells. Normalization between samples was done with the deconvolution method of Lun et al. (27) using the package Scran (version 1.16.0) (28). Samples were integrated with the FindIntegrationAnchors function of the package Seurat (version 3.2.0) based on the first 30 principal components (PCs) (29). Graph-based clustering was done with the FindNeighbors and FindClusters functions of the Seurat package using the first 35 PCs from the dimensionality reduction step. The Clustree package (version 0.4.3) (30) was used to determine the resolution (0.8) resulting in clustering concurring with the presumed cell types. Clusters were annotated based on marker genes that were identified with the FindAllMarkers function of Seurat. Cells from clusters identified as monocytic cells (c4, c10, c14, and c18) were extracted and re-clustered in an identical fashion as above, but with a resolution of 0.6. The scRNA-seq datasets are available in the European Nucleotide Archive (http://www.ebi.ac.uk/ena) under the accession number PRJEB50632.
The R package Monocle3 (31–33) was used to do a trajectory analysis on the clusters 0-4 of the re-clustered cells. UMAP dimensionality reduction method was used and the Louvain clustering method using 100 nearest neighbors (function cluster_cells of Monocle3). The function graph_test of Monocle3 was used to find genes that are differentially expressed across a single-cell trajectory. Default parameters were used unless stated otherwise.
The animal experiments were performed in compliance with the Swiss animal protection law (TSchG SR 455; TSchV SR 455.1; TVV SR 455.163). The procedures were reviewed by the committee on animal experiments of the canton of Bern, Switzerland, and approved by the cantonal veterinary authority (Amt für Landwirtschaft und Natur LANAT, Veterinärdienst VeD, Bern, Switzerland) under the license numbers BE102/15, BE104/17, and BE131/17.
Figures were prepared using FlowJo version 10 (FlowJo LLC, Ashland, OR), GraphPad Prism versions 7.0.3 and 9.3.1 for Windows (GraphPad Software, San Diego, CA), R version 3.6.1., and Inkscape (www.inkscape.org).
Fold change in median fluorescence intensity (MFI; phosphoflow cytometry) was tested for statistical significance using multiple paired t-tests on log-transformed MFI values of PBS-incubated versus stimulated samples. Obtained p-values are shown alongside q values (two-stage step-up, Benjamini, Krieger, and Yekutieli; desired FDR 5%) and adjusted p-values (Holm-Šídák method).
Differences in glycolytic and mitochondrial ATP production rates (Seahorse assays) were tested for statistical significance using multiple paired t-tests on means of duplicates/triplicates across four assays. Adjusted p-values were determined by the Holm-Šídák method. Calculations were done using GraphPad Prism version 9.3.1 for Windows.
Bovine monocyte subsets were analyzed by flow cytometry for expression of various surface molecules (Figures 1A, B). While some molecules showed clear subset-dependent expression patterns (e.g. CD163, CD11a, CD11b, CD205), other molecules varied strongly with the animals analyzed (e.g. CD40, CD80, MHC-II). A gradual increase from cM over intM to ncM could be observed for expression of CD11a, whereas a gradual decrease was observed for CD11b. In addition to CD11a, ncM expressed the highest levels of CD5, CD8α, and CD205. Intermediate monocytes expressed the highest levels of CD86 and, for 2 out of 3 animals, also expressed the highest levels of MHC-II. Highest expression on intM combined with lowest expression on ncM was seen for CD163 and CD11c. Expression of CD172a, CD45 and CD43 was higher on ncM and intM compared to cM. Furthermore, cM expressed the highest levels of CD62L, being almost absent from ncM. Supplementary File 1 illustrates exemplary flow cytometry data as well as marker expression on CD14highCD16dim monocytes, which were not included in any sorting gates for bulk RNA-seq in the present study. These cells showed expression levels in-between CD14highCD16- (cM) and CD14highCD16high (intM) monocytes for most markers analyzed, except for CD163, CD11b and CD11c, which were expressed on CD14highCD16dim cells at levels at least as high or even higher than on cM of the same animal.

Figure 1 Phenotype and transcriptional clustering of bovine monocyte subsets. (A, B) Flow cytometric analysis. Freshly isolated PBMC were stained for flow cytometry. Monocyte subsets were gated based on expression of CD14 and CD16 within CD172ahigh cells after gating on large cells (FSChigh), single cells (within diagonal in FSC-A vs. FSC-H and SSC-A vs. SSC-H), and living cells (Near-IRlow). Classical monocytes (cM) were gated as CD14highCD16-, intermediate monocytes (intM) as CD14highCD16high, and nonclassical monocytes (ncM) as CD14-/dimCD16high. (B) Graphs show the delta median fluorescence intensity (MFI) of surface expression for selected molecules. Delta MFI was calculated as the difference in MFI between stained samples and FMO controls. Lines illustrate the delta MFI across monocyte subsets. Stainings were performed on seven different animals, resulting in 3 animals analyzed per marker. Within single graphs, data of three different animals is illustrated by solid, dashed, and dotted lines. (C) First two axes of a principal component analysis (PCA) including the 1000 most variable genes. Illumina sequencing was performed on RNA isolated from sorted monocyte subsets of three animals. Each dot represents one sample, with the color coding for different cell subsets and the shape coding for the three different animals.
Taken together, our phenotypic analyses have confirmed previously described expression patterns of MHC-II, CD172a, CD62L, CD11a and CD11b on bovine monocyte subsets (7) and provide new information on the expression of CD45, CD43, CD5, CD40, CD80, CD86, CD11c, CD163, and CD205. Moreover, in contrast to a previous study, where CD8α expression was concluded to be absent from all monocytes (34), we found indications of weak CD8α expression on ncM and intM. A recent paper, citing the pre-print version of the present manuscript (35), summarizes phenotypic characteristics of bovine monocyte subsets and gating strategies (36).
Principal component analysis of previously published bulk RNA-seq data (9) revealed that differences between monocyte subsets explained the highest proportion of total variance (73%, PC1) in the transcriptomic dataset, followed by 9% of variance (PC2) explained by differences between animals (Figure 1C). As expected from previous analyses (9), ncM and intM clearly clustered apart from cM, with intM clustering much closer to ncM than to cM. Notably, when looking at PC1, intM of animal #2 clustered closer to ncM samples than to intM samples of the other two animals.
Identity of monocyte subsets was confirmed by subset-specific transcription of the key genes NR4A1 (ncM, intM), CX3CR1 (ncM, intM) and CCR2 (cM) (Supplementary File 2A). Moreover, the transcription of surface molecules previously analyzed by flow cytometry in different animals followed the same patterns. Except for CD163, for which mRNA content in intM was lower than expected, and CD11b (ITGAM) and CD43, for which mRNA content in ncM was higher than in intM (Supplementary File 2B). Diverging patterns were also observed for CD80, with considerable individual variation both on mRNA and protein level.
Pairwise comparisons of monocyte subsets revealed a variety of differentially expressed genes, involved in various immune functions. The genes addressed in the following chapters have been selected based on pairwise comparisons (DESeq2; adjusted p-value < 0.05) and literature research, and raise no claim for completeness. The output from pairwise comparisons, including normalized counts for all genes and subsets, is provided in Supplementary File 3.
Monocyte subsets clearly differed in the transcription of inflammatory cytokines and cytokine receptors (Figure 2A). Classical monocytes were strongly enriched in transcripts for IL-1 (IL1A, IL1B) and for the IL-1 receptor (IL1R1, IL1RAP). Moreover, cM predominantly expressed IL6R, IL15RA, IL17RA, IL17RC, IL17RD and IL27RA. Trans-signaling with soluble IL-6 receptor is reported to mediate pro-inflammatory functions of IL-6 (37) and also in vitro stimulation with IL-27 is reported to increase inflammasome activation in monocytes (38). Furthermore, expression of TNFSF13 (APRIL), reported to induce IL-8 production in the human macrophage-like cell line THP-1 (39) and TNFRSF1A (TNFR1), mediating pro-inflammatory signaling of TNF-α, was highest in cM. Notably, TNF was found to be primarily expressed in ncM and intM. Tumor necrosis factor alpha (TNF/TNF-α) is regarded as a master regulator of inflammation with various effects on different cell types. TNF-α is produced either in soluble form which signals mainly via TNFR1 (TNFRSF1A), or as transmembrane protein, being the main ligand for TNFR2 (TNFRSF1B) (40) and implicated in reverse signaling (41), the functional consequences of which are incompletely understood (41, 42). Moreover, receptors for IL-12 and IL-20 (IL12RB1, IL12RB2 and IL20RA, IL20RB), were mainly expressed in ncM, though reads for IL20RB were very low (mean=20). Although little is known about IL-12-receptor- and IL-20-receptor signaling in monocytes, in vitro studies suggest overall pro-inflammatory effects (43, 44).
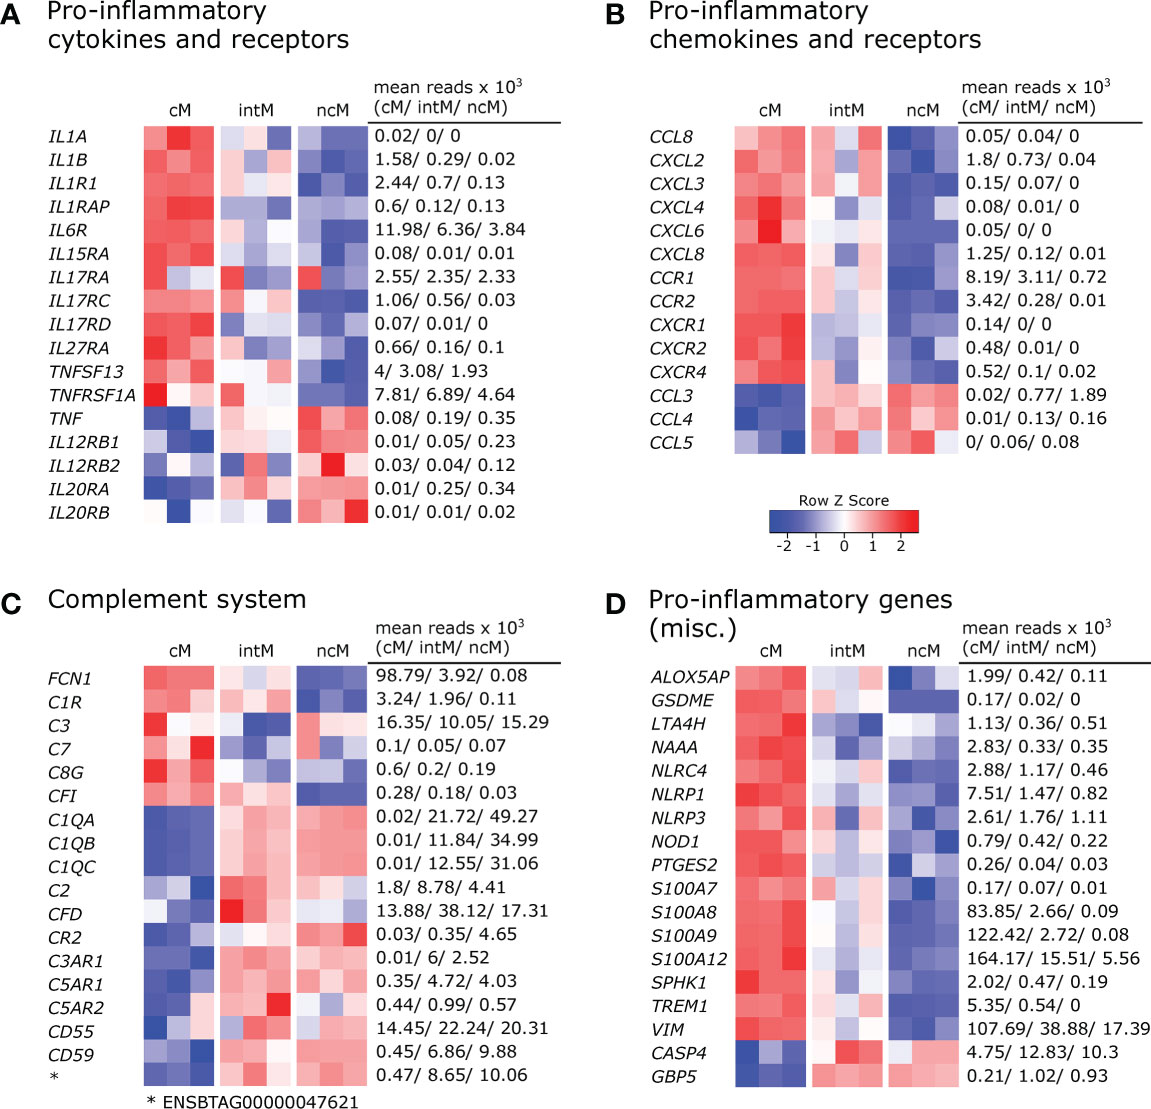
Figure 2 Pro-inflammatory gene expression. Illumina sequencing was performed on RNA isolated from sorted monocyte subsets (cM, intM, ncM) of three animals. Heatmaps show row z-scores calculated from log2-transformed normalized counts of selected genes coding for pro-inflammatory cytokines and receptors (A), pro-inflammatory chemokines and receptors (B), proteins associated with the complement system (C), and other pro-inflammatory mediators (D). Mean kilo reads for each subset and gene are given to the right of each heatmap. Genes were selected based on pairwise comparisons with DESeq2 (adjusted p-value < 0.05) and literature research.
Also a number of pro-inflammatory chemokines and chemokine receptors were found to be differentially expressed among monocyte subsets (Figure 2B). Looking at chemokines overexpressed in cM, the most pronounced differences between cM and ncM were found in the expression of CXCL2 and CXCL8. Moreover, transcripts for CCL8, CXCL3, CXCL4 and CXCL6 could be detected in cM and in intM of two animals, though all with low number of reads (max. 150 mean reads). Chemokine receptors associated with inflammation were all predominantly expressed by cM. Expression of CCR1 in cM was upregulated 2-fold over intM and 11-fold over ncM. Expression of CCR2 and CXCR4 was clearly upregulated in cM over intM (12-fold and 5-fold, respectively), and almost absent from ncM. Exclusive expression in cM was observed for CXCR1 and CXCR2. Nonclassical monocytes and intM clearly showed the highest expression of CCL3 and were also enriched in transcripts for CCL4 and CCL5, though at a lower level.
Gene expression also supports a prominent role of cM in complement-mediated inflammatory processes (Figure 2C). We found that transcription of FCN1, a recognition receptor for the lectin complement pathway, was highly increased in cM and almost absent in ncM, as was the transcription of C1R, a subunit of the complement C1. Notably, transcripts for complement component C3, which is central for activation of both the classical and the alternative complement pathway, were enriched in cM and ncM, and showed the lowest levels in intM, whereas complement factor I (CFI, C3b-Inactivator), an important negative regulator of both complement pathways, was exclusively transcribed in cM and intM. Moreover, transcription of C7 as well as of C8G, both involved in formation of the membrane attack complex, was highest in cM. Nevertheless, certain important genes of the complement system were overexpressed in both ncM and intM. Among those genes were C1QA, C1QB, and C1QC, all of which were barely expressed in cM. The molecule C1q is one of the main sensors of PAMPs and DAMPs, but also antibody complexes, in the classical complement pathway and has been associated with tolerogenic functions (45). Notably, C1q also binds to the surface of dead cells, thereby promoting their phagocytosis. Complement factor 2 (C2) and complement factor D (CFD), involved in the classical and alternative complement pathway, respectively, showed the highest transcription in intM. The receptor for complement factor C3a (C3AR1) was exclusively expressed in intM and ncM, whereas transcription of the receptor for complement factor C3d (CR2/CD21) was markedly increased in ncM and to a lesser extent in intM, when compared to cM. Both known receptor genes for complement factor C5a, C5AR1 (CD88) and C5AR2, showed increased expression in ncM and intM, with slightly higher expression in intM. While C5aR1 is regarded as a mediator of pro-inflammatory signaling, C5aR2 has recently received attention as a multifaceted modulator of C5a signaling, described to dampen inflammasome activation and to alter TLR signaling (46). Furthermore, we found a higher transcription of CD55 in ncM/intM compared to cM, encoding a complement inhibitory protein reported to suppress T-cell responses (47). A 20-fold increased transcription in ncM as compared to cM was found for CD59, encoding a receptor for C8 and C9. Apart from its function as an inhibitor of the membrane attack complex, CD59 expression on antigen-presenting cells was reported to deliver suppressive signals to murine CD59-expressing CD4 T cells via a complement-independent ligand (48, 49). Nonclassical monocytes were also clearly enriched in transcripts for the gene ENSBTAG00000047621. A protein query revealed the highest similarity with human (53.7%) and murine (47.5%) C4BPA, a molecule implicated in the inhibition of classical complement activation that has been reported to induce an anti-inflammatory state in monocyte-derived dendritic cells (50). However, no transcripts were found for the gene annotated as bovine C4BPA.
Also transcription of other genes associated with pro-inflammatory functions was clearly dominant in cM (Figure 2D). This includes genes coding for sensory components of inflammasomes (NOD1, NLRC4, NLRP1, NLRP3), pyroptosis-mediating gasdermin E (GSDME), enzymes involved in the biosynthesis of leukotriens (ALOX5AP, LTA4H) and prostaglandins (PTGES2), as well as the kinase for generation of sphingosine-1-phosphate (SPHK1), the pro-inflammatory receptor TREM1, the pro-inflammatory amidase NAAA (51, 52), and S100 proteins promoting inflammation (S100A7, S100A8, S100A9, S100A12) (53). Furthermore, transcripts for vimentin (VIM), reported to be a key positive regulator of the NLRP inflammasome (54), were clearly enriched in cM. While none of the monocyte subsets contained transcripts for nitric-oxide synthases at steady state (data not shown), we could recently show that bovine cM massively increase transcription of NOS2 upon in vitro stimulation with TLR ligands (24). Nonclassical monocytes expressed the highest levels of CASP4 and GBP5, the latter being described as an activator of inflammasome assembly (55). Caspase 4 (CASP4), being part of the non-canonical inflammasome, is described to promote pro-inflammatory cytokine production, but recently has also been implicated in autophagy (56) – a process that may negatively regulate inflammasome signaling. Taken together, the differential expression of pro-inflammatory genes suggests fundamentally different functions of bovine monocyte subsets.
Looking at the gene expression of pattern recognition receptors, we found that TLR2 was expressed higher in cM and intM compared to ncM, and that TLR4 and TLR5 transcripts were clearly enriched in cM (Figure 3A). Toll-like receptor 6 (TLR6) showed a trend towards higher expression in intM and ncM. Expression of TLR3 differed markedly between animals, but was in tendency highest in intM. Furthermore, cM expressed the highest levels of TLR7 and STING1, the latter encoding a cytoplasmic receptor for DNA of both viral and bacterial origin. For two out of three animals, TLR9 expression was also highest in cM. Transcript levels for RIG-1 (DDX58) and MDA-5 (IFIH1), however, were higher in ncM and intM.
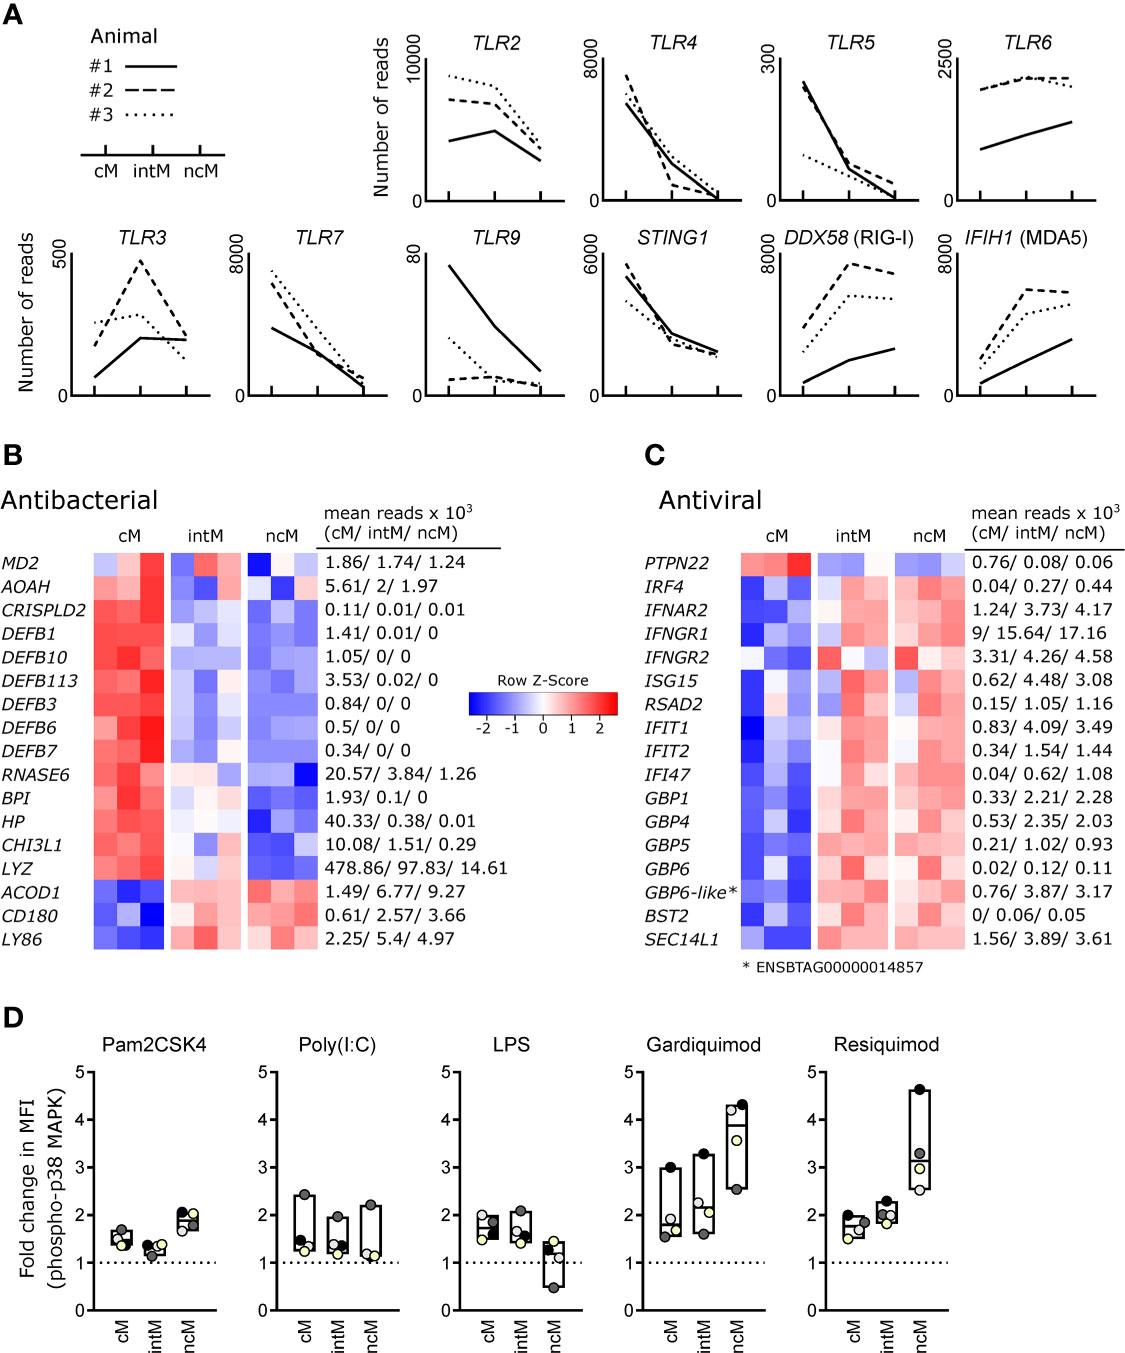
Figure 3 Antimicrobial gene expression and TLR responsiveness. Illumina sequencing was performed on RNA isolated from sorted monocyte subsets (cM, intM, ncM) of three animals. (A) Gene expression for pattern-recognition receptors. Graphs show the number of reads across monocyte subsets for selected genes with individual animals indicated by solid (#1), dashed (#2) and dotted (#3) lines. (B, C) Heatmaps show row z-scores calculated from log2-transformed normalized counts for genes associated with antibacterial (B) and antiviral (C) responses. Mean kilo reads for each subset and gene are given to the right of each heatmap. Genes were selected based on pairwise comparisons with DESeq2 (adjusted p-value < 0.05) and literature research. (D) Responsiveness of bovine monocyte subsets to TLR ligands. Defrosted bovine PBMC were depleted of CD3+cells, stained for CD172a, CD14 and CD16, and stimulated with Pam2CSK4, Poly(I:C), LPS, Gardiquimod, or Resiquimod for 15 min, before being fixed/permeabilized and stained with a fluorochrome-conjugated monoclonal antibody against phosphorylated p38 MAPK. Incubation with PBS served as control. Graphs show the fold change in median fluorescence intensity (MFI of stimulated sample divided by MFI of PBS control) of phospho-p38 MAPK staining for cM (CD14highCD16-), intM (CD14highCD16high) and ncM (CD14-/dimCD16high). For each stimulation, data of four different animals (color-coded dots) is shown. Boxes indicate minimum, maximum and median values. Paired t-tests were performed on log-transformed MFI values of stimulated samples vs. PBS-incubated samples. Statistical analyses and exemplary flow cytometry plots are given in Supplementary File 4.
Bovine cM were clearly enriched in transcripts involved in antibacterial responses (Figure 3B). These transcripts encode an accessory protein for TLR4 (MD2), other LPS-binding proteins [AOAH (57), CRISPLD2 (58)], beta-defensins (DEFB1, DEFB3, DEFB6, DEFB7, DEFB10, DEFB113) (59), and other proteins commonly known or described to be involved in antibacterial responses (RNASE6 (60), BPI (61, 62), HP (63), CHI3L1 (64), LYZ). Notably, high levels of MD2 were also expressed by intM of two animals. Three genes associated with antibacterial responses were found to be upregulated in ncM and intM – ACOD1, CD180 and LY86 (MD1), the latter two genes coding for LPS-binding proteins and members of the TLR family that form a complex to regulate TLR4 signaling (65). ACOD1 (IRG1) mediates the production of itaconate, which is – apart from its anti-inflammatory functions – also known for its antibacterial properties (66).
Looking at genes associated with antiviral responses, we found one gene upregulated in cM (PTPN22) and the vast majority of genes upregulated in intM and ncM (Figure 3C). PTPN22, overexpressed in cM, has been reported to potentiate TLR-induced type-I interferon production (67), and to regulate inflammasome activation (68). Both ncM and intM clearly expressed the highest levels of IRF4 and IFNAR2, whereas IFNAR1 was expressed to similar levels in all monocyte subsets (data not shown). Also IFNGR1 and IFNGR2, coding for the IFN-γ receptor, showed increased transcription in ncM and intM. Accordingly, the transcription of interferon-induced antiviral genes (ISG15, RSAD2, IFIT1, IFIT2, IFI47) was higher in ncM and intM, as compared to cM. Notably, the ubiquitin-like protein ISG15 exerts its antiviral function intracellularly by ISGylation of viral proteins and also extracellularly by acting in a cytokine-like manner to promote IFN-γ production of NK cells and T cells (69). Viperin (RSAD2), a multifunctional antiviral factor (70), has recently gained attention, as it was shown to act as a synthase for antiviral ribonucleotides (71).
Moreover, ncM and intM were enriched in transcripts for several interferon-induced guanylate-binding proteins (GBP1, GBP4, GBP5, GBP6, ENSBTAG00000014857). Alongside the GBP4 gene displayed in the heatmap (ENSBTAG00000037634), also three other genes annotated as GBP4 (ENSBTAG00000014529, ENSBTAG00000038233) or GBP4-like (ENSBTAG00000002416) were upregulated in ncM and intM (data not shown). Only recently, GBP1 has been allocated an important role in apoptosis and pyroptosis of human macrophages (72). GBP4 has been reported to negatively regulate virus-induced type I IFN responses by targeting interferon regulatory factor 7 (73). Along this line, BST2, exclusively expressed in ncM and intM, was reported to inhibit type I interferon and cytokine production in TLR7/9-stimulated pDC (74). Furthermore, SEC14L1, more than 2-fold enriched in ncM and intM, was reported to negatively regulate RIG-I-mediated signaling (75).
Responsiveness of monocyte subsets to TLR stimulation, as determined by phosphoflow cytometry for p38 MAPK (Figure 3D), corroborates a specialization of cM and ncM for antibacterial and antiviral responses, respectively. While the TLR4 ligand LPS induced responses primarily in cM and intM, stimulation with the TLR7/8 ligands Gardiquimod and Resiquimod induced the strongest responses in ncM. This may point towards high TLR8 expression in ncM (TLR8 not annotated), as transcript levels for TLR7 were relatively low in ncM. Also responses to Pam2CSK4, a synthetic diacylated lipopeptide and ligand for TLR2/6, were highest in ncM. At last, similar low-level responses to Poly(I:C) were detectable in all subsets, with one animal standing out by a considerably higher response (statistical analyses and exemplary flow cytometry plots are given in Supplementary File 4). Taken together, these results indicate that bovine monocyte subsets are specialized in responding to different pathogen-associated molecular patterns, suggesting a role of ncM in immunity against viruses (TLR7/8) as well as gram-positive bacteria and mycoplasma (TLR2/6) (76) and for cM and intM against gram-negative bacteria (TLR4).
All three monocyte subsets expressed anti-inflammatory genes, but ncM and intM were clearly dominant in this regard (Figure 4A).With the expression of anti-inflammatory genes, cM seemed to mainly regulate their own pro-inflammatory functions. Among those genes are regulators of inflammasome activation (MEFV (77), NLRP12 (78)), an enzymatic inactivator of leukotriene B4 (PTGR1) and sphingosine-1-phosphate (SGPL1) (79), a cytokine-scavenging protein (A2M) (80), as well as a negative regulator of cytokine signaling (SOCS3) and nitric oxide production (SPSB2). Moreover, cM were strongly enriched in transcripts for the IL-1 receptor antagonist (IL1RN) and exclusively expressed the decoy receptor for IL-1 (IL1R2). Also IL4R and IL13RA1 were expressed to higher levels in cM, suggesting that cM are especially receptive for IL-13, which was shown to inhibit the production of pro-inflammatory cytokines in macrophages (81). Furthermore, classical signaling through the IL-6 receptor (IL6R), 3-fold enriched in cM over ncM (Figure 2A), is reported to mediate anti-inflammatory effects of IL-6, as opposed to signaling through soluble IL-6 receptor (37). Notably, while cM expressed the highest levels of IL10, transcripts for the IL-10 receptor (IL10RA, IL10RB) were clearly enriched in ncM and intM. Additionally, both ncM and intM contained IL17REL transcripts, coding for a soluble receptor and potential negative regulator of IL-17 signaling (82). Moreover, ncM and intM were enriched for IL21R transcripts, with IL-21 signaling described to enhance SOCS gene expression and to limit cytokine production in human monocyte-derived cells (83). Also transcripts for TRAIL (TNFSF10), TNFR2 (TNFRSF1B) and DR6 (TNFRSF21) were strongly overexpressed in ncM and intM. Apoptosis-inducing TRAIL expression on monocytes is suggested to be critical for regulation of inflammation (84), and high expression of TNF receptor 2 (TNFRSF1B) in intM and ncM may favor suppressive signaling of transmembrane TNF-α, as reported for murine myeloid-derived suppressor cells (85). Death receptor 6 (TNFRSF21) has been reported to have inhibitory effects on monocyte differentiation when cleaved from the surface of tumor cells by matrix metalloproteinase 14 (MMP14) (86), the latter being expressed about 10-fold higher in ncM and intM (data not shown).
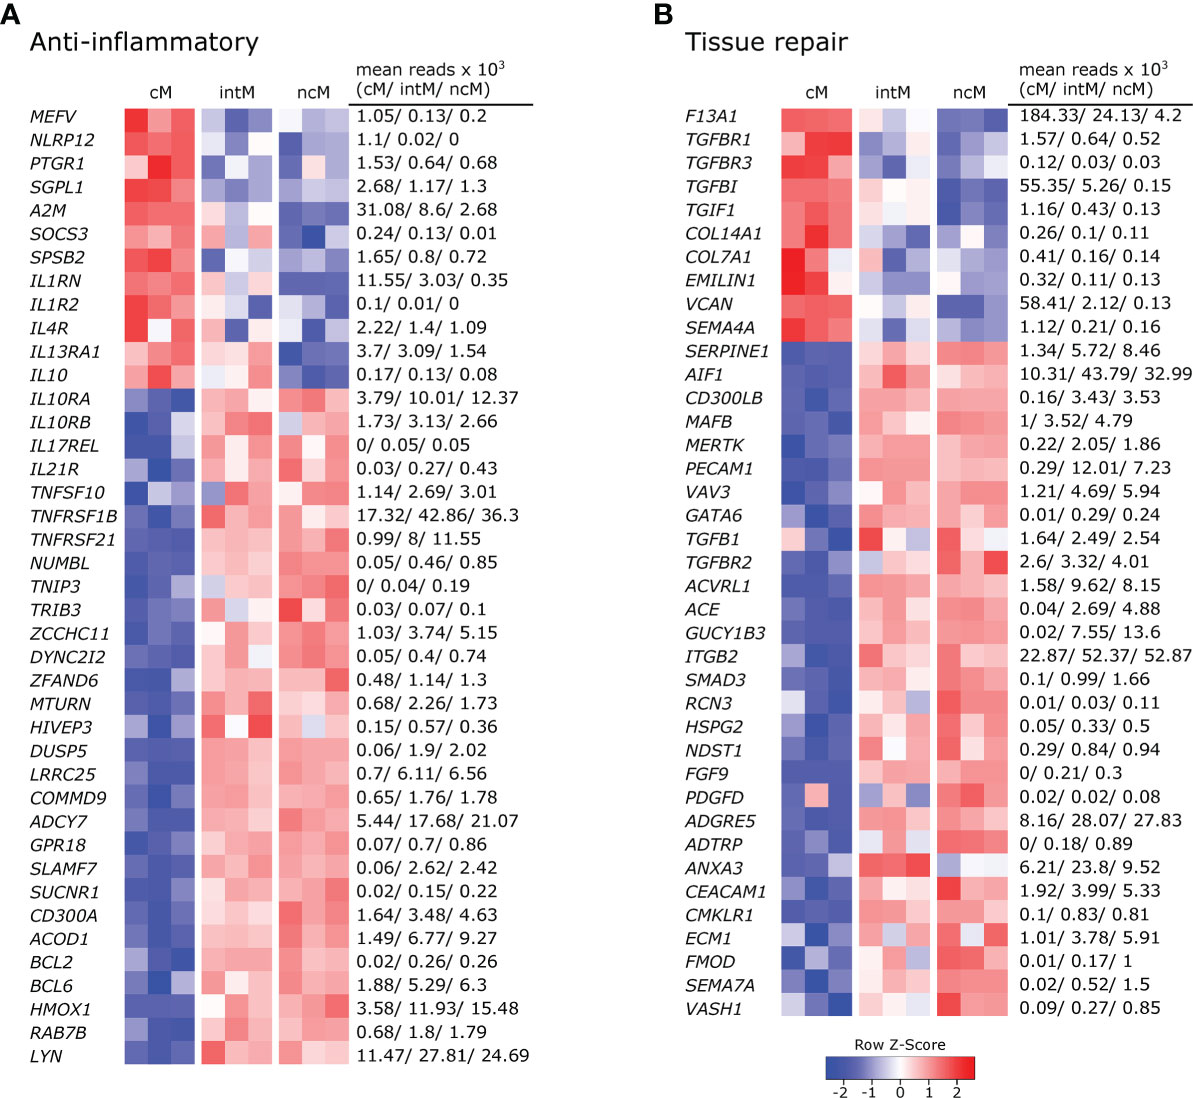
Figure 4 Gene expression associated with anti-inflammatory responses and tissue repair. Illumina sequencing was performed on RNA isolated from sorted monocyte subsets (cM, intM, ncM) of three animals. Heatmaps show row z-scores calculated from log2-transformed normalized counts of selected genes associated with anti-inflammatory responses (A), and tissue repair (B). Mean kilo reads for each subset and gene are given to the right of each heatmap. Genes were selected based on pairwise comparisons with DESeq2 (adjusted p-value < 0.05) and literature research.
Other anti-inflammatory genes over-expressed by ncM and intM are reported to be mostly involved in negative regulation of NF-κB signaling (NUMBL, TNIP3, TRIB3 (87), ZCCHC11, DYNC2I2 (88), ZFAND6 (89), MTURN (90), HIVEP3 (91), DUSP5, LRRC25, COMMD9 (92), ADCY7 (93)), but also include surface receptors involved in regulation of inflammation, such as GPR18 (receptor for resolvin D2) (94), SLAMF7 (95), SUCNR1 (96), and CD300A (97).
Notably, expression of ACOD1 was over 6-fold higher in ncM compared to cM. The metabolite itaconate, generated by IRG1 (ACOD1), is well-known for its anti-inflammatory effects (66, 98). Furthermore, BCL2 and BCL6 were transcribed to higher levels in ncM and intM. BCL-2 was shown to negatively regulate caspase-1 activation (99) and BCL-6 was recently reported to exert anti-inflammatory effects by suppressing IL6 transcription in murine macrophages (100). Like in human CD16+ monocytes (101), HMOX1 was significantly increased in ncM and intM. Heme oxygenase-1 (HMOX1) was shown to be induced by IL-10 and to mediate the anti-inflammatory effect of IL-10 in murine macrophages, presumably via NF-κB suppression by the heme degradation product carbon monoxide (102). Also in human monocytes, HMOX1 was reported to inhibit LPS-induced TNF-α and IL1-β production (103). Additionally, RAB7B, described to promote degradation of TLR4 (104) and TLR9 (105), was more than 2-fold higher expressed in ncM and intM. As was LYN, also expressed in human ncM and intM (106, 107), and reported to negatively regulate TLR-induced cytokine responses (108). Notably, LYN has recently been proposed as a negative regulator of murine ncM development (109). Overall, these results indicate anti-inflammatory functions for ncM and intM.
In line with their suggested anti-inflammatory and pro-resolving functions, a number of genes associated with different stages of tissue repair were upregulated in ncM and intM (Figure 4B). While cM were enriched in F13A1, mediating hemostasis (110), intM and ncM expressed SERPINE1, described to regulate clot resolution (111). Both ncM and intM contained the highest transcript levels of genes associated with efferocytosis [AIF1 (112), CD300LB (113), MAFB (114), MERTK (115), PECAM1 (116), VAV3 (117)]. Notably, MERTK has also been described as a negative regulator of human T-cell activation (118).
Furthermore, ncM expressed higher levels of TGFB1 and of genes coding for TGF receptors (TGFBR2, ACVRL1) or being directly or indirectly involved in TGF-β pathways (ACE, GUCY1B3, ITGB2, SMAD3). Transforming growth factor beta (TGF-β) is known as a pro-fibrotic cytokine involved in wound healing (119). Notably, cM expressed higher levels of the TGF receptor genes TGFBR1 and TGFBR3, and of TGFBI and TGIF1. Genes associated with extracellular matrix components dominantly transcribed by ncM included HSPG2 (basement membrane-specific heparin sulfate) and NDST1 (biosynthesis of heparin sulfate), whereas cM contained the highest transcript levels for collagens COL14A1, COL7A1, as well as for EMILIN1 (associates with elastic fibers) and VCAN (versican). Furthermore, fibroblast growth factor FGF9 and platelet-derived growth factor PDGFD were clearly enriched in ncM. The high expression of CMLKR1 in intM and ncM suggests that these subsets are attracted to inflamed tissues via chemerin and contribute to resolution of inflammation via binding to resolvin E1 (120), which was shown to increase IL-10 production and phagocytosis of apoptotic neutrophils in macrophages (121, 122).
In addition, several metalloproteinases and their regulators were either upregulated in ncM (ADAM9, ADAMTSL5, ADAMTS12, MMP14, MMP19, TIMP2, TSPAN14, ECM1) or cM (ADAM19, ADAM8, ADAMTS2, MMP25) (data not shown). Several metalloproteinases are described to be involved in wound healing (123), among which MMP14 and ADAM9 are suggested to regulate epithelial cell proliferation (123, 124). Finally, several genes associated with angiogenesis (ADGRE5/CD97 (125), ADTRP, ANXA3 (126), CEACAM1 (127), CMKLR1 (128), ECM1 (129), FMOD (130), SEMA7A (131), VASH1) were predominantly expressed by intM and ncM. Notably, SEMA4A (132), also reported to be involved in angiogenesis, showed the highest transcription in cM. Altogether, these data suggest anti-inflammatory pro-resolving functions of ncM and intM, as well as a prominent role of these subsets in wound healing and tissue regeneration.
Antigen presentation capabilities are reported for monocytes across species (1). As expected from phenotypic analyses, intM stood out by their high gene expression for MHC-II (BOLA-DQA5, BOLA-DQB, BOLA-DRA), and the co-stimulatory molecules CD40 and CD86 (Figure 5A). Interaction of CD40 with CD40L on T cells has been reported to stimulate Th17 responses (133). Notably, genes for MHC class I molecules (BOLA, BoLA), were transcribed to higher levels in intM and ncM. Furthermore, mRNA from genes associated with the presentation of lipid antigens to T cells (ENSBTAG00000039366 annotated as CD1a molecule-like, CD1E), was enriched in intM.
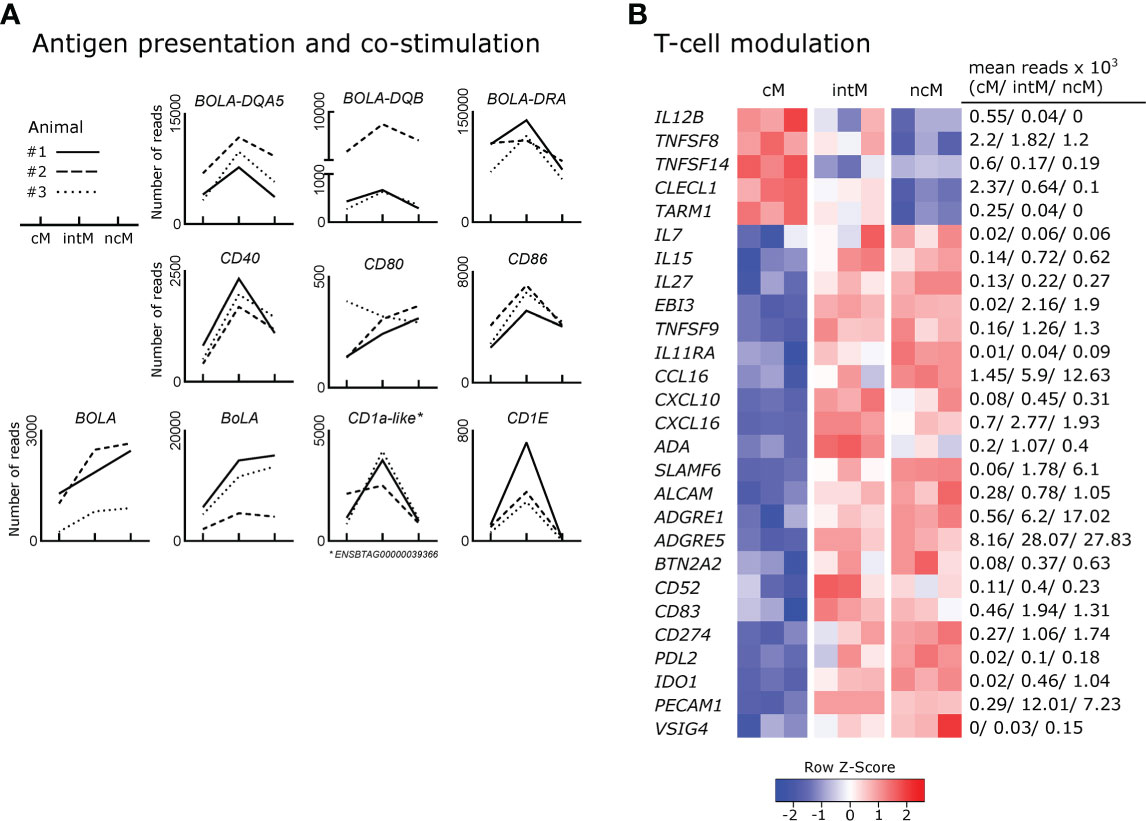
Figure 5 Expression of genes involved in the shaping of T-cell responses. Illumina sequencing was performed on RNA isolated from sorted monocyte subsets (cM, intM, ncM) of three animals (#1-3). (A) Gene expression promoting antigen presentation and co-stimulation. Graphs show the number of reads across monocyte subsets for selected genes with individual animals indicated by solid (#1), dashed (#2) and dotted (#3) lines. (B) Gene expression involved in T-cell modulation. Heatmap shows row z-scores calculated from log2-transformed normalized counts of selected genes. Mean kilo reads for each subset and gene are given to the right of the heatmap. Genes were selected based on pairwise comparisons with DESeq2 (adjusted p-value < 0.05) and literature research.
Genes encoding T-cell signaling cytokines predominantly expressed by cM included IL12B (Figure 5B), as well as TNFSF8 (CD30L) and TNFSF14 (LIGHT) (134, 135). In fact, transcription of IL12B mRNA was found to be absent in ncM, and over 13-fold increased in cM over intM. Two further genes upregulated in cM and reported to be involved in regulation of T-cell activation include CLECL1 and TARM1. CLECL1, 20-fold increased over ncM, has been reported to act as a T-cell costimulatory molecule, skewing the CD4 T-cell response towards Th2 by increasing IL-4 production and proliferation (136). TARM1, about 6-fold enriched in cM, has been reported to suppress CD4-T-cell activation and proliferation in vitro (137).
T-cell signaling cytokines predominantly expressed by intM and ncM included IL7 and IL15, reported to function in lymphoid homeostasis (138), and IL27, encoding a multifaceted cytokine described to both promote and suppress T-cell responses (139). Also, EBI3 (IL-27β), an essential component of the cytokines IL-27 and IL-35, was exclusively expressed in intM and ncM (approx. 110-fold increased). Moreover, TNFSF9, a ligand for CD137 on T cells shown to be important for the generation of antiviral CD8-T-cell responses (140), was 8-fold enriched in ncM over cM.
Furthermore, IL11RA (alpha subunit of the IL-11 receptor) was expressed at higher levels in ncM and intM. In line with almost absent IL12B transcription in ncM and intM, IL-11 signaling has been reported to inhibit IL-12 production in macrophages (141), which supports polarization towards Th2 responses (142). As shown in Figures 2B, 5B, chemokines relevant for T-cell responses were mainly expressed by ncM and intM (CCL3, CCL4, CCL5 and CCL16, CXCL10, CXCL16).
In fact, the vast majority of genes (22 out of 27) associated with modulation of T-cell responses was overexpressed in ncM and intM (Figure 5B). Intermediate monocytes expressed the highest levels of adenosine deaminase (ADA), which is reported to act as a modulator of T-cell differentiation, increasing the generation of effector, memory, and regulatory T cells (143). Both ncM and intM were enriched in transcripts for SLAMF6, reported to boost IFN-γ production and cytolytic anti-tumor activity of human CD8 T cells in vitro (144). Furthermore, expression of ALCAM, encoding a ligand for CD6 on T cells, important for stabilizing the immunological synapse between APC and T cells (145) and reported to mediate extravasation of monocytes (146), was more than 3-fold higher expressed in ncM than in cM. Notably ADGRE1 (F4/80), reported to be essential for the generation of Tregs and peripheral tolerance when expressed on antigen-presenting cells (147), was 30-fold enriched in ncM over cM. Moreover, ADGRE5, coding for CD97 and described to induce regulatory T cells and IL-10 production upon engagement of CD55 on CD4 T cells (148, 149) was 3-fold higher transcribed in ncM and intM. Consistent with the idea that ncM promote the generation of Tregs, they showed the highest transcription of BTN2A2, a butyrophilin reported to inhibit activation and induce Foxp3 expression in murine T cells (150, 151).
Many T-cell modulating genes overexpressed in ncM and intM were found to be genes involved in negative regulation of T-cell activation (BTN2A2, CD52, CD83, CD274/PDL1, PDL2, IDO1, PECAM1, and VSIG4). Soluble CD52 was reported to suppress T-cell activation via binding to Siglec-10 (152) and soluble CD83 was shown to regulate T-cell activation by binding to the TLR4/MD-2 complex on human CD14+ monocytes and inducing expression of anti-inflammatory mediators such as IDO and IL-10 (153). Transcription for PDL-1 (CD274), a well-known inhibitor of T-cell activation (154), was increased 6-fold in ncM over cM. Notably, PDL-1 has recently been employed as a marker of ncM for in-vivo tracking of this monocyte subset in mice (155). Similarly, the gene for PDL-2, a second ligand for PD-1 on T cells with T-cell inhibitory function (156), was 9-fold higher expressed in ncM, though at lower levels than the gene for PDL-1 (CD274). Strikingly, IDO1 expression was found to be significantly increased in intM (20-fold) and ncM (50-fold) when compared to cM, where expression was almost absent (mean of 20 reads). IDO1 was described to inhibit T-cell activation by degrading tryptophan, and to promote tolerance of DC and the expansion of Tregs (157). Also transcription of PECAM1 (CD31), described as a key co-inhibitory receptor promoting tolerogenic functions in both DCs and T cells through homophilic interactions (158), was greatly upregulated in ncM and intM. A recent in vitro study also suggested that high CD31 expression on DCs reduces priming of CD4 T cells by impairing stable cell-cell contacts (159). Furthermore, VSIG4, coding for a B7-family related protein specifically expressed on resting macrophages was primarily expressed in ncM. Notably, VSIG4 has been described as a strong negative regulator of T-cell activation, maintaining T-cell unresponsiveness in healthy tissues (160). Taken together, these data clearly indicate that monocyte subsets are actively involved in the shaping of T-cell responses, with ncM and intM being especially well equipped for T-cell suppression, either directly or via the induction of regulatory T cells.
Given that metabolism and immune function are tightly linked (161–163), differences in metabolic pathways can give indications for subset-specific functions. In fact, monocyte subsets showed prominent differences in the expression of genes relating to metabolism. The vast majority of these differentially expressed genes was associated with glycolysis and showed the highest expression in cM (Figure 6A). Apart from glycolytic genes, also genes involved in oxidative phosphorylation showed increased transcription in cM as compared to ncM (Figure 6B). Among those genes was ATP5ME (subunit of the mitochondrial ATP synthase), a mitochondrial inner membrane protein (MPV17) supporting oxidative phosphorylation (164), the genes coding for the components of complex II of the mitochondrial electron transport chain succinate dehydrogenase (SDHA, SDHB, SDHC, SDHD), and also most of the numerous genes coding for subunits of complex I (data not shown). In line with increased glycolysis in cM, transcripts for the glucose transporters SLC2A1 and SLC2A3 were about 3-fold enriched in cM (data not shown). As reported in our previous publication (9), also SLC genes involved in transport of succinate (SLC13A3), citrate (SLC13A5) and lactate/pyruvate (SLC16A1) were mainly expressed in cM. Notably, the metabolites succinate and citrate are both described as critical pro-inflammatory mediators linking metabolism to immune functions (165). Moreover, two genes associated with fructose metabolism (KHK, SORD) were predominantly expressed in cM. Fructose-induced metabolic changes were recently described to enhance inflammatory responses of dendritic cells (166). In addition, genes involved in the oxidative (G6PD, PGD) and non-oxidative (TALDO1) pentose-phosphate pathway (PPP) showed the highest transcription in cM. The PPP, providing redox-equivalents and nucleotide precursors, was shown to be essential for pro-inflammatory functions of human macrophages (167, 168). Furthermore, PANK1, coding for a key enzyme in CoA synthesis was 5-fold upregulated in cM over ncM.
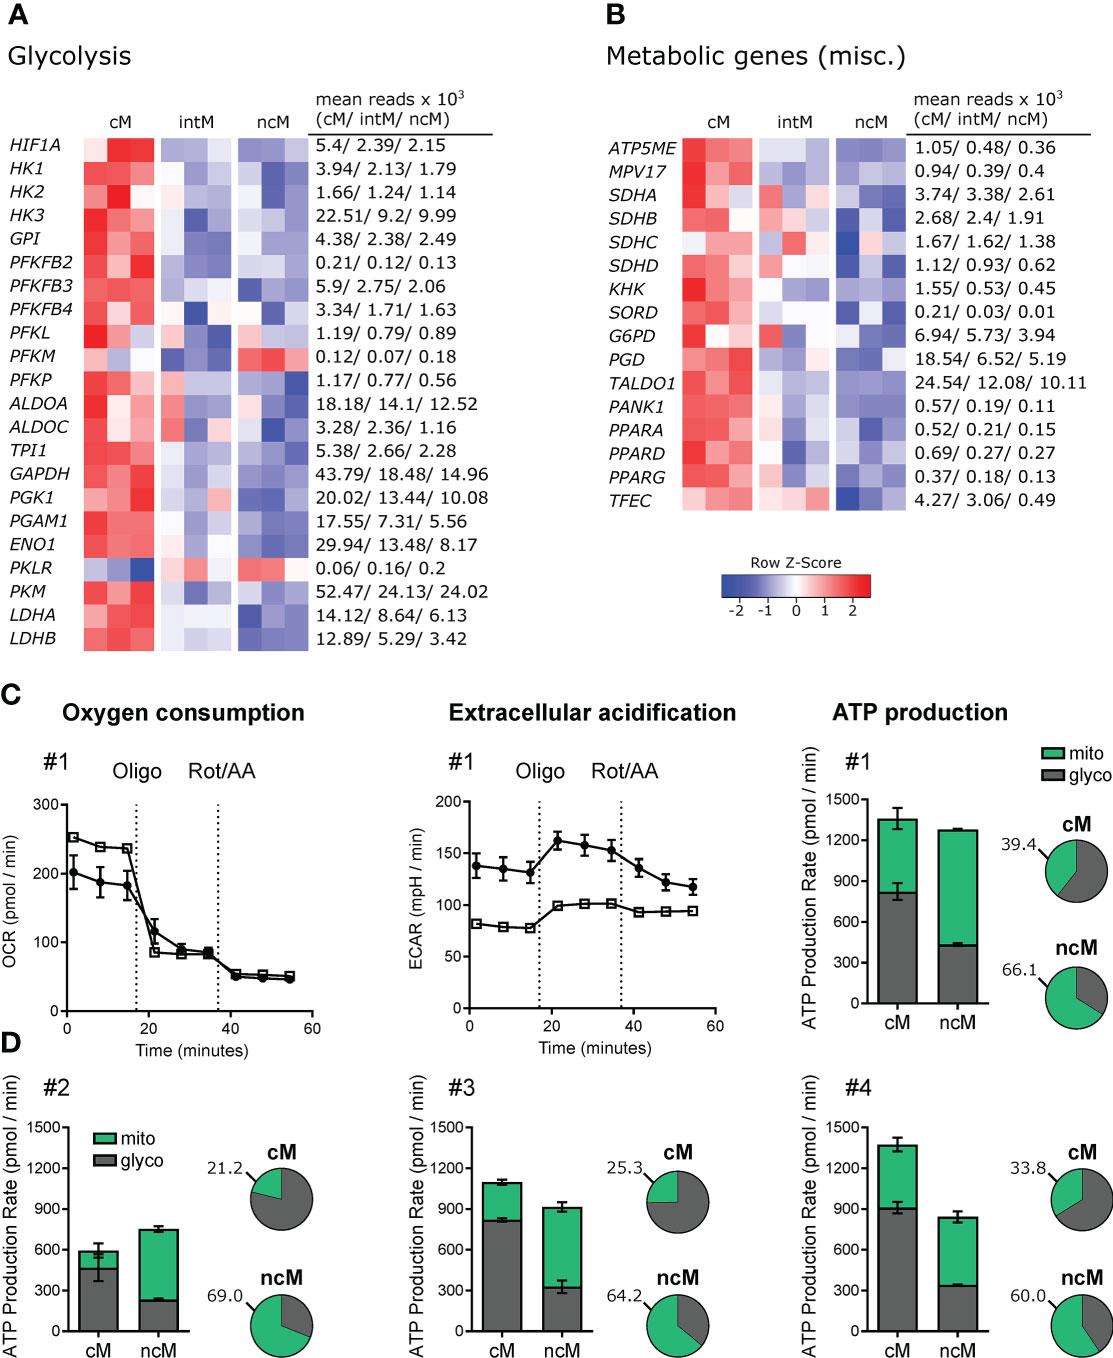
Figure 6 Metabolic gene expression and Agilent Seahorse Assays. (A, B) Illumina sequencing was performed on RNA isolated from sorted monocyte subsets (cM, intM, ncM) of three animals. Heatmaps show row z-scores calculated from log2-transformed normalized counts of glycolytic genes (A) and of genes associated with other metabolic pathways (B). Mean kilo reads for each subset and gene are given to the right of each heatmap. Genes were selected based on pairwise comparisons with DESeq2 (adjusted p-value < 0.05) and literature research. (C+D) Bovine monocyte subsets were FACS-sorted and metabolic activity was analyzed by Agilent Seahorse XF technology and the XF Real-Time ATP Rate Assay. Oxygen consumption rate (OCR) and extracellular acidification rate (ECAR) were automatically calculated from measured oxygen and pH decrease (Agilent Wave software). The electron transport chain inhibitors oligomycin and rotenone/antimycin A were injected sequentially to allow calculation of OXPHOS- as well as glycolysis-mediated ATP production rates (mito, glyco) from resulting OCR and ECAR. Monocyte subsets from four animals were analyzed. (C) For one representative animal, OCR and ECAR traces are depicted in addition to ATP production rates which are shown as absolute values (bar graphs) and relative values (pie charts). (D) ATP production rates for three other animals. Data of intM (2 animals) and monocyte-derived macrophages (2 out of 3 animals) is shown in Supplementary File 6.
Notably, all three genes coding for members of the PPAR family (PPARA, PPARD, PPARG) were transcribed at higher levels in cM. These lipid-activated nuclear receptors have evolved as key regulators linking lipid metabolism to inflammation, and in particular expression of PPARG is associated with anti-inflammatory functions (169). We recently showed that bovine cM downregulate PPARG transcription dramatically upon Gardiquimod (TLR7/8) stimulation in vitro (24). PPARA was recently proposed as an important mediator of antimicrobial responses to mycobacteria (170), inducing expression and translocation of TFEB, a key transcriptional activator of autophagy and lysosomal biogenesis. Notably, while TFEB was equally expressed in all monocyte subsets (data not shown), transcription of TFEC, a less well described member of the TFE family, was approximately 9- and 6-fold increased in cM and intM respectively compared to ncM.
Altogether, these data suggest that cM are metabolically more active than ncM and intM, with a significantly enhanced expression of genes involved in glycolysis, supporting pro-inflammatory functions.
To investigate differential use of metabolic pathways in monocyte subsets, we assessed the contribution of glycolysis and mitochondrial respiration to their ATP production. Extracellular flux analysis of sorted monocyte subsets demonstrated that cM produced the majority of their ATP through glycolysis, whereas ncM predominantly used oxidative phosphorylation (OXPHOS) for ATP production (Figure 6C, D). Raw data and statistical analyses (ATP production rates) are shown in Supplementary File 5.
Intermediate monocytes appeared to proportionally produce more ATP via glycolysis than ncM (Supplementary File 6), however these results should be interpreted with caution, as bulk RNA-seq of intM revealed pronounced animal-to-animal variability, presumably caused by considerable heterogeneity, or mixed populations within the intM gate.
Monocyte-derived macrophages (cM-M, intM-M, ncM-M) generated by a 6-day in-vitro culture showed considerably higher metabolic activity evident also by the need to reduce the cell number for Seahorse assays by five times. Notably, after this 6-day culture, the proportion of ATP produced by OXPHOS was increased in all subsets (Supplementary Files 6C, D; right panels). It remains to be elucidated whether this switch to OXPHOS is a hallmark of macrophage differentiation or rather a result of in-vitro culture conditions. Certainly, the observed preferences for different metabolic pathways ex vivo are in line with diverging roles of monocyte subsets in inflammation and beyond.
In addition to the manual gene-by-gene analysis described above, automated analyses with pre-defined gene sets were performed for the bulk RNA-seq datasets. Intermediate monocytes were excluded from the analyses due to the high animal-to-animal variability observed for certain genes. Enrichment analysis with gene ontology gene sets related to biological processes was found to be most informative. In line with the manual analysis, genes overexpressed in cM vs. ncM (DESeq2 output; adjusted p-value < 0.05) were enriched (q value < 0.05) in gene sets related to metabolism as well as to antibacterial and pro-inflammatory responses, whereas genes overexpressed in ncM vs. cM were enriched in gene sets related to adhesion, T-cell regulation, wound healing and antiviral responses.
The complete list of gene sets is provided as Supplementary File 7, including the lists of genes assigned to these gene sets, which should be carefully examined before making further conclusions. Especially for genes overexpressed in ncM, many gene sets were found to be misleading, suggesting for example an involvement in B-cell responses due to genes expressed in, and related to, B cells.
Single-cell RNA-seq has provided unprecedented insights into the heterogeneity of myeloid cells (171), highlighting that the classification of human and bovine monocyte subsets according to expression of CD14 and CD16 may be an oversimplification. In order to get an unbiased view on monocyte subset composition, we have performed 10x Genomics single-cell RNA-seq of bovine PBMC (summaries of Cell Ranger outputs are given in Supplementary File 8). Within PBMC, monocytes were readily identified by visualizing SIRPA expression in the UMAP projection (Figure 7A). To better resolve potential subclustering, clusters belonging to this group of SIRPA-expressing cells (c4, c10, c14, c18; Supplementary File 9A) were selected and re-clustered independently from the other cells in the PBMC dataset (Figure 7B). From the resulting eight clusters (resolution 0.6), only six clusters (clusters 0-5) were further analyzed, as clusters 6 and 7 appeared to contain doublets with expression of T- and B-cell associated genes alongside SIRPA expression (Supplementary File 9B). Visualization of key genes and analysis of the top differentially expressed genes identified cluster 2 as ncM/intM and cluster 5 as cDC2 (Figures 7C, D). Clusters 0, 3 and 4 appeared to contain cM in different activation states. Notably, cluster 4 stood out by high expression of several defensin genes. The complete list of differentially expressed genes is given in Supplementary File 10.
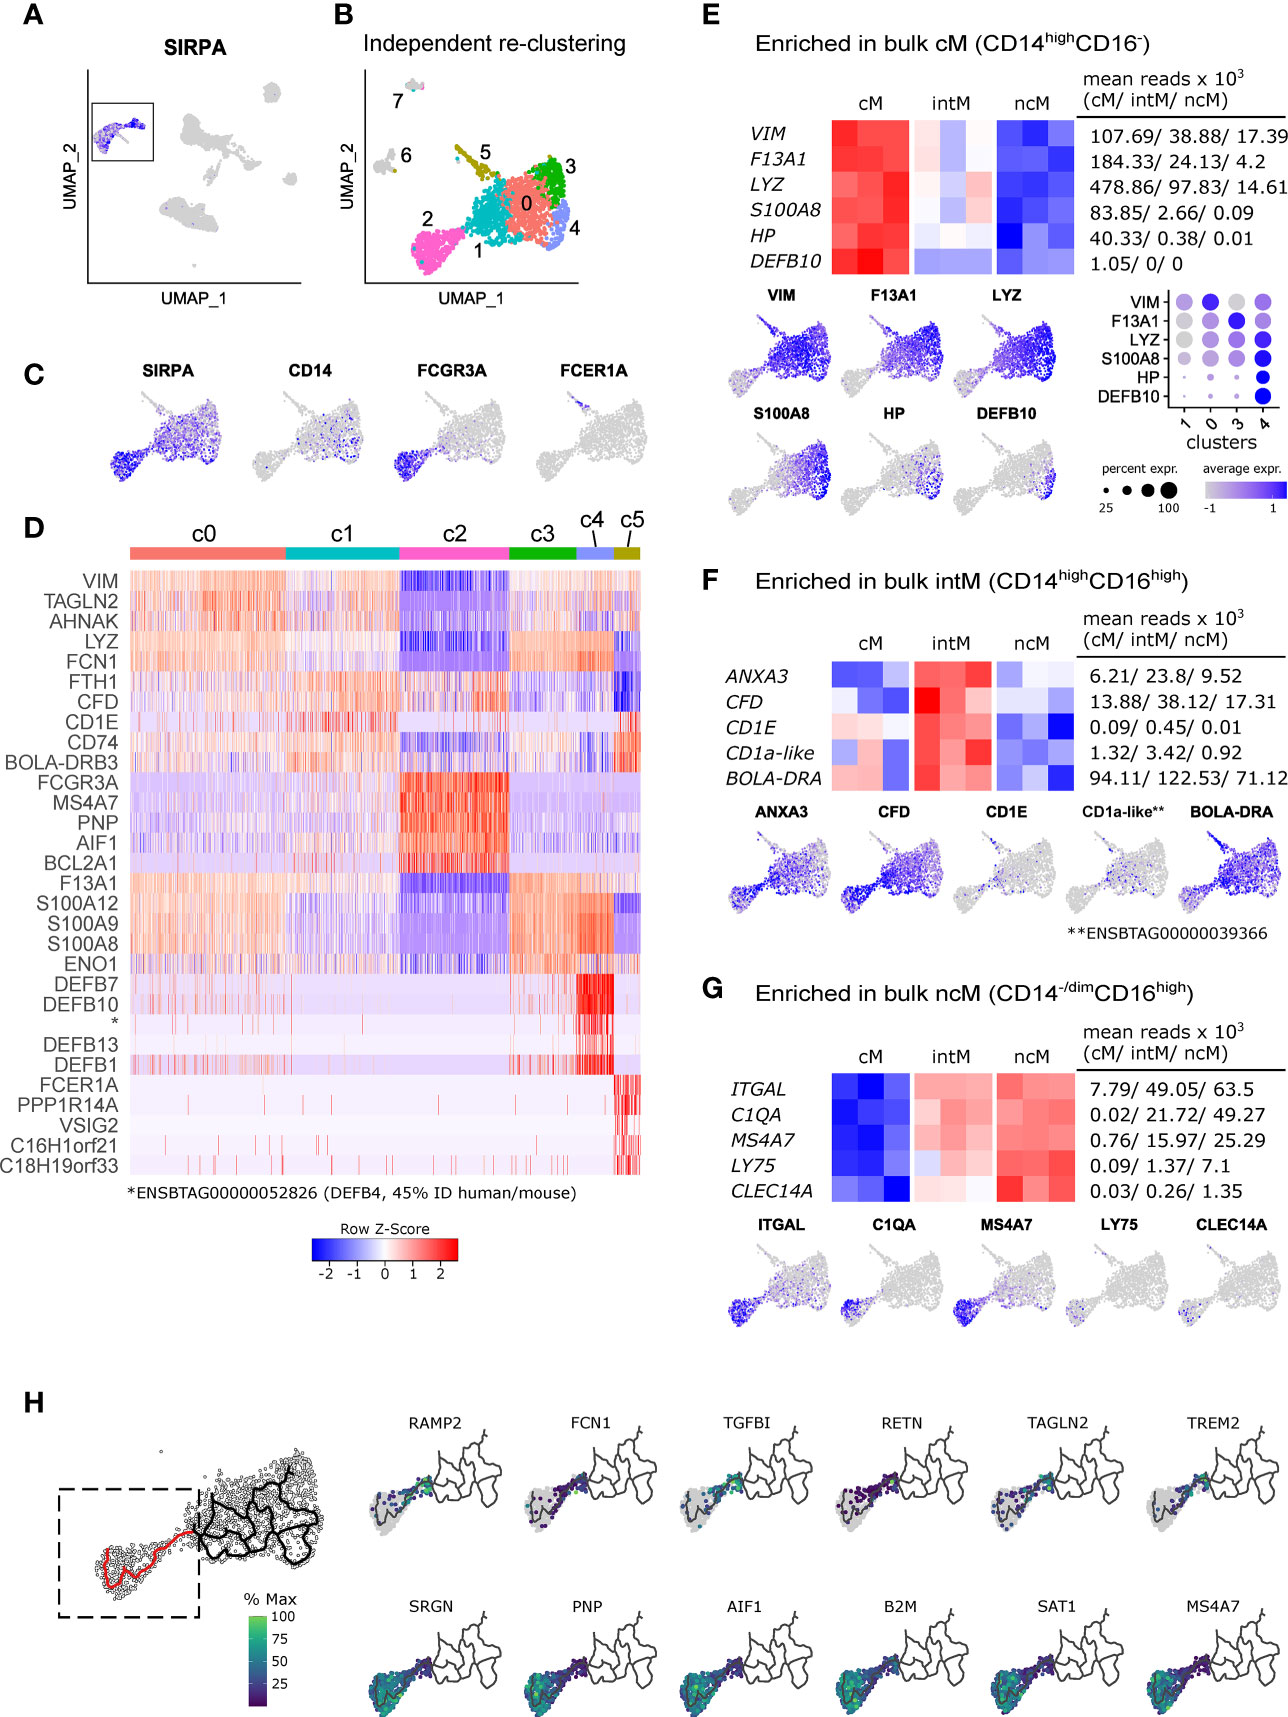
Figure 7 Single-cell RNA sequencing reveals heterogeneity of bovine monocytes. PBMC from two cows were subjected to 10x Genomics 3’ single-cell RNA sequencing. (A, B) Clusters containing SIRPA-expressing putative monocytes were subsetted for independent re-clustering. Clusters 6 and 7 were excluded from further analysis. (C) Feature plots show expression of SIRPA, CD14, FCGR3A (CD16) and FCER1A in the re-clustered dataset. (D) Heatmap shows the top 5 (adjusted p-value) differentially expressed genes, revealing expression signatures resembling classical monocytes (c0, c3, c4), intermediate monocytes (c1, c2), nonclassical monocytes (c2), and cDC2 (c5). Differential expression testing was performed with seurat’s FindAllMarkers function. (E-G) Visualization of selected signature genes enriched in bulk-sequenced cM (E), intM (F), and ncM (G). (H) Trajectory analysis on clusters 0-4 and visualization of genes differentially expressed along a selected trajectory (indicated in red). The complete list of differentially expressed genes along this trajectory is given in Supplementary File 11.
Visualization of signature genes derived from bulk-sequenced cM supported their cluster annotation, and for some genes (e.g. LYZ, S100A8), also revealed a gradual expression increase from clusters 1 and 0 towards clusters 3 and 4 (Figure 7E), while VIM and F13A1 showed the highest transcription in cluster 0 and 3, respectively. In line with their intermediate nature, transcripts enriched in bulk-sequenced intM (e.g. ANXA3, CFD, CD1E) were mostly detected in cells connecting clusters 1 and 2 (Figures 7B, F). It must be noted that bulk sequenced intM of the present study were defined as CD14highCD16high. It is expected that cluster 1 contains CD14highCD16dim cells, which were not included in the sorting gate used for bulk RNA sequencing. Transcripts enriched in bulk-sequenced ncM were almost exclusively detected in cluster 2 (Figures 7B, G). Notably, expression of C1QA (Figure 7G), as well as of C1QB and C1QC (not shown) appeared to be restricted to a subcluster within cluster 2, suggesting the presence of distinct cell states within ncM.
Trajectory analyses performed with Monocle 3, resulted in net-shaped trajectories spanning clusters 0, 1, 3 and 4, and a straight trajectory from cluster 1 towards cluster 2. Genes for which expression either significantly (q value < 0.05) decreased or increased along this straight trajectory are shown in Figure 7H (selection) and Supplementary File 11 (complete list).
Taken together, the unbiased analysis of single-cell transcripts revealed remarkable heterogeneity of bovine blood-derived cM in healthy animals, presumably reflecting a continuum of activation states, and supports the hypothesis that ncM are generated via differentiation from cM, with intM (CD14highCD16high), or a subpopulation thereof, representing a transient intermediate state, potentially specialized in lipid antigen presentation to T cells (Figure 8). Future studies need to address CD14highCD16dim monocytes and the heterogeneity of CD14highCD16high intermediate monocytes.
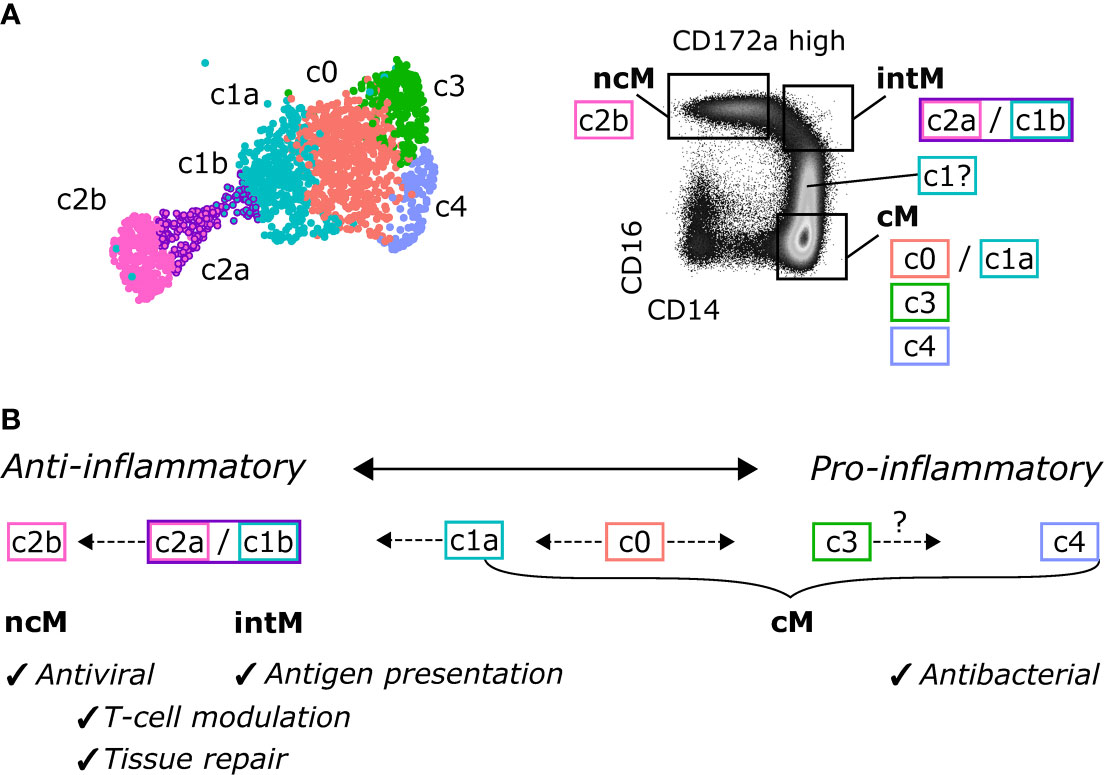
Figure 8 Proposed continuous differentiation and proposed functional specialization of bovine monocyte subsets. (A) Assignment of scRNA-seq clusters to CD14/CD16-defined monocyte subsets, as sorted for bulk RNA-seq. (B) Proposed differentiation pathways. A subcluster of cM (c0) may give rise to anti-inflammatory intM and ncM with specialized functions in antigen presentation and antiviral responses, respectively, and to pro-inflammatory subclusters of cM with prominent antibacterial functions.
With the present study, we extended the phenotypic characterization of bovine monocyte subsets and combined an in-depth analysis of their bulk- and single-cell transcriptomes with metabolic and TLR-stimulation assays to get detailed insights into subset-specific functions. Pairwise comparison of bulk gene expression coupled with extensive literature research revealed substantial transcriptomic differences between bovine monocyte subsets, likely determining their specializations, while single-cell transcriptomics provided an unbiased view on subset composition supporting differentiation of cM towards ncM via relatively transient intM. Genes differentially expressed between bulk-sequenced cM and ncM were also analyzed by GSEA with GO_BP gene sets. While GSEA largely confirmed the manual analysis, results of GSEA need to be interpreted with caution and require manual validation with respect to gene-set composition.
Bovine cM clearly emerged as pro-inflammatory, with overall gene expression supporting antibacterial inflammatory responses. This is in line with data on human and murine cM, and with earlier studies on bovine cM that have shown their superiority in phagocytosing bacteria (34). Both ncM and intM were dominant in the transcription of many genes associated with regulatory functions. The expression of anti-inflammatory genes and numerous genes associated with wound healing (efferocytosis, angiogenesis, fibrosis) clearly indicate that bovine ncM are specialized in the resolution of inflammation and in tissue regeneration, as suggested for ncM based on studies in mouse models (172). In line with our steady-state transcriptomic data, bovine ncM were previously shown to almost lack IL-1β production upon inflammasome activation in vitro (34). However, literature on the ability of human ncM to produce IL1-β is conflicting (6, 173).
Pro- and anti-inflammatory functions of cM and ncM, respectively, are also supported by their metabolic transcriptome, clearly indicating that cM are metabolically more active and skewed towards pro-inflammatory glycolysis. Differential use of ATP-generating metabolic pathways could also be confirmed by extracellular flux analysis, where cM predominantly performed glycolysis and ncM mainly employed oxidative phosphorylation (OXPHOS). These metabolic differences are in line with reported lower glucose uptake of bovine ncM as compared to cM (174), and match gene expression as well as respirometric measurements in human cells (175), suggesting similar metabolic programing and functional specialization of monocyte subsets in humans and cattle.
Transcriptomic data also suggest diverging functions of bovine monocyte subsets in the interaction with T cells. Notably, intM showed the highest expression of MHC-II, both on mRNA and protein level. High expression of MHC-II is also reported for human intM (5, 6), and may be linked to their superiority in stimulating human CD4-T-cell proliferation (5). Also considering the high expression of CD86 and the high transcription of CD1E and a CD1a-like gene, bovine intM may be particularly well equipped for co-stimulation, and lipid antigen presentation to T cells. A specialization in antigen presentation is also reported for human intM (15). Nonclassical monocytes and intM were enriched in transcripts for various genes promoting CD8-T-cell responses. This preferential activation of CD8 T cells and the risk associated with uncontrolled cytolytic T-cell responses might explain why ncM and intM also show high expression of genes mediating the inhibition of T cells and the generation of Tregs, the latter being reported for murine ncM (176). Furthermore, gene expression promoting activation of CD8 T cells, together with the interferon-associated gene signature and the high responsiveness to Gardiquimod and Resiquimod, indicate a specialization of bovine ncM towards antiviral responses, as suggested for human ncM (14).
In support of T-cell stimulating functions, we have detected monocytic cells transcriptionally resembling ncM, intM and cM in bovine mesenteric lymph nodes (scRNA-seq; manuscript in preparation), however the mechanisms of lymph-node entry remain elusive. In contrast to ncM and intM, which almost lack CD62L expression, bovine CD62Lhigh cM should be able to enter lymph nodes directly from blood. Also lymph-mediated entry of antigen-presenting monocytes has been reported for mice (177), however we could not observe CCR7 upregulation in/on stimulated bovine monocytes (24), making lymph-mediated entry via CCR7 rather unlikely.
As reported for human intM (6), bovine intM expressed the majority of genes at levels in-between cM and ncM, while showing higher transcriptional similarity with ncM. Notably, bovine intM were reported to produce the highest amounts of reactive oxygen species in response to opsonized bacteria and the highest amounts of IL-1β following inflammasome activation (34). This is surprising when looking at the steady-state transcriptome of intM described in the present study. A major limitation of studies on intM across species is their poor phenotypic definition, likely including multiple subsets or different activation states leading to conflicting results (11). In fact, heterogeneity of intM has been described for both humans (171) and mice (178). The lack of a clear cluster assignment in our scRNA-seq data and the observation that animal-to-animal variability was most prominent for intM in the bulk dataset support the idea that also bovine CD14highCD16high intM are a mixed population – or at least contain various cell states. Notably, a reported expansion of intM in response to dengue-virus infection was recently revealed to be an upregulation of CD16 on human cM (179). Also for bovine cM, an upregulation of CD16 is reported following stimulation with IFN-γ (34). Similarly, we found that sorted bovine cM (CD14+CD16-) were all CD16high after overnight culture (unpublished observation), making them phenotypically indistinguishable from intM when using the standard gating strategy with CD14 and CD16. Therefore, also dominant glycolysis and LPS responsiveness of intM, observed in the present study and both reminiscent of cM, should be interpreted in the light of possible gate contamination with cM that have recently upregulated CD16 expression – potentially a phenotypic alteration that precedes profound transcriptomic alterations in intM.
It is widely accepted that murine and human intM and ncM arise from cM in the periphery (19, 180, 181). Our single-cell RNA-seq data enable an unbiased view on monocyte subset composition in bovine blood and support the idea of sequential differentiation. Along this line, intM – as identified by bulk-derived signature genes – appeared to be bridging between cM and ncM in the UMAP projection of our single-cell dataset. Further studies are required to understand the differentiation trajectories and to elucidate whether bovine ncM can differentiate from cM under steady-state and/or inflammatory conditions and if and how they can enter tissues to fulfill their specialized functions during immune responses induced by infections and vaccinations. Given the striking similarities of bovine and human monocyte subsets (15), insights from studies in cattle should also advance our understanding of monocyte biology and associated diseases in humans.
The original contributions presented in the study are publicly available. This data can be found here: [https://www.ebi.ac.uk/ena/browser/home/PRJEB50632].
The animal study was reviewed and approved by the committee on animal experiments of the canton of Bern, Switzerland, and the cantonal veterinary authority (Amt für Landwirtschaft und Natur LANAT, Veterinärdienst VeD, Bern, Switzerland) under the license numbers BE102/15, BE104/17, and BE131/17.
ST and AS designed the study. ST performed laboratory work, analyzed and interpreted the data and wrote the manuscript. GTB performed laboratory work and analyzed flow cytometry data. HL and RB bioinformatically processed scRNA-seq data. RR and LvM assisted with Seahorse experiments and data interpretation. AS assisted with data interpretation and data analysis. All authors contributed to the article and approved the submitted version.
Open access funding was provided by the University Of Bern.
We want to thank the team of the Clinic for Ruminants at the Vetsuisse Faculty in Bern and the team of animal caretakers at the IVI in Mittelhäusern for blood sampling. Many thanks also go to Giuseppe Bertoni and Nicolas Ruggli for obtaining the cantonal licenses for blood sampling. We also want to thank Sylvie Python and Gael Auray for their support with cell sorting and RNA extraction and Corinne Hug for isolating PBMC and preparing monoclonal antibodies. Furthermore, we want to thank Stefan Müller and Thomas Schaffer (Flow Cytometry and Cell Sorting Facility, University of Bern) for cell sorting. Finally, we want to thank Pamela Nicholson and Tosso Leeb from the Next Generation Sequencing Platform of the University of Bern, and Irene Keller (Interfaculty Bioinformatics Unit, University of Bern) for their support with RNA-sequencing and bioinformatic analyses. A previous version of the manuscript has been uploaded to the preprint server bioRxiv (35).
Author LvM is employed by Bucher Biotec AG.
The remaining authors declare that the research was conducted in the absence of any commercial or financial relationships that could be construed as a potential conflict of interest.
All claims expressed in this article are solely those of the authors and do not necessarily represent those of their affiliated organizations, or those of the publisher, the editors and the reviewers. Any product that may be evaluated in this article, or claim that may be made by its manufacturer, is not guaranteed or endorsed by the publisher.
The Supplementary Material for this article can be found online at: https://www.frontiersin.org/articles/10.3389/fimmu.2022.889175/full#supplementary-material.
1. Jakubzick CV, Randolph GJ, Henson PM. Monocyte differentiation and antigen-presenting functions. Nat Rev Immunol (2017) 17:349–62. doi: 10.1038/nri.2017.28
2. Guilliams M, Mildner A, Yona S. Developmental and functional heterogeneity of monocytes. Immunity (2018) 49:595–613. doi: 10.1016/j.immuni.2018.10.005
3. Ginhoux F, Jung S. Monocytes and macrophages: developmental pathways and tissue homeostasis. Nat Rev Immunol (2014) 14:392–404. doi: 10.1038/nri3671
4. Hume DA, Irvine KM, Pridans C. The mononuclear phagocyte system: The relationship between monocytes and macrophages. Trends Immunol (2019) 40:98–112. doi: 10.1016/j.it.2018.11.007
5. Zawada AM, Rogacev KS, Rotter B, Winter P, Marell RR, Fliser D, et al. SuperSAGE evidence for CD14++CD16+ monocytes as a third monocyte subset. Blood (2011) 118:e50–61. doi: 10.1182/blood-2011-01-326827
6. Wong KL, Tai JJ, Wong WC, Han H, Sem X, Yeap WH, et al. Gene expression profiling reveals the defining features of the classical, intermediate, and nonclassical human monocyte subsets. Blood (2011) 118:e16–31. doi: 10.1182/blood-2010-12-326355
7. Hussen J, Schuberth HJ. Heterogeneity of bovine peripheral blood monocytes. Front Immunol (2017) 8:1875. doi: 10.3389/fimmu.2017.01875
8. Geissmann F, Jung S, Littman DR. Blood monocytes consist of two principal subsets with distinct migratory properties. Immunity (2003) 19:71–82. doi: 10.1016/S1074-7613(03)00174-2
9. Talker SC, Baumann A, Barut GT, Keller I, Bruggmann R, Summerfield A. Precise delineation and transcriptional characterization of bovine blood dendritic-cell and monocyte subsets. Front Immunol (2018) 9:2505. doi: 10.3389/fimmu.2018.02505
10. Serbina NV, Jia T, Hohl TM, Pamer EG. Monocyte-mediated defense against microbial pathogens. Annu Rev Immunol (2008) 26:421–52. doi: 10.1146/annurev.immunol.26.021607.090326
11. Narasimhan PB, Marcovecchio P, Hamers AAJ, Hedrick CC. Nonclassical monocytes in health and disease. Annu Rev Immunol (2019) 37:439–56. doi: 10.1146/annurev-immunol-042617-053119
12. Auffray C, Fogg D, Garfa M, Elain G, Join-Lambert O, Kayal S, et al. Monitoring of blood vessels and tissues by a population of monocytes with patrolling behavior. Science (2007) 317:666–70. doi: 10.1126/science.1142883
13. Carlin LM, Stamatiades EG, Auffray C, Hanna RN, Glover L, Vizcay-Barrena G, et al. Nr4a1-dependent Ly6C(low) monocytes monitor endothelial cells and orchestrate their disposal. Cell (2013) 153:362–75. doi: 10.1016/j.cell.2013.03.010
14. Cros J, Cagnard N, Woollard K, Patey N, Zhang SY, Senechal B, et al. Human CD14dim monocytes patrol and sense nucleic acids and viruses via TLR7 and TLR8 receptors. Immunity (2010) 33:375–86. doi: 10.1016/j.immuni.2010.08.012
15. Kapellos TS, Bonaguro L, Gemund I, Reusch N, Saglam A, Hinkley ER, et al. Human monocyte subsets and phenotypes in major chronic inflammatory diseases. Front Immunol (2019) 10:2035. doi: 10.3389/fimmu.2019.02035
16. Olingy CE, San Emeterio CL, Ogle ME, Krieger JR, Bruce AC, Pfau DD, et al. Non-classical monocytes are biased progenitors of wound healing macrophages during soft tissue injury. Sci Rep (2017) 7:447. doi: 10.1038/s41598-017-00477-1
17. Larson SR, Atif SM, Gibbings SL, Thomas SM, Prabagar MG, Danhorn T, et al. Ly6C(+) monocyte efferocytosis and cross-presentation of cell-associated antigens. Cell Death Differ (2016) 23:997–1003. doi: 10.1038/cdd.2016.24
18. Corripio-Miyar Y, Hope J, McInnes CJ, Wattegedera SR, Jensen K, Pang Y, et al. Phenotypic and functional analysis of monocyte populations in cattle peripheral blood identifies a subset with high endocytic and allogeneic T-cell stimulatory capacity. Vet Res (2015) 46:112. doi: 10.1186/s13567-015-0246-4
19. Patel AA, Zhang Y, Fullerton JN, Boelen L, Rongvaux A, Maini AA, et al. The fate and lifespan of human monocyte subsets in steady state and systemic inflammation. J Exp Med (2017) 214:1913–23. doi: 10.1084/jem.20170355
20. Love MI, Huber W, Anders S. Moderated estimation of fold change and dispersion for RNA-seq data with DESeq2. Genome Biol (2014) 15:550. doi: 10.1186/s13059-014-0550-8
21. Mootha VK, Lindgren CM, Eriksson KF, Subramanian A, Sihag S, Lehar J, et al. PGC-1alpha-responsive genes involved in oxidative phosphorylation are coordinately downregulated in human diabetes. Nat Genet (2003) 34:267–73. doi: 10.1038/ng1180
22. Subramanian A, Tamayo P, Mootha VK, Mukherjee S, Ebert BL, Gillette MA, et al. Gene set enrichment analysis: a knowledge-based approach for interpreting genome-wide expression profiles. Proc Natl Acad Sci U S A (2005) 102:15545–50. doi: 10.1073/pnas.0506580102
23. Liberzon A, Subramanian A, Pinchback R, Thorvaldsdottir H, Tamayo P, Mesirov JP. Molecular signatures database (MSigDB) 3.0. Bioinformatics (2011) 27:1739–40. doi: 10.1093/bioinformatics/btr260
24. Barut GT, Lischer HEL, Bruggmann R, Summerfield A, Talker SC. Transcriptomic profiling of bovine blood dendritic cells and monocytes following TLR stimulation. Eur J Immunol (2020). doi: 10.1002/eji.202048643
25. Team RC. R: A language and environment for statistical computing (2016). Available at: https://www.R-project.org/.
26. McCarthy DJ, Campbell KR, Lun AT, Wills QF. Scater: pre-processing, quality control, normalization and visualization of single-cell RNA-seq data in r. Bioinformatics (2017) 33:1179–86. doi: 10.1093/bioinformatics/btw777
27. Lun AT, Bach K, Marioni JC. Pooling across cells to normalize single-cell RNA sequencing data with many zero counts. Genome Biol (2016) 17:75. doi: 10.1186/s13059-016-0947-7
28. Lun AT, McCarthy DJ, Marioni JC. A step-by-step workflow for low-level analysis of single-cell RNA-seq data with bioconductor. F1000Res (2016) 5:2122. doi: 10.12688/f1000research.9501.2
29. Stuart T, Butler A, Hoffman P, Hafemeister C, Papalexi E, Mauck WM, et al. Comprehensive integration of single-cell data. Cell (2019) 177:1888–902.e21. doi: 10.1016/j.cell.2019.05.031
30. Zappia L, Oshlack A. Clustering trees: a visualization for evaluating clusterings at multiple resolutions. Gigascience (2018) 7:giy083. doi: 10.1093/gigascience/giy083
31. Trapnell C, Cacchiarelli D, Grimsby J, Pokharel P, Li S, Morse M, et al. The dynamics and regulators of cell fate decisions are revealed by pseudotemporal ordering of single cells. Nat Biotechnol (2014) 32:381–6. doi: 10.1038/nbt.2859
32. Qiu X, Mao Q, Tang Y, Wang L, Chawla R, Pliner HA, et al. Reversed graph embedding resolves complex single-cell trajectories. Nat Methods (2017) 14:979–82. doi: 10.1038/nmeth.4402
33. Cao J, Spielmann M, Qiu X, Huang X, Ibrahim DM, Hill AJ, et al. The single-cell transcriptional landscape of mammalian organogenesis. Nature (2019) 566:496–502. doi: 10.1038/s41586-019-0969-x
34. Hussen J, Düvel A, Sandra O, Smith D, Sheldon IM, Zieger P, et al. Phenotypic and functional heterogeneity of bovine blood monocytes. PLoS One (2013) 8:e71502. doi: 10.1371/journal.pone.0071502
35. Talker SC, Barut GT, Rufener R, von Münchow L, Summerfield A. Transcriptomic signature and metabolic programming of bovine classical and nonclassical monocytes indicate distinct functional specializations. bioRxiv (2020). doi: 10.1101/2020.10.30.362731:2020.10.30.362731
36. Grandoni F, Scata MC, Martucciello A, De Carlo E, De Matteis G, Hussen J. Comprehensive phenotyping of peripheral blood monocytes in healthy bovine. Cytometry A (2021) 101:122–130. doi: 10.1002/cyto.a.24492
37. Wolf J, Rose-John S, Garbers C. Interleukin-6 and its receptors: a highly regulated and dynamic system. Cytokine (2014) 70:11–20. doi: 10.1016/j.cyto.2014.05.024
38. Gregersen I, Sandanger O, Askevold ET, Sagen EL, Yang K, Holm S, et al. Interleukin 27 is increased in carotid atherosclerosis and promotes NLRP3 inflammasome activation. PLoS One (2017) 12:e0188387. doi: 10.1371/journal.pone.0188387
39. Lee SM, Jeon ST, Suk K, Lee WH. Macrophages express membrane bound form of APRIL that can generate immunomodulatory signals. Immunology (2010) 131:350–6. doi: 10.1111/j.1365-2567.2010.03306.x
40. Grell M, Douni E, Wajant H, Lohden M, Clauss M, Maxeiner B, et al. The transmembrane form of tumor necrosis factor is the prime activating ligand of the 80 kDa tumor necrosis factor receptor. Cell (1995) 83:793–802. doi: 10.1016/0092-8674(95)90192-2
41. Eissner G, Kolch W, Scheurich P. Ligands working as receptors: reverse signaling by members of the TNF superfamily enhance the plasticity of the immune system. Cytokine Growth Factor Rev (2004) 15:353–66. doi: 10.1016/j.cytogfr.2004.03.011
42. Holbrook J, Lara-Reyna S, Jarosz-Griffiths H, McDermott M. Tumour necrosis factor signalling in health and disease. F1000Res (2019) 8. doi: 10.12688/f1000research.17023.1
43. Darwich L, Coma G, Pena R, Bellido R, Blanco EJ, Este JA, et al. Secretion of interferon-gamma by human macrophages demonstrated at the single-cell level after costimulation with interleukin (IL)-12 plus IL-18. Immunology (2009) 126:386–93. doi: 10.1111/j.1365-2567.2008.02905.x
44. Chen J, Caspi RR, Chong WP. IL-20 receptor cytokines in autoimmune diseases. J Leukoc Biol (2018) 104:953–9. doi: 10.1002/JLB.MR1117-471R
45. Serrano I, Luque A, Aran JM. Exploring the immunomodulatory moonlighting activities of acute phase proteins for tolerogenic dendritic cell generation. Front Immunol (2018) 9:892. doi: 10.3389/fimmu.2018.00892
46. Li XX, Lee JD, Kemper C, Woodruff TM. The complement receptor C5aR2: A powerful modulator of innate and adaptive immunity. J Immunol (2019) 202:3339–48. doi: 10.4049/jimmunol.1900371
47. Liu J, Miwa T, Hilliard B, Chen Y, Lambris JD, Wells AD, et al. The complement inhibitory protein DAF (CD55) suppresses T cell immunity in vivo. J Exp Med (2005) 201:567–77. doi: 10.1084/jem.20040863
48. Longhi MP, Sivasankar B, Omidvar N, Morgan BP, Gallimore A. Cutting edge: murine CD59a modulates antiviral CD4+ T cell activity in a complement-independent manner. J Immunol (2005) 175:7098–102. doi: 10.4049/jimmunol.175.11.7098
49. Kimberley FC, Sivasankar B, Paul Morgan B. Alternative roles for CD59. Mol Immunol (2007) 44:73–81. doi: 10.1016/j.molimm.2006.06.019
50. Olivar R, Luque A, Naranjo-Gomez M, Quer J, Garcia de Frutos P, Borras FE, et al. The alpha7beta0 isoform of the complement regulator C4b-binding protein induces a semimature, anti-inflammatory state in dendritic cells. J Immunol (2013) 190:2857–72. doi: 10.4049/jimmunol.1200503
51. Ueda N, Yamanaka K, Yamamoto S. Purification and characterization of an acid amidase selective for n-palmitoylethanolamine, a putative endogenous anti-inflammatory substance. J Biol Chem (2001) 276:35552–7. doi: 10.1074/jbc.M106261200
52. Gorelik A, Gebai A, Illes K, Piomelli D, Nagar B. Molecular mechanism of activation of the immunoregulatory amidase NAAA. Proc Natl Acad Sci U.S.A. (2018) 115:E10032–40. doi: 10.1073/pnas.1811759115
53. Xia C, Braunstein Z, Toomey AC, Zhong J, Rao X. S100 proteins as an important regulator of macrophage inflammation. Front Immunol (2017) 8:1908. doi: 10.3389/fimmu.2017.01908
54. dos Santos G, Rogel MR, Baker MA, Troken JR, Urich D, Morales-Nebreda L, et al. Vimentin regulates activation of the NLRP3 inflammasome. Nat Commun (2015) 6:6574. doi: 10.1038/ncomms7574
55. Shenoy AR, Wellington DA, Kumar P, Kassa H, Booth CJ, Cresswell P, et al. GBP5 promotes NLRP3 inflammasome assembly and immunity in mammals. Science (2012) 336:481–5. doi: 10.1126/science.1217141
56. Krause K, Caution K, Badr A, Hamilton K, Saleh A, Patel K, et al. CASP4/caspase-11 promotes autophagosome formation in response to bacterial infection. Autophagy (2018) 14:1928–42. doi: 10.1080/15548627.2018.1491494
57. Gorelik A, Illes K, Nagar B. Crystal structure of the mammalian lipopolysaccharide detoxifier. Proc Natl Acad Sci U S A (2018) 115:E896–905. doi: 10.1073/pnas.1719834115
58. Wang ZQ, Xing WM, Fan HH, Wang KS, Zhang HK, Wang QW, et al. The novel lipopolysaccharide-binding protein CRISPLD2 is a critical serum protein to regulate endotoxin function. J Immunol (2009) 183:6646–56. doi: 10.4049/jimmunol.0802348
59. Hancock RE, Haney EF, Gill EE. The immunology of host defence peptides: beyond antimicrobial activity. Nat Rev Immunol (2016) 16:321–34. doi: 10.1038/nri.2016.29
60. Lu L, Arranz-Trullen J, Prats-Ejarque G, Pulido D, Bhakta S, Boix E. Human antimicrobial RNases inhibit intracellular bacterial growth and induce autophagy in mycobacteria-infected macrophages. Front Immunol (2019) 10:1500. doi: 10.3389/fimmu.2019.01500
61. Elsbach P. The bactericidal/permeability-increasing protein (BPI) in antibacterial host defense. J Leukoc Biol (1998) 64:14–8. doi: 10.1002/jlb.64.1.14
62. Bülow S, Zeller L, Werner M, Toelge M, Holzinger J, Entzian C, et al. Bactericidal/Permeability-increasing protein is an enhancer of bacterial lipoprotein recognition. Front Immunol (2018) 9. doi: 10.3389/fimmu.2018.02768
63. Eaton JW, Brandt P, Mahoney JR, Lee JT Jr. Haptoglobin: a natural bacteriostat. Science (1982) 215:691–3. doi: 10.1126/science.7036344
64. Dela Cruz CS, Liu W, He CH, Jacoby A, Gornitzky A, Ma B, et al. Chitinase 3-like-1 promotes streptococcus pneumoniae killing and augments host tolerance to lung antibacterial responses. Cell Host Microbe (2012) 12:34–46. doi: 10.1016/j.chom.2012.05.017
65. Yoon SI, Hong M, Wilson IA. An unusual dimeric structure and assembly for TLR4 regulator RP105-MD-1. Nat Struct Mol Biol (2011) 18:1028–35. doi: 10.1038/nsmb.2106
66. O'Neill LAJ, Artyomov MN. Itaconate: the poster child of metabolic reprogramming in macrophage function. Nat Rev Immunol (2019) 19:273–81. doi: 10.1038/s41577-019-0128-5
67. Wang Y, Shaked I, Stanford SM, Zhou W, Curtsinger JM, Mikulski Z, et al. The autoimmunity-associated gene PTPN22 potentiates toll-like receptor-driven, type 1 interferon-dependent immunity. Immunity (2013) 39:111–22. doi: 10.1016/j.immuni.2013.06.013
68. Spalinger MR, Lang S, Gottier C, Dai X, Rawlings DJ, Chan AC, et al. PTPN22 regulates NLRP3-mediated IL1B secretion in an autophagy-dependent manner. Autophagy (2017) 13:1590–601. doi: 10.1080/15548627.2017.1341453
69. Swaim CD, Canadeo LA, Monte KJ, Khanna S, Lenschow DJ, Huibregtse JM. Modulation of extracellular ISG15 signaling by pathogens and viral effector proteins. Cell Rep (2020) 31:107772. doi: 10.1016/j.celrep.2020.107772
70. Rivera-Serrano EE, Gizzi AS, Arnold JJ, Grove TL, Almo SC, Cameron CE. Viperin reveals its true function. Annu Rev Virol (2020) 7:421–46. doi: 10.1146/annurev-virology-011720-095930
71. Gizzi AS, Grove TL, Arnold JJ, Jose J, Jangra RK, Garforth SJ, et al. A naturally occurring antiviral ribonucleotide encoded by the human genome. Nature (2018) 558:610–4. doi: 10.1038/s41586-018-0238-4
72. Fisch D, Bando H, Clough B, Hornung V, Yamamoto M, Shenoy AR, et al. Human GBP1 is a microbe-specific gatekeeper of macrophage apoptosis and pyroptosis. EMBO J (2019) 38:e100926. doi: 10.15252/embj.2018100926
73. Hu Y, Wang J, Yang B, Zheng N, Qin M, Ji Y, et al. Guanylate binding protein 4 negatively regulates virus-induced type I IFN and antiviral response by targeting IFN regulatory factor 7. J Immunol (2011) 187:6456–62. doi: 10.4049/jimmunol.1003691
74. Cao W, Bover L, Cho M, Wen X, Hanabuchi S, Bao M, et al. Regulation of TLR7/9 responses in plasmacytoid dendritic cells by BST2 and ILT7 receptor interaction. J Exp Med (2009) 206:1603–14. doi: 10.1084/jem.20090547
75. Li MT, Di W, Xu H, Yang YK, Chen HW, Zhang FX, et al. Negative regulation of RIG-i-mediated innate antiviral signaling by SEC14L1. J Virol (2013) 87:10037–46. doi: 10.1128/JVI.01073-13
76. Kang JY, Nan X, Jin MS, Youn SJ, Ryu YH, Mah S, et al. Recognition of lipopeptide patterns by toll-like receptor 2-toll-like receptor 6 heterodimer. Immunity (2009) 31:873–84. doi: 10.1016/j.immuni.2009.09.018
77. Chae JJ, Wood G, Masters SL, Richard K, Park G, Smith BJ, et al. The B30.2 domain of pyrin, the familial Mediterranean fever protein, interacts directly with caspase-1 to modulate IL-1beta production. Proc Natl Acad Sci U.S.A. (2006) 103:9982–7. doi: 10.1073/pnas.0602081103
78. Normand S, Waldschmitt N, Neerincx A, Martinez-Torres RJ, Chauvin C, Couturier-Maillard A, et al. Proteasomal degradation of NOD2 by NLRP12 in monocytes promotes bacterial tolerance and colonization by enteropathogens. Nat Commun (2018) 9:5338. doi: 10.1038/s41467-018-07750-5
79. Allende ML, Bektas M, Lee BG, Bonifacino E, Kang J, Tuymetova G, et al. Sphingosine-1-phosphate lyase deficiency produces a pro-inflammatory response while impairing neutrophil trafficking. J Biol Chem (2011) 286:7348–58. doi: 10.1074/jbc.M110.171819
80. LaMarre J, Wollenberg GK, Gonias SL, Hayes MA. Cytokine binding and clearance properties of proteinase-activated alpha 2-macroglobulins. Lab Invest (1991) 65:3–14.
81. Minty A, Chalon P, Derocq JM, Dumont X, Guillemot JC, Kaghad M, et al. Interleukin-13 is a new human lymphokine regulating inflammatory and immune responses. Nature (1993) 362:248–50. doi: 10.1038/362248a0
82. Wu B, Jin M, Zhang Y, Wei T, Bai Z. Evolution of the IL17 receptor family in chordates: a new subfamily IL17REL. Immunogenetics (2011) 63:835–45. doi: 10.1007/s00251-011-0554-4
83. Strengell M, Lehtonen A, Matikainen S, Julkunen I. IL-21 enhances SOCS gene expression and inhibits LPS-induced cytokine production in human monocyte-derived dendritic cells. J Leukoc Biol (2006) 79:1279–85. doi: 10.1189/jlb.0905503
84. Cartland SP, Genner SW, Martinez GJ, Robertson S, Kockx M, Lin RC, et al. TRAIL-expressing Monocyte/Macrophages are critical for reducing inflammation and atherosclerosis. iScience (2019) 12:41–52. doi: 10.1016/j.isci.2018.12.037
85. Hu X, Li B, Li X, Zhao X, Wan L, Lin G, et al. Transmembrane TNF-alpha promotes suppressive activities of myeloid-derived suppressor cells via TNFR2. J Immunol (2014) 192:1320–31. doi: 10.4049/jimmunol.1203195
86. DeRosa DC, Ryan PJ, Okragly A, Witcher DR, Benschop RJ. Tumor-derived death receptor 6 modulates dendritic cell development. Cancer Immunol Immunother (2008) 57:777–87. doi: 10.1007/s00262-007-0413-1
87. Wu M, Xu LG, Zhai Z, Shu HB. SINK is a p65-interacting negative regulator of NF-kappaB-dependent transcription. J Biol Chem (2003) 278:27072–9. doi: 10.1074/jbc.M209814200
88. Gao D, Wang R, Li B, Yang Y, Zhai Z, Chen DY. WDR34 is a novel TAK1-associated suppressor of the IL-1R/TLR3/TLR4-induced NF-kappaB activation pathway. Cell Mol Life Sci (2009) 66:2573–84. doi: 10.1007/s00018-009-0059-6
89. Chang EJ, Ha J, Kang SS, Lee ZH, Kim HH. AWP1 binds to tumor necrosis factor receptor-associated factor 2 (TRAF2) and is involved in TRAF2-mediated nuclear factor-kappaB signaling. Int J Biochem Cell Biol (2011) 43:1612–20. doi: 10.1016/j.biocel.2011.07.010
90. Sun X, Lu B, Hu B, Xiao W, Li W, Huang Z. Novel function of the chromosome 7 open reading frame 41 gene to promote leukemic megakaryocyte differentiation by modulating TPA-induced signaling. Blood Cancer J (2014) 4:e198. doi: 10.1038/bcj.2014.18
91. Hong JW, Allen CE, Wu LC. Inhibition of NF-kappaB by ZAS3, a zinc-finger protein that also binds to the kappaB motif. Proc Natl Acad Sci U.S.A. (2003) 100:12301–6. doi: 10.1073/pnas.2133048100
92. Burstein E, Hoberg JE, Wilkinson AS, Rumble JM, Csomos RA, Komarck CM, et al. COMMD proteins, a novel family of structural and functional homologs of MURR1. J Biol Chem (2005) 280:22222–32. doi: 10.1074/jbc.M501928200
93. Jiang LI, Sternweis PC, Wang JE. Zymosan activates protein kinase a via adenylyl cyclase VII to modulate innate immune responses during inflammation. Mol Immunol (2013) 54:14–22. doi: 10.1016/j.molimm.2012.10.027
94. Chiang N, Dalli J, Colas RA, Serhan CN. Identification of resolvin D2 receptor mediating resolution of infections and organ protection. J Exp Med (2015) 212:1203–17. doi: 10.1084/jem.20150225
95. Kim JR, Horton NC, Mathew SO, Mathew PA. CS1 (SLAMF7) inhibits production of proinflammatory cytokines by activated monocytes. Inflammation Res (2013) 62:765–72. doi: 10.1007/s00011-013-0632-1
96. Keiran N, Ceperuelo-Mallafre V, Calvo E, Hernandez-Alvarez MI, Ejarque M, Nunez-Roa C, et al. SUCNR1 controls an anti-inflammatory program in macrophages to regulate the metabolic response to obesity. Nat Immunol (2019) 20:581–92. doi: 10.1038/s41590-019-0372-7
97. Valiate BVS, Alvarez RU, Karra L, Queiroz-Junior CM, Amaral FA, Levi-Schaffer F, et al. The immunoreceptor CD300a controls the intensity of inflammation and dysfunction in a model of Ag-induced arthritis in mice. J Leukoc Biol (2019) 106:957–66. doi: 10.1002/JLB.3A1018-389R
98. Hooftman A, O’Neill LAJ. The immunomodulatory potential of the metabolite itaconate. Trends Immunol (2019) 40:687–98. doi: 10.1016/j.it.2019.05.007
99. Bruey JM, Bruey-Sedano N, Luciano F, Zhai D, Balpai R, Xu C, et al. Bcl-2 and bcl-XL regulate proinflammatory caspase-1 activation by interaction with NALP1. Cell (2007) 129:45–56. doi: 10.1016/j.cell.2007.01.045
100. Li Q, Zhou L, Wang L, Li S, Xu G, Gu H, et al. Bcl6 modulates innate immunity by controlling macrophage activity and plays critical role in experimental autoimmune encephalomyelitis. Eur J Immunol (2020) 50:525–36. doi: 10.1002/eji.201948299
101. Ancuta P, Liu KY, Misra V, Wacleche VS, Gosselin A, Zhou X, et al. Transcriptional profiling reveals developmental relationship and distinct biological functions of CD16+ and CD16- monocyte subsets. BMC Genomics (2009) 10:403. doi: 10.1186/1471-2164-10-403
102. Wu B, Wu Y, Tang W. Heme catabolic pathway in inflammation and immune disorders. Front Pharmacol (2019) 10:825. doi: 10.3389/fphar.2019.00825
103. Rushworth SA, O'Connell MA. Haem oxygenase-1 in inflammation. Biochem Soc Trans (2004) 32:1093–4. doi: 10.1042/BST0321093
104. Wang Y, Chen T, Han C, He D, Liu H, An H, et al. Lysosome-associated small rab GTPase Rab7b negatively regulates TLR4 signaling in macrophages by promoting lysosomal degradation of TLR4. Blood (2007) 110:962–71. doi: 10.1182/blood-2007-01-066027
105. Yao M, Liu X, Li D, Chen T, Cai Z, Cao X. Late endosome/lysosome-localized Rab7b suppresses TLR9-initiated proinflammatory cytokine and type I IFN production in macrophages. J Immunol (2009) 183:1751–8. doi: 10.4049/jimmunol.0900249
106. Schmiedel BJ, Singh D, Madrigal A, Valdovino-Gonzalez AG, White BM, Zapardiel-Gonzalo J, et al. Impact of genetic polymorphisms on human immune cell gene expression. Cell (2018) 175:1701–15.e16. doi: 10.1016/j.cell.2018.10.022
107. Monaco G, Lee B, Xu W, Mustafah S, Hwang YY, Carre C, et al. RNA-Seq signatures normalized by mRNA abundance allow absolute deconvolution of human immune cell types. Cell Rep (2019) 26:1627–40.e7. doi: 10.1016/j.celrep.2019.01.041
108. Keck S, Freudenberg M, Huber M. Activation of murine macrophages via TLR2 and TLR4 is negatively regulated by a Lyn/PI3K module and promoted by SHIP1. J Immunol (2010) 184:5809–18. doi: 10.4049/jimmunol.0901423
109. Roberts ME, Barvalia M, Silva J, Cederberg RA, Chu W, Wong A, et al. Deep phenotyping by mass cytometry and single-cell RNA-sequencing reveals LYN-regulated signaling profiles underlying monocyte subset heterogeneity and lifespan. Circ Res (2020) 126:e61–79. doi: 10.1161/CIRCRESAHA.119.315708
110. Sun H, Kaartinen MT. Transglutaminases in monocytes and macrophages. Med Sci (Basel) (2018) 6(4):115. doi: 10.3390/medsci6040115
111. Ghosh AK, Vaughan DE. PAI-1 in tissue fibrosis. J Cell Physiol (2012) 227:493–507. doi: 10.1002/jcp.22783
112. Egana-Gorrono L, Chinnasamy P, Casimiro I, Almonte VM, Parikh D, Oliveira-Paula GH, et al. Allograft inflammatory factor-1 supports macrophage survival and efferocytosis and limits necrosis in atherosclerotic plaques. Atherosclerosis (2019) 289:184–94. doi: 10.1016/j.atherosclerosis.2019.07.022
113. Murakami Y, Tian L, Voss OH, Margulies DH, Krzewski K, Coligan JE. CD300b regulates the phagocytosis of apoptotic cells via phosphatidylserine recognition. Cell Death Differ (2014) 21:1746–57. doi: 10.1038/cdd.2014.86
114. Sato M, Shibata Y, Inoue S, Igarashi A, Tokairin Y, Yamauchi K, et al. MafB enhances efferocytosis in RAW264.7 macrophages by regulating axl expression. Immunobiology (2018) 223:94–100. doi: 10.1016/j.imbio.2017.10.007
115. Zizzo G, Hilliard BA, Monestier M, Cohen PL. Efficient clearance of early apoptotic cells by human macrophages requires M2c polarization and MerTK induction. J Immunol (2012) 189:3508–20. doi: 10.4049/jimmunol.1200662
116. Brown S, Heinisch I, Ross E, Shaw K, Buckley CD, Savill J. Apoptosis disables CD31-mediated cell detachment from phagocytes promoting binding and engulfment. Nature (2002) 418:200–3. doi: 10.1038/nature00811
117. Sindrilaru A, Peters T, Schymeinsky J, Oreshkova T, Wang H, Gompf A, et al. Wound healing defect of Vav3-/- mice due to impaired {beta}2-integrin-dependent macrophage phagocytosis of apoptotic neutrophils. Blood (2009) 113:5266–76. doi: 10.1182/blood-2008-07-166702
118. Cabezón R, Carrera-Silva EA, Flórez-Grau G, Errasti AE, Calderón-Gómez E, Lozano JJ, et al. MERTK as negative regulator of human T cell activation. J Leukoc Biol (2015) 97:751–60. doi: 10.1189/jlb.3A0714-334R
119. Frangogiannis N. Transforming growth factor-beta in tissue fibrosis. J Exp Med (2020) 217:e20190103. doi: 10.1084/jem.20190103
120. Arita M, Bianchini F, Aliberti J, Sher A, Chiang N, Hong S, et al. Stereochemical assignment, antiinflammatory properties, and receptor for the omega-3 lipid mediator resolvin E1. J Exp Med (2005) 201:713–22. doi: 10.1084/jem.20042031
121. Ohira T, Arita M, Omori K, Recchiuti A, Van Dyke TE, Serhan CN. Resolvin E1 receptor activation signals phosphorylation and phagocytosis. J Biol Chem (2010) 285:3451–61. doi: 10.1074/jbc.M109.044131
122. Herova M, Schmid M, Gemperle C, Hersberger M. ChemR23, the receptor for chemerin and resolvin E1, is expressed and functional on M1 but not on M2 macrophages. J Immunol (2015) 194:2330–7. doi: 10.4049/jimmunol.1402166
123. Gill SE, Parks WC. Metalloproteinases and their inhibitors: regulators of wound healing. Int J Biochem Cell Biol (2008) 40:1334–47. doi: 10.1016/j.biocel.2007.10.024
124. Mauch C, Zamek J, Abety AN, Grimberg G, Fox JW, Zigrino P. Accelerated wound repair in ADAM-9 knockout animals. J Invest Dermatol (2010) 130:2120–30. doi: 10.1038/jid.2010.60
125. Wang T, Ward Y, Tian L, Lake R, Guedez L, Stetler-Stevenson WG, et al. CD97, an adhesion receptor on inflammatory cells, stimulates angiogenesis through binding integrin counterreceptors on endothelial cells. Blood (2005) 105:2836–44. doi: 10.1182/blood-2004-07-2878
126. Meadows SM, Cleaver O. Annexin A3 regulates early blood vessel formation. PLoS One (2015) 10:e0132580. doi: 10.1371/journal.pone.0132580
127. Ergun S, Kilik N, Ziegeler G, Hansen A, Nollau P, Gotze J, et al. CEA-related cell adhesion molecule 1: a potent angiogenic factor and a major effector of vascular endothelial growth factor. Mol Cell (2000) 5:311–20. doi: 10.1016/S1097-2765(00)80426-8
128. Nakamura N, Naruse K, Kobayashi Y, Miyabe M, Saiki T, Enomoto A, et al. Chemerin promotes angiogenesis in vivo. Physiol Rep (2018) 6:e13962. doi: 10.14814/phy2.13962
129. Han Z, Ni J, Smits P, Underhill CB, Xie B, Chen Y, et al. Extracellular matrix protein 1 (ECM1) has angiogenic properties and is expressed by breast tumor cells. FASEB J (2001) 15:988–94. doi: 10.1096/fsb2fj990934com
130. Zheng Z, Jian J, Velasco O, Hsu CY, Zhang K, Levin A, et al. Fibromodulin enhances angiogenesis during cutaneous wound healing. Plast Reconstr Surg Glob Open (2014) 2:e275. doi: 10.1097/GOX.0000000000000243
131. Hu S, Liu Y, You T, Zhu L. Semaphorin 7A promotes VEGFA/VEGFR2-mediated angiogenesis and intraplaque neovascularization in ApoE(-/-) mice. Front Physiol (2018) 9:1718. doi: 10.3389/fphys.2018.01718
132. Iragavarapu-Charyulu V, Wojcikiewicz E, Urdaneta A. Semaphorins in angiogenesis and autoimmune diseases: Therapeutic targets? Front Immunol (2020) 11:346. doi: 10.3389/fimmu.2020.00346
133. Iezzi G, Sonderegger I, Ampenberger F, Schmitz N, Marsland BJ, Kopf M. CD40-CD40L cross-talk integrates strong antigenic signals and microbial stimuli to induce development of IL-17-producing CD4+ T cells. Proc Natl Acad Sci U S A (2009) 106:876–81. doi: 10.1073/pnas.0810769106
134. Croft M. Co-Stimulatory members of the TNFR family: keys to effective T-cell immunity? Nat Rev Immunol (2003) 3:609–20. doi: 10.1038/nri1148
135. Kober J, Leitner J, Klauser C, Woitek R, Majdic O, Stockl J, et al. The capacity of the TNF family members 4-1BBL, OX40L, CD70, GITRL, CD30L and LIGHT to costimulate human T cells. Eur J Immunol (2008) 38:2678–88. doi: 10.1002/eji.200838250
136. Ryan EJ, Marshall AJ, Magaletti D, Floyd H, Draves KE, Olson NE, et al. Dendritic cell-associated lectin-1: a novel dendritic cell-associated, c-type lectin-like molecule enhances T cell secretion of IL-4. J Immunol (2002) 169:5638–48. doi: 10.4049/jimmunol.169.10.5638
137. Radjabova V, Mastroeni P, Skjodt K, Zaccone P, de Bono B, Goodall JC, et al. TARM1 is a novel leukocyte receptor complex-encoded ITAM receptor that costimulates proinflammatory cytokine secretion by macrophages and neutrophils. J Immunol (2015) 195:3149–59. doi: 10.4049/jimmunol.1401847
138. Ma A, Koka R, Burkett P. Diverse functions of IL-2, IL-15, and IL-7 in lymphoid homeostasis. Annu Rev Immunol (2006) 24:657–79. doi: 10.1146/annurev.immunol.24.021605.090727
139. Tait Wojno ED, Hunter CA, Stumhofer JS. The immunobiology of the interleukin-12 family: Room for discovery. Immunity (2019) 50:851–70. doi: 10.1016/j.immuni.2019.03.011
140. Tan JT, Whitmire JK, Ahmed R, Pearson TC, Larsen CP. 4-1BB ligand, a member of the TNF family, is important for the generation of antiviral CD8 T cell responses. J Immunol (1999) 163:4859–68.
141. Leng SX, Elias JA. Interleukin-11 inhibits macrophage interleukin-12 production. J Immunol (1997) 159:2161–8.
142. Curti A, Ratta M, Corinti S, Girolomoni G, Ricci F, Tazzari P, et al. Interleukin-11 induces Th2 polarization of human CD4(+) T cells. Blood (2001) 97:2758–63. doi: 10.1182/blood.V97.9.2758
143. Martinez-Navio JM, Casanova V, Pacheco R, Naval-Macabuhay I, Climent N, Garcia F, et al. Adenosine deaminase potentiates the generation of effector, memory, and regulatory CD4+ T cells. J Leukoc Biol (2011) 89:127–36. doi: 10.1189/jlb.1009696
144. Eisenberg G, Engelstein R, Geiger-Maor A, Hajaj E, Merims S, Frankenburg S, et al. Soluble SLAMF6 receptor induces strong CD8(+) T-cell effector function and improves anti-melanoma activity In vivo. Cancer Immunol Res (2018) 6:127–38. doi: 10.1158/2326-6066.CIR-17-0383
145. Zimmerman AW, Joosten B, Torensma R, Parnes JR, van Leeuwen FN, Figdor CG. Long-term engagement of CD6 and ALCAM is essential for T-cell proliferation induced by dendritic cells. Blood (2006) 107:3212–20. doi: 10.1182/blood-2005-09-3881
146. Masedunskas A, King JA, Tan F, Cochran R, Stevens T, Sviridov D, et al. Activated leukocyte cell adhesion molecule is a component of the endothelial junction involved in transendothelial monocyte migration. FEBS Lett (2006) 580:2637–45. doi: 10.1016/j.febslet.2006.04.013
147. Lin HH, Faunce DE, Stacey M, Terajewicz A, Nakamura T, Zhang-Hoover J, et al. The macrophage F4/80 receptor is required for the induction of antigen-specific efferent regulatory T cells in peripheral tolerance. J Exp Med (2005) 201:1615–25. doi: 10.1084/jem.20042307
148. Capasso M, Durrant LG, Stacey M, Gordon S, Ramage J, Spendlove I. Costimulation via CD55 on human CD4+ T cells mediated by CD97. J Immunol (2006) 177:1070–7. doi: 10.4049/jimmunol.177.2.1070
149. Sutavani RV, Bradley RG, Ramage JM, Jackson AM, Durrant LG, Spendlove I. CD55 costimulation induces differentiation of a discrete T regulatory type 1 cell population with a stable phenotype. J Immunol (2013) 191:5895–903. doi: 10.4049/jimmunol.1301458
150. Ammann JU, Cooke A, Trowsdale J. Butyrophilin Btn2a2 inhibits TCR activation and phosphatidylinositol 3-kinase/Akt pathway signaling and induces Foxp3 expression in T lymphocytes. J Immunol (2013) 190:5030–6. doi: 10.4049/jimmunol.1203325
151. Sarter K, Leimgruber E, Gobet F, Agrawal V, Dunand-Sauthier I, Barras E, et al. Btn2a2, a T cell immunomodulatory molecule coregulated with MHC class II genes. J Exp Med (2016) 213:177–87. doi: 10.1084/jem.20150435
152. Bandala-Sanchez E, Zhang Y, Reinwald S, Dromey JA, Lee BH, Qian J, et al. T Cell regulation mediated by interaction of soluble CD52 with the inhibitory receptor siglec-10. Nat Immunol (2013) 14:741–8. doi: 10.1038/ni.2610
153. Horvatinovich JM, Grogan EW, Norris M, Steinkasserer A, Lemos H, Mellor AL, et al. Soluble CD83 inhibits T cell activation by binding to the TLR4/MD-2 complex on CD14(+) monocytes. J Immunol (2017) 198:2286–301. doi: 10.4049/jimmunol.1600802
154. Butte MJ, Keir ME, Phamduy TB, Sharpe AH, Freeman GJ. Programmed death-1 ligand 1 interacts specifically with the B7-1 costimulatory molecule to inhibit T cell responses. Immunity (2007) 27:111–22. doi: 10.1016/j.immuni.2007.05.016
155. Bianchini M, Duchene J, Santovito D, Schloss MJ, Evrard M, Winkels H, et al. PD-L1 expression on nonclassical monocytes reveals their origin and immunoregulatory function. Sci Immunol (2019) 4:eaar3054. doi: 10.1126/sciimmunol.aar3054
156. Latchman Y, Wood CR, Chernova T, Chaudhary D, Borde M, Chernova I, et al. PD-L2 is a second ligand for PD-1 and inhibits T cell activation. Nat Immunol (2001) 2:261–8. doi: 10.1038/85330
157. Mellor AL, Munn DH. IDO expression by dendritic cells: tolerance and tryptophan catabolism. Nat Rev Immunol (2004) 4:762–74. doi: 10.1038/nri1457
158. Clement M, Fornasa G, Guedj K, Ben Mkaddem S, Gaston AT, Khallou-Laschet J, et al. CD31 is a key coinhibitory receptor in the development of immunogenic dendritic cells. Proc Natl Acad Sci U S A (2014) 111:E1101–10. doi: 10.1073/pnas.1314505111
159. Saul L, Mair I, Ivens A, Brown P, Samuel K, Campbell JDM, et al. 1,25-dihydroxyvitamin D3 restrains CD4(+) T cell priming ability of CD11c(+) dendritic cells by upregulating expression of CD31. Front Immunol (2019) 10:600. doi: 10.3389/fimmu.2019.00600
160. Vogt L, Schmitz N, Kurrer MO, Bauer M, Hinton HI, Behnke S, et al. VSIG4, a B7 family-related protein, is a negative regulator of T cell activation. J Clin Invest (2006) 116:2817–26. doi: 10.1172/JCI25673
161. O'Neill LA, Pearce EJ. Immunometabolism governs dendritic cell and macrophage function. J Exp Med (2016) 213:15–23. doi: 10.1084/jem.20151570
162. Buck MD, Sowell RT, Kaech SM, Pearce EL. Metabolic instruction of immunity. Cell (2017) 169:570–86. doi: 10.1016/j.cell.2017.04.004
163. Pearce EJ, Pearce EL. Immunometabolism in 2017: Driving immunity: all roads lead to metabolism. Nat Rev Immunol (2018) 18:81–2. doi: 10.1038/nri.2017.139
164. Antonenkov VD, Isomursu A, Mennerich D, Vapola MH, Weiher H, Kietzmann T, et al. The human mitochondrial DNA depletion syndrome gene MPV17 encodes a non-selective channel that modulates membrane potential. J Biol Chem (2015) 290:13840–61. doi: 10.1074/jbc.M114.608083
165. Mills EL, Kelly B, O'Neill LAJ. Mitochondria are the powerhouses of immunity. Nat Immunol (2017) 18:488–98. doi: 10.1038/ni.3704
166. Jaiswal N, Agrawal S, Agrawal A. High fructose-induced metabolic changes enhance inflammation in human dendritic cells. Clin Exp Immunol (2019) 197:237–49. doi: 10.1111/cei.13299
167. Nagy C, Haschemi A. Time and demand are two critical dimensions of immunometabolism: The process of macrophage activation and the pentose phosphate pathway. Front Immunol (2015) 6. doi: 10.3389/fimmu.2015.00164
168. Baardman J, Verberk SGS, Prange KHM, van Weeghel M, van der Velden S, Ryan DG, et al. A defective pentose phosphate pathway reduces inflammatory macrophage responses during hypercholesterolemia. Cell Rep (2018) 25:2044–52.e5. doi: 10.1016/j.celrep.2018.10.092
169. Bensinger SJ, Tontonoz P. Integration of metabolism and inflammation by lipid-activated nuclear receptors. Nature (2008) 454:470–7. doi: 10.1038/nature07202
170. Kim YS, Lee HM, Kim JK, Yang CS, Kim TS, Jung M, et al. PPAR-alpha activation mediates innate host defense through induction of TFEB and lipid catabolism. J Immunol (2017) 198:3283–95. doi: 10.4049/jimmunol.1601920
171. Villani AC, Satija R, Reynolds G, Sarkizova S, Shekhar K, Fletcher J, et al. Single-cell RNA-seq reveals new types of human blood dendritic cells, monocytes, and progenitors. Science (2017) 356:eaah4573. doi: 10.1126/science.aah4573
172. Wynn TA, Vannella KM. Macrophages in tissue repair, regeneration, and fibrosis. Immunity (2016) 44:450–62. doi: 10.1016/j.immuni.2016.02.015
173. Hadadi E, Zhang B, Baidzajevas K, Yusof N, Puan KJ, Ong SM, et al. Differential IL-1beta secretion by monocyte subsets is regulated by Hsp27 through modulating mRNA stability. Sci Rep (2016) 6:39035. doi: 10.1038/srep39035
174. Eger M, Hussen J, Drong C, Meyer U, von Soosten D, Frahm J, et al. Impacts of parturition and body condition score on glucose uptake capacity of bovine monocyte subsets. Vet Immunol Immunopathol (2015) 166:33–42. doi: 10.1016/j.vetimm.2015.04.007
175. Schmidl C, Renner K, Peter K, Eder R, Lassmann T, Balwierz PJ, et al. Transcription and enhancer profiling in human monocyte subsets. Blood (2014) 123:e90–9. doi: 10.1182/blood-2013-02-484188
176. Brunet A, LeBel M, Egarnes B, Paquet-Bouchard C, Lessard AJ, Brown JP, et al. NR4A1-dependent Ly6C(low) monocytes contribute to reducing joint inflammation in arthritic mice through treg cells. Eur J Immunol (2016) 46:2789–800. doi: 10.1002/eji.201646406
177. Jakubzick C, Gautier EL, Gibbings SL, Sojka DK, Schlitzer A, Johnson TE, et al. Minimal differentiation of classical monocytes as they survey steady-state tissues and transport antigen to lymph nodes. Immunity (2013) 39:599–610. doi: 10.1016/j.immuni.2013.08.007
178. Mildner A, Jung S. Development and function of dendritic cell subsets. Immunity (2014) 40:642–56. doi: 10.1016/j.immuni.2014.04.016
179. Ong SM, Teng K, Newell E, Chen H, Chen J, Loy T, et al. A novel, five-marker alternative to CD16-CD14 gating to identify the three human monocyte subsets. Front Immunol (2019) 10:1761. doi: 10.3389/fimmu.2019.01761
180. Arnold L, Henry A, Poron F, Baba-Amer Y, van Rooijen N, Plonquet A, et al. Inflammatory monocytes recruited after skeletal muscle injury switch into antiinflammatory macrophages to support myogenesis. J Exp Med (2007) 204:1057–69. doi: 10.1084/jem.20070075
Keywords: bovine monocyte subsets, classical monocytes, intermediate monocytes, nonclassical monocytes, transcriptome, single-cell RNA sequencing (scRNA-seq), immunometabolism, cattle
Citation: Talker SC, Barut GT, Lischer HEL, Rufener R, von Münchow L, Bruggmann R and Summerfield A (2022) Monocyte biology conserved across species: Functional insights from cattle. Front. Immunol. 13:889175. doi: 10.3389/fimmu.2022.889175
Received: 03 March 2022; Accepted: 30 June 2022;
Published: 29 July 2022.
Edited by:
Elodie Segura, Institut Curie, FranceReviewed by:
Thien-Phong Vu Manh, INSERM U1104 Centre d’immunologie de Marseille-Luminy (CIML), FranceCopyright © 2022 Talker, Barut, Lischer, Rufener, von Münchow, Bruggmann and Summerfield. This is an open-access article distributed under the terms of the Creative Commons Attribution License (CC BY). The use, distribution or reproduction in other forums is permitted, provided the original author(s) and the copyright owner(s) are credited and that the original publication in this journal is cited, in accordance with accepted academic practice. No use, distribution or reproduction is permitted which does not comply with these terms.
*Correspondence: Stephanie C. Talker, c3RlcGhhbmllLnRhbGtlckB2ZXRzdWlzc2UudW5pYmUuY2g=
Disclaimer: All claims expressed in this article are solely those of the authors and do not necessarily represent those of their affiliated organizations, or those of the publisher, the editors and the reviewers. Any product that may be evaluated in this article or claim that may be made by its manufacturer is not guaranteed or endorsed by the publisher.
Research integrity at Frontiers
Learn more about the work of our research integrity team to safeguard the quality of each article we publish.