 Jianwei Zhang
 Silu Meng
 Xiuqing Zhang1,2,3
 Kang Shao
 Cong Lin
- 1College of Life Sciences, University of Chinese Academy of Sciences, Beijing, China
- 2BGI-Shenzhen, Shenzhen, China
- 3Guangdong Provincial Key Laboratory of Human Disease Genomics, Shenzhen Key Laboratory of Genomics, BGI-Shenzhen, Shenzhen, China
- 4Department of Obstetrics and Gynecology, Tongji Hospital, Tongji Medical College, Huazhong University of Science and Technology, Wuhan, China
Background: Local cellular microenvironment plays a crucial role in the HPV-induced cervical malignant transformation. Characterization of the dynamic infiltration changes of microenvironment cells during cervical carcinogenesis would contribute to a better understanding of involved mechanisms.
Methods: Three public gene expression datasets of cervical squamous epithelium samples were collected and combined. We applied seven up-to-date computational methods for infiltrating estimation and compared their results (CD4+ and CD8+ T cells) to the known fraction. After benchmarking the applied methods, the cell filtration patterns were determined and clustered through fuzzy c-means algorithm.
Results: Most methods displayed better performance in predicting the abundance of CD4+ T cell than that of CD8+ T cell. The infiltration patterns of 33 microenvironment cell types (including 31 immune cells and 2 non-immune cells) were determined, and five immune cell clusters with distinct features were then derived. Meanwhile, opposite changes in abundance were observed between the activated and resting state of some immune cells from the progression perspective.
Conclusions: Based on characteristics and evaluation performance of different methods, as well as previous findings, for the first time we provide a comprehensive overview of the infiltration patterns of microenvironment cells throughout cervical cancer progression.
Introduction
Cervical cancer is thought to result from persistent infection with high-risk human papillomavirus (HR-HPV), which causes a continuum of progressive neoplastic changes known as squamous intraepithelial lesions (SILs) (1). However, precancerous lesions are not the only manifestation during cervical carcinogenesis. The cellular and acellular microenvironment surrounding the lesions undergo alterations, that also play a positive role in tumorigenesis and tumor progression (2, 3). The cellular tumor microenvironment (TME) is mainly composed of tumor vessels and perivascular cells, cancer-associated fibroblasts (CAFs), mesenchymal cells, and immune cells. Meanwhile, it is believed that non-neoplastic epithelium is also a critical component in the microenvironment of cervical lesions (4).
In premalignant lesions and cervical cancer, the host immune system (innate and adaptive immune) is closely related to HR-HPV infection. The virus induces multi mechanisms to evade immune detection, leading to chronic infection and host cell transformation (5, 6). Still, the majority of infections are spontaneously eliminated by the host immune response (7). Increasing evidence suggests that many immune cells in cervical tissue are involved in this immune response to against viruses (8). For example, NK cells could kill HPV-infected cells directly and then attract other immune cells to the sites of malignancy (9). Besides, non-immune cells are also associated with immune surveillance and disease progression (10). For example, keratinocytes synthesize various signaling and regulatory molecules (IFN-I, TNF-α and CXCL9, etc.) and antimicrobial peptides to support the recruitment and activation of immune cells (8). Hence, a better understanding of the infiltration features of microenvironment cells in the progression of the disease would lead to a new sight in the immunopathogenesis of cervical cancer.
Many traditional studies on immune cellular heterogeneity of patients with precancerous lesions have focused on peripheral blood (11, 12). The quantification of the immune infiltrates in tissue mainly relies on imaging, immunohistochemistry (IHC) and flow cytometry which generally measure a few cell subsets of interest at a time. Several current methods have been published for enumerating cell subsets proportions from gene expression profiles (13–15). This provides us with an opportunity to fully reveal the microenvironment changes across cervical disease stages. Several recent studies based on public expression profiles have described immune infiltration profiles in the preinvasive and invasive cervical lesions (16, 17). However, a comprehensive and accurate landscape of cellular microenvironment in cervical cancer progression has not been elucidated.
Herein, we performed a benchmarking between seven methods and compared their results (CD4+ and CD8+ T cells) to gold-standard measures from a meta-analysis (18). Based on the methods’ characteristics and predictive performance, we combined the estimated results of 33 cell types from various methods and constructed a landscape of cellular microenvironment transitions during cervical carcinogenesis.
Materials and Methods
Microarray Datasets Search and Processing
We downloaded the publicly available gene expression datasets of cervical tissue samples from Gene Expression Omnibus (GEO) database as of Oct 1st, 2021. The inclusion criteria were being no less than 25 samples, having at least three disease stages from normal, low-grade SIL (LSIL), high-grade SIL (HSIL) and squamous cell carcinoma (SCC), and being on Affymetrix platform. Three eligible microarray datasets, GSE63514 (19), GSE27678 (20) and GSE7803 (21), were collected in this study. Of note, the specimens in three studies were microdissected squamous epithelial samples. Raw CEL files of each dataset were downloaded and then preprocessed (including background correction, quantile normalization, and log2-transformation) using the Robust Multi-array Average (RMA) algorithm of the “affy” package (version 1.66.0, R foundation) (22). The datasets were combined and processed by the Combat function in the “sva” package (version 3.36.0, R foundation) (23, 24) to remove non-biological batch effects. Hierarchical clustering heatmap (Euclidean distance and Ward’s algorithm) was used to visualize correlation values between samples and detect outliers.
Estimation of Microenvironment Cells
Computational methods, including CIBERSORTX (Relative and Absolute, web portal) (13), EPIC (version 1.1.5, R foundation) (25), ImmuCellAI (web portal) (14), MCP-counter (version 1.2.0, R foundation) (26), quanTIseq (implemented via the R package immunedeconv, version 2.0.4) (27, 28), TIMER2.0 (web portal) (29), xCell (version 1.1.0, R foundation) (15), were applied for microenvironment estimation. Firstly, we constructed a compendium of gene signatures collected from the tools above. Secondly, our custom probe annotation function from the in-house package was used for probes mapping. The probe mapped to multiple genes was annotated preferentially to the gene presented in the compendium. When multiple probes were mapped to the same gene, the probe with the highest mean expression was used. Finally, the results of cell composition were generated according to annotated gene expression matrix. CIBERSORTX-Relative and -Absolute scores reflect the relative fraction and absolute proportion of each cell type in a mixture, respectively. Unless otherwise specified, CIBERSORTX refers to the CIBERSORTX-Absolute score in the context.
Analysis of CD4+ and CD8+ T Cells
We quantified CD4+ and CD8+ T cells and compared the results to the recently published formal meta-analysis (18). It should be taken into account that CIBERSORTX did not predict CD4+ T cell directly. Thus, the CD4+ T cell score was calculated as the sum of “CD4+ naïve T cell”, “CD4+ memory resting T cell”, “CD4+ memory activated T cell”, “T follicular helper cell (Tfh)” and “regulatory T cell (Treg)”.
CD4/CD8 ratio was also calculated. CIBERSORTX, EPIC, and quanTIseq generate relative cell fractions and allow intra-sample comparisons between cells. Other methods provide scores in arbitrary units that support inter-sample comparisons. While for xCell, we took the approach described by Marderstein et al. to calculate the ratio, adding ϵ = 10−10 to both the numerator and the denominator and then applying a rank-inverse normal transformation (30).
Evaluation of Microenvironment Feature
To describe the microenvironment feature, we selected 31 immune cell types and 2 non-immune cell types for further analysis. Immune cells included 11 innate immune cell subsets [monocyte, macrophage (M0, M1 and M2), monocyte-derived dendritic cell (Mo-DC), myeloid DC (mDC), neutrophil, eosinophil, basophil, mast and natural killer (NK) cells], 3 innate-like lymphocyte subsets [natural killer T (NKT), gamma delta T (Tgd) and mucosal‐associated invariant T (MAIT) cells] and 17 adaptive immune cell subsets [CD4+/CD8+ naïve T, CD4+ memory T, CD4+/CD8+ central memory T (Tcm), CD4+/CD8+ effector memory T (Tem), cytotoxic T (Tc), exhausted T (Tex), Th1, Th2, Th17, Tfh, Treg, naïve B, memory B, plasma cells]. Moreover, epithelial cells and keratinocytes, as essential components of cervical epithelial microenvironment, were also incorporated.
The infiltration patterns of each cell type from seven methods were collected. Furthermore, the final pattern was determined as follows: (1) CIBERSORTX scores for activated and resting cell types were added, and the sum preferentially represented the pattern of the corresponding cell type. (2) The results of ImmuCellAI, a method for predicting comprehensive T cell subsets, preferentially represented the pattern of T cells. (3) If more than one method provides estimates for the same cell type, the pattern supported by most methods was selected. (4) If the infiltration feature of a cell type has been reported in cervical precancerous lesion or SCC (through experimental measurements), the pattern was finally corrected with reference to the previous reports (Supplementary Table 1).
Fuzzy C-Means Clustering
Immune cell infiltration patterns along disease progression were clusterd using soft clustering approach of fuzzy c-means (FCM) algorithm implemented with “Mfuzz” package (version 2.48.0, R foundation) (31, 32). FCM algorithm allows each data point to belong to multiple clusters with varying degrees of membership, providing more flexibility than hard clustering. The optimal number of clusters (c) was set to five in this case. Heatmap of clusters was drawn by “pheatmap” package (version 1.0.12, R foundation).
Statistical Analysis
R statistical software (version 4.0.3) was used for statistical analyses and graphical visualization. The Pearson correlation was used to evaluate similarity of gene expression profiles. Correlation between abundance of immune cells inferred by different methods was evaluated by Spearman correlation. Wilcoxon rank-sum test with Benjamini-Hochberg (BH) correction was applied to compare CIBERSORTX-Absolute scores. All p-values were two-sided; p < 0.05 was considered statistically significant unless otherwise specified.
Results
Data Integration and Quality Management
This study merged three microarray datasets containing 46 normal, 25 LSIL, 90 HSIL and 49 SCC samples based on 13018 shared and filtered genes. A detailed description of included datasets is summarized in Table 1. Pearson’s correlation coefficients between samples were calculated, and a clustering heatmap was generated. Eight samples (5 normal, 1 LSIL and 2 SCC) that correlated poorly with other samples were removed from the subsequent analysis (Figure 1A). Next, boxplots and principal component analysis (PCA) plots were used to verify quality of gene expression data before and after batch effect correction (Figures 1B-E). After removing outliers and batch effect, the meta-dataset showed consistent expression distribution and reduced variance, indicating that it was suitable for further microenvironment estimation.
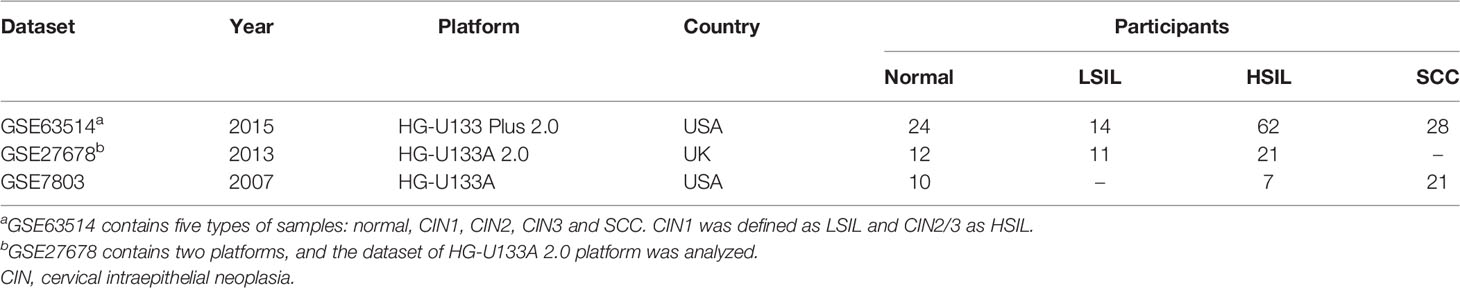
Table 1 Microarray datasets included in this study.
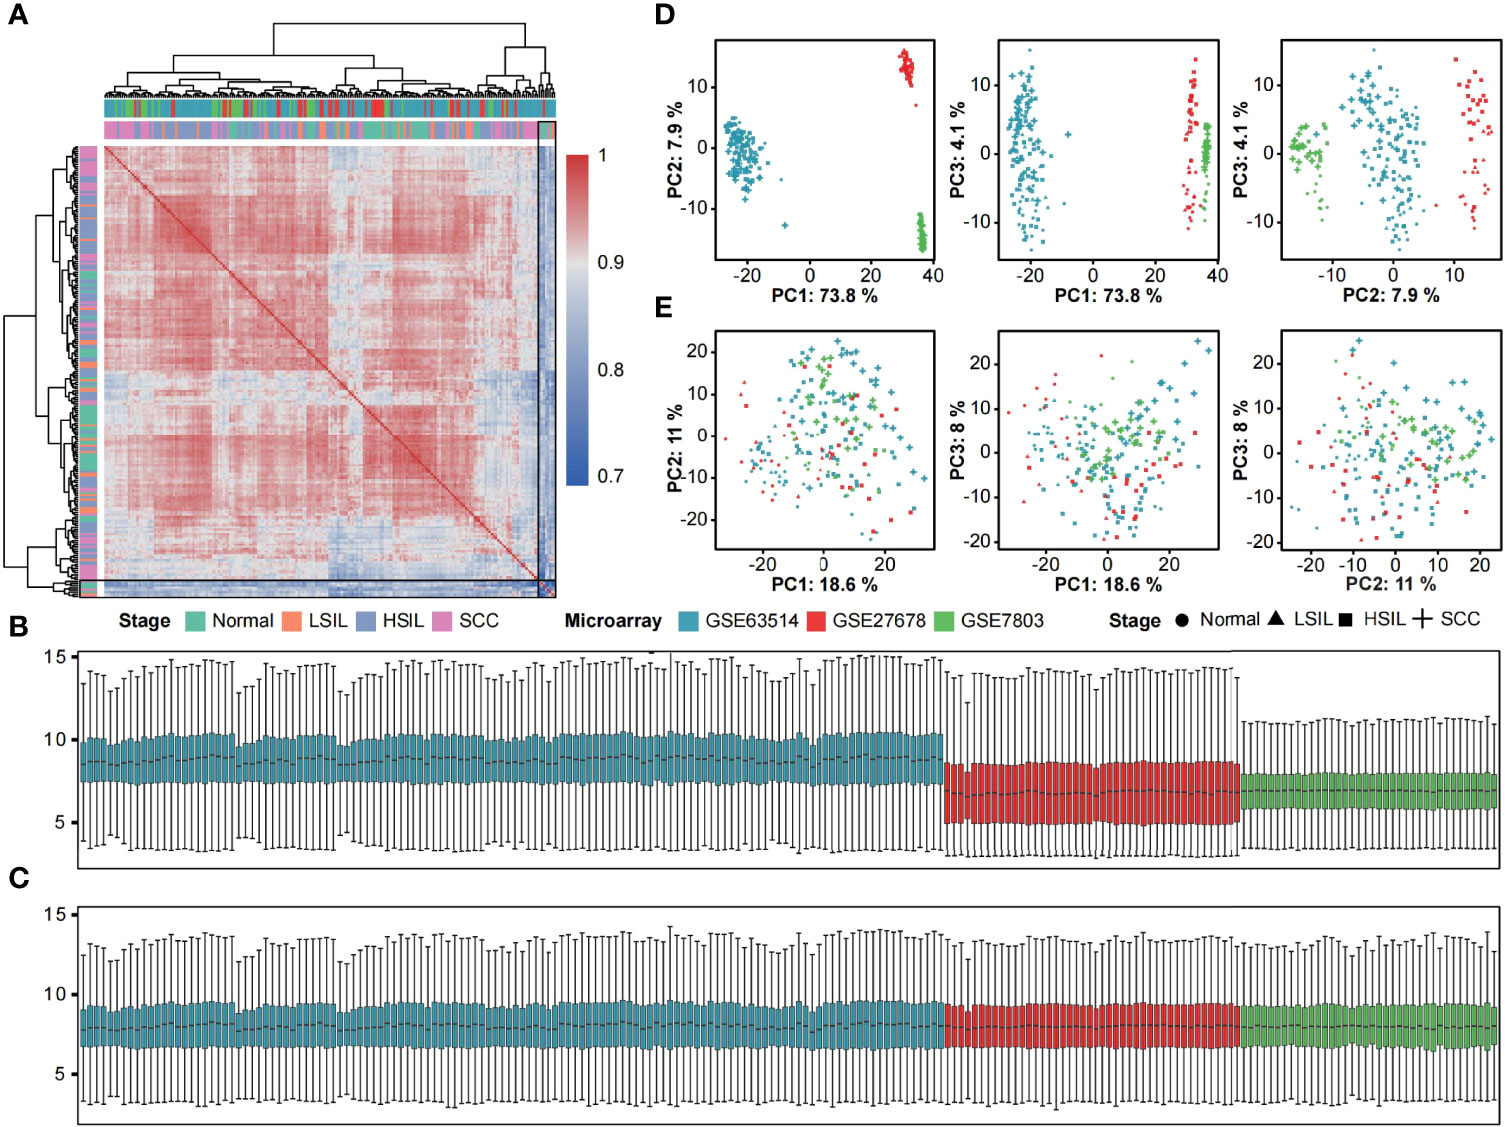
Figure 1 Removal of outliers and batch effect. (A) Heatmap displaying Pearson correlations between pairwise comparisons of meta-dataset. Clear outliers are highlighted with a black frame. Boxplots of log2-transformed gene expression distributions before (B) and after (C) batch effect correction. The boxes are colored according to datasets. Scatter plots of the first three principal components from the PCA of expression data before (D) and after (E) batch effect correction. Symbols are colored according to datasets and shaped according to disease stage.
Benchmark of Quantification Methods
A recent systematic review and meta-analysis of infiltrating T-cell populations in cervical carcinogenesis reported fewer CD4+ and CD8+ T cells in the epithelium of SILs than in normal and SCC tissue (18). We inferred microenvironment cell types with seven computational methods and compared the estimated CD4+ and CD8+ T cells infiltration patterns to the result from meta-analysis to assess predictive accuracy of selected methods.
We calculated the disease-stage correlation and average correlation of tested methods for the abundance of CD4+ and CD8+ T cells. In total, quanTIseq showed negative correlations with other methods in estimating CD4+ T cell (all Spearman’s rho < 0, Figure 2A). ImmuCellAI showed weak correlations with other methods in estimating CD8+ T cell (all Spearman’s rho < 0.4, Figure 2A). Moreover, the level of prediction agreement in SCC was higher than in other stages (Supplementary Figure 1). The analysis of CD4+ T cell infiltration pattern showed high similarity among methods except for quanTIseq and is consistent with the description in the meta-analysis (Figure 2B). In contrast, the methods’ predication on CD8+ T cell was inconsistent with the known pattern. Four methods (ImmuCellAI, quanTIseq, MCP-counter and xCell) showed higher CD8+ T cell infiltration in normal and HSIL, as well as high variances between the LSIL samples (Figure 2C).
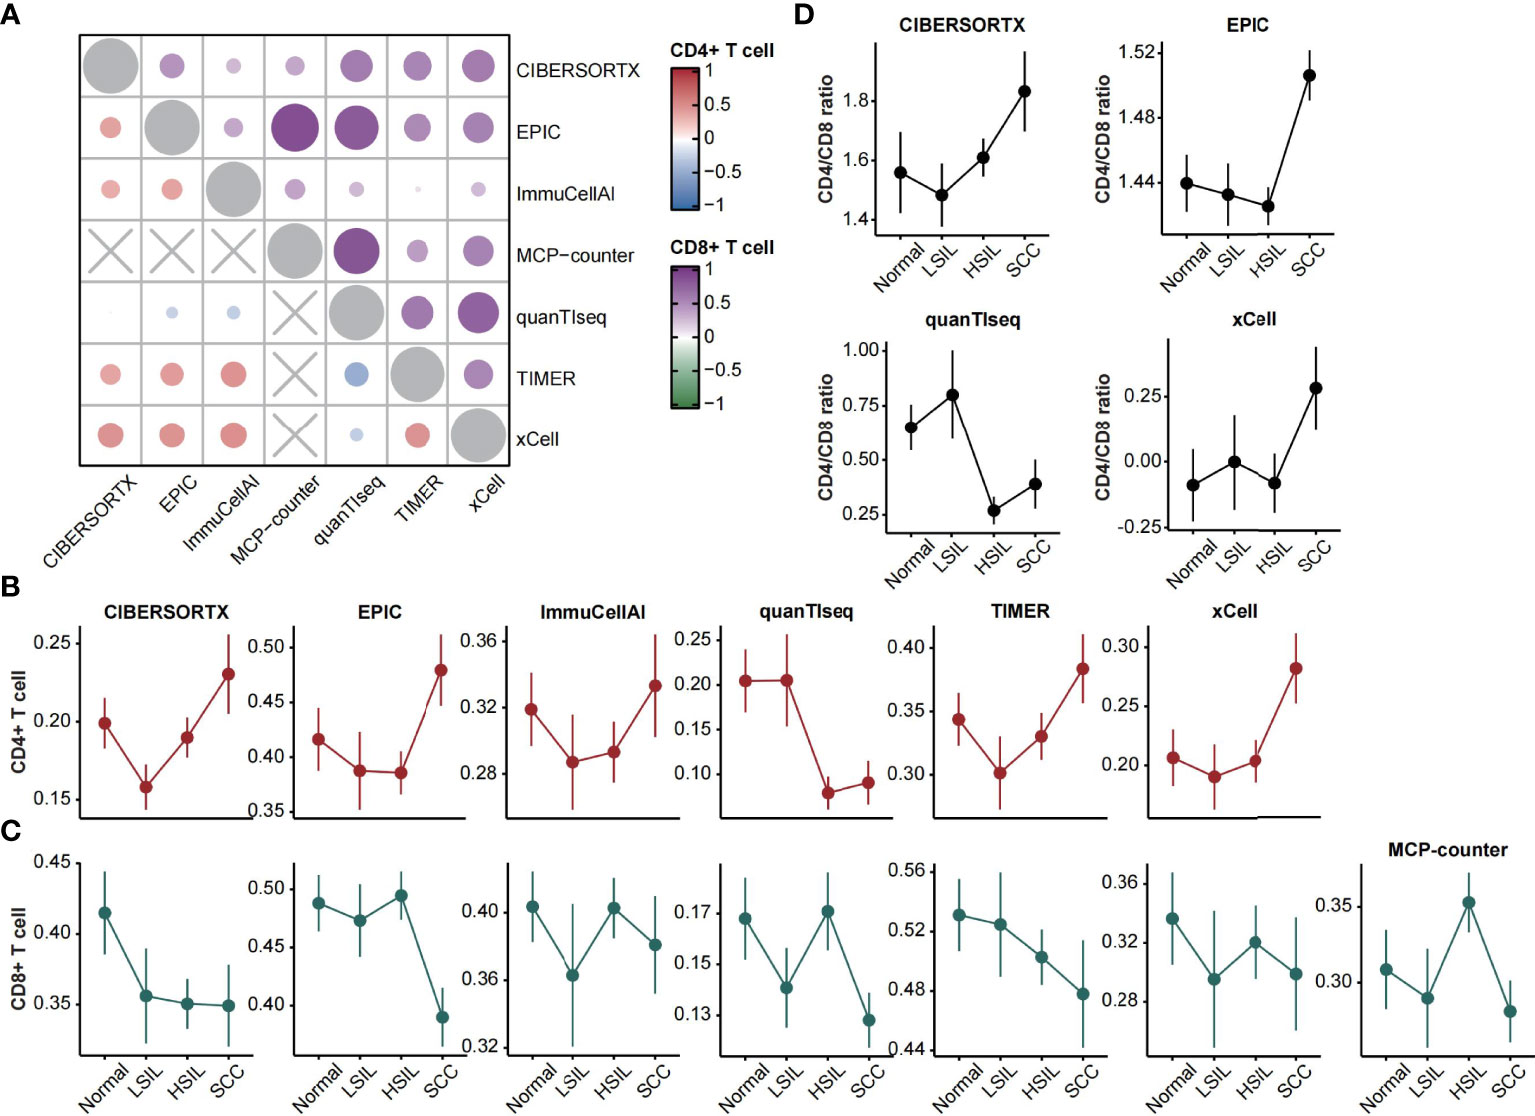
Figure 2 CD4+ and CD8+ T cells estimation. (A) Heatmap displaying average Spearman correlations of seven computational methods for the CD4+ (left bottom) and CD8+ (right top) T cells abundance across disease stages. (B, C) Line plots showing the abundance of CD4+ and CD8+ T cells (mean ± SEM) changes over disease stages. The estimated scores were normalized between zero and one. (D) Line plots showing the CD4/CD8 ratio (mean ± SEM) changes over disease stages.
Furthermore, the ratio of CD4+ to CD8+ T cells could be calculated through four feasible methods. Three of them showed high consistency and featured higher ratios in SCC. QuanTIseq showed a decreased ratio in HSIL and SCC, which corresponded to the characterization of the meta-analysis (Figure 2D).
Dynamic Changes of Cellular Microenvironment During Cervical Carcinogenesis
According to the variety and accuracy of predictions from applied methods, CIBERSORTX, ImmuCellAI, and xCell were selected as guidelines and the rest methods were considered as references. Specifically, the microenvironment cells and their infiltration patterns were decided preferentially by guidelines methods. We presented a set of 33 cell types, spanning 31 immune cell types from distinct subsets of innate, innate-like, and adaptive immune cells and 2 non-immune cell types (epithelial cell, keratinocyte) to reveal an evolving microenvironment with the progression of cervical lesions. Then, we enumerated these cell types available in each of the seven analytical methods. The final infiltration pattern of each cell type was determined on the basis of several criteria (see the Materials and methods section). The complete list of selected cells and corresponding estimates are shown in Figure 3 and Supplementary Table 2.
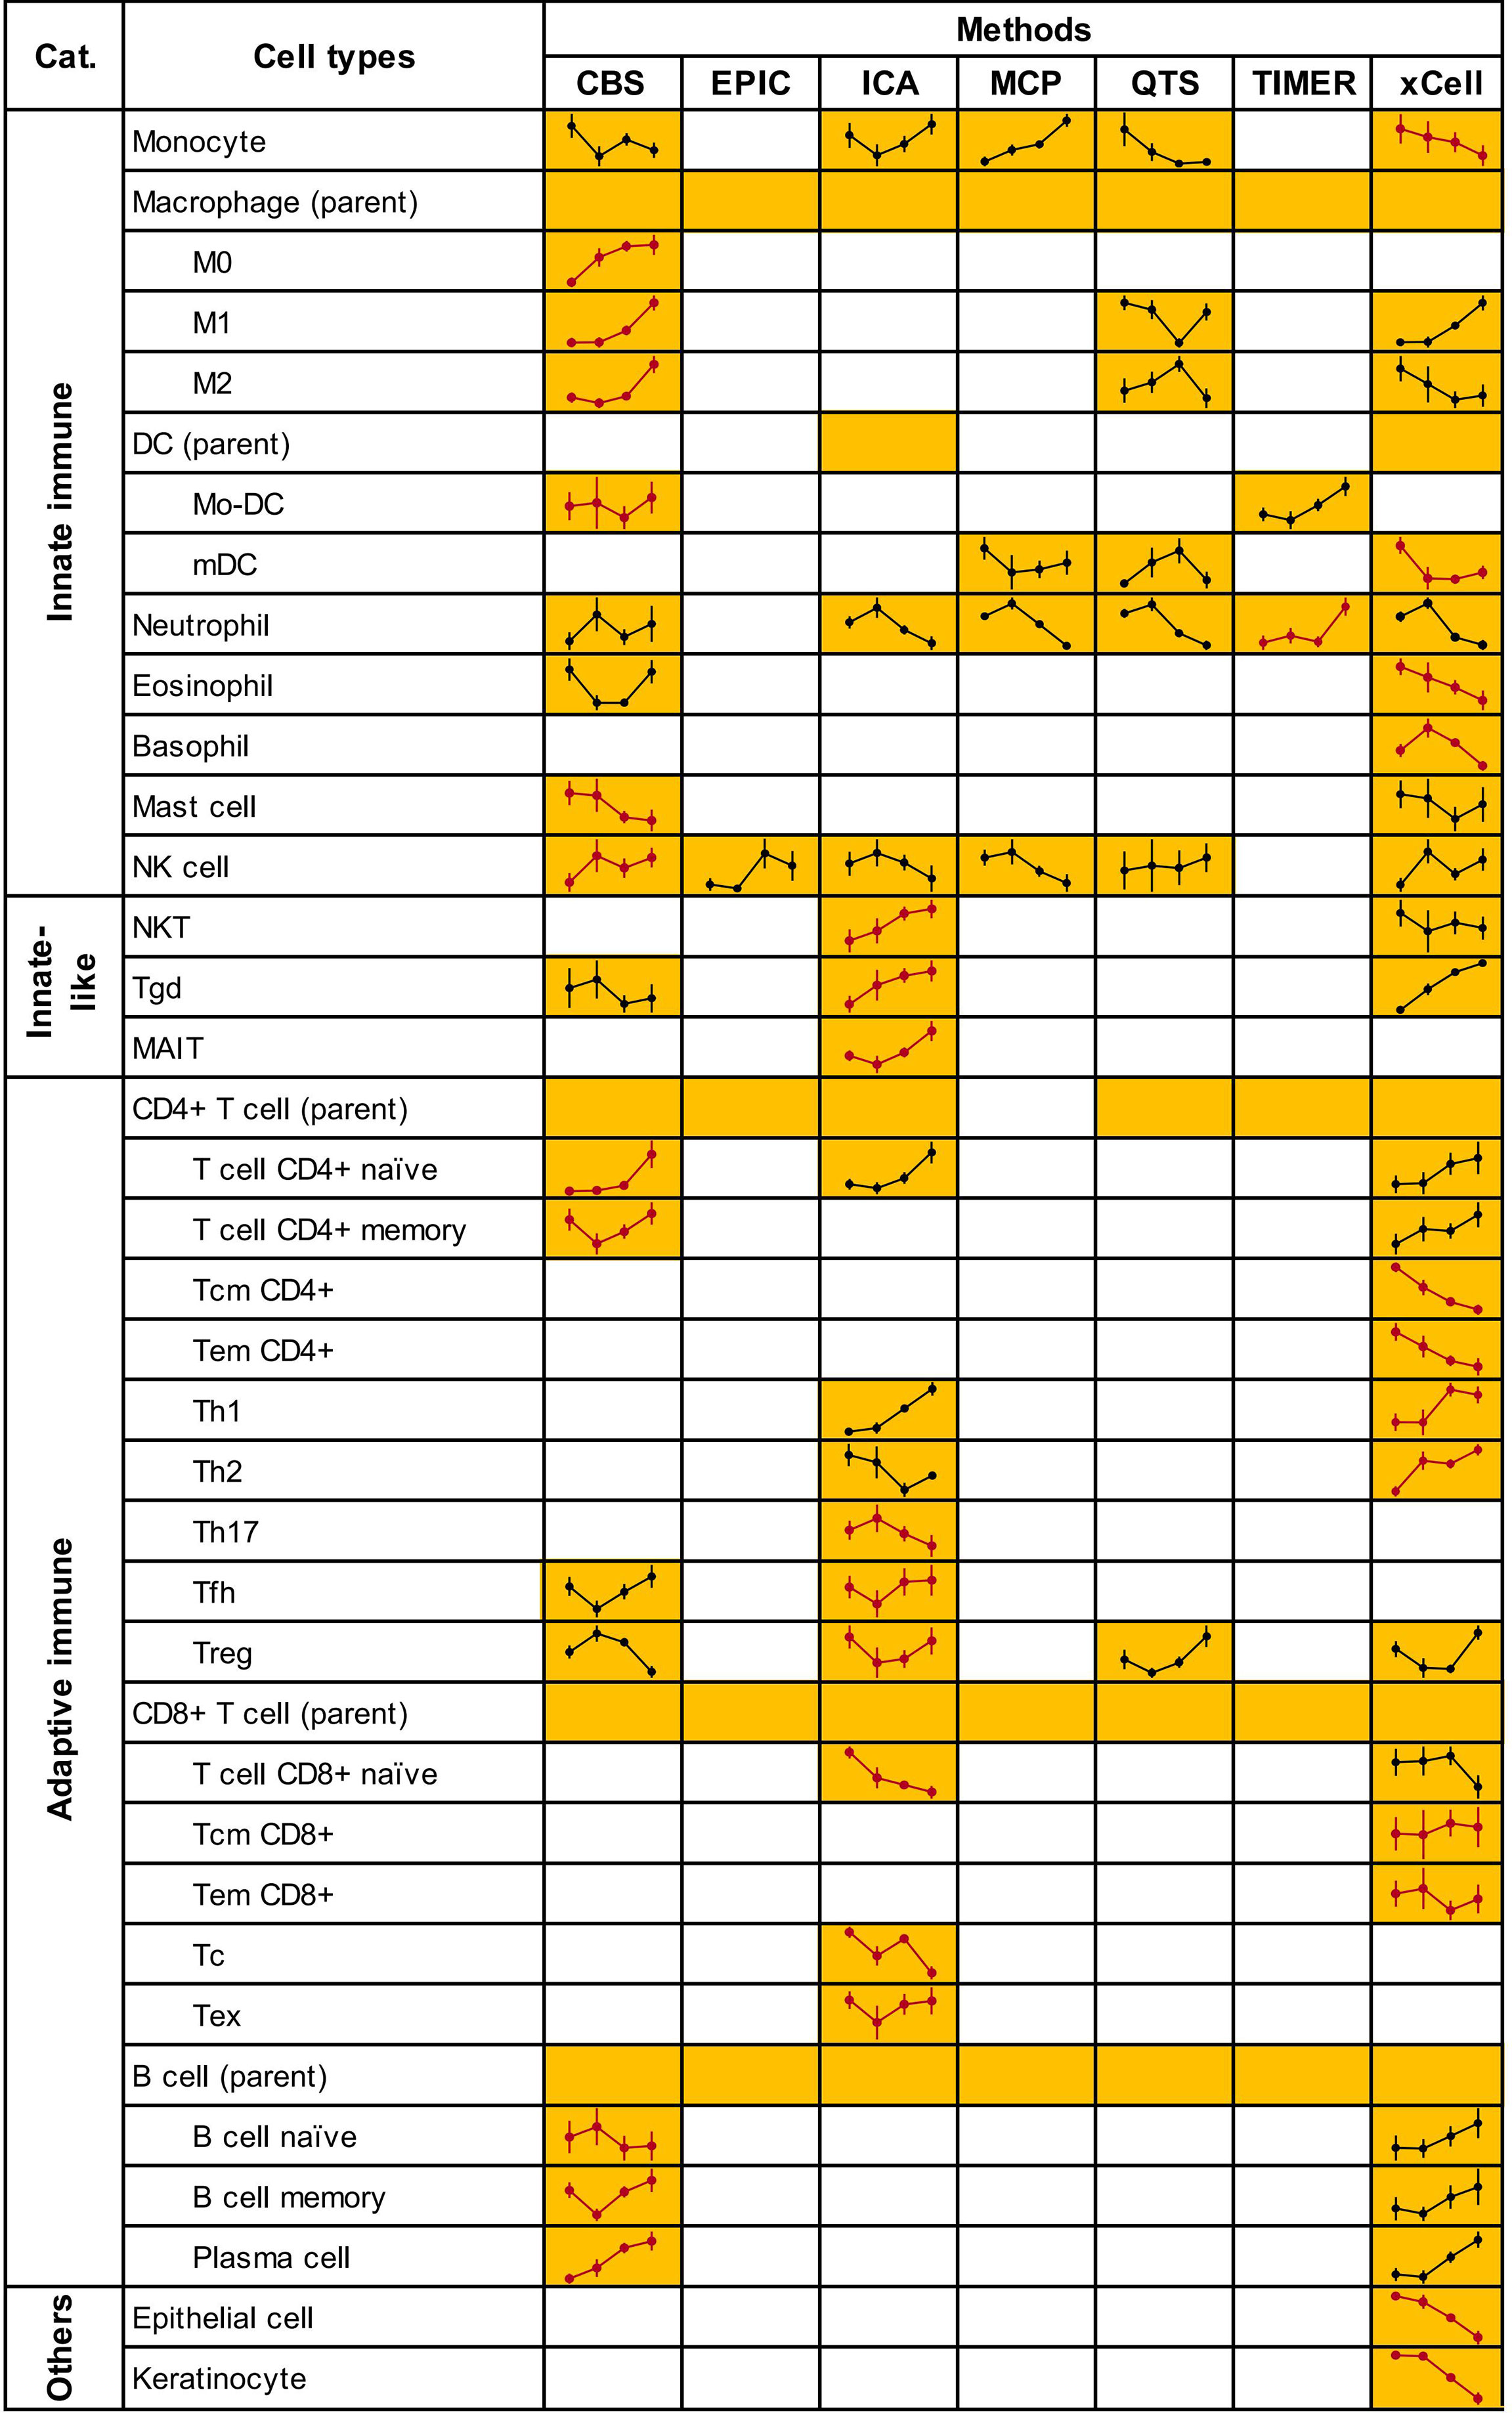
Figure 3 Microenvironment cells and their infiltrating patterns. Due to lack of estimation for monocyte by MCP-counter, we used the “monocytic lineage” as a surrogate. Treg score was calculated as the sum of “nTreg” and “iTreg” in ImmuCellAI. CIBERSORTX scores for activated and resting cell types (Mo-DC, mast, NK and CD4+ memory T cells) were also added. Yellow squares indicate that the method could predict the cells content and line plots of the predicted infiltrating patterns were added. Blank squares indicate that the method could not predict the cells content. Line plots in red represented the patterns finally determined. Full plots with normalized abundance scores of cells are shown in Supplementary Figure 2. CBS, CIBERSORTX; ICA, ImmuCellAI; MCP, MCP-counter; QTS, quanTIseq.
We performed the FCM clustering to characterize the dynamic changes in abundance of 31 immune cell types across the spectrum of cervical diseases. Five distinct clusters containing between 4 and 8 members per each were identified (Figure 4A). Clusters 1 and 3 showed linear evolution from normal to SCC (termed “Ascending” and “Descending”, respectively). Cluster 2 displayed an increased abundance from LSIL that continued to SCC; no significant difference between normal and LSIL was found (termed “Ascending from LSIL”). Two clusters had biphasic abundance evolutions; cluster 4 reached a nadir of abundance at LSIL (termed “biphasic 1”) while cluster 5 reached a peak of abundance at LSIL (termed “biphasic 2”) (Figure 4A). The immune cells of each cluster and their abundance changes in all samples ordered by disease progression were shown in the heatmap (Figure 4B). Of note, some immune cells with low membership values were not fully presented by corresponding clusters, like NK cell, Th1 cell and CD8+ Tcm cell in C1, Mo-DC in C2, Tc cell and mDC in C3.
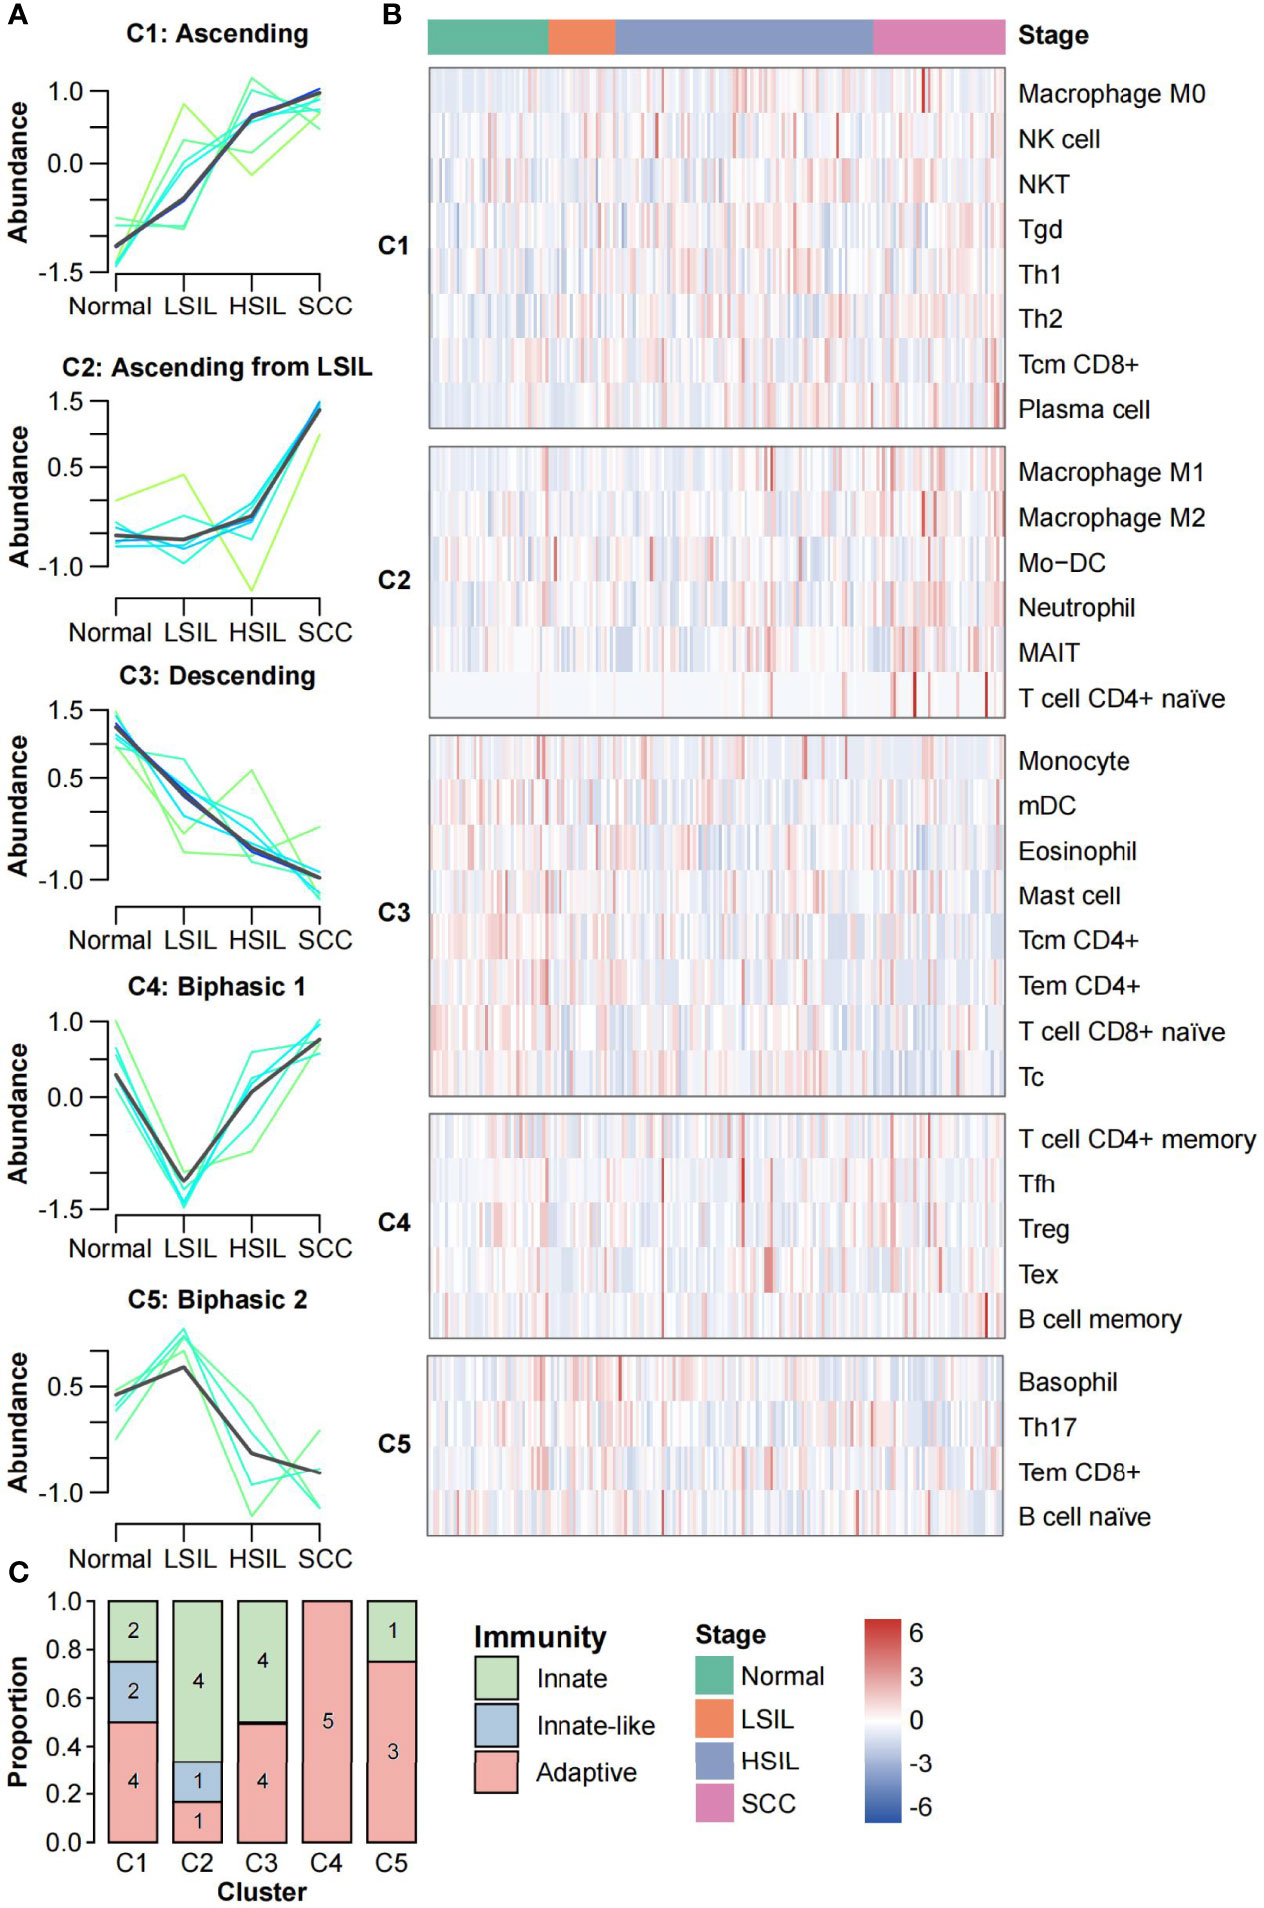
Figure 4 Clustering analysis of immune cells abundance. (A) FCM clustering identified five distinct clusters of immune cell infiltration patterns. Each line indicates the abundance of one immune cell and is colored by membership value. Green colored lines correspond to cells with low membership values. Bule and cyan colored lines correspond to cells with moderate membership values. The line for each cluster centre is plotted in black. The x axis represents disease stages; the y axis represents abundance changes. (B) Stage-ordered heatmap showing abundance changes of 31 immune cell types in meta-dataset. The groups were divided according to the clustering results of FCM algorithm. (C) Stacked bar plot of the number of immune cells in each category (innate, innate-like, and adaptive) for each cluster.
We further analyzed the subsets of immune cells in each cluster. As shown in Figure 4C, adaptive immune cells were distributed in all five clusters, with a strong preference for C4 (n = 5, 100%) while low proportion in C2 (n = 1, 16.7%). Innate-like lymphocytes were only found in C1 and C2 (n = 2 and n = 1, respectively), showing the increase tends along the carcinogenesis. Innate immune cells were mainly distributed in C1-C3 (n = 2, n = 4 and n = 4, respectively). Interestingly, macrophages M0 were in C1, while M1 and M2 were in C2.
In addition, epithelial cells and keratinocytes showed similar infiltration patterns that the abundance slightly decreased from normal to LSIL and then dropped sharply from LSIL to SCC (Figure 3 and Supplementary Figure 2).
Evolving Immune Response During Cervical Carcinogenesis
The abundance of 22 immune cell subsets of each development stage was compared using CIBERSORTX, a gene expression-based deconvolution algorithm (Figure 5A). Of note, CIBERSORTX could distinguish activated and resting of some cell types. Here, we explored changes in the immune status, from resting to activated and from naive to memory (Figure 5B).
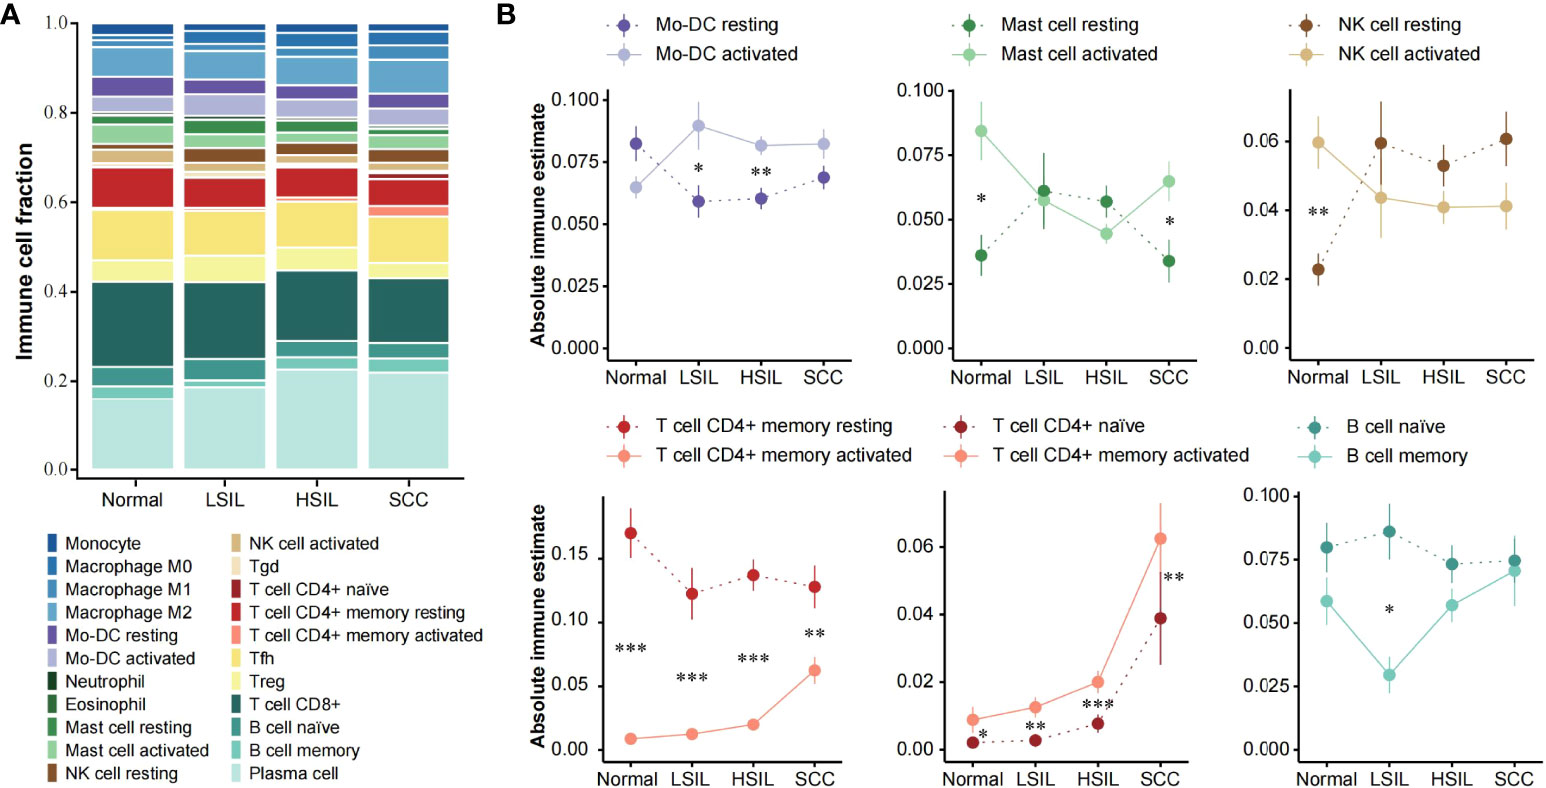
Figure 5 Assessment of local immune status with CIBERSORTX. (A) Stacked bar plot showing the composition of 22 immune cell subsets across different disease stages. The CIBERSORTX-Relative score was used. (B) Line plots showing immune-status shift for Mo-DC, mast cell, NK cell, CD4+ T cell and B cell with development of cervical lesions. Statistical comparisons were performed using Wilcoxon rank-sum test with BH false discovery rate correction. Significant differences per stage are signed with asterisks. *** p < 0.001, ** p < 0.01, * p < 0.05, FDR.
Overall, the opposite changes in abundance existed between the activated and resting state of the same immune cell type. The alterations of activated and resting Mo-DC and NK cell abundance mainly occurred in the transition from normal to LSIL. After the relative abundance of the two states was reversed, they showed a steady infiltration from LSIL to SCC. Resting memory CD4+ T cell abundance was significantly higher at all stages compared to activated memory CD4+ T cell, but the difference between them decreased with the disease development. Interestingly, the abundance of activated mast cell decreased from normal to HSIL and then increased in SCC. Resting mast cell followed the opposite pattern and showed approximate abundance as activated mast cell in SILs. Naïve CD4+ T cell and activated memory CD4+ T cell were more abundant in SCC compared to normal and SILs. The abundance of naïve and memory B cells was basically at the same level, except for a significant separation at LSIL with a rapid decrease of memory B cell and a slight increase of naïve B cell. It also should be mentioned that all cell types discussed here were included in the microenvironment cell set.
Discussion
The microenvironment could be characterized using either single sample gene set enrichment analysis (ssGSEA) (33) with previously defined cell signatures or published computational methods directly. The former method has an advantage in defining customized cell subsets according to our needs. Therefore, we firstly constructed a compendium of signatures related to a set of microenvironment cells from xCell, ImmuCellAI, Xiao et al.’s study (324 genes selected from CIBERSORT) (34) and Bagaev et al.’s study (35). Then, we used ssGSEA to calculate the enrichment score to represent the abundance of each cell type in each sample. We found some degree of consistency between our estimation and the original methods which the signatures were extracted from (data not shown). However, the infiltration patterns of some cells varied widely between existing methods. Hence, the estimations from ssGSEA hardly represent the full final patterns. Finally, we combined the results of multiple methods with a manual correction rather than solely depending on ssGSEA results.
It is important to reiterate that additional corrections to the estimation of bioinformatic methods based on previous studies made our conclusion more reliable. For example, recently, Wang et al. reported a decreased abundance of neutrophils from normal to SCC through bioinformatic analysis; however, the opposite results were found by flow cytometry (16). Likewise, another study also observed an increased number of neutrophils in cervical cancer compared to precursor cervical lesions (36). Consequently, we chose TIMER to describe the neutrophil pattern, which also showed the highest neutrophil infiltration in SCC, although many other methods displayed decreasing trends instead. Furthermore, Wang et al. also discovered an increased abundance of monocyte lineages as disease progressed through MCP-counter. After flow cytometry evaluation of CD14, they concluded that monocytes increasingly infiltrated in parallel along with increasing cervical lesion grade (16). In our view, flow cytometry could not reflect changes in monocytes due to CD14 being an antigen on the surface of myelomonocyte lineage rather than the monocyte itself (37). So when we evaluated monocytes, we still selected the most supported pattern from all methods instead of correcting for monocytes according to their study. Additionally, appropriate classification and combination of immune cells also contribute to the accuracy of our estimation. For example, none of methods addresses a certain DC subtype except for MCP-counter. We assigned specific subtypes to DCs estimated by different methods as reported by Sturm et al. (see their Supplementary Table 2) (28).
However, the results of some cells were inconsistent with those previously reported, such as Th17 (38), eosinophil (39) and mast cell (40) in cervical epithelium. Th17 cells in Hou et al.’s study were validated to be significantly increased in CIN3 and cervical cancer compared to healthy control through immunohistochemistry (38), while in our study, it was clustered in C5 and especially enriched in LSIL. Interestingly, a similar observation was seen in head and neck squamous cell carcinomas (HNSCC), that lymph nodes of mice with premalignant lesions showed increased Th17 cells compared to controls and HNSCC. It may be explained by the increased levels of TGF-β during progression from premalignant lesion to HNSCC, which may inhibit Th17 differentiation and decrease Th17 cells (41). Mast cells clustered in C3, on the other hand, were previously shown to progressively increase along the continuum from CIN1 to SCC (40). However, another study with fewer samples reported the least mast cell count in SCC compared to SILs and normal cervix (42), which is in line with our results. The role of mast cells in HPV lesions is uncertain. They could recruit other immune cells inducing apoptosis of tumor cells and secret IL-10 and VEGF inducing immunosuppression (43). Further studies are warranted to investigate these controversial cells and to confirm the patterns of some cell infiltrations (e.g., Tcm and Tem) firstly described by our research.
We discovered and defined five distinct clusters through clustering analysis of immune cells abundance. Extra attention should be allocated to the cells that cannot completely fit in their clusters. For example, in cluster 1, using “Ascending” to describe Th1 and Th2 cells may be inaccurate. As our results demonstrated, Th1 significantly increased from LSIL to HSIL, and slightly decreased from HSIL to SCC. The infiltration pattern of Th2 was opposite to that of Th1. The shift from the Th1 to Th2 response was found in the late stage, consistent with the previous description (44).
There are several limitations to our study. First, a few non-immune microenvironment cell subsets estimated by methods were removed in the current version for their attributes. For instance, CAFs are a group of activated fibroblasts with significant heterogeneity in the tumor stroma (45). Estimating the abundance of CAFs in squamous epithelium samples from normal cervices and SILs might be off-target. Secondly, not all studies provided the HPV status of each sample. According to the available information, most SILs+ (SILs and SCC) samples are HR-HPV positive and normal samples are a mixture of HR-HPV positive and negative samples. Regarding the impact of HPV on host microenvironment, we believe that the difference in cellular microenvironment between normal and other stage samples (especially for LSIL) has been somewhat diminished in this study (46).
Conclusion
To conclude, we summarized the infiltrating patterns of 33 microenvironment cell types in cervical malignant transformation. Moreover, we reported a continuous shift of immune status for several typical cells. Our findings provided a reference for further studies on the mechanisms of microenvironment cells modulated by HR-HPV and corresponding immune therapies for virus clearance.
Data Availability Statement
Publicly available datasets analyzed in this study can be found in the NCBI Gene Expression Omnibus (http://www.ncbi.nlm.nih.gov/geo/). The analysis codes supporting the conclusions of this article will be made available by the corresponding author.
Author Contributions
Conceptualization, JZ and XZ. Methodology, JZ. Formal analysis, JZ. Visualization, JZ and SM. Writing-original draft preparation, JZ. Writing-review and editing, CL and KS. All authors have read and agreed to the published version of the manuscript.
Funding
This research was supported by the Guangdong Provincial Key Laboratory of Human Disease Genomics (2020B1212070028).
Conflict of Interest
Authors JZ, XZ, KS and CL were employed by company BGI-Shenzhen.
The remaining author declare that the research was conducted in the absence of any commercial or financial relationships that could be construed as a potential conflict of interest.
Publisher’s Note
All claims expressed in this article are solely those of the authors and do not necessarily represent those of their affiliated organizations, or those of the publisher, the editors and the reviewers. Any product that may be evaluated in this article, or claim that may be made by its manufacturer, is not guaranteed or endorsed by the publisher.
Supplementary Material
The Supplementary Material for this article can be found online at: https://www.frontiersin.org/articles/10.3389/fimmu.2022.888176/full#supplementary-material
Supplementary Figure 1 | Correlation matrices of methods. Heatmap displaying Spearman correlations of seven computational methods for the CD4+ (left bottom) and CD8+ (right top) T cells abundance in (A) normal, (B) LSIL, (C) HSIL and (D) SCC.
Supplementary Figure 2 | The infiltration patterns of selected microenvironment cells estimated by seven methods. Line plots showing the abundance of selected microenvironment cells (mean ± SEM) changes over disease stages.
Supplementary Table 1 | A collection of studies used as a reference for correction of cell infiltration patterns.
Supplementary Table 2 | Normalized abundance scores of cells.
References
1. zur Hausen H. Papillomaviruses and Cancer: From Basic Studies to Clinical Application. Nat Rev Cancer (2002) 2(5):342–50. doi: 10.1038/nrc798
2. Umar A, Dunn BK, Greenwald P. Future Directions in Cancer Prevention. Nat Rev Cancer (2012) 12(12):835–48. doi: 10.1038/nrc3397
3. Quail DF, Joyce JA. Microenvironmental Regulation of Tumor Progression and Metastasis. Nat Med (2013) 19(11):1423–37. doi: 10.1038/nm.3394
4. LeBleu VS. Imaging the Tumor Microenvironment. Cancer J (2015) 21(3):174–8. doi: 10.1097/PPO.0000000000000118
5. Tindle RW. Immune Evasion in Human Papillomavirus-Associated Cervical Cancer. Nat Rev Cancer (2002) 2(1):59–65. doi: 10.1038/nrc700
6. Stanley MA, Pett MR, Coleman N. HPV: From Infection to Cancer. Biochem Soc Trans (2007) 35(Pt 6):1456–60. doi: 10.1042/BST0351456
7. Nobbenhuis MA, Walboomers JM, Helmerhorst TJ, Rozendaal L, Remmink AJ, Risse EK, et al. Relation of Human Papillomavirus Status to Cervical Lesions and Consequences for Cervical-Cancer Screening: A Prospective Study. Lancet (1999) 354(9172):20–5. doi: 10.1016/S0140-6736(98)12490-X
8. Barros MR Jr., de Melo CML, Barros M, de Cássia Pereira de Lima R, de Freitas AC, Venuti A. Activities of Stromal and Immune Cells in HPV-Related Cancers. J Exp Clin Cancer Res (2018) 37(1):137. doi: 10.1186/s13046-018-0802-7
9. Gras Navarro A, Björklund AT, Chekenya M. Therapeutic Potential and Challenges of Natural Killer Cells in Treatment of Solid Tumors. Front Immunol (2015) 6:202. doi: 10.3389/fimmu.2015.00202
10. Spurgeon ME, Lambert PF. Human Papillomavirus and the Stroma: Bidirectional Crosstalk During the Virus Life Cycle and Carcinogenesis. Viruses (2017) 9(8):219. doi: 10.3390/v9080219
11. Zhang W, Tian X, Mumtahana F, Jiao J, Zhang T, Croce KD, et al. The Existence of Th22, Pure Th17 and Th1 Cells in CIN and Cervical Cancer Along With Their Frequency Variation in Different Stages of Cervical Cancer. BMC Cancer (2015) 15:717. doi: 10.1186/s12885-015-1767-y
12. Lin W, Niu Z, Zhang H, Kong Y, Wang Z, Yang X, et al. Imbalance of Th1/Th2 and Th17/Treg During the Development of Uterine Cervical Cancer. Int J Clin Exp Pathol (2019) 12(9):3604–12.
13. Newman AM, Steen CB, Liu CL, Gentles AJ, Chaudhuri AA, Scherer F, et al. Determining Cell Type Abundance and Expression From Bulk Tissues With Digital Cytometry. Nat Biotechnol (2019) 37(7):773–82. doi: 10.1038/s41587-019-0114-2
14. Miao YR, Zhang Q, Lei Q, Luo M, Xie GY, Wang H, et al. ImmuCellAI: A Unique Method for Comprehensive T-Cell Subsets Abundance Prediction and its Application in Cancer Immunotherapy. Adv Sci (Weinh) (2020) 7(7):1902880. doi: 10.1002/advs.201902880
15. Aran D, Hu Z, Butte AJ. Xcell: Digitally Portraying the Tissue Cellular Heterogeneity Landscape. Genome Biol (2017) 18(1):220. doi: 10.1186/s13059-017-1349-1
16. Wang Y, He M, Zhang G, Cao K, Yang M, Zhang H, et al. The Immune Landscape During the Tumorigenesis of Cervical Cancer. Cancer Med (2021) 10(7):2380–95. doi: 10.1002/cam4.3833
17. Wang J, Li Z, Gao A, Wen Q, Sun Y. The Prognostic Landscape of Tumor-Infiltrating Immune Cells in Cervical Cancer. BioMed Pharmacother (2019) 120:109444. doi: 10.1016/j.biopha.2019.109444
18. Litwin TR, Irvin SR, Chornock RL, Sahasrabuddhe VV, Stanley M, Wentzensen N. Infiltrating T-Cell Markers in Cervical Carcinogenesis: A Systematic Review and Meta-Analysis. Br J Cancer (2021) 124(4):831–41. doi: 10.1038/s41416-020-01184-x
19. den Boon JA, Pyeon D, Wang SS, Horswill M, Schiffman M, Sherman M, et al. Molecular Transitions From Papillomavirus Infection to Cervical Precancer and Cancer: Role of Stromal Estrogen Receptor Signaling. Proc Natl Acad Sci U S A (2015) 112(25):E3255–64. doi: 10.1073/pnas.1509322112
20. Caffarel MM, Chattopadhyay A, Araujo AM, Bauer J, Scarpini CG, Coleman N. Tissue Transglutaminase Mediates the Pro-Malignant Effects of Oncostatin M Receptor Over-Expression in Cervical Squamous Cell Carcinoma. J Pathol (2013) 231(2):168–79. doi: 10.1002/path.4222
21. Zhai Y, Kuick R, Nan B, Ota I, Weiss SJ, Trimble CL, et al. Gene Expression Analysis of Preinvasive and Invasive Cervical Squamous Cell Carcinomas Identifies HOXC10 as a Key Mediator of Invasion. Cancer Res (2007) 67(21):10163–72. doi: 10.1158/0008-5472.CAN-07-2056
22. Gautier L, Cope L, Bolstad B, Irizarry R. Affy–Analysis of Affymetrix GeneChip Data at the Probe Level. Bioinf (Oxford England) (2004) 20(3):307–15. doi: 10.1093/bioinformatics/btg405
23. Leek JT, Johnson WE, Parker HS, Jaffe AE, Storey JD. The Sva Package for Removing Batch Effects and Other Unwanted Variation in High-Throughput Experiments. Bioinformatics (2012) 28(6):882–3. doi: 10.1093/bioinformatics/bts034
24. Johnson WE, Li C, Rabinovic A. Adjusting Batch Effects in Microarray Expression Data Using Empirical Bayes Methods. Biostatistics (2007) 8(1):118–27. doi: 10.1093/biostatistics/kxj037
25. Racle J, de Jonge K, Baumgaertner P, Speiser DE, Gfeller D. Simultaneous Enumeration of Cancer and Immune Cell Types From Bulk Tumor Gene Expression Data. Elife (2017) 6:e26476. doi: 10.7554/eLife.26476
26. Becht E, Giraldo NA, Lacroix L, Buttard B, Elarouci N, Petitprez F, et al. Estimating the Population Abundance of Tissue-Infiltrating Immune and Stromal Cell Populations Using Gene Expression. Genome Biol (2016) 17(1):218. doi: 10.1186/s13059-016-1070-5
27. Finotello F, Mayer C, Plattner C, Laschober G, Rieder D, Hackl H, et al. Molecular and Pharmacological Modulators of the Tumor Immune Contexture Revealed by Deconvolution of RNA-Seq Data. Genome Med (2019) 11(1):34. doi: 10.1186/s13073-019-0638-6
28. Sturm G, Finotello F, Petitprez F, Zhang JD, Baumbach J, Fridman WH, et al. Comprehensive Evaluation of Transcriptome-Based Cell-Type Quantification Methods for Immuno-Oncology. Bioinformatics (2019) 35(14):i436–i45. doi: 10.1093/bioinformatics/btz363
29. Li T, Fu J, Zeng Z, Cohen D, Li J, Chen Q, et al. TIMER2.0 for Analysis of Tumor-Infiltrating Immune Cells. Nucleic Acids Res (2020) 48(W1):W509–w14. doi: 10.1093/nar/gkaa407
30. Marderstein AR, Uppal M, Verma A, Bhinder B, Tayyebi Z, Mezey J, et al. Demographic and Genetic Factors Influence the Abundance of Infiltrating Immune Cells in Human Tissues. Nat Commun (2020) 11(1):2213. doi: 10.1038/s41467-020-16097-9
31. Futschik ME, Carlisle B. Noise-Robust Soft Clustering of Gene Expression Time-Course Data. J Bioinform Comput Biol (2005) 3(4):965–88. doi: 10.1142/S0219720005001375
32. Kumar L, EF M. Mfuzz: A Software Package for Soft Clustering of Microarray Data. Bioinformation (2007) 2(1):5–7. doi: 10.6026/97320630002005
33. Barbie DA, Tamayo P, Boehm JS, Kim SY, Moody SE, Dunn IF, et al. Systematic RNA Interference Reveals That Oncogenic KRAS-Driven Cancers Require TBK1. Nature (2009) 462(7269):108–12. doi: 10.1038/nature08460
34. Xiao Y, Ma D, Zhao S, Suo C, Shi J, Xue MZ, et al. Multi-Omics Profiling Reveals Distinct Microenvironment Characterization and Suggests Immune Escape Mechanisms of Triple-Negative Breast Cancer. Clin Cancer Res (2019) 25(16):5002–14. doi: 10.1158/1078-0432.CCR-18-3524
35. Bagaev A, Kotlov N, Nomie K, Svekolkin V, Gafurov A, Isaeva O, et al. Conserved Pan-Cancer Microenvironment Subtypes Predict Response to Immunotherapy. Cancer Cell (2021) 39(6):845–65 e7. doi: 10.1016/j.ccell.2021.04.014
36. Alvarez KLF, Beldi M, Sarmanho F, Rossetti RAM, Silveira CRF, Mota GR, et al. Local and Systemic Immunomodulatory Mechanisms Triggered by Human Papillomavirus Transformed Cells: A Potential Role for G-CSF and Neutrophils. Sci Rep (2017) 7(1):9002. doi: 10.1038/s41598-017-09079-3
37. Zamani F, Zare Shahneh F, Aghebati-Maleki L, Baradaran B. Induction of CD14 Expression and Differentiation to Monocytes or Mature Macrophages in Promyelocytic Cell Lines: New Approach. Adv Pharm Bull (2013) 3(2):329–32. doi: 10.5681/apb.2013.053
38. Hou F, Li Z, Ma D, Zhang W, Zhang Y, Zhang T, et al. Distribution of Th17 Cells and Foxp3-Expressing T Cells in Tumor-Infiltrating Lymphocytes in Patients With Uterine Cervical Cancer. Clin Chim Acta (2012) 413(23-24):1848–54. doi: 10.1016/j.cca.2012.07.012
39. Xie F, Liu LB, Shang WQ, Chang KK, Meng YH, Mei J, et al. The Infiltration and Functional Regulation of Eosinophils Induced by TSLP Promote the Proliferation of Cervical Cancer Cell. Cancer Lett (2015) 364(2):106–17. doi: 10.1016/j.canlet.2015.04.029
40. Jekal S-J, Lee J-A, Rho J-S. Mast Cells and Vascular Endothelial Growth Factor Expression in Neoangiogenesis of Cervical Intraepithelial Neoplasia and Invasive Squamous Cell Carcinomas of the Uterine Cervix. Korean J Clin Lab Sci (2005) 37(3):197–206.
41. Woodford D, Johnson SD, De Costa AM, Young MR. An Inflammatory Cytokine Milieu Is Prominent in Premalignant Oral Lesions, But Subsides When Lesions Progress to Squamous Cell Carcinoma. J Clin Cell Immunol (2014) 5(3):230. doi: 10.4172/2155-9899.1000230
42. Kalyani R, Rajeshwari G. Significance of Mast Cells in non-Neoplastic and Neoplastic Lesions of Uterine Cervix. Biomed Res Ther (2016) 3(1):1–7. doi: 10.7603/s40730-016-0003-y
43. Bergot AS, Kassianos A, Frazer IH, Mittal D. New Approaches to Immunotherapy for HPV Associated Cancers. Cancers (Basel) (2011) 3(3):3461–95. doi: 10.3390/cancers3033461
44. Shamseddine AA, Burman B, Lee NY, Zamarin D, Riaz N. Tumor Immunity and Immunotherapy for HPV-Related Cancers. Cancer Discovery (2021) 11(8):1896–912. doi: 10.1158/2159-8290.CD-20-1760
45. Sahai E, Astsaturov I, Cukierman E, DeNardo DG, Egeblad M, Evans RM, et al. A Framework for Advancing Our Understanding of Cancer-Associated Fibroblasts. Nat Rev Cancer (2020) 20(3):174–86. doi: 10.1038/s41568-019-0238-1
Keywords: cervical cancer, squamous intraepithelial lesions, microenvironment, infiltration pattern, immune response
Citation: Zhang J, Meng S, Zhang X, Shao K and Lin C (2022) Infiltration Patterns of Cervical Epithelial Microenvironment Cells During Carcinogenesis. Front. Immunol. 13:888176. doi: 10.3389/fimmu.2022.888176
Received: 02 March 2022; Accepted: 13 June 2022;
Published: 14 July 2022.
Edited by:
Lanlan Wei, Shenzhen Third People’s Hospital, ChinaReviewed by:
Ji Wang, Indiana University Bloomington, United StatesBarbara Seliger, Martin Luther University of Halle-Wittenberg, Germany
Copyright © 2022 Zhang, Meng, Zhang, Shao and Lin. This is an open-access article distributed under the terms of the Creative Commons Attribution License (CC BY). The use, distribution or reproduction in other forums is permitted, provided the original author(s) and the copyright owner(s) are credited and that the original publication in this journal is cited, in accordance with accepted academic practice. No use, distribution or reproduction is permitted which does not comply with these terms.
*Correspondence: Cong Lin, bGluY29uZ0BnZW5vbWljcy5jbg==; Kang Shao, c2hhb2thbmdAZ2Vub21pY3MuY24=