 Shaoqing Zang
 Li-Xia Lv1
 Cang Li
 Jin-Xing Wang
- 1Shandong Provincial Key Laboratory of Animal Cells and Developmental Biology, School of Life Sciences, Shandong University, Qingdao, China
- 2State Key Laboratory of Microbial Technology, Shandong University, Qingdao, China
Trained immunity is driven by metabolism and epigenetics in innate immune cells in mammals. The phenomenon of trained immunity has been identified in invertebrates, including shrimp, but the underlying mechanisms remain unclear. To elucidate mechanisms of trained immunity in shrimp, the metabolomic changes in hemolymph of Marsupenaeus japonicus trained by the UV-inactivated white spot syndrome virus (UV-WSSV) were analyzed using tandem gas chromatography–mass/mass spectrometry. The metabolomic profiles of shrimp trained with UV-WSSV followed WSSV infection showed significant differences comparison with the control groups, PBS injection followed WSSV infection. 16 differential metabolites in total of 154 metabolites were identified, including D-fructose-6-phosphate, D-glucose-6-phosphate, and D-fructose-6-phosphate, and metabolic pathways, glycolysis, pentose phosphate pathway, and AMPK signaling pathway were enriched in the UV-WSSV trained groups. Further study found that histone monomethylation and trimethylation at H3K4 (H3K4me1 and H3K4me3) were involved in the trained immunity. Our data suggest that the UV-WSSV induced trained immunity leads to metabolism reprogramming in the shrimp and provide insights for WSSV control in shrimp aquaculture.
Introduction
The host immune response can be classified into innate and adaptive immune responses according to the classical immune theory. Vertebrates have both innate and adaptive immunity, while invertebrates have only the former (1). It is generally believed that adaptive immunity generates specific immunological memory, and innate immunity has no memory. However, a large body of research evidence has challenged this dogma. In organisms lacking adaptive immunity as well as in mammals, the innate immune system can mount resistance to reinfection, this phenomenon termed trained immunity or innate immune memory (2–4). Briefly, the first stimulus to host innate immune cells by pathogen-associated molecular patterns leads to changes in the functional immune status; subsequently, the immune activation status returns to the basal level during the resting phase (3). At the second homologous or heterologous encounter, the functions of cells against pathogens are enhanced at much a faster and higher level than those induced during the first challenge (2, 4). Trained immunity has been reported in invertebrates, such as shrimp and crayfish (5–8), and in plants (9).
While specific pathways and markers differ between the various adaptive programs (including differentiation, priming, trained immunity and tolerance according to functional state of innate immune cells) in innate immunity, they all use the same basic mechanisms (epigenetic, transcriptional and metabolic), but with different flavors (10). The core mechanism underlying trained immunity is the interaction between epigenetic modification and metabolism. In mammals, changes in the metabolism of trained innate immune cells are closely related to epigenetics (11). When stimulated by training components, the metabolome of innate immune cells is reprogrammed; further, changes in metabolites activate epigenetic modifications, thereby inducing changes in chromatin. Chromatin is specifically modified and the expression of immune-related genes is then activated (3). In trained immunity, although the cell immune response reverts to a low level at the resting phase and several epigenetic modifications of chromatin are lost, the regulatory region retains the activated modification partially as a potential enhancer for a long time to exist. Thus, by rapidly modifying chromatin at the same site to activate immune-related genes, cells can strongly and quickly respond to secondary infections (3, 12). Several studies exist on the mechanisms underlying trained immunity in mammals; nevertheless, the molecular mechanisms linking immunological signals induced by microbial stimuli to epigenetic changes have not been clearly revealed.
Metabolomics is widely used to study the metabolic network of a biological system by investigating metabolite profiles before and after the system is stimulated or disturbed. In recent years, it has been extensively used for studying aquaculture diseases so as to develop novel strategies for their prevention and control (13). In the context of trained immunity, increasing evidence has associated metabolism to epigenetic modifications (14). Several metabolites involved in glycolysis and the tricarboxylic acid (TCA) cycle can serve as cofactors for epigenetic writers and erasers, such as DNA and histone methyltransferases and demethylases and histone acetyltransferases and deacetylases (11, 15). Although the phenomenon of trained immunity has been reported in shrimp, pertinent molecular mechanisms remain almost completely unclear. Based on growing evidences of metabolites with epigenetic modification, we applied metabolic analysis to study the mechanism of shrimp trained immunity.
Shrimp is an economically important animal in marine aquaculture. It is highly vulnerable to diseases, particularly the white spot syndrome caused by white spot syndrome virus (WSSV); such problems lead to heavy losses to the shrimp farming industry. Despite this, effective prevention and control measures remain missing. To tackle this problem, we established a trained immunity model induced by UV-inactivated white spot syndrome virus (UV-WSSV) in kuruma shrimp Marsupenaeus japonicus and performed a metabolomic-based analysis to elucidate the mechanisms underlying trained immunity in shrimp. By comparing changes in the metabolome, we identified key metabolites and metabolic pathways associated with trained immunity in shrimp, which might be related to epigenetic modifications. The results reported herein can not only serve as a theoretical basis for trained immunity in shrimp but also facilitate disease prevention and control in aquaculture.
Results
UV-WSSV Induced Trained Immunity in M. japonicus
We first established a training model using UV-WSSV (Figure 1A) in M. japonicus. Before training with UV-WSSV/PBS, we firstly detected if the shrimp were free from WSSV infection, using Vp28 as an indicator by reverse transcription-PCR (RT-PCR). As show in Figure 1B, Vp28 expression was not detected in hemocytes, intestine and gills of shrimp randomly selected and double distilled water (ddH2O) (a negative control), but was detected in the positive control (WSSV). The result suggested that the untreated shrimp were free from WSSV infection (Figure 1B).
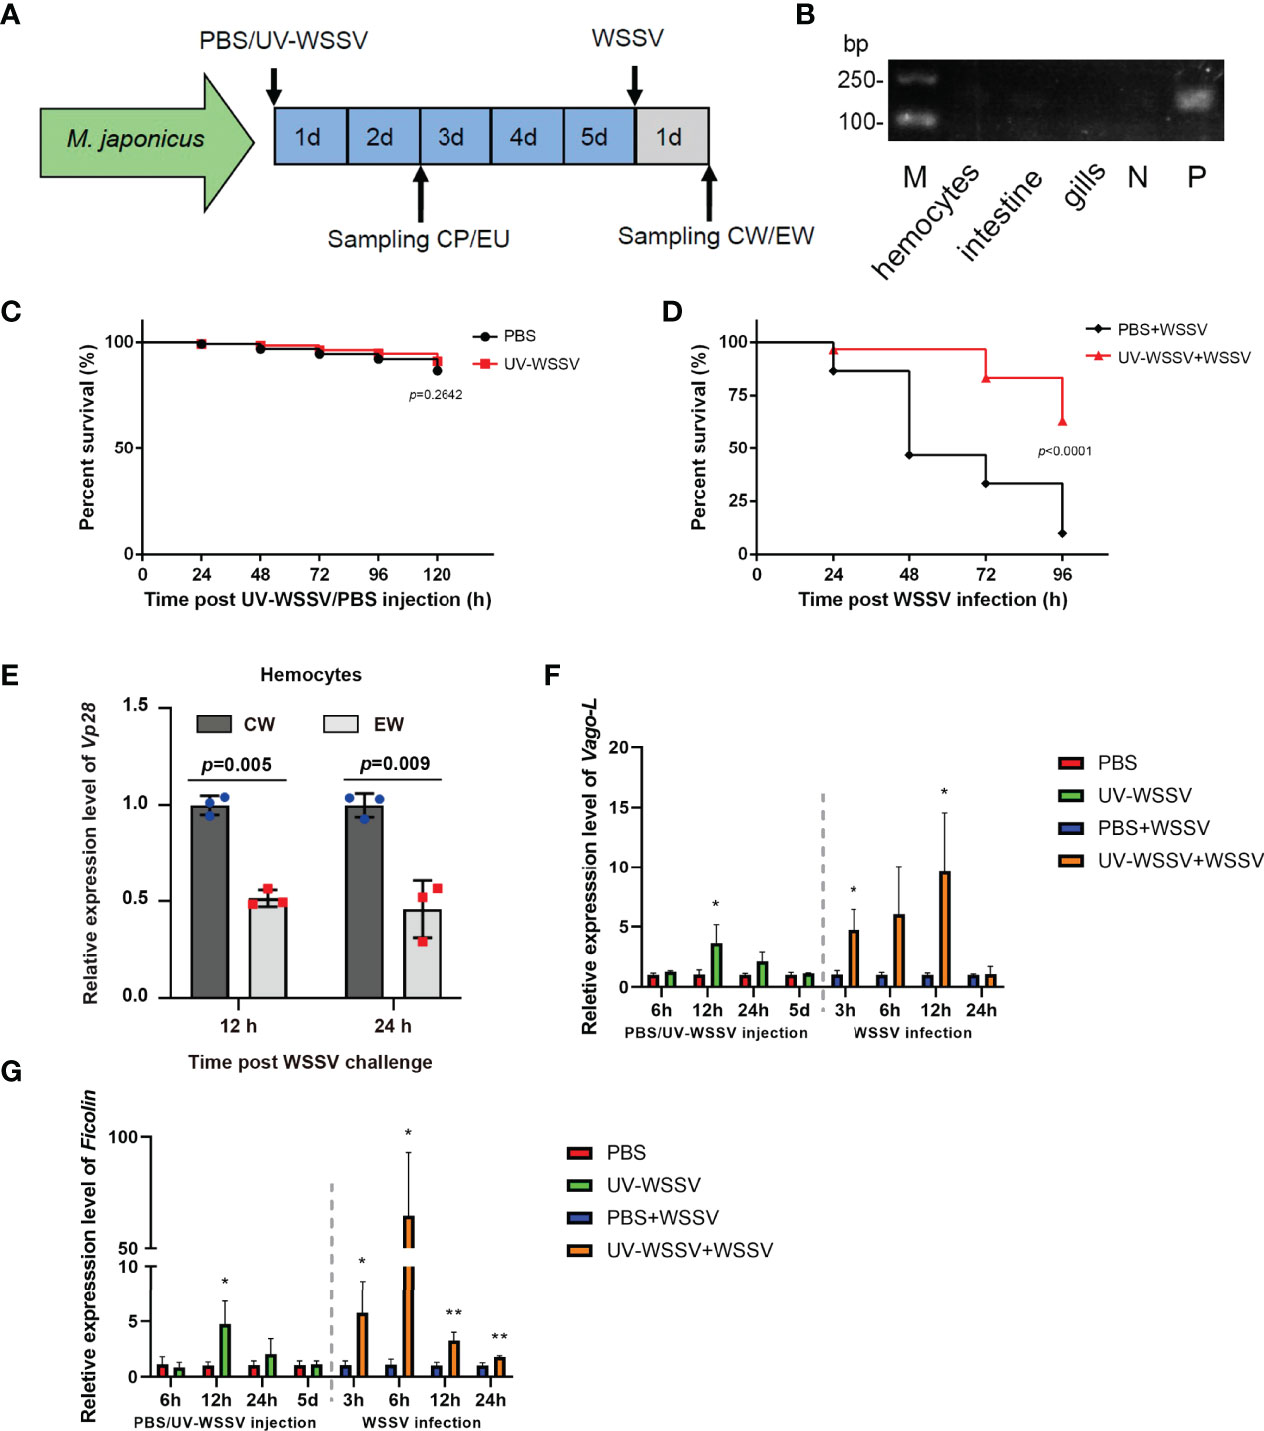
Figure 1 Trained immunity model. (A) UV-WSSV-induced trained immunity in M. japonicus. UV-WSSV (50 μL, 5 × 10⁵ copies) was injected into shrimp; the same volume of PBS was injected into controls. Five days after the first injection (training), a second injection of WSSV was administered (50 μL, 5 × 10⁵ copies). Hemolymph was collected at 48 h after the first injection (CP, PBS-injected shrimp; EU, UV-WSSV-injected shrimp) and 24 h after the second one (CW, PBS-injected shrimp infected with WSSV; EW, UV-WSSV-injected shrimp infected with WSSV). (B) Vp28 expression in hemocytes, intestine and gills of shrimp analyzed by RT-PCR. N was negative control (ddH2O). P was positive control (WSSV). (C) Survival rate analysis of shrimp injected with UV-WSSV; controls were injected with an equal volume of sterile PBS. (D) Survival rate of shrimp, which was analyzed using the log-rank (Mantel–Cox) test. Normal shrimp were divided into two groups, and the experimental group was first trained with UV-WSSV, and then live WSSV was injected after 5 days. In case of the control group, an equal volume of sterile PBS was first injected, and then the same amount of WSSV was administered. (E) WSSV replication was analyzed using Vp28 as an indicator in hemocytes of control and UV-WSSV trained shrimp at 12 and 24 h post WSSV infection (the second infection). The shrimp injected with a corresponding amount of PBS in training period and then infected with WSSV were used as controls. (F, G) The expression patterns of Vago-L (F) and Ficolin (G) in hemocytes of shrimp in the UV-WSSV trained immunity model. Student’s t test was used for statistical analysis, and p < 0.05 was considered to demonstrate statistically significant differences. *p < 0.05, **p < 0.01.
To test whether UV-WSSV was completely inactivated upon UV treatment, the survival rate of shrimp was analyzed. We observed that the survival rate of shrimp injected with UV-WSSV (5 × 10⁵) was the same as that of those injected with PBS (Figure 1C), suggesting that WSSV was completely inactivated. Further, 5 days after UV-WSSV injection, we infected shrimp with live WSSV. On assessing their survival rate, we found that the survival rate of UV-WSSV trained immunity shrimp was significantly higher than that of control (PBS injected) shrimp (Figure 1D), indicating that UV-WSSV enhanced the ability of shrimp to resist viral infections by inducing trained immunity.
To confirm above results, we analyzed WSSV replication using Vp28 expression as an indicator in hemocytes of M. japonicus with quantitative real-time PCR (qRT-PCR) in the trained immunity model, and the result showed that Vp28 expression was significantly lower in the UV-WSSV trained group than that in the PBS control group at 12 and 24 h post WSSV infection (Figure 1E). We also detected the expression patterns of some immune effector genes such as Vago-like (Vago-L) and Ficolin, and the results showed that during the training period with UV-WSSV, the expression of Vago-L and Ficolin were significantly upregulated in the shrimp at 12 h post UV-WSSV training compared with the PBS control, at the 5th day of UV-WSSV training, the expression of above two genes returned to a low level (at resting time), and then upregulated at 3 h post WSSV injection (the second challenge) in the UV-WSSV trained group (Figures 1F, G), which was consistent with the important characteristics of trained immunity, that is, faster and stronger expression in the second period of trained immunity (10). All the results suggested that UV-WSSV was able to induced trained immunity in M. japonicus.
Multivariate Analysis of Metabolite Profiles
Metabolomic analysis was performed to explore the alterations in metabolism in UV-WSSV trained and control shrimp. GC–MS/MS was used for the metabolic profiling of plasma samples collected from various groups (CP, control group injected with PBS; EU, experimental group injected with UV-WSSV; CW, the control injected with WSSV and EW, UV-WSSV trained immunity group injected with WSSV) (Supplementary Figure 1). Subsequently, data were compared to identify differential metabolites (DMs) and associated metabolic pathways. Based on the classification of metabolites in Kyoto Encyclopedia of Genes and Genomes (KEGG) and Metabolon.inc, metabolites were classified by function; the largest category was “carbohydrates” (20.779%), followed by “amino acids” (16.883%) and “nucleotide” (12.987%) (Supplementary Figure 2).
To detect variations in metabolites and metabolic pathways, we analyzed and compared DMs between the EU and CP, EW and CW, and EU and EW groups. Simultaneously, we assessed reliability of the CP and CW groups.
Multivariate data analysis was performed to detect metabolic differences and the discrete changes of metabolic data between various pairs of groups. principal component analysis (PCA) showed the degree of aggregation and dispersion between samples. As evident from Figure 2, PCA score plots for all pairs of groups were properly aggregated within a group and separated between the groups of the original state of the metabolome data. R2X represents the interpretability of the PCA model. In general, R2X > 0.5 indicates good model reliability. Table 1 shows R2X values for different pairs of groups.
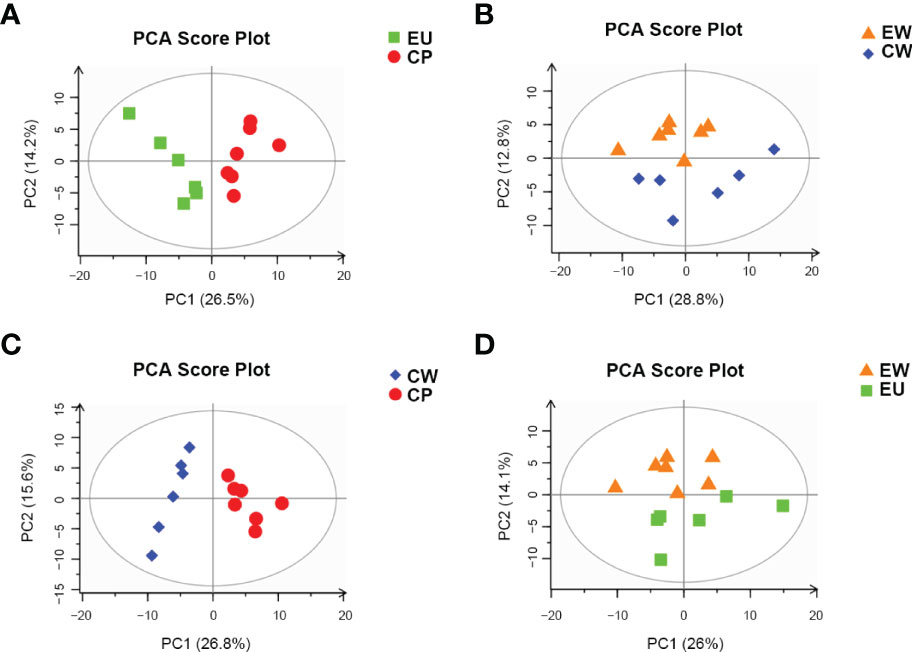
Figure 2 PCA score plots based on pairwise comparisons between different groups. (A) EU vs. CP, (B) EW vs. CW, (C) CW vs. CP, and (D) EW vs. EU groups.
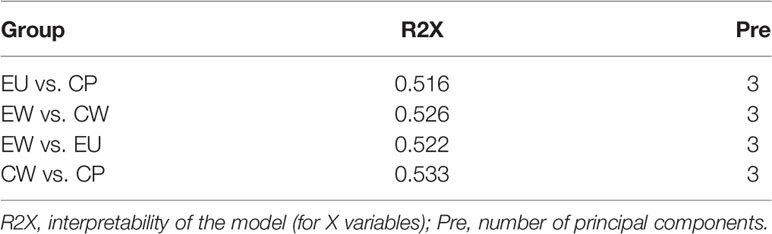
Table 1 PCA validation parameters of various pairwise comparison groups.
We also constructed orthogonal projections to latent structures discriminant analysis (OPLS-DA) models to investigate the correlation between metabolite levels and conditions of different pairs of groups, with the OPLS-DA model representing the distribution of all datasets. As shown in Figure 3, obvious clusters were obtained upon comparing different pairs of groups. The PCA and OPLS-DA models nicely described the data of samples obtained from trained immunity in shrimp and could be used for further analyses of data.
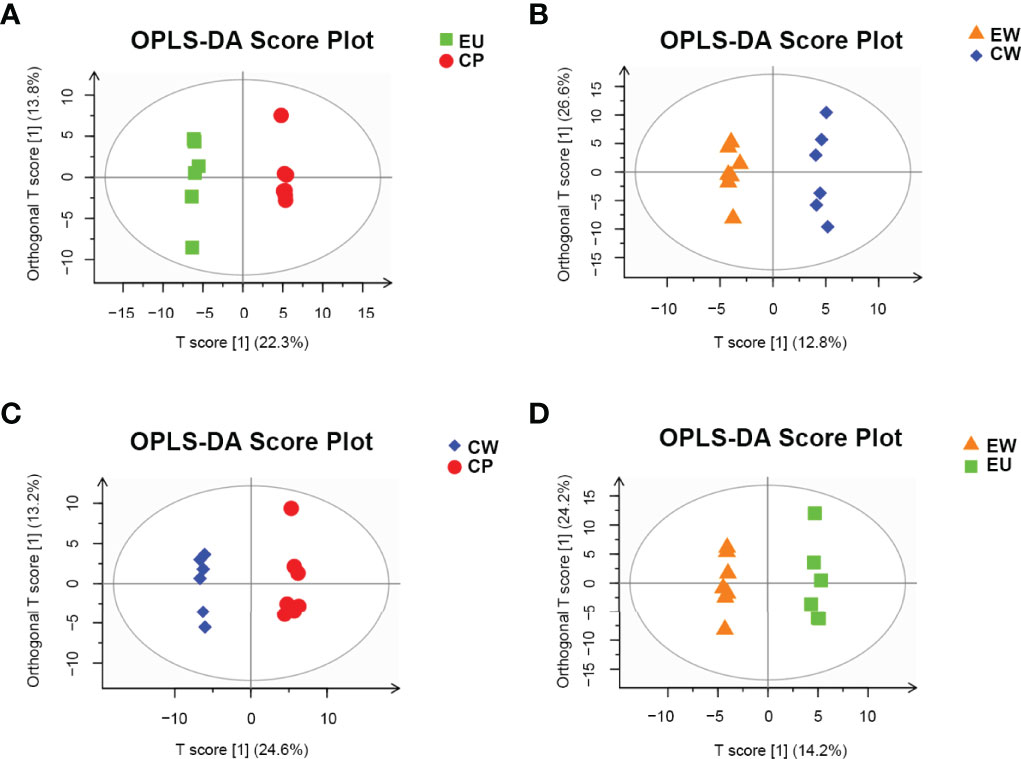
Figure 3 OPLS-DA score plots for pairwise comparisons between UV-WSSV trained immunity and control groups. (A) EU vs. CP, (B) EW vs. CW, (C) CW vs. CP, and (D) EW vs. EU groups.
A permutation plot can be used to effectively assess model overfitting. Herein the permutation plots for EU vs. CP, CW vs. CP, and EW vs. EU groups showed no overfitting, indicating that these models properly represented the samples and could be used for further data analyses (Figures 4A, C, D). In contrast, the permutation plot for EW vs. CW groups showed overfitting, suggesting that the data were invalid, and there were no significant differences in small molecules detected by GC–MS/MS (Figure 4B). Thus, no further analysis was performed for EW vs. CW group.
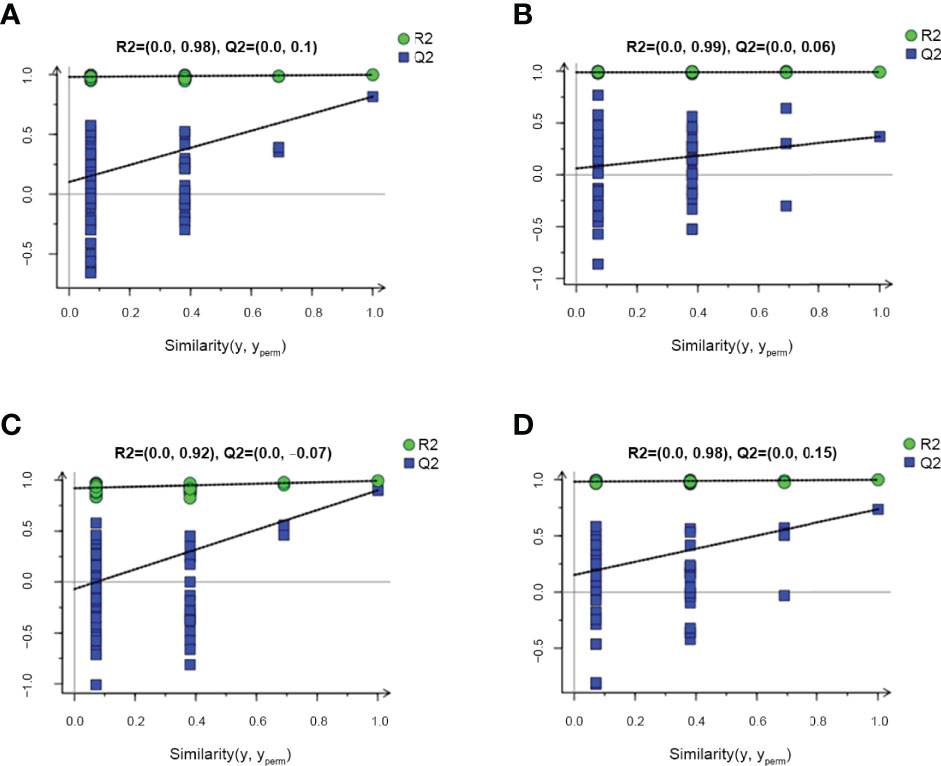
Figure 4 Permutation plots for pairwise comparisons between UV-WSSV trained immunity and control groups. (A) EU vs. CP, (B) EW vs. CW, (C) CW vs. CP, and (D) EW vs. EU groups.
Identification of DMs
Metabolomic analysis led to the identification of 154 metabolites. We compared changes in these metabolites based on variable importance in projection (VIP) score ≥ 1 obtained by OPLS-DA and p ≤ 0.05 (16, 17). Consequently, 45 and 23 DMs were identified in EU vs. CP and EW vs. EU groups, respectively. Tables 2, 3 show the classification, associated pathways, and fold-changes in DMs for EU vs. CP and EW vs. EU groups, respectively. DMs identified in CW vs. CP and EW vs. CW groups are listed in Supplementary Tables 1, 2, respectively.
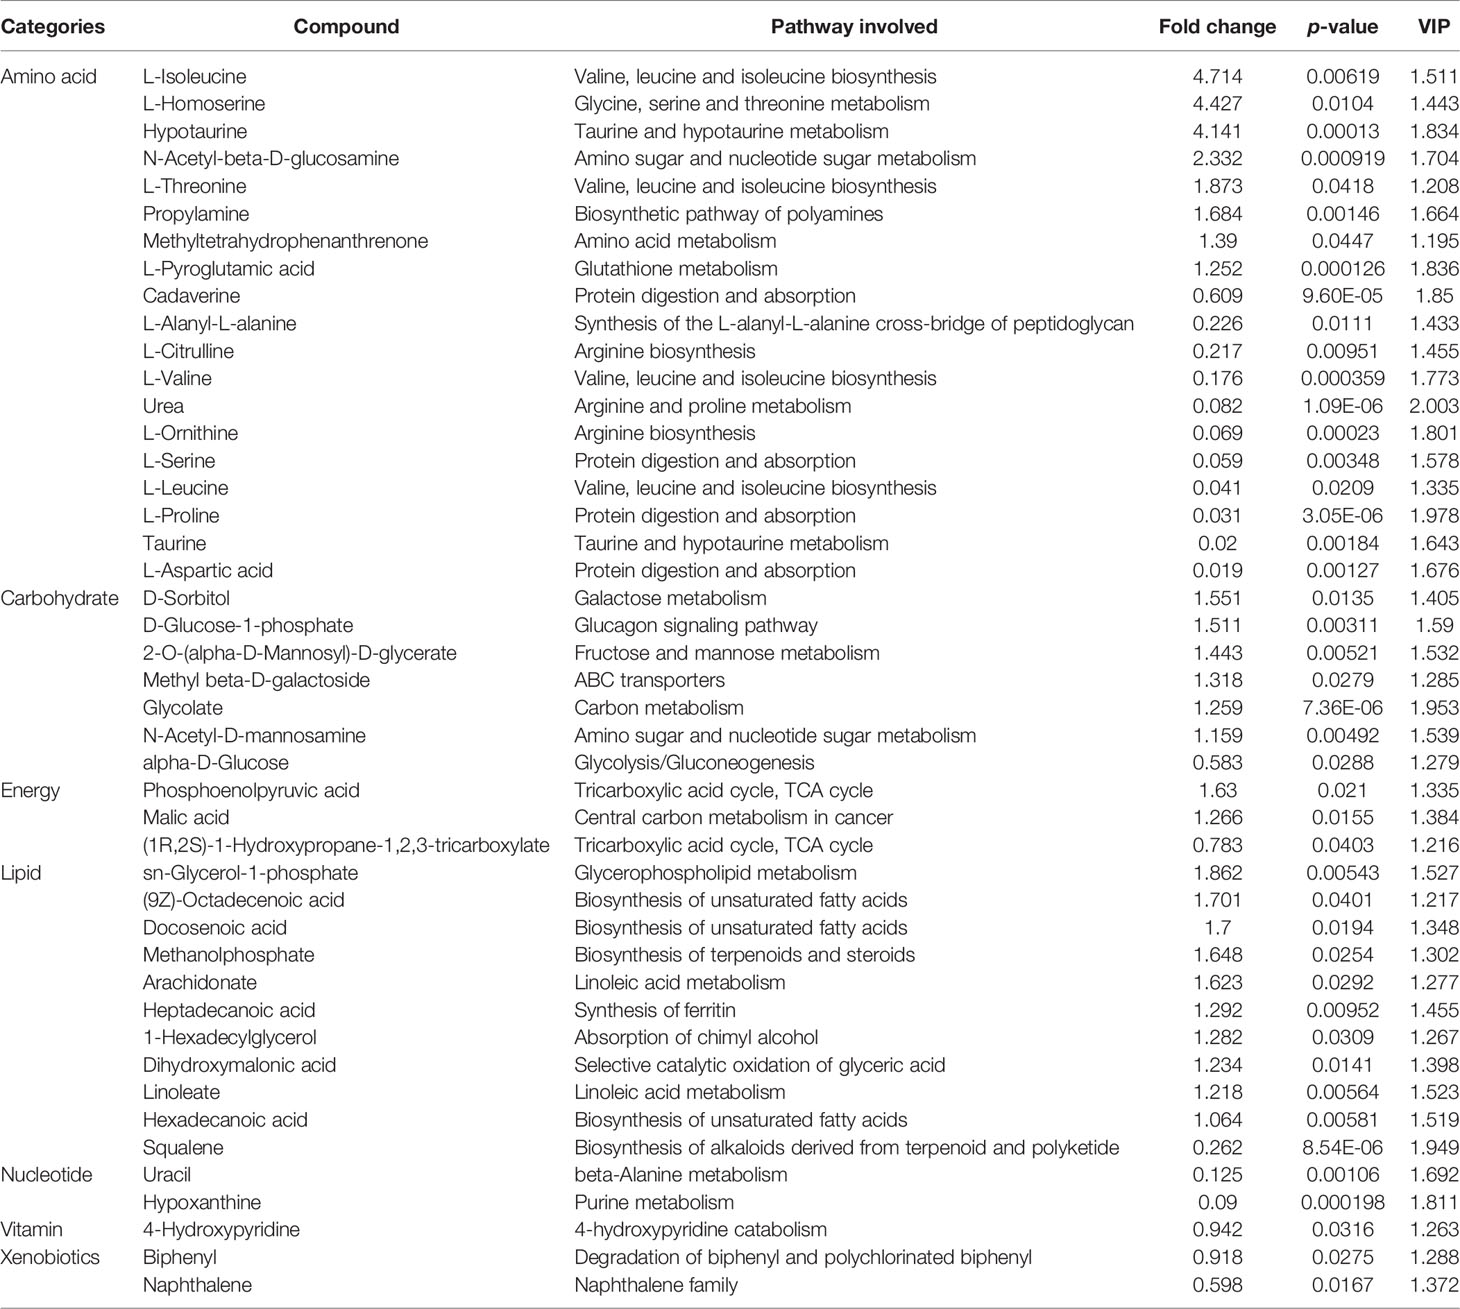
Table 2 Significantly changed differential metabolites in EU vs. CP groups.
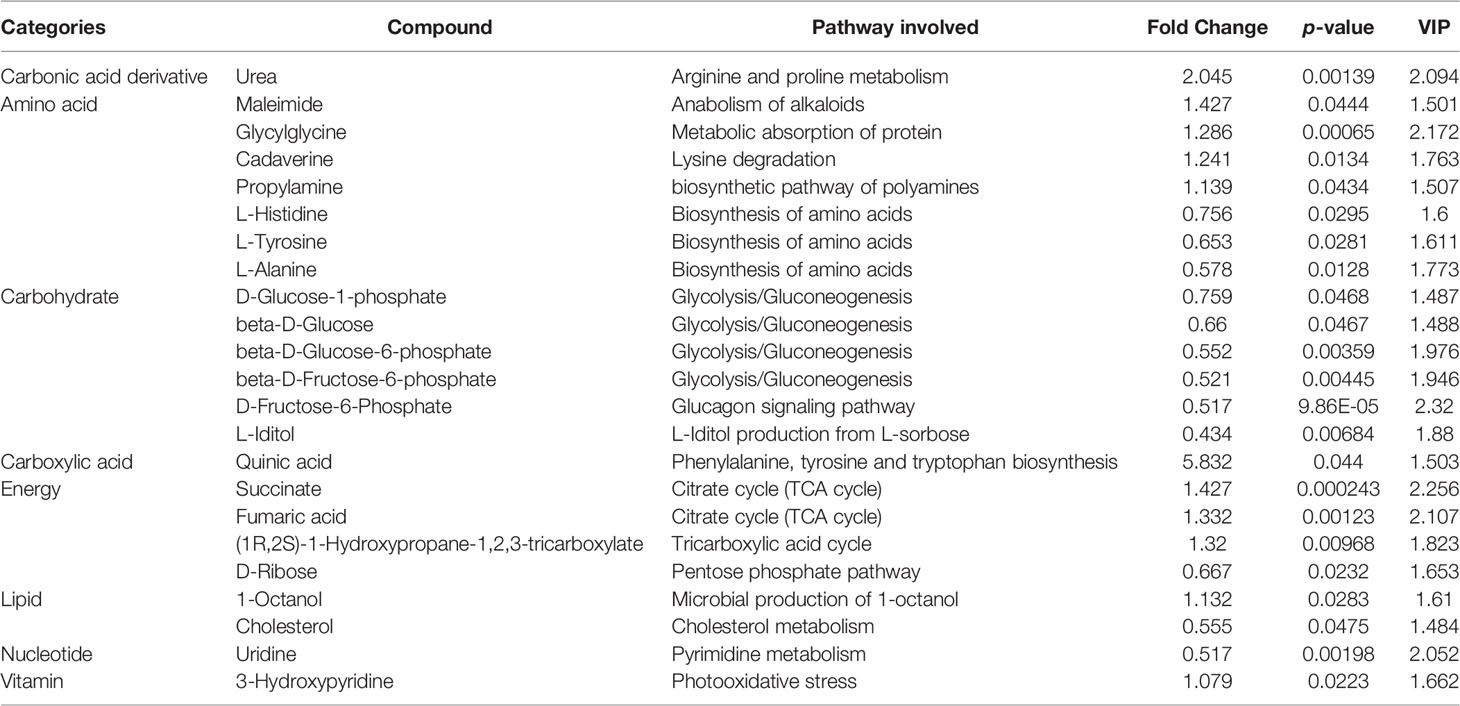
Table 3 Significantly changed differential metabolites in EW vs. EU groups.
Identification of DMs in EU vs. CP Groups
In EU vs. CP groups, 45 DMs were identified: 26 were upregulated and 19 were downregulated (Table 2). The top three most upregulated metabolites were L-isoleucine (4.71-fold), L-homoserine (4.42-fold), and hypotaurine (4.14-fold), whereas the top three most downregulated metabolites were L-proline, taurine, and L-aspartic acid. Based on p values and VIP scores, the most significantly altered metabolites were urea, L-proline, and glycolate; of them, glycolate was upregulated. Besides, as many as 14 types of amino acids were identified, including L-proline, L-pyroglutamic acid, L-ornithine, L-valine, and L-aspartic acid, accounting for a high proportion (>25%) of all DMs. Most of them were downregulated, accounting for 47% of all downregulated DMs. As evident from Supplementary Figures 3A, B, urea and L-proline were significantly downregulated in the EU group.
L-isoleucine is involved in protein metabolism, fatty acid metabolism, glucose transportation, and growth performance (18, 19). L-isoleucine can improve the immune system, including immune organs, cells, and reactive substances (20). According to our findings, L-isoleucine was upregulated (4.714-fold) and 14 different amino acids were downregulated in UV-WSSV trained immunity shrimp, suggesting that UV-WSSV training enhanced protein metabolism in shrimp.
Identification of DMs in EW vs. EU Groups
In EW vs. EU groups (Table 3), 23 DMs were identified: 11 were upregulated and 12 were downregulated. Quinic acid was upregulated by 5-fold and urea by approximately 2-fold, while the most downregulated metabolites included L-iditol, uridine, cholesterol, beta-D-glucose-6-phosphate, beta-D-fructose-6-phosphate, and D-fructose-6-phosphate. Based on p values and VIP scores, D-fructose-6-phosphate, succinate, glycylglycine, fumaric acid, and urea were the most significantly altered metabolites; of them, glycylglycine, succinate, and fumaric were upregulated. As evident from Supplementary Figures 3C, D, succinate and fumaric acid were significantly upregulated in the EW group. Further, beta-D-glucose, beta-D-glucose-6-phosphate, and D-fructose-6-phosphate, which are all associated with the glycolysis pathway, were significantly downregulated in the EW group. These results indicated that the glycolysis pathway might be involved in UV-WSSV-induced trained immunity in shrimp.
Heatmaps of DMs
We performed hierarchical clustering analyses to assess metabolic patterns under different experimental conditions; relative changes in various metabolites were determined and heatmaps were plotted (Figure 5). We found that the levels of metabolite change of six biological duplications within the groups showed good reproducibility, suggesting that our results were highly reliable. We could more intuitively identify downregulated metabolites, such as urea, L-proline, taurine, and L-aspartic acid, as well as upregulated metabolites, including L-isoleucine, L-homoserine, glycolate, and propylamine, in EU vs. CP groups (Figure 5A). Metabolites including quinic acid, maleimide, succinate, and fumaric acid were upregulated in EW vs. EU groups and those such as cholesterol, beta-D-glucose-6-phosphate, beta-D-fructose-6-phosphate, and L-iditol were downregulated (Figure 5B). All findings suggested that metabolism was significantly altered in EU vs. CP and EW vs. EU groups and that metabolic pathways were distinct between these pairs of groups (reprogramed).
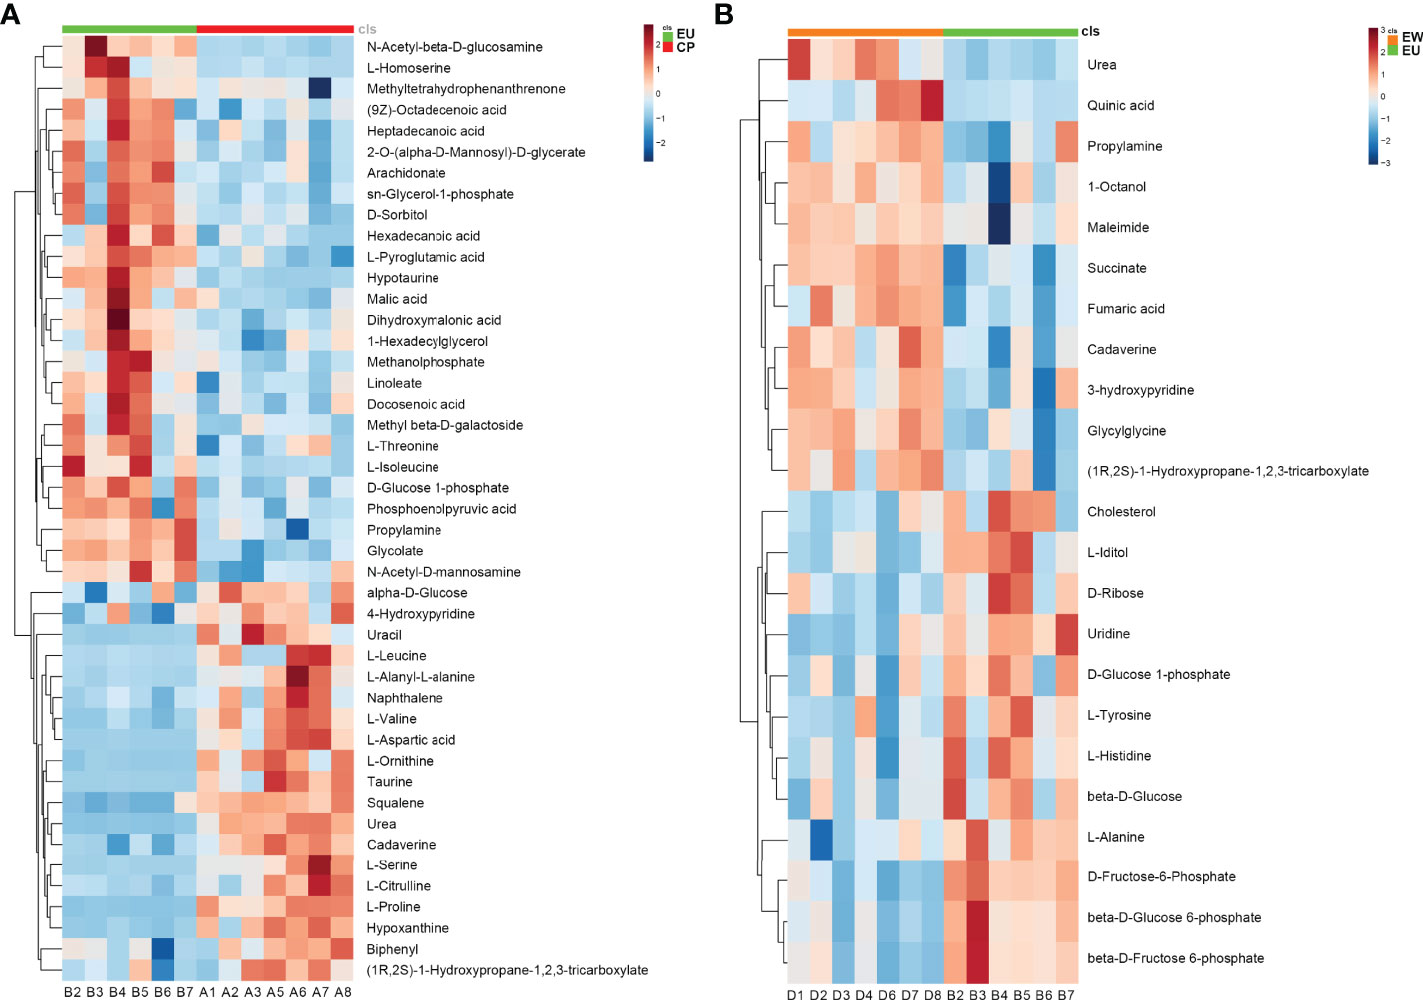
Figure 5 Heatmaps plotted using significantly changed metabolites. Each metabolite is represented by a row of colored boxes. Columns represent samples, and rows represent metabolites. Red indicates an increase in the relative level of metabolites, while blue indicates a decrease. (A) Heatmap of EU vs. CP and (B) EW vs. EU groups. A = CP, B = EU, and D = EW.
Comparison of DMs Between Experimental and Control Groups
We plotted a Venn diagram (Figure 6) to determine the number of common and unique DMs between experimental and control groups. As anticipated, there were certain changes in metabolites between EW vs. EU and CW vs. CP groups. Detailed information pertaining to DMs is shown in Table 4. In the experimental group (EW vs. EU), only 16 DMs were identified, including D-fructose-6-phosphate, beta-D-glucose-6-phosphate, and beta-D-fructose-6-phosphate, whereas in the control group (CW vs. CP), 37 unique DMs were identified, including squalene, L-proline, and L-valine. Seven DMs were common between the groups (Figure 6). These results suggested that UV-WSSV training led to metabolism reprogramming in UV-WSSV trained shrimp. In other words, trained immunity showed a relationship with metabolism in shrimp.
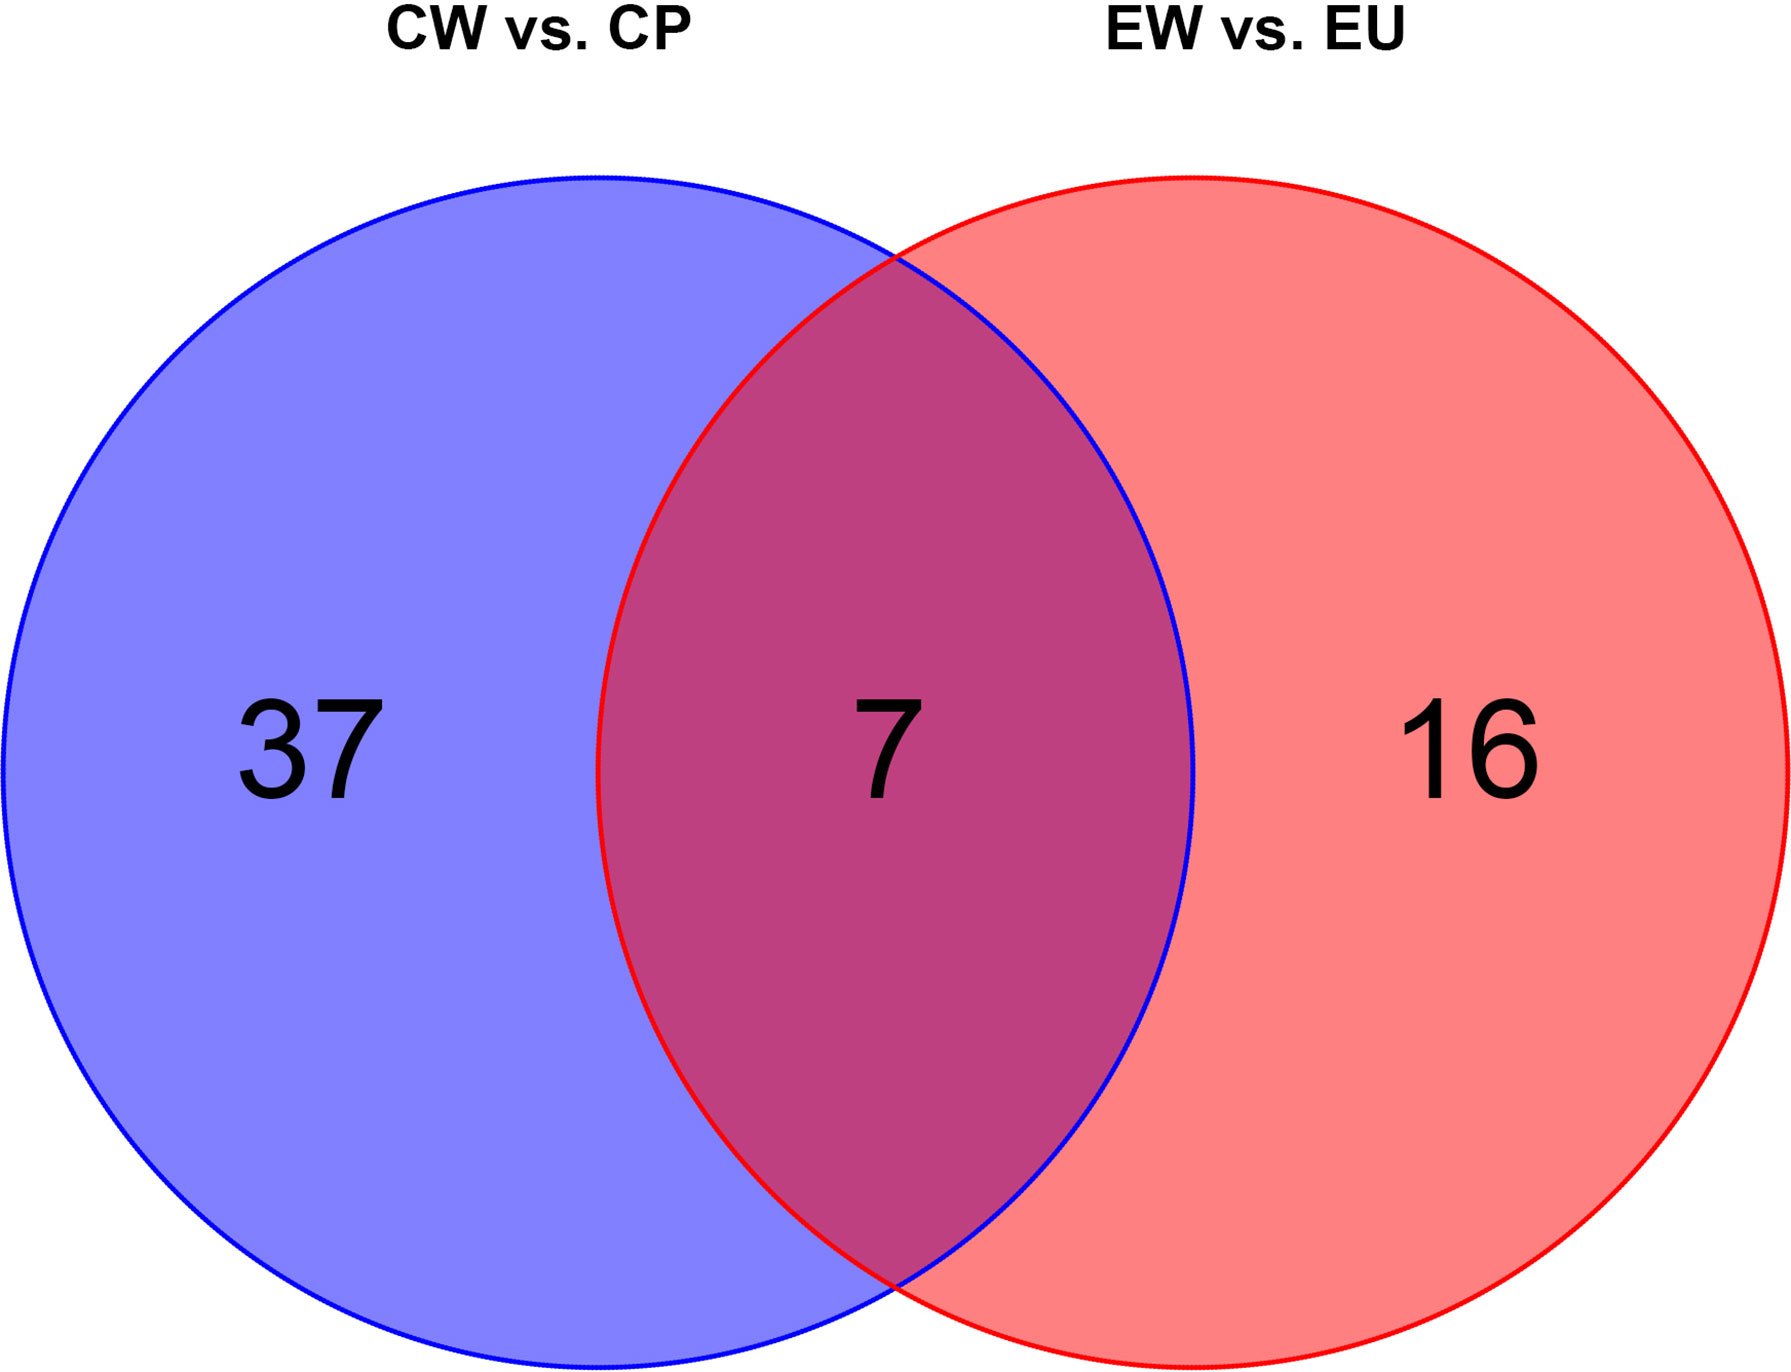
Figure 6 Venn diagram showing common and unique metabolites (EW vs. EU and CW vs. CP groups). There are 16 and 37 unique differential metabolites in EW vs. EU and CW vs. CP groups, respectively. Seven differential metabolites were common between them.
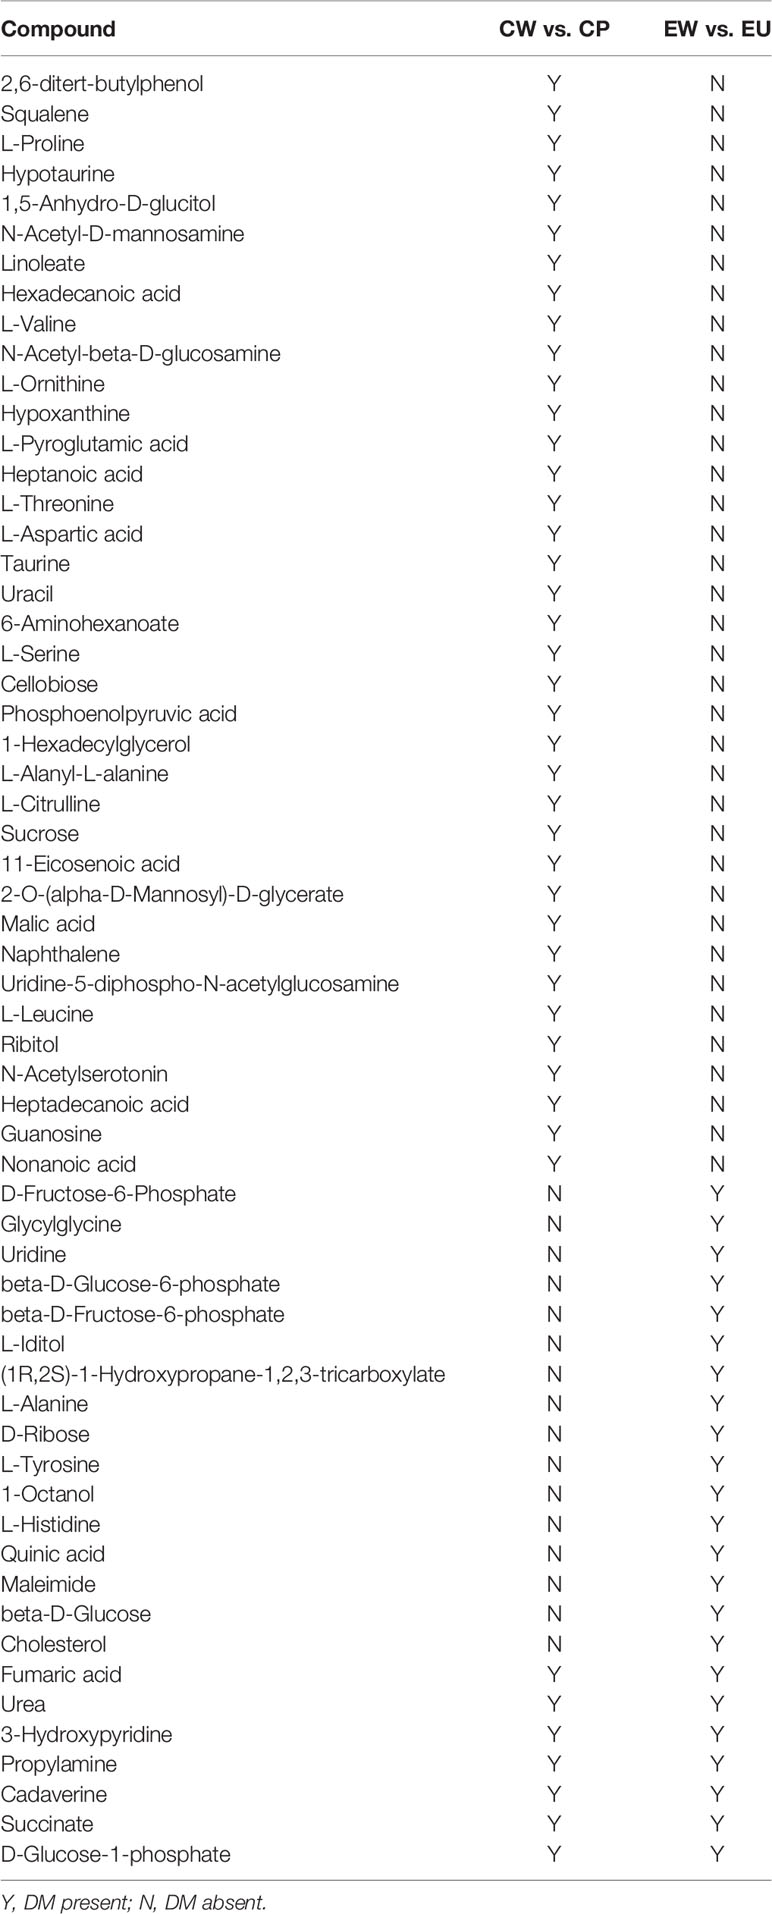
Table 4 Differential metabolites in the Venn diagram of EW vs. EU and CW vs. CP groups.
On plotting a Venn diagram, we found similarities and differences in metabolites between experimental (EU vs. EW) and control (CP vs. CW) groups. Energy metabolism-related metabolites, fumaric acid, and succinate were upregulated in both the groups, but urea was significantly upregulated in the experimental group (EW vs. EU) and downregulated in the control group (CW vs. CP). Many amino acids were altered in CW vs. CP groups. L-Proline, L-Valine, L-Ornithine, L-Aspartic acid, Taurine, L-Serine, L-Alanyl-L-alanine, L-Citrulline and L-Leucine were exclusively altered in CW vs. CP groups, which were down-regulated. Hypotaurine, L-Pyroglutamic acid, L-Threonine were exclusively altered in CW vs. CP groups, which were up-regulated. D-Fructose-6-Phosphate, beta-D-Glucose-6-phosphate, beta-D-Fructose-6-phosphate, D-Ribose, 1-Octanol, Quinic acid, beta-D-Glucose and cholesterol were unique in EW vs. EU. Most unique metabolites in EW vs. EU groups were related to energy metabolism. Cholesterol only changed in the trained group, to which is worth paying attention.
Metabolic Pathway Analyses
To explore potential metabolic pathways affected by UV-WSSV training, all DMs were annotated by KEGG pathway analysis. In the control group (CP vs. CW), biosynthesis of amino acid, biosynthesis of unsaturated fatty acid, TCA cycle, and mTOR signaling pathway were prevalent (Figure 7A), whereas in the experimental group EW vs. EU, carbon metabolism, glycolysis/gluconeogenesis, pentose phosphate pathway, and AMPK signaling pathway were enriched (Figure 7B).
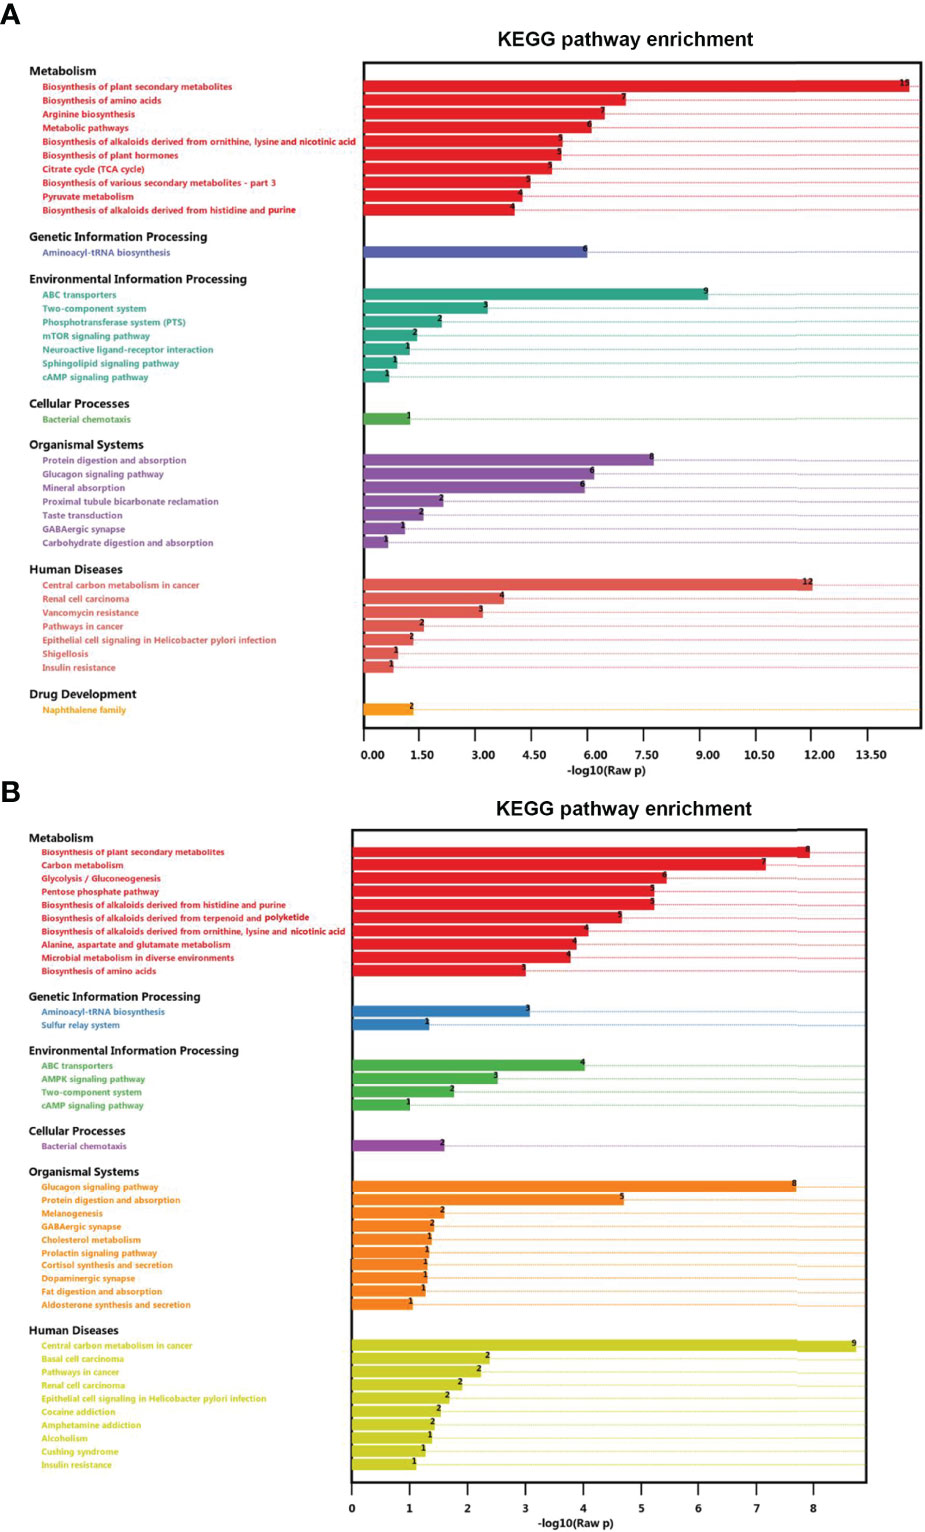
Figure 7 Enrichment of differential metabolites in distinct KEGG pathways. (A) CP vs. CW and (B) EU vs. EW groups.
Methylation of Histones at H3K4 Was Involved in Trained Immunity
Fumaric acid was significantly upregulated in shrimp at the 2nd WSSV infection as compared to those with 1st UV-WSSV training (Table 3). A previous study reported that fumarate-induced trained immunity resulted in increased trimethylation of histone at H3K4 (H3K4me3), associating metabolic activation with epigenetic changes (15). In the experimental (EU and EW) groups, we found that fumaric acid was upregulated (Table 3), indicating that histone methylation modification might be involved in trained immunity in shrimp. We therefore analyzed methylation of histones at H3K4, including monomethylation of histone H3 at lysine 4 (H3K4me1) and H3K4me3. The results showed that during training period, both H3K4me1 and H3K4me3 were increased at 6 h post UV-WSSV injection compared to PBS injection group and recovered to basal level at the 5th day of training (Figure 8A). After the 2nd infection with WSSV, the H3K4me1 and H3K4me3 was increased significantly at 3 h compared to PBS injection group (Figure 8B), suggesting a faster and stronger modification in UV-WSSSV trained shrimp. All the results suggested that modification of H3K4me1 and H3K4me3 is involved in the trained immunity in shrimp.

Figure 8 H3K4me1 and H3K4me3 were involved in trained immunity in shrimp. Histones were extracted from PBS and UV-WSSV trained shrimp at different time points, and H3K4me1 and H3K4me3 were analyzed using western blotting. (A) H3K4me1 modification analyzed by western blotting using anti-H3K4me1 as the primary antibody and statistical analysis based on three experiments. (B) H3K4me3 modification analysis using anti-H3K4me3 as the primary antibody and statistical analysis based on three experiments. The bands of western blotting were digitalized using Image J software, and the differences between trained and control groups at different time points was analyzed by student’s t test, p < 0.05 was accepted as significant difference.
Discussion
In the present study, UV-WSSV was used to induce trained immunity in M. japonicus and metabolic changes were analyzed. Metabolomic analyses revealed distinct changes between various groups. These changes were associated with several trained immunity-related metabolic pathways.
The ability of the innate immune system to develop adaptive characteristics (enhanced innate immune response to pathogens after an initial challenge) and provide long-term protection against pathogenic reinfection (via innate immune memory) is termed as trained immunity (21). However, there are several similarities between the trained immunity and other immune processes, such as differentiation, priming and tolerance. The main difference of these adaptive programs in innate immune cells is their functional status prior to secondary challenges (10). For the innate immune cell differentiation, cells are not allowed to return to the functional steady state before secondary stimulation. In the priming process, the first stimulus changes the functional state of cells, and their immune status does not return to basal levels before the secondary stimulation or infection (3). The tolerance is opposite process with trained immunity, innate immune cell is unable to activate gene transcription and does not perform its functions following second stimulation (10). The most common model of trained immunity is the training of innate immune cells or organisms for a short duration (10). Subsequently, cells or organisms rest for 5–7 days without any stimulation, and functional programs of cells return to a low and steady state during the resting phase (10). On the second stimulation, a heightened response to homologous or heterologous secondary stimuli is induced (10). In shrimp, the resting period after pathogen priming should be at least 5 days for the low recovery of immune response level (7). Considering this, we chose 5 days as the resting period after UV-WSSV training. Furthermore, the survival rate of the UV-WSSV trained immunity group was significantly higher than that of the control group. Vago-L inhibits white spot syndrome virus infection by activating JAK/STAT signaling in shrimp (22). Ficolin is an antiviral effector through binding virions and promoting phagocytosis, which is a direct antiviral effector downstream the WSSV/Vago-L/JAK/STAT axis in M. japonicus (22). We investigated the expression patterns of Vago-L and Ficolin in M. japonicus, and the results showed that expression of the two genes showed faster and stronger gene expressions after the second challenge with WSSV in UV-WSSV training shrimp (Figures 1F, G), which is consistent with the important characteristics of trained immunity (10). By methylation analysis, we found that H3K4me1 and H3K4me3 modification recovered to basal level at 5th day of UV-WSSV stimulation and the level of modifications increased faster and greater compared to control group (Figure 8). All the results suggested that UV-WSSV treatment induced trained immunity, and we successfully established the model of trained immunity in M. japonicus.
On comparing EU vs. CP groups, 45 DMs were identified, indicating that UV-WSSV treatment induced metabolome reprogramming in M. japonicus. The highest number of DMs were involved in “metabolic pathways” and “biosynthesis of amino acids.” As mentioned earlier, a lot of differential amino acids were identified, with most being downregulated in EU group. In addition, six metabolites that were the most up-regulated (L-isoleucine, L-homoserine, and hypotaurine) and downregulated (L-proline, taurine, and L-aspartic acid) from a fold-change perspective were amino acids. These results suggested that UV-WSSV training affected protein synthesis and amino acid metabolism. Amino acid metabolism plays a key role in metabolic rewiring and supports diverse immune cell functions (23). In addition, amino acids contribute to many other intracellular metabolic pathways. Immune cells rely on these pathways to obtain energy and biomass, and reprogram their metabolism after activation to support growth, proliferation, and effector functions (23). Accordingly, our findings suggested that amino acid metabolism and protein synthesis were involved in UV-WSSV-induced trained immunity. L-proline reportedly increases DNA methylation to regulate the pluripotency of embryonic stem cells (24). And synthesized cadmium–proline complexes accelerate epigenetic rearrangement by histone deacetylases inhibition (25). The treatment of cultured hepatocellular carcinoma cells with hydrogen peroxide caused methylation of the E-cadherin promoter (26). It showed that the ROS generated by proline degradation induces the expression of a genetic program including antioxidant enzymes protecting against ROS so that lifespan is extended (27, 28). Epigenetic reprogramming is a widely recognized trained immunity mechanism, and it mainly involves changes in chromatin structure caused by histone modifications, such as methylation and acetylation (29). Our data suggests that L-proline is involved in this process, affecting epigenetic modifications via metabolic changes and thereby inducing UV-WSSV trained immunity in M. japonicus. During amino acid metabolism in vivo, ammonia is produced through ornithine, followed by urea synthesis; this process is known as the ornithine cycle or the urea cycle. As highly concentrated ammonia is toxic to cells, most of it is converted to urea through the ornithine cycle. This might explain the high folds change of urea among all DMs in different groups.
It is reported that training of monocytes with β-glucan induces profound changes in cellular metabolism. Three metabolic pathways are involved in trained immunity, namely glycolysis, glutaminolysis, and cholesterol synthesis, which are linked to enrichment in H3K4me3 (15). mTOR signaling pathway is complicated and is differently regulated under different conditions. A study reported that inhibition of Akt, mTOR, or HIF-1α blocked the trained immunity induced by the Candida albicans cell wall constituent β-glucan in human monocytes (14). We herein observed that the mTOR signaling pathway was significantly altered, with L-leucine being significantly downregulated within this pathway. These results indicated that the changes in amino acid metabolism were particularly significant in this process.
Energy metabolism is one of the driving forces for the performance of immunity. Several DMs were enriched in the energy metabolism pathway in EU vs. CP groups. Arachidonate, a long-chain polyunsaturated fatty acid, has beneficial effects on the immunity of aquatic animals (30, 31), which was upregulated in our result. It is related with linoleic acid metabolism. In our previous study, we found that linoleic acid plays a key role against WSSV infection (32). Therefore, its upregulation might be related to trained immunity.
In EW vs. EU groups, there were 23 DMs, including succinate (Table 3). Succinate is recently being receiving increased attention as an epigenetic modulator, and it is also involved in reactive oxygen species (ROS) formation and elimination, signal transduction, and endo- and paracrine modulation and inflammation (33). β-glucan training has been reported to enhance ROS levels in tumor-associated neutrophils, and ROS production is the basic feature of trained neutrophils to exert anti-tumor activity (34). Our findings indicated that succinate was significantly upregulated, suggesting that it participates in UV-WSSV-induced trained immunity. Succinate is oxidized by succinate dehydrogenase to fumaric acid to participate in the TCA cycle. The TCA cycle is the most effective way to oxidize sugars or other substances so as to generate energy. Further, TCA cycle is the final metabolic pathway of carbohydrates, lipids, as well as amino acids, and it is the hub of their metabolic connection. This explains why fumaric acid was also significantly upregulated herein. Fumarate-induced trained immunity results in increased H3K4me3 and also acetylation at H3K27; it is notable that fumarate accumulation integrates immune and metabolic circuits to induce monocyte epigenetic reprogramming by inhibiting KDM5 histone demethylases (15). We observed that fumaric acid was significantly upregulated in EW vs. EU groups, and H3K4me1 and H3K4me3 were increased in UV-WSSV trained immunity shrimp. Long-term changes in DNA methylation and stable changes in chromatin accessibility can accompany cell differentiation, whereas specific histone marks characterizing ‘latent enhancers,’ such as monomethylated histone H3K4 are often ‘tagged’ in trained immunity (6, 21). In the present study, we also found that H3K4me1 and H3K4me3 were involved in the UV-WSSV trained immunity.
Energy is indispensable for various life activities, including immunity. We found that beta-D-glucose-6-phosphate, beta-D-fructose-6-phosphate, and D-fructose-6-phosphate showed an obvious downregulation (Table 3), indicating that energy metabolism was affected. In addition, KEGG pathway analysis revealed the enrichment of glucagon signaling pathway and glycolysis, suggesting an increase in energy consumption in shrimp with trained immunity. After trained immunity, the immune response to homologous infection is evidently stronger (2, 4); thus, we speculated that higher energy metabolism must be related to this response. Monocytes/macrophages appear to have a central role in COVID-19 pathogenicity; they adapt their metabolism upon infection and become highly glycolytic, facilitating SARS-CoV-2 replication (35). The infection triggers mitochondrial ROS production, which induces stabilization of hypoxia-inducible factor-1α and consequently promotes glycolysis (35). Similarly, WSSV infection has been found to increase energy demand and induce the Warburg effect, in which glucose consumption and lactate production increase even in the presence of oxygen, and this is essential for viral replication (36, 37). We observed that shrimp with UV-WSSV trained immunity showed increased energy metabolism after the second injection with WSSV.
Bekkering et al. (38) reported that monocytes from patients with familial hypercholesterolemia showed a trained immunity phenotype and that lipid lowering with statins did not revert this proinflammatory phenotype. Moreover, Wang et al. (39) reported that an M. japonicus stomach virus-associated C-type lectin (MjsvCL) enhanced WSSV entry via the MjsvCL–calreticulin pathway in a cholesterol-dependent manner. We found a decrease in cholesterol levels on comparing EW vs. EU groups. Accordingly, we believe that the decrease in cholesterol was a strategy against WSSV infection in shrimp trained immunity.
Interestingly, we found that quinic acid level was significantly upregulated in EW vs. EU groups. Quinic acid, a cyclohexanecarboxylic acid, is generally obtained from plants (40), and it has been mostly studied as a chlorogenic acid, an ester of caffeic and quinic acids (41). In the colon, chlorogenic acid is hydrolyzed by microbial esterases to release caffeic and quinic acids (41). Quinic acid derivatives have been found in propolis produced by Apis mellifera in the South and Southeast regions of Brazil (42). Furthermore, quinic acid derivatives evidently exert antiviral activities against HIV, Moloney murine leukemia virus, and dengue virus (43, 44). The hemolymph of crustaceans has been reported to have microbiota (45, 46). Quinic acid levels were found to be positively correlated with the abundance of some probiotic bacteria such as Lactobacillus in the gut, with changes in gene modulation effects (47, 48). Two hundred and two strains of lactic acid bacteria isolated from digestive tracts of cultivated and wild adult shrimp, including Litopenaeus vannamei, Metapenaeus brevicornis and Penaeus merguiensis (49). In addition, Lactobacillus species as probiotics was used in shrimp aquaculture to prevent viral infections due to their positive promoting effects on survival and health (50). It is reasonable to assume that quinic acid plays a role against WSSV; nevertheless, further studies are warranted to validate its function.
To determine metabolic changes underlying UV-WSSV-induced trained immunity in shrimp, we performed metabolomic-based analyses, which led to the identification of several DMs, many of which were closely related to amino acid metabolism. Further, we assessed changes in the EW group in comparison with the EU group and found that metabolites related to energy and amino acid metabolism, including succinate, fumaric acid, and urea, were the most significantly altered. Many energy metabolism-related DMs were found only in the trained immunity groups, while more amino acid metabolism-related DMs were found in the control groups. We believe that glycolysis, pentose phosphate pathway, and AMPK signaling pathway are involved in WSSV-induced trained immunity in shrimp and that metabolic changes during the process of trained immunity are associated H3K4me1 and H3K4me3 epigenetic modifications.
Materials and Methods
Animals and Rearing Conditions
Healthy shrimp (M. japonicus) with average body weight of 20 ± 2 g were obtained from a local farming pond in Aoshanwei, Qingdao, China. They were maintained in aerated natural seawater at 20°C in our laboratory and acclimated for 1 day before the training experiment. Animals were randomly selected for subsequent experiments. The animal treatment protocol was reviewed and approved by Shandong University School of Life Sciences.
Preparation of Inactivated Viral Inoculum
WSSV inoculum was prepared as previously described, and qRT-PCR was performed for viral quantification (22, 51).
WSSV was inactivated by exposure to UV (UV-WSSV). Briefly, WSSV inoculum (15 mL, 1 × 10⁷ copies/mL) in a sterile Petri dish was placed under a 20 W UV lamp on an ultraclean workbench for 30 min. The irradiation distance was 500 mm. Before the training experiment, we performed shrimp mortality analysis to detect the training effect of UV-WSSV. The number of dead shrimp was counted every 24 h, and the survival rate of shrimp was calculated using the log-rank (Mantel–Cox) test.
UV-WSSV-Induced Trained Immunity Model
Figure 1A shows the establishment of the UV-WSSV-induced trained immunity model in shrimp. Shrimp were randomly divided into two groups (100 shrimp/group). Fifty microliters of UV-WSSV (5 × 10⁵ copies) were intramuscularly injected into the animals. The control group was injected with the same volume of sterile PBS (140 mM NaCl, 2.7 mM KCl, 10 mM Na2HPO4, and 1.8 mM KH2PO4, pH 7.4). Five days after UV-WSSV training, a second injection of WSSV was administered. The training and control groups were injected with the same amount of live WSSV (50 μL, 5 × 10⁵ copies).
Detection of Viral Replication
After WSSV infection, the hemocytes of trained shrimp (UV-WSSV/PBS) was sampled to isolated total RNA at 12 and 24 h, and qRT-PCR was performed with the reverse transcribed RNA samples (22, 51) to detect the Vp28 expression level.
Prior to treatment, the shrimp used for trained immunity analysis were randomly selected for testing WSSV infection by RT-PCR with primers VP28F and VP28R (Supplementary Table 3). Hemocytes, intestine and gills of untreated shrimp were sampled to isolated total RNA with TRIzol (Transgen, Beijing, China), and RT-PCR was carried out to detect the Vp28 expression level with the reverse transcribed RNA. The PCR procedure comprised: an initial incubation at 94°C for 3 min; followed by 28 cycles of 94°C for 30 s, 60°C for 30 s, and 72°C for 30 s; followed by 72°C for 10 min. The PCR products were analyzed by agarose gel electrophoresis (1.2% agarose). ddH2O was used as a negative control, while the WSSV sample was used as a positive control.
qRT-PCR
The total RNA was isolated from the hemocytes of the PBS- or UV-WSSV-treatment shrimp at 6, 12, 24 h and 5 days post injection. After second challenge with WSSV, the hemocytes was sampled to isolated total RNA at 3, 6, 12 and 24 h post infection. Then qRT-PCR was performed with the reverse transcribed RNA samples (22, 51).
β-Actin was used as a control. Each assay was carried out in triplicate with the following cycling conditions: 94°C for 10 min, followed by 40 cycles at 94°C for 15 s, and 62°C for 50 s; and then a melting period from 65°C to 95°C (22, 51). The gene relative expression levels of Vago-L and Ficolin were detected. Triplicate Ct values were analyzed by the comparative Ct (ΔΔCt) method. The data are presented as mean ± standard deviation (SD). The primers are listed in Supplementary Table 3.
Metabolomic Sample Collection
For metabolome analyses, hemolymph was sampled at two timepoints: first in the training phase and another after active WSSV reinjection (Figure 1A). At 48 h of training, hemolymph samples from both groups (experiment/control) were collected [hemolymph from the control group (CP, control group injected with PBS) and from the UV-WSSV trained immunity group (EU, experimental group injected with UV-WSSV)]. Subsequently, at 24 h of the second injection with WSSV, hemolymph samples were again collected from both groups [hemolymph from the control and UV-WSSV trained immunity groups injected with WSSV (CW and EW, respectively), Figure 1A)].
Hemolymph samples were collected from two shrimp using a syringe preloaded with 500 μL anticoagulant (450 mM NaCl, 10 mM KCl, 10 mM EDTA, and 10 mM HEPES, pH 7.45) at a ratio of 1:1, gently mixed, and clearly marked. The samples were then centrifuged (4°C, 1600 ×g, 15 min) as soon as possible and the supernatant (plasma) thus obtained was immediately frozen in liquid nitrogen. All samples were stored at −80°C until needed. In total, for each group, >6 biological duplicate samples were subjected to metabolomic analyses.
Metabolomic Analysis
At least six plasma samples from each group were assessed using tandem gas chromatography mass spectrometry (GC–MS/MS) by BioNovoGene company (Suzhou, China). Briefly, 1 mL ice-cold (−20°C) acetonitrile:isopropanol:water (3:3:2, v/v/v) was added to 50 μL sample and vortexed for 30 s. After ultrasonication for 5 min at room temperature, the samples were centrifuged at 13523 ×g for 2 min. Subsequently, 500 μL of the supernatant was dried in a vacuum concentrator for 8–10 h. The sample was then redissolved in 80 μL of 20 mg/mL methoxypyridine and thoroughly mixed for 30 s, followed by incubation at 60°C for 1 h. Finally, 100 μL BSTFA-TMCS (99:1) reagent was added to the samples, vortexed for 30 s, followed by heating at 70°C for 90 min. After centrifugation at 18407 ×g for 3 min, the supernatant (100 μL) was added to the detection bottle. Overall samples were placed in sealed cuvettes stored for testing and processed for gas chromatography time-of-flight upper detection within 24 h (52).
Gas chromatographic separations of derivatives were performed on a DB-5MS capillary column (30 m × 250 μm i.d., 0.25 μm film thickness, Agilent J & W Scientific, Folsom, CA, USA) with a constant flow of 1 mL/min helium. The sample (1 μL) was injected in split mode at a split ratio of 1:10 by the autosampler. The inlet temperature was 280°C, and the temperatures of the transfer line and ion source were 320°C and 230°C, respectively. The column temperature was initially held at 50°C for 30 s and then increased at a rate of 15°C/min to 320°C; the temperature was then maintained at 320°C for 9 min. MS was performed using the full-scan method at a scan rate of 10 spectra/s, electron energy of −70 V, and solvent delay of 3 min (53, 54).
First, all sample data were preprocessed. A data matrix was obtained, including mass-to-charge ratio (m/z), retention time (rt), and intensity. The minimum one-half method to fill in the blanks was used to simulate the missing value recoding of the original data. To compare different magnitudes, data were subjected to total peak area normalization. All data were performed quality assurance and quality control (55). Data were normalized using autoscaling (mean-centering and scaled to unit variance) before performing multivariate analysis, including PCA, and OPLS-DA to obtain more reliable, intuitive results. SIMCA-P v13.0 and R package ‘ropls’ (56) were used. Based on p ≤ 0.05 and VIP score ≥ 1 obtained by OPLS-DA (57), DMs were identified. The R v3.3.2 package pheatmap was used to zoom the dataset and to obtain a hierarchical clustering map of relative quantitative values of metabolites. DMs were annotated by performing KEGG pathway analysis using MetPA, which is a part of metaboanalyst (www.metaboanalyst.ca) and mainly based on KEGG metabolic pathways.
Histone Modification Analysis
Histones were extracted using the Nuclear Protein Extraction Kit (R0050, Solarbio, Beijing, China), according to manufacturer instructions. Further, we analyzed histone modification levels by western blotting (58) using anti-H3K4me1 and anti-H3K4me3 as primary antibodies (ABclonal, USA). Histone H3 polyclonal antibody (ABclonal, USA) was used as the reference. Student’s t test statistical analysis of H3K4me1 and H3K4me3 modifications were performed after digitalized the bands of western blotting using Image J software.
Statistical Analysis
Values are presented as mean ± SD. p < 0.05 indicated statistically significant differences analyzed by Student’s t test.
Data Availability Statement
The original contributions presented in the study are included in the article/Supplementary Material. Further inquiries can be directed to the corresponding author.
Author Contributions
SZ performed experiments, including establishment of the shrimp trained immunity model, sample collection, performed the metabolomics analysis, and wrote and revised the manuscript draft, and helped to design the study. L-XL and C-FL contributed to the model establishment and samples collection. L-XL and PZ performed histone modification analysis and expression patterns of immune genes. C-FL and CL prepared the WSSV inoculum for infection. J-XW designed and administrated this study, wrote and revised the manuscript. All authors contributed to the article and approved the submitted version.
Funding
This work was supported by grants from the National Natural Science Foundation of China (Grant Nos. 31930112), National Key Research and Development Program of China (Grant No. 2018YFD0900502).
Conflict of Interest
The authors declare that the research was conducted in the absence of any commercial or financial relationships that could be construed as a potential conflict of interest.
Publisher’s Note
All claims expressed in this article are solely those of the authors and do not necessarily represent those of their affiliated organizations, or those of the publisher, the editors and the reviewers. Any product that may be evaluated in this article, or claim that may be made by its manufacturer, is not guaranteed or endorsed by the publisher.
Acknowledgments
The authors would like to thank Mr. Changbin Liu at State Key laboratory of Microbial Technology of Shandong University for help in qRT-PCR analysis.
Supplementary Material
The Supplementary Material for this article can be found online at: https://www.frontiersin.org/articles/10.3389/fimmu.2022.885782/full#supplementary-material
References
1. Hoffmann JA, Kafatos FC, Janeway CA, Ezekowitz RA. Phylogenetic Perspective in Innate Immunity. Science (1999) 284:1313–8. doi: 10.1126/science.284.5418.1313
2. Netea MG, Quintin J, van der Meer JWM. Trained Immunity: A Memory for Innate Host Defense. Cell Host Microbe (2011) 9:355–61. doi: 10.1016/j.chom.2011.04.006
3. Netea MG, Schlitzer A, Placek K, Joosten LA, Schultze JL, et al. Innate and Adaptive Immune Memory: An Evolutionary Continuum in the Host’s Response to Pathogens. Cell Host Microbe (2019) 25:13–26. doi: 10.1016/j.chom.2018.12.006
4. Netea MG, Joosten LA, Latz E, Mills KH, Natoli G, Stunnenberg HG, et al. Trained Immunity: A Program of Innate Immune Memory in Health and Disease. Science (2016) 352:aaf1098. doi: 10.1126/science.aaf1098
5. Norouzitallab P, Biswas P, Baruah K, Bossier P. Multigenerational Immune Priming in an Invertebrate Parthenogenetic Artemia to a Pathogenic Vibrio Campbellii. Fish Shellfish Immunol (2015) 42:426–9. doi: 10.1016/j.fsi.2014.11.029
6. Norouzitallab P, Baruah K, Biswas P, Vanrompay D, Bossier P. Probing the Phenomenon of Trained Immunity in Invertebrates During a Transgenerational Study, Using Brine Shrimp Artemia as a Model System. Sci Rep (2016) 6:1–14. doi: 10.1038/srep21166
7. Chang YH, Kumar R, Ng TH, Wang HC. What Vaccination Studies Tell Us About Immunological Memory Within the Innate Immune System of Cultured Shrimp and Crayfish. Dev Comp Immunol (2018) 80:53–66. doi: 10.1016/j.dci.2017.03.003
8. Roy S, Bossier P, Norouzitallab P, Vanrompay D. Trained Immunity and Perspectives for Shrimp Aquaculture. Rev Aquac (2020) 12:2351–70. doi: 10.1111/raq.12438
9. Ramirez-Prado JS, Abulfaraj AA, Rayapuram N, Benhamed M, Hirt H, et al. Plant Immunity: From Signaling to Epigenetic Control of Defense. Trends Plant Sci (2018) 23:833–44. doi: 10.1016/j.tplants.2018.06.004
10. Divangahi M, Aaby P, Khader SA, Barreiro LB, Bekkering S, Chavakis T, et al. Trained Immunity, Tolerance, Priming and Differentiation: Distinct Immunological Processes. Nat Immunol (2021) 22:2–6. doi: 10.1038/s41590-020-00845-6
11. Donohoe DR, Bultman SJ. Metaboloepigenetics: Interrelationships Between Energy Metabolism and Epigenetic Control of Gene Expression. J Cell Physiol (2012) 227:3169–77. doi: 10.1002/jcp.24054
12. Rodriguez RM, Suarez-Alvarez B, Lopez-Larrea C. Therapeutic Epigenetic Reprogramming of Trained Immunity in Myeloid Cells. Trends Immunol (2019) 40:66–80. doi: 10.1016/j.it.2018.11.006
13. Low CF, Rozaini MZH, Musa N, Syarul Nataqain B. Current Knowledge of Metabolomic Approach in Infectious Fish Disease Studies. J Fish Dis (2017) 40:1267–77. doi: 10.1111/jfd.12610
14. Cheng SC, Quintin J, Cramer RA, Shepardson KM, Saeed S, Kumar V, et al. mTOR-And HIF-1α–Mediated Aerobic Glycolysis as Metabolic Basis for Trained Immunity. Science (2014) 345:1250684. doi: 10.1126/science.1250684
15. Arts RJW, Novakovic B, Ter Horst R, Carvalho A, Bekkering S, Lachmandas E, et al. Glutaminolysis and Fumarate Accumulation Integrate Immunometabolic and Epigenetic Programs in Trained Immunity. Cell Metab (2016) 24:807–19. doi: 10.1016/j.cmet.2016.10.008
16. Chong IG, Jun CH. Performance of Some Variable Selection Methods When Multicollinearity is Present. Chemometr Intell Lab (2005) 78:103–12. doi: 10.1016/j.chemolab.2004.12.011
17. Chen Y, Ma Z, Li A, Li H, Wang B, Zhong J, et al. Metabolomic Profiling of Human Serum in Lung Cancer Patients Using Liquid Chromatography/Hybrid Quadrupole Time-of-Flight Mass Spectrometry and Gas Chromatography/Mass Spectrometry. J Cancer Res Clin Oncol (2015) 141:705–18. doi: 10.1007/s00432-014-1846-5
18. Olde Damink SWM, Jalan R, Deutz NE, Dejong CH, Redhead DN, Hynd P, et al. Isoleucine Infusion During “Simulated” Upper Gastrointestinal Bleeding Improves Liver and Muscle Protein Synthesis in Cirrhotic Patients. Hepatology (2007) 45:560–8. doi: 10.1002/hep.21463
19. Appuhamy JA., Knoebel NA, Nayananjalie WA, Escobar J, Hanigan MD, et al. Isoleucine and Leucine Independently Regulate mTOR Signaling and Protein Synthesis in MAC-T Cells and Bovine Mammary Tissue Slices. J Nutr (2012) 142:484–91. doi: 10.3945/jn.111.152595
20. Gu C, Mao X, Chen D, Yu B, Yang Q. Isoleucine Plays an Important Role for Maintaining Immune Function. Curr Protein Pept Sci (2019) 20:644–51. doi: 10.2174/1389203720666190305163135
21. Netea MG, Domínguez-Andrés J, Barreiro LB, Chavakis T, Divangahi M, Fuchs E, et al. Defining Trained Immunity and its Role in Health and Disease. Nat Rev Immunol (2020) 20:375–88. doi: 10.1038/s41577-020-0285-6
22. Gao J, Zhao BR, Zhang H, You YL, Li F, Wang XW, et al. Interferon Functional Analog Activates Antiviral Jak/Stat Signaling Through Integrin in an Arthropod. Cell Rep (2021) 36:109761. doi: 10.1016/j.celrep.2021.109761
23. Kelly B, Pearce EL. Amino Assets: How Amino Acids Support Immunity. Cell Metab (2020) 32:154–75. doi: 10.1016/j.cmet.2020.06.010
24. D'Aniello C, Habibi E, Cermola F, Paris D, Russo F, Fiorenzano A, et al. Vitamin C and L-Proline Antagonistic Effects Capture Alternative States in the Pluripotency Continuum. Stem Cell Rep (2017) 8:1–10. doi: 10.1016/j.stemcr.2016.11.011
25. Chidambaram A, Sekar A, S H K, Chidambaram RK, Arunachalam K, G P S, et al. Synthesis, Characterization, and Evaluation of Cd [L-Proline]2, a Novel Histone Deacetylase Inhibitor That Induces Epigenetic Modification of Histone Deacetylase Isoforms in A549 Cells. Invest New Drug (2017) 35:691–705. doi: 10.1007/s10637-017-0489-1
26. Lim SO, Gu JM, Kim MS, Kim HS, Park YN, Park CK, et al. Epigenetic Changes Induced by Reactive Oxygen Species in Hepatocellular Carcinoma: Methylation of the E-Cadherin Promoter. Gastroenterology (2008) 135:2128–40. doi: 10.1053/j.gastro.2008.07.027
27. Zarse K, Schmeisser S, Groth M, Priebe S, Beuster G, Kuhlow D, et al. Impaired Insulin/IGF1 Signaling Extends Life Span by Promoting Mitochondrial L-Proline Catabolism to Induce a Transient ROS Signal. Cell Metab (2012) 15:451–65. doi: 10.1016/j.cmet.2012.02.013
28. Schroeder EA, Shadel GS. Alternative Mitochondrial Fuel Extends Life Span. Cell Metab (2012) 15:417–8. doi: 10.1016/j.cmet.2012.03.011
29. Bannister AJ, Kouzarides T. Regulation of Chromatin by Histone Modifications. Cell Res (2011) 21:381–95. doi: 10.1038/cr.2011.22
30. Aguilar V, Racotta IS, Goytortúa E, Wille M, Sorgeloos P, Civera R, et al. The Influence of Dietary Arachidonic Acid on the Immune Response and Performance of Pacific Whiteleg Shrimp, Litopenaeus Vannamei, at High Stocking Density. Aquacult Nutr (2012) 18:258–71. doi: 10.1111/j.1365-2095.2011.00892.x
31. Ding Z, Zhou J, Kong Y, Zhang Y, Cao F, Luo N, et al. Dietary Arachidonic Acid Promotes Growth, Improves Immunity, and Regulates the Expression of Immune-Related Signaling Molecules in Macrobrachium Nipponense (De Haan). Aquaculture (2018) 484:112–9. doi: 10.1016/j.aquaculture.2017.11.010
32. Li C, Yang MC, Hong PP, Zhao XF, Wang JX, et al. Metabolomic Profiles in the Intestine of Shrimp Infected by White Spot Syndrome Virus and Antiviral Function of the Metabolite Linoleic Acid in Shrimp. J Immunol (2021) 206:2075–87. doi: 10.4049/jimmunol.2001318
33. Tretter L, Patocs A, Chinopoulos C. Succinate, an Intermediate in Metabolism, Signal Transduction, ROS, Hypoxia, and Tumorigenesis. BBA-Bioenergetics (2016) 1857:1086–101. doi: 10.1016/j.bbabio.2016.03.012
34. Kalafati L, Kourtzelis I, Schulte-Schrepping J, Li X, Hatzioannou A, Grinenko T, et al. Innate Immune Training of Granulopoiesis Promotes Anti-Tumor Activity. Cell (2020) 183:771–85. doi: 10.1016/j.cell.2020.09.058
35. Codo AC, Davanzo GG, Monteiro LB, de Souza GF, Muraro SP, Virgilio-da-Silva JV, et al. Elevated Glucose Levels Favor SARS-CoV-2 Infection and Monocyte Response through a HIF-1α/Glycolysis-Dependent Axis. Cell Metab (2020) 32:437–47. doi: 10.1016/j.cmet.2020.07.007
36. Chen IT, Aoki T, Huang YT, Hirono I, Chen TC, Huang JY, et al. White Spot Syndrome Virus Induces Metabolic Changes Resembling the Warburg Effect in Shrimp Hemocytes in the Early Stage of Infection. J Virol (2011) 85:12919–28. doi: 10.1128/JVI.05385-11
37. Hernández-Palomares MLE, Godoy-Lugo JA, Gómez-Jiménez S, Gámez-Alejo LA, Ortiz RM, Muñoz-Valle JF, et al. Regulation of Lactate Dehydrogenase in Response to WSSV Infection in the Shrimp Litopenaeus Vannamei. Fish Shellfish Immunol (2018) 74:401–9. doi: 10.1016/j.fsi.2018.01.011
38. Bekkering S, Stiekema LCA, Bernelot Moens S, Verweij SL, Novakovic B, Prange K, et al. Treatment With Statins Does Not Revert Trained Immunity in Patients With Familial Hypercholesterolemia. Cell Metab (2019) 30:1–2. doi: 10.1016/j.cmet.2019.05.014
39. Wang XW, Xu YH, Xu JD, Zhao XF, Wang JX. Collaboration Between a Soluble C-Type Lectin and Calreticulin Facilitates White Spot Syndrome Virus Infection in Shrimp. J Immunol (2014) 193:2106–17. doi: 10.4049/jimmunol.1400552
40. Dhondge SS, Shende PH, Paliwal LJ, Deshmukh DW, et al. Volumetric and Acoustic Study of Aqueous Binary Mixtures of Quinine Hydrochloride, Guanidine Hydrochloride and Quinic Acid at Different Temperatures. J Chem Thermodyn (2015) 81:34–43. doi: 10.1016/j.jct.2014.09.011
41. Pinta MN, Naranjo Pinta M, Montoliu I, Aura AM, Seppänen-Laakso T, Barron D, et al. In Vitro Gut Metabolism of [U-13c]-Quinic Acid, The Other Hydrolysis Product of Chlorogenic Acid. Mol Nutr Food Res (2018) 62:e1800396. doi: 10.1002/mnfr.201800396
42. Pereira A, dos SantosPereira A, de MirandaPereira AF, Trugo LC, de AquinoNeto FR. Distribution of Quinic Acid Derivatives and Other Phenolic Compounds in Brazilian Propolis. Z Naturforsch C J Biosci (2003) 58:590–3. doi: 10.1515/znc-2003-7-824
43. Kamng’ona A, Moore JP, Lindsey G, Brandt W. Inhibition of HIV-1 and M-MLV Reverse Transcriptases by a Major Polyphenol (3,4,5 Tri-O-Galloylquinic Acid) Present in the Leaves of the South African Resurrection Plant, Myrothamnus Flabellifolia. J Enzyme Inhib Med Chem (2011) 26:843–53. doi: 10.3109/14756366.2011.566220
44. Zanello PR, Koishi AC, Rezende JúniorCde O, Oliveira LA, Pereira AA, de Almeida MV, et al. Quinic Acid Derivatives Inhibit Dengue Virus Replication In Vitro. Virol J (2015) 12:1–13. doi: 10.1186/s12985-015-0443-9
45. Wang XW, Xu JD, Zhao XF, Vasta GR, Wang JX. A Shrimp C-Type Lectin Inhibits Proliferation of the Hemolymph Microbiota by Maintaining the Expression of Antimicrobial Peptides. J Biol Chem (2014) 289:11779–90. doi: 10.1074/jbc.M114.552307
46. Wang XW, Wang JX. Crustacean Hemolymph Microbiota: Endemic, Tightly Controlled, and Utilization Expectable. Mol Immunol (2015) 68:404–11. doi: 10.1016/j.molimm.2015.06.018
47. Tao S, Tian P, Luo Y, Tian J, Hua C, Geng Y, et al. Microbiome-Metabolome Responses to a High-Grain Diet Associated With the Hind-Gut Health of Goats. Front Microbiol (2017) 8:1764. doi: 10.3389/fmicb.2017.01764
48. Das Q, Islam MR, Lepp D, Tang J, Yin X, Mats L, et al. Gut Microbiota, Blood Metabolites, and Spleen Immunity in Broiler Chickens Fed Berry Pomaces and Phenolic-Enriched Extractives. Front Vet Sci (2020) 7:150. doi: 10.3389/fvets.2020.00150
49. Kongnum K, Hongpattarakere T. Effect of Lactobacillus Plantarum Isolated From Digestive Tract of Wild Shrimp on Growth and Survival of White Shrimp (Litopenaeus Vannamei) Challenged With Vibrio Harveyi. Fish Shellfish Immunol (2012) 32:170–7. doi: 10.1016/j.fsi.2011.11.008
50. Naiel M, Farag MR, Gewida AGA, Elnakeeb MA, Alagawany M. Using Lactic Acid Bacteria as an Immunostimulants in Cultured Shrimp With Special Reference to Lactobacillus Spp. Aquacult Int (2021) 29:219–31. doi: 10.1007/s10499-020-00620-2
51. Wang S, Zhao XF, Wang JX. Molecular Cloning and Characterization of the Translationally Controlled Tumor Protein From Fenneropenaeus Chinensis. Mol Biol Rep (2009) 36:1683–93. doi: 10.1007/s11033-008-9369-2
52. Want EJ, Masson P, Michopoulos F, Wilson ID, Theodoridis G, Plumb RS, et al. Global Metabolic Profiling of Animal and Human Tissues via UPLC-MS. Nat Protoc (2013) 8:17–32. doi: 10.1038/nprot.2012.135
53. Sangster T, Major H, Plumb R, Wilson AJ, Wilson ID. A Pragmatic and Readily Implemented Quality Control Strategy for HPLC-MS and GC-MS-Based Metabonomic Analysis. Analyst (2006) 131:1075–8. doi: 10.1039/b604498k
54. Wilson ID, Gika H, Theodoridis G, Plumb RS, Shockcor J, Holmes E, et al. Global Metabolic Profiling Procedures for Urine Using UPLC-MS. Nat Protoc (2010) 5:1005–18. doi: 10.1038/nprot.2010.50
55. Dunn WB, Broadhurst D, Begley P, Zelena E, Francis-McIntyre S, Anderson N, et al. Procedures for Large-Scale Metabolic Profiling of Serum and Plasma Using Gas Chromatography and Liquid Chromatography Coupled to Mass Spectrometry. Nat Protoc (2011) 6:1060–83. doi: 10.1038/nprot.2011.335
56. Thévenot EA, Roux A, Xu Y, Ezan E, Junot C. Analysis of the Human Adult Urinary Metabolome Variations With Age, Body Mass Index, and Gender by Implementing a Comprehensive Workflow for Univariate and OPLS Statistical Analyses. J Proteome Res (2015) 14:3322–35. doi: 10.1021/acs.jproteome.5b00354
57. Trygg J, Wold S. Orthogonal Projections to Latent Structures (O-PLS). J Chemometr (2002) 16:119–28. doi: 10.1002/cem.695
Keywords: trained immunity, shrimp, WSSV, GC–MS/MS, metabolites
Citation: Zang S, Lv L-X, Liu C-F, Zhang P, Li C and Wang J-X (2022) Metabolomic Investigation of Ultraviolet Ray-Inactivated White Spot Syndrome Virus-Induced Trained Immunity in Marsupenaeus japonicus. Front. Immunol. 13:885782. doi: 10.3389/fimmu.2022.885782
Received: 28 February 2022; Accepted: 29 April 2022;
Published: 26 May 2022.
Edited by:
Chu-Fang Lo, National Cheng Kung University, TaiwanReviewed by:
Kallaya Sritunyalucksana-Dangtip, National Science and Technology Development Agency (NSTDA), ThailandKunlaya Somboonwiwat, Chulalongkorn University, Thailand
Copyright © 2022 Zang, Lv, Liu, Zhang, Li and Wang. This is an open-access article distributed under the terms of the Creative Commons Attribution License (CC BY). The use, distribution or reproduction in other forums is permitted, provided the original author(s) and the copyright owner(s) are credited and that the original publication in this journal is cited, in accordance with accepted academic practice. No use, distribution or reproduction is permitted which does not comply with these terms.
*Correspondence: Jin-Xing Wang, anh3YW5nQHNkdS5lZHUuY24=