 Yuqin Tang
 Chengbin Guo
 Zhao Yang
 Yumei Wang
 Yongqiang Zhang
 Dong Wang
- 1State Key Laboratory of Southwestern Chinese Medicine Resources, School of Basic Medical Sciences, Chengdu University of Traditional Chinese Medicine, Chengdu, China
- 2Faculty of Medicine, Macau University of Science and Technology, Macau, China
- 3West China School of Medicine, West China Hospital, Sichuan University, Chengdu, China
- 4Guangzhou Women and Children’s Medical Center, Guangzhou Medical University, Guangzhou, China
Hepatocellular carcinoma (HCC) is the predominant subtype of primary liver cancer and represents a highly heterogeneous disease, making it hard to predict the prognosis and therapy efficacy. Here, we established a novel tumor immunological phenotype-related gene index (TIPRGPI) consisting of 11 genes by Univariate Cox regression and the least absolute shrinkage and selection operator (LASSO) algorithm to predict HCC prognosis and immunotherapy response. TIPRGPI was validated in multiple datasets and exhibited outstanding performance in predicting the overall survival of HCC. Multivariate analysis verified it as an independent predictor and a TIPRGPI-integrated nomogram was constructed to provide a quantitative tool for clinical practice. Distinct mutation profiles, hallmark pathways, and infiltration of immune cells in tumor microenvironment were shown between the TIPRGPI high and low-risk groups. Notably, significant differences in tumor immunogenicity and tumor immune dysfunction and exclusion (TIDE) were observed between the two risk groups, suggesting a better response to immune checkpoint blockade (ICB) therapy of the low-risk group. Besides, six potential drugs binding to the core target of the TIPRGPI signature were predicted via molecular docking. Taken together, our study shows that the proposed TIPRGPI was a reliable signature to predict the risk classification, immunotherapy response, and drugs candidate with potential application in the clinical decision and treatment of HCC. The novel “TIP genes”-guided strategy for predicting the survival and immunotherapy efficacy, we reported here, might be also applied to more cancers other than HCC.
Introduction
Liver cancer is one of the deadliest malignancies in the world and hepatocellular carcinoma (HCC) is the dominant type, accounting for ~75% of all cases (1). In the past decade, despite the great progress of surveillance, diagnosis and management in HCC, the mortality rate of HCC remains unacceptably high (2, 3). Due to the poor prognosis, the incidence and mortality rates of HCC are roughly equivalent (4). In 2018, the incidence rate per 100,000 in Eastern Asia was 17.7, whereas the corresponding mortality rate was 16.0 (5). The high prevalence and poor survival of HCC largely result from the heterogeneity of pathogenic factors, treatment responses, and molecular profiles. For instance, multiple factors, including chronic infections of Hepatitis B virus (HBV) or Hepatitis C virus (HCV), alcohol consumption, metabolic syndrome are strong causes for the incidence of HCC (2, 6, 7). While the HBV vaccine has been introduced by a number of countries to eliminate HBV-related HCC, there is still no vaccine available for HCV-related HCC and nonviral HCC (4). The presently used clinical characteristics including the tumor-node-metastasis (TNM) staging system, vascular invasion, and tumor burden status are limited in predicting the prognosis and treatment sensitivities for HCC (8, 9). Thus, novel prognostic classifiers or therapeutic biomarkers are urgently needed to improve the clinical benefits of HCC patients.
Tumor immune microenvironment (TIME) is proven to play a vital role in tumorigenesis and development (10). Immunotherapy with immune checkpoint inhibitors (ICIs), reversing the inactivation of immune cells to eliminate tumor cells, has emerged as a promising therapy for a variety of cancers in recent years (11). Multiple ICIs were approved for cancer therapy such as nivolumab, pembrolizumab, and cemiplimab targeting programmed death-1 (PD-1) and ipilimumab targeting cytotoxic T-lymphocyte-associated protein 4 (CTLA-4) (12). More agents targeting novel immune checkpoints such as T cell immunoglobulin and mucin-domain containing-3 (TIM-3), lymphocyte activation gene-3 (LAG-3), and T cell immunoglobulin and ITIM domain (TIGIT) are under investigation to expand the scope of immunotherapy (13–15). Adequate evidences suggested that chronic inflammation was a major risk factor for the development of HCC and immunotherapy might be the ideal approach to improve the prognosis of HCC (16, 17). The composition of tumor microenvironment (TME) of HCC is complex, in which a number of immune and stromal cells interact to form an immunosuppressive microenvironment and eventually lead to a worse prognosis of HCC (11). Hopefully, checkpoint-based therapy was effective and beneficial against advanced HCC clinically (18, 19). However, owing to the low sensitivity and unexpected resistance to ICIs, more useful and reliable biomarkers should be identified to improve the accuracy of predicting the prognosis and immunotherapy efficiency in HCC (20). How to choose available and suitable targets for personalized therapy is still a tricky question to be answered for HCC patients.
TME is a highly heterogeneous ecosystem involving different types of stromal cells, vascular cells, and immune cells perturbed by therapy, which are recognized as the potential determinants of treatment response in cancer (21, 22). Tumor immunological phenotype (TIP) is an emerging concept to evaluate the immunological heterogeneity depending on the relative infiltration of immune cells (23), and tumors are generally classified into two TIPs: “hot” (inflamed) and “cold” (non-inflamed) (23). Particular genes and pathways genetically regulate the immunological phenotypes have been identified to aid immunotherapy (24–27). Wang et al. recently reported 12 hot tumor-related genes and three cold tumor-related genes to constitute the TIP gene signature using a text-mining approach (26), which is significantly associated with the survival outcomes of cancer patients and shows superior performance in predicting immunotherapeutic responses than widely used immune signatures such as tumor mutation burden (TMB), and tumor immune dysfunction and exclusion (TIDE). Thus, these “TIP genes” hold great promise in clinical application especially for postoperative risk stratification and the discovery of immunotherapeutic predictors.
Accumulating immune-based signatures have been established to predict HCC patients’ outcomes. However, the predictive accuracies of most signatures are still insufficient for clinical practice and a more reliable and accurate signature predicting the survival as well as the immunotherapy response of HCC patients is urgently needed (28, 29). In this study, a “TIP genes”-guided strategy was employed with several statistical algorithms to construct TIP-related gene prognostic index (TIPRGPI), a novel HCC signature, followed by comprehensive validation to predict the prognosis and immunotherapy efficiency for HCC patients. Besides, it is estimated that the low-risk group might respond better to immunotherapies than those in the high-risk group. Furthermore, we identified six potential drugs binding well to the core target of TIPRGPI with molecular docking. The workflow for this study is shown in Figure 1.

Figure 1 Flowchart of this study.
Materials and Methods
Data Source
We carefully reviewed the mRNA expression datasets deposited in the Cancer Genome Atlas (TCGA), International Cancer Genome Consortium (ICGC), and Gene Expression Omnibus (GEO), database and enrolled the patients with complete annotation of overall survival (OS).Those patients with an overall survival time of <30 days were excluded due to other possible causes of mortality (29). Subsequently, the RNA-seq gene expression data of 336 HCC patients was derived from the TCGA database (https://portal.gdc.cancer.gov/) (TCGA-LIHC). The corresponding clinical information and survival outcomes including overall survival, progression-free survival (PFS), disease-specific survival (DSS) and disease-free survival (DFS) were also collected. Another RNA-seq expression profiling dataset (ICGC-LIRI-JP) containing 238 patients with survival information was obtained from the ICGC database (https://dcc.icgc.org). In addition, we acquired a transcriptomic microarray dataset (GSE14520) including a total of 221 HCC patients (30, 31) from the GEO database (https://www.ncbi.nlm.nih.gov/geo/). The summary of the demographic information was listed in Supplementary Table 1. For the TCGA-LIHC dataset, the Fragments per Kilobase Million (FPKM) value was used to generate the Transcripts per Kilobase Million (TPM) and further subjected to log2 transformation for normalization. For the ICGC-LIRI-JP and GSE14520 datasets, data were preprocessed as previously reported (32, 33). The ESTIMATE algorithm was utilized to calculate the immune score, stromal score, estimate score, and tumor purity for all the patients in the TCGA-LIHC dataset (34, 35).
Somatic mutation information of TCGA-LIHC was gathered from the TCGA data portal (http://tcga-data.nci.nih.gov/tcga/) as the mutation annotation format (MAF) format by the R package “maftools” (36). The CNV profile contained in the “Masked Copy Number Segment” data type was downloaded from TCGA.
Correlations of TIP Score With Prognosis and TME of HCC
TIP score was calculated as previously reported (26) with some modifications. Briefly, the gene expression matrix of three predefined cold tumor-related genes (CXCL1, CXCL2, and CCL20) and 12 predefined hot tumor-related genes (CXCR3, CXCR4, CXCL9, CXCL10, CXCL11, CCL5, CD3, CD4, CD8a, CD8b, CD274, and PDCD1) was extracted, followed by the generation of expression z scores. TIP score was computed by a summary score of RNA-seq z scores for the tumor immunological phenotype genes. To evaluate the prognostic value of the TIP score, all patients with available survival information for OS, DFS, PFS, and DSS were divided into the high- and low-score group by the optimal cutoff of TIP scores, respectively (34), followed by the Kaplan-Meier analysis with a log-rank test. To examine the relationship between TIP score and TME, we carried out the Spearman correlation analysis between TIP score and the ESTIMATE derived scores including immune score, stromal score, estimate score, and tumor purity. And we also checked the correlations of the TIP score and the fractions of the activated CD4 and the activated CD8, as well as two immune checkpoint molecules (PD1 and CTLA-4).
Weighted Gene Co-Expression Network Analysis (WGCNA) and TIPRGPI Establishment
WGCNA was performed on the expression data of TCGA-LIHC using the “WGCNA” R package (37). Generally, all genes were sorted by the median absolute deviation (MAD), and the top 5,000 genes were used for sample clustering, followed by the removal of outlier samples. Then, the optimal soft threshold power was specified to generate a scale-free network. Next, the topological overlap matrix (TOM)-based dissimilarity (dissTOM) was computed and further used to perform the gene dendrogram and module recognition with the minClusterSize of 30. Similar dynamic modules were merged by the cutline of 0.2. Pearson correlation coefficients (PCC) and corresponding P values between module eigengenes and clinicopathological parameters were subsequently calculated and visualized by a heatmap. The most significant module that correlated with the TIP score was identified and used for further analysis.
Gene Ontology (GO) enrichment and Kyoto Encyclopedia of Genes and Genomes (KEGG) pathway analysis were completed for the most significant module by the “clusterProfiler” R package (38) with the cutoff of p.adjust <0.05.
To establish a scoring system regarding TIP score, we first adopted the Univariate Cox (UniCox) hazard regression to screen the candidate genes from the most significant module. Next, the popular least absolute shrinkage and selection operator (LASSO) algorithm was applied for the best subset of prognostic genes using the “glmnet” R package (39). For the purpose of minimization of the overfitting risk, we conducted LASSO 200 times and chose the robust genes that appeared in the model more than 160 times. A linear equation called “TIPRGPI” was then established to predict the overall survival of HCC patients: Risk score = Σ(coef (β)*EXPβ), where β represents each selected gene.
Survival Analysis
The TIPRGPI score was calculated for each patient of the TCGA-LIHC training set, the ICGC-LIRI-JP validation set, and the GSE14520 validation set. For each dataset, patients were separated into the high- and low-risk groups by the median value of the training set, which is crucial for clinical practice. Kaplan-Meier survival curves were depicted to compare the difference of distinct risk groups with a log-rank test, and time-dependent receiver operating characteristic (tROC) curves were drawn to assess the predictive power. Moreover, stratified analysis was performed to further validate the additional prognostic value of the TIPRGPI model, and univariate and multivariate analyses were used to determine the independent prognostic indicators for HCC. Additionally, we also compared the 3- and 5-year ROC values of the TIPRGPI and popular biomarkers for immunotherapy and other published gene signatures of HCC, including a TP53-related transcriptomic signature by Long et al. (“Long signature”) (40), a metabolic gene signature by Huo et al. (“Huo signature”) (27), a ferroptosis-related gene signature (“Liang signature”) (41), an immune-related prognostic signature (“Wang signature”) (42), and a hypoxia-related risk signature by Zeng et al. (“Zeng signature”) (43).
Construction of a Predictive Nomogram
A TIPRGPI-integrated nomogram was constructed to quantitatively evaluate the prognostic risk based on the result of univariate analysis. Calibration curves for the 3- and 5-year were drawn to examine the predictive capability of the nomogram. The 1-, 3-, and 5-year DCA plots were utilized to measure the net benefits of the nomogram and TNM stage, as well as tumor burden. Moreover, Kaplan-Meier analysis was further used for OS, DFS, PFS, and DSS on the TCGA-LIHC set to validate the prognostic value of the nomogram.
Genomic Variation Analysis
To explore the somatic mutations regarding TIPRGPI, the “maftools” R package was used to depict the waterfall plots manifesting the mutation landscape for the high- and low-risk groups of HCC patients. TMB values reflecting total mutation numbers for each HCC patient were calculated with non-synonymous mutations using 38MB as the estimate of the exome size (44, 45). Somatic copy number alterations between the two different risk groups were investigated via the GISTIC2.0 algorithm. The correlations of expression values and CNV types for two oncogenic hub genes (NDC80 and RFC4) (32, 33) in HCC were accomplished by the Kruskal-Wallis test.
Gene Set Variation Analysis (GSVA) and Gene Set Enrichment Analysis (GSEA)
To determine the underlying hallmark pathways related to TIPRGPI, the R package “GSVA” was utilized to obtain the GSVA enrichment scores (46) of the 50 hallmark pathways (h.all.v7.1.symbols) deposited in the molecular signature database (47, 48) for each patient in the high- and low-risk groups of the TCGA-LIHC dataset, followed by the contrast of GSVA scores using a linear model as previously reported (49). Significant gene sets were defined by an adj.P.Val of < 0.01. GSEA for the same 50 hallmark gene sets was operated in the two risk groups with the recommended criteria of FDR<0.25 and NES>1. Venn diagram analysis was performed to identify the overlapping hallmark pathways by GSVA and GSEA, and Kaplan-Meier analysis was further used to verify the prognostic value of oncogenic hallmark pathways.
Exploration of Immune Infiltration
To investigate the relative infiltration of TME cells in the high- and low-risk groups of HCC, the ssGSEA algorithm was utilized for immune deconvolution analyses with the gene sets of 28 reported immune cell types (50) and two stromal components (fibroblasts and endothelial cells) (51) of TME. Differential infiltration analysis was conducted and visualized by a violin plot and the relationship of the TIPRGPI score and each type of the 30 TME cells was determined by the Spearman correlation analysis. Kaplan-Meier survival analysis was also performed to assess the prognostic values of these TME cells.
Estimation of Immunotherapeutic Response Prediction
According to previous publications, the correlations between TIPRGPI and potential immunotherapeutic markers including 50 ICB-related genes (52–54), IFN-gamma pathway markers (55), and m6A regulators (56, 57) were explored by Wilcoxon test. The Tumor Immune Dysfunction and Exclusion (TIDE) algorithm (58) (http://tide.dfci.harvard.edu/), was utilized to infer the clinical response to immunotherapy with the gene expression profile of TCGA-LIHC. Additionally, Immunophenoscore (IPS), which was designed to determine immunogenicity using the machine learning approach, was further obtained from The Cancer Immunome Atlas (TCIA) (https://tcia.at/home) (50). Higher IPS indicates a better response to immunotherapy.
Identification of the Core Target of TIPRGPI
To identify the core target of the TIPRGPI signature, all genes were uploaded to the online database of the Search Tool for the Retrieval of Interacting Genes (STRING) (version 11.0; http://string-db.org/) for the construction of the protein-protein interaction (PPI) network with default settings (Interaction score ≥0.4). Cytoscape (version 3.2.1; http://www.cytoscape.org) was used for visualization. Next, we calculated the topological parameters with the Network Analyzer plugin and obtained the degrees of all nodes in the network. The core target was recognized as the node with the highest degree.
Molecular Docking
For the screening of the putative small molecules stably binding to the core target, molecular docking was performed with Glide of Schrodinger. Firstly, we collected the 3D protein structures of totally 9800 small molecules as well as the core target from zinc15 database and PDB database (www.rcsb.org), respectively. Next, the protein preparation wizard tool was utilized to process the crystal structure. Subsequently, the ligand-binding pocket was predicted with the deepsite module (59) of Play Molecule (www.playmolecule.org), which was a knowledge-based approach using convolutional neural networks. Finally, the binding mode and interaction force of the core target and small molecules were evaluated to identify potential compounds.
Statistical Analysis
The correlations of TIP score and immune signatures were conducted using Spearman correlation by the “ggplot2” package. Kaplan-Meier analysis was performed using the “survival” package with a log-rank test. The correlations of the TIPRGPI group and other clinicopathological features were determined by the Pearson Chi-square test. Univariate and multivariate analyses were applied by the “survival” package to identify independent prognostic indicators. The optimal cutoff for survival analysis was generated by the R package “survminer”. All statistical analyses were completed by the R software (version 3.6.1). Unless specified otherwise, P < 0.05 was considered statistically significant.
Results
TIP Score Was Associated With the Prognosis and the Immune State of HCC
To determine whether TIP score was effective in HCC, we carried out a series of survival analyses, applying Kaplan-Meier (K-M) survival curves and log-rank tests to investigate the discrepancy between low- and high- TIP score groups. As expected, patients with HCC in the high TIP score group had a better prognosis (Figure 2A). Next, we confirmed the correlations between TIP score and the immune score, stromal score, estimate score, and tumor purity respectively. As shown in Figure 2B, TIP score was positively associated with immune score, stromal score, and estimate score, but negatively associated with tumor purity. Moreover, given that effective T cells such as activated CD4 and CD8 T cells play a pivotal role in the tumor microenvironment (60), we also calculated their correlations with TIP score, and we found they were both correlated with TIP score positively (Figure 2C). Besides, considering that PD-1 or CTLA-4 is the key immune checkpoint, we also verified they were positively correlated with TIP score (Figure 2C).
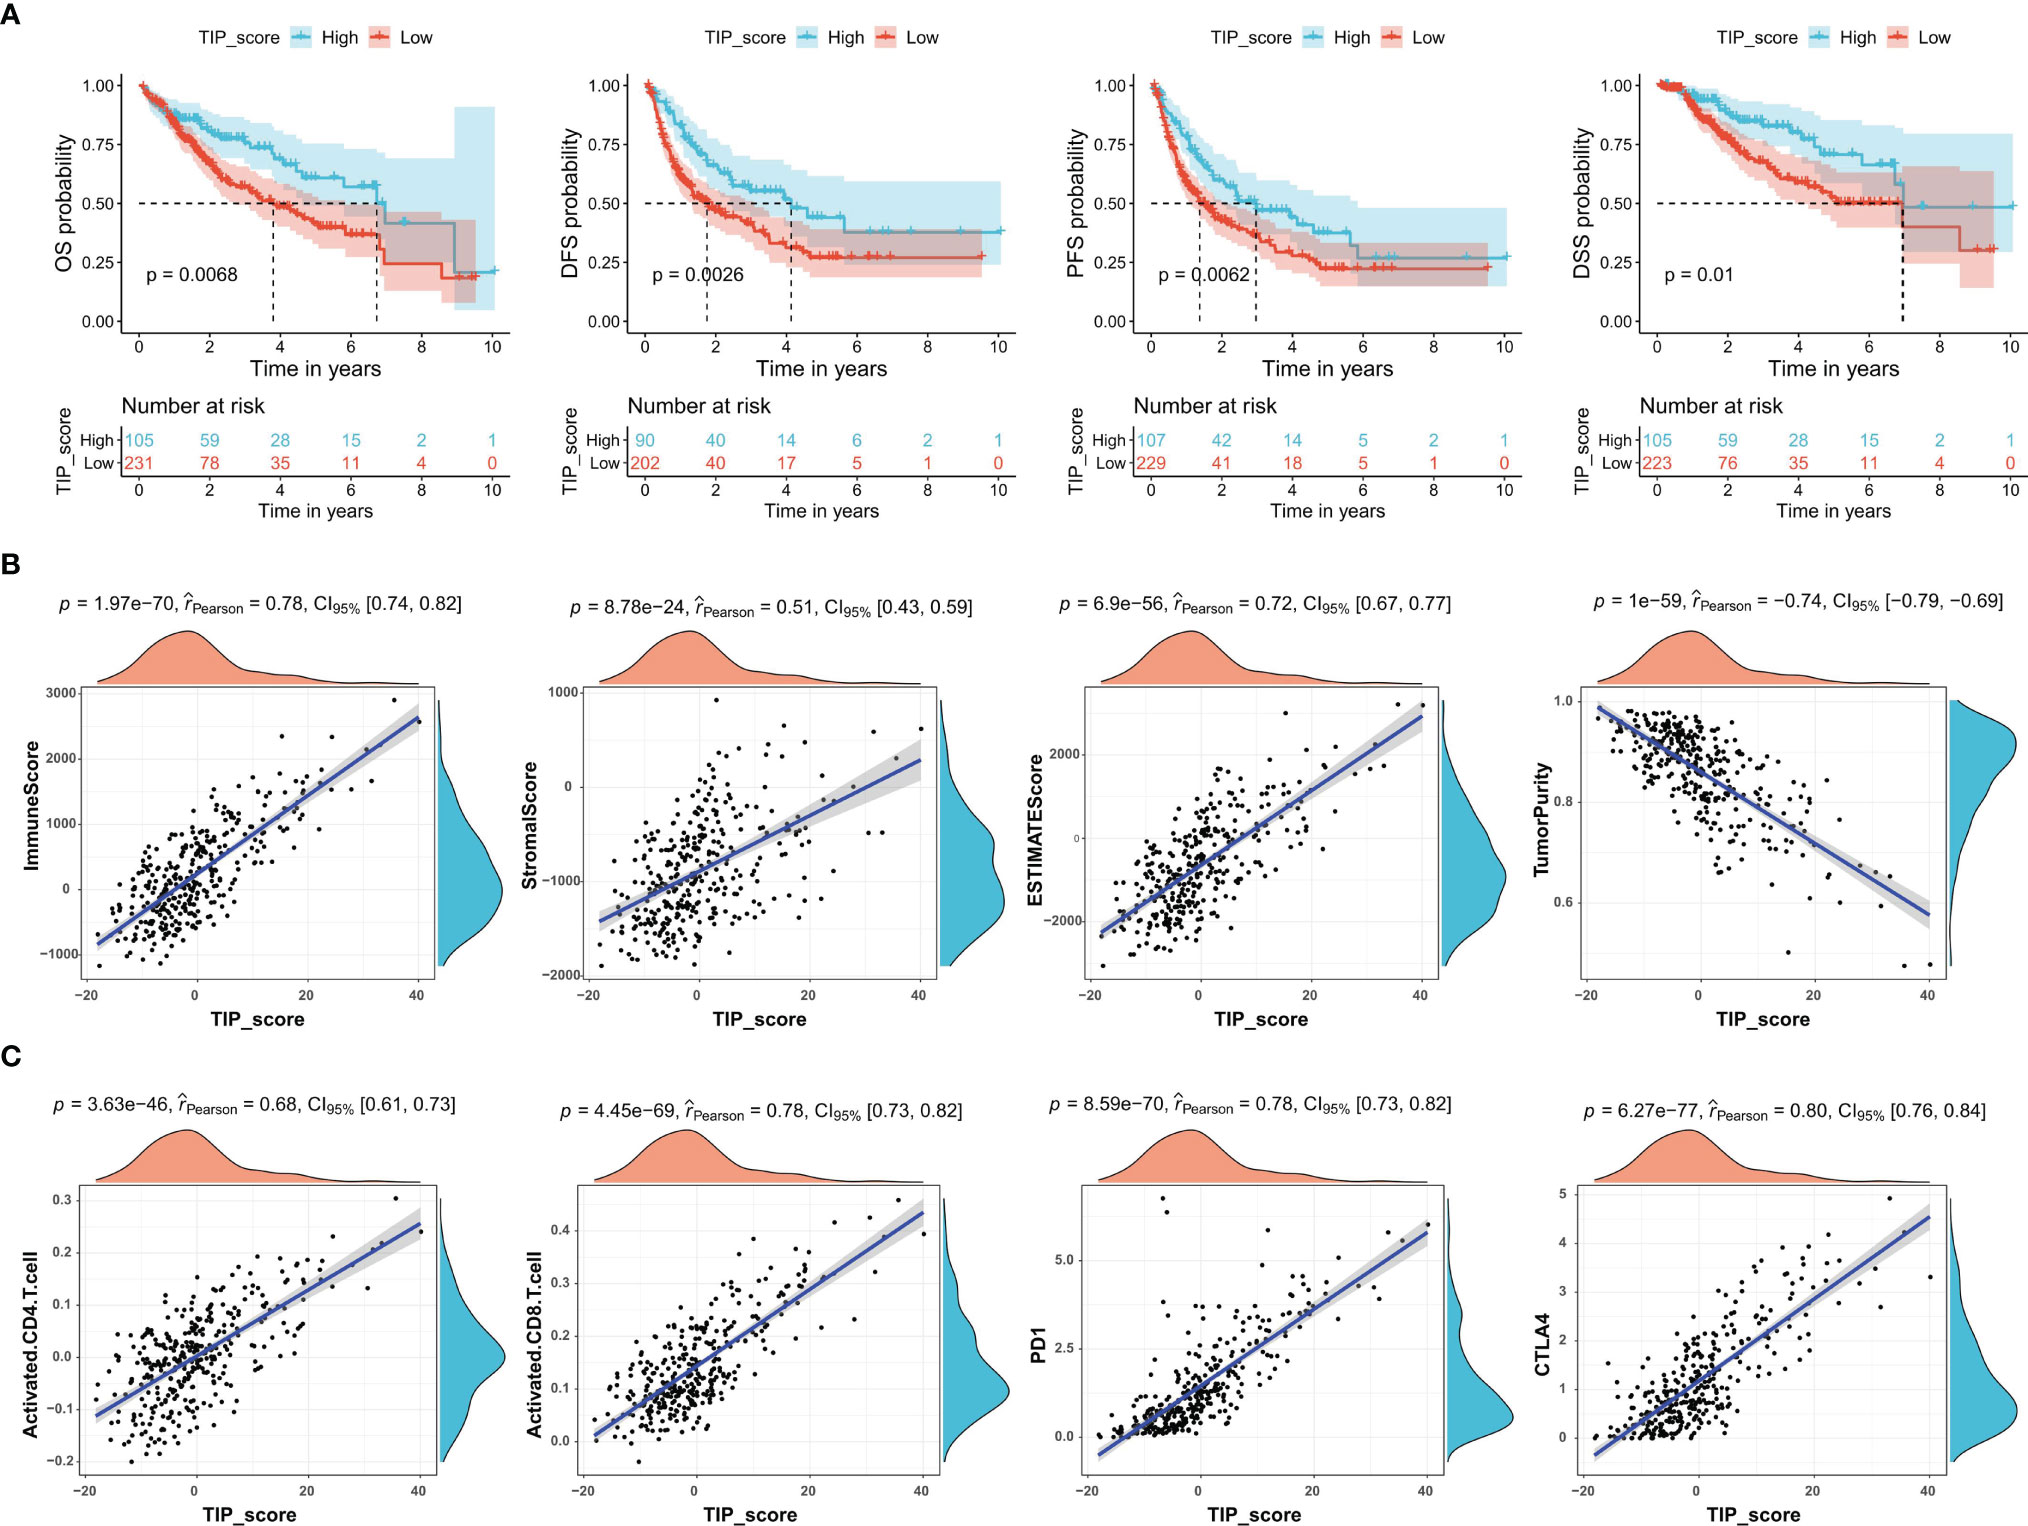
Figure 2 TIP score correlates with the prognosis and the immune state of HCC. (A) Kaplan–Meier survival plots of TIP score for OS, DFS, PFS, and DSS in TCGA-HCC cohort. (B) Correlations between TIP score and immune score, stromal score, estimate score, and tumor purity in HCC. (C) Correlations between TIP score and biomarkers of cancer immunotherapy including activated CD4/CD8 and PD-1/CTLA-4. TIP, tumor immunological phenotype. OS, overall survival; DFS, disease-free survival; PFS, progression-free survival; DSS, disease-specific survival.
Construction of TIPRGPI
In order to identify the gene module associated with TIP score, WGCNA was applied to the TCGA-LIHC RNA-seq dataset. The MAD top 5000 genes were extracted to construct a co-expression network. Four outlier samples were removed prior to network construction (Supplementary Figure 1A). The optimal soft-thresholding power of 10 (scale-free R2 = 0.86) was picked to ensure the scale-free topology (Supplementary Figure 1B). The established co-expression network showed that these 5000 genes were clustered into seven modules (Figure 3A) and the network heatmap plot of the clustering dendrogram among modules was shown (Supplementary Figure 1C). Then, we calculated the correlations of module eigengenes (ME) with multiple indicated variables by computing the Pearson correlation coefficient (PCC), and among which, we focused on the black module showing highly positive correlation with TIP score (PCC = 0.78, P = 3E-70) (Figure 3B). Also, we plotted a scatterplot of gene significance vs. module membership of the black module containing 432 genes (Figure 3C). GO enrichment analysis revealed that the most significant terms enriched by the black module were the biological process (BP) of T cell activation, cellular component (CC) of side of membrane, and molecular function (MF) of peptide antigen binding (Figure 3D). KEGG analysis suggested that they mostly participated in the pathway of cytokine-cytokine receptor interaction (Figure 3E). Subsequently, we inputted the genes of the black module into UniCox regression analysis and found 128 significant genes with P value lower than 0.05 (Supplementary Table 2). Next, we conducted LASSO Cox regression with the 128 genes and obtained 11 robust genes (KLRB1, GZMH, SLC16A3, IMPDH1, IL15RA, MSC, S100A9, ST6GALNAC4, DAB2, ADA, SLC1A5) that were significantly correlated with the OS of HCC patients from TCGA-HCC dataset. MultiCox was applied to analyze the 11 genes, which were subsequently incorporated into a TIPRGPI model for predicting the prognosis of HCC. Figures 3F, G showed the UniCox and MultiCox results of the selected 11 genes with the corresponding hazard ratio (HR) and statistical significance.
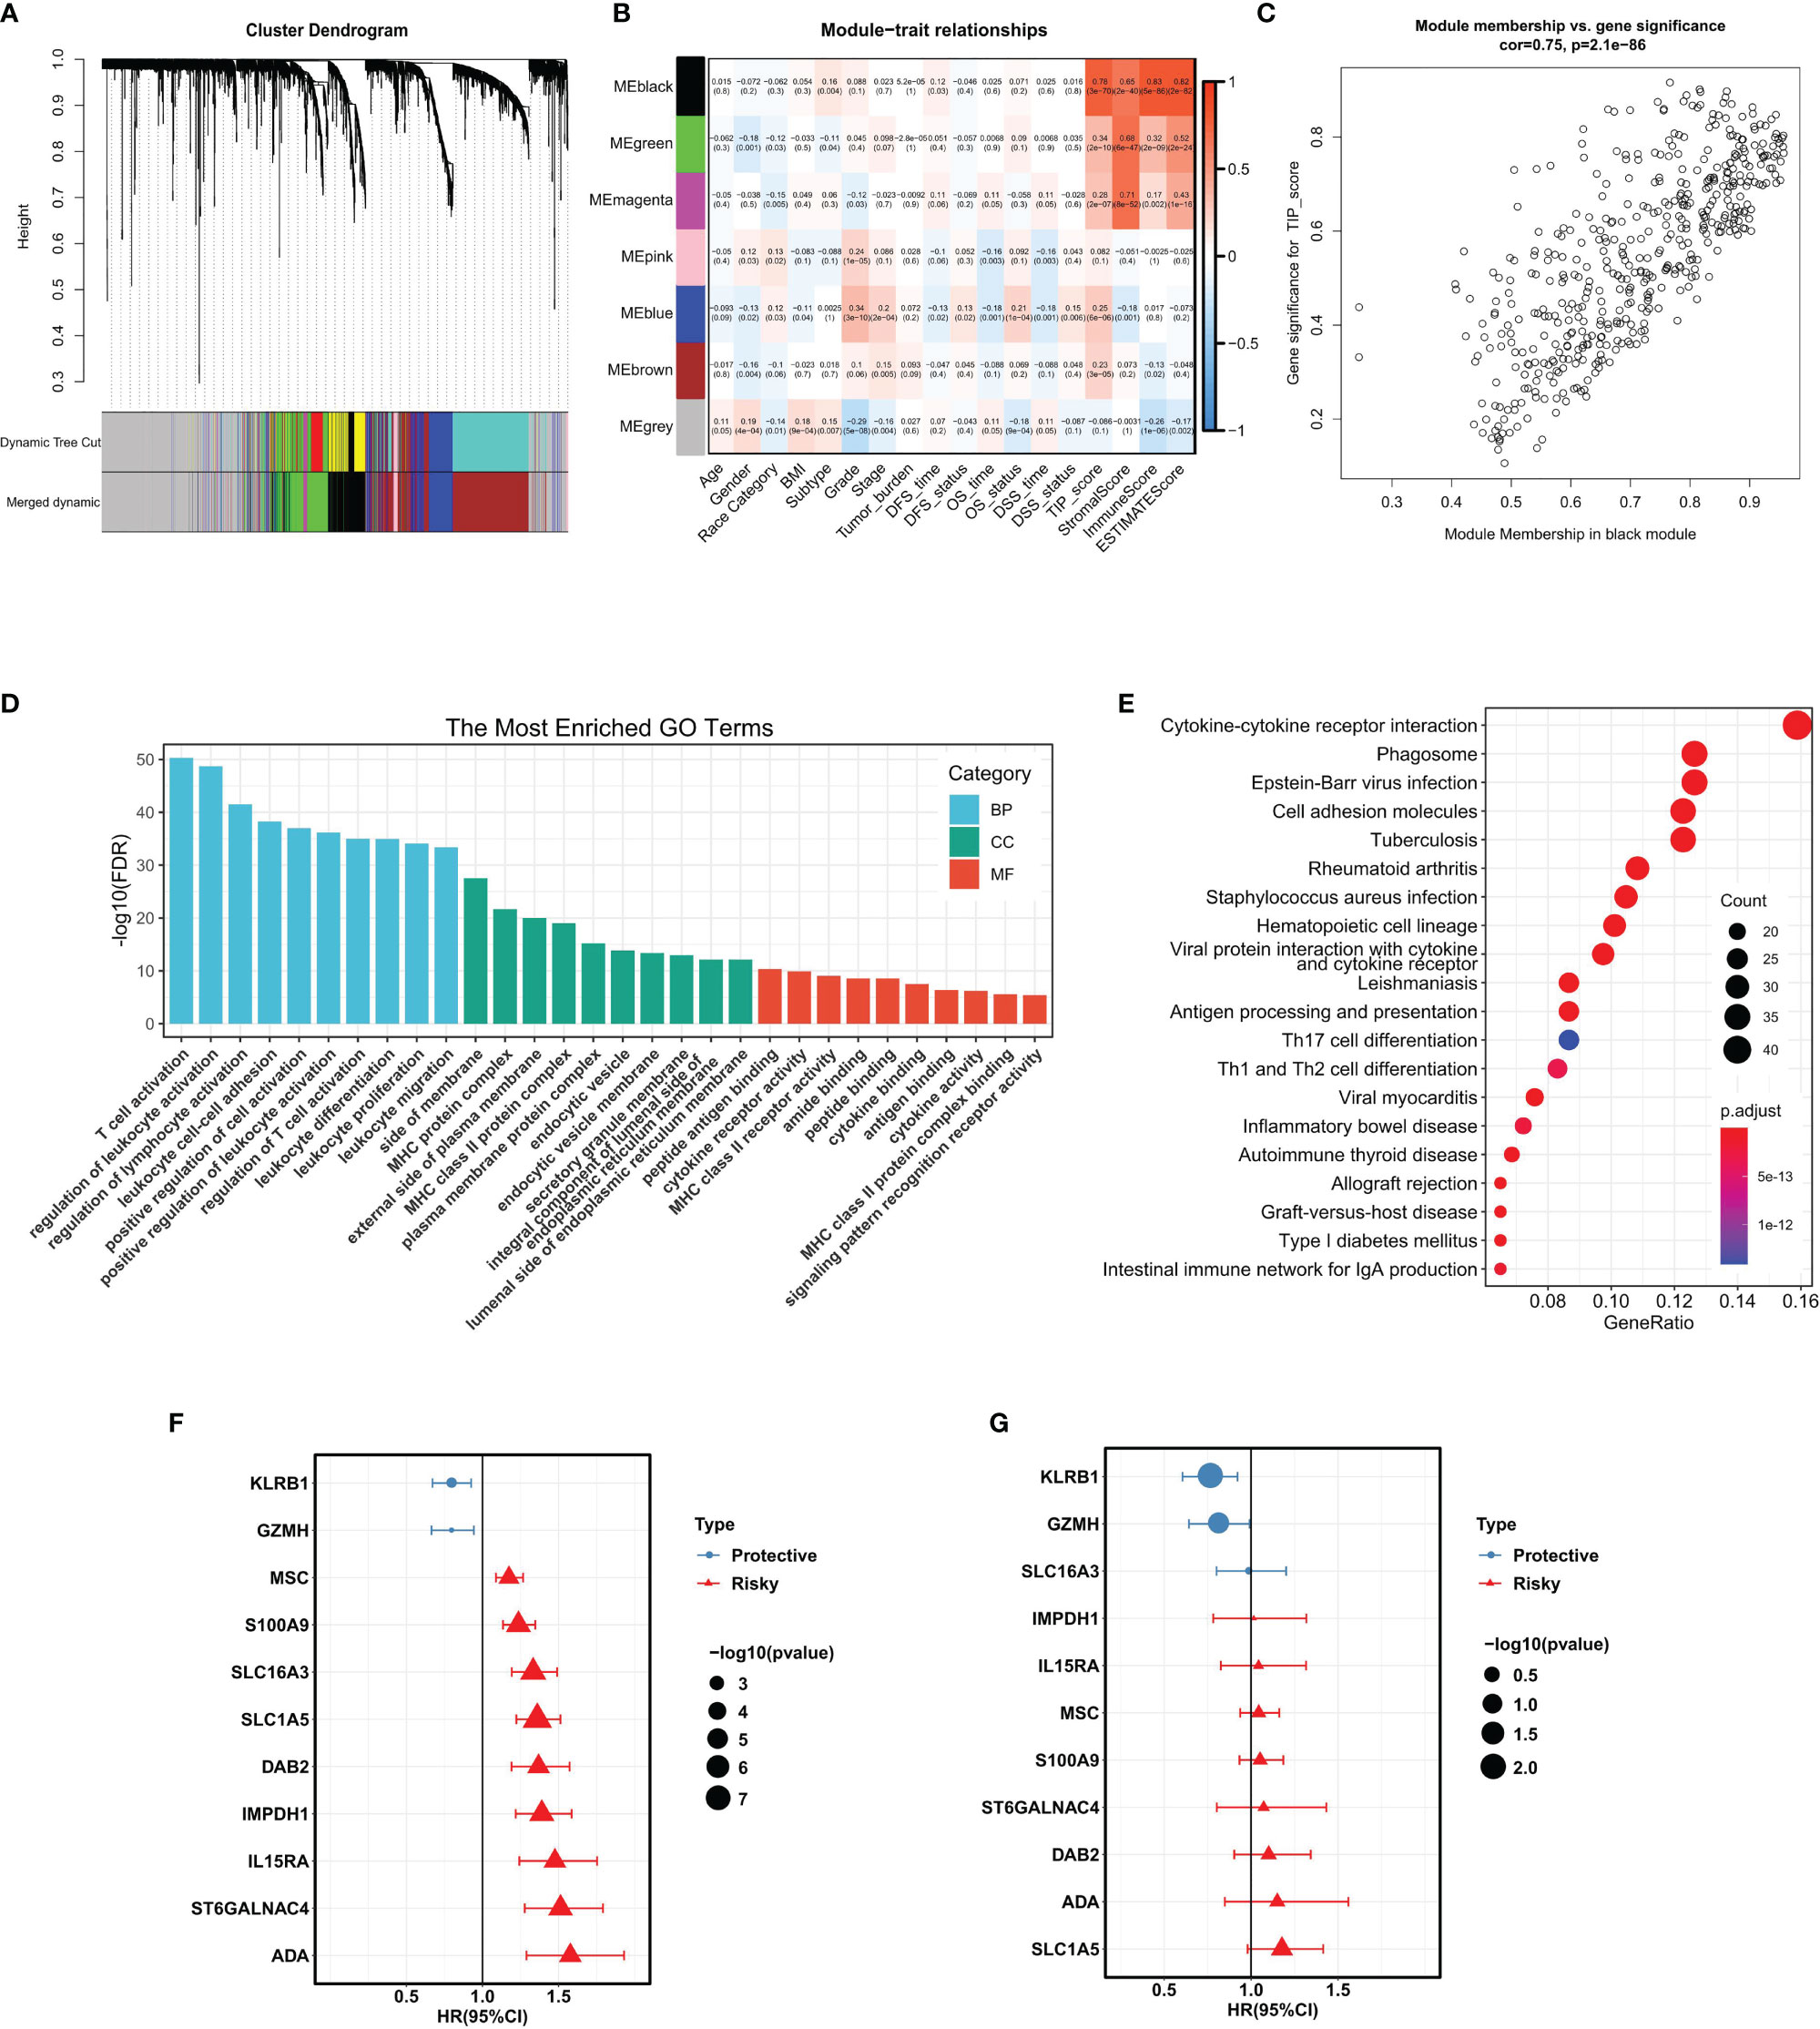
Figure 3 WGCNA analysis and the construction of TIPRGPI for HCC. (A) Cluster dendrogram of MAD top 5000 genes. (B) Table cells showing Pearson’s correlation coefficients and corresponding P-value between module eigengenes (ME) and the variables. (C) Scatter plot showing the relationship between gene significance (GS) for TIP score and module membership (MM) in the black module. (D, E) GO enrichment analysis (D) and KEGG (E) enrichment analysis for the black module genes. (F, G) Hazard ratio with 95%CI of each gene in the TIPRGPI signature computed by UniCox and MultiCox, respectively. GO, gene oncology; KEGG, Kyoto Encyclopedia of Genes and Genomes; WGCNA, weighted gene co-expression network analysis; MAD, median absolute deviation; TIPRGPI, TIP-related gene prognostic index.
Evaluation and Validation of the TIPRGPI Signature
After the construction of TIPRGPI, we proceeded with evaluation and validation analysis. First, we computed the risk score for individual patients using the expression and the risk coefficients of the 11 TIPRGPI genes in HCC datasets, and based on the median value derived from the training set, HCC patients from TCGA-LIHC (training dataset), GSE14520 (validation dataset 1) and ICGC-LIRI-JP (validation dataset 2) were separated into low- and high-risk groups, respectively (Figure 4A). As shown in Figure 4B, the low-risk group had a lower death rate than the high-risk group. Afterward, by Kaplan-Meier analysis, significant differences in the OS possibility were observed between the low- and high-risk groups in the training and validation datasets (Figure 4C). Further, the time-dependent receiver operating characteristic curve analysis was applied to evaluate the accuracy of the TIPRGPI signature. For the TCGA-HCC training dataset, the area under the ROC curve (AUC) was 0.836, 0.775, and 0.741 in 1-year, 3-year, and 5-year survival, respectively. Moreover, ROC curve analysis of GSE14520 and ICGC validation dataset exhibited that TIPRGPI had excellent predictive performance (GSE14520: AUC = 0.664 for 1-year, 0.708 for 3-years and 0.666 for 5-year survival; ICGC: AUC = 0.769 for 1-year, 0.637 for 3-years and 0.656 for 4-year survival) (Figure 4D). Compared with several other published signatures and popular biomarkers, TIPRGPI had the highest AUC for either 3-year or 5-year survival (Figure 4E). Besides, stratified analysis revealed an additional predictive value of TIPRGPI in subgroups divided by age, gender, BMI, race, stage, grade, and tumor burden (Supplementary Figure 2). Correlation analysis between TIPRGPI and multiple clinical traits revealed that the tumor grade and stage of HCC were significantly correlated with risk score (Figure 4F). These results indicated that TIPRGPI was a highly reliable signature.
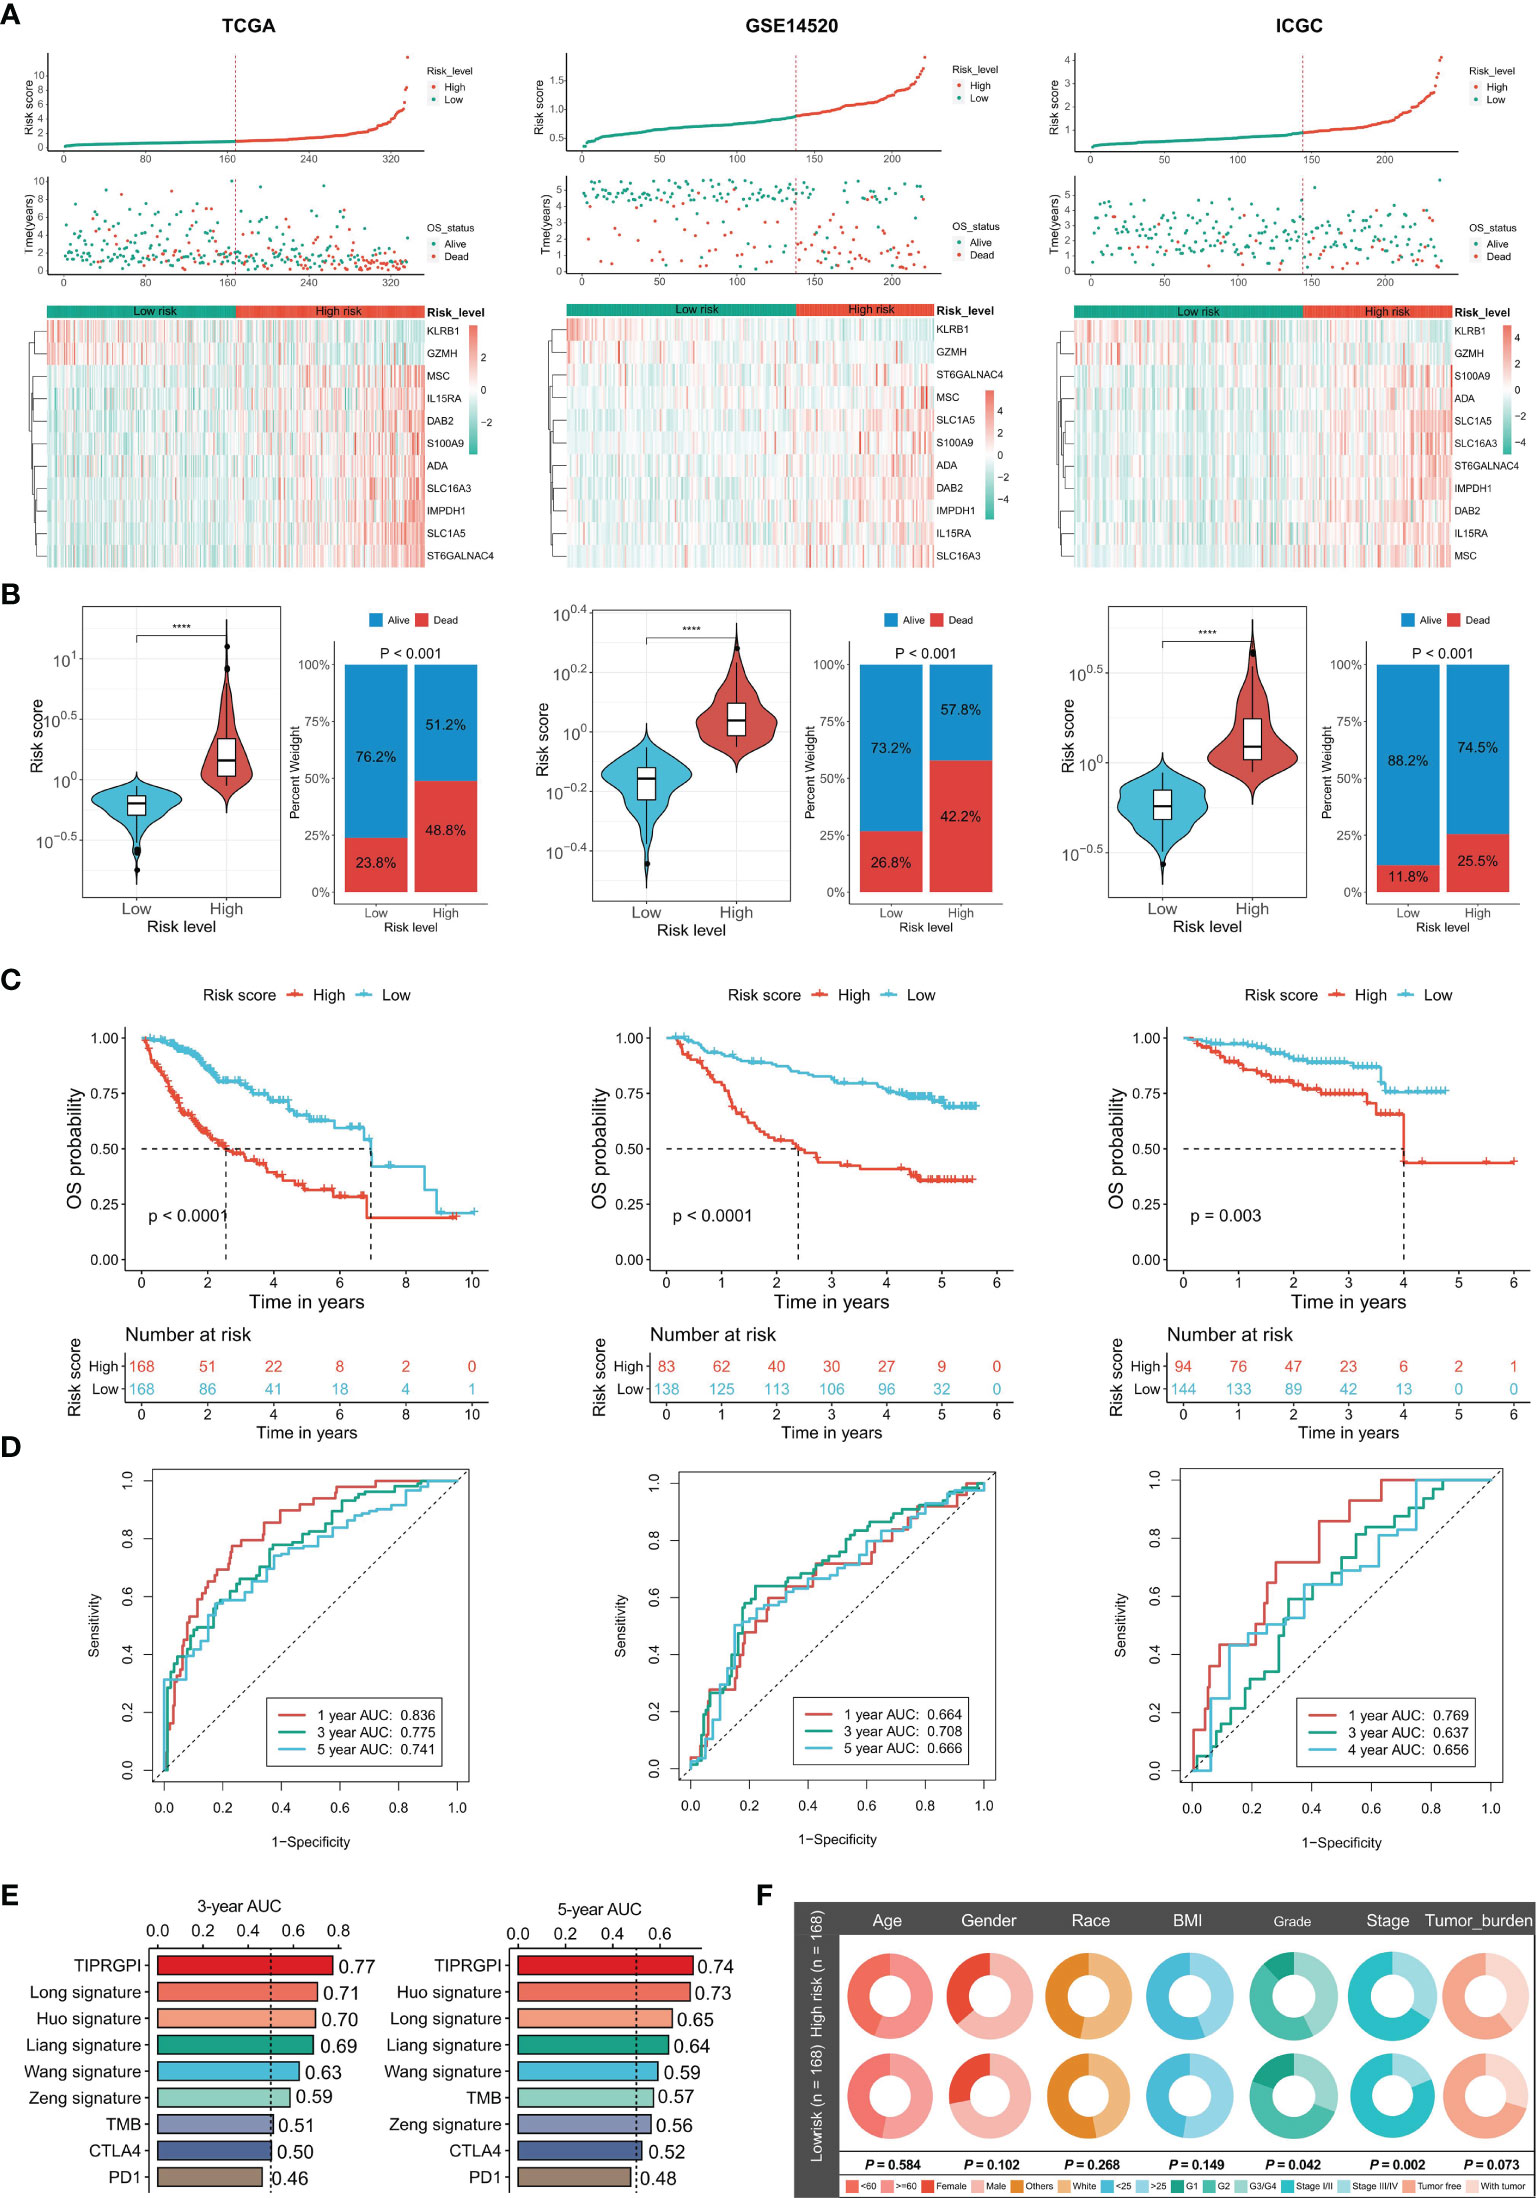
Figure 4 Validation of the TIPRGPI predicting model and performance analysis in HCC. (A) Risk score distribution, survival status, and the expression of 11 TIPRGPI genes for patients in low- and high-risk groups from TCGA training dataset and two validation datasets (GSE14520 and ICGC-LIRI-JP). (B) Risk score and mortality rate of patients in low- and high-risk groups from three datasets. (C) Kaplan-Meier survival curves showing the comparison of overall survival (OS) between the low- and high-risk groups from three datasets. (D) Time-dependent receiver operating characteristic (tROC) curves of three datasets. (E) The area under the ROC curve (AUC) in 3-year and 5-year survival for TIPRGPI and other published signatures and common immunotherapeutic biomarkers. (F) Correlation analysis between the TIPRGPI low-/high-risk groups and clinical traits ****P < 0.0001.
Establishment of the Prognostic Nomogram
To figure out whether the TIPRGPI predicting model was an independent prognostic indicator in HCC, univariate and multivariate analyses were performed. The HR of the TIPRGPI risk level was 3.049 (95%CI: 2.083-4.465) and 3.056 (95%CI: 1.976-4.725) in the univariate and multivariate analysis, respectively, and an elevated HR was observed compared with the pathologic stage (Figure 5A). Importantly, multivariate analysis demonstrated TIPRGPI was an independent prognostic factor in HCC.
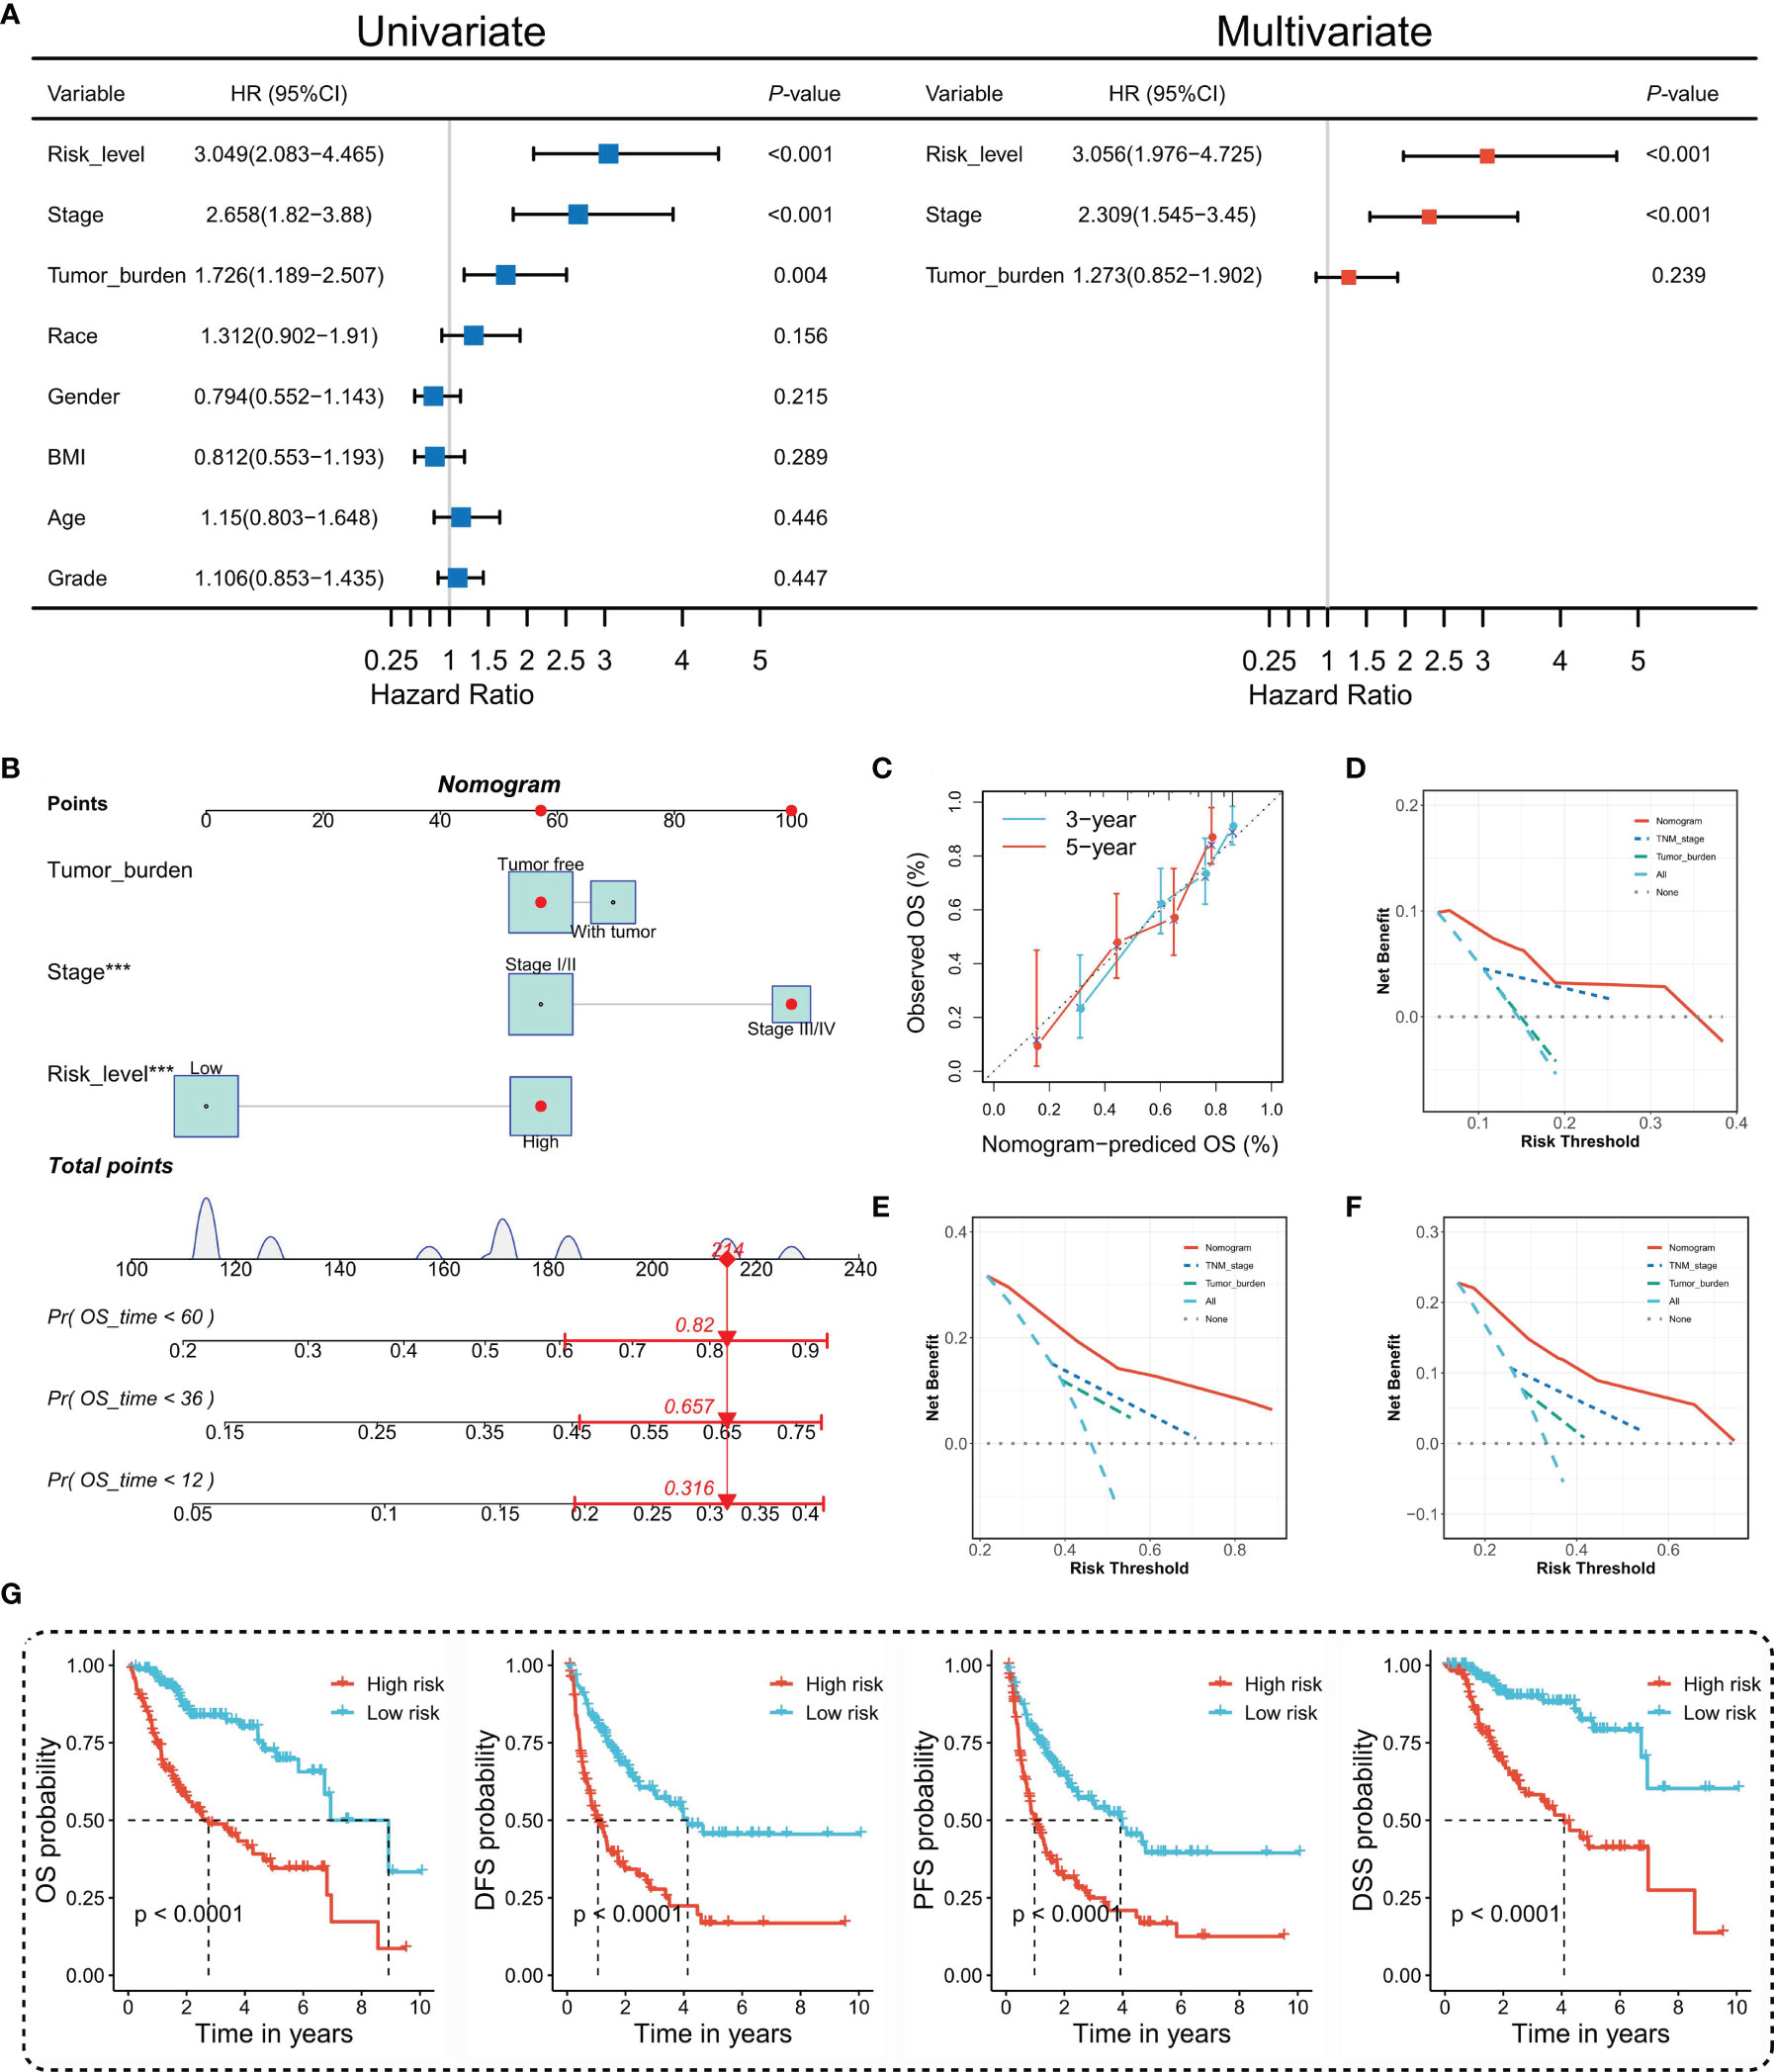
Figure 5 Construction and evaluation of the TIPRGPI-integrated nomogram. (A) Univariate and multivariate analyses of the clinical traits and TIPRGPI for the OS. (B) Nomogram for predicting the probability of 1-, 3-, and 5-year overall survival in HCC. (C) The calibration plots of the nomogram predicting the probability of the 3- and 5-year OS. (D–F) Decision curves showing the comparison of net benefits of the nomogram, TNM stage, tumor burden for 1-year (D), 3-year (E), and 5-year (F) OS. (G) Kaplan-Meier survival analysis of the integrated nomogram for OS, DFS, PFS, and DSS of HCC. ***P < 0.001.
To provide a quantitative instrument for the clinician, a nomogram was built by tumor burden, stage, and TIPRGPI (Figure 5B). The calibration plot showing the observed versus predicted rates of the 3- and 5-year OS indicates the ideal consistency of the nomogram (Figure 5C). As Figures 5D–F showed, the TIPRGPI-integrated nomogram achieved a better net benefit than clinical traits in predicting 1-year, 3-year, and 5-year OS in HCC patients from the TCGA-LIIHC dataset. In addition, we confirmed the prognostic value of the nomogram, which was found to be significantly associated with OS, DFS, PFS, and DSS, respectively (Figure 5G).
The Underlying Molecular Mechanisms of TIPRGPI
To investigate the potential mechanisms of the risk level defined by TIPRGPI in HCC, we downloaded the available somatic mutation profiles and analyzed the mutation landscape of the high- and low-risk patients from the TCGA-LIHC dataset (Figures 6A, B). We exhibited the top 20 mutated genes in two groups respectively. The gene with the most mutation frequency is TP53 (43%) in the high-risk group and that in the low-risk group is CTNNB1 (29%). The summary of the mutation information with statistical calculation was shown in Supplementary Figure 3. Further, the significant differentially mutated genes between the TIPRGPI high- and low-risk groups were detected by Fisher’s exact test. As shown in Figure 6C, TP53 was found with a much higher mutation rate in the high-risk group compared with the low-risk group (P < 0.001), and a lollipop plot was depicted to indicate the different mutation spots of TP53 for the two risk groups (Figure 6D). Meanwhile, the coincident and exclusive associations across the top 25 mutated genes from the high- and low-risk groups were also analyzed, in which blue represents the co-occurrence while red represents mutual exclusion (Figure 6E). Additionally, the CNV alteration landscapes of the high- and low-risk groups were generated after removing the germline features (Figure 6F). Interestingly, the hub genes of HCC (32, 33) were widely amplified in the high-risk group in comparison with the low-risk group (Figure 6G). NDC80 and RFC4 were two examples demonstrating the positive correlations of gene expression and copy number in the TIPRGPI high-risk group (Figure 6H).
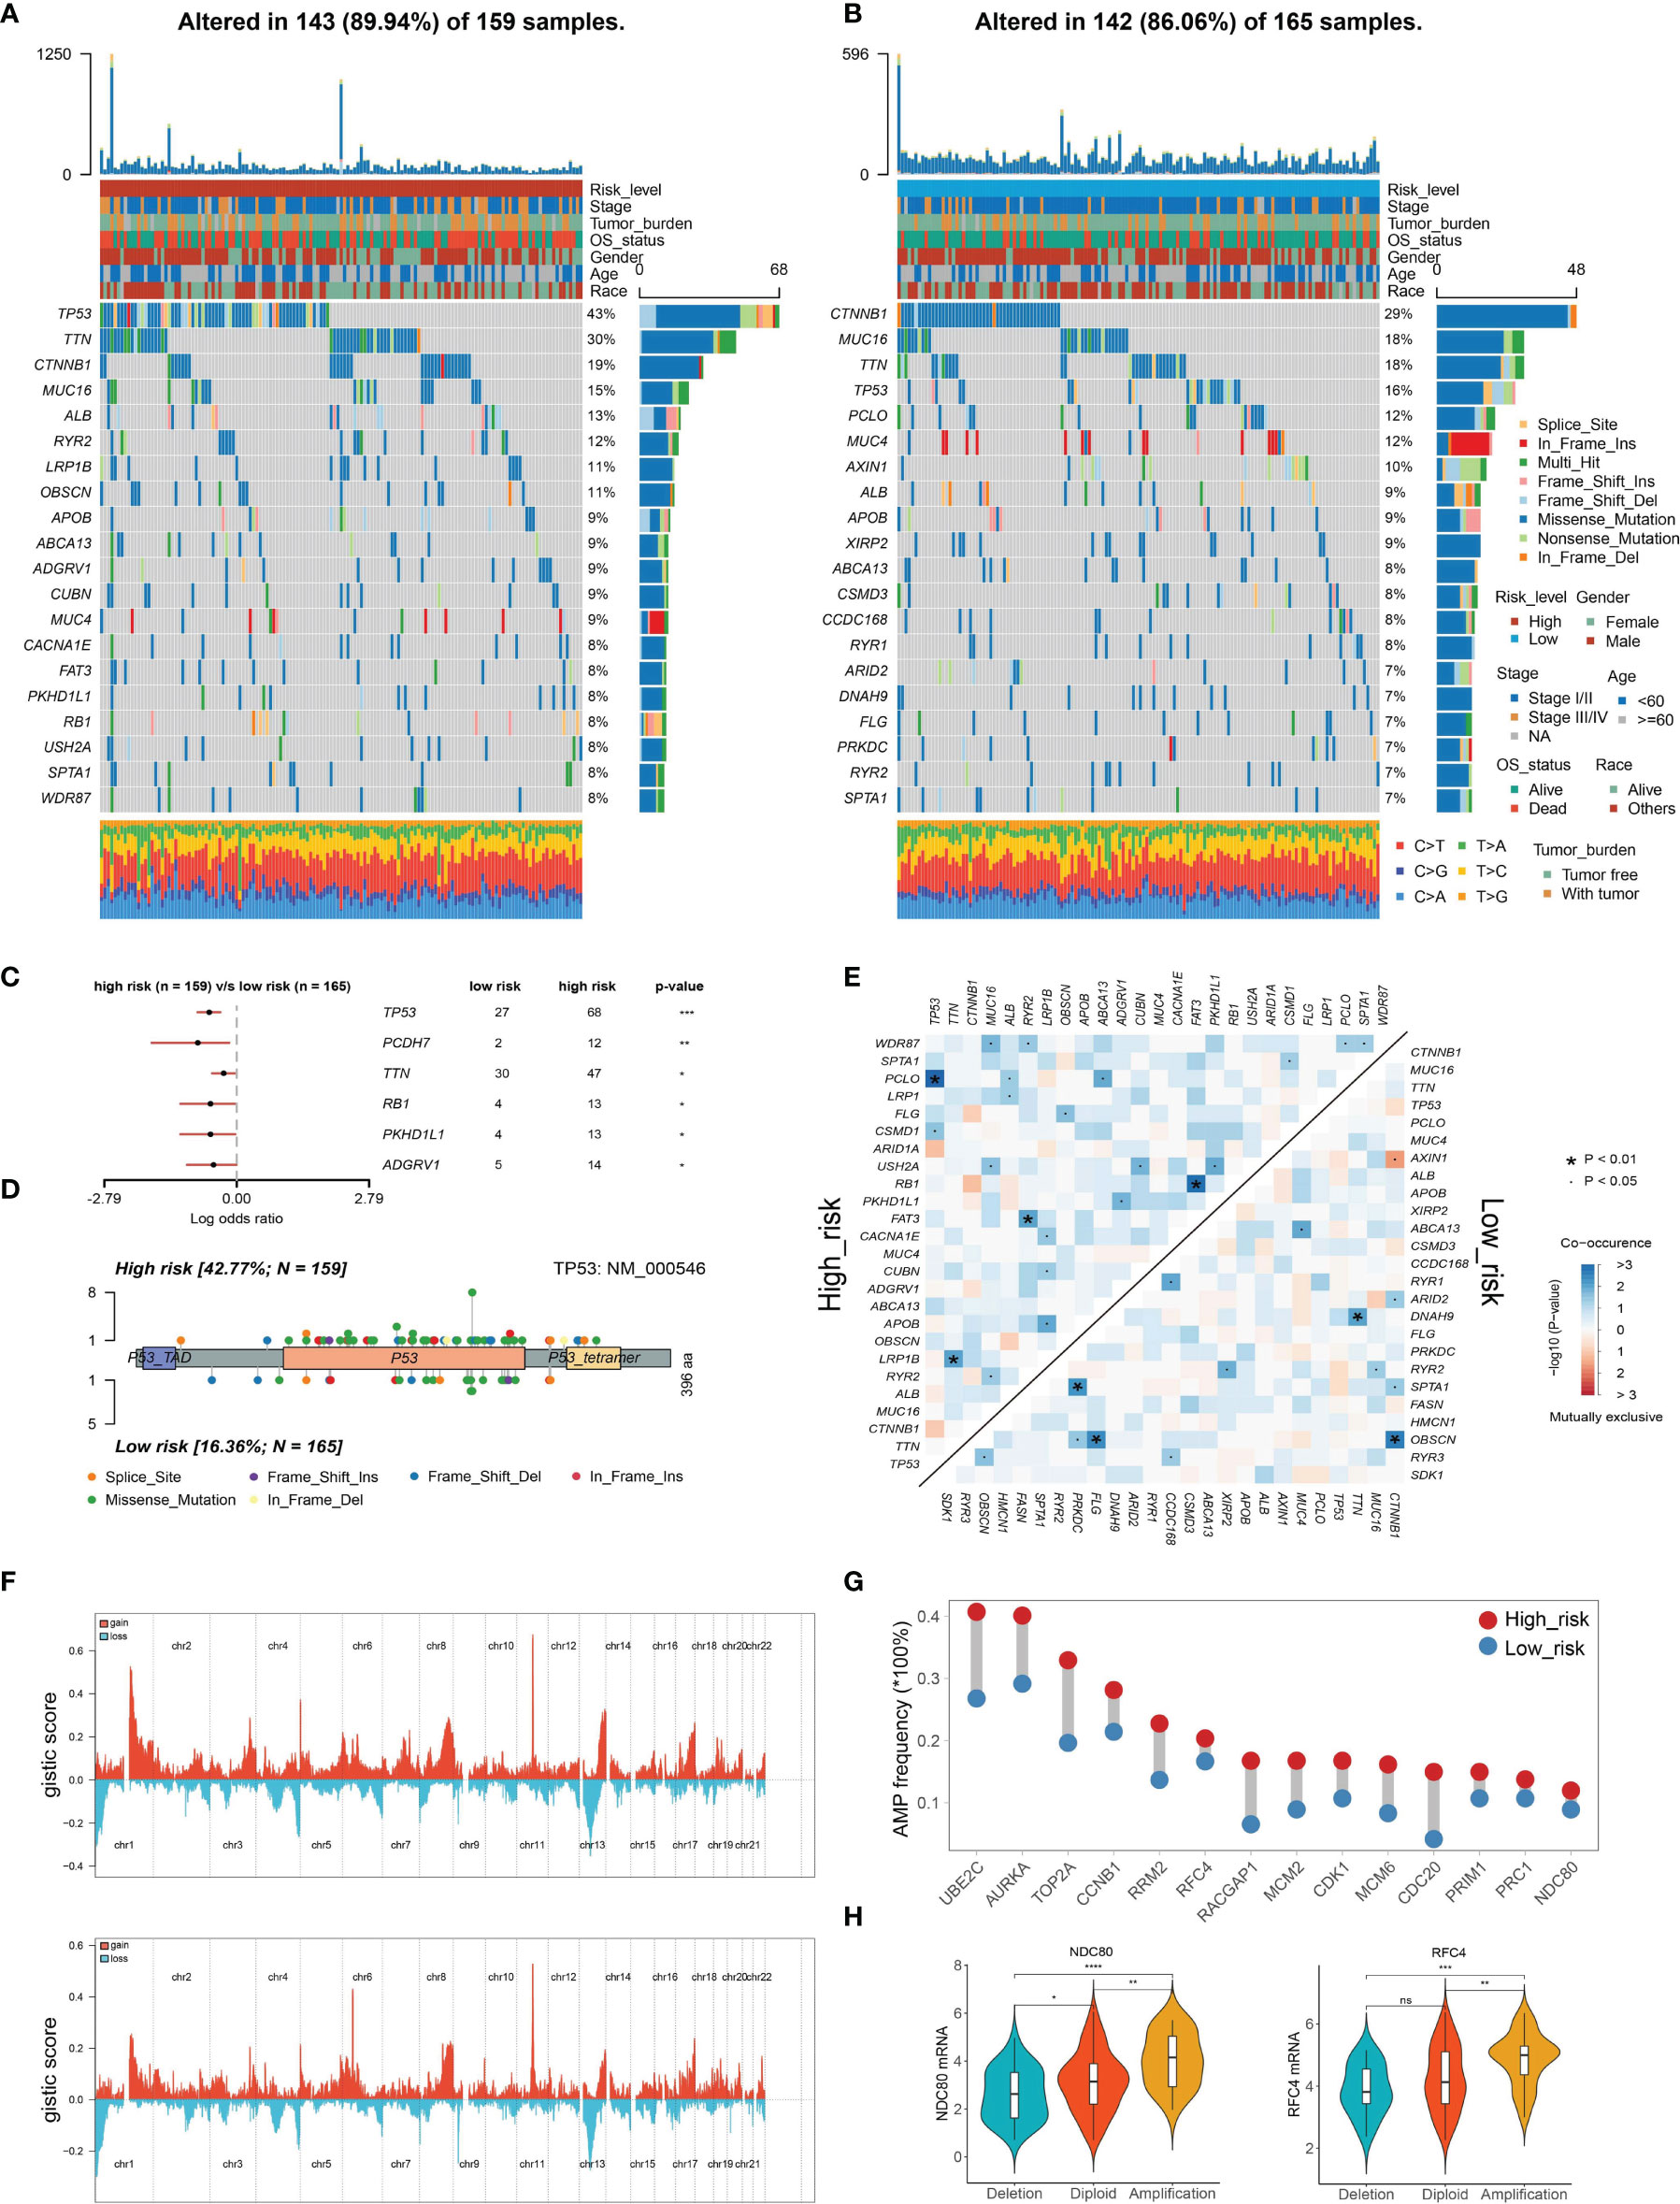
Figure 6 Genetic alterations of the TIPRGPI low- and high-risk groups. (A, B) Waterfall plots displaying the mutation landscapes of the high- (A) and low-risk groups (B). (C) Forest plot showing the significantly different mutated genes between the TIPRGPI risk groups. (D) Lollipop plot indicating the distribution of mutation spots in the high- and low-risk groups. (E) The coincident and exclusive associations across the top mutated genes in high- and low-risk groups. (F) The distribution of CNV features across all chromosomes for the high- (upper) and low- (bottom) risk groups. (G) HCC hub genes were widely amplified in the high-risk group. (H) Violin plots indicating the positive correlation of gene expression and copy number of two represented hub genes (NDC80 and RFC4) in the high-risk group. *P < 0.05, **P < 0.01, ***P < 0.001, ****P < 0.0001, ns, not significant.
To explore the associated cancer hallmark pathways regarding TIPRGPI, we performed GSVA in high- and low-risk groups. According to the predefined cutoff, 16 hallmark pathways significantly increased in the high-risk group compared with the low-risk group (Figure 7A). GSEA confirmed that 12 of them were upregulated in the high-risk group, most of which were related to well-known oncogenic pathways (61) (Figure 7B and Supplementary Table 3). Kaplan-Meier survival analysis was applied to evaluate the prognostic values of the upregulated hallmark pathways and different OS probabilities were observed between the high- and low-score groups for these oncogenic hallmark pathways, such as PI3K_AKT_MTOR_SIGNALING, G2M_CHECKPOINT, WNT_BETA_CATENIN_SIGNALING, and MYC_TARGETS_V1 (Figure 7C). Taken together, TIPRGPI was tightly associated with oncogenic pathways.

Figure 7 Determination of the distinct hallmark pathways of the TIPRGPI low- and high-risk groups. (A) Differences in cancer hallmark pathway activities between the high- and low-risk groups scored by GSVA. (B) The GSEA results for the 12 overlapping upregulated hallmark pathways in terms of the TIPRGPI risk groups. (C) Kaplan-Meier survival plots showing the significant correlations between the OS and GSVA scores of typical oncogenic hallmark pathways. GSVA, gene set variation analysis. GSEA, gene set enrichment analysis.
TIPRGPI Was Associated With HCC Immune Status
Given that TIPRGPI was constructed on the basis of TIP score, which was significantly related to other immune signatures, we explored the potential relationship between TIPRGPI and the infiltration of TME cells. The boxplots showed the differential distribution of infiltrating TME cells inferred by ssGSEA algorithm between low- and high-risk groups and revealed that the infiltration of most TME cell types including activated B cell, activated CD4 T cell, gamma delta T cell, memory B cell, activated CD8 T cell, immature B cell, effector memory CD8 T cell, type 1 T helper cell, natural killer T cell, eosinophil, activated dendritic cell, immature dendritic cell, plasmacytoid dendritic cell, endothelial cell and fibroblast cell (P < 0.05) were significantly associated with risk group (Figure 8A). In addition, correlation analysis was used to pick out the TME cell types significantly correlated with the risk score and the result showed that four types were positively correlated with risk score while seven types were negatively correlated with it (Figure 8B). We also analyzed the relationships between OS and the infiltration of TME cells, whose expression levels were classed into low- and high-infiltration groups from the TCGA-HCC dataset, and the results showed 13 TME cell types were involved in the significant differences between the high- and low-infiltration groups (Supplementary Figure 4). Finally, overlapping Venn plot revealed 10 intersected TME cell types including four adaptive immune cell types (red), five innate immune cell types (green), and one stromal cell type (blue) among differential analysis, correlation analysis, and survival analysis (Figure 8C). These findings strongly suggested that the infiltration of TME cells plays a vital role in the postoperative risk stratification of HCC.
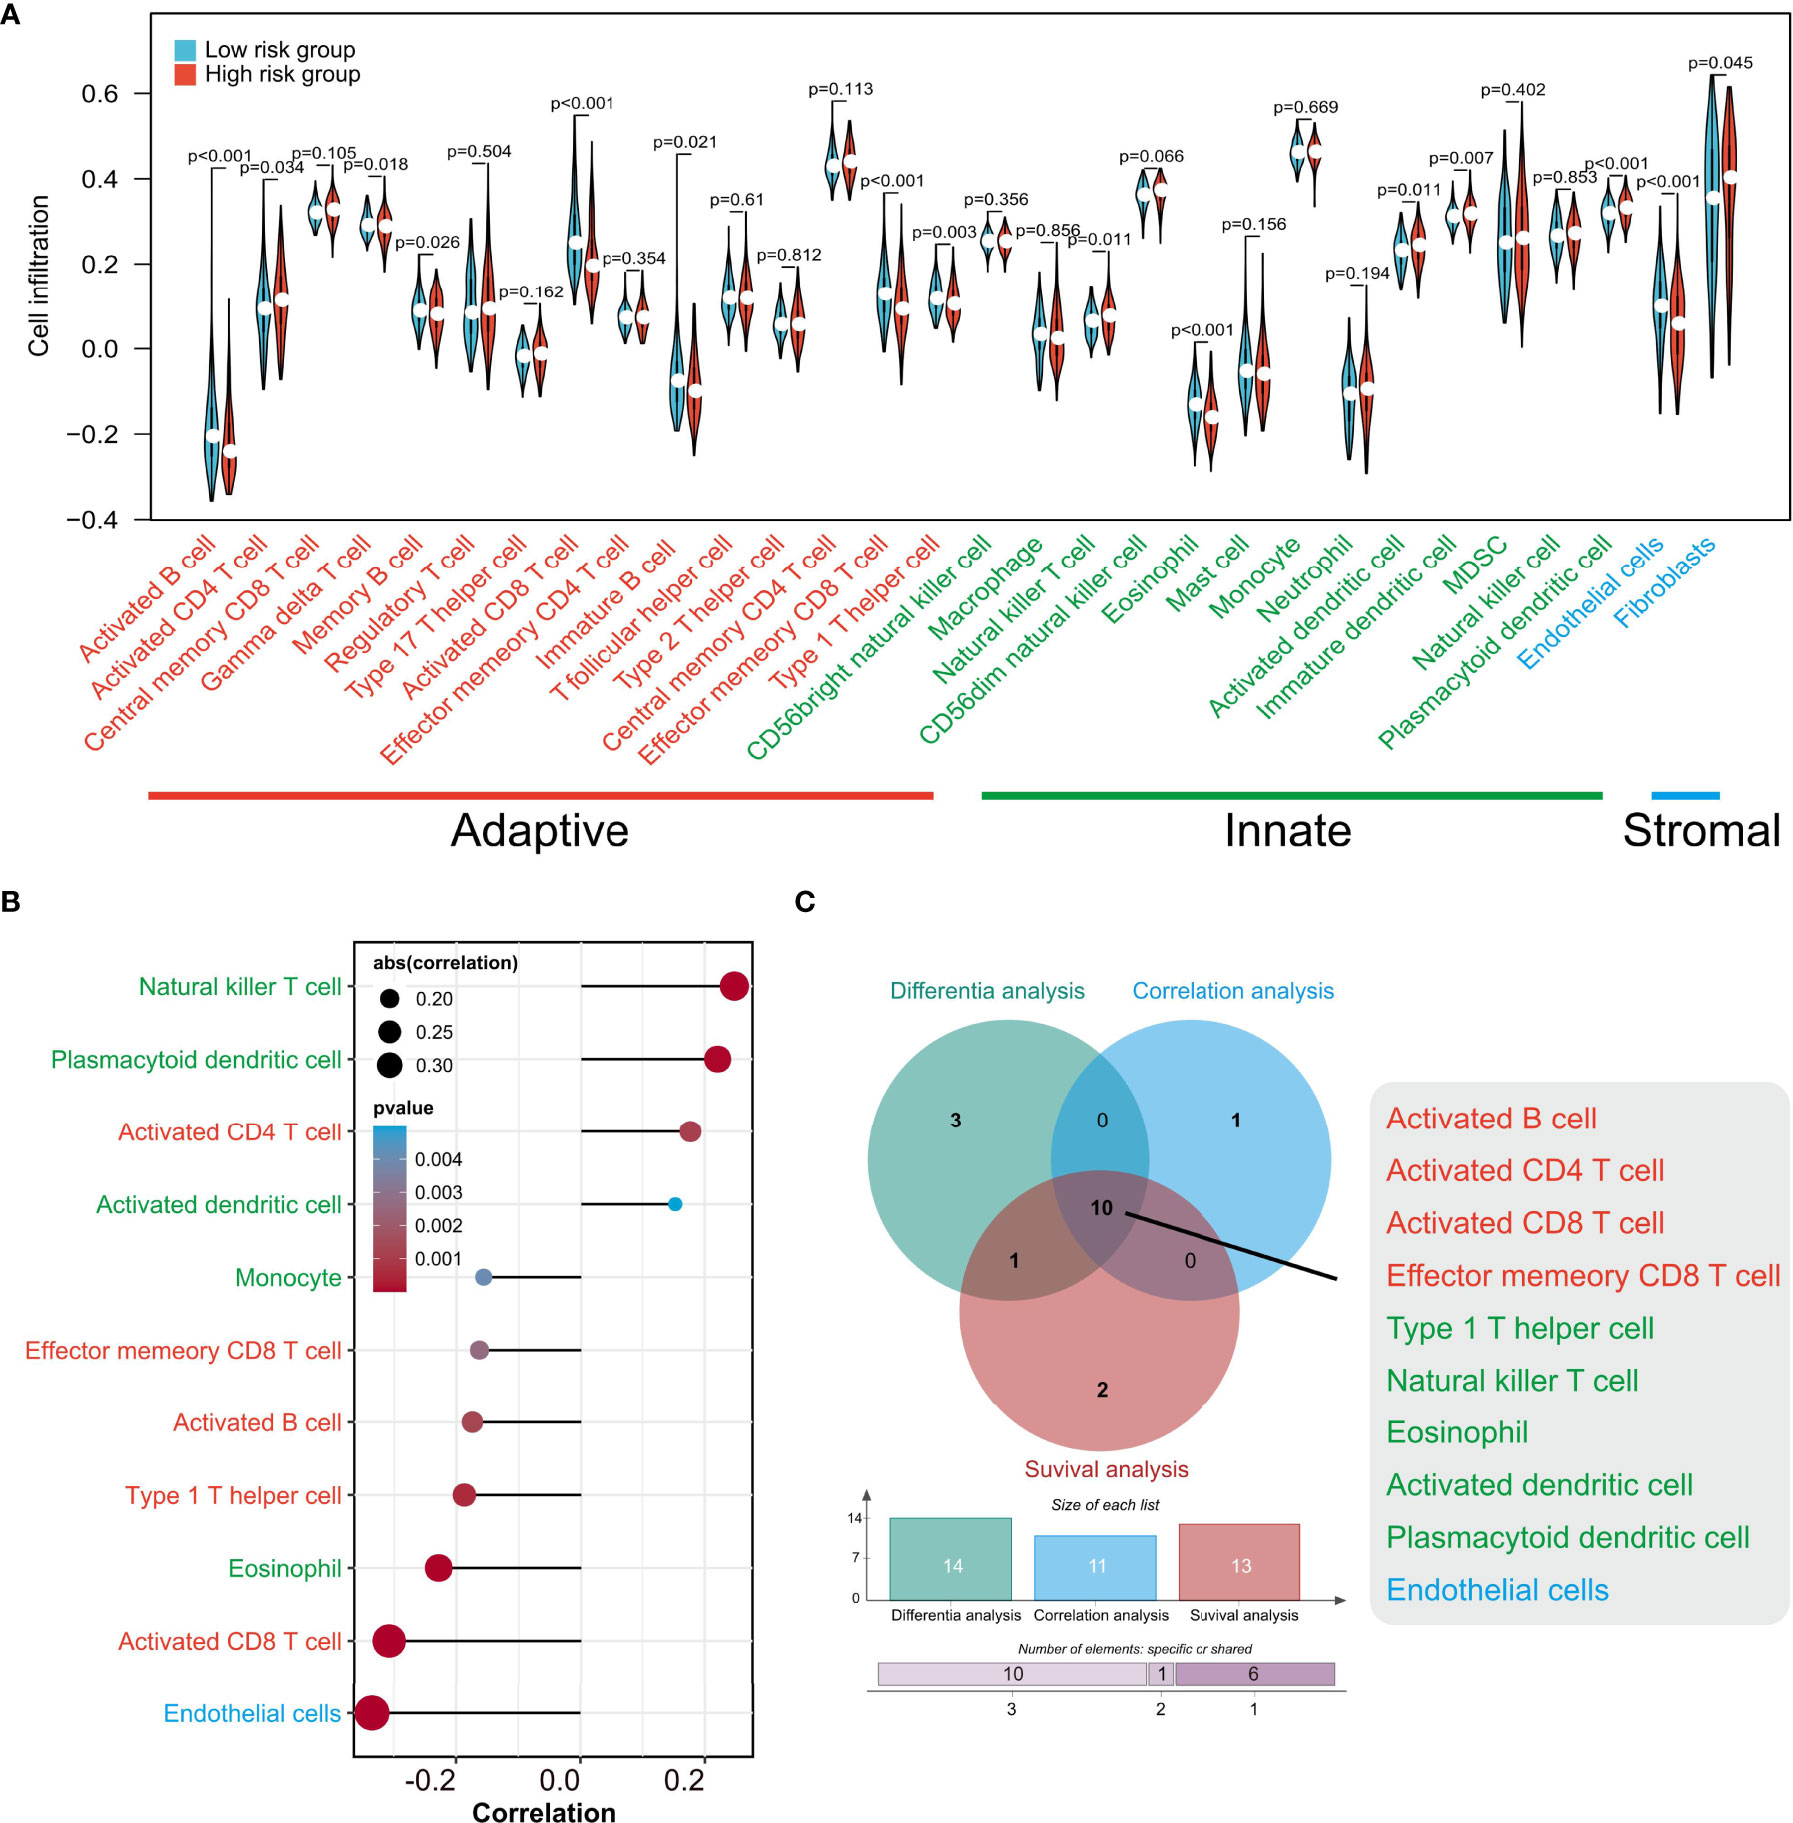
Figure 8 The associations of TIPRGPI and infiltration of TME cells estimated by ssGSEA. (A) The differences of TME cell infiltration between low- and high-risk groups. (B) Correlations between the risk score and TME cells. (C) Venn diagram revealing 10 types of most relevant TME cells contributing to the risk stratification of HCC patients by TIPRGPI. TME, tumor microenvironment.
TIPRGPI May be a Potential Indicator to Predict Immunotherapeutic Sensitivity in HCC Patients
ICB-related gene expression levels have been reported to be correlated with therapeutic responses of immune checkpoint inhibitors (62) and ICB targeting promising checkpoints has emerged as a promising strategy in treating cancers (63). To evaluate the potential of TIPRGPI for predicting the response of HCC patients to immunotherapy, we first determined the expression of 50 immunomodulators in low- and high-risk groups. As shown in Figure 9A, the expressions of more than half of the presented immunomodulators were significantly associated with the risk score. Considering the significant correlation between the risk score and CD8 T cell and the important role of m6A methylation in impairing the anti-tumor ability of CD8 T cell, we next analyzed the expression of the CD8 T cell-related IFN-gamma pathway markers and m6A regulators in low- and high-risk groups and found most of them were significantly associated with the risk score (Figures 9B, C). These findings demonstrated the TIPRGPI had great potential in evaluating the response of immunotherapy for HCC. Subsequently, we explored the correlation between the TIPRGPI risk group and immunophenoscore (IPS), which is a recognized model based on machine learning to predict patients’ responses to immune checkpoints blockade by estimating the immunogenicity. We found that the low-risk group has a higher IPS score, indicating patients in the low-risk group might respond better to immunotherapy (Figure 9D). We also used the TIDE algorithm to predict the immunotherapeutic efficacy for immune checkpoint blockade in TCGA-LIHC, GSE14520, and ICGC datasets and the high-risk group had a higher TIDE score, indicating that high-risk patients might have a worse response to immunotherapy (Figure 9E).
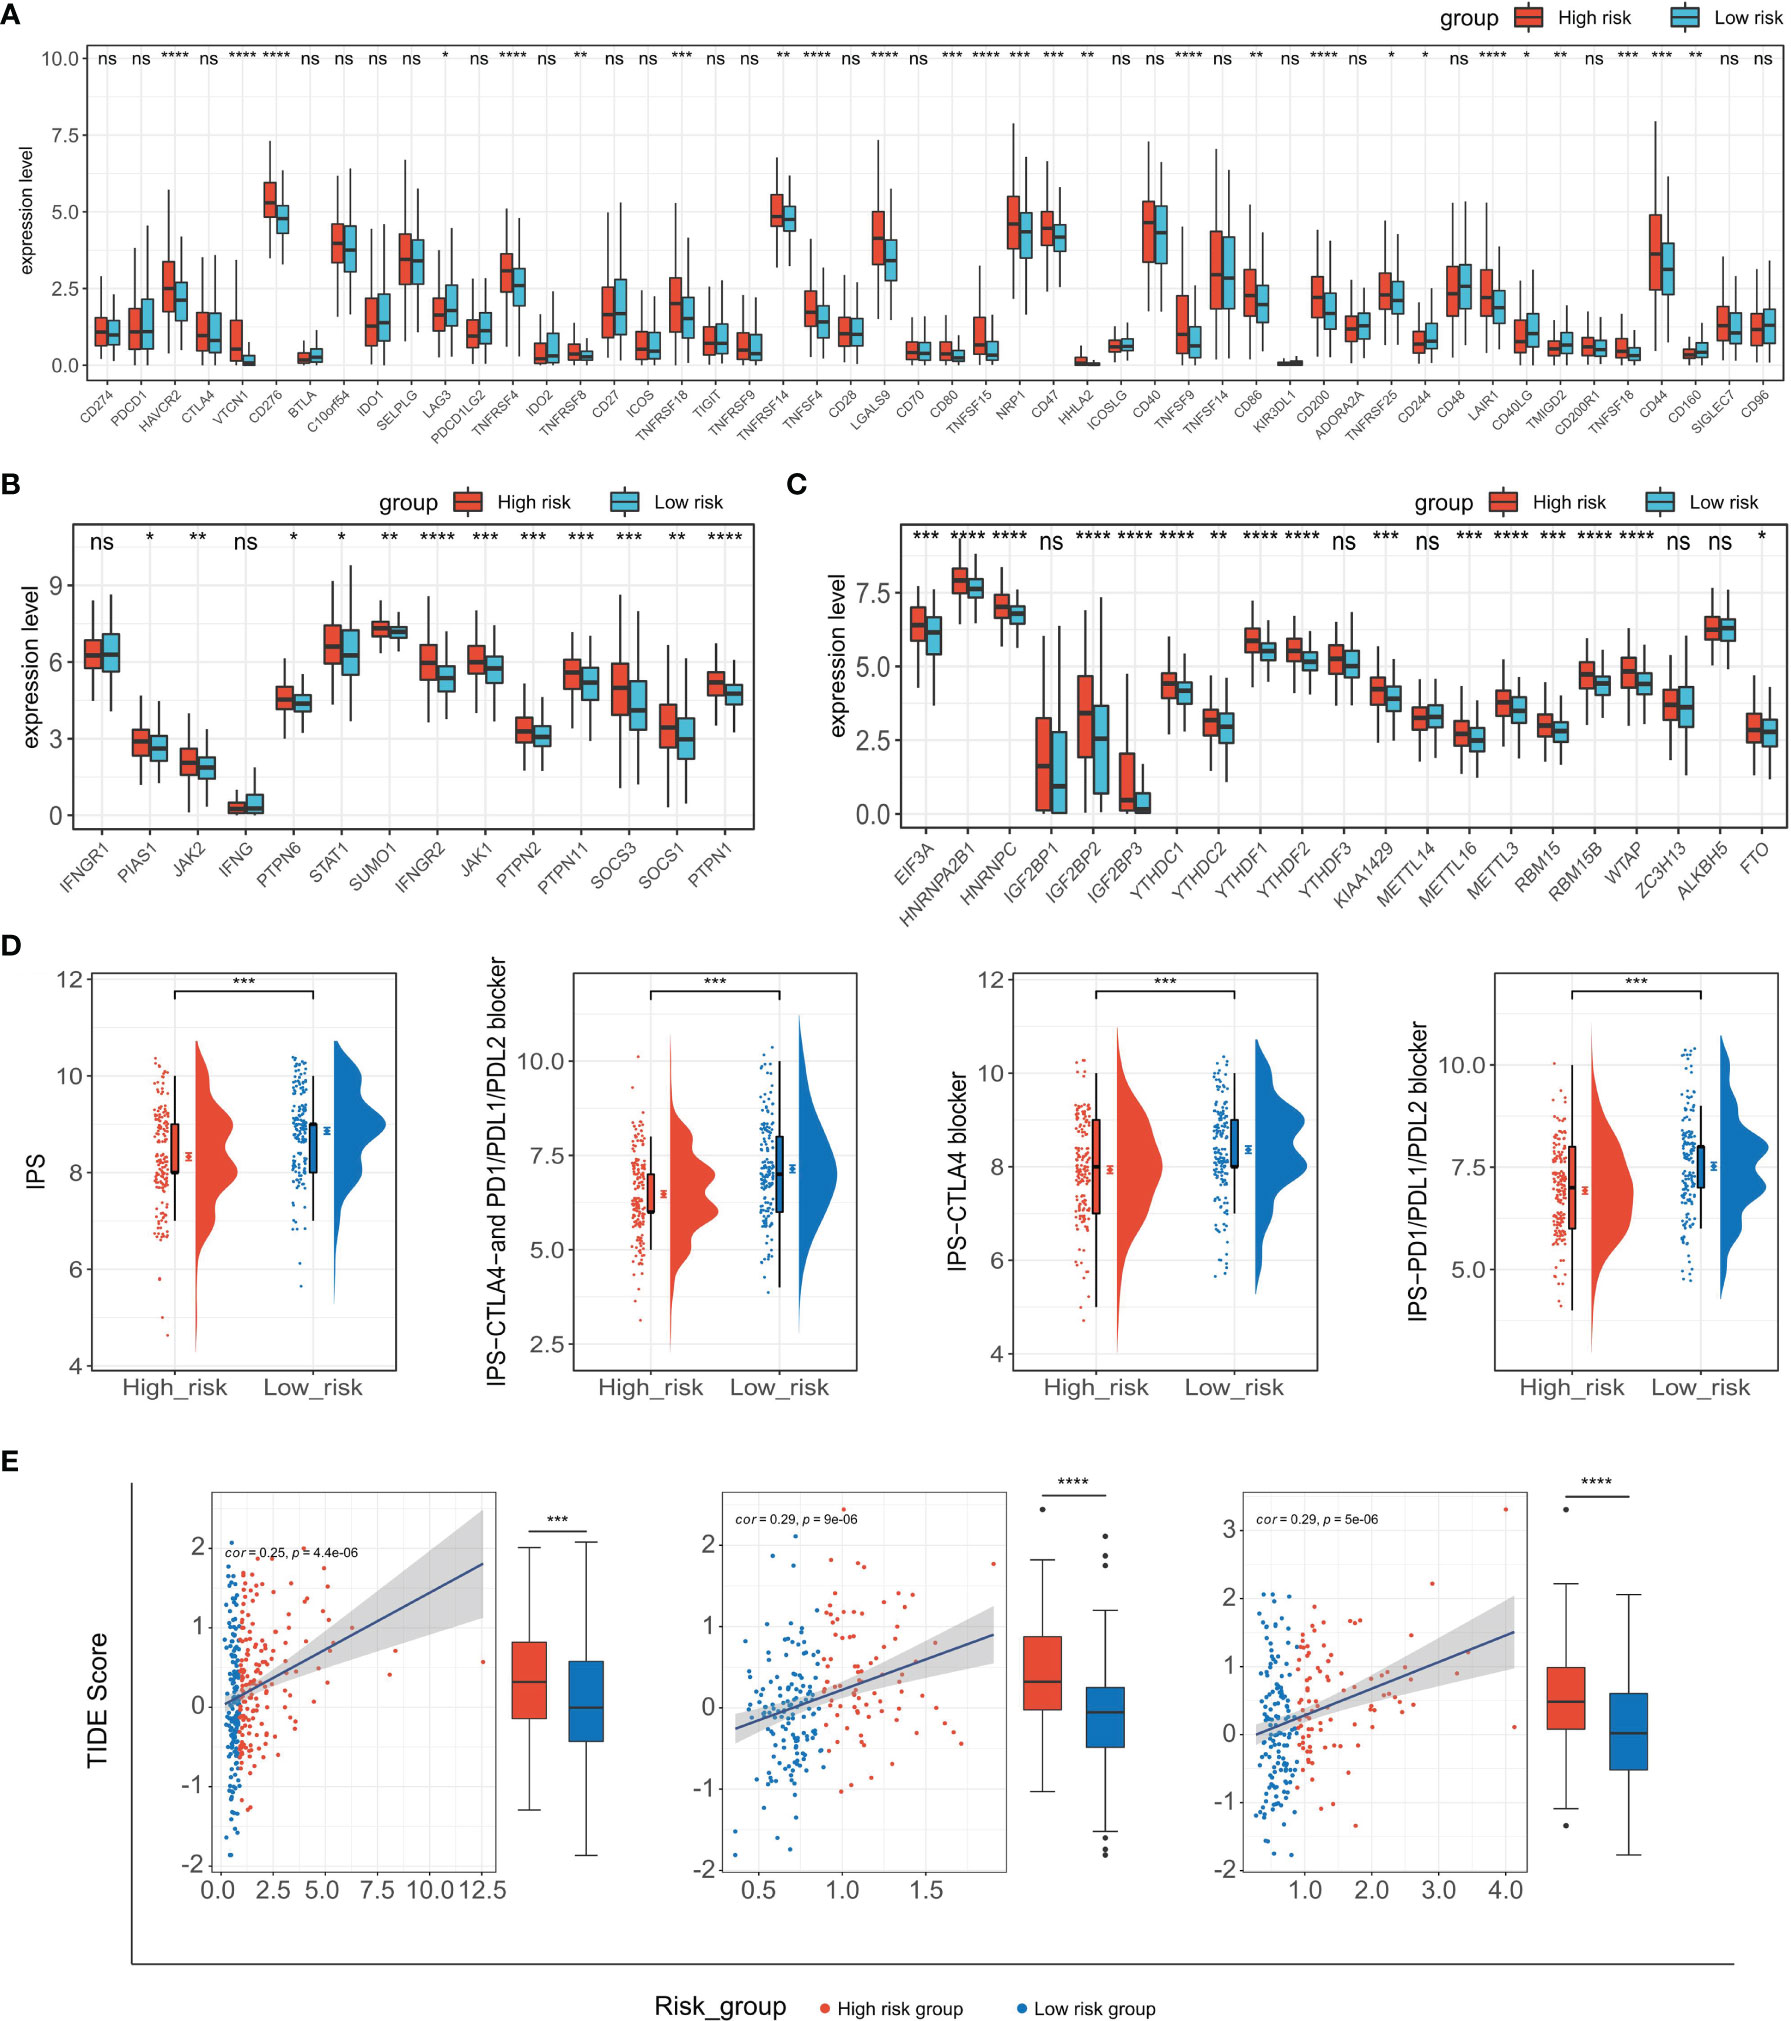
Figure 9 Application of the TIPRGPI model for immunotherapy prediction. (A–C) Expression of immune checkpoint molecules (A), IFN-gamma pathway-related markers (B), and m6A regulators (C) in low- and high-risk groups. (D) The relationship between TIPRGPI and IPS. (E) Distribution of TIDE scores in the TCGA-LIHC, GSE14520, and ICGC-LIRI-JP datasets. *P < 0.05, **P < 0.01, ***P < 0.001, ****P < 0.0001, ns, not significant.
Core Target Identification and Candidate Molecules Prediction
To identify the core target concerning TIPRGPI, a PPI network was built using the STRING database (confidence score > 0.4) and visualized by the Cytoscape software (Supplementary Figure 5). The highly interactive network contains 58 nodes and 182 edges with the clustering coefficient of 0.595. As shown in Supplementary Figure 5, CD44 lies at the hub of the network and has the highest degree among all the nodes. Thus, CD44 was considered as the core target.
Molecular docking is a structure-based computational algorithm for compound screening. In this study, the structures for a total of 9800 purchasable small molecules from the libraries of zinc15 database were obtained and subjected to molecular docking. Supplementary Table 4 showed the top six molecules (Pentostatin, Allantoin, Mizoribine, Xylose, Deoxynojirimycin, and 6-Hydroxyetodolac) that had the highest affinity with the predicted binding pocket of CD44. The 3D diagrams for the six docking models presenting the detailed binding energy were displayed in Figure 10. For instance, Mizoribine (ZINC000003812887) forms hydrogen bonds with amino acid residues ILE-96, CYS-77, ARG-78, TYR-42, and ILE-91. Besides, the probable formation of salt bridge interaction between ARG-78 and the side-chain hydroxyl group of the ligand also helped the compound connect to the active site of CD44.
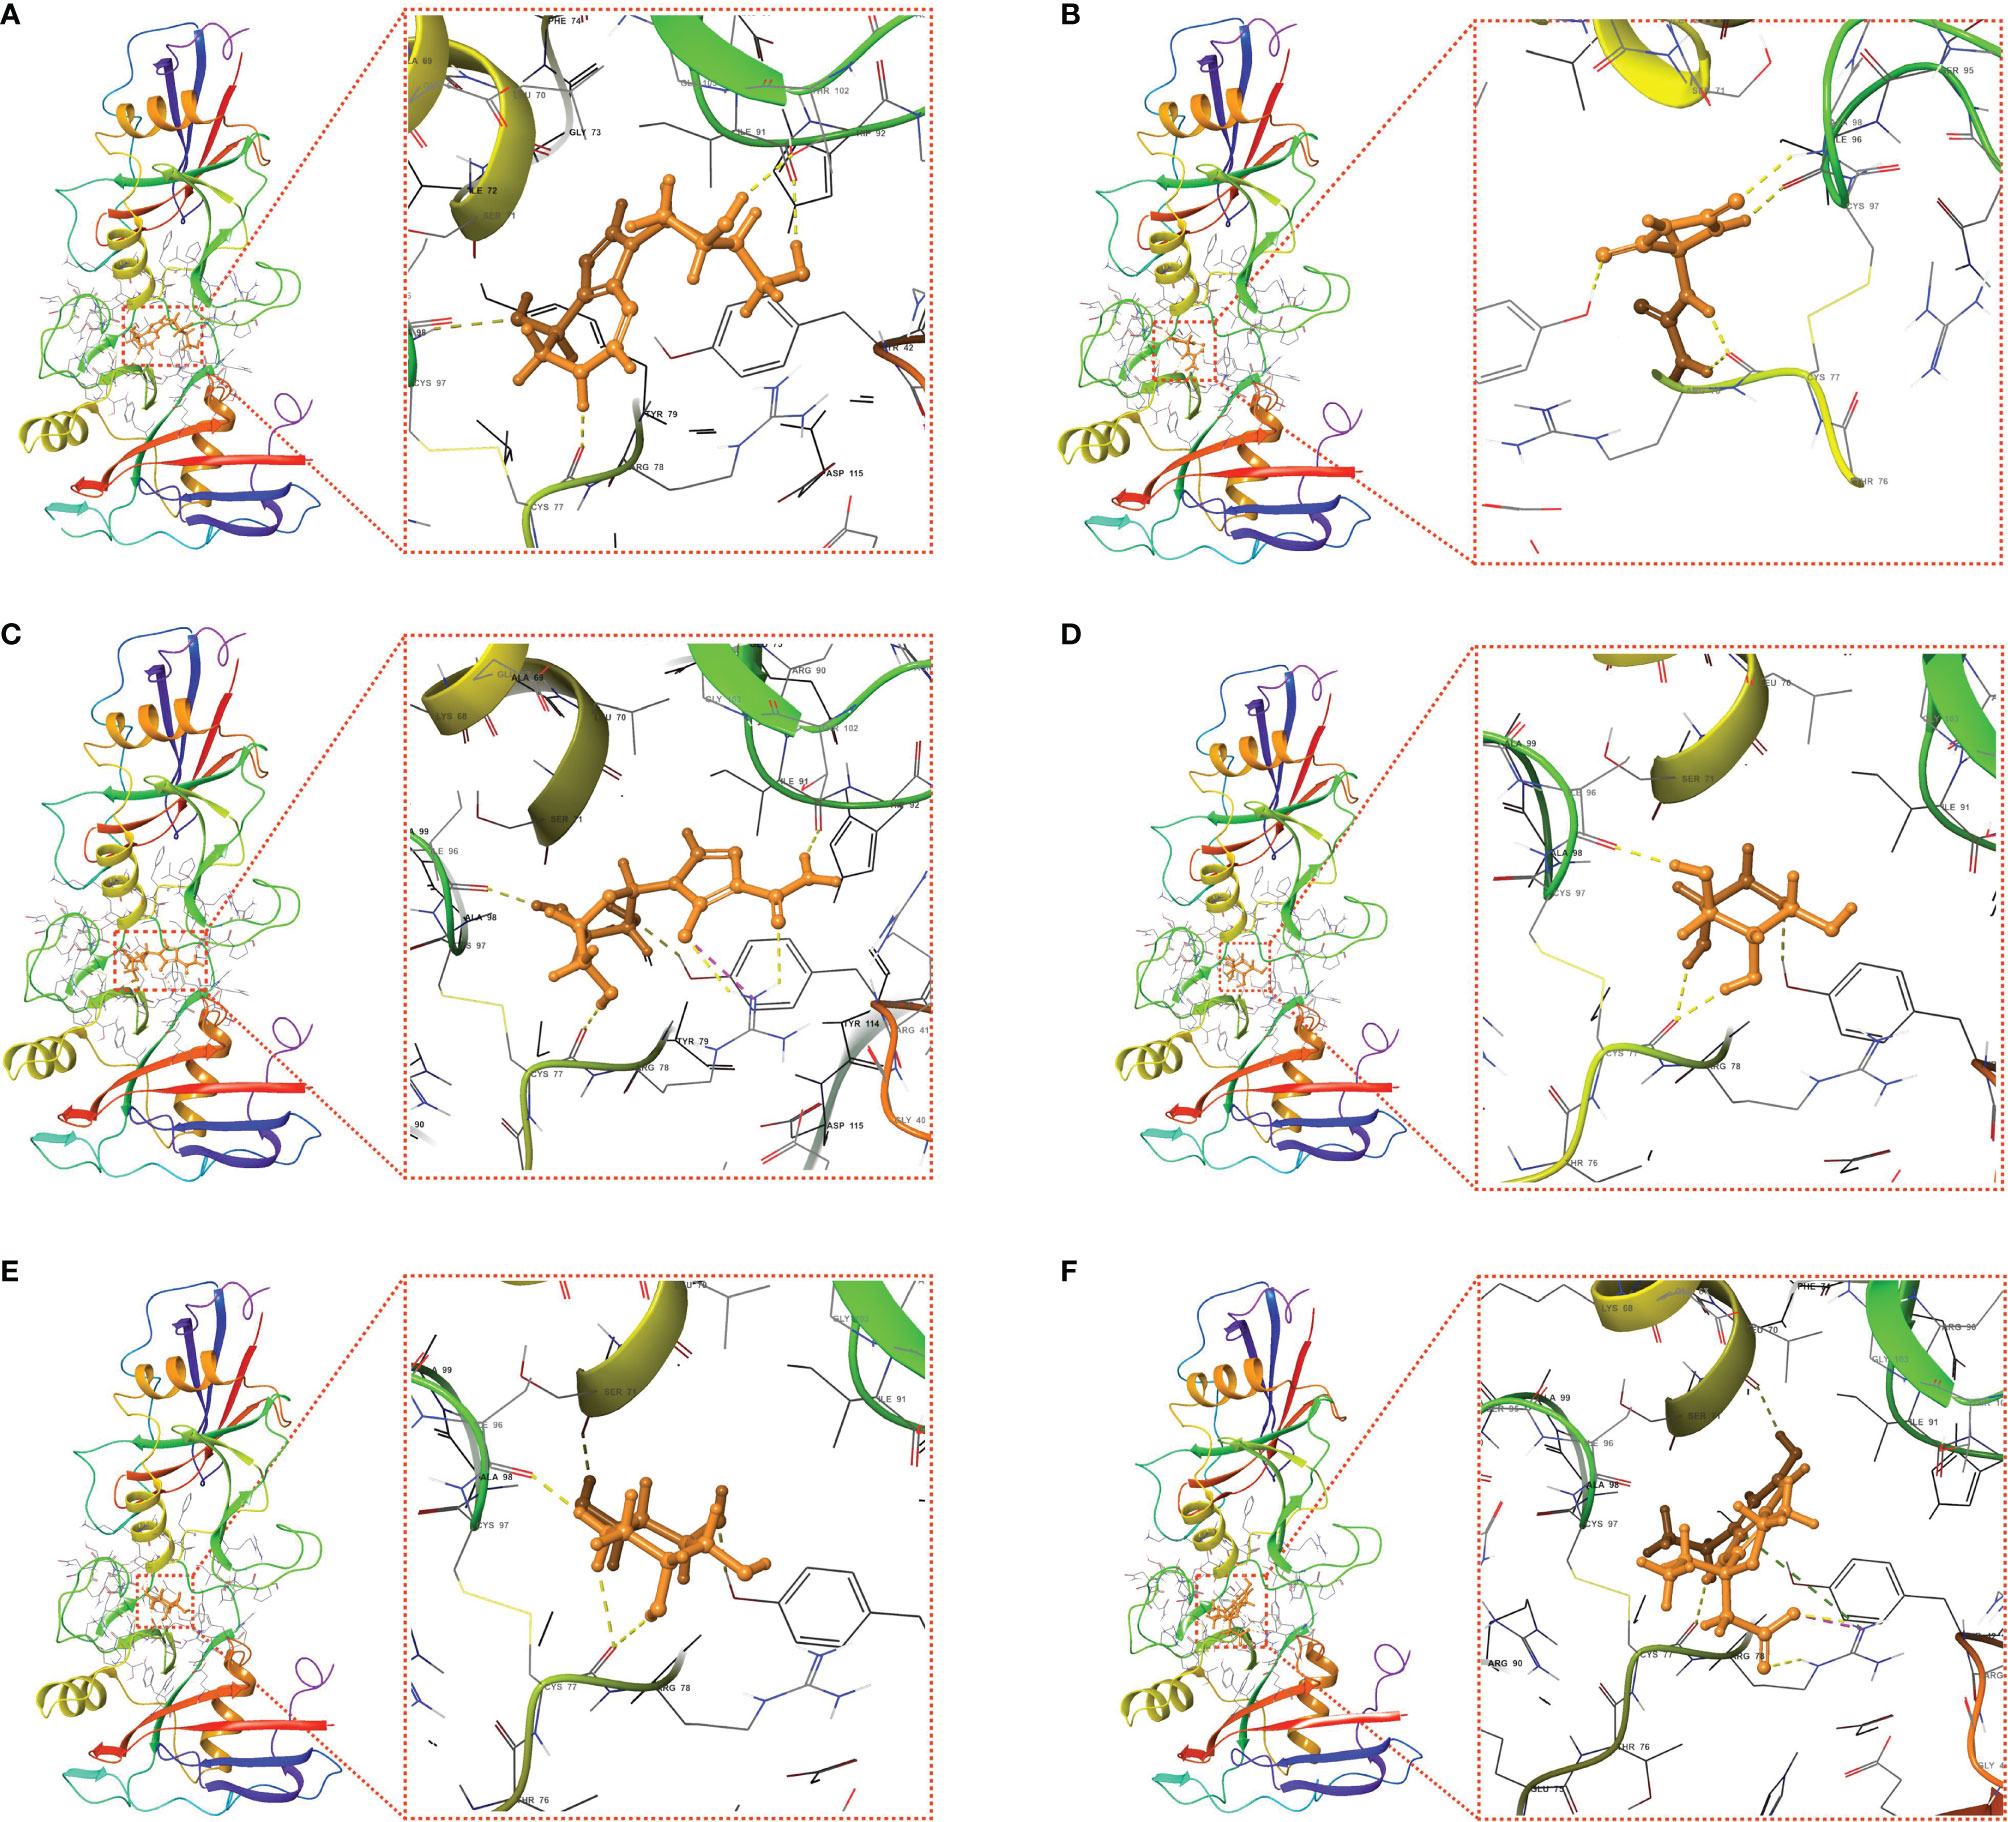
Figure 10 Putative docking models of the six candidate drugs and the core target using molecular docking analysis. 3D structures and binding modes showing the formed hydrogen bonds between the predicted pocket of CD44 and Pentostatin (A), Allantoin (B), Mizoribine (C), Xylose (D), Deoxynojirimycin (E), and 6-Hydroxyetodolac (F).
Discussions
It is well established that the tumor immune microenvironment is closely related to tumorigenesis and cancer progression (64–66). Here, using the “TIP genes”-guided strategy with multiple statistical approaches, we developed a novel immune-relevant and independent predictive model - TIPRGPI - for prognosis and immunotherapy in HCC. Based on the training (TCGA-LIHC) and two external validation (ICGC-LIRI-JP and GSE14520) datasets, the TIPRGPI signature was applied to divide HCC patients into low-risk and high-risk groups. As expected, high-risk patients had a worse prognosis and response to immunotherapy. Univariate and multivariate analysis verified it was an independent predictor for the prognosis of HCC. Moreover, a TIPRGPI-integrated nomogram model was established, which showed a better net benefit than the clinical traits in predicting 1-year, 3-year, and 5-year OS for HCC patients, thus demonstrating enhanced accuracy and potential implication in clinical practice. Besides, potential drugs targeting the signature could be predicted via molecular docking. Therefore, the TIPRGPI signature was a reliable model to predict prognosis and immunotherapeutic response in HCC and might provide valuable insight for seeking the treatment for HCC.
A growing body of gene signatures has been established to shed light on the prognosis classification of HCC. For example, Long et al. established a four-gene prognostic model that showed a good performance for HCC prognosis prediction (40). Gao et al. reported a six-gene signature for predicting OS of HCC (67). However, few studies focused on gene signatures on the basis of key genes in the tumor immune microenvironment. Tumor immunological phenotype has been emerging to be significantly related to prognosis and therapeutic responses in various types of cancer by mounting evidence (26, 68–71). TIP score, representing the expression level of fifteen TIP genes that were obtained from a previously study (26), was significantly associated with the prognosis and other immune signatures in HCC. Thus, we, for the first time, conducted WGCNA to uncover the specific gene expression pattern related to TIP score in HCC, identifying the black module that contained 432 genes, which generated an 11-gene signature called “TIPRGPI” for prognosis prediction of HCC. Another advantage of this study is the larger sample size and higher AUCs than that of most previous studies trying to building an effective risk classifier for HCC. Besides, unlike previous studies only describing a prognostic gene signature, we engaged an integrative analysis to get a deeper and comprehensive understanding of the risk model, and putative drugs were even predicted based on the model, which was rarely reported by other similar studies.
All genes involved are either related to the immune system or tumorigenesis. For example, adenosine deaminase (ADA) is produced in all cells but highest in lymphocytes and loss of ADA causes the immune system to collapse (72). IL-15RA is expressed in multiple types of immune cells including dendritic cells (DC), macrophages, and natural killer cells (NK), and it plays a prominent role in TME (73). Disabled-2 (DAB2) is considered to be an immune-regulatory factor (74), and has recently been found to be involved in the regulation of tumor-related signaling pathways (75, 76). To sum up, TIPRGPI is likely to be a prognostic indicator strongly related to the immune status in HCC.
Systematically exploring the hallmark gene sets between the low- and high-risk groups provided us more insights into the transcriptomic regulatory mechanisms of TIPRGPI in HCC. Those hallmark pathways with an increased level in the high-risk group were found to be relevant to well-recognized oncogenic signaling pathways, including PI3K pathway, Wnt pathway, Myc pathway, and Cell cycle pathway (61). The similarities and disparities of mutation status or CNV profiles gave a hint of oncogenes that linked to the TIPRGPI model. These preliminary data strongly implied the inherent associations between immune-derived signature and oncogenic pathways and could provide more clues or new strategies for candidate drug discovery in future studies.
In consideration of the importance of immune infiltration in the tumor ecosystem, ssGSEA algorithm was used to estimate the activities of TME cells in low- and high-risk groups. 11 types of immune cells were significantly associated with the risk score. In line with the survival analysis, a higher abundance of activated B cell, effector memory CD8+ T cell, and activated CD8+ T cell in the low-risk group might contribute to a better prognosis. These results suggest that the poor survival outcomes of high-risk group patients are probably due to the low infiltration of these protective immune cells, which is also the main cause for the low objective response rates to immunotherapy, agreeing with previous observations (43, 77).
In the past decade, anti-cancer immunotherapies targeting PD-1/PD-L1 and CTLA-4, have achieved positive response in HCC patients (78, 79). However, as mentioned above, only a small proportion of HCC patients can respond to immunotherapies, and the main reason might be the limitations in their tumor immunity status (80). To determine whether TIPRGPI was capable of predicting the efficiency of anti-cancer immunotherapies in HCC patients, we measured the expression levels of 50 common immune checkpoints in low- and high-risk groups and found more than half of them were significantly associated with the risk level. It is widely known that cancer immunotherapy restores or enhances the anti-tumor function of CD8+ T cells in the tumor microenvironment (81). Thus, we estimated the expression levels of the key molecules in two CD8+ T cells anti-tumor related pathways (IFN-gamma (82) and m6A pathway (83)) in low- and high-risk groups, and the results indicated that the majority of these molecules were expressed differently between two groups of HCC patients. IPS, developed from a panel of immune-related genes belonging to the four classes-effector cells, immunosuppressive cells, MHC molecules, and selected immunomodulators, was a superior predictor of response to immune checkpoint inhibitors (50). Our study showed that the low-risk group had higher IPS, IPS-PD-11/PD-L1/PD-L2, and IPS-CTLA4 scores, suggesting that HCC patients in the low-risk group might have a better response to anti-CTLA-4 and anti-PD-1 antibodies. Also, TIDE analysis showed that the low-risk group had a lower TIDE score than the high-risk group in three different datasets. Taken together, these results suggested that patients in the low-risk group might have a better response to immunotherapies and TIPGPI could be a potential biomarker for predicting the efficiency of immunotherapies in HCC.
As another application of the prognostic classifier, we demonstrated the feasibility of searching candidate drugs by combining the core target and structure-based approaches. A PPI network was constructed for these signature genes, among which CD44 was found to be the hub node. Interestingly, CD44 was a well-defined cancer stem cell (CSC) marker that was involved in tumor initiation, epithelial-mesenchymal transition (EMT), and therapy resistance in multiple types of cancer. Therefore, substantial efforts have been exerted to develop effective anti-cancer drugs or antibodies by targeting CD44 (84–87). Preclinical and clinical trials of CD44 monoclonal antibodies have also been performed to evaluate the pharmacokinetics, efficacy, and drug-related toxicity in cancer (88). In the present study, we identified six drugs with high affinity to CD44 from a total of 9800 small molecules. Among them, Pentostatin has been reported in clinical trials for chronic lymphocytic leukemia (CLL) (89). Noticeably, Deoxynojirimycin could exert anti-HCV activity through inhibiting alpha-glucosidase (90). Although more in-depth investigations should be conducted for the specific mechanisms of the small compounds, our results indicated their potential in cancer immunotherapy especially for the immunological high-risk group of HCC patients.
Conclusion
In summary, we constructed an immune-related TIPRGPI model to predict the prognosis and immunotherapy efficacy of HCC patients using a novel “TIP genes”- guided strategy, and it was well-validated from multiple aspects. Combining these results and the linkage between TIPRGPI and oncogenic hallmark pathways, our study provides new perspectives for the identification of prognostic classifiers and even the discovery of immunotherapeutic drugs. Notably, in the era, where immunotherapy offers new hope for effective cancer treatment, TIPRGPI provides certain guiding significance for clinical judgment and personalized treatment.
Data Availability Statement
The data achieved and analyzed in the current study are available in the TCGA repository (https://portal.gdc.cancer.gov/), ICGC database (https://icgc.org/), and GEO database (https://www.ncbi.nlm.nih.gov/geo/) under the accession number GSE14520.
Author Contributions
YT, YZ, and DW conceived the study. YT, YZ, and CG contributed to data collection, analysis, and interpretation. ZY helped with data visualization. YZ and CG completed the drafting of the manuscript. YT, YW, and DW revised the manuscript. DW supervised the research. All authors contributed to the article and approved the submitted version.
Funding
This work was supported by the National Natural Science Foundation of China (Grant No. 82172723, 81673460), Science and Technology Department of Sichuan Province (Grant No. 2021ZYD0079), and the Sichuan Youth Science and Technology Innovation Research Team of Experimental Formulology (2020JDTD0022).
Conflict of Interest
The authors declare that the research was conducted in the absence of any commercial or financial relationships that could be construed as a potential conflict of interest.
Publisher’s Note
All claims expressed in this article are solely those of the authors and do not necessarily represent those of their affiliated organizations, or those of the publisher, the editors and the reviewers. Any product that may be evaluated in this article, or claim that may be made by its manufacturer, is not guaranteed or endorsed by the publisher.
Acknowledgments
We acknowledge the Gene Expression Omnibus (GEO) database, Cancer Genome Atlas (TCGA), and International Cancer Genome Consortium (ICGC) for data sharing.
Supplementary Material
The Supplementary Material for this article can be found online at: https://www.frontiersin.org/articles/10.3389/fimmu.2022.862527/full#supplementary-material
References
1. Petrick JL, Florio AA, Znaor A, Ruggieri D, Laversanne M, Alvarez CS, et al. International Trends in Hepatocellular Carcinoma Incidence, 1978-2012. Int J Cancer (2020) 147(2):317–30. doi: 10.1002/ijc.32723
2. Yang JD, Hainaut P, Gores GJ, Amadou A, Plymoth A. Roberts LR. A Global View of Hepatocellular Carcinoma: Trends, Risk, Prevention and Management. Nat Rev Gastroenterol Hepatol (2019) 16(10):589–604. doi: 10.1038/s41575-019-0186-y
3. Valery PC, Laversanne M, Clark PJ, Petrick JL, McGlynn KA, Bray F. Projections of Primary Liver Cancer to 2030 in 30 Countries Worldwide. Hepatology (2018) 67(2):600–11. doi: 10.1002/hep.29498
4. Bray F, Ferlay J, Soerjomataram I, Siegel RL, Torre LA, Jemal A. Global Cancer Statistics 2018: Globocan Estimates of Incidence and Mortality Worldwide for 36 Cancers in 185 Countries. CA Cancer J Clin (2018) 68(6):394–424. doi: 10.3322/caac.21492
5. Singal AG, Lampertico P, Nahon P. Epidemiology and Surveillance for Hepatocellular Carcinoma: New Trends. J Hepatol (2020) 72(2):250–61. doi: 10.1016/j.jhep.2019.08.025
6. de Martel C, Maucort-Boulch D, Plummer M, Franceschi S. World-Wide Relative Contribution of Hepatitis B and C Viruses in Hepatocellular Carcinoma. Hepatology (2015) 62(4):1190–200. doi: 10.1002/hep.27969
7. Sung H, Ferlay J, Siegel RL, Laversanne M, Soerjomataram I, Jemal A, et al. Global Cancer Statistics 2020: Globocan Estimates of Incidence and Mortality Worldwide for 36 Cancers in 185 Countries. CA Cancer J Clin (2021) 71(3):209–49. doi: 10.3322/caac.21660
8. Bruix J, Reig M, Sherman M. Evidence-Based Diagnosis, Staging, and Treatment of Patients With Hepatocellular Carcinoma. Gastroenterology (2016) 150(4):835–53. doi: 10.1053/j.gastro.2015.12.041
9. Xu Q, Xu H, Chen S, Huang W. Immunological Value of Prognostic Signature Based on Cancer Stem Cell Characteristics in Hepatocellular Carcinoma. Front Cell Dev Biol (2021) 9:710207. doi: 10.3389/fcell.2021.710207
10. Schreiber RD, Old LJ, Smyth MJ. Cancer Immunoediting: Integrating Immunity’s Roles in Cancer Suppression and Promotion. Science (2011) 331(6024):1565–70. doi: 10.1126/science.1203486
11. Sangro B, Sarobe P, Hervas-Stubbs S, Melero I. Advances in Immunotherapy for Hepatocellular Carcinoma. Nat Rev Gastroenterol Hepatol (2021) 18(8):525–43. doi: 10.1038/s41575-021-00438-0
12. Vaddepally RK, Kharel P, Pandey R, Garje R, Chandra AB. Review of Indications of Fda-Approved Immune Checkpoint Inhibitors Per Nccn Guidelines With the Level of Evidence. Cancers (Basel) (2020) 12(3):738. doi: 10.3390/cancers12030738
13. Anderson AC, Joller N, Kuchroo VK. Lag-3, Tim-3, and Tigit: Co-Inhibitory Receptors With Specialized Functions in Immune Regulation. Immunity (2016) 44(5):989–1004. doi: 10.1016/j.immuni.2016.05.001
14. Zhang Q, Bi J, Zheng X, Chen Y, Wang H, Wu W, et al. Blockade of the Checkpoint Receptor Tigit Prevents Nk Cell Exhaustion and Elicits Potent Anti-Tumor Immunity. Nat Immunol (2018) 19(7):723–32. doi: 10.1038/s41590-018-0132-0
16. Yang YM, Kim SY, Seki E. Inflammation and Liver Cancer: Molecular Mechanisms and Therapeutic Targets. Semin Liver Dis (2019) 39(1):26–42. doi: 10.1055/s-0038-1676806
17. Ringelhan M, Pfister D, O’Connor T, Pikarsky E, Heikenwalder M. The Immunology of Hepatocellular Carcinoma. Nat Immunol (2018) 19(3):222–32. doi: 10.1038/s41590-018-0044-z
18. Sangro B, Gomez-Martin C, de la Mata M, Inarrairaegui M, Garralda E, Barrera P, et al. A Clinical Trial of Ctla-4 Blockade With Tremelimumab in Patients With Hepatocellular Carcinoma and Chronic Hepatitis C. J Hepatol (2013) 59(1):81–8. doi: 10.1016/j.jhep.2013.02.022
19. El-Khoueiry AB, Sangro B, Yau T, Crocenzi TS, Kudo M, Hsu C, et al. Nivolumab in Patients With Advanced Hepatocellular Carcinoma (Checkmate 040): An Open-Label, Non-Comparative, Phase 1/2 Dose Escalation and Expansion Trial. Lancet (2017) 389(10088):2492–502. doi: 10.1016/S0140-6736(17)31046-2
20. Miamen AG, Dong H, Roberts LR. Immunotherapeutic Approaches to Hepatocellular Carcinoma Treatment. Liver Cancer (2012) 1(3-4):226–37. doi: 10.1159/000343837
21. Sammut SJ, Crispin-Ortuzar M, Chin SF, Provenzano E, Bardwell HA, Ma W, et al. Multi-Omic Machine Learning Predictor of Breast Cancer Therapy Response. Nature (2021) 601(7894):623–9. doi: 10.1038/s41586-021-04278-5
22. Marusyk A, Janiszewska M, Polyak K. Intratumor Heterogeneity: The Rosetta Stone of Therapy Resistance. Cancer Cell (2020) 37(4):471–84. doi: 10.1016/j.ccell.2020.03.007
23. Nagarsheth N, Wicha MS, Zou W. Chemokines in the Cancer Microenvironment and Their Relevance in Cancer Immunotherapy. Nat Rev Immunol (2017) 17(9):559–72. doi: 10.1038/nri.2017.49
24. Cai Y, Ji W, Sun C, Xu R, Chen X, Deng Y, et al. Interferon-Induced Transmembrane Protein 3 Shapes an Inflamed Tumor Microenvironment and Identifies Immuno-Hot Tumors. Front Immunol (2021) 12:704965. doi: 10.3389/fimmu.2021.704965
25. Ollauri-Ibanez C, Ayuso-Inigo B, Pericacho M. Hot and Cold Tumors: Is Endoglin (Cd105) a Potential Target for Vessel Normalization? Cancers (Basel) (2021) 13(7):1552. doi: 10.3390/cancers13071552
26. Wang H, Li S, Wang Q, Jin Z, Shao W, Gao Y, et al. Tumor Immunological Phenotype Signature-Based High-Throughput Screening for the Discovery of Combination Immunotherapy Compounds. Sci Adv (2021) 7(4):eabd7851. doi: 10.1126/sciadv.abd7851
27. Huo J, Wu L, Zang Y. Development and Validation of a Ctnnb1-Associated Metabolic Prognostic Model for Hepatocellular Carcinoma. J Cell Mol Med (2021) 25(2):1151–65. doi: 10.1111/jcmm.16181
28. Chew V, Chen J, Lee D, Loh E, Lee J, Lim KH, et al. Chemokine-Driven Lymphocyte Infiltration: An Early Intratumoural Event Determining Long-Term Survival in Resectable Hepatocellular Carcinoma. Gut (2012) 61(3):427–38. doi: 10.1136/gutjnl-2011-300509
29. Cai WY, Dong ZN, Fu XT, Lin LY, Wang L, Ye GD, et al. Identification of a Tumor Microenvironment-Relevant Gene Set-Based Prognostic Signature and Related Therapy Targets in Gastric Cancer. Theranostics (2020) 10(19):8633–47. doi: 10.7150/thno.47938
30. Roessler S, Jia HL, Budhu A, Forgues M, Ye QH, Lee JS, et al. A Unique Metastasis Gene Signature Enables Prediction of Tumor Relapse in Early-Stage Hepatocellular Carcinoma Patients. Cancer Res (2010) 70(24):10202–12. doi: 10.1158/0008-5472.CAN-10-2607
31. Roessler S, Long EL, Budhu A, Chen Y, Zhao X, Ji J, et al. Integrative Genomic Identification of Genes on 8p Associated With Hepatocellular Carcinoma Progression and Patient Survival. Gastroenterology (2012) 142(4):957–66 e12. doi: 10.1053/j.gastro.2011.12.039
32. Zhang Y, Tang Y, Guo C, Li G. Integrative Analysis Identifies Key Mrna Biomarkers for Diagnosis, Prognosis, and Therapeutic Targets of Hcv-Associated Hepatocellular Carcinoma. Aging (Albany NY) (2021) 13:12865–95. doi: 10.18632/aging.202957
33. Tang Y, Zhang Y, Hu X. Identification of Potential Hub Genes Related to Diagnosis and Prognosis of Hepatitis B Virus-Related Hepatocellular Carcinoma via Integrated Bioinformatics Analysis. BioMed Res Int (2020) 2020:4251761. doi: 10.1155/2020/4251761
34. Guo C, Tang Y, Zhang Y, Li G. Mining Tcga Data for Key Biomarkers Related to Immune Microenvironment in Endometrial Cancer by Immune Score and Weighted Correlation Network Analysis. Front Mol Biosci (2021) 8:645388. doi: 10.3389/fmolb.2021.645388
35. Yoshihara K, Shahmoradgoli M, Martinez E, Vegesna R, Kim H, Torres-Garcia W, et al. Inferring Tumour Purity and Stromal and Immune Cell Admixture From Expression Data. Nat Commun (2013) 4:2612. doi: 10.1038/ncomms3612
36. Mayakonda A, Lin DC, Assenov Y, Plass C, Koeffler HP. Maftools: Efficient and Comprehensive Analysis of Somatic Variants in Cancer. Genome Res (2018) 28(11):1747–56. doi: 10.1101/gr.239244.118
37. Langfelder P, Horvath S. Wgcna: An R Package for Weighted Correlation Network Analysis. BMC Bioinf (2008) 9:559. doi: 10.1186/1471-2105-9-559
38. Yu G, Wang LG, Han Y, He QY. Clusterprofiler: An R Package for Comparing Biological Themes Among Gene Clusters. OMICS (2012) 16(5):284–7. doi: 10.1089/omi.2011.0118
39. Friedman J, Hastie T, Tibshirani R. Regularization Paths for Generalized Linear Models via Coordinate Descent. J Stat Softw (2010) 33(1):1–22. doi: 10.18637/jss.v033.i01
40. Long J, Wang A, Bai Y, Lin J, Yang X, Wang D, et al. Development and Validation of a Tp53-Associated Immune Prognostic Model for Hepatocellular Carcinoma. EBioMedicine (2019) 42:363–74. doi: 10.1016/j.ebiom.2019.03.022
41. Liang JY, Wang DS, Lin HC, Chen XX, Yang H, Zheng Y, et al. A Novel Ferroptosis-Related Gene Signature for Overall Survival Prediction in Patients With Hepatocellular Carcinoma. Int J Biol Sci (2020) 16(13):2430–41. doi: 10.7150/ijbs.45050
42. Wang Z, Zhu J, Liu Y, Liu C, Wang W, Chen F, et al. Development and Validation of a Novel Immune-Related Prognostic Model in Hepatocellular Carcinoma. J Transl Med (2020) 18(1):67. doi: 10.1186/s12967-020-02255-6
43. Zeng F, Zhang Y, Han X, Zeng M, Gao Y, Weng J. Employing Hypoxia Characterization to Predict Tumour Immune Microenvironment, Treatment Sensitivity and Prognosis in Hepatocellular Carcinoma. Comput Struct Biotechnol J (2021) 19:2775–89. doi: 10.1016/j.csbj.2021.03.033
44. Chalmers ZR, Connelly CF, Fabrizio D, Gay L, Ali SM, Ennis R, et al. Analysis of 100,000 Human Cancer Genomes Reveals the Landscape of Tumor Mutational Burden. Genome Med (2017) 9(1):34. doi: 10.1186/s13073-017-0424-2
45. Sun J, Shi R, Zhang X, Fang D, Rauch J, Lu S, et al. Characterization of Immune Landscape in Papillary Thyroid Cancer Reveals Distinct Tumor Immunogenicity and Implications for Immunotherapy. Oncoimmunology (2021) 10(1):e1964189. doi: 10.1080/2162402X.2021.1964189
46. Hanzelmann S, Castelo R, Guinney J. Gsva: Gene Set Variation Analysis for Microarray and Rna-Seq Data. BMC Bioinf (2013) 14:7. doi: 10.1186/1471-2105-14-7
47. Subramanian A, Tamayo P, Mootha VK, Mukherjee S, Ebert BL, Gillette MA, et al. Gene Set Enrichment Analysis: A Knowledge-Based Approach for Interpreting Genome-Wide Expression Profiles. Proc Natl Acad Sci U States America (2005) 102(43):15545–50. doi: 10.1073/pnas.0506580102
48. Liberzon A, Birger C, Thorvaldsdottir H, Ghandi M, Mesirov JP, Tamayo P. The Molecular Signatures Database (Msigdb) Hallmark Gene Set Collection. Cell Syst (2015) 1(6):417–25. doi: 10.1016/j.cels.2015.12.004
49. Lambrechts D, Wauters E, Boeckx B, Aibar S, Nittner D, Burton O, et al. Phenotype Molding of Stromal Cells in the Lung Tumor Microenvironment. Nat Med (2018) 24(8):1277–89. doi: 10.1038/s41591-018-0096-5
50. Charoentong P, Finotello F, Angelova M, Mayer C, Efremova M, Rieder D, et al. Pan-Cancer Immunogenomic Analyses Reveal Genotype-Immunophenotype Relationships and Predictors of Response to Checkpoint Blockade. Cell Rep (2017) 18(1):248–62. doi: 10.1016/j.celrep.2016.12.019
51. Becht E, Giraldo NA, Lacroix L, Buttard B, Elarouci N, Petitprez F, et al. Estimating the Population Abundance of Tissue-Infiltrating Immune and Stromal Cell Populations Using Gene Expression. Genome Biol (2016) 17(1):218. doi: 10.1186/s13059-016-1070-5
52. Wu XN, Su D, Mei YD, Xu MQ, Zhang H, Wang ZY, et al. Identified Lung Adenocarcinoma Metabolic Phenotypes and Their Association With Tumor Immune Microenvironment. Cancer Immunol Immunother (2021) 70(10):2835–50. doi: 10.1007/s00262-021-02896-6
53. Wu J, Li L, Zhang H, Zhao Y, Zhang H, Wu S, et al. A Risk Model Developed Based on Tumor Microenvironment Predicts Overall Survival and Associates With Tumor Immunity of Patients With Lung Adenocarcinoma. Oncogene (2021) 40(26):4413–23. doi: 10.1038/s41388-021-01853-y
54. Liu Z, Lu T, Wang L, Liu L, Li L, Han X. Comprehensive Molecular Analyses of a Novel Mutational Signature Classification System With Regard to Prognosis, Genomic Alterations, and Immune Landscape in Glioma. Front Mol Biosci (2021) 8:682084. doi: 10.3389/fmolb.2021.682084
55. Xu F, Chen JX, Yang XB, Hong XB, Li ZX, Lin L, et al. Analysis of Lung Adenocarcinoma Subtypes Based on Immune Signatures Identifies Clinical Implications for Cancer Therapy. Mol Ther Oncolytics (2020) 17:241–9. doi: 10.1016/j.omto.2020.03.021
56. Xu Q, Xu H, Deng R, Li N, Mu R, Qi Z, et al. Landscape of Prognostic M6a Rna Methylation Regulators in Hepatocellular Carcinoma to Aid Immunotherapy. Front Cell Dev Biol (2021) 9:669145. doi: 10.3389/fcell.2021.669145
57. Li Y, Xiao J, Bai J, Tian Y, Qu Y, Chen X, et al. Molecular Characterization and Clinical Relevance of M(6)a Regulators Across 33 Cancer Types. Mol Cancer (2019) 18(1):137. doi: 10.1186/s12943-019-1066-3
58. Jiang P, Gu S, Pan D, Fu J, Sahu A, Hu X, et al. Signatures of T Cell Dysfunction and Exclusion Predict Cancer Immunotherapy Response. Nat Med (2018) 24(10):1550–8. doi: 10.1038/s41591-018-0136-1
59. Jimenez J, Doerr S, Martinez-Rosell G, Rose AS, De Fabritiis G. Deepsite: Protein-Binding Site Predictor Using 3d-Convolutional Neural Networks. Bioinformatics (2017) 33(19):3036–42. doi: 10.1093/bioinformatics/btx350
60. van der Leun AM, Thommen DS, Schumacher TN. Cd8(+) T Cell States in Human Cancer: Insights From Single-Cell Analysis. Nat Rev Cancer (2020) 20(4):218–32. doi: 10.1038/s41568-019-0235-4
61. Sanchez-Vega F, Mina M, Armenia J, Chatila WK, Luna A, La KC, et al. Oncogenic Signaling Pathways in the Cancer Genome Atlas. Cell (2018) 173(2):321–37 e10. doi: 10.1016/j.cell.2018.03.035
62. Goodman A, Patel SP, Kurzrock R. Pd-1-Pd-L1 Immune-Checkpoint Blockade in B-Cell Lymphomas. Nat Rev Clin Oncol (2017) 14(4):203–20. doi: 10.1038/nrclinonc.2016.168
63. Postow MA, Callahan MK, Wolchok JD. Immune Checkpoint Blockade in Cancer Therapy. J Clin Oncol: Off J Am Soc Clin Oncol (2015) 33(17):1974–82. doi: 10.1200/JCO.2014.59.4358
64. Gajewski TF, Schreiber H, Fu YX. Innate and Adaptive Immune Cells in the Tumor Microenvironment. Nat Immunol (2013) 14(10):1014–22. doi: 10.1038/ni.2703
65. Hinshaw DC, Shevde LA. The Tumor Microenvironment Innately Modulates Cancer Progression. Cancer Res (2019) 79(18):4557–66. doi: 10.1158/0008-5472.CAN-18-3962
66. Melaiu O, Lucarini V, Cifaldi L, Fruci D. Influence of the Tumor Microenvironment on Nk Cell Function in Solid Tumors. Front Immunol (2019) 10:3038. doi: 10.3389/fimmu.2019.03038
67. Liu G-M, Zeng H-D, Zhang C-Y, Xu J-W. Identification of a Six-Gene Signature Predicting Overall Survival for Hepatocellular Carcinoma. Cancer Cell Int (2019) 19(1):138. doi: 10.1186/s12935-019-0858-2
68. Wang S, Zhang Q, Yu C, Cao Y, Zuo Y, Yang L. Immune Cell Infiltration-Based Signature for Prognosis and Immunogenomic Analysis in Breast Cancer. Brief Bioinform (2020) 22(2):2020–31. doi: 10.1093/bib/bbaa026
69. Sui S, An X, Xu C, Li Z, Hua Y, Huang G, et al. An Immune Cell Infiltration-Based Immune Score Model Predicts Prognosis and Chemotherapy Effects in Breast Cancer. Theranostics (2020) 10(26):11938–49. doi: 10.7150/thno.49451
70. Fu H, Zhu Y, Wang Y, Liu Z, Zhang J, Xie H, et al. Identification and Validation of Stromal Immunotype Predict Survival and Benefit From Adjuvant Chemotherapy in Patients With Muscle-Invasive Bladder Cancer. Clin Cancer Res (2018) 24(13):3069–78. doi: 10.1158/1078-0432.CCR-17-2687
71. Zhou R, Zhang J, Zeng D, Sun H, Rong X, Shi M, et al. Immune Cell Infiltration as a Biomarker for the Diagnosis and Prognosis of Stage I-Iii Colon Cancer. Cancer Immunol Immunother (2019) 68(3):433–42. doi: 10.1007/s00262-018-2289-7
72. Carbonaro Sarracino D, Tarantal AF, Lee CC, Martinez M, Jin X, Wang X, et al. Effects of Vector Backbone and Pseudotype on Lentiviral Vector-Mediated Gene Transfer: Studies in Infant Ada-Deficient Mice and Rhesus Monkeys. Mol Ther (2014) 22(10):1803–16. doi: 10.1038/mt.2014.88
73. Di Pilato M, Kfuri-Rubens R, Pruessmann JN, Ozga AJ, Messemaker M, Cadilha BL, et al. Cxcr6 Positions Cytotoxic T Cells to Receive Critical Survival Signals in the Tumor Microenvironment. Cell (2021) 184(17):4512–30 e22. doi: 10.1016/j.cell.2021.07.015
74. Figliuolo da Paz V, Ghishan FK, Kiela PR. Emerging Roles of Disabled Homolog 2 (Dab2) in Immune Regulation. Front Immunol (2020) 11:580302. doi: 10.3389/fimmu.2020.580302
75. Adamson SE, Griffiths R, Moravec R, Senthivinayagam S, Montgomery G, Chen W, et al. Disabled Homolog 2 Controls Macrophage Phenotypic Polarization and Adipose Tissue Inflammation. J Clin Invest (2016) 126(4):1311–22. doi: 10.1172/JCI79590
76. Hocevar BA, Prunier C, Howe PH. Disabled-2 (Dab2) Mediates Transforming Growth Factor Beta (Tgfbeta)-Stimulated Fibronectin Synthesis Through Tgfbeta-Activated Kinase 1 and Activation of the Jnk Pathway. J Biol Chem (2005) 280(27):25920–7. doi: 10.1074/jbc.M501150200
77. Havel JJ, Chowell D, Chan TA. The Evolving Landscape of Biomarkers for Checkpoint Inhibitor Immunotherapy. Nat Rev Cancer (2019) 19(3):133–50. doi: 10.1038/s41568-019-0116-x
78. Flynn MJ, Sayed AA, Sharma R, Siddique A, Pinato DJ. Challenges and Opportunities in the Clinical Development of Immune Checkpoint Inhibitors for Hepatocellular Carcinoma. Hepatology (2019) 69(5):2258–70. doi: 10.1002/hep.30337
79. Duffy AG, Ulahannan SV, Makorova-Rusher O, Rahma O, Wedemeyer H, Pratt D, et al. Tremelimumab in Combination With Ablation in Patients With Advanced Hepatocellular Carcinoma. J Hepatol (2017) 66(3):545–51. doi: 10.1016/j.jhep.2016.10.029
80. Ramos-Casals M, Brahmer JR, Callahan MK, Flores-Chavez A, Keegan N, Khamashta MA, et al. Immune-Related Adverse Events of Checkpoint Inhibitors. Nat Rev Dis Primers (2020) 6(1):38. doi: 10.1038/s41572-020-0160-6
81. Lang X, Green MD, Wang W, Yu J, Choi JE, Jiang L, et al. Radiotherapy and Immunotherapy Promote Tumoral Lipid Oxidation and Ferroptosis via Synergistic Repression of Slc7a11. Cancer Discov (2019) 9(12):1673–85. doi: 10.1158/2159-8290.CD-19-0338
82. St Paul M, Ohashi PS. The Roles of Cd8(+) T Cell Subsets in Antitumor Immunity. Trends Cell Biol (2020) 30(9):695–704. doi: 10.1016/j.tcb.2020.06.003
83. Wang L, Hui H, Agrawal K, Kang Y, Li N, Tang R, et al. M(6) a Rna Methyltransferases Mettl3/14 Regulate Immune Responses to Anti-Pd-1 Therapy. EMBO J (2020) 39(20):e104514. doi: 10.15252/embj.2020104514
84. Phua SZF, Yang G, Lim WQ, Verma A, Chen H, Thanabalu T, et al. Catalase-Integrated Hyaluronic Acid as Nanocarriers for Enhanced Photodynamic Therapy in Solid Tumor. ACS Nano (2019) 13(4):4742–51. doi: 10.1021/acsnano.9b01087
85. Chan LS, Man OY, Kwok HH, Chen L, Chan KC, Lung HL, et al. The Wnt Modulator Icg001 Mediates the Inhibition of Nasopharyngeal Carcinoma Cell Migration in Vitro via the Mir150/Cd44 Axis. Int J Oncol (2019) 54(3):1010–20. doi: 10.3892/ijo.2018.4664
86. Lv Y, Xu C, Zhao X, Lin C, Yang X, Xin X, et al. Nanoplatform Assembled From a Cd44-Targeted Prodrug and Smart Liposomes for Dual Targeting of Tumor Microenvironment and Cancer Cells. ACS Nano (2018) 12(2):1519–36. doi: 10.1021/acsnano.7b08051
87. Wang S, Tian Y, Tian W, Sun J, Zhao S, Liu Y, et al. Selectively Sensitizing Malignant Cells to Photothermal Therapy Using a Cd44-Targeting Heat Shock Protein 72 Depletion Nanosystem. ACS Nano (2016) 10(9):8578–90. doi: 10.1021/acsnano.6b03874
88. Xu H, Niu M, Yuan X, Wu K, Liu A. Cd44 as a Tumor Biomarker and Therapeutic Target. Exp Hematol Oncol (2020) 9(1):36. doi: 10.1186/s40164-020-00192-0
89. Zent CS, Taylor RP, Lindorfer MA, Beum PV, LaPlant B, Wu W, et al. Chemoimmunotherapy for Relapsed/Refractory and Progressive 17p13-Deleted Chronic Lymphocytic Leukemia (Cll) Combining Pentostatin, Alemtuzumab, and Low-Dose Rituximab Is Effective and Tolerable and Limits Loss of Cd20 Expression by Circulating Cll Cells. Am J Hematol (2014) 89(7):757–65. doi: 10.1002/ajh.23737
Keywords: hepatocellular carcinoma, tumor immunological phenotype, immunotherapy efficacy, immune infiltration, prognosis, molecular docking
Citation: Tang Y, Guo C, Yang Z, Wang Y, Zhang Y and Wang D (2022) Identification of a Tumor Immunological Phenotype-Related Gene Signature for Predicting Prognosis, Immunotherapy Efficacy, and Drug Candidates in Hepatocellular Carcinoma. Front. Immunol. 13:862527. doi: 10.3389/fimmu.2022.862527
Received: 26 January 2022; Accepted: 22 March 2022;
Published: 12 April 2022.
Edited by:
Xian Zeng, Fudan University, ChinaReviewed by:
Lei Yang, Harbin Medical University, ChinaJianzhong Su, Wenzhou Medical University, China
Copyright © 2022 Tang, Guo, Yang, Wang, Zhang and Wang. This is an open-access article distributed under the terms of the Creative Commons Attribution License (CC BY). The use, distribution or reproduction in other forums is permitted, provided the original author(s) and the copyright owner(s) are credited and that the original publication in this journal is cited, in accordance with accepted academic practice. No use, distribution or reproduction is permitted which does not comply with these terms.
*Correspondence: Yongqiang Zhang, enlxMTAxNHp5cTEwMTRAMTYzLmNvbQ==; Dong Wang, ZHdhbmdAY2R1dGNtLmVkdS5jbg==
†These authors have contributed equally to this work