 Lisha Teng1,2,3,4†Lingling Shen1,2,3,4†Wenjun Zhao1,2,3,4Cuili Wang1,2,3,4Shi Feng1,2,3,4
 Yucheng Wang1,2,3,4Yan Bi1,2,3,4
 Song Rong5Nelli Shushakova5
 Hermann Haller5
 Jianghua Chen1,2,3,4
 Hong Jiang1,2,3,4*
- 1Kidney Disease Center, The First Affiliated Hospital, College of Medicine, Zhejiang University, Hangzhou, China
- 2Key Laboratory of Nephropathy, Hangzhou, China
- 3Institute of Nephropathy, Zhejiang University, Hangzhou, China
- 4Zhejiang Clinical Research Center of Kidney and Urinary System Disease, Hangzhou, China
- 5Department of Nephrology, Hannover Medical School, Hannover, Germany
Background: Acute rejection (AR) in kidney transplantation is an established risk factor that reduces the survival rate of allografts. Despite standard immunosuppression, molecules with regulatory control in the immune pathway of AR can be used as important targets for therapeutic operations to prevent rejection.
Methods: We downloaded the microarray data of 15 AR patients and 37 non-acute rejection (NAR) patients from Gene Expression Omnibus (GEO). Gene network was constructed, and genes were classified into different modules using weighted gene co-expression network analysis (WGCNA). Kyoto Encyclopedia of Genes and Genomes (KEGG) and Cytoscape were applied for the hub genes in the most related module to AR. Different cell types were explored by xCell online database and single-cell RNA sequencing. We also validated the SLAMF8 and TLR4 levels in Raw264.7 and human kidney tissues of TCMR.
Results: A total of 1,561 differentially expressed genes were filtered. WGCNA was constructed, and genes were classified into 12 modules. Among them, the green module was most closely associated with AR. These genes were significantly enriched in 20 pathway terms, such as cytokine–cytokine receptor interaction, chemokine signaling pathway, and other important regulatory processes. Intersection with GS > 0.4, MM > 0.9, the top 10 MCC values and DEGs in the green module, and six hub genes (DOCK2, NCKAP1L, IL2RG, SLAMF8, CD180, and PTPRE) were identified. Their expression levels were all confirmed to be significantly elevated in AR patients in GEO, Nephroseq, and quantitative real-time PCR (qRT-PCR). Single-cell RNA sequencing showed that AR patient had a higher percentage of native T, CD1C+_B DC, NKT, NK, and monocytes in peripheral blood mononuclear cells (PBMCs). Xcell enrichment scores of 20 cell types were significantly different (p<0.01), mostly immune cells, such as B cells, CD4+ Tem, CD8+ T cells, CD8+ Tcm, macrophages, M1, and monocytes. GSEA suggests that highly expressed six hub genes are correlated with allograft rejection, interferon γ response, interferon α response, and inflammatory response. In addition, SLAMF8 is highly expressed in human kidney tissues of TCMR and in M1 phenotype macrophages of Raw264.7 cell line WGCNA accompanied by high expression of TLR4.
Conclusion: This study demonstrates six hub genes and functionally enriched pathways related to AR. SLAMF8 is involved in the M1 macrophages via TLR4, which contributed to AR process.
Introduction
Kidney transplantation is the most optimal renal replacement therapy both for the quality and quantity of life that it provides and for cost effectiveness compared to classic maintenance dialysis for patients in end-stage renal disease (ESRD) (1, 2). The overall risk of acute rejection within 1 year after transplantation has been steadily decreasing to <15% with the introduction of several newer immunosuppressive agents. Nevertheless, short-term improvement in graft survival decreased since 2000, and disappointingly, long-term improvement remained unchanged (3–6). Timing of acute rejection (AR) and the number of episodes still remains a major risk factor for the development of chronic renal allograft failure (CAF), which is a major cause of late graft loss (7–9). AR consists of two distinct diseases: T-cell-mediated rejection (TCMR) characterized by arteritis, interstitial inflammation, and tubulitis, which is the main type in the first year of AR and antibody-mediated rejection (ABMR) refined to encompass histological evidence of capillaritis and serological evidence (10, 11). However, as far as we know, the pathophysiology of AR is multifactorial and still not fully defined. Therefore, there is a continuing need to screen new biomarkers for the diagnosis and treatment of allograft rejection after kidney transplantation.
Transcriptional genomic information to acute allograft rejection after renal transplantation has shed new light on our understanding of the pathogenesis (12). Weighted gene co-expression network analysis (WGCNA) has been applied to many important studies such as cancer (13, 14), autoimmune diseases (15, 16), and neurodegenerative diseases (17, 18) since its introduction in 2005. WGCNA can potentially identify the gene network significantly involved in AR, and hub gene in estimating network structures can improve the performance of the predicting biological processes and gene regulation to get deep understanding of its pathogenesis (19). Two recent studies identified several genes associated with kidney transplant rejection via WGCNA based on peripheral blood lymphocytes (PBLs) or peripheral blood (PB) (20, 21). Nevertheless, there are few relative studies on kidney transplantation based on percutaneous allograft biopsy.
Due to the latest advances in basic science, macrophages serve as crucial mediators of acute and chronic allograft immunopathology. It is well known that macrophages can trigger an adaptive immune response, persist T-cell-mediated rejection and antibody-mediated rejection, and promote allograft fibrosis (22). Renal macrophages exhibit a pro-inflammatory phenotype signature for interferon gamma (IFNγ) activated and secrete a variety of cytokines, which can activate endothelial cells and promote the production of cytotoxic T cells during acute TCMR associated with poor allograft outcomes (23, 24). Therefore, macrophages have important effects on transplantation results. However, the exact mechanisms controlling macrophage functions are not yet completely understood.
In this study, by using WGCNA-based methods, we downloaded the Gene Expression Omnibus database GSE138043 and screened six hub genes related to the AR. Kyoto Encyclopedia of Genes and Genomes (KEGG) enrichment analysis was performed to reveal pathways in target module, which possibly influence the pathogenesis of AR, and Gene Set Enrichment Analysis (GSEA) was performed to show enrichment results of differentially expressed genes in six hub genes high-expression groups. In addition, we utilized PBMC from patient in whom acute rejection occurred after surgery in our hospital to validate six hub genes. We performed single-cell RNA sequencing to further study the cell types changes related to AR. The AR patient had a higher percentage of native T, CD1C+_B DC, NKT, NK, and monocytes. Immunohistochemistry of SLAMF8 revealed that SLAMF8+ cells infiltrated in the human allograft tissue in AR. We constructed Immunofluorescence staining of SLAMF8 and TLR4 to validate that SLAMF8 was involved in the pro-inflammatory macrophages via TLR4, which contributed to AR process in vivo and in vitro.
Materials and Methods
Data Collection and Preprocessing
We downloaded mRNA expression profiles of human AR from the Gene Expression Omnibus (GEO) database. In our study, GSE138043 was used to construct co-expression networks and identify hub genes related to AR. The microarray dataset provided gene expression profile in the percutaneous allograft biopsy from 15 AR patients and 37 NAR (25). According to the data processing information of GSE138043, each dataset was normalized independently using Robust Multiarray Average (RMA) followed by log2 transformation and quantile normalization. Data from GSE50058 and GSE343 were used for hub genes validation. In the GSE50058 dataset, 42 AR patients and 58 STA individuals were recruited, and the RNA was extracted from their renal allograft biopsy. In the GSE343 dataset, the total RNA was extracted from the kidney tissue of 25AR patients and 15 NAR. Supplementary Table S5 shows the summary of discovery and validation microarray data sets of clinical biopsy samples from kidney transplants.
Differentially Expressed Genes Screening
“limma” R package was utilized to the differentially expressed screen genes (DEGs) between AR and NAR in the expressing data. The genes with adjusted p-value <0.05 were selected as having significant change. “ggplot2” and “pheatmap” were used respectively to paint the volcano plot and heatmap of all DEGs.
Construction of Co-expression Network
The co-expression network of the genes was constructed based on GSE138043 microarray dataset by the R package “WGCNA.” The soft-thresholding power that we chose was 17 when 0.9 was used as the correlation coefficient threshold. We defined 0.25 as the threshold for cut height to merge possible similar modules.
Functional Enrichment Analysis
To obtain further insights into the function of the target module most related to AR, we referred to the Database for Annotation, Visualization and Integrated Discovery (DAVID) (https://david.ncifcrf.gov/) to perform the KEGG enrichment analysis. The results were shown graphically by the R package “ggplot2.”
Hub Genes Identification
The green module, which was most significantly related to AR, was imported into Cytoscape with their weighted correlations. We identified the hub gene with the following criteria: (1) DEGs in green module; (2) gene significance (GS) > 0.4 and module membership (MM) > 0.9; (3) and top 10 Maximal Clique Centrality (MCC)value calculated by the Cytohubba package in Cytoscape v3.8.2.
Single-Cell RNA Sequencing
A 10X Genomics Chromium machine was used for single-cell capture and cDNA preparation following manufacture’s instruction. Chromium™ Single Cell 3′ Solution was used to perform reverse transcription on gel bead in emulsion, followed by cDNA cleanup and amplification. The cDNA is digested and broken into fragments of about 200–300 bp, followed by the traditional second-generation sequencing library construction process, and PCR amplification is performed to obtain a DNA library. Illumina sequencing platform of paired-end sequencing mode was used to perform high-throughput sequencing on the established library. Sequence data were processed with Cell Ranger V2.1.0 (10X Genomics).
Quality Control
Then, quality control was performed to filter low-quality cells. For 10X-derived datasets, we only retained cells that had (1) genes more than 200 and <6,000, (2) UMIs more than 500 and <40,000, and (3) <15% of reads mapped to mitochondrial genes.
Clinical Validation
The Nephroseq v5 online database (http://v5.nephroseq.org/), an integrated data-mining platform for gene expression data sets of kidney diseases, was adopted to validate the correlation between the hub genes and clinical manifestations of AR by Spearman rank correlation coefficient analysis. A p-value of <0.05 was considered statistically significant. r>0.6 was considered strong correlation, and 0.4<r<0.6 was considered medium intensity correlation.
Cell Types Analysis
The xCell (https://xcell.ucsf.edu/), which is a webtool that performs cell-type enrichment analysis from gene expression data for 64 immune and stroma cell types, was adopted to reveal different infiltrating cell types between AR and NAR, and adjusted p-value < 0.01 was chosen as the cutoff criterion. Cell-type enrichment score is shown in Supplementary Table S3. To further explore the six hub genes expression in 76 single cell types, we obtained RNA expression values per cell types from Human Protein Atlas Dataset (proteinatlas.org). Single cell-type clusters were normalized separately from other transcriptomics datasets using trimmed mean of M values (TMM). To generate expression values per cell type, clusters were aggregated per cell type by first calculating the mean nTPM in all cells with the same cluster annotation within a dataset.
Gene Set Enrichment Analysis
To further explore the potential function of the selected hub genes in AR, we used gene set enrichment analysis (GSEA_4.1.0) for single hub gene. In the dataset GSE138043, samples were divided into two groups according to the median expression level of hub genes. The h.all.v6.2.sytmbols.gmt in Molecular Signatures Database (MSigDB) was selected as the reference gene set, and adjusted p-value <0.05 was considered significantly different. The results were showed graphically by the R package “ggplot2.”
Cell Culture
The Raw264.7 cells were cultured in Dulbecco’s modified Eagle’s medium (DMEM) High Glucose (11965084, Gibco) containing 10% fetal bovine serum (FBS) (12103C, Sigma) and 1% penicillin–streptomycin (15070063,Gibco), incubated at 37°C in a humidified atmosphere containing 5% CO2, and routinely passaged every 1 or 2 days. To induce RAW264.7 cell line to M1/M2 phenotypes, 105 Raw264.7 cell were seeded in six-well plates 24 h before exposed to IFN-γ (20 ng/ml) + lipopolysaccharide (LPS) (10 ng/ml) to M1 phenotype, and IL-4 (10 ng/ml) to M2 phenotype for 24 h.
Bone-Marrow-Derived Macrophages Isolation and Culture
Isolation and culture of bone-marrow-derived macrophages (BMDMs) were described by Pineda-Torra et al. (26). In brief, bone marrow was flushed out from the femurs and tibias, cultured and differentiated for 7 days in 1640 supplemented with 10% heat-inactivated FBS and 1% penicillin–streptomycin with macrophage-stimulating factor (M-CSF) (50 ng/ml) at 37°C in a humidified incubator with 5% CO2.
Flow Cytometry to Measure Macrophage Polarization
Flow cytometry was used to measure the phenotypical changes in Raw264.7 macrophages. Single-cell suspension is prepared before staining with fluorochrome-labeled anti-CDF4/80 (clone BM8, BioLegend, San Diego, CA, USA), anti-CD80 (clone 16-10A1, eBioscience, San Diego, CA, USA). Data were analyzed using FlowJo v.10 (Treestar, Ashland, OR).
Blood Sample and the Percutaneous Allograft Biopsy Collection
Research involving human participants was reviewed and approved by the Research Ethics Committee of the First Affiliated Hospital of Zhejiang University School of Medicine. Patients/participants (or their close relatives) provided written informed consent to participate in this study. Peripheral blood mononuclear cell (PBMC) was isolated within 3 h after collection. Percutaneous allograft biopsy was collected and fixed with 4% formalin for paraffin embedding. Biopsies were scored by the revised Banff 2019 classification of renal allograft pathology; rejection cases here were TCMR including borderline cases. Supplementary Table S6 showed the characteristics of the samples used in this study.
RNA Extraction and Real-Time Quantitative PCR
Total RNA was extracted from cultured cells and peripheral blood mononuclear cells (PBMCs) by Trizol reagent (Invitrogen, CA, USA). cDNA was prepared using the PrimeScriptTM RT Reagent Kit with gDNA Eraser (No. RR047A, Takara, Shiga, Japan) following the manufacturer’s protocol. Real-time PCR was run using SYBR Green and CFX96™ Real-Time PCR Detection Systems (Bio-Rad, CA, USA). The mRNA levels of selected genes were calculated after normalization to β-actin by using the 2−ΔΔCt method according to the manufacturer’s protocol. All primer sequences used are shown in Supplementary Table S4.
Immunohistochemistry
Immunohistochemistry (IHC) was performed following standard protocol. Briefly, after being dewaxed and rehydrated, the 2-μm paraffin-embedded sections were incubated with Anti-BLAME Polyclonal Antibody (bs-2473R, Bioss, Boston, MA, USA). After washing, the sections were incubated with the horseradish-peroxidase-labeled anti-mouse/rabbit IgG polymer (GK500710, GeneTech, South San Francisco, CA, USA) and diaminobenzidine. The sections were then counterstained with hematoxylin, dehydrated, and cleared. Six random fields of each section were photographed, and the staining was semi-quantified using the National Institutes of Health Image J by an investigator blinded to the experimental protocol.
Immunofluorescence Assessment of Cultured Raw264.7
Coverslips containing RAW264.7 or BMDMs were fixed with 4% paraformaldehyde for 15 min and blocked in phosphate-buffered saline (PBS) containing 0.1% Triton X-100 and 3% bovine serum albumin(BSA) for 30 min at room temperature prior to incubation with Anti-BLAME Polyclonal Antibody (bs-2473R, Bioss), TLR4 antibody (sc-293072, Santa Cruz) overnight in a humidified chamber at 4°C. Slips were incubated with secondary antibody Alexa Fluor 594-conjugated anti-rabbit IgG (1:500) and Alexa Fluor 488-conjugated anti-mouse IgG (1:500) 1 h at 37°C. Sections were then examined by immunofluorescence microscopy (Leica DMLB, Wetzlar, Germany).
Western Blotting
Total RAW264.7 cells were lysed in radioimmunoprecipitation assay (RIPA) cell lysis buffer following separated by sodium dodecyl sulfate–polyacrylamide gel electrophoresis (SDS-PAGE) and transferred to 0.22-μm polyvinylidene fluoride membranes (Millipore, Burlington, MA, USA). Blocked with 5% milk and incubated with the inducible nitric oxide synthase (iNOS) antibody (ab178945, Abcam, Cambridge, UK) at 4°C overnight. Protein was visualized using secondary anti-rabbit IgG or anti-mouse IgG (Sigma) with conjugated horseradish peroxidase and chemiluminescent substrate (Millipore, Billerica, MA, USA).
Statistical Analysis
The statistical significance differences between the two groups were analyzed using non-parametric test or t-test based on data distribution characteristics. All analyses were conducted using software R4.1.0. A p-value < 0.05 was considered statistically significant.
Results
Differentially Expressed Genes Between AR and Non-AR Controls
Kidney transcriptome data from GSE138043 containing 15 AR patients (rejection at 12 months post-renal transplant) and 37 NAR (non-rejection at 12 months post-renal transplant) was used for further analysis. We identified 1,561 DEGs (differential genes, adjusted p-values < 0.05) between the AR and NAR groups. Among 1,561 DEGs, 541 genes were upregulated, while 1,020 genes were downregulated. All genes are displayed in volcano plot in Figure 1A, and DEGs are listed in Supplementary Table S1. Additionally, the red plots represent adjusted p < 0.01, orange plots represent log2FC > 1, and green plots that were annotated represent both. Unsupervised clustering hierarchy was used in heatmap (Figure 1B).
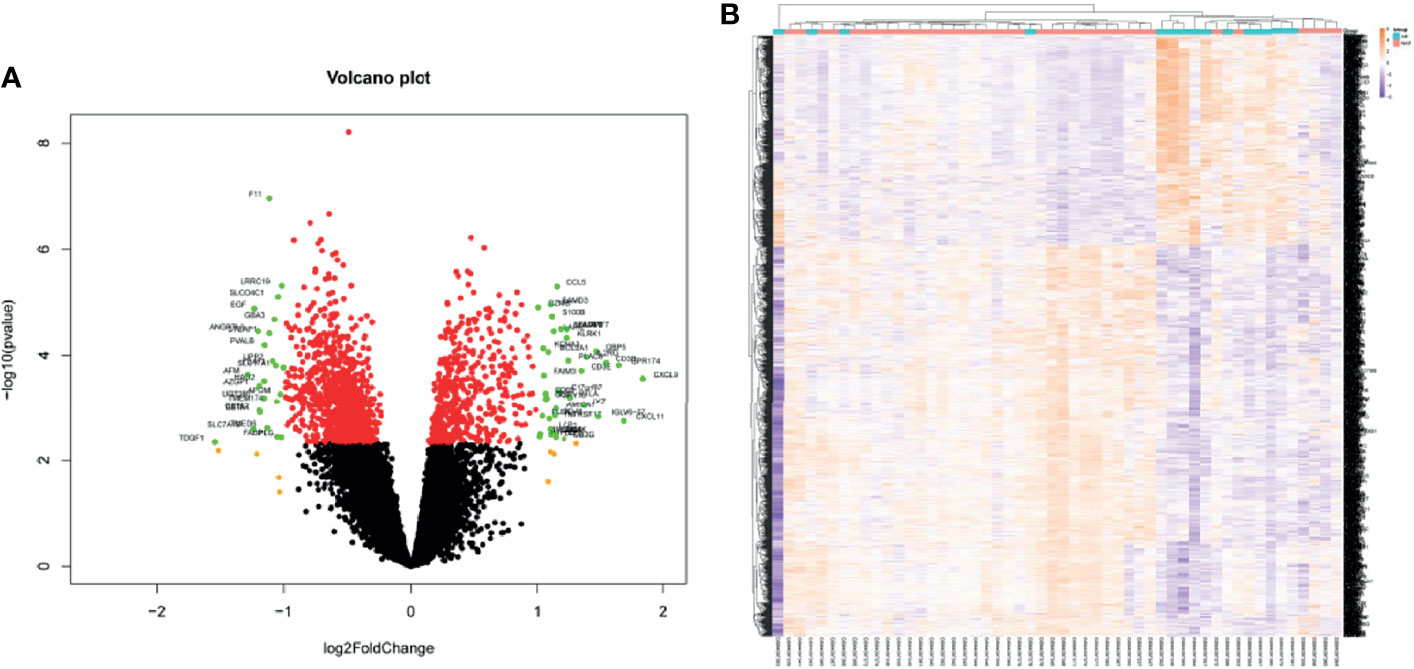
Figure 1 Screening for differentially expressed genes in the percutaneous allograft biopsy of 15 AR patients than NAR from GSE138043. (A) Differential genes in volcano plot. Red plots of adjusted p<0.01, orange plots of log2FC>1, green plots of both. (B) The clustering of differential genes in heatmap. The color in the heatmap represents the log2 expression values. Text on the right of heatmap indicates the enriched gene ontology terms for each cluster of genes. AR, rejection at 12 months post-renal transplant; NAR, non-rejection at 12 months post-renal transplant.
Weighted Co-expression Network Construction
WGCNA package was applied to compile the network. Keeping to the scale-free topology criterion, β = 17 was considered in this study for which the fit index curve flattens out upon reaching a high value (>0.9) and the mean connectivity ≤100 (Figure 2A). Hierarchical clustering was used to generate a hierarchical clustering dendrogram of genes; meanwhile, Dynamic Tree Cut R library was used for detecting clusters. As shown in Figures 2B–D, 12 distinct gene modules (M1–12) were defined, as MEDissThres was set to 0.25 to merge similar modules. Genes failing to fit within a distinct group were assigned to the gray module. The interaction relationships of 1,000 randomly selected genes were presented in the network heatmap (Supplementary Figure S1A).The genes in the same module were highly correlated, while they were weakly correlated to those in other modules. Thus, the reliability of the modules was verified.
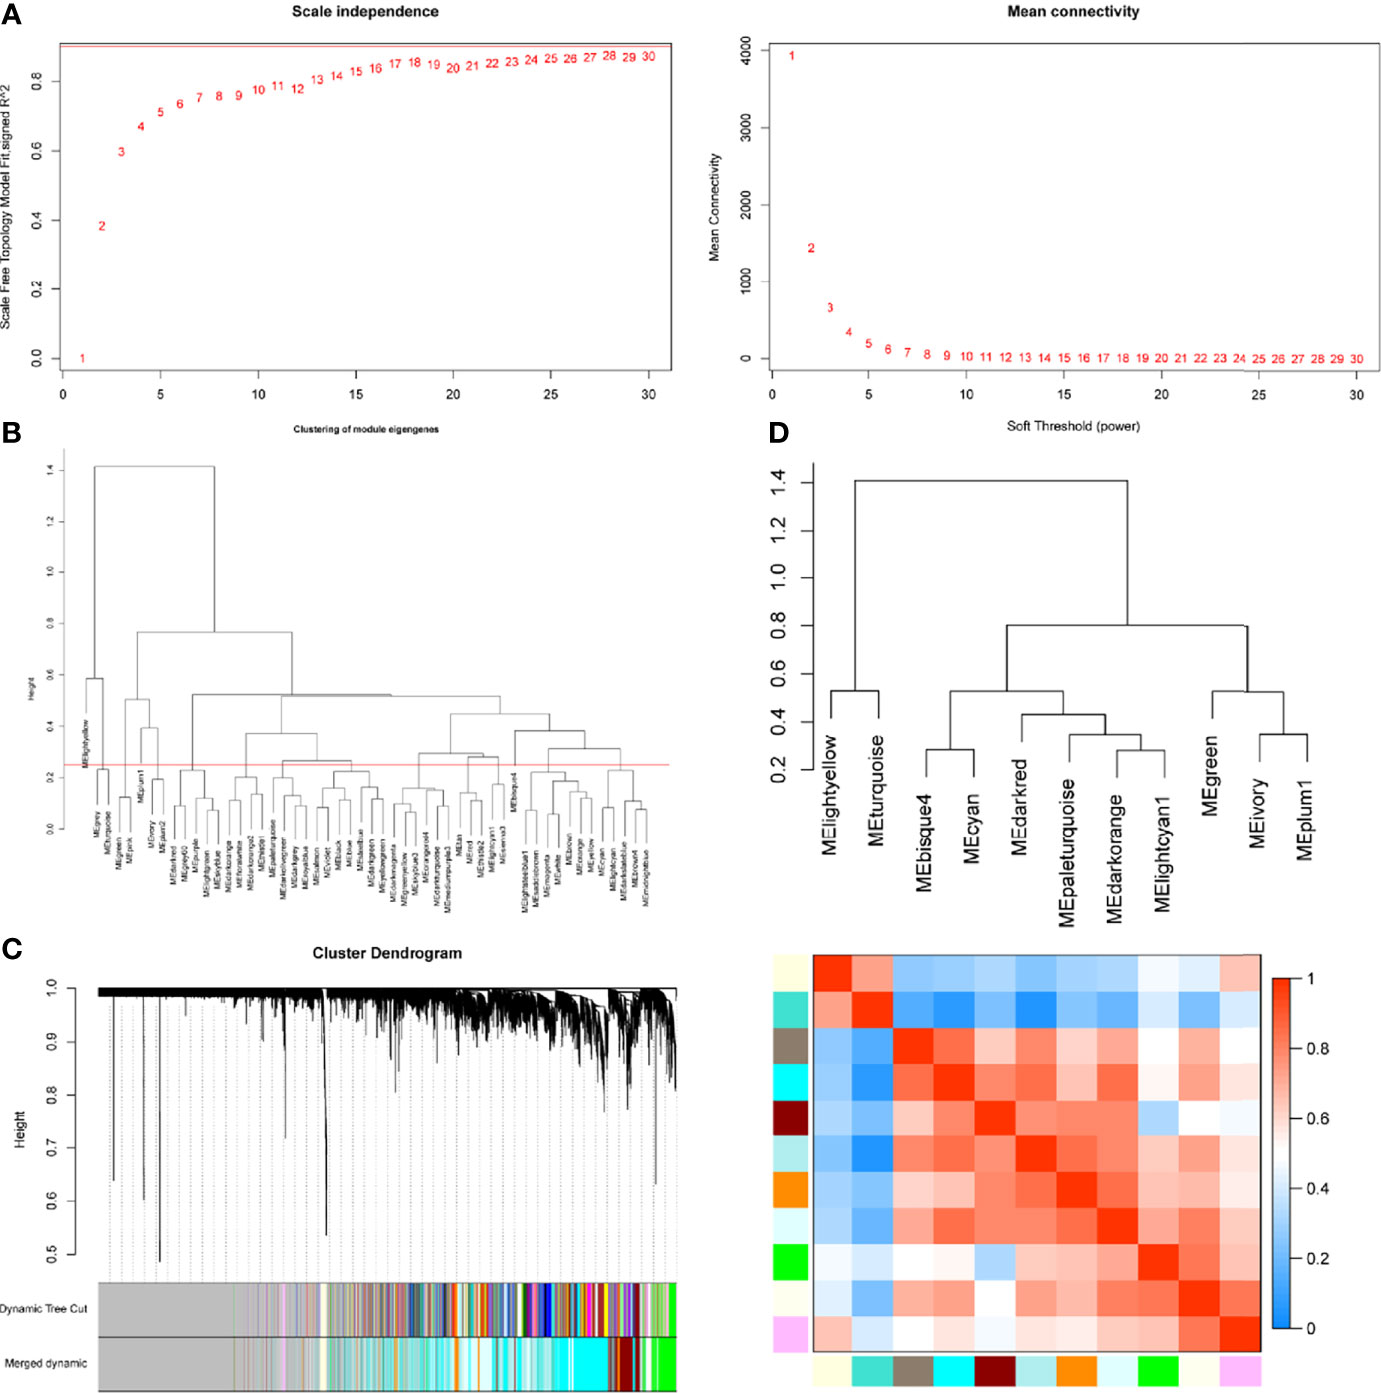
Figure 2 Determination of soft-threshold power in the WGCNA. (A) Left: Analysis of the scale-free topology model fit for various soft-threshold powers (β). Right: Analysis of the mean connectivity for various soft-threshold powers. (B) Clustering of module eigengenes. The red line represents MEDissThres=0.25. (C) Dendrogram of all differentially expressed genes clustered based on the measurement of dissimilarity (1-TOM). The branches correspond to modules of highly interconnected groups of genes. (D) The cluster dendrogram and adjacency heatmap of eigengenes.
Identification of meta-modules and Hub Genes associated with AR
Module-trait correlations analyses showed that multiple modules were related to AR (Figure 3A) The summary of significance of all genes in each module related to AR is shown in Figure 3B. Clearly, the green module was most significantly related to AR, followed by the turquoise module. Figure 3C shows the significance of these genes in the green module for AR (cor = 0.35, p = 2.4e−22). To investigate the potential biological function of genes in the green modules, we performed KEGG enrichment analysis. The top 20 pathways terms of green module are shown in Figure 3D. We found that genes in green modules played roles in cytokine–cytokine receptor interaction, chemokine signaling pathway, cell adhesion molecules (CAMs), tuberculosis, and other important regulatory processes. To identify hub genes in the target module, we calculated the MCC values via Cytohubba and constructed a network based on the top 10 genes (Supplementary Table S2). The module was visualized using Cytoscape 3.8 software (Figure 3E). The node colors coded from yellow to red (low to high) correspond to the top 10 MCC values from low to high. In intersection with GS > 0.4, MM > 0.9, and DEGs in the green module, six genes were regarded as the hub genes(Figure 3F), including dedicator of cytokinesis 2 (DOCK2), NCK-associated protein 1 like (NCKAP1L), interleukin 2 receptor subunit gamma (IL2RG), SLAM family member 8 (SLAMF8), CD180 molecule (CD180), and protein tyrosine phosphatase receptor type E (PTPRE). Relative mRNA expression of six hub genes in GSE138043 is shown in Figure 1B.
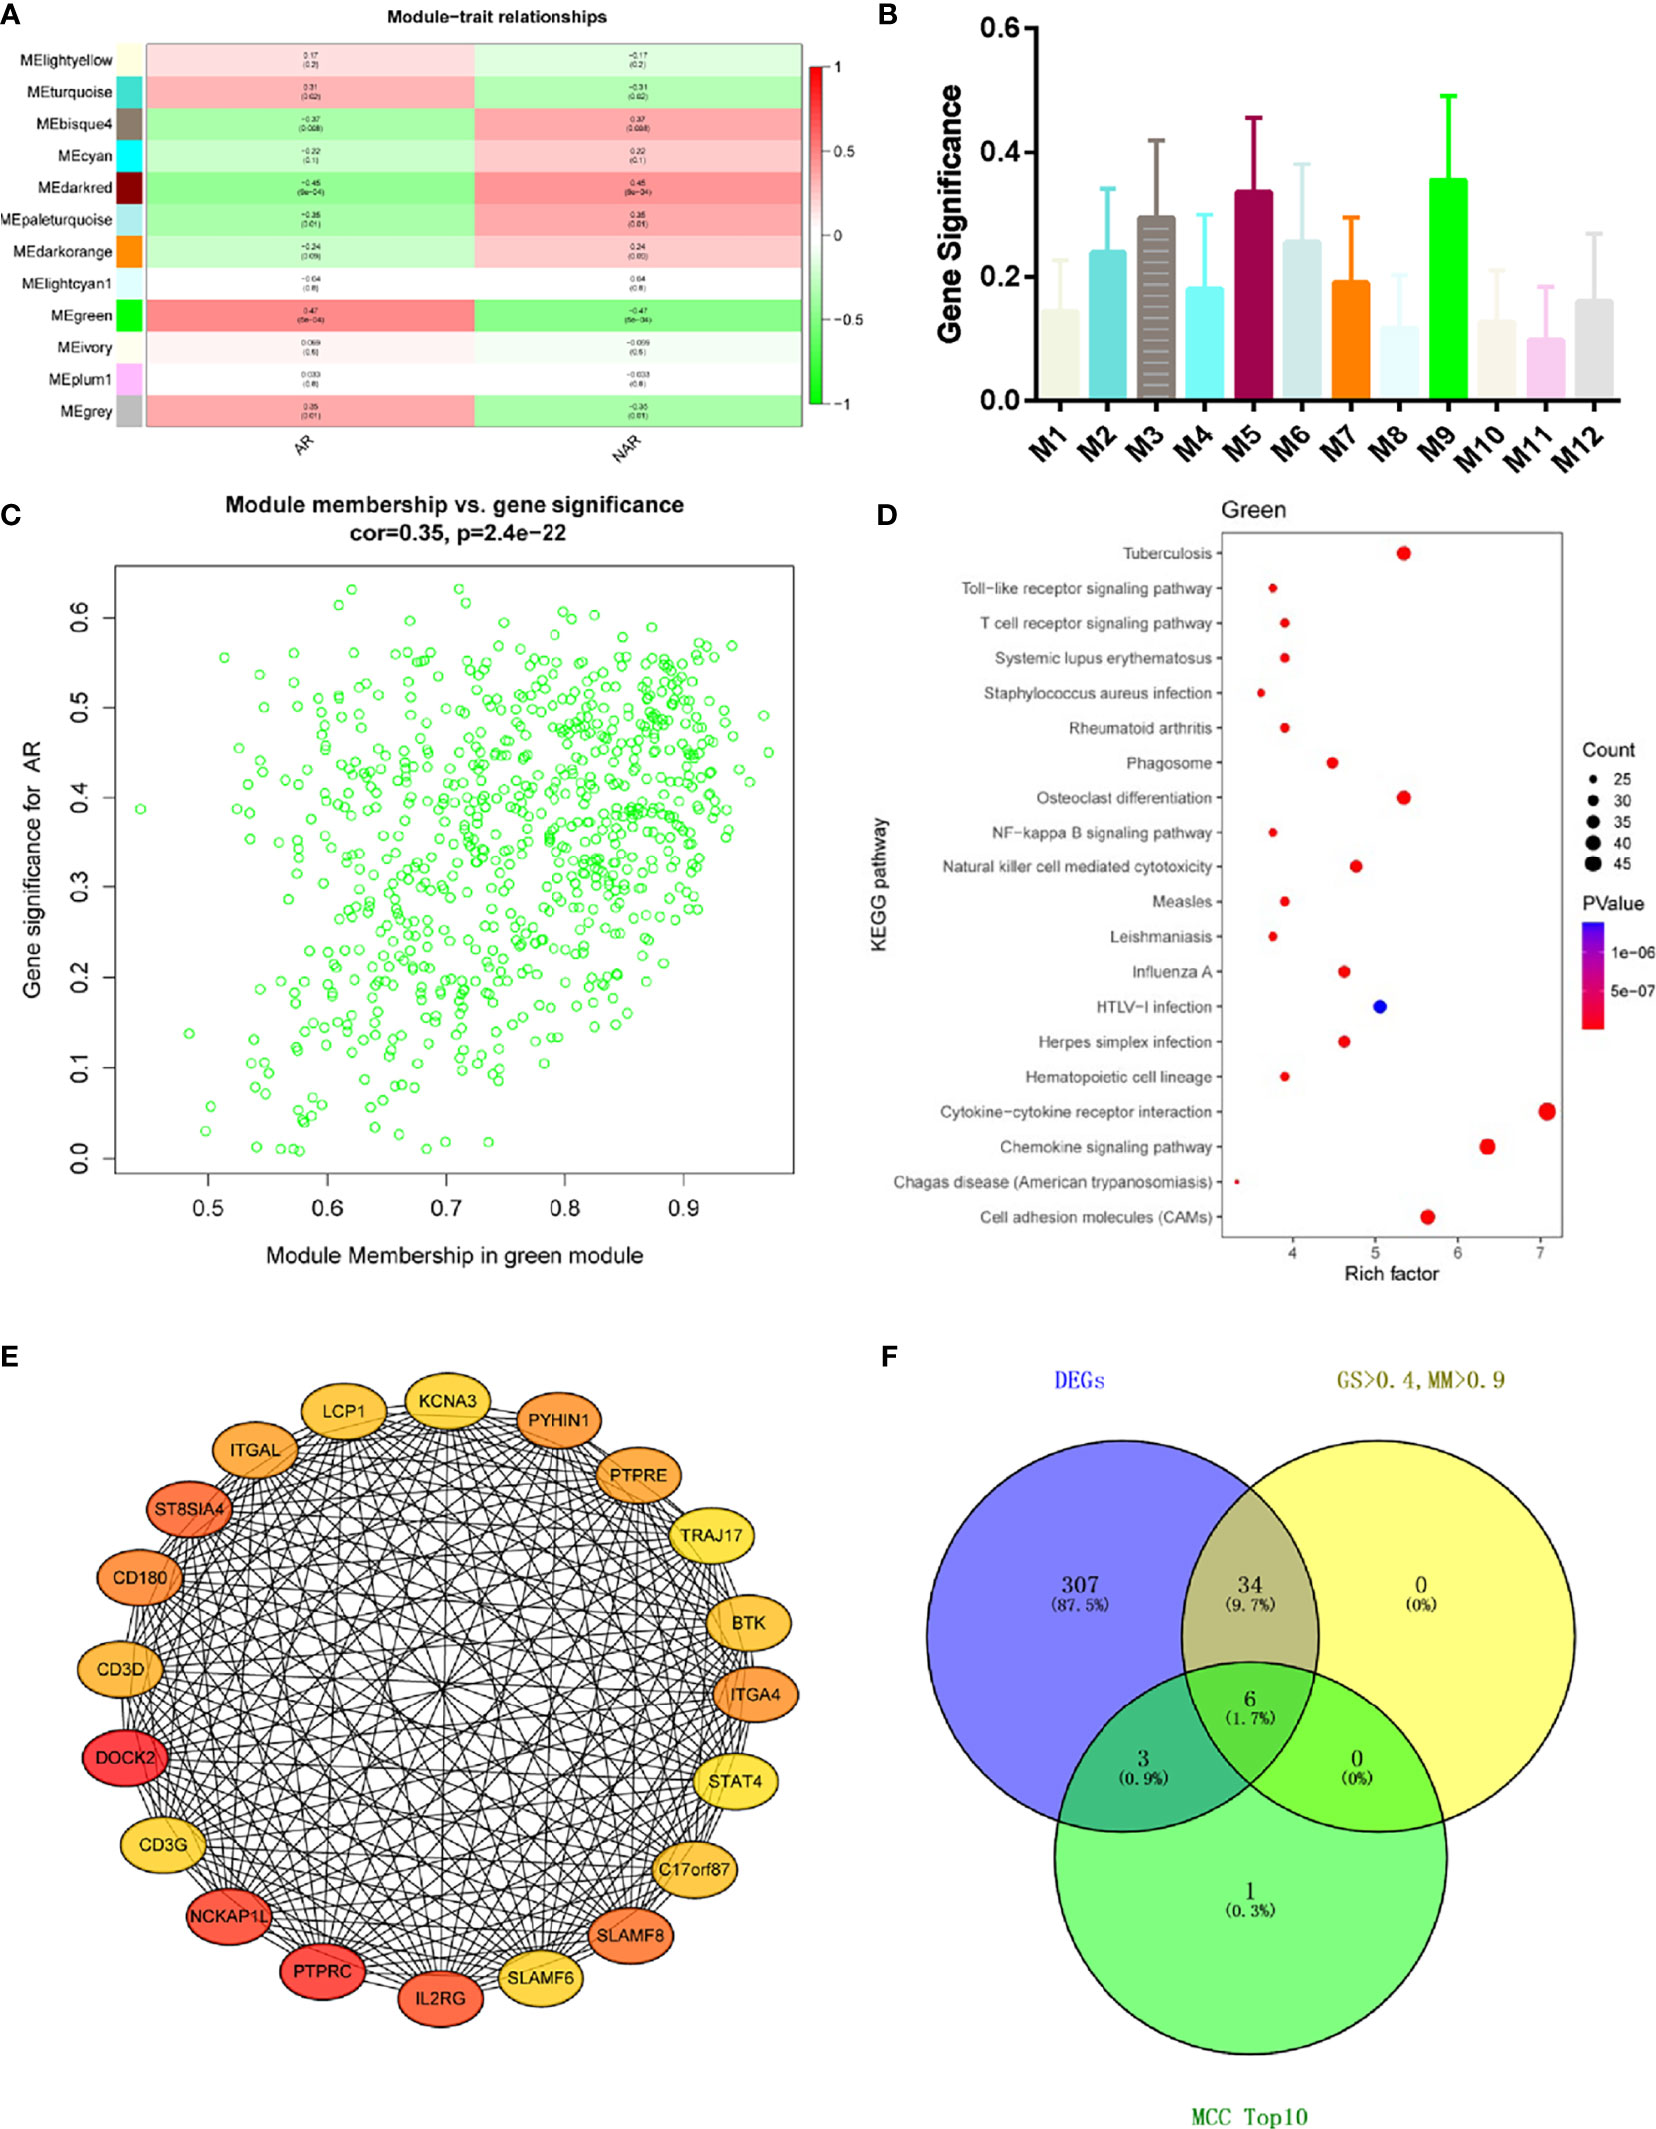
Figure 3 WGCNA revealed gene co-expression networks and the key genes in the percutaneous allograft biopsy of 15 AR patients. (A) Heatmap of the correlation between the module eigengenes and clinical traits of AR. We selected the green block for subsequent analysis. (B) Module significance values of those co-expression modules associated with SS (module significance value indicated the summary of gene significance of all genes in each module, and different colors of column indicated different modules). (C) The gene significance for AR in the green module (one dot represents one gene). (D) Top 20 pathways from Kyoto Encyclopedia of Genes and Genomes enrichment analysis. The x-axis represents KEGG enrichment scores, and the y-axis represents pathway terms. The colors of circle indicate p-values, and the size of circle indicates the numbers of differential RNAs. The redder and larger circle indicates that the enrichment of the pathway is higher and differential RNAs number is larger in the pathway. (E) Interaction of gene co-expression patterns in the green module. Each node corresponds to a gene. Colors from yellow to red correspond to the top 10 maximal clique centrality (MCC) values from low to high. (F) Identification of the hub gene in the intersection of MCC TOP10, DEGs, and GS > 0.4, and MM > 0.9.
GEO, Clinical, and qRT-PCR Validation
As expected, the expression levels of hub genes including DOCK2, NCKAP1L, IL2RG, SLAMF8, CD180, and PTPRE were significantly upregulated in AR samples from the GSE50058 dataset (Figure 4A). For verifying hub genes, we obtained another dataset, GSE343, and analyzed the expression levels of the above five genes except for SLAMF8, which was not found in this dataset between AR patients and STA patients (Figures 4B). The expression of these genes was also upregulated in AR samples. We used the Nephroseq v5 online database to explore the correlation between the expression of IL2RG and clinical traits of AR. As shown, there was a positive correlation between the expression of IL2RG in AR with the Banff pathological grading of transplanted kidney (r=0.6540, p<0.0001) (Figure 4C).Correlation between the expression of DOCK2 in AR and the Banff pathological grading is shown in Supplementary Figure S1C (r=0.4863, p<0.0035).
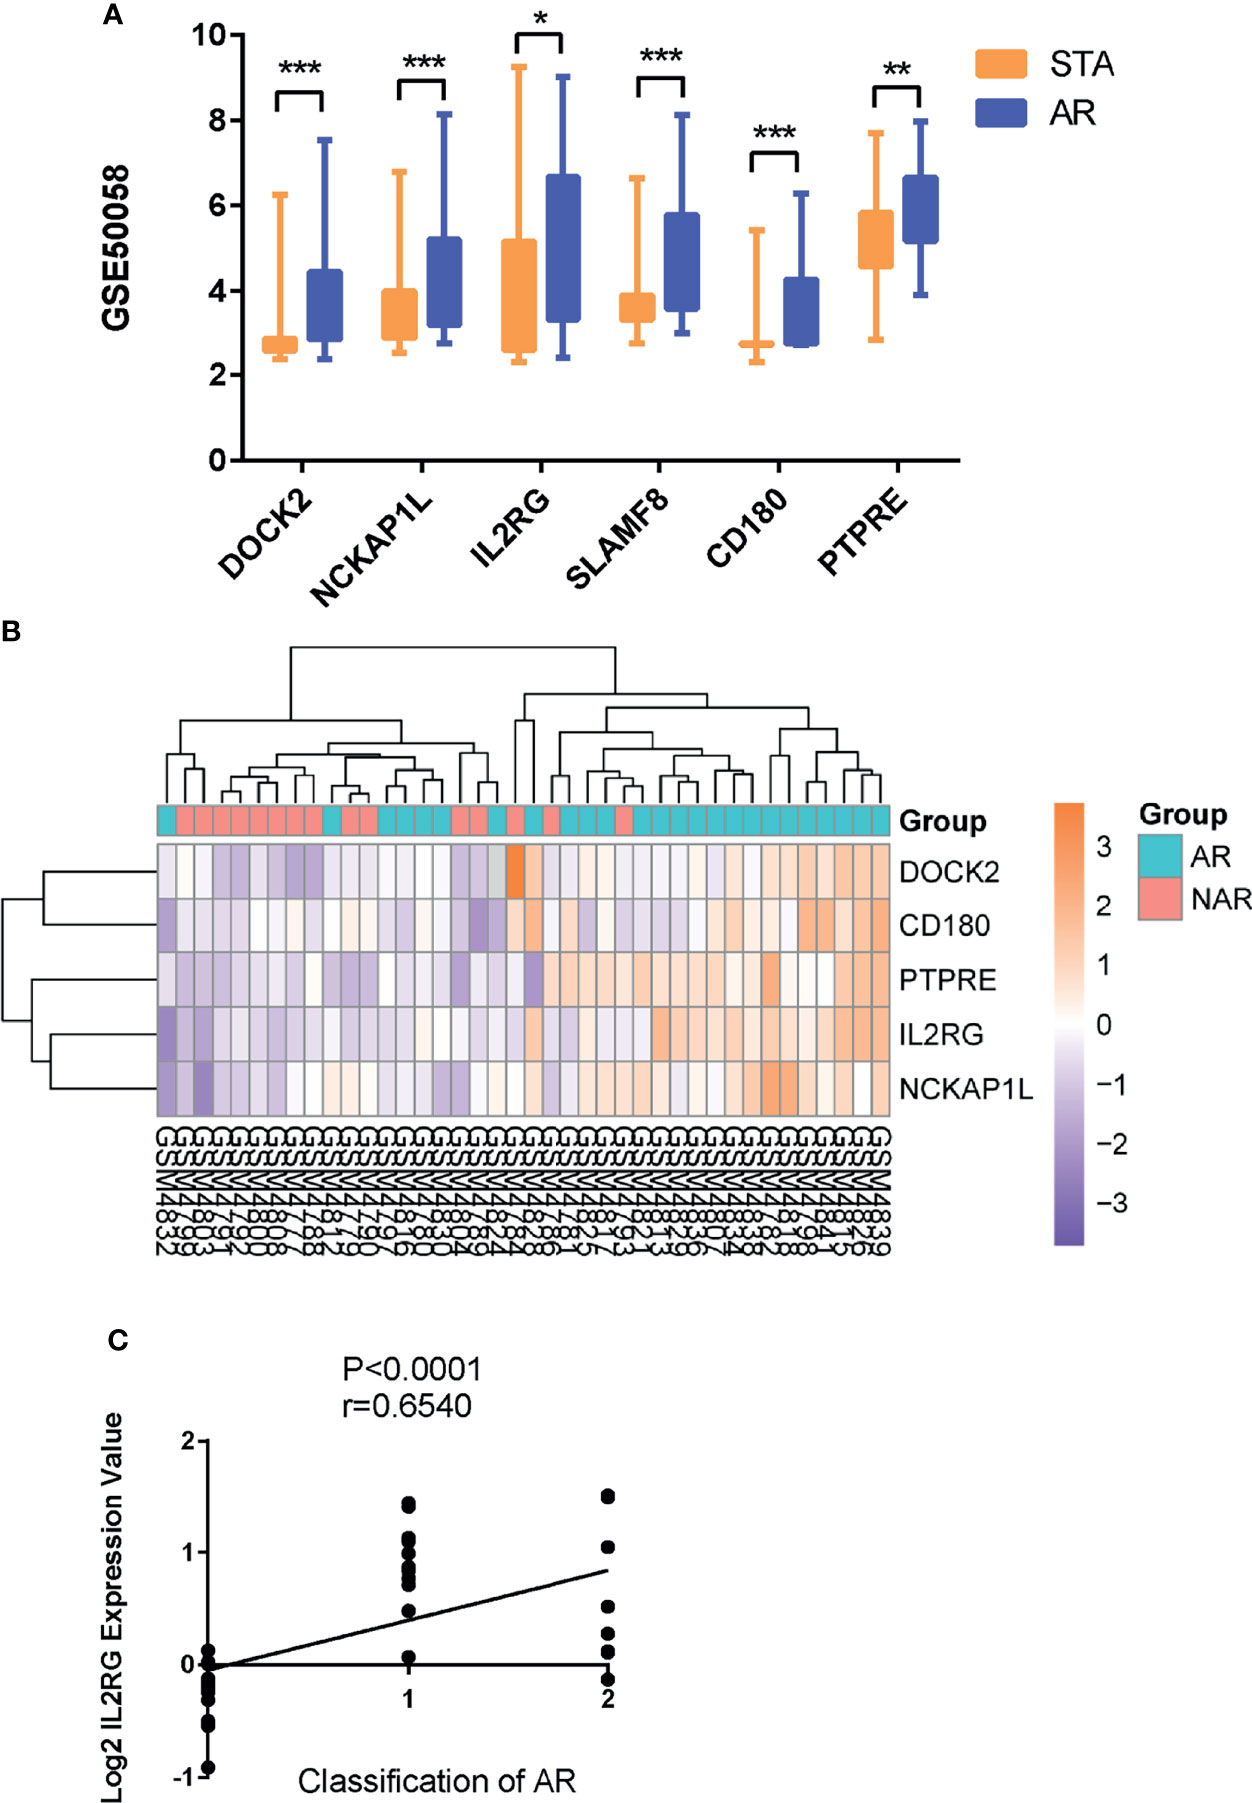
Figure 4 GEO and clinical validation. (A) Expression levels of DOCK2, NCKAP1L, IL2RG, SLAMF8, CD180, and PTPRE were significantly upregulated in the renal allograft biopsy of AR patient in dataset GSE50058. (B)The clustering of five hub genes in heatmap of dataset GSE343. (C) Correlation between the expression of IL2RG in AR with the Banff pathological grading of transplanted kidney. STA, stable patients; AR, patient with acute rejection. *p < 0.05, **p < 0.01, ***p < 0.0001.
To study the transcriptional changes related to AR further, we performed single-cell RNA sequencing in P1 (patient PBMCs of acute rejection post renal transplant) and C1 (control patient of stable kidney function post renal transplant). The patient had a higher percentage of native T, CD1C+_B DC, NKT, NK, and monocytes in P1 compared with C1 (Figures 5A–C). Expression of DOCK2, NCKAP1L, IL2RG, SLAMF8, CD180, and PTPRE (colored single cells) on UMAP plot projecting PBMCs from P1 and C1 are shown in Supplementary Figure S2. In addition, to further validate these six hub genes, we collected PBMCs from eight non-AR and 10 AR patients to perform qRT-PCR. The results showed that compared with NAR group, the mRNA levels of DOCK2, NCKAP1L, IL2RG, SLAMF8, CD180, and PTPRE were all significantly elevated in AR patients (Figures 5D–I).
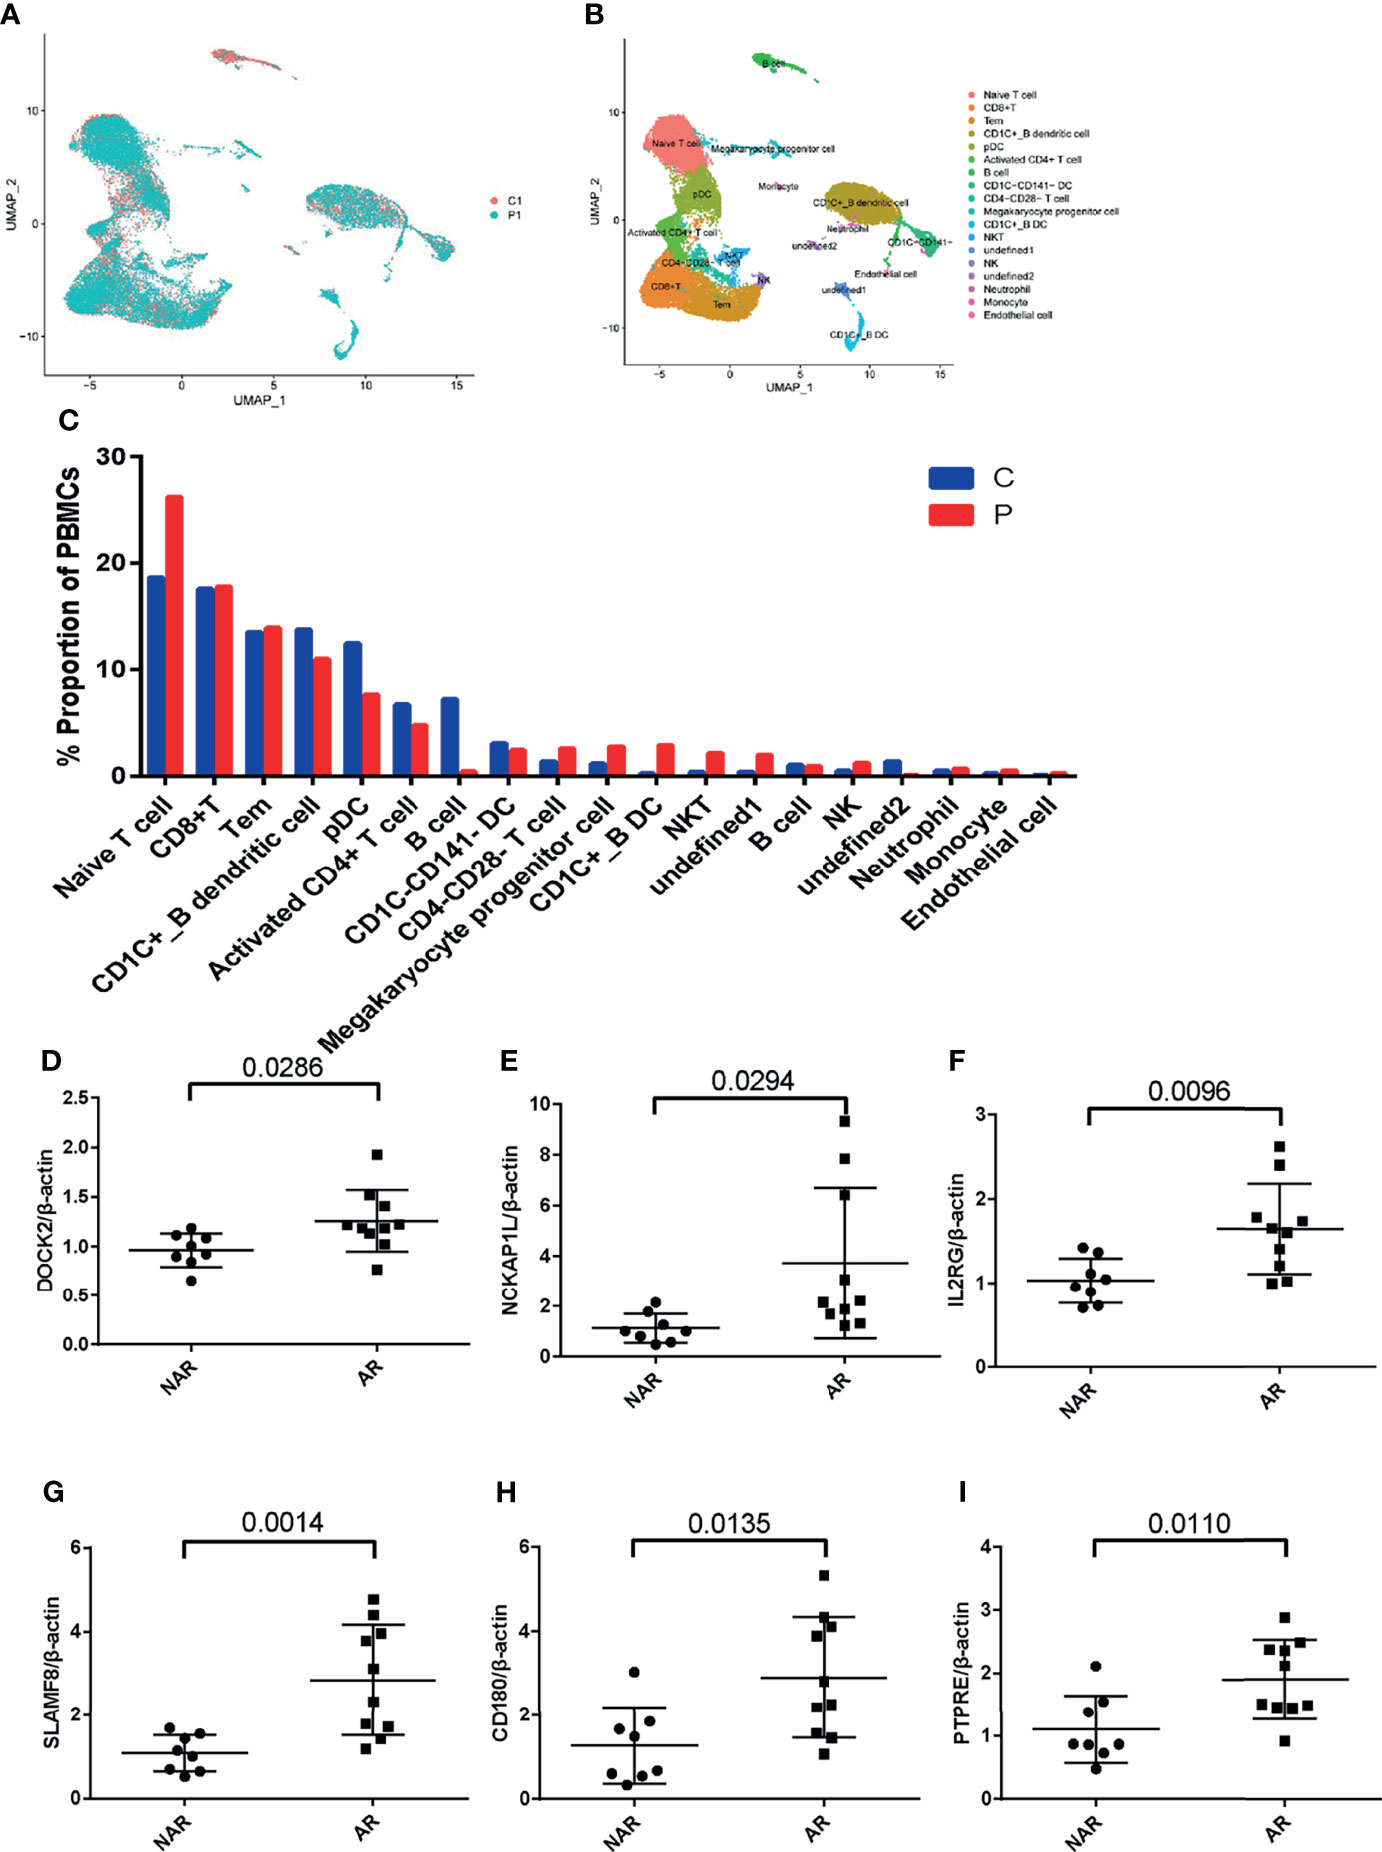
Figure 5 scRNA-seq in patient PBMCs of acute rejection post renal transplant and qRT-PCR validation. (A) Uniform manifold approximation and projection (UMAP) of 26,192 cells, split between P1 and C1. (B) UMAP plot of 19 cell clusters identified based on the expression of highly variable genes. (C) Single-cell RNA sequencing revealed a higher percentage of native T, CD1C+_B DC, NKT, NK, and monocytes in P1 compared with C1. Relative mRNA expression of DOCK2 (D), NCKAP1L (E), IL2RG (F), SLAMF8 (G), CD180 (H), and PTPRE (I) were measured in peripheral blood mononuclear cells (PBMCs)of 8 NAR and 10 AR patients. Data shown are mean ± SD by an unpaired t-test; P1, patient of acute rejection post renal transplant; C1, control patient of stable kidney function post renal transplant; NAR, non-acute rejection; AR, acute rejection.
Cell-Type Enrichment Analysis
Cell-type enrichment analysis was performed by xCell from gene expression data for 64 immune and stroma cell types. Our data revealed that the AR group had higher immune scores and microenvironment scores than the NAR group. Among the 64 cell types, scores of 20 types of cells were significantly differently expressed (p<0.01), including immune cells, such as B cells, basophils, CD4+ Tem, CD4+ memory T cells, CD8+ T cells, CD8+ Tcm, class-switched memory B cells, DC, macrophages, M1, mast cells, memory B cells, monocytes, plasma cells, aDC, cDC, naive B cells, pDC, and stroma cells such as endothelial cells, smooth muscle, and MV endothelial cells (Figure 6). We used the Protein Atlas online database to explore the six hub genes RNA expression in 76 single-cell types (Supplementary Figure S3). Except for SLAMF8, which is more singly expressed in Langerhans cell and macrophages, the other five genes are more widely expressed in immune cells such as B cells, DC, T cells, and monocyte consistent with the different cell types in AR groups, meaning that six hub genes exercise certain biological properties in these cell types during AR.
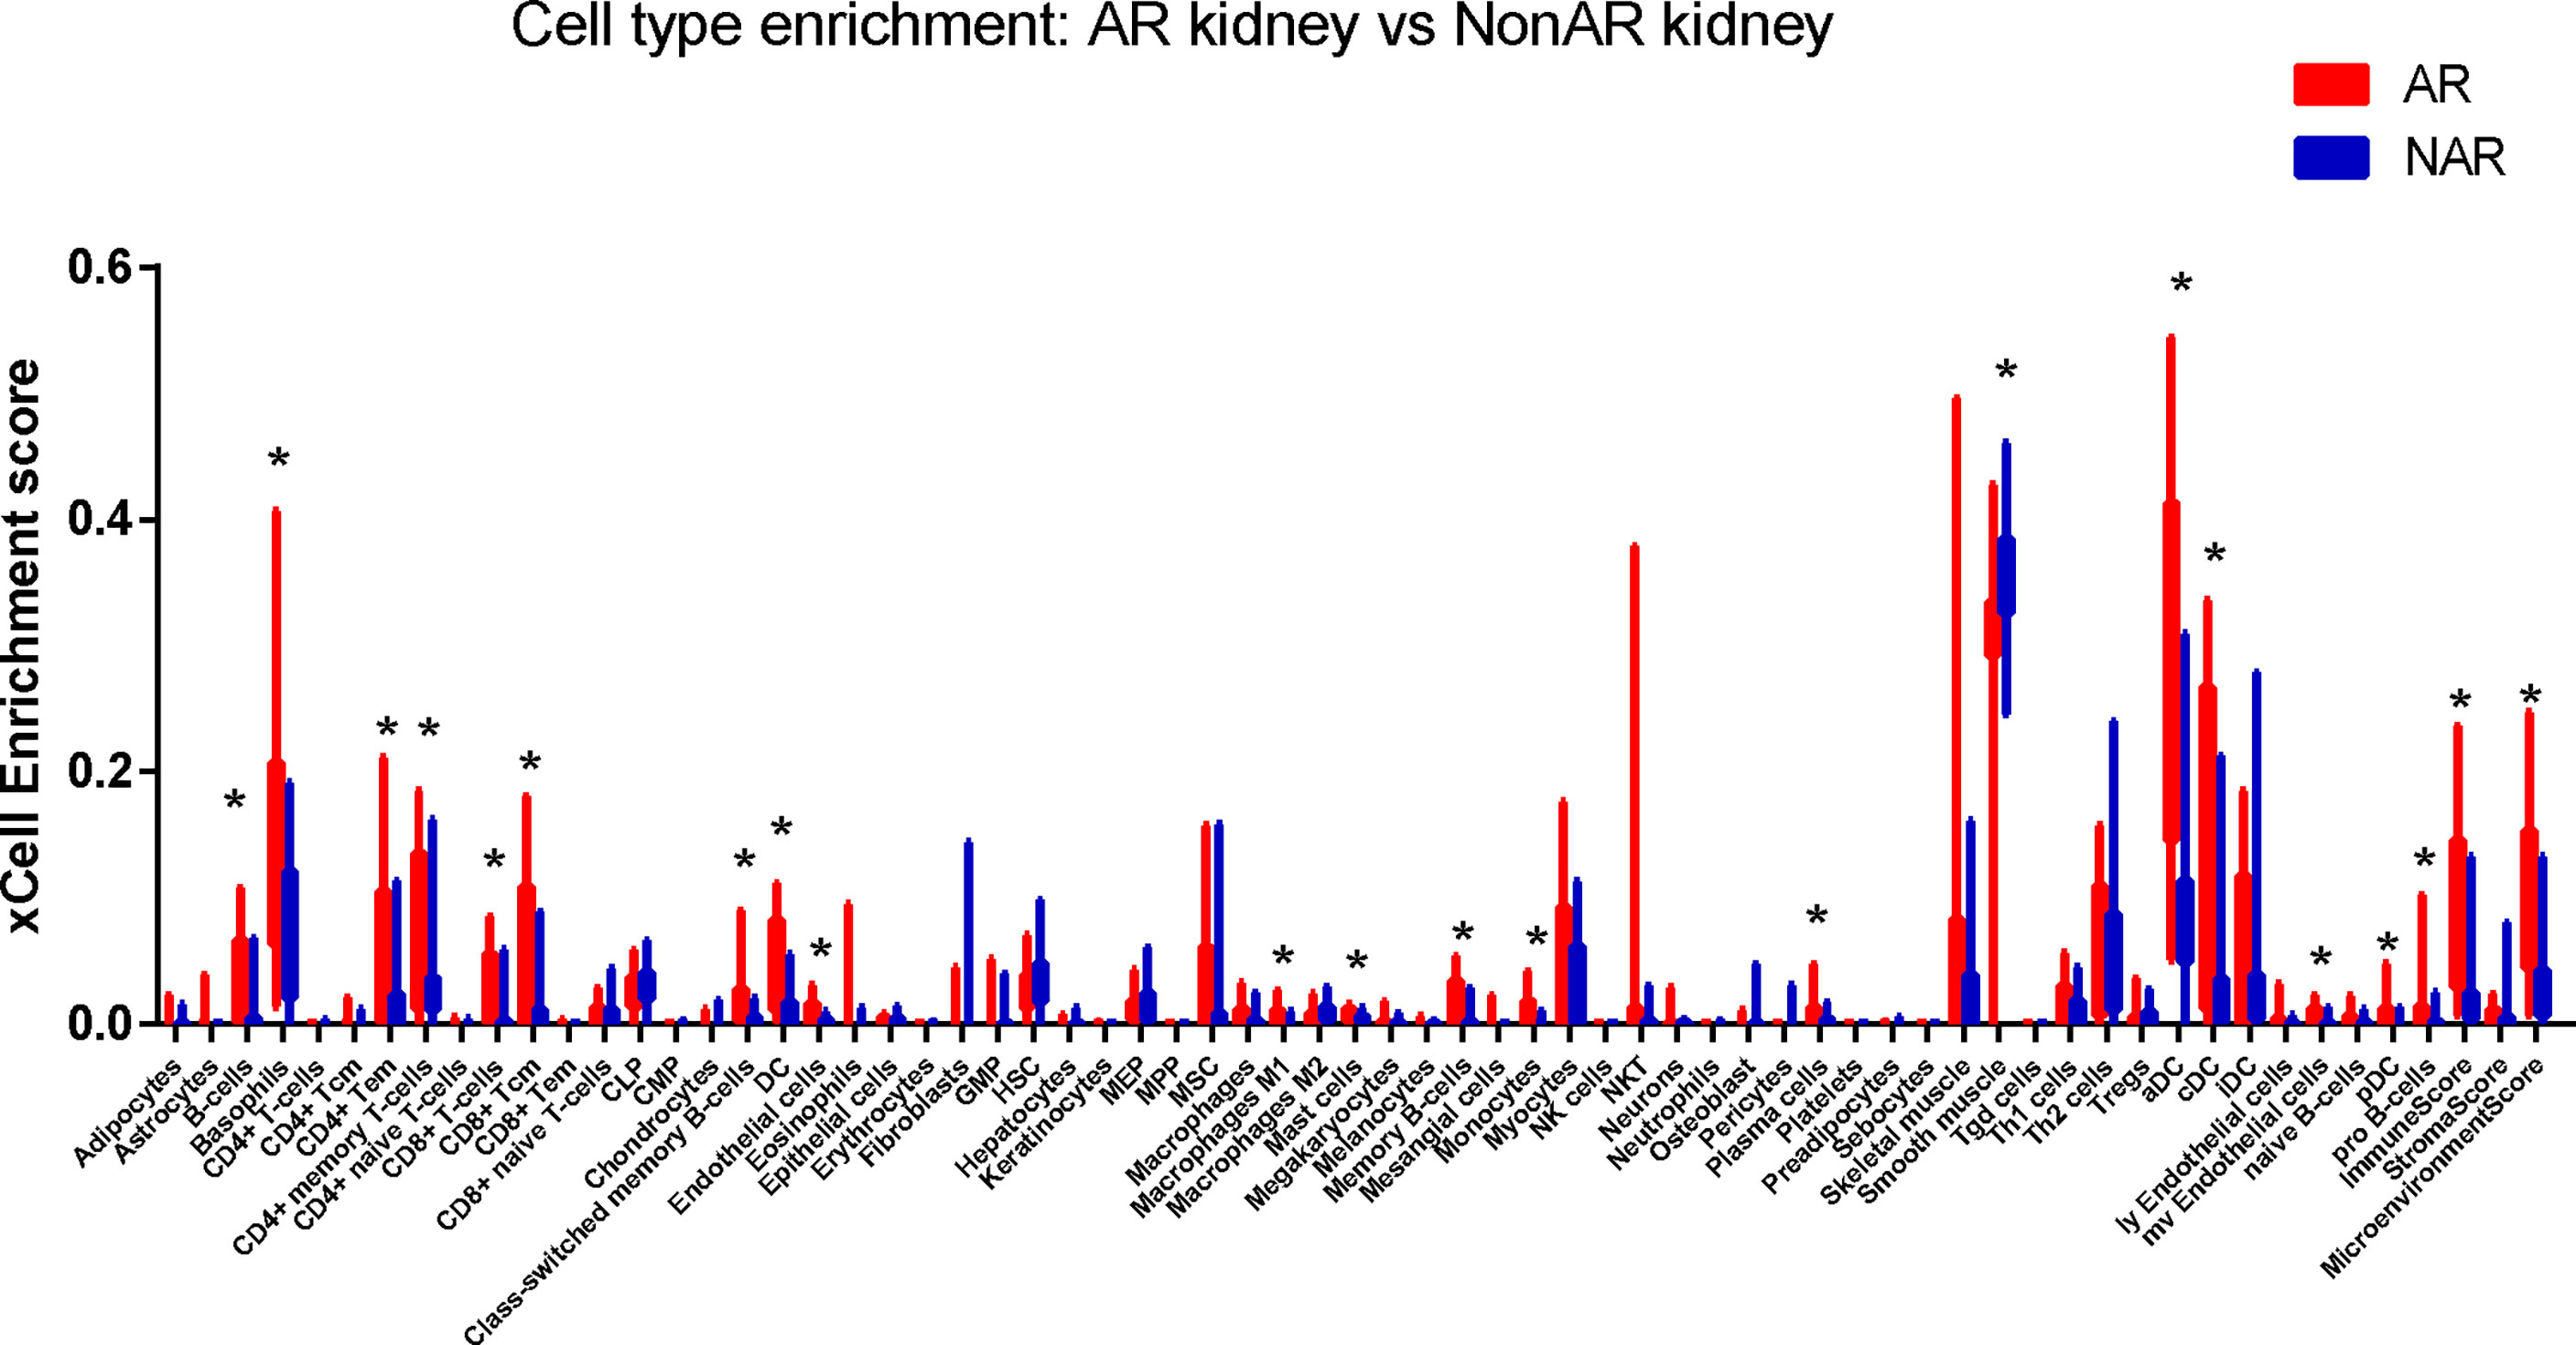
Figure 6 Immune cells enrichment. Distribution of cell-type enrichment scores for AR and NAR. xCell, a bioinformatics tool, was used to provide an enrichment score for different cell types that allow comparison of cell types across group. The x-axis represents cell types. The y-axis represents the xCell enrichment score. *p < 0.01.
Gene Set Enrichment Analysis
We performed GSEA, and h.all.v7.4.sytmbols.gmt in MSigDB was used as the reference gene set. The full list of gene sets enriched in samples with DOCK2 (Figure 7A), NCKAP1L (Figure 7B), IL2RG (Figure 7C), SLAMF8 (Figure 7D), CD180 (Figure 7E), or PTPRE (Figure 7F) highly expressed is shown. Four gene sets were enriched in samples with highly expressed DOCK2, NCKAP1L, IL2RG, SLAMF8, CD180, and PTPRE, including “allograft rejection”, “interferon γ response”, “interferon α response”, and “inflammatory response”. Moreover, gene sets “IL6–JAK–STAT3 signaling”, “KRAS signaling”, and “TNFα signaling via NFkB” were enriched in the samples with either DOCK2, NCKAP1L, IL2RG, SLAMF8, CD180, and PTPRE highly expressed.
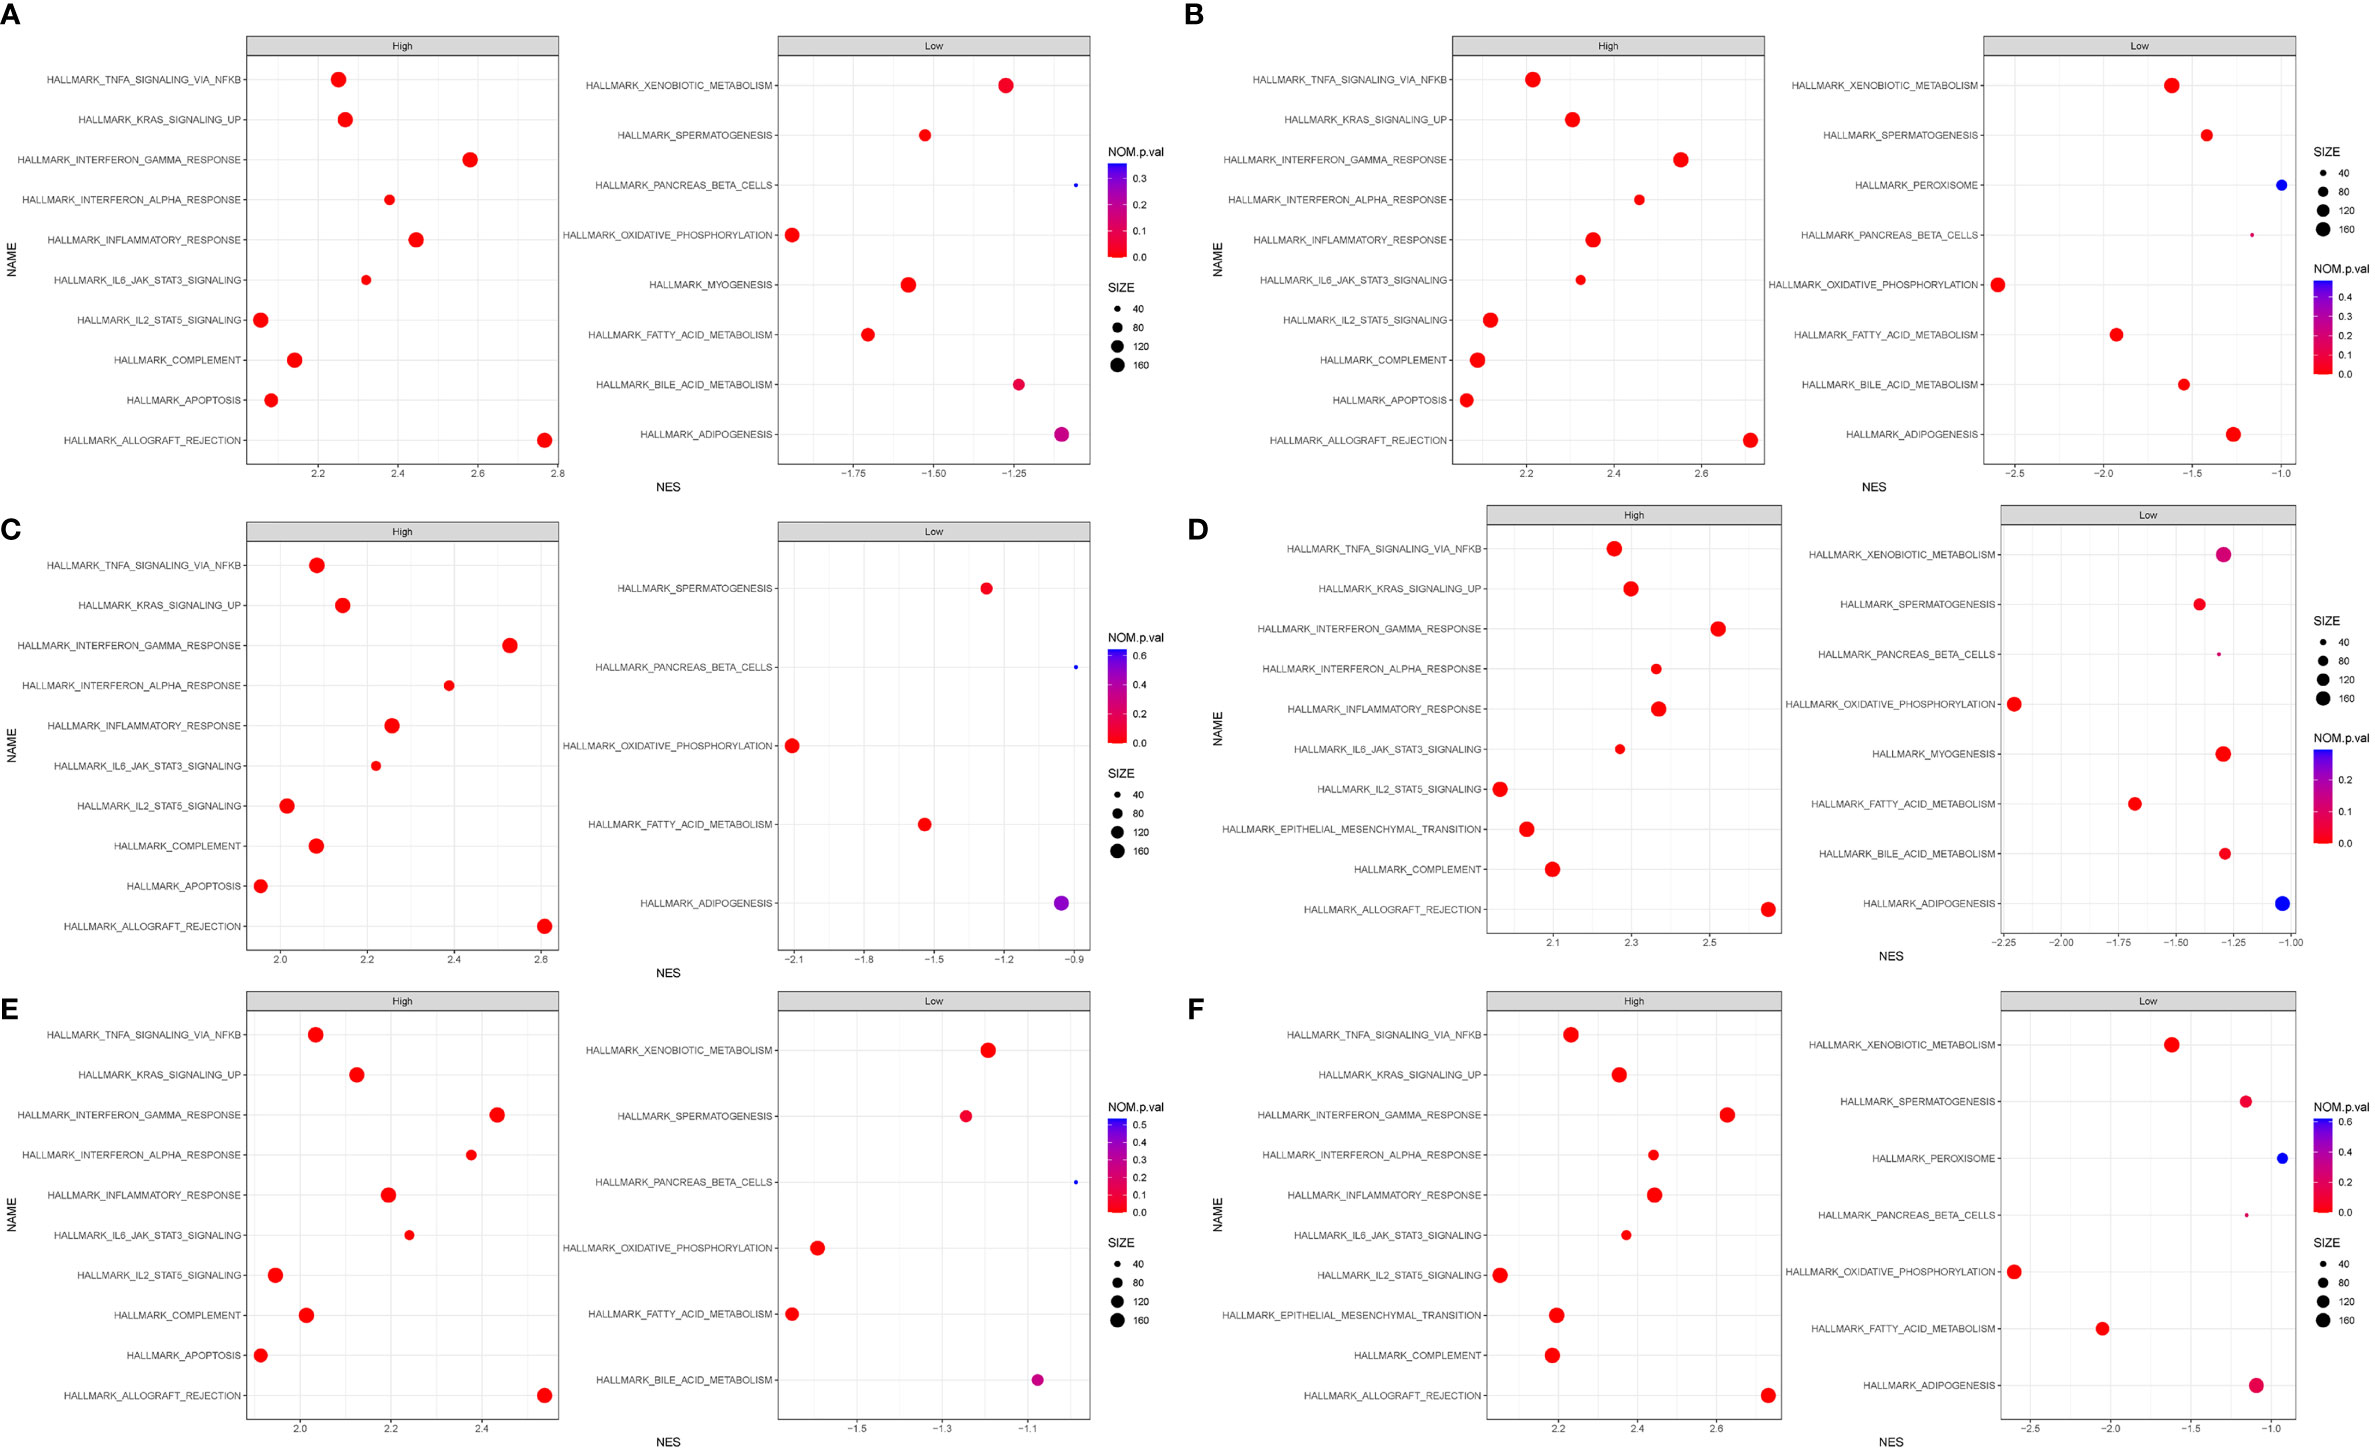
Figure 7 Gene set enrichment analysis (GSEA). The full list of gene sets enriched in samples with DOCK2 (A), NCKAP1L (B), IL2RG (C), SLAMF8 (D), CD180 (E), and PTPRE (F) highly expressed.
SLAMF8 Participate in AR Progression via TLR4 In Vivo
SLAMF8, one of the six hub genes, was also the top rejection-associated transcripts in TCMR versus everything else including ABMR in previous study (27). In addition, SLAMF8 is more specifically expressed in macrophages, which is exactly the cell type that differentially infiltrated in the AR group in our above research results (Figure 6; Supplementary Figure S3D). Immunohistochemical staining of kidney tissue revealed a higher level of SLAMF8 expression in the renal interstitium from TCMR (T-cell-mediated acute rejection after renal transplantation) kidney tissue than from HC (healthy donor control) (Figures 8A, B). A previous study confirmed that SLAMF8 maintained TLR4 expression on macrophages and promoted LPS-induced mitogen-activated protein kinase (MAPK) activation (28). We subsequently determined whether the SLAMF8 participates in macrophage activation via TLR4. Fluorescence detection of SLAMF8 and TLR4 revealed that approximately complete SLAMF8+ cells express TLR4 (Figure 8C). Thus, we speculated that SLAM8 participates in AR progression, likely through upregulating TLR4 expression.
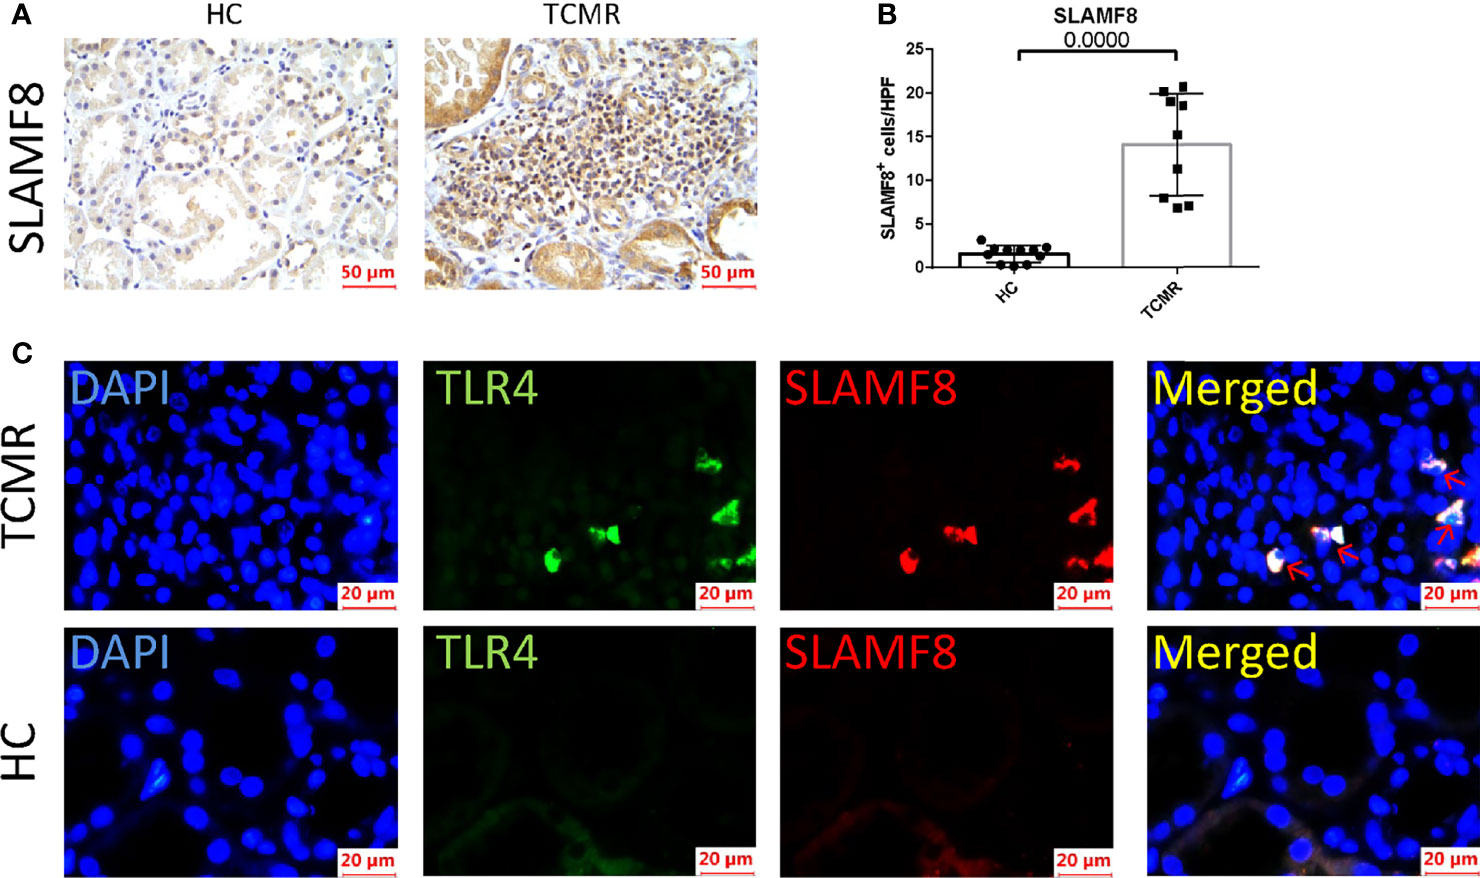
Figure 8 SLAMF8 participate in AR progression via TLR4 in vivo. (A, B) Representative images and quantification of SLAMF8+ cells number in the human allograft diagnosed as TCMR (n=9) clinically and HC (n=11). Scale bar: 50 μm; six random fields were taken from each kidney. (C) Representative of immunofluorescence staining of TLR4 (green) and SLAMF8 (red) in TCMR (n=11) and HC (n=8). Red arrow indicates cells co-expressing TLR4 and SLAMF8. Scale bar = 20μm; TCMR, T-cell-mediated rejection; HC, healthy control.
SLAMF8 and TLR4 Are Co-expressed in M1-Type Macrophages
In order to explore in which phenotype of macrophages SLAMF8 is specifically expressed, murine RAW 264.7 macrophages and primary BMDM cells were treated with 10 ng/ml LPS plus 20 ng/ml IFNγ or 10 ng/ml IL-4 for 24 h. CD80 and CD206 are known to be a specific surface marker of the M1 phenotype and the M2 phenotype, respectively. Flow cytometry and RT-qPCR were used to measure the polarization of RAW 264.7 macrophages (Supplementary Figures S4A–D). Western blotting using the M1 phenotype marker iNOS was confirmed to be increased in the LPS plus IFNγ treated group in RAW264.7 (Supplementary Figure S4E). The mRNA expression of SLAMF8 and TLR4 was increased in LPS and IFNγ treated RAW 264.7 macrophages and BMDMs (Figures 9A, B; Supplementary Figures S5A, B) consistent with the phenomenon in immunofluorescence staining (Figures 9C–E; Supplementary Figures S5C–E). Two-color immunofluorescence analysis revealed that the M1 phenotype contained large numbers of TLR4-expressing SLAMF8+ cells in contrast to M0- and M2-type macrophages (Figures 9C–F; Supplementary Figures 5C–E).
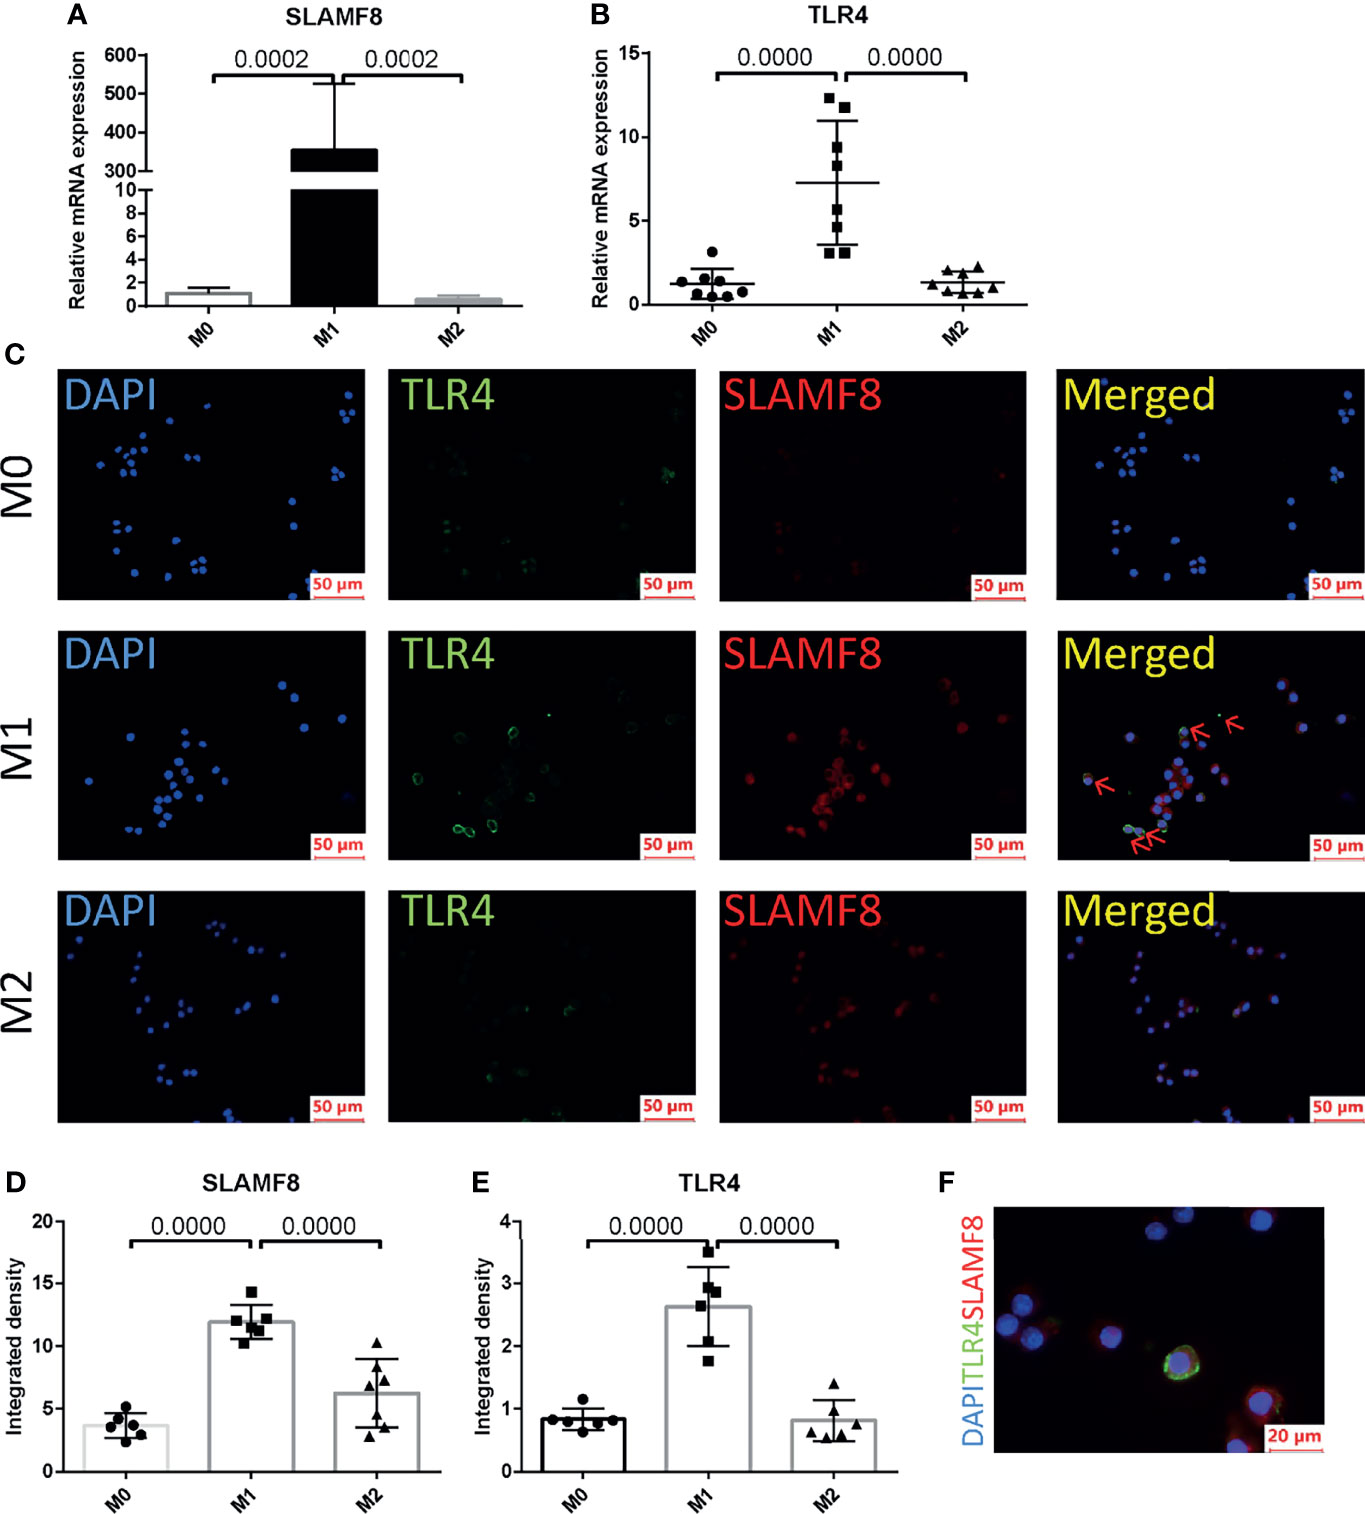
Figure 9 SLAMF8 and TLR4 are co-expressed in M1-type macrophages. Relative mRNA expression of SLAMF8 (A) and TLR4 (B) were measured in M0, M1, and M2. (C–E) Representative and quantification of immunofluorescence staining of TLR4 (green) and SLAMF8 (red) in M0, M1, and M2. Red arrow indicates cells co-expressing TLR4 and SLAMF8. Scale bar = 50μm; six random fields were taken from each coverslip (mean ± SD, n = 6). (F) Representative of immunofluorescence staining of TLR4 (green) and SLAMF8 (red) in M1. Scale bar = 20μm. M0, murine RAW 264.7; M1, RAW 264.7 treated with 10 ng/ml LPS plus 20 ng/ml IFNγ for 24 h; M2, RAW 264.7 treated with 10 ng/ml IL-4 for 24 h.
Discussion
Even if the incidence of clinical acute rejection and subclinical rejection in the first year after kidney transplantation is controlled in 10%–15%, respectively, preventing acute rejection remains the key to achieving long-term graft survival (6). Therefore, timely detection of rejection is important for the surveillance after transplantation. To our knowledge, there are few studies analyzing kidney transplant rejection using WGCNA (20, 21, 29). This study shows that co-expression network analysis was employed to mine the hub gene based on expression in the percutaneous allograft biopsy of 15 AR and 37 NAR. Through WGCNA, we divided all genes into 12 separate modules and found that the green module was the most related to AR. Six hub genes were then screened out satisfying three criteria: (1) DEGs; (2) GS > 0.4, MM > 0.9; and (3) the 10 highest MCC value, followed by validation in both two datasets and clinical traits of AR. Of the six hub genes derived, some have well-described functions in the immune response (e.g., DOCK2, IL2RG, PTPRE, and CD180), while others have not been as well characterized (e.g., NCKAP1L and SLAMF8) and represent opportunities for future study.
DOCK2, a member of the CDM protein family, plays a critical role in lymphocyte homing and immunological synapse formation by remodeling the actin cytoskeleton in response to chemokine signaling (30). DOCK2 mediates GTP–GDP exchange reaction for Rac through its DOCK homology region (DHR)-2 (also known as Docker) domain (31). Mutations in this gene result in immunodeficiency, a combined form of immunodeficiency that affects T-cell number and function, also with variable defects in B-cell and NK-cell function (32, 33). Deletion of DOCK2 suppresses cardiac allograft rejection (34). IL2RG, interleukin 2 receptor subunit gamma chain, or CD132, is the co-receptor subunit of a variety of important immune factors, including IL-2, IL-4, IL-7, IL-9, IL-15, and IL-21. Therefore, it is also called the receptor common gamma chain (γc) (35). In mammals, the IL2Rg gene is located on the X chromosome. Its mutation called X-linked severe combined immunodeficiency (X-SCID), presenting with absent or profoundly diminished peripheral T and NK cells and functionally defective B cells (36, 37). In severe combined immunodeficiency (SCID) gene homozygous mutation or recombination activation gene 1 (Rag1) or Rag2 homozygous mutation mice, accompanied by mutation of the interleukin 2 receptor gamma chain (IL2Rg) locus, comparing with previous immunodeficiency mouse models, the implantation and function of human hematopoietic stem cells (HSC) and peripheral blood mononuclear cells (PBMC) are greatly increased (38). In this study, we found that DOCK2 and IL2RG mRNA levels correlated to inflammatory parameters according to the Banff classification.
The nine receptors of the SLAM family are differentially expressed on the surface of hematopoietic cells such as thymocytes, memory CD4+ and CD8+T cells, dendritic cells, monocytes, macrophages, and platelets. They regulate not only the proliferation, cytotoxicity, and cytokine production of T lymphocytes but also the lytic activity, cytokine production, and MHC-independent inhibition of natural killer (NK) cells; B cell activation and proliferation; regulation of neutrophil; and macrophage killing and platelet aggregation (39). In contrast to the classical SLAMF receptors, SLAMF8 have no signaling motifs including the ITSM in their short cytoplasmic tail. Limited studies have indicated that combined deficiency of SLAMF8 and SLAMF9 prevents endotoxin-induced liver inflammation by downregulating TLR4 expression on macrophages (28), and SLAMF8 can negatively regulate ROS production by macrophages (40). In addition, a previous study has shown that SLAMF8 is the top differentiating transcripts rejection-associated transcripts in TCMR versus everything else including ABMR, and SLAMF8 is the most specific transcript in macrophages cell lines for TCMR (27, 41). Bone marrow cells follow a differentiation trajectory from monocytes to pro-inflammatory macrophages and become predominantly infiltrating cells in the intimal arteritis of biopsies graded as Banff II or III acute allogeneic renal rejection (42, 43). Due to SLAMF8 mainly expressed on macrophages and the important role of macrophages in transplant rejection, we further investigated the expression of SLAMF8 in from TCMR in vivo and macrophages of different phenotypes in vitro. We observed that SLAMF8 expressed highly in TCMR than HC and in M1 phenotype.
TLR4 is a member of the toll-like receptor family and plays an important role in regulating innate immunity in response to exogenous and endogenous molecular patterns (44). Activation of the innate immunity through toll-like receptors (TLRs) has been postulated to play an important role in the pathophysiology of renal allograft dysfunction (45). Renal transplant recipients with TLR4 polymorphism present a lower risk of acute allograft rejection and lower rates of delayed graft function as compared to those with normal TLR4 function (46), also consistent with the observation that acute kidney allograft rejection was modestly attenuated in TLR4−/− mice (47). Previous reports have demonstrated that activation of TLR4 triggers a phenotypic switch of macrophages from a quiescent population to an inflammatory population and inhibition of TLR4 suppressed macrophages polarization (48–50). Because SLAMF8 has no signaling activity and the TLR4 has essential role in macrophages and immune rejection, we wondered whether SLAMF8 participates in macrophage activation via TLR4. Here, we identified that approximatively complete SLAMF8+ cells express TLR4 in TCMR. M1 macrophage contained large numbers of TLR4-expressing SLAMF8+ cells in contrast to M0- and M2-type macrophages.
In summary, our study finds involvement of the key gene co-expression module, hub genes, and some functional biological pathways related to “interferon γ response”, “interferon α response”, and “inflammatory response” in the pathogenesis of AR. SLAMF8 was highly expressed in pro-inflammatory macrophage-mediated acute renal transplantation rejection accompanied by TLR4 high expression, and it presents a potentially novel therapeutic target for controlling kidney allograft rejection and improving kidney allograft survival. These findings provide new insights into the development of AR, although the exact molecular mechanism of hub genes and functional pathway in AR still need to be further explored.
Data Availability Statement
The data presented in the study are deposited in the OMIX, China National Center for Bioinformation / Beijing Institute of Genomics, Chinese Academy of Sciences (https://ngdc.cncb.ac.cn/omix/release/OMIX873), accession number OMIX873.
Ethics Statement
The studies involving human participants were reviewed and approved by the Research Ethics Committee of the First Affiliated Hospital, College of Medicine, Zhejiang University. The patients/participants provided their written informed consent to participate in this study.
Author Contributions
HJ, JC, and LT designed the study. LT and LS analyzed bioinformatics. CW, SF, and YW collected PBMC and the percutaneous allograft biopsy from AR patients and healthy donor. WZ and YB carried out experiments. SR, NS, and HH analyzed data. All authors contributed to the article and approved the submitted version.
Funding
This work was supported by NSFC81970651, U21A20350, Sino-German Center GZ1572.
Conflict of Interest
The authors declare that the research was conducted in the absence of any commercial or financial relationships that could be construed as a potential conflict of interest.
Publisher’s Note
All claims expressed in this article are solely those of the authors and do not necessarily represent those of their affiliated organizations, or those of the publisher, the editors and the reviewers. Any product that may be evaluated in this article, or claim that may be made by its manufacturer, is not guaranteed or endorsed by the publisher.
Supplementary Material
The Supplementary Material for this article can be found online at: https://www.frontiersin.org/articles/10.3389/fimmu.2022.846695/full#supplementary-material
Supplementary Figure 1 | (A) Network heatmap plot in the co-expression modules (The progressively saturated red colors indicated higher overlap among the functional modules). (B) Relative mRNA expression of six hub genes in AR and NAR tissues. NAR: Non rejection at 12 months post renal transplant; AR: Rejection at 12 months post renal transplant. Box represents mean ± SD by an unpaired t-test. *P < 0.05, **P < 0.01, ***P < 0.0001, ns, no significance (C) Correlation between the expression of DOCK2 in AR and the AR classification.
Supplementary Figure 2 | Visualization of expression of DOCK2, NCKAP1L, IL2RG, SLAMF8, CD180 and PTPRE (coloured single cells) on UMAP plot projecting PBMCs from P1 (n = 14,118 cells) and C1 (n = 12,074 cells). P1: patient of acute rejection post renal transplant; C1: control patient of stable kidney function post renal transplant.
Supplementary Figure 3 | Six hub genes RNA expression in Top 15 single cell types. DOCK2 (A), NCKAP1L (B), IL2RG (C), SLAMF8 (D), CD180 (E) and PTPRE(F). Data were obtained from Human Protein Atlas Dataset available from proteinatlas.org.
Supplementary Figure 4 | Relative mRNA expression of CD80 (A) iNOS (B) and CD206 (C) were measured in M0, M1 and M2. (D) Representative histograms of CD80 expression among M0, M1 and M2 in flow cytometry. (E) Mean fluorescence intensity of CD80 in M0, M1 and M2. (F) Western blotting of iNOS in M0, M1 and M2. M0: murine RAW 264.7, M1: RAW 264.7 treated with 10ng/ml LPS plus 20ng/ml IFNγ for 24 h, M2: RAW 264.7 treated with 10ng/ml IL-4 for 24h.
Supplementary Figure 5 | SLAMF8 and TLR4 are co-expressed in LPS plus IFNγ treated BMDMs. Relative mRNA expression of SLAMF8 (A) and TLR4 (B) were measured in BMDMs, BMDMs+LPS (10ng/ml)+IFNγ (20ng/ml) and BMDMs+IL-4(10ng/ml) for 24 h. (C–E) Representative and quantification of Immunofluorescence staining of TLR4(green) and SLAMF8(red) in BMDMs, BMDMs+LPS+IFNγ and BMDMs+IL-4. Scale bar = 50μm; Six random fields were taken from each coverslip(mean ± SD, n = 6).
Supplementary Table 1 | DEGs in GSE138043.
Supplementary Table 2 | The MCC values of the top 10 genes in the green module.
Supplementary Table 3 | Cell-type enrichment score.
Supplementary Table 4 | All primer sequences.
References
1. Abecassis M, Bartlett ST, Collins AJ, Davis CL, Delmonico FL, Friedewald JJ, et al. Kidney Transplantation as Primary Therapy for End-Stage Renal Disease: A National Kidney Foundation/Kidney Disease Outcomes Quality Initiative (NKF/KDOQITM) Conference. Clin J Am Soc Nephrol (2008) 3(2):471–80. doi: 10.2215/CJN.05021107
2. Garcia GG, Harden P, Chapman J. World Kidney Day Steering Committee 2012. The Global Role of Kidney Transplantation. Nephrol Dial Transplant (2013) 28(8):e1–5. doi: 10.1093/ndt/gfs013
3. Meier-Kriesche HU, Schold JD, Srinivas TR, Kaplan B. Lack of Improvement in Renal Allograft Survival Despite a Marked Decrease in Acute Rejection Rates Over the Most Recent Era. Am J Transplant (2004) 4(3):378–83. doi: 10.1111/j.1600-6143.2004.00332.x
4. Nankivell BJ, Alexander SI. Rejection of the Kidney Allograft. N Engl J Med (2010) 363(15):1451–62. doi: 10.1056/NEJMra0902927
5. Coemans M, Süsal C, Döhler B, Anglicheau D, Giral M, Bestard O, et al. Analyses of the Short- and Long-Term Graft Survival After Kidney Transplantation in Europe Between 1986 and 2015. Kidney Int (2018) 94(5):964–73. doi: 10.1016/j.kint.2018.05.018
6. Hariharan S, Israni AK, Danovitch G. Long-Term Survival After Kidney Transplantation. N Engl J Med (2021) 385(8):729–43. doi: 10.1056/NEJMra2014530
7. Meier-Kriesche HU, Ojo AO, Hanson JA, Cibrik DM, Punch JD, Leichtman AB, et al. Increased Impact of Acute Rejection on Chronic Allograft Failure in Recent Era. Transplantation (2000) 70(7):1098–100. doi: 10.1097/00007890-200010150-00018
8. Wu O, Levy AR, Briggs A, Lewis G, Jardine A. Acute Rejection and Chronic Nephropathy: A Systematic Review of the Literature. Transplantation (2009) 87(9):1330–9. doi: 10.1097/TP.0b013e3181a236e0
9. Opelz G, Döhler B. Collaborative Transplant Study Report. Influence of Time of Rejection on Long-Term Graft Survival in Renal Transplantation. Transplantation (2008) 85(5):661–6. doi: 10.1097/TP.0b013e3181661695
10. Loupy A, Haas M, Roufosse C, Naesens M, Adam B, Afrouzian M, et al. The Banff 2019 Kidney Meeting Report (I): Updates on and Clarification of Criteria for T Cell- and Antibody-Mediated Rejection. Am J Transplant (2020) 20(9):2318–31. doi: 10.1111/ajt.15898
11. Haas M, Loupy A, Lefaucheur C, Roufosse C, Glotz D, Seron D, et al. The Banff 2017 Kidney Meeting Report: Revised Diagnostic Criteria for Chronic Active T Cell-Mediated Rejection, Antibody-Mediated Rejection, and Prospects for Integrative Endpoints for Next-Generation Clinical Trials. Am J Transplant (2018) 18(2):293–307. doi: 10.1111/ajt.14625
12. Menon MC, Keung KL, Murphy B, O’Connell PJ. The Use of Genomics and Pathway Analysis in Our Understanding and Prediction of Clinical Renal Transplant Injury. Transplantation (2016) 100(7):1405–14. doi: 10.1097/TP.0000000000000943
13. Niemira M, Collin F, Szalkowska A, Bielska A, Chwialkowska K, Reszec J, et al. Molecular Signature of Subtypes of Non-Small-Cell Lung Cancer by Large-Scale Transcriptional Profiling: Identification of Key Modules and Genes by Weighted Gene Co-Expression Network Analysis (WGCNA). Cancers (Basel) (2019) 12(1):37. doi: 10.3390/cancers12010037
14. Luo Z, Wang W, Li F, Songyang Z, Feng X, Xin C, et al. Pan-Cancer Analysis Identifies Telomerase-Associated Signatures and Cancer Subtypes. Mol Cancer (2019) 18(1):106. doi: 10.1186/s12943-019-1035-x
15. Shen L, Lan L, Zhu T, Chen H, Gu H, Wang C, et al. Identification and Validation of IFI44 as Key Biomarker in Lupus Nephritis. Front Med (Lausanne) (2021) 8:762848. doi: 10.3389/fmed.2021.762848
16. Yao Q, Song Z, Wang B, Qin Q, Zhang JA. Identifying Key Genes and Functionally Enriched Pathways in Sjögren’s Syndrome by Weighted Gene Co-Expression Network Analysis. Front Genet (2019) 10:1142. doi: 10.3389/fgene.2019.01142
17. Liang JW, Fang ZY, Huang Y, Liuyang ZY, Zhang XL, Wang JL, et al. Application of Weighted Gene Co-Expression Network Analysis to Explore the Key Genes in Alzheimer’s Disease. J Alzheimers Dis (2018) 65(4):1353–64. doi: 10.3233/JAD-180400
18. Bhargava P, Fitzgerald KC, Calabresi PA, Mowry EM. Metabolic Alterations in Multiple Sclerosis and the Impact of Vitamin D Supplementation. JCI Insight (2017) 2(19):e95302. doi: 10.1172/jci.insight.95302
19. Yu D, Lim J, Wang X, Liang F, Xiao G. Enhanced Construction of Gene Regulatory Networks Using Hub Gene Information. BMC Bioinf (2017) 18(1):186. doi: 10.1186/s12859-017-1576-1
20. Fan P, Zhang W, Liu Y. CYC1, SDHA, UQCRC1, UQCRQ, and SDHB Might be Important Biomarkers in Kidney Transplant Rejection. Clin Chim Acta (2020) 507:132–8. doi: 10.1016/j.cca.2020.04.013
21. Wang LJ, Ma XB, Xia HY, Sun X, Yu L, Yang Q, et al. Identification of Biomarkers for Predicting Allograft Rejection Following Kidney Transplantation Based on the Weighted Gene Coexpression Network Analysis. BioMed Res Int (2021) 2021:9933136. doi: 10.1155/2021/9933136
22. Li J, Li C, Zhuang Q, Peng B, Zhu Y, Ye Q, et al. The Evolving Roles of Macrophages in Organ Transplantation. J Immunol Res (2019) 2019:5763430. doi: 10.1155/2019/5763430
23. Panzer SE. Macrophages in Transplantation: A Matter of Plasticity, Polarization, and Diversity. Transplantation (2022) 106(2):257–67. doi: 10.1097/TP.0000000000003804.
24. Mueller FB, Yang H, Lubetzky M, Verma A, Lee JR, Dadhania DM, et al. Landscape of Innate Immune System Transcriptome and Acute T Cell-Mediated Rejection of Human Kidney Allografts. JCI Insight (2019) 4(13:e128014. doi: 10.1172/jci.insight.128014
25. Yi Z, Keung KL, Li L, Hu M, Lu B, Nicholson L, et al. Key Driver Genes as Potential Therapeutic Targets in Renal Allograft Rejection. JCI Insight (2020) 5(15):e136220. doi: 10.1172/jci.insight.136220
26. Pineda-Torra I, Gage M, de Juan A, Pello OM. Isolation, Culture, and Polarization of Murine Bone Marrow-Derived and Peritoneal Macrophages. Methods Mol Biol (2015) 1339:101–9. doi: 10.1007/978-1-4939-2929-0_6
27. Halloran PF, Venner JM, Famulski KS. Comprehensive Analysis of Transcript Changes Associated With Allograft Rejection: Combining Universal and Selective Features. Am J Transplant (2017) 17(7):1754–69. doi: 10.1111/ajt.14200
28. Zeng X, Liu G, Peng W, He J, Cai C, Xiong W, et al. Combined Deficiency of SLAMF8 and SLAMF9 Prevents Endotoxin-Induced Liver Inflammation by Downregulating TLR4 Expression on Macrophages. Cell Mol Immunol (2020) 17(2):153–62. doi: 10.1038/s41423-018-0191-z
29. Liu R, Zou Y, Zhang W, Zhou HH. Correlating Transcriptional Networks to Acute Rejection in Human Kidney Transplant Biopsies. Crit Rev Eukaryot Gene Expr (2019) 29(5):401–12. doi: 10.1615/CritRevEukaryotGeneExpr.2019027763
30. Fukui Y, Hashimoto O, Sanui T, Oono T, Koga H, Abe M, et al. Haematopoietic Cell-Specific CDM Family Protein DOCK2 Is Essential for Lymphocyte Migration. Nature (2001) 412(6849):826–31. doi: 10.1038/35090591
31. Kulkarni K, Yang J, Zhang Z, Barford D. Multiple Factors Confer Specific Cdc42 and Rac Protein Activation by Dedicator of Cytokinesis (DOCK) Nucleotide Exchange Factors. J Biol Chem (2011) 286(28):25341–51. doi: 10.1074/jbc.M111.236455
32. Moens L, Gouwy M, Bosch B, Pastukhov O, Nieto-Patlàn A, Siler U, et al. Human DOCK2 Deficiency: Report of a Novel Mutation and Evidence for Neutrophil Dysfunction. J Clin Immunol (2019) 39(3):298–308. doi: 10.1007/s10875-019-00603-w
33. Dobbs K, Domínguez Conde C, Zhang SY, Parolini S, Audry M, Chou J, et al. Inherited DOCK2 Deficiency in Patients With Early-Onset Invasive Infections. N Engl J Med (2015) 372(25):2409–22. doi: 10.1056/NEJMoa1413462
34. Jiang H, Pan F, Erickson LM, Jang MS, Sanui T, Kunisaki Y, et al. Deletion of DOCK2, a Regulator of the Actin Cytoskeleton in Lymphocytes, Suppresses Cardiac Allograft Rejection. J Exp Med (2005) 202(8):1121–30. doi: 10.1084/jem.20050911
35. Lin JX, Leonard WJ. The Common Cytokine Receptor γ Chain Family of Cytokines. Cold Spring Harb Perspect Biol (2018) 10(9):a028449. doi: 10.1101/cshperspect.a028449
36. Walsh NC, Kenney LL, Jangalwe S, Aryee KE, Greiner DL, Brehm MA, et al. Humanized Mouse Models of Clinical Disease. Annu Rev Pathol (2017) 12:187–215. doi: 10.1146/annurev-pathol-052016-100332
37. Rochman Y, Spolski R, Leonard WJ. New Insights Into the Regulation of T Cells by Gamma(C) Family Cytokines. Nat Rev Immunol (2009) 9(7):480–90. doi: 10.1038/nri2580
38. Shultz LD, Ishikawa F, Greiner DL. Humanized Mice in Translational Biomedical Research. Nat Rev Immunol (2007) 7(2):118–30. doi: 10.1038/nri2017
39. Veillette A. Immune Regulation by SLAM Family Receptors and SAP-Related Adaptors. Nat Rev Immunol (2006) 6(1):56–66. doi: 10.1038/nri1761
40. Wang G, Abadía-Molina AC, Berger SB, Romero X, O'Keeffe MS, Rojas-Barros DI, et al. Cutting Edge: Slamf8 Is a Negative Regulator of Nox2 Activity in Macrophages. J Immunol (2012) 188(12):5829–32. doi: 10.4049/jimmunol.1102620
41. Venner JM, Famulski KS, Badr D, Hidalgo LG, Chang J, Halloran PF. Molecular Landscape of T Cell-Mediated Rejection in Human Kidney Transplants: Prominence of CTLA4 and PD Ligands. Am J Transplant (2014) 14(11):2565–76. doi: 10.1111/ajt.12946
42. Matheson PJ, Dittmer ID, Beaumont BW, Merrilees MJ, Pilmore HL. The Macrophage Is the Predominant Inflammatory Cell in Renal Allograft Intimal Arteritis. Transplantation (2005) 79(12):1658–62. doi: 10.1097/01.TP.0000167099.51275.EC
43. Dangi A, Natesh NR, Husain I, Ji Z, Barisoni L, Kwun J, et al. Single Cell Transcriptomics of Mouse Kidney Transplants Reveals a Myeloid Cell Pathway for Transplant Rejection. JCI Insight (2020) 5(20):e141321. doi: 10.1172/jci.insight.141321
44. Barton GM, Medzhitov R. Toll-Like Receptor Signaling Pathways. Science (2003) 300(5625):1524–5. doi: 10.1126/science.1085536
45. Dessing MC, Bemelman FJ, Claessen N, Ten Berge IJ, Florquin S, Leemans JC. Intragraft Toll-Like Receptor Profiling in Acute Renal Allograft Rejection. Nephrol Dial Transplant (2010) 25(12):4087–92. doi: 10.1093/ndt/gfq589
46. Ducloux D, Deschamps M, Yannaraki M, Ferrand C, Bamoulid J, Saas P, et al. Relevance of Toll-Like Receptor-4 Polymorphisms in Renal Transplantation. Kidney Int (2005) 67(6):2454–61. doi: 10.1111/j.1523-1755.2005.00354.x
47. Kwan TK, Chadban SJ, Wu H. Toll-Like Receptor 4 Deficiency Improves Short-Term Renal Function But Not Long-Term Graft Survival in a Fully MHC-Mismatched Murine Model of Renal Allograft Transplantation. Transplantation (2016) 100(6):1219–27. doi: 10.1097/TP.0000000000001168
48. Zhou Y, Zhang T, Wang X, Wei X, Chen Y, Guo L, et al. Curcumin Modulates Macrophage Polarization Through the Inhibition of the Toll-Like Receptor 4 Expression and Its Signaling Pathways. Cell Physiol Biochem (2015) 36(2):631–41. doi: 10.1159/000430126
49. Liu Z, Ma Y, Cui Q, Xu J, Tang Z, Wang Y, et al. Toll-Like Receptor 4 Plays a Key Role in Advanced Glycation End Products-Induced M1 Macrophage Polarization. Biochem Biophys Res Commun (2020) 531(4):602–8. doi: 10.1016/j.bbrc.2020.08.014
Keywords: acute rejection, renal transplantation, weighted gene co-expression network analysis (WGCNA), hub gene, SLAMF8, gene set enrichment analysis
Citation: Teng L, Shen L, Zhao W, Wang C, Feng S, Wang Y, Bi Y, Rong S, Shushakova N, Haller H, Chen J and Jiang H (2022) SLAMF8 Participates in Acute Renal Transplant Rejection via TLR4 Pathway on Pro-Inflammatory Macrophages. Front. Immunol. 13:846695. doi: 10.3389/fimmu.2022.846695
Received: 31 December 2021; Accepted: 03 March 2022;
Published: 01 April 2022.
Edited by:
Zhenhua Dai, Guangdong Provincial Academy of Chinese Medical Sciences, ChinaReviewed by:
Tongyu Zhu, Fudan University, ChinaNing Na, Third Affiliated Hospital of Sun Yat-sen University, China
Copyright © 2022 Teng, Shen, Zhao, Wang, Feng, Wang, Bi, Rong, Shushakova, Haller, Chen and Jiang. This is an open-access article distributed under the terms of the Creative Commons Attribution License (CC BY). The use, distribution or reproduction in other forums is permitted, provided the original author(s) and the copyright owner(s) are credited and that the original publication in this journal is cited, in accordance with accepted academic practice. No use, distribution or reproduction is permitted which does not comply with these terms.
*Correspondence: Hong Jiang, Smlhbmdob25nOTYxMTA2QHpqdS5lZHUuY24=
†These authors have contributed equally to this work and share first authorship