 Jonas Aakre Wik
 Bjørn Steen Skålhegg
95% of researchers rate our articles as excellent or good
Learn more about the work of our research integrity team to safeguard the quality of each article we publish.
Find out more
REVIEW article
Front. Immunol. , 14 March 2022
Sec. T Cell Biology
Volume 13 - 2022 | https://doi.org/10.3389/fimmu.2022.840610
This article is part of the Research Topic T Cell Metabolism in Infection View all 7 articles
T lymphocytes (T cells) are divided into two functionally different subgroups the CD4+ T helper cells (Th) and the CD8+ cytotoxic T lymphocytes (CTL). Adequate CD4 and CD8 T cell activation to proliferation, clonal expansion and effector function is crucial for efficient clearance of infection by pathogens. Failure to do so may lead to T cell exhaustion. Upon activation by antigen presenting cells, T cells undergo metabolic reprograming that support effector functions. In this review we will discuss how metabolic reprograming dictates functionality during viral infections using severe acute respiratory syndrome coronavirus 2 (SARS-CoV-2) and human immunodeficiency virus (HIV) as examples. Moreover, we will briefly discuss T cell metabolic programs during bacterial infections exemplified by Mycobacterium tuberculosis (MT) infection.
All multicellular organisms are in an “arms race” against infectious pathogens, which include pathogenic bacteria, viruses, fungi and parasites (1). The primary defenses against infectious pathogens are the physical and chemical barriers of the skin and mucosa, which separates the external and internal environments (1). Breach of these barriers allow pathogens to enter the body, requiring activation of the immune system to clear the infection (2). The immune system is a host defense system comprising many biological structures and processes within an organism that defends against foreign infection as well as damaged and transformed cells. The ability of the immune system to act optimally depends on its capacity to distinguish foreign and self and to react to non-self. In higher organisms, the immune system is classified into the innate and adaptive immune system (3). The innate immune system is rapidly engaged in an unspecific manner to foreign pathogens or damaged self through recognition of pathogen-associated molecular patterns (PAMP) or damage-associated molecular patterns (DAMP) (4, 5). In contrast to the innate immune system, the adaptive immune system is activated over a longer time-period and is associated with controlled activation of T- and B lymphocytes (T- and B cells), with immense specificity towards its targets, and immunological memory (5). B cells are activated and differentiate into plasma cells that produce immunoglobulins (Ig), commonly referred to as antibodies, following interaction between soluble antigens binding to the B cell receptor (BCR). T cells on the other hand are activated through cell-to-cell interactions when the T cell antigen receptor (TCR) complex encounters peptide antigens presented to them by antigen presenting cells (APC). APCs present antigens through major histocompatibility complex I or II (MHCI and MHCII), which interact with the two major subsets of T cells, CD8 positive (CD8+) and CD4 positive (CD4+) T cells, respectively. CD8+ T cells are also called cytotoxic T lymphocytes (CTLs) while CD4+ T cells are designated as T helper cells (Th) (2). The CTLs target virus-infected cells and induce cell death by three mechanisms. The secretion of proinflammatory cytokines, interaction between the Fas ligand and Fas receptor, and the secretion of cytolytic granules containing perforin, which creates pores in the target cell allowing the entry of proteases, including Granzyme B, that induce apoptosis (6, 7). CD4+ T cells are indirectly involved in clearing infection by modulating the activity of other immune cells, including macrophages (Mø), neutrophils, B cells and CTLs (2). CD4+ T cells can be grouped into several subsets and include T helper (Th) 1 (Th1), Th2, Th9, Th17, Th22 as well as follicular helper T (Tfh) cells and regulatory T cells (Tregs). The CD4+ T cell subsets are defined by the distinct expression of surface molecules and endogenous production of cytokines, which are driven by the presence of extracellular cytokines and activation of key transcription factors (8). Tfh cells are primarily involved in promoting survival, proliferation and class-switching of germinal center B cells and support germinal center development. Th1, Th2, Th9, Th17, and Th22 subsets, on the other hand, are involved in host defense against specific microbial pathogens. The Th1 and Th2 subsets were the first Th cell subsets to be identified. Whereas Th1 cells kill intracellular bacteria through activating Mø and CTLs, Th2 cells are drivers of immune reactions directed against extracellular parasites (8, 9). Th17 cells, which are characterized by the transcription factor retinoic acid receptor (RAR)-related orphan receptor γ (RORγ) and production of the cytokines IL-17A, IL-17F, IL-21 and IL-22, are involved in protection against pathogens on mucosal surfaces (8, 10–12). Th22 cells also secrete IL-22, but in contrast to Th17 cells, do not secrete IL-17 nor express RORγ (13). As Th22 cells are mainly found in the skin where IL-22 induces expression of antimicrobial peptides in keratinocytes and epithelial cells they are likely involved in maintaining homeostasis in skin (13, 14). Th9 cells, which are characterized by the secretion of IL-9, are involved in immune responses towards extracellular parasites, allergic inflammation and anti-tumor immune response. Interestingly, the anti-tumor functions of Th9 cells were found to be superior as compared to Th1 and other Th subsets and involves activation of the innate and adaptive immune system, including, generation of a profound CTL response against neo antigens (15, 16). Recently, it has also become evident that CD4+ subset of T cells can be cytotoxic themselves. These cytotoxic CD4+ T cells can induce cell death through interacting with peptides presented on MHC II, similar to CD8+ CTLs (17). While the CD4+ subsets are crucial in clearing infection, dysregulation may also result in pathological conditions including autoimmune diseases, allergy and asthma (14, 15, 18, 19). While Th1 and Th17 cells are implicated in autoimmunity and Th2 cells are involved in allergic immune responses, Th22 cells appear to be involved in both autoimmunity and allergy (14, 20–22). Th9 cells have recently been implicated in tumor immunity and promoting tolerance to transplanted organs (15, 23, 24). The activities of T cell subsets are balanced in part by unique CD4+ Treg T cell subpopulation. Tregs are vital to immune homeostasis and self-tolerance, dampening inflammation, and preventing the development of autoimmune disease, but may also be involved in promoting cancer progression (25). The balance between pro-inflammatory and anti-inflammatory signals is critically important.
It is widely accepted that the fundamental processes in T cell biology, such as T cell activation, differentiation and effector functions are closely linked to changes in the cellular metabolic programs. Key metabolic pathways such as glycolysis, fatty acid synthesis and mitochondrial metabolism play a crucial role in T cell immunometabolism (26).
T cell metabolism is crucial for maintaining homeostasis in naïve and memory cells, while also priming cells for rapid activation. Additionally, T cell metabolism drives and mirrors the activation and differentiation states of T cells. The focus of this section will be on how activation of T cells and metabolism are related as well as how metabolic reprograming drives the phenotype of activated T cells.
Naïve T cells enter the circulation from the thymus and are actively maintained in a reversible form of cell cycle arrest by a combination of self-peptide–MHC engagement of the TCR/CD3 and by interleukin (IL)-7 stimulation (27). Activation of T cells leads to exit of the quiescent state, inducing cell growth, clonal expansion and differentiation. This process is initiated and regulated by three key factors, perturbation of cell surface receptors, nutrient availability and oxygen levels (28).
The magnitude of acute T cell activation depends on activation of the TCR and co-stimulation of a group of T cell surface co-receptors. These co-receptors include the CD3, CD4, CD8 CD28/CTLA4 and more (29). As mentioned, the CD4 and CD8 molecules directly interact with the MHC II and MHC I molecules, respectively, and influence the early mode of T cell activation. Interaction between the MHC-peptide complex and CD4/CD8 co-receptors is recognized by the TCR, leading to activation of a signaling complex composed of the protein tyrosine kinase (PTK) C-terminal Src kinase (Csk) and lymphocyte-specific protein kinase (Lck). These kinases phosphorylate the immunoreceptor tyrosine kinase-based activation motifs (ITAMs) on the ζ-chain of CD3. This induces downstream signaling by the recruitment, phosphorylation and activation of the zeta-chain associated protein kinase 70 (ZAP70). ZAP70 initiates a downstream signaling cascade and includes activation of phospholipase Cγ1 (PLCγ1), which promotes calcium mobilization, activation of protein kinase C (PKC) and activation of Ras pathway (30–32). The combination of these signaling cascades promotes activation of several transcription factors, including Nuclear factor kappa-light-chain-enhancer of activated B cells (NFκB), Nuclear factor of activated T-cells (NFAT) and Activator protein 1 (AP-1). This leads to production and secretion of the T cell-specific growth factor IL-2 (33–38). The costimulatory receptor CD28 interacts with its ligands CD80 and CD86, which are differentially expressed by APCs. CD86 is constitutively expressed on APCs, while expression of CD80 is induced by stimulation of Toll-like receptors (TLRs) (39). Activation of CD28 leads to cross phosphorylation of intrinsic CD28 receptor tyrosine residues followed by attachment and activation of phosphatidylinositol kinase 3 (PI3K) (40, 41). PI3K phosphorylates phosphatidylinositol 4,5-bisphosphate (PIP2) to phosphatidylinositol 3,4,5 phosphate (PIP3), leading to activation of protein kinase B (PKB or Akt) and NFκB. This pathway regulates T cell survival through the expression of the anti-apoptotic gene B-cell lymphoma-extra-large (BCL-XL) and Akt-dependent upregulation of IL-2 production (39). CTLA4, however, is considered an inhibitory receptor and stimulation will, to some extent, suppress TCR/CD3-CD28 induced activation by competing with CD28 for CD80/86. Perturbation of the CTLA4 receptor will lead to the recruitment of endogenous protein tyrosine and serine/threonine phosphatases. This includes Src homology protein 2 domain-containing tyrosine phosphatase 2 (SHP-2) and protein phosphatase 2A (PP2A). This will lead to dephosphorylation and inhibition of several proteins in the signaling pathway, including ZAP70, consequently reducing the activation, growth and clonal expansion of T cells (42–47). Exhausted T cells (see below for an explanation) may be found in the environment of chronic infections and cancer cells often display increased expression of inhibitory receptors, including CTLA4 and programmed death receptor 1 (PD-1) (45, 48).
Naïve T cells have relatively low metabolic activity (49), but in response to activating stimuli, metabolic activity is rapidly increased (50). This rapid response is possible due to increased nutrient uptake post stimulation. This may occur concomitant with the presence of untranslated mRNA, idle ribosomes, rapid turnover of transcription factors required for T cell activation, and the presence of an abundance of most of the glycolytic enzymes in quiescent T cells. Together this facilitates upregulation of protein, DNA and lipid synthesis (51, 52). Perturbation of the TCR/CD3 complex and the CD28 marker is further associated with activation of Calcium Calmodulin-dependent protein kinase 2 (CaMKK2) (53). CaMKK2 is known to activate the energy sensor AMP-dependent protein kinase (AMPK) in T cells (54, 55). AMPK is an energy sensor, which is mainly activated by low levels of ATP and liver kinase B1 (LKB1)-dependent phosphorylation (56). Although AMPK is commonly activated in response to an increased ADP/ATP ratio, TCR/CD3-CD28 signaling increases mitochondrial biogenesis and activation of this energy associated enzyme independently of the ADP/ATP ratio (55). This suggests that AMPK activation and increased mitochondrial biogenesis is induced in preparation for the energy demands required for T cell growth and proliferation. Engagement of TCR/CD3-CD28 also promotes recruitment of PI3K and activation of Akt in the immune synapse. This regulates the activity of the mammalian target of rapamycin, mTOR/raptor complex 1 (mTOR complex 1/mTORC1) through inhibition of the key upstream regulator tuberous sclerosis complex 2 (TSC2), which functions as a GTPase activity protein (GAP) for Ras homolog enriched in brain (Rheb) GTPase (57). mTOR kinase forms two distinct protein complexes, mTORC1 and mTORC2, which are crucial for driving differentiation of CD8+ and CD4+ T cells (58). The mTORC1 complex is defined as regulatory-associated protein of mTOR (RAPTOR), while mTORC2 is defined as rapamycin insensitive companion of mTOR (RICTOR) (57).
The GTP-bound form of Rheb directly interacts with mTORC1, which tunes the induction and activity of several transcription factors involved in regulation of mitochondrial activity and biomass production. This includes sterol regulatory element-binding proteins (SREBP) hypoxia-inducible factor 1α (HIF-1α) and MYC, resulting in increased glycolysis, glutaminolysis and lipid synthesis (59). mTORC2, on the other hand, is more involved in fatty acid oxidation and negatively regulates CD8+ T cell memory differentiation through Akt-dependent phosphorylation of forkhead box protein O1 (FOXO1) resulting in cytosolic retention (60, 61). mTORC2 directly phosphorylates Akt on Serine 473, thereby, promoting the expression of glucose transporter 1 (GLUT1), activating hexokinase 2 (HK-2) and phosphofructokinase-1 (PFK-1), phosphorylation and expression of 2-phosphofructkinase 6/fructose 2,6-bisphosphatase (PFKFB)-3 and 4. This promotes in increased glucose uptake and glycolysis (summarized in Figure 1) (62–65). TCR/CD3-CD28 stimulation is further associated with induction of lactate-dehydrogenase A (LDHA) that converts pyruvate to lactate (66). This metabolic reprograming of T cells result in increased glycolysis and lactate production despite presence of oxygen (67). This process is commonly referred to as the Warburg effect and supports accumulation of glycolytic intermediates that can enter the pentose phosphate pathway (PPP), to produce ribose 5-phosphate (R5P), which is used in nucleotide synthesis. The Warburg effect is also associated with the production of nicotinamide adenine dinucleotide phosphate (NADPH), which has two main functions; it acts as a redox agent and is essential as an electron donor in anabolic biomass synthesis (67, 68). TCR/CD3 and CD4/CD8-induced PTK activity phosphorylates the muscle form of pyruvate kinase (PKM2) leading to nuclear localization of PKM2 dimers, which participate in regulating gene expression rather than glycolysis (69). In fact, regulation of PKM2 activity is a key factor together with pyruvate dehydrogenase kinase 1 (PDK1) in preventing pyruvate entering the mitochondrion. PDK1 inhibits the enzyme pyruvate dehydrogenase (PDH), which catalyzes the formation of acetyl co-enzyme A (AcCoA) and TCA cycle entry. This leads to accumulation of pyruvate in the cytosol, which is used to produce lactate and regenerate NAD+ from NADH (70, 71).
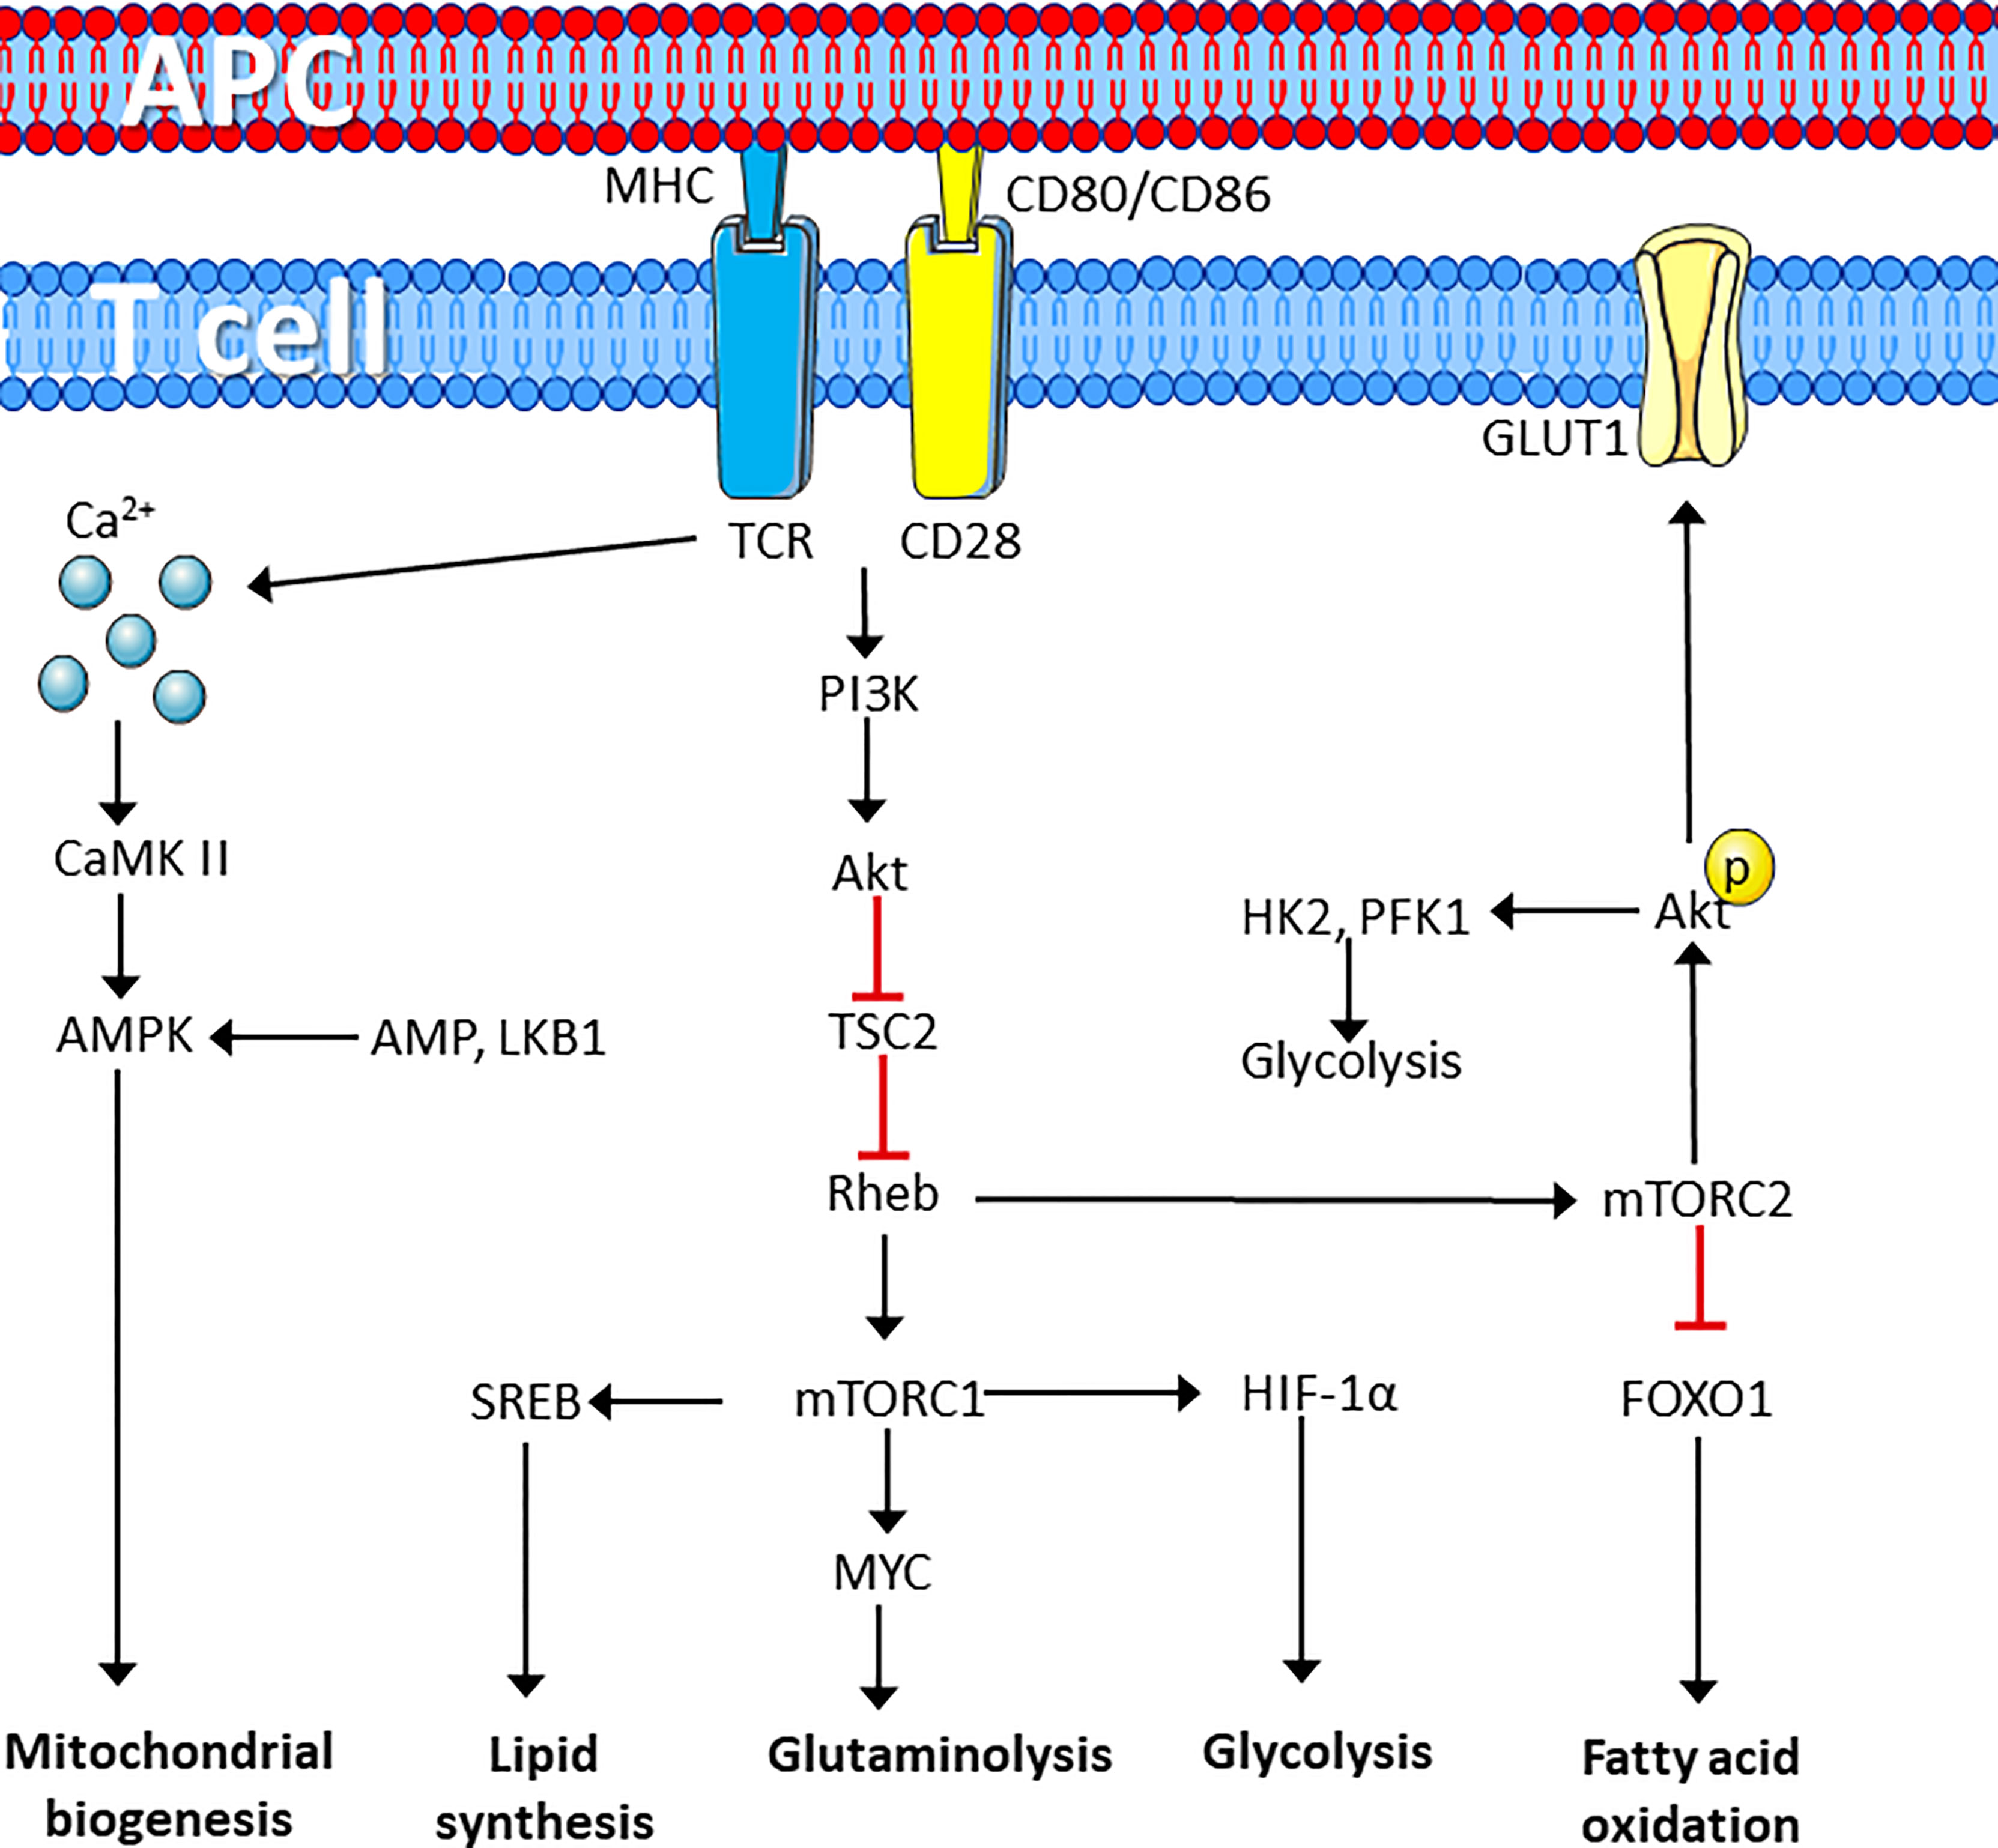
Figure 1 T cell receptor perturbation drives metabolic reprograming. T cell activation by ligation of the TCR and CD28 cell surface marker induces metabolic reprograming through activation of protein kinases that induces calcium dependent activation of the AMPK pathway to induce synthesis of mitochondria. In addition, mTORC1 activation induces lipid synthesis and enhances lipid synthesis, glutaminolysis and glycolysis required for rapid proliferation, whereas mTORC2 induces glucose uptake and glycolysis while repressing fatty acid oxidation. Figure was created using assets from Servier Medical Art, licensed under a Creative Common Attribution 3.0 Generic License. (http://smart.servier.com/). APC, antigen presenting cell; TCR, T cell receptor; PI3K, phosphatidylinositol kinase 3; CaMK II, calcium calmodulin-dependent kinase II; AMPK, adenosine monophosphate-dependent kinase; TSC2, tuberous sclerosis complex 2; Rheb, RAS homolog enriched in the brain; LKB1, liver kinase B1; SREB, sterol regulatory element-binding proteins; HIF-1α, hypoxia-inducible factor 1 α; mTORC, Mechanistic target of rapamycin complex; GLUT1, Glucose transporter 1; FOXO1, forkhead box O1; FAO, fatty acid oxidation; HK1, hexokinase 1; PFK-1, phosphofructokinase 1.
Many proliferating cells, including TCR/CD3-CD28 stimulated T cells, may adopt profiles associated with oxidative phosphorylation (OXPHOS) when glucose is limited. This is achieved by increased uptake and metabolism of the amino acid glutamine (72). This requires upregulation of the glutamine transporter, alanine-serine-cysteine transporter 2 (ASCT2/SLC1A5) and differential regulation of the glutaminase (GLS) isoforms, kidney glutaminase (KGA) and glutaminase C (GAC) (73, 74). TCR/CD3-CD28 co-stimulation upregulates expression of GAC, while downregulating KGA. GLS catalyzes the deamidation of glutamine to glutamate, which is the first step of glutaminolysis. Glutaminolysis is mainly regulated through MYC-induced expression of key genes (75). Glutamine metabolism is crucial for proliferating cells as it is involved in several metabolic pathways. This includes production of α-ketoglutarate (α-KG) from glutamate and alanine by transferring the amino group from glutamate to pyruvate by alanine aminotransferase (ALT) (76). The product, α-KG may enter the TCA cycle to form citrate. Citrate can be shunted out of the mitochondrion to support cytosolic AcCoA levels and used as a substrate lipogenesis and mevalonate metabolism as well as cholesterol synthesis (77, 78). α-KG may also support production of carbon intermediates in the TCA cycle and the production of reduced forms of the electron donors NADH and flavin adenosine dinucleotide (FADH) required for OXPHOS (79). Glutaminolysis also supports production of NADPH through the PPP and TCA cycle, which along with glutamate and cysteine, is used to produce the antioxidant glutathione (GSH) (80, 81). Finally, glutaminolysis provides both carbon and nitrogen residues used for synthesis of polyamines, amino acids and DNA and RNA nucleotides (82). Inhibition of glutaminolysis as well as reduced ornithine and putrescine synthesis decrease T cell proliferation, highlighting the important role of glutaminolysis (83).
As glutamine has a central role in proliferating cells, including activated T cells, glutamine is sometimes referred to as a conditionally essential amino acid. In fact, exogenous glutamine deprivation and inhibition of glutaminolysis prevent T cell activation, proliferation and clonal expansion (84). This reliance on glutamine metabolism is sometimes referred to as “glutamine-addition”. Glutamine-dependent anapleurosis is further known to dictate glucose uptake and glycolysis in proliferating cancer cells (85, 86). Extracellular glutamine depletion is also associated with metabolic reprogramming, as glutamine synthetase (GS) converts glutamate to glutamine, is upregulated (87). Glutamine anapleurosis can also be used to produce the amino acid asparagine, which in addition to being important for protein synthesis, is also regulating activation of T cells by directly enhancing Lck activity (88–90). In response to glutamine deprivation, asparagine becomes an essential amino acid. Despite this, mammals do not possess functional asparaginase, the enzyme required for asparagine to re-enter the TCA cycle (89). In fact, ectopic expression of the catalytically active asparaginase inhibits cell growth and proliferation by redirecting asparagine to the TCA cycle rather than protein synthesis (89, 91). Arginine is another amino acid important for T cell activation, and supplementation of extracellular arginine increases long-term survival and effector functions of T cells, accompanied by a reduction in glycolysis and enhanced oxidative phosphorylation (92). T cell activation and clonal expansion also require uptake of the amino acids cysteine, methionine and the branched chain amino acid (BCAA) leucine. While naïve T cells do not express transporters for cysteine and cystine, this is rapidly induced by CD3/CD28-induced activation. In early activation, uptake of cysteine and methionine is crucial for proliferating T cells (93). Leucine is important for determining the fate of CD4+ T cells as it regulates activation of mTORC1. During leucine depletion the leucine sensor sestrin 2 (SESN2) binds to the GTPase-activating protein towards Rags-2 (GATOR2), forming an inhibitory complex towards mTORC1 (94, 95). Loss of the leucine transporter SLC7A5/LAT1 (CD98) limits T cell activation and effector maturation owing to impairments in mTORC1 activity (96). Finally, serine is used for one-carbon metabolism and purine synthesis through the B vitamin 10-formyltetrahydrofolate. Serine also supports 5-methyltetrahydrofolate, and generation of the methyl donor S-adenosyl methionine (97).
In addition to nutrient availability, oxygen tension also varies greatly in different tissues. Many lymphoid organs, including spleen and thymus, are known to have low oxygen levels and are considered to be in a state of physiological hypoxia (<4% O2) (98). T cells, which are highly mobile in nature encounters a wide range of oxygen levels in the body. For example, during thymic development, thymocytes inhabit within relatively low oxygen (< 1%). Activated T cells are faced with both high oxygen levels in the lungs and arterial blood as well as the hypoxic and anoxic conditions in inflammatory lesions and tumors (99–101). As low oxygen concentration is metabolically challenging, hypoxia induces metabolic programs required to adapt to the environment. T cell differentiation, function and survival is known to be affected by exposure to hypoxia, a response mainly mediated by the transcription factor HIF-1α, directly or indirectly (98). HIF-1α, is stabilized and heterodimerizes with the constitutively expressed HIF-1β, also known as aryl hydrocarbon receptor nuclear transporter (Arnt) under hypoxic conditions. The HIF complex translocate into the nucleus where it binds to hypoxia response elements (HREs) (102). In the presence of oxygen, HIF-1α is rapidly degraded by the enzyme prolyl hydroxylase domain proteins (PHD) 1, 2 and 3, thus the HIF-1α complex has limited transcriptional activation capacity in normoxia. HIF-1α induces a metabolic shift by inducing a glycolytic phenotype mediated by increased expression of genes involved in glucose uptake and glycolysis, including GLUT1, HK2, PKM2, LDHA, while actively reducing glucose oxidation through the expression of PDK1 (102–104). This indicates that HIF-1α induces a metabolic phenotype where glycolysis is the primary source for ATP. As pyruvate is shunted towards lactate, rather than the TCA cycle, this reduces the ability to produce citrate. To compensate for this, cells at hypoxia produce citrate and cytosolic AcCoA required for fatty acid synthesis through glutaminolysis. In this case, α-KG is metabolized to citrate through the TCA cycle in a reverse fashion by reductive carboxylation. These reactions are catabolized by the two isocitrate dehydrogenase (IDH) isozymes, IDH1 and IDH2, which are induced by low oxygen (105, 106). This demonstrates that during hypoxia, HIF-1α drives T cells to adapt a metabolic phenotype relying on glycolysis and glutaminolysis to support proliferation and clonal expansion.
In addition to its role in early activation, it has become increasingly clear that distinct metabolic programs define the various T cell subsets (Figure 2) (107). It is also known that T cell differentiation can be manipulated through modulating metabolic activity in vitro (108–110). However, the extent of how metabolism affects T cell function in response to infection is not fully understood.
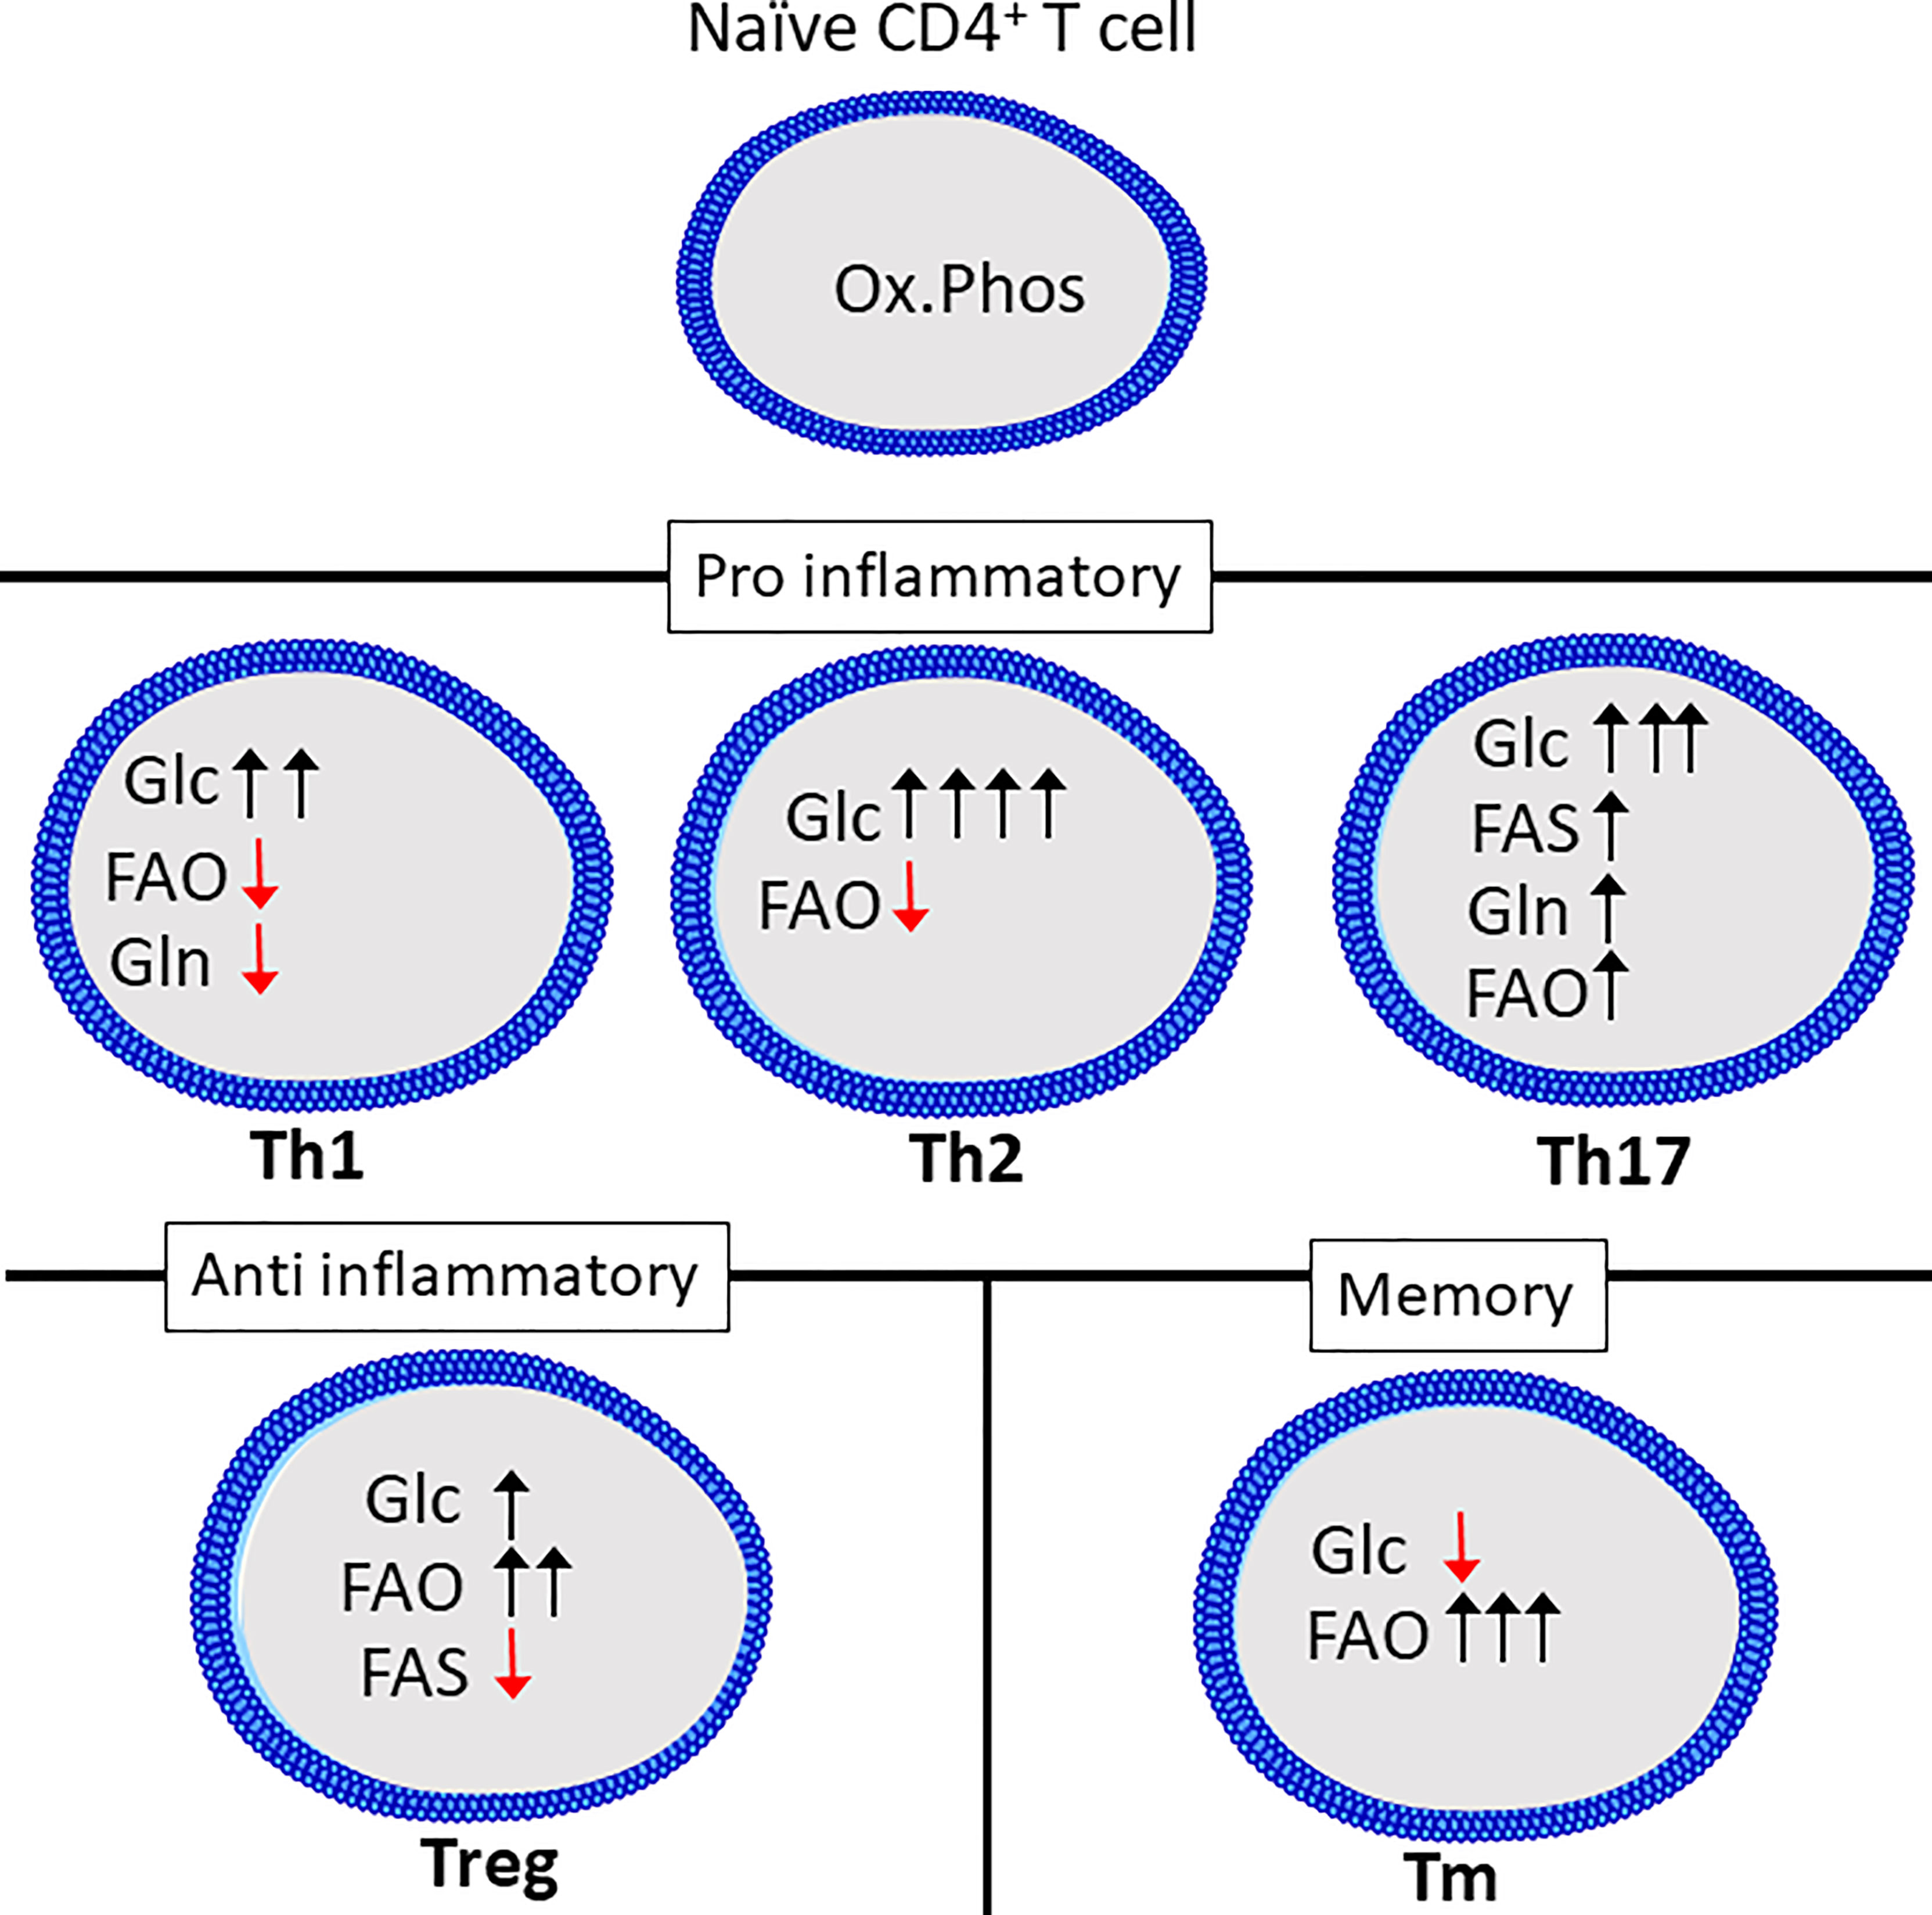
Figure 2 Th subsets display distinct metabolic programs. Quiescent Th cells rely mainly on oxidative phosphorylation (Ox.Phos) to maintain homeostasis, while the effector subsets are characterized by increased glycolytic metabolism (Glc) as well as a differential reliance on glutaminolysis (Gln), fatty acid oxidation (FAO and fatty acid synthesis (FAS) to support effector functions. Figure was created using assets from Servier Medical Art, licensed under a Creative Common Attribution 3.0 Generic License. (http://smart.servier.com/t).
As mentioned, naïve T cells generate most of their ATP from oxidative phosphorylation and in general display a less energetic state than activated T cells yet can rapidly reprogram metabolism upon activation (50, 111, 112). This rapid response towards antigen is likely made possible by the rapid turnover of proteins (51). While this metabolic reprograming stems, at least in part, from an increased demand for ATP to fuel rapid proliferation, there is also increasing evidence that fine-tuning of specific metabolic pathways drive differentiation into various subsets. This is best characterized for the Th1, Th2 and Th17 subsets.
Th1, Th2 and Th17 cell differentiation induces three distinct metabolic phenotypes. However, all subsets have a relatively high rate of glycolysis when compared to Tregs, naïve or memory T cells (113). While Glucose is known to be crucial for T cells to produce IFNγ, as cells cultured in galactose have severely reduced IFNγ-secretion. This has been linked to the dual role of the enzyme glyceraldehyde 3-phosphate dehydrogenase (GAPDH), as it can bind to, and repress translation of IFNγ mRNA (110). This was shown to be related to glucose-derived mannose combustion. Supplementation with mannose could partially restore IFNγ production in cells cultured with the glycolysis inhibitor 2-deoxy-D-glucose (2DG). Interestingly, the transcription factor T-bet, which is crucial for Th1 differentiation, was reduced when cells were cultured in the presence of galactose, but was restored by mannose supplementation (114). Lastly, inhibition of GLS-1 has been shown to increase Th1 differentiation (73). Th2 cells are reportedly the most glycolytic of the Th subsets, correlating with high expression of GLUT1 and low rate of fatty acid oxidation (113). mTORC2, which as previously mentioned, is an important regulator of fatty acid oxidation and glycolysis, is also important for differentiation of Th1 and Th2 cells through distinct mechanisms. Th1 cells depend on mTORC2-dependent phosphorylation of Akt, while Th2 cells depend on phosphorylation of PKC (115). Peroxisome proliferation activating receptor-γ (PPAR-γ), which is a regulator of fatty acid metabolism, is also involved in promoting Th2 differentiation while repressing Th1 differentiation (116). Th17 differentiation induces a metabolic phenotype distinct from both Th1 and Th2 cells. Th17 differentiation requires HIF-1α stabilization and induction of PDHK1, preventing mitochondrial pyruvate oxidation in favor of lactate production (71, 104, 117). GLS1-dependent glutamine metabolism is also a crucial factor for Th17 differentiation (109). GLS1 expression in T cells can be induced by the transcription factor inducible cAMP early repressor (ICER) (109). Blocking GLS1 shifts Th17 cells to a Th1-like phenotype (73). Th17 differentiation also requires fatty acid synthesis (118). The metabolic phenotype of Th9 and Th22 cells is not as extensively studied compared to that of the other CD4+ effector cells. However, Th9 cells have a higher glycolytic rate than both Th2 and Th17 cells, and require activation of mTORC1 and HIF-1α (119).
Treg differentiation depends on the oxidation of long fatty acids, induced by activation of AMPK (113). Although Tregs upregulate glycolysis compared to naïve cells this is to a lesser degree than the effector CD4+ T cells and it is not necessary to support Treg differentiation (113, 120). In support of this Treg differentiation is inhibited in favor of Th17 differentiation by HIF-1α-induced glycolysis (117, 121). In fact, increasing glucose uptake and glycolysis in Tregs represses suppressor functions despite increasing proliferation (122, 123). Compared to effector CD4+ T cells, Tregs depend on fatty acid oxidation to fuel mitochondrial respiration (120). Treg differentiation may also be reduced by the presence of exogenous amino acids including glutamine, tryptophan and arginine (124). Lastly, extracellular lactate may enhance Treg function through uptake via the monocarboxylate transporter 1 (MCT1) (123).
Memory subsets of T cells are characterized by a reliance on fatty acid oxidation and low rate of glycolysis (125). Supplementing the amino acid arginine has been shown to enhance memory formation and reprogram T cells from a glycolytic to an oxidative phenotype (92). Similar to naïve T cells, memory T cells have a rapid turnover of proteins related to activation, including glycolytic enzymes (51).
The microenvironment is also important for modulating T cell activity and metabolism. Recently, it was discovered that T cells create acidic niches within lymphoid organs to dampen effector functions (126). This is also well-defined in the tumor microenvironment (TME), which is characterized by the presence of anti-inflammatory cytokines, low levels of oxygen and acidification by lactate (127–130). In rheumatoid arthritis the microenvironment of the synovium exerts pro-inflammatory effects on the CD4+ T cells by repressing glycolytic rate (131). It is further known that increased body temperature may enhance proliferation and effector functions of both CD4+ and CD8+ T cells (132, 133) Together this demonstrates how the microenvironment may shape T cell activity.
T cell exhaustion is featured in both cancer and persistent infections. Exhausted T cells can be defined by an increased expression of inhibitory ligands, including PD-1 and CTLA-4 and are more apoptotic than effector and memory cells (48, 134). Exhausted T cells also display a distinct metabolic phenotype, with reduced glucose uptake as well as mitochondrial dysfunction, which reduces capacity for oxidative metabolism. The presence of extracellular metabolites as well as low abundance of important nutrients may further inhibit metabolism and prevent the appropriate T cell activity (135, 136).
As detailed above, T cell metabolism and functionality are closely related and metabolic reprograming is crucial for appropriate T cell activity. In this section, we will briefly describe how T cell metabolism is regulated in certain acute infections and how T cell metabolism may aid or hinder pathogen clearance under acute and chronic conditions of infection. We will use examples of virus infections by SARS-CoV-2 and HIV as these viruses are known to induce differential effects on T cell metabolism. We will also briefly describe T cell metabolism in bacterial infections, here exemplified by infections of Mycobacterium tuberculosis.
When T cells are engaged in the immune response, they can be roughly divided into naïve, effector and memory cells, each with accompanying metabolic programs (137). The immune system, when properly regulated will have a protective role. However, in some cases the immune system might exasperate the inflammation associated with infection (138). This is apparent for SARS-CoV-2 infections, which cause the well-known coronavirus disease 2019 (COVID-19). Despite that the underlying molecular mechanism responsible for sustaining SARS-CoV-2 virulence is enigmatic, how SARS-CoV-2 attaches on the surface of host cells through a variety of receptors is in part well described. Attachment may be through receptors, such as angiotensin converting enzyme 2 (ACE2), neuropilin-1 (NRP1), AXL, and antibody–FcγR complexes (139). ACE2 is expressed in various human organs and may play a role in regulating cardiovascular and renal function. In addition, the ACE2 protein is a functional receptor for the spike glycoprotein of the human coronavirus and is considered a causative agent of COVID-19 disease. Next, NRP1 is a membrane-bound coreceptor to a tyrosine kinase for both vascular endothelial growth factor (VEGF) and semaphorin (SEMA3A) family members, both playing versatile roles in angiogenesis, axon guidance, cell survival, migration, and invasion. Furthermore, the gene AXL, which encodes the tyrosine-protein kinase receptor UFO, is involved in stimulation of cell proliferation and survival through PI3K-AKT-mTOR, MEK/ERK, NF-κB, and JAK/STAT activation (140–143). In line with the fact that COVID-19 uses receptor ligation for infection, several reports reveal that COVID-19 ligation through and activation of the above-mentioned signal transduction molecules, induces metabolic reprogramming (144, 145). In fact, this metabolic reprograming can be detected by positron emission tomography (PET) by increased accumulation of 18F labelled fluorodeoxyglucose (FDG) (146). This metabolic reprograming is also associated with a distinct profile of serum metabolites, which might be used as a prognostic measurement of disease severity (147). It has further been demonstrated that this increased level of FDG in the tissue correlate with increased glycolysis in several cells, including epithelial cells and immune cells, reviewed by Kumar (148). Notably, peripheral blood mononuclear cells (PBMCs) display metabolic dysfunction, characterized by increased glycolysis and reduced oxygen consumption (149). SARS-CoV 2-infected monocytes also show enhanced glycolytic rate. Interestingly, the same study reports that increasing extracellular glucose concentration increased SARS-CoV 2 replication in monocytes (150). Because of this central role of glycolysis in COVID-19 the glucose analog 2-deoxy-D-glucose (2DG), which inhibits glycolysis, has undergone a phase III trial and received emergency approval in the treatment of moderate and severe COVID-19 in India. However, the trial was conducted in only 220 patients and the data has not been made available to the public (151). In this review we have mainly focused on the metabolism of T cells in response in COVID-19.
In both CD4+ and CD8+ T cells COVID-19 inhibits activation of mTORC1, which reduces glycolytic activity, as well as causing mitochondrial dysfunction and increased susceptibility to apoptosis (Figure 3) (145). In line with this, expression levels of GLUT1 are reported to be decreased in T cells in patients with severe COVID-19 as compared to healthy controls or patients infected by influenza virus. However, contradictory results exist. A study by De Biasi et al., showed with one exception that T cells from COVID-19 patients had a similar capacity for metabolic reprogramming to non-infected T cells (152). However, the COVID-19 patients all required respiratory aid, while most patients in the latter study had pO2 >90%. This might indicate a link between metabolic alteration, mitochondrial dysfunction and declining oxygen saturation (145, 152). This is supported by a study by Siaska et al., where T cell metabolism was differentially affected in mild compared to moderate and severe disease. This was evident by an elevated uptake of fatty acids in T cells from patients with mild or no symptoms, while glucose uptake was similar to that of quiescent T cells from healthy controls (153). This study also revealed that moderate and severe disease was correlated with increased mitochondrial content, ROS and expression of basigin, which is reported to drive hyperinflammation and bone degradation in rheumatoid arthritis (153, 154).
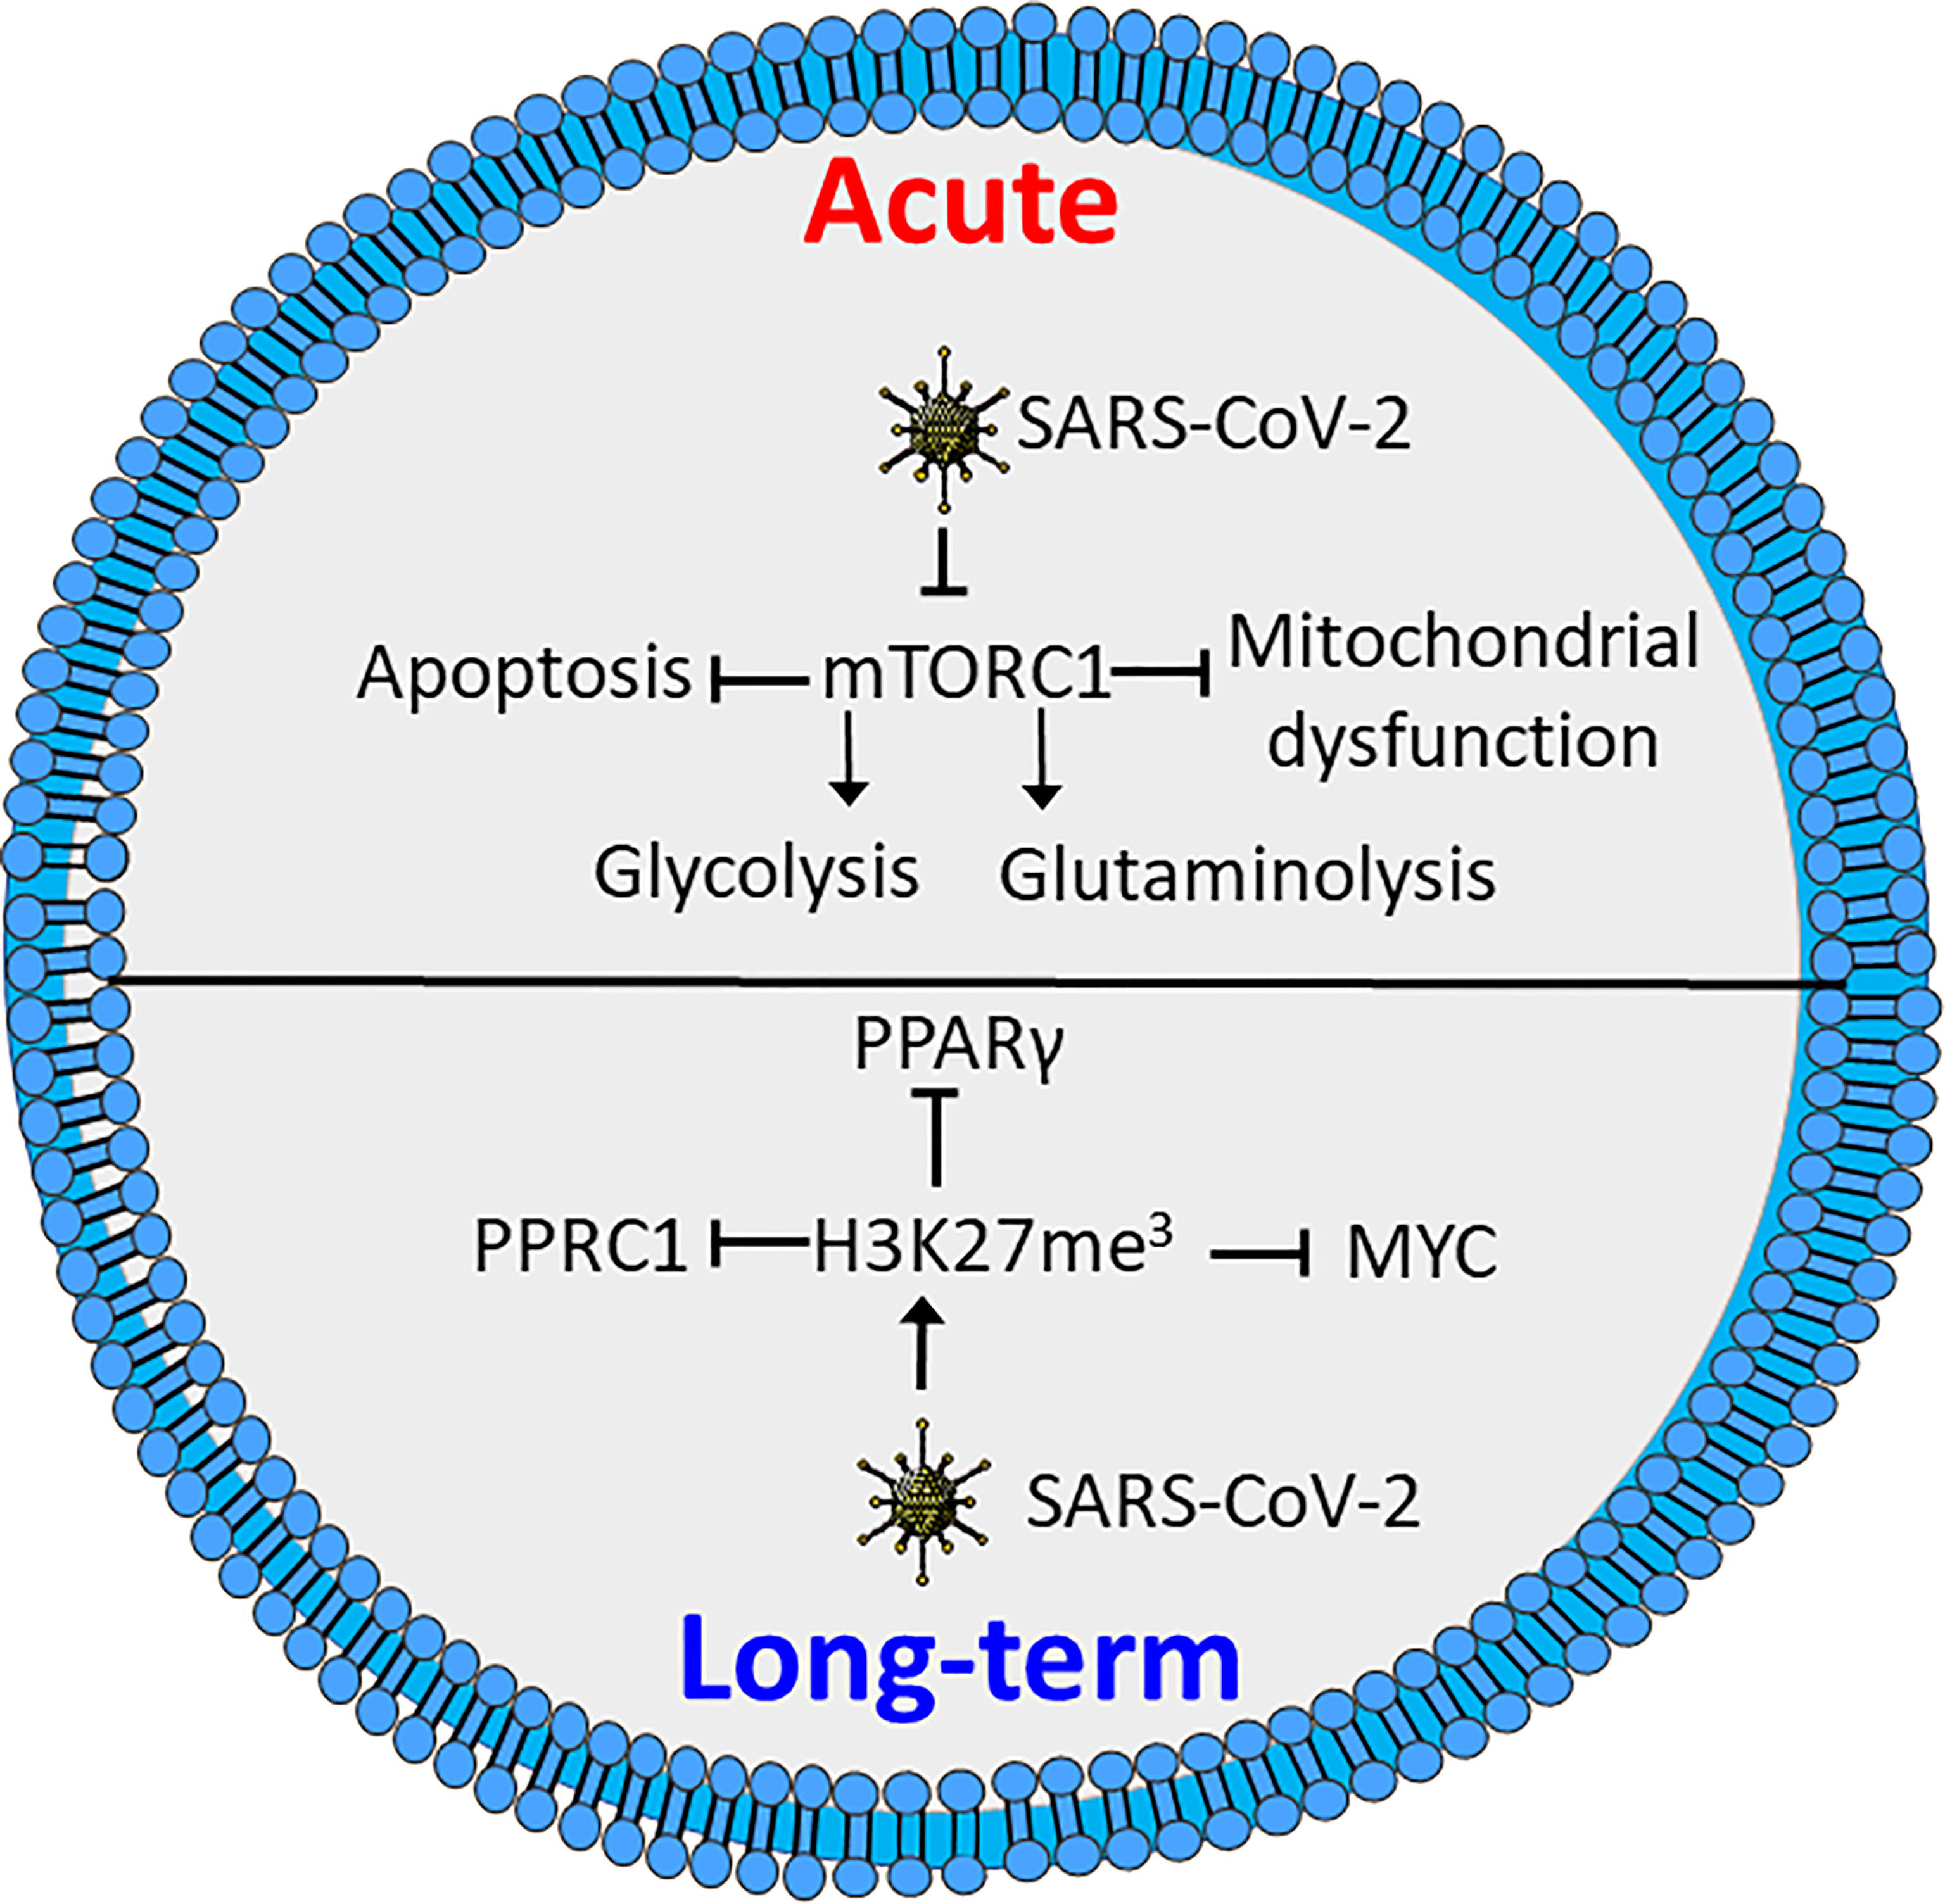
Figure 3 SARS-CoV-2 induces metabolic defects in acute and long-term infection. Acute infection by SARS-CoV-2 inhibits activation of mTORC1, causing reduced glycolysis and glutaminolysis as well as enhanced apoptosis and mitochondrial defects. Long-term SARS-CoV-2 induces triple methylation of histone 3 lysine 27 (H3K27me3), resulting in reduced activation through inhibition of MYC peroxisome proliferator-activated receptor γ (PPARγ) and peroxisome proliferator-activated receptor gamma coactivator-related protein 1 (PPRC1). Figure was created using assets from Servier Medical Art, licensed under a Creative Common Attribution 3.0 Generic License. (http://smart.servier.com/).
Several studies have shown that recovered COVID-19 patients display symptoms for weeks or months after disease onset, commonly referred to as “long COVID” (155–157). These symptoms include chest pains, joint pains, cognitive disorders, anxiety, depression and neurological disorders. Long COVID even affects individuals who initially had mild symptoms upon infection (155, 156, 158). Interestingly, T cells from COVID-19 patients reportedly have increased levels of triple methylated histone 3 lysine 27 (H3K27me3), a potentially epigenetic effect that persists in recovered patients (159). Reports demonstrate that the H3K27me3 modification represses T cell activation, differentiation and metabolic activity, by inhibiting expression of several transcription factors involved in metabolic regulation. These include MYC, PPARγ and peroxisome proliferator-activated receptor gamma coactivator-related protein 1 (PPRC1) (Figure 3) (160, 161). A recent study demonstrates a correlation between neurologic symptoms in recovered patients and T-cell immune reactivity. Patients with neurologic symptoms were also shown to have a distinct T-cell phenotype compared to healthy COVID convalescents. Notably, in individuals with long COVID Tfh cells had increased reactivity to the nucleocapsid of the SARS-CoV-2 virus, while the COVID convalescents showed reactivity towards spike proteins (157). This is consistent with an earlier study revealing that T cells from patients with neurological symptoms following COVID-19 recovery, displayed a distinct reactivity. The same study also showed an increase in the population of exhausted CD4+ T cells (162). Whether these effects are related to the epigenetic changes induced by methylation of H3K27 is not clear. Further studies will be needed to determine how T-cell metabolism and metabolic dysfunction are correlated to COVID-19 disease severity and if similar phenomena can be found for other infectious agents.
As T-cell metabolism is correlated to both short-term survival and long-term effects further studies of T-cell metabolism in COVID-19 may result in better stratification of patients as well as offering new therapeutic targets to minimize the impact of COVID-19.
The excessive immune response for severely affected patients may be caused by so called cytokine storms, which is simply defined as release of too many cytokines into the blood too quickly (163). In patients where this occurs, coupled with inability to clear infection leads to chronic infection, a condition leading to T-cell exhaustion (137). Exhausted T cells are characterized by an increased expression of inhibitory markers and a progressive and hierarchical loss of function as seen in HIV infections, where HIV is the causative agent for acquired immunodeficiency syndrome (AIDS) (164). HIV target the CD4 cell surface marker, allowing infection of CD4+ T cells and Mø (165). During the acute phase of HIV infection, most patients experience a marked increase in HIV viral load coupled with increased levels of the PD‐1 receptor on HIV‐infected T cells. Untreated patients will in this case experience T-cell exhaustion. The positive effects of antiretroviral therapy (ART), which in most cases significantly inhibits viral replication, also lowers high PD-1 expressing T cells, suggesting a link between viral load and the level of PD-1 expressing T cells (166, 167). The HIV virus infects cells by first interacting with CD4, followed by interaction with the chemokine receptor CCR5 on Mø or CXCR4 on T cells (168). In addition to CD4 and CXCR4, HIV is reported to exploit GLUT1 to infect T cells (169). GLUT1 expression has been shown to be elevated on circulating CD4+ T cells in patients with chronic HIV-1 infection. As HIV-induced surface expression of GLUT1 coincide with increased glucose uptake and increased glycolytic activity (Figure 4) (170, 171) it is likely that such a metabolic pattern mirror HIV infected CD4+ T cells in AIDS patients. Recently, it was demonstrated that in acute HIV-1 infections, viral replication is correlated with increased expression of nucleotide-binding domain leucine-rich repeat-containing receptor X1 (NLRX1). NLRX1 is most likely required for the HIV-induced metabolic reprograming of CD4+ T cells and leads to increased glycolysis and oxygen consumption. Interestingly, blocking glycolysis using the glucose analogue 2DG or mitochondrial respiration using rotenone or metformin inhibits HIV replication in CD4+ cells (171). This is in line with the fact that CD4+ T cells cultured with the simple sugar galactose exhibit less viral replication and reduced HIV-induced cell death, supporting that HIV infections requires glycolytic activity (172). Furthermore, some HIV-infected patients maintain low virus titers even without ART. This was associated with distinct HIV-specific CD8+ T cells. Such CD8+ T cells can be distinguished from CD8+ T cells from patients sensitive to ART. In the ART-insensitive patients, the CD8+ T cells expressed enhanced levels of mTORC2 and increased fatty acid oxidation. and ART-insensitive patients were further associated with formation of increased numbers of CD8+ memory T cells Interestingly, in ART treated CD8+ T cells, treatment with IL15 reflected increased mTORC2 expression and a fatty acid consuming phenotype (173). In line with these observations, T-cell metabolism may have prognostic potential, and may even provide therapeutic targets in cases of HIV infections.
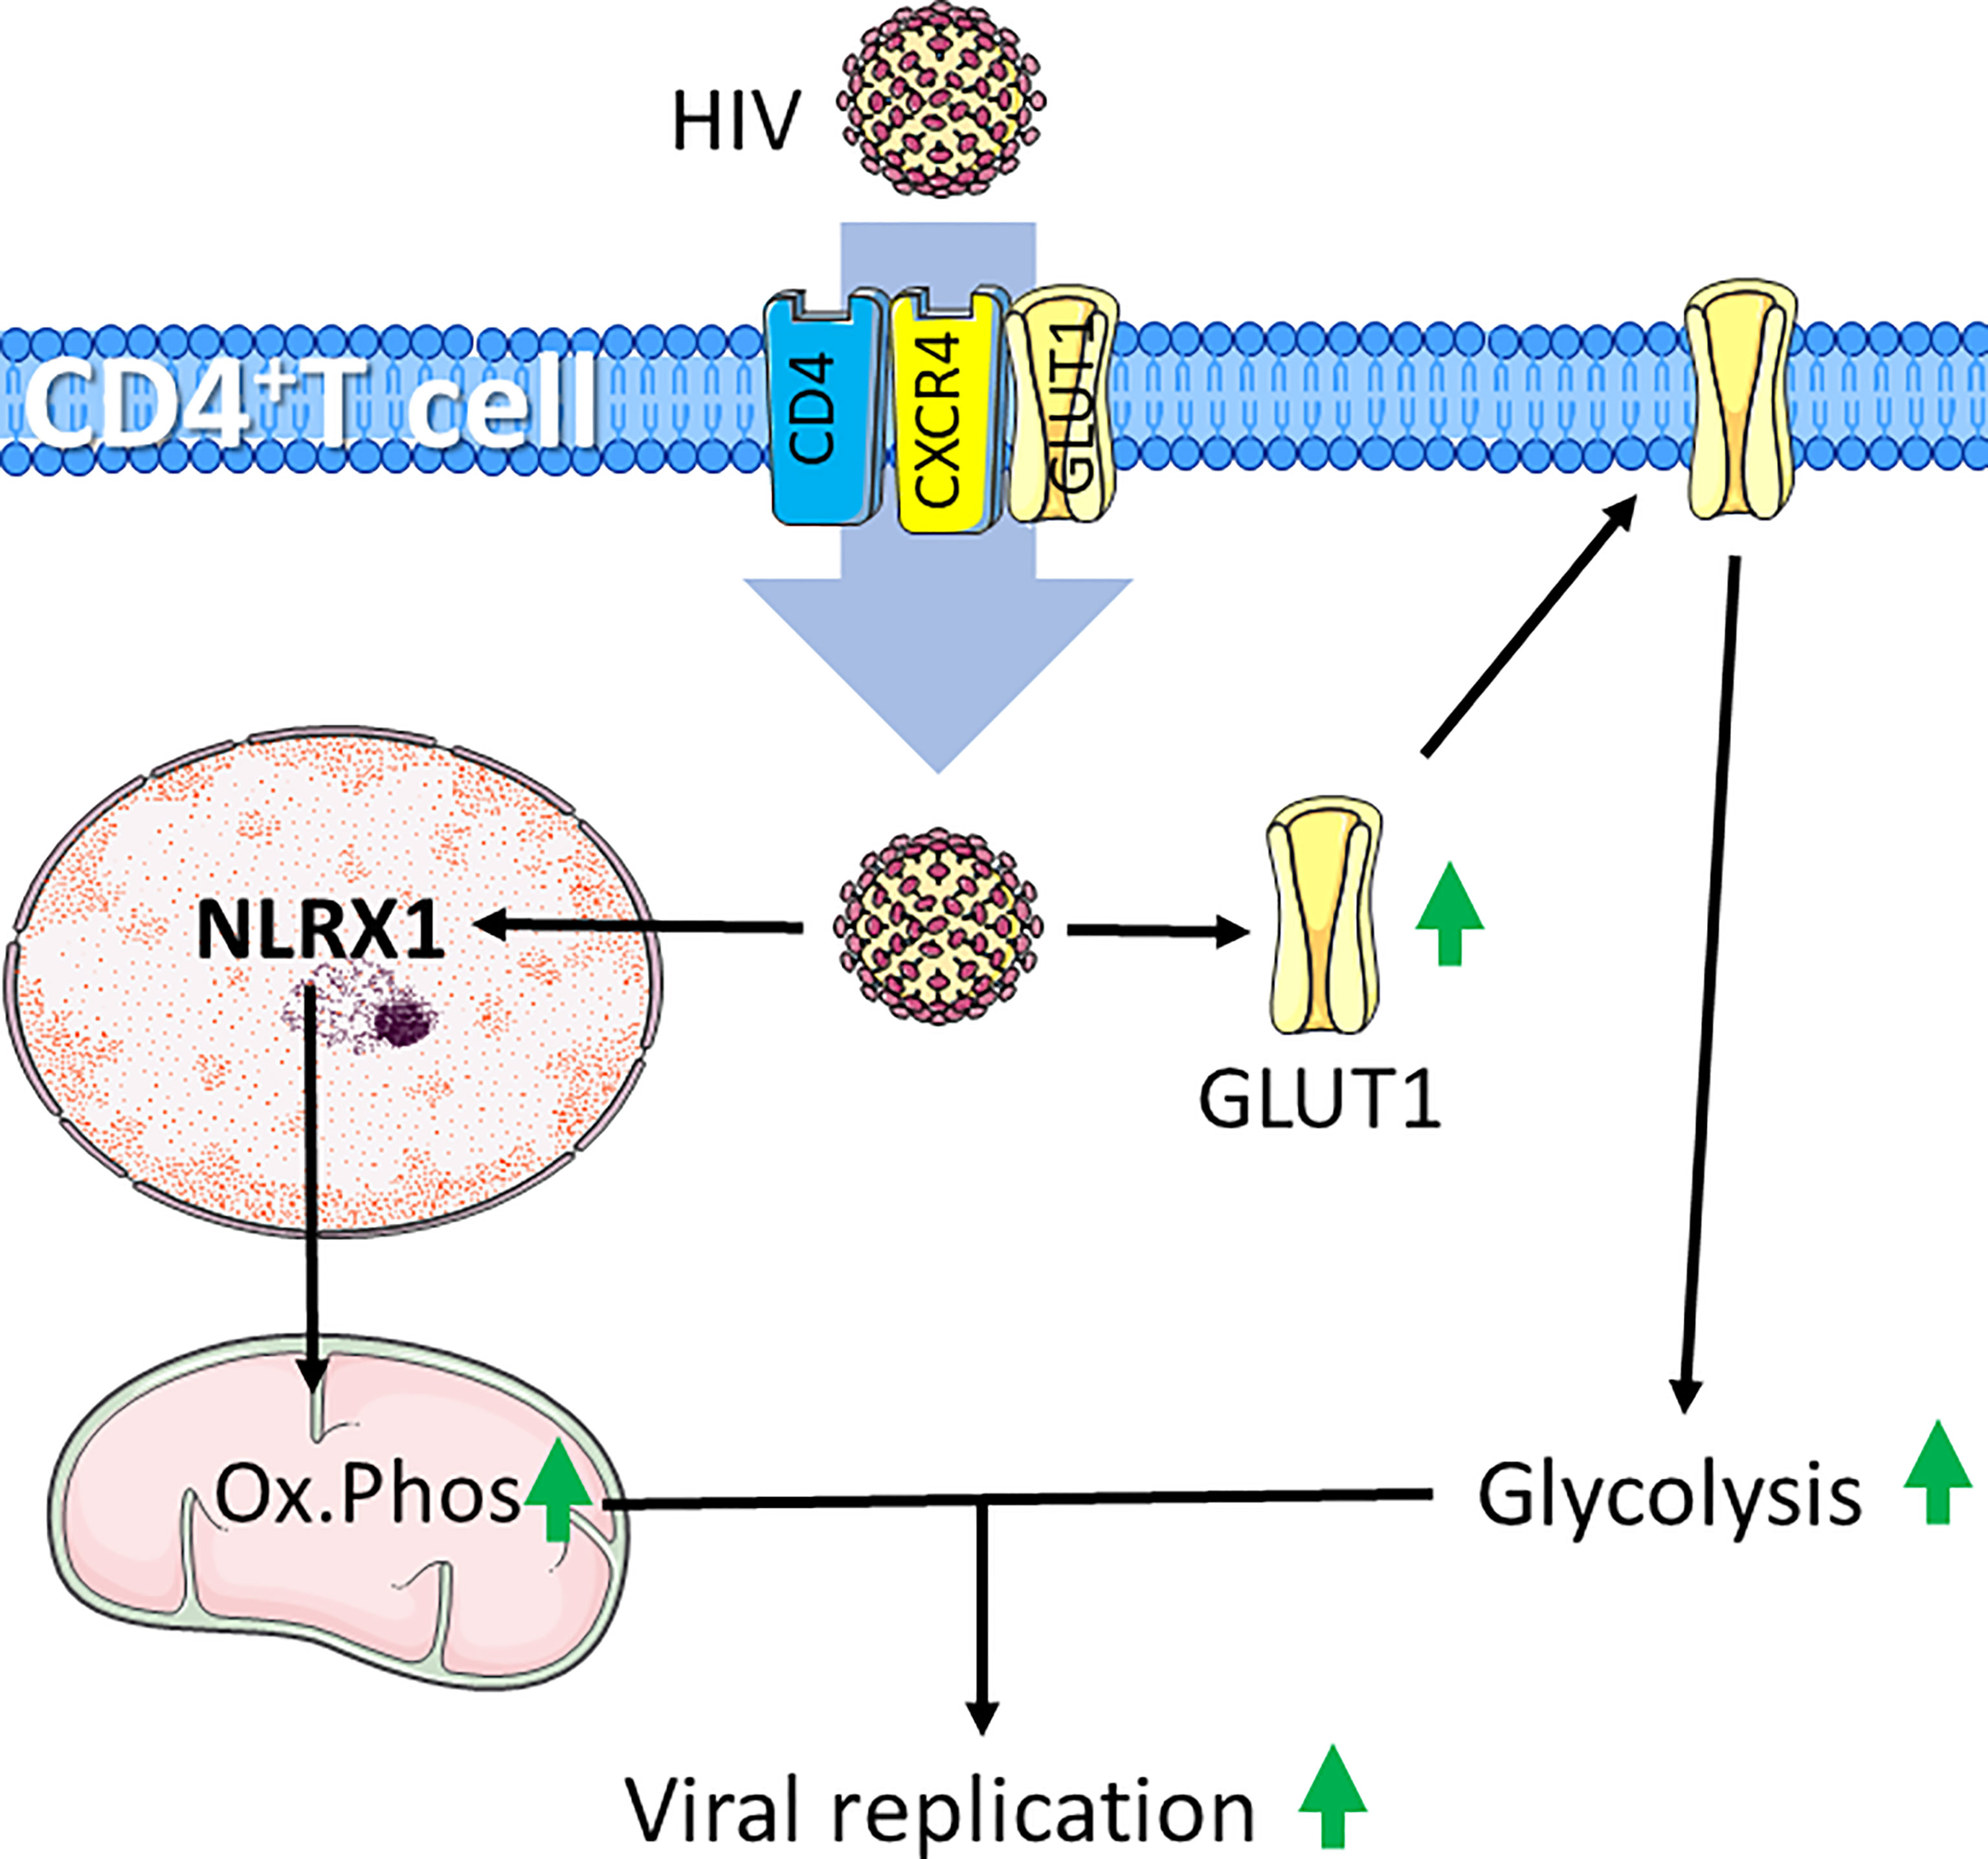
Figure 4 HIV infection induces increased glycolysis and mitochondrial respiration in CD4+ T cells. HIV infects CD4+ T cells through interaction with CD4 and chemokine receptor CXCR4. HIV-infection supports glycolytic metabolism by increasing expression of the glucose transporter GLUT1, which can also be exploited to further infect CD4+ T cells. Additionally, HIV induces expression the of nucleotide-binding domain leucine-rich repeat-containing receptor X1 (NLRX1) to induce increased oxidative phosphorylation (Ox.Phos). The increased metabolic rate supports enhanced viral replication. Figure was created using assets from Servier Medical Art, licensed under a Creative Common Attribution 3.0 Generic License. http://smart.servier.com/.
The current knowledge of T-cell metabolism in HIV infection indicates that the HIV virus exploits the glycolysis of CD4+ T cells to both infect and enhance replication rate, while high glycolytic rate of CD8+ T cells confer resistance to infection (170, 171, 173). Hence, both CD4+ and CD8+ T-cell metabolic profiles may serve as prognostic markers of the patients. In line with this, it is speculated that targeting glycolysis of e.g., CD4+ T cells may reduce T-cell replication in patients suffering from viral infection, such as by HIV. Importantly, this understanding of metabolism in HIV indicates a potential for repurposing metformin for the management of HIV infection (171). Together, this highlights the importance of further studies to determine the efficacy of metabolic inhibition in the management of HIV infection.
Tuberculosis remains a major threat to human global health, with an estimated one-fourth of the world population latently infected (174). Tuberculosis is caused by Mycobacterium tuberculosis (MT) infection. T cells and Mø are crucial players in the anti-mycobacterial host defense and in containing the spread of mycobacteria during latent disease (175). This is highlighted by the observation that HIV-induced depletion of CD4+ T cells and the level of PD-1 expression leads to increased co-morbidity in MT-infected individuals (176, 177). Together this points to the importance of stringent regulation of CD4+ T cells in defense against MT infection.
With an increasing body of evidence, it is argued that metabolic changes at the cellular level, is vital to mount an effective immune response to MT. This include pathways found to be necessary for the full activation of lymphocytes and include regulation of cytokine production, pyrimidine metabolism, as well as production of glutathione and large amounts of mitochondrial reactive oxygen species (ROS) in response to MT infection (178). To this end, the mitochondrial matrix protein Cyclophilin D (CypD) acts as a peptidyl-prolyl cis-trans isomerase that regulates the mitochondrial permeability transition pore (PTP). PTP is a nonspecific large conductance pore when open leads to cell death. PTP expression has been implicated in ischemia/reperfusion injury in multiple organs, in neurodegenerative disorders, and in muscular dystrophies (179, 180). Interestingly, loss of CypD is implicated in metabolic changes, which include increased aerobic glycolysis, mitochondrial OXPHOS, and consumption of glucose and glutamine. This is further associated with increased T-cell activation to proliferation and cytokine production, such as TNFα and IFNγ. Moreover, MT infection in CypD ablated individuals, lead to immunopathology caused by T-cell dysfunction, however, without affecting bacterial burden. Moreover, CypD-deficient mice succumbed earlier to infection than wild-type mice stressing the role of CypD and dysregulated T-cell function potentially associated with altered immune cell metabolism in MT infections (181). It is also reported that both early and long-term MT infection induces distinct defects to the metabolism of CD8+ T cells. MT infection increases expression of both PD-1 and CTLA4, which further correlates with decreased glucose uptake as well as reduced glycolysis and mitochondrial respiration. This further reflects a repressed metabolic programing normally induced by stimulation of the anti-CD3/CD28 complex (182).
As the tissue microenvironment also affects the effector functions and metabolism of T cells, targeting metabolic pathways can also affect T-cell activity indirectly. This is the case for MT-induced granulomas, in which Mø catabolize tryptophan and secrete transforming growth factor β (TGF-β) to create an immunosuppressive environment (178, 183, 184). Hence, the capability of T cells in clearing MT infections is largely limited by the inability to enter the granulomas in which MT induces expression of indoleamine 2,3-dioxygenase (IDO), and tryptophan catabolism to form the immunosuppressive metabolite kynurenine (185, 186). Moreover, IDO expression has previously been linked to a decline in IFNγ, demonstrating how MT-induced changes in Mø metabolism may induce tolerance and prevent clearance (183). This likely occurs through interaction between kynurenine and the aryl hydrocarbon receptor (AHR) in combination with TGF-β, which drives Treg differentiation (Figure 5) (187). In conclusion, MT infections contribute to decreased T cell glycolytic metabolism through several mechanisms. Despite that the knowledge is sparse, such changes may further have implications for how and to what extent the immune system is able to counteract a MT infection and to what extent the immune system may be capable to eradicate the MT bacteria.
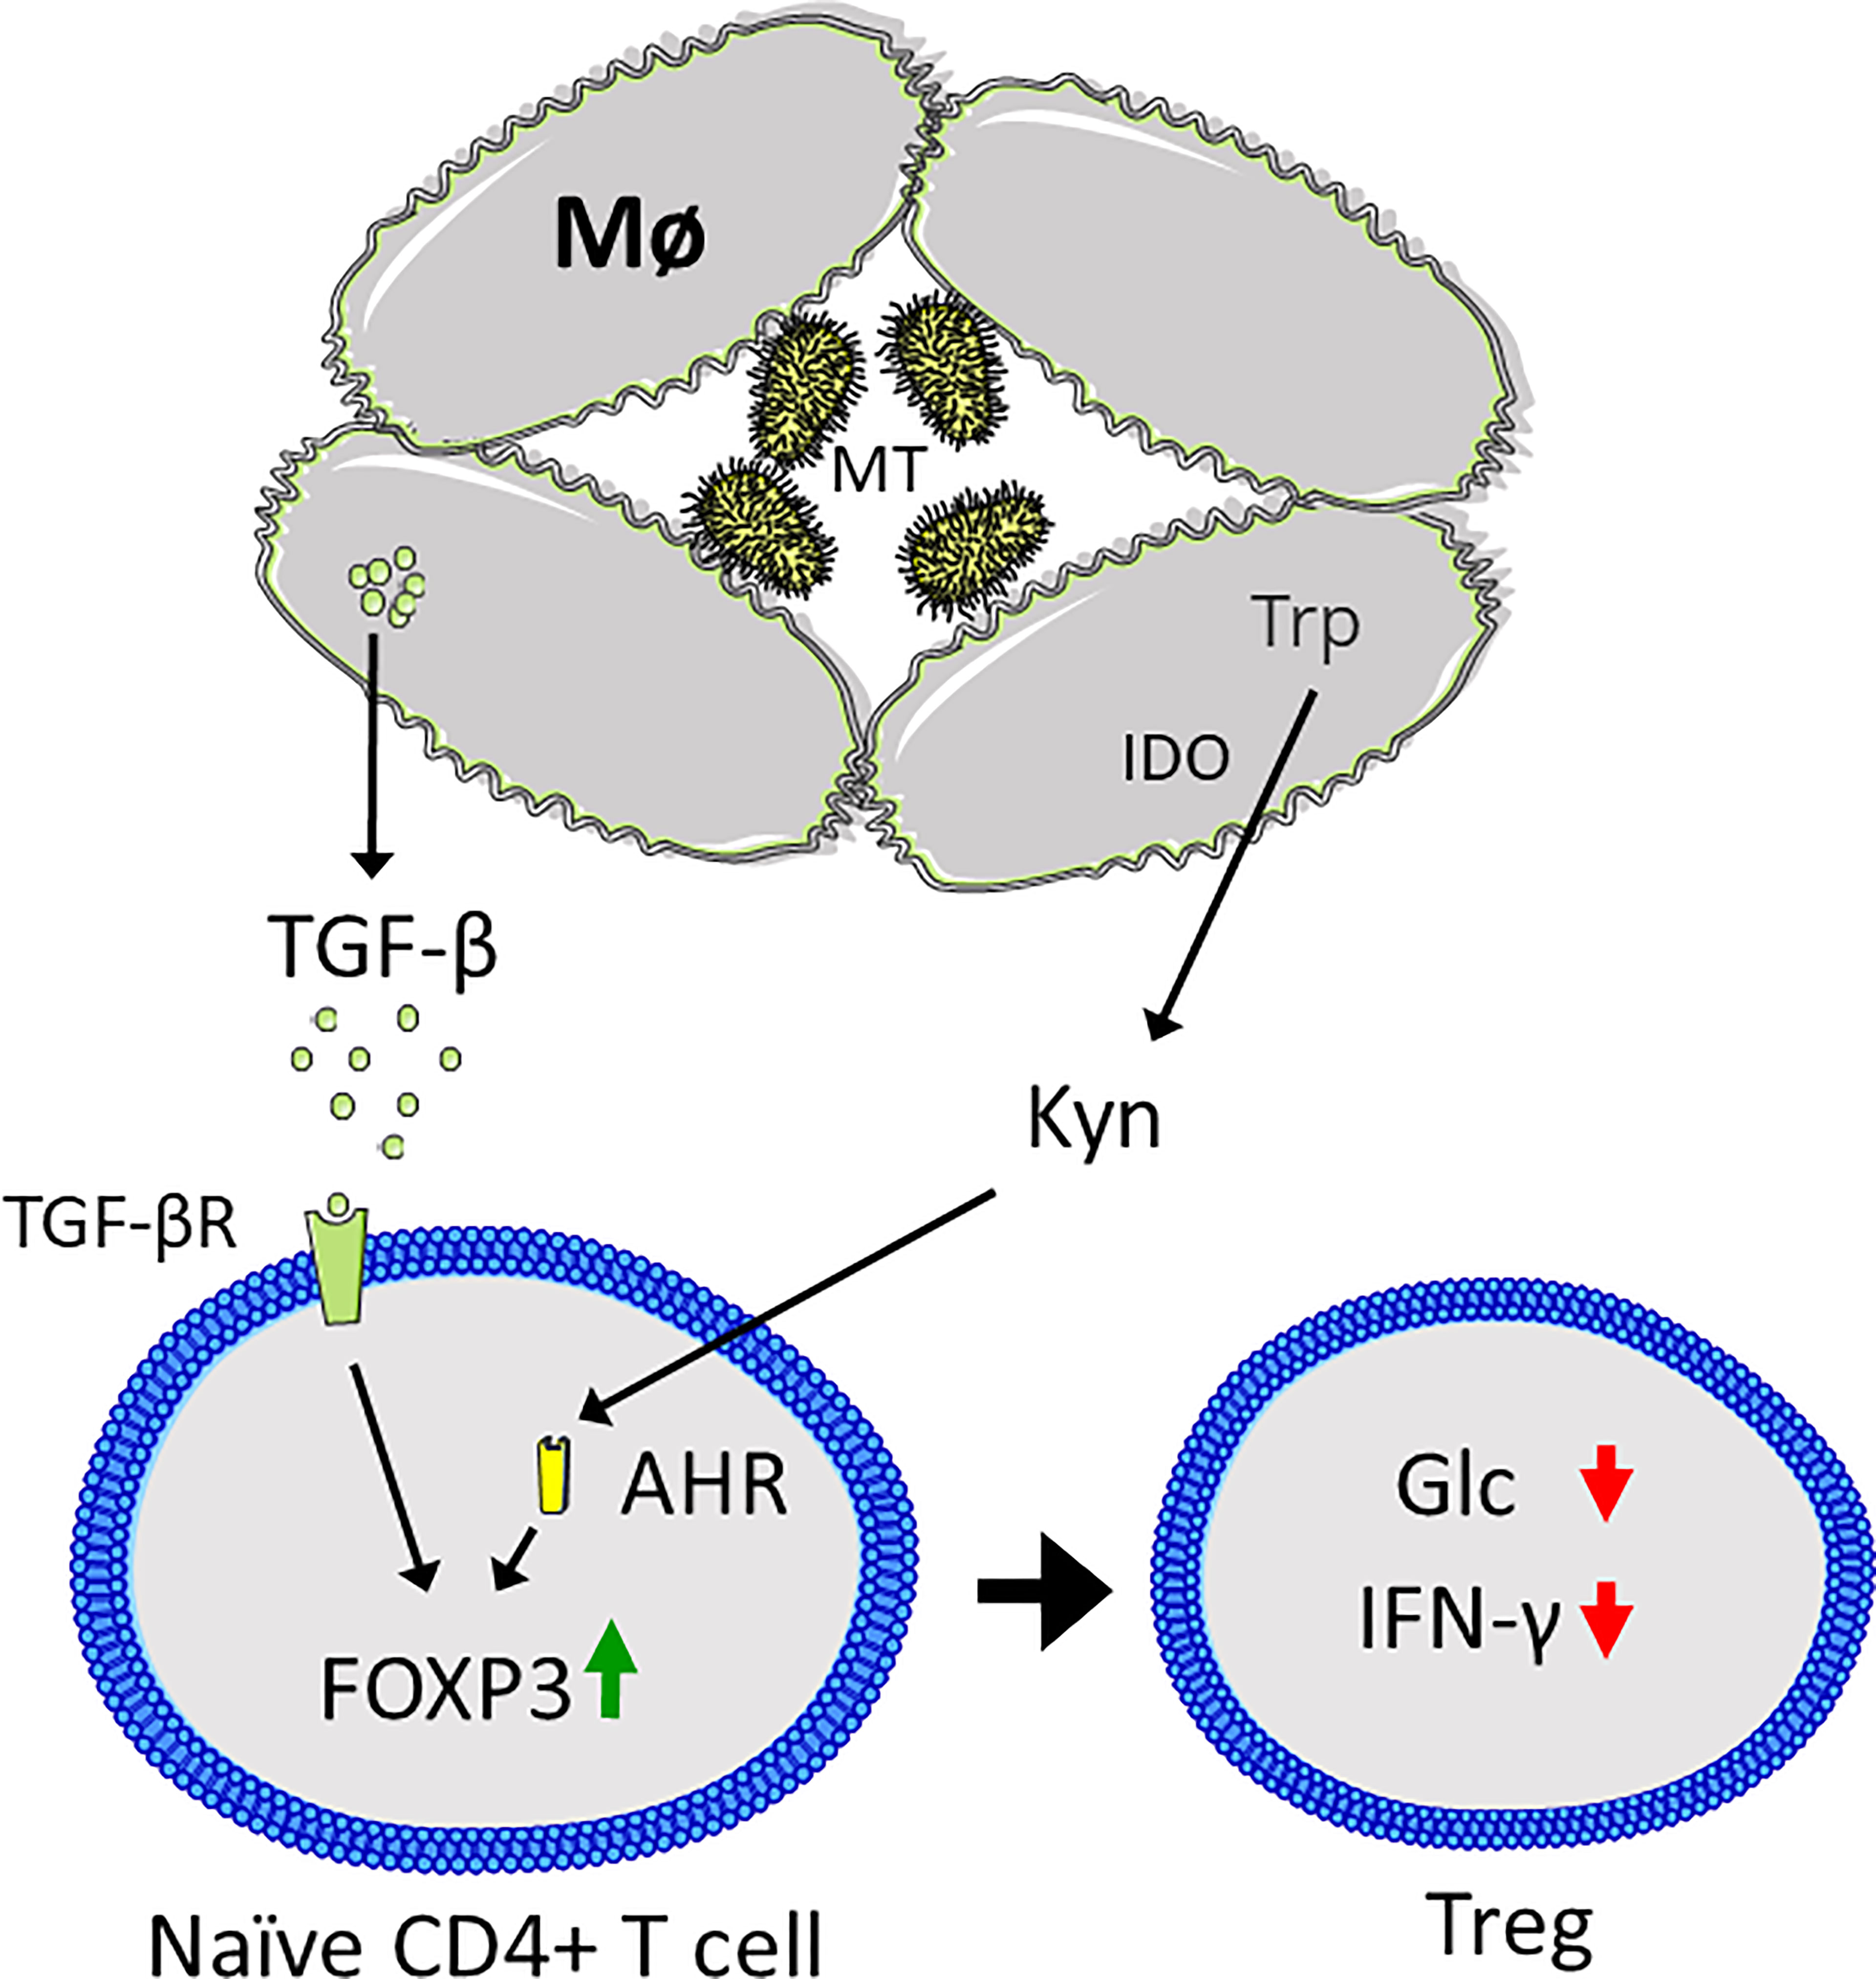
Figure 5 Mycobacterium tuberculosis (MT) infection results in an immunosuppressive microenvironment. Macrophages (Mø) are unable to clear MT infection, resulting in granuloma formation. MT induces expression of indoleamine 2,3-dioxygenase (IDO), which catabolized tryptophan (Trp) to kynurenine (Kyn), which binds to the aryl hydrocarbon receptor (AHR) in CD4+ T cells, coupled with secretion of transforming growth factor β (TGF-β) that binds to the TGF-β receptor (TGF-βR). Together this results in upregulation of FOXP3 and Treg differentiation, characterized by suppression of CD4+ T cell glycolysis (Glc) and interferon γ (IFN-γ) secretion. Figure was created using assets from Servier Medical Art, licensed under a Creative Common Attribution 3.0 Generic License. (http://smart.servier.com/).
We have briefly summarized some knowledge on T-cell metabolism in situation of infections by virus and bacteria. Research over the last couple of decades have revealed that T-cell metabolism is closely linked, not only to proliferation and clonal expansion, but that cell-specific metabolism also dictate cell differentiation programs and reflect effector functions (136). As detailed here, T-cell metabolism may in addition aid pathogen clearance or confer resistance to infections by virus and bacteria. However, in some cases T-cell metabolism may be displayed as T-cell exhaustion leading to tolerance, or even support of inflammation. The latter is displayed in certain cases of viral infection, where immune cell metabolism also supports viral replication (135, 169, 170, 181, 182).
Modulating T-cell metabolism by supplementation with key nutrients or employing inhibitors of key metabolic pathways has previously been shown to enhance memory formation or enhance effector function of T cells in cancer, or even induce pro-inflammatory and migratory programs (92, 108, 188, 189). As T-cell exhaustion is a feature in both persistent infection and cancer it is expected that reversing the exhausted phenotype will have markedly clinical potential (190). T-cell metabolism may also be important in both the acute and long-term effects of COVID-19, making it an interesting target for therapeutic applications (145, 155, 159, 162).
As detailed in this review, metabolic reprograming of T cells is crucial for conveying protection against infectious pathogens. On the other hand, some pathogens may exploit or modify T cell metabolism to prevent the appropriate effector functions. Further research is needed to determine if targeting dysfunctional T cell metabolism may be used therapeutically in infectious diseases to enhance effector functions and reverse T-cell exhaustion in chronic infections.
JW and BS both conceived and drafted this review and contributed to final proof and approval of the submitted version.
Grant from Thorn Holst 2020-2021 to BS.
The authors declare that the research was conducted in the absence of any commercial or financial relationships that could be construed as a potential conflict of interest.
All claims expressed in this article are solely those of the authors and do not necessarily represent those of their affiliated organizations, or those of the publisher, the editors and the reviewers. Any product that may be evaluated in this article, or claim that may be made by its manufacturer, is not guaranteed or endorsed by the publisher.
1. Coates M, Lee MJ, Norton D, MacLeod AS. The Skin and Intestinal Microbiota and Their Specific Innate Immune Systems. Front Immunol (2019) 10:2950. doi: 10.3389/fimmu.2019.02950
2. Murphy K, Weaver C, Janeway C. Janeway’s Immunobiology. New York: Garland Publishing Inc. (2017).
3. Medzhitov R. Recognition of Microorganisms and Activation of the Immune Response. Nature (2007) 449(7164):819–26. doi: 10.1038/nature06246
4. Tang D, Kang R, Coyne CB, Zeh HJ, Lotze MT. PAMPs and DAMPs: Signal 0s That Spur Autophagy and Immunity. Immunol Rev (2012) 249(1):158–75. doi: 10.1111/j.1600-065X.2012.01146.x
6. Schmidt ME, Varga SM. The CD8 T Cell Response to Respiratory Virus Infections. Front Immunol (2018) 9:678. doi: 10.3389/fimmu.2018.00678
7. Sutton VR, Davis JE, Cancilla M, Johnstone RW, Ruefli AA, Sedelies K, et al. Initiation of Apoptosis by Granzyme B Requires Direct Cleavage of Bid, But Not Direct Granzyme B-Mediated Caspase Activation. J Exp Med (2000) 192(10):1403–14. doi: 10.1084/jem.192.10.1403
8. Geginat J, Paroni M, Maglie S, Alfen JS, Kastirr I, Gruarin P, et al. Plasticity of Human CD4 T Cell Subsets. Front Immunol (2014) 5:630. doi: 10.3389/fimmu.2014.00630
9. Infante-Duarte C, Kamradt T. Th1/Th2 Balance in Infection. Springer Semin Immunopathol (1999) 21(3):317–38. doi: 10.1007/BF00812260
10. Khader SA, Gaffen SL, Kolls JK. Th17 Cells at the Crossroads of Innate and Adaptive Immunity Against Infectious Diseases at the Mucosa. Mucosal Immunol (2009) 2(5):403–11. doi: 10.1038/mi.2009.100
11. Ma CS, Chew GYJ, Simpson N, Priyadarshi A, Wong M, Grimbacher B, et al. Deficiency of Th17 Cells in Hyper IgE Syndrome Due to Mutations in STAT3. J Exp Med (2008) 205(7):1551–7. doi: 10.1084/jem.20080218
12. Capone A, Volpe E. Transcriptional Regulators of T Helper 17 Cell Differentiation in Health and Autoimmune Diseases. Front Immunol (2020) 11:348. doi: 10.3389/fimmu.2020.00348
13. Duhen T, Geiger R, Jarrossay D, Lanzavecchia A, Sallusto F. Production of Interleukin 22 But Not Interleukin 17 by a Subset of Human Skin-Homing Memory T Cells. Nat Immunol (2009) 10(8):857–63. doi: 10.1038/ni.1767
14. Fujita H. The Role of IL-22 and Th22 Cells in Human Skin Diseases. J Dermatol Sci (2013) 72(1):3–8. doi: 10.1016/j.jdermsci.2013.04.028
15. Li J, Chen S, Xiao X, Zhao Y, Ding W, Li XC. IL-9 and Th9 Cells in Health and Diseases-From Tolerance to Immunopathology. Cytokine Growth Factor Rev (2017) 37:47–55. doi: 10.1016/j.cytogfr.2017.07.004
16. Chandwaskar R, Awasthi A. Emerging Roles of Th9 Cells as an Anti-Tumor Helper T Cells. Int Rev Immunol (2019) 38(5):204–11. doi: 10.1080/08830185.2019.1648453
17. Juno JA, van Bockel D, Kent SJ, Kelleher AD, Zaunders JJ, Munier CML. Cytotoxic CD4 T Cells—Friend or Foe During Viral Infection? Front Immunol (2017) 8:19. doi: 10.3389/fimmu.2017.00019
18. Tabarkiewicz J, Pogoda K, Karczmarczyk A, Pozarowski P, Giannopoulos K. The Role of IL-17 and Th17 Lymphocytes in Autoimmune Diseases. Arch Immunol Ther Exp (2015) 63(6):435–49. doi: 10.1007/s00005-015-0344-z
19. Tesmer LA, Lundy SK, Sarkar S, Fox DA. Th17 Cells in Human Disease. Immunol Rev (2008) 223:87–113. doi: 10.1111/j.1600-065X.2008.00628.x
20. Dardalhon V, Korn T, Kuchroo VK, Anderson AC. Role of Th1 and Th17 Cells in Organ-Specific Autoimmunity. J Autoimmun (2008) 31(3):252–6. doi: 10.1016/j.jaut.2008.04.017
21. Romagnani S. Immunologic Influences on Allergy and the TH1/TH2 Balance. J Allergy Clin Immunol (2004) 113(3):395–400. doi: 10.1016/j.jaci.2003.11.025
22. Jia L, Wu C. The Biology and Functions of Th22 Cells. In: Sun B, editor. T Helper Cell Differentiation and Their Function. Dordrecht: Springer Netherlands (2014). p. 209–30.
23. Lu Y, Wang Q, Xue G, Bi E, Ma X, Wang A, et al. Th9 Cells Represent a Unique Subset of CD4(+) T Cells Endowed With the Ability to Eradicate Advanced Tumors. Cancer Cell (2018) 33(6):1048–60.e7. doi: 10.1016/j.ccell.2018.05.004
24. Pennock ND, White JT, Cross EW, Cheney EE, Tamburini BA, Kedl RM. T Cell Responses: Naïve to Memory and Everything in Between. Adv Physiol Educ (2013) 37(4):273–83. doi: 10.1152/advan.00066.2013
25. Corthay A. How do Regulatory T Cells Work? Scand J Immunol (2009) 70(4):326–36. doi: 10.1111/j.1365-3083.2009.02308.x
26. Bantug GR, Galluzzi L, Kroemer G, Hess C. The Spectrum of T Cell Metabolism in Health and Disease. Nat Rev Immunol (2018) 18(1):19–34. doi: 10.1038/nri.2017.99
27. Chapman NM, Boothby MR, Chi H. Metabolic Coordination of T Cell Quiescence and Activation. Nat Rev Immunol (2020) 20(1):55–70. doi: 10.1038/s41577-019-0203-y
28. Chapman NM, Chi H. Hallmarks of T-Cell Exit From Quiescence. Cancer Immunol Res (2018) 6(5):502–8. doi: 10.1158/2326-6066.CIR-17-0605
29. Smith-Garvin JE, Koretzky GA, Jordan MS. T Cell Activation. Annu Rev Immunol (2009) 27:591–619. doi: 10.1146/annurev.immunol.021908.132706
30. Mariuzza RA, Agnihotri P, Orban J. The Structural Basis of T-Cell Receptor (TCR) Activation: An Enduring Enigma. J Biol Chem (2020) 295(4):914–25. doi: 10.1016/S0021-9258(17)49904-2
31. Wang H, Kadlecek TA, Au-Yeung BB, Goodfellow HE, Hsu LY, Freedman TS, et al. ZAP-70: An Essential Kinase in T-Cell Signaling. Cold Spring Harb Perspect Biol (2010) 2(5):a002279. doi: 10.1101/cshperspect.a002279
32. Williams BL, Irvin BJ, Sutor SL, Chini CC, Yacyshyn E, Bubeck Wardenburg J, et al. Phosphorylation of Tyr319 in ZAP-70 Is Required for T-Cell Antigen Receptor-Dependent Phospholipase C-Gamma1 and Ras Activation. EMBO J (1999) 18(7):1832–44. doi: 10.1093/emboj/18.7.1832
33. Fisher WG, Yang PC, Medikonduri RK, Jafri MS. NFAT and NFkappaB Activation in T Lymphocytes: A Model of Differential Activation of Gene Expression. Ann BioMed Eng (2006) 34(11):1712–28. doi: 10.1007/s10439-006-9179-4
34. Jamieson C, McCaffrey PG, Rao A, Sen R. Physiologic Activation of T Cells via the T Cell Receptor Induces NF-Kappa B. J Immunol (Baltimore Md: 1950) (1991) 147(2):416–20.
35. Verweij CL, Geerts M, Aarden LA. Activation of Interleukin-2 Gene-Transcription Via the T-Cell Surface-Molecule Cd28 Is Mediated Through an Nf-Kb-Like Response Element. J Biol Chem (1991) 266(22):14179–82. doi: 10.1016/S0021-9258(18)98663-1
36. Shaw JP, Utz PJ, Durand DB, Toole JJ, Emmel EA, Crabtree GR. Identification of a Putative Regulator of Early T-Cell Activation Genes. Science (1988) 241(4862):202–5. doi: 10.1126/science.3260404
37. Rincón M, Flavell RA. AP-1 Transcriptional Activity Requires Both T-Cell Receptor-Mediated and Co-Stimulatory Signals in Primary T Lymphocytes. EMBO J (1994) 13(18):4370–81. doi: 10.1002/j.1460-2075.1994.tb06757.x
38. Ross SH, Cantrell DA. Signaling and Function of Interleukin-2 in T Lymphocytes. Annu Rev Immunol (2018) 36:411–33. doi: 10.1146/annurev-immunol-042617-053352
39. Esensten JH, Helou YA, Chopra G, Weiss A, Bluestone JA. CD28 Costimulation: From Mechanism to Therapy. Immunity (2016) 44(5):973–88. doi: 10.1016/j.immuni.2016.04.020
40. Frauwirth KA, Riley JL, Harris MH, Parry RV, Rathmell JC, Plas DR, et al. The CD28 Signaling Pathway Regulates Glucose Metabolism. Immunity (2002) 16(6):769–77. doi: 10.1016/S1074-7613(02)00323-0
41. Garçon F, Patton DT, Emery JL, Hirsch E, Rottapel R, Sasaki T, et al. CD28 Provides T-Cell Costimulation and Enhances PI3K Activity at the Immune Synapse Independently of Its Capacity to Interact With the P85/P110 Heterodimer. Blood (2008) 111(3):1464–71. doi: 10.1182/blood-2007-08-108050
42. Wülfing C, Tunbridge HM, Wraith DC. New Inhibitory Signaling by CTLA-4. Nat Immunol (2014) 15(5):408–9. doi: 10.1038/ni.2870
43. Rudd CE, Taylor A, Schneider H. CD28 and CTLA-4 Coreceptor Expression and Signal Transduction. Immunol Rev (2009) 229(1):12–26. doi: 10.1111/j.1600-065X.2009.00770.x
44. Mukherjee S, Maiti PK, Nandi D. Role of CD80, CD86, and CTLA4 on Mouse CD4(+) T Lymphocytes in Enhancing Cell-Cycle Progression and Survival After Activation With PMA and Ionomycin. J Leukoc Biol (2002) 72(5):921–31.
45. Wherry EJ, Kurachi M. Molecular and Cellular Insights Into T Cell Exhaustion. Nat Rev Immunol (2015) 15(8):486–99. doi: 10.1038/nri3862
46. Guntermann C, Alexander DR. CTLA-4 Suppresses Proximal TCR Signaling in Resting Human CD4(+) T Cells by Inhibiting ZAP-70 Tyr(319) Phosphorylation: A Potential Role for Tyrosine Phosphatases. J Immunol (Baltimore Md: 1950) (2002) 168(9):4420–9. doi: 10.4049/jimmunol.168.9.4420
47. Brunner-Weinzierl MC, Rudd CE. CTLA-4 and PD-1 Control of T-Cell Motility and Migration: Implications for Tumor Immunotherapy. Front Immunol (2018) 9:2737. doi: 10.3389/fimmu.2018.02737
48. Blank CU, Haining WN, Held W, Hogan PG, Kallies A, Lugli E, et al. Defining ‘T Cell Exhaustion’. Nat Rev Immunol (2019) 19(11):665–74. doi: 10.1038/s41577-019-0221-9
49. Frauwirth KA, Thompson CB. Regulation of T Lymphocyte Metabolism. J Immunol (Baltimore Md: 1950) (2004) 172(8):4661–5. doi: 10.4049/jimmunol.172.8.4661
50. Menk AV, Scharping NE, Moreci RS, Zeng X, Guy C, Salvatore S, et al. Early TCR Signaling Induces Rapid Aerobic Glycolysis Enabling Distinct Acute T Cell Effector Functions. Cell Rep (2018) 22(6):1509–21. doi: 10.1016/j.celrep.2018.01.040
51. Wolf T, Jin W, Zoppi G, Vogel IA, Akhmedov M, Bleck CKE, et al. Dynamics in Protein Translation Sustaining T Cell Preparedness. Nat Immunol (2020) 21(8):927–37. doi: 10.1038/s41590-020-0714-5
52. Almeida L, Lochner M, Berod L, Sparwasser T. Metabolic Pathways in T Cell Activation and Lineage Differentiation. Semin Immunol (2016) 28(5):514–24. doi: 10.1016/j.smim.2016.10.009
53. Boubali S, Liopeta K, Virgilio L, Thyphronitis G, Mavrothalassitis G, Dimitracopoulos G, et al. Calcium/calmodulin-Dependent Protein Kinase II Regulates IL-10 Production by Human T Lymphocytes: A Distinct Target in the Calcium Dependent Pathway. Mol Immunol (2012) 52(2):51–60. doi: 10.1016/j.molimm.2012.04.008
54. Racioppi L, Means AR. Calcium/calmodulin-Dependent Protein Kinase Kinase 2: Roles in Signaling and Pathophysiology. J Biol Chem (2012) 287(38):31658–65. doi: 10.1074/jbc.R112.356485
55. Tamás P, Hawley SA, Clarke RG, Mustard KJ, Green K, Hardie DG, et al. Regulation of the Energy Sensor AMP-Activated Protein Kinase by Antigen Receptor and Ca2+ in T Lymphocytes. J Exp Med (2006) 203(7):1665–70. doi: 10.1084/jem.20052469
56. Hardie DG, Sakamoto K. AMPK: A Key Sensor of Fuel and Energy Status in Skeletal Muscle. Physiology (Bethesda) (2006) 21:48–60. doi: 10.1152/physiol.00044.2005
57. Mondino A, Mueller DL. mTOR at the Crossroads of T Cell Proliferation and Tolerance. Semin Immunol (2007) 19(3):162–72. doi: 10.1016/j.smim.2007.02.008
58. Pollizzi KN, Patel CH, Sun IH, Oh MH, Waickman AT, Wen J, et al. mTORC1 and mTORC2 Selectively Regulate CD8⁺ T Cell Differentiation. J Clin Invest (2015) 125(5):2090–108. doi: 10.1172/JCI77746
59. Liu C, Chapman NM, Karmaus PW, Zeng H, Chi H. mTOR and Metabolic Regulation of Conventional and Regulatory T Cells. J Leukoc Biol (2015) 97(5):837–47. doi: 10.1189/jlb.2RI0814-408R
60. Pollizzi KN, Patel CH, Sun IH, Oh MH, Waickman AT, Wen J, et al. mTORC1 and mTORC2 Selectively Regulate CD8(+) T Cell Differentiation. J Clin Invest (2015) 125(5):2090–108. doi: 10.1172/JCI77746
61. Zhang L, Tschumi BO, Lopez-Mejia IC, Oberle SG, Meyer M, Samson G, et al. Mammalian Target of Rapamycin Complex 2 Controls CD8 T Cell Memory Differentiation in a Foxo1-Dependent Manner. Cell Rep (2016) 14(5):1206–17. doi: 10.1016/j.celrep.2015.12.095
62. Gottlob K, Majewski N, Kennedy S, Kandel E, Robey RB, Hay N. Inhibition of Early Apoptotic Events by Akt/PKB Is Dependent on the First Committed Step of Glycolysis and Mitochondrial Hexokinase. Genes Dev (2001) 15(11):1406–18. doi: 10.1101/gad.889901
63. Kohn AD, Summers SA, Birnbaum MJ, Roth RA. Expression of a Constitutively Active Akt Ser/Thr Kinase in 3T3-L1 Adipocytes Stimulates Glucose Uptake and Glucose Transporter 4 Translocation. J Biol Chem (1996) 271(49):31372–8. doi: 10.1074/jbc.271.49.31372
64. Houddane A, Bultot L, Novellasdemunt L, Johanns M, Gueuning M-A, Vertommen D, et al. Role of Akt/PKB and PFKFB Isoenzymes in the Control of Glycolysis, Cell Proliferation and Protein Synthesis in Mitogen-Stimulated Thymocytes. Cell Signal (2017) 34:23–37. doi: 10.1016/j.cellsig.2017.02.019
65. Wu S, Yin X, Fang X, Zheng J, Li L, Liu X, et al. C-MYC Responds to Glucose Deprivation in a Cell-Type-Dependent Manner. Cell Death Discov (2015) 1:15057–. doi: 10.1038/cddiscovery.2015.57
66. Peng M, Yin N, Chhangawala S, Xu K, Leslie CS, Li MO. Aerobic Glycolysis Promotes T Helper 1 Cell Differentiation Through an Epigenetic Mechanism. Science (2016) 354(6311):481–4. doi: 10.1126/science.aaf6284
67. Vander Heiden MG, Cantley LC, Thompson CB. Understanding the Warburg Effect: The Metabolic Requirements of Cell Proliferation. Science (2009) 324(5930):1029–33. doi: 10.1126/science.1160809
68. Abdel-Haleem AM, Lewis NE, Jamshidi N, Mineta K, Gao X, Gojobori T. The Emerging Facets of Non-Cancerous Warburg Effect. Front Endocrinol (Lausanne) (2017) 8:279. doi: 10.3389/fendo.2017.00279
69. Angiari S, Runtsch MC, Sutton CE, Palsson-McDermott EM, Kelly B, Rana N, et al. Pharmacological Activation of Pyruvate Kinase M2 Inhibits CD4(+) T Cell Pathogenicity and Suppresses Autoimmunity. Cell Metab (2020) 31(2):391–405.e8. doi: 10.1016/j.cmet.2019.10.015
70. Cantó C, Menzies KJ, Auwerx J. NAD(+) Metabolism and the Control of Energy Homeostasis: A Balancing Act Between Mitochondria and the Nucleus. Cell Metab (2015) 22(1):31–53. doi: 10.1016/j.cmet.2015.05.023
71. Gerriets VA, Kishton RJ, Nichols AG, Macintyre AN, Inoue M, Ilkayeva O, et al. Metabolic Programming and PDHK1 Control CD4+ T Cell Subsets and Inflammation. J Clin Invest (2015) 125(1):194–207. doi: 10.1172/JCI76012
72. Finlay DK. Starved Human T Lymphocytes Keep Fighting. Eur J Immunol (2015) 45(9):2480–3. doi: 10.1002/eji.201545885
73. Johnson MO, Wolf MM, Madden MZ, Andrejeva G, Sugiura A, Contreras DC, et al. Distinct Regulation of Th17 and Th1 Cell Differentiation by Glutaminase-Dependent Metabolism. Cell (2018) 175(7):1780–95.e19. doi: 10.1016/j.cell.2018.10.001
74. Nakaya M, Xiao YC, Zhou XF, Chang JH, Chang M, Cheng XH, et al. Inflammatory T Cell Responses Rely on Amino Acid Transporter ASCT2 Facilitation of Glutamine Uptake and mTORC1 Kinase Activation. Immunity (2014) 40(5):692–705. doi: 10.1016/j.immuni.2014.04.007
75. Wang R, Dillon CP, Shi LZ, Milasta S, Carter R, Finkelstein D, et al. The Transcription Factor Myc Controls Metabolic Reprogramming Upon T Lymphocyte Activation. Immunity (2011) 35(6):871–82. doi: 10.1016/j.immuni.2011.09.021
76. Choi YH, Jin N, Kelly F, Sakthivel SK, Yu T. Elevation of Alanine Aminotransferase Activity Occurs After Activation of the Cell-Death Signaling Initiated by Pattern-Recognition Receptors But Before Activation of Cytolytic Effectors in NK or CD8+ T Cells in the Liver During Acute HCV Infection. PloS One (2016) 11(10):e0165533. doi: 10.1371/journal.pone.0165533
77. Bietz A, Zhu HY, Xue MM, Xu CQ. Cholesterol Metabolism in T Cells. Front Immunol (2017) 8:1664. doi: 10.3389/fimmu.2017.01664
78. Gruenbacher G, Thurnher M. Mevalonate Metabolism in Immuno-Oncology. Front Immunol (2017) 8:1714. doi: 10.3389/fimmu.2017.01714
79. Patsoukis N, Bardhan K, Weaver J, Herbel C, Seth P, Li L, et al. The Role of Metabolic Reprogramming in T Cell Fate and Function. Curr Trends Immunol (2016) 17:1–12.
80. DeBerardinis RJ, Mancuso A, Daikhin E, Nissim I, Yudkoff M, Wehrli S, et al. Beyond Aerobic Glycolysis: Transformed Cells can Engage in Glutamine Metabolism That Exceeds the Requirement for Protein and Nucleotide Synthesis. Proc Natl Acad Sci USA (2007) 104(49):19345–50. doi: 10.1073/pnas.0709747104
81. Gnanaprakasam JNR, Wu RH, Wang RN. Metabolic Reprogramming in Modulating T Cell Reactive Oxygen Species Generation and Antioxidant Capacity. Front Immunol (2018) 9:1–19. doi: 10.3389/fimmu.2018.01075
82. Altman BJ, Stine ZE, Dang CV. From Krebs to Clinic: Glutamine Metabolism to Cancer Therapy. Nat Rev Cancer (2016) 16(10):619–34. doi: 10.1038/nrc.2016.71
83. Hesterberg RS, Cleveland JL, Epling-Burnette PK. Role of Polyamines in Immune Cell Functions. Med Sci (Basel) (2018) 6(1). doi: 10.3390/medsci6010022
84. Dimeloe S, Burgener AV, Grählert J, Hess C. T-Cell Metabolism Governing Activation, Proliferation and Differentiation; a Modular View. Immunology (2017) 150(1):35–44. doi: 10.1111/imm.12655
85. Kaadige MR, Looper RE, Kamalanaadhan S, Ayer DE. Glutamine-Dependent Anapleurosis Dictates Glucose Uptake and Cell Growth by Regulating MondoA Transcriptional Activity. Proc Natl Acad Sci USA (2009) 106(35):14878–83. doi: 10.1073/pnas.0901221106
86. Reid MA, Lowman XH, Pan M, Tran TQ, Warmoes MO, Ishak Gabra MB, et al. Ikkβ Promotes Metabolic Adaptation to Glutamine Deprivation via Phosphorylation and Inhibition of PFKFB3. Genes Dev (2016) 30(16):1837–51. doi: 10.1101/gad.287235.116
87. Sener Z, Cederkvist FH, Volchenkov R, Holen HL, Skålhegg BS. T Helper Cell Activation and Expansion Is Sensitive to Glutaminase Inhibition Under Both Hypoxic and Normoxic Conditions. PloS One (2016) 11(7):e0160291. doi: 10.1371/journal.pone.0160291
88. Wu J, Li G, Li L, Li D, Dong Z, Jiang P. Asparagine Enhances LCK Signalling to Potentiate CD8+ T-Cell Activation and Anti-Tumour Responses. Nat Cell Biol (2021) 23(1):75–86. doi: 10.1038/s41556-020-00615-4
89. Pavlova NN, Hui S, Ghergurovich JM, Fan J, Intlekofer AM, White RM, et al. As Extracellular Glutamine Levels Decline, Asparagine Becomes an Essential Amino Acid. Cell Metab (2018) 27(2):428–38.e5. doi: 10.1016/j.cmet.2017.12.006
90. Huang H, Vandekeere S, Kalucka J, Bierhansl L, Zecchin A, Brüning U, et al. Role of Glutamine and Interlinked Asparagine Metabolism in Vessel Formation. EMBO J (2017) 36(16):2334–52. doi: 10.15252/embj.201695518
91. Luo M, Brooks M, Wicha MS. Asparagine and Glutamine: Co-Conspirators Fueling Metastasis. Cell Metab (2018) 27(5):947–9. doi: 10.1016/j.cmet.2018.04.012
92. Geiger R, Rieckmann JC, Wolf T, Basso C, Feng Y, Fuhrer T, et al. L-Arginine Modulates T Cell Metabolism and Enhances Survival and Anti-Tumor Activity. Cell (2016) 167(3):829–42.e13. doi: 10.1016/j.cell.2016.09.031
93. Levring TB, Hansen AK, Nielsen BL, Kongsbak M, von Essen MR, Woetmann A, et al. Activated Human CD4+ T Cells Express Transporters for Both Cysteine and Cystine. Sci Rep (2012) 2(1):266. doi: 10.1038/srep00266
94. Ananieva EA, Powell JD, Hutson SM. Leucine Metabolism in T Cell Activation: mTOR Signaling and Beyond. Adv Nutr (2016) 7(4):798s–805s. doi: 10.3945/an.115.011221
95. Wolfson RL, Chantranupong L, Saxton RA, Shen K, Scaria SM, Cantor JR, et al. Sestrin2 Is a Leucine Sensor for the mTORC1 Pathway. Science (2016) 351(6268):43–8. doi: 10.1126/science.aab2674
96. Sinclair LV, Rolf J, Emslie E, Shi YB, Taylor PM, Cantrell DA. Control of Amino-Acid Transport by Antigen Receptors Coordinates the Metabolic Reprogramming Essential for T Cell Differentiation. Nat Immunol (2013) 14(5):500–8. doi: 10.1038/ni.2556
97. Ma EH, Bantug G, Griss T, Condotta S, Johnson RM, Samborska B, et al. Serine Is an Essential Metabolite for Effector T Cell Expansion. Cell Metab (2017) 25(2):482. doi: 10.1016/j.cmet.2016.12.011
98. McNamee EN, Korns Johnson D, Homann D, Clambey ET. Hypoxia and Hypoxia-Inducible Factors as Regulators of T Cell Development, Differentiation, and Function. Immunol Res (2013) 55(1-3):58–70. doi: 10.1007/s12026-012-8349-8
99. Braun RD, Lanzen JL, Snyder SA, Dewhirst MW. Comparison of Tumor and Normal Tissue Oxygen Tension Measurements Using OxyLite or Microelectrodes in Rodents. Am J Physiol Heart Circ Physiol (2001) 280(6):H2533–44. doi: 10.1152/ajpheart.2001.280.6.H2533
100. Hale LP, Braun RD, Gwinn WM, Greer PK, Dewhirst MW. Hypoxia in the Thymus: Role of Oxygen Tension in Thymocyte Survival. Am J Physiol Heart Circ Physiol (2002) 282(4):H1467–H77. doi: 10.1152/ajpheart.00682.2001
101. Biniecka M, Canavan M, McGarry T, Gao W, McCormick J, Cregan S, et al. Dysregulated Bioenergetics: A Key Regulator of Joint Inflammation. Ann Rheum Dis (2016) 75(12):2192–200. doi: 10.1136/annrheumdis-2015-208476
102. Tao JH, Barbi J, Pan F. Hypoxia-Inducible Factors in T Lymphocyte Differentiation and Function. A Review in the Theme: Cellular Responses to Hypoxia. Am J Physiol Cell Physiol (2015) 309(9):C580–9. doi: 10.1152/ajpcell.00204.2015
103. Serganova I, Cohen IJ, Vemuri K, Shindo M, Maeda M, Mane M, et al. LDH-A Regulates the Tumor Microenvironment via HIF-Signaling and Modulates the Immune Response. PloS One (2018) 13(9):1–22. doi: 10.1371/journal.pone.0203965
104. Kim JW, Tchernyshyov I, Semenza GL, Dang CV. HIF-1-Mediated Expression of Pyruvate Dehydrogenase Kinase: A Metabolic Switch Required for Cellular Adaptation to Hypoxia. Cell Metab (2006) 3(3):177–85. doi: 10.1016/j.cmet.2006.02.002
105. Tyrakis PA, Palazon A, Macias D, Lee KL, Phan AT, Veliça P, et al. S-2-Hydroxyglutarate Regulates CD8+ T-Lymphocyte Fate. Nature (2016) 540(7632):236–41. doi: 10.1038/nature20165
106. Böttcher M, Renner K, Berger R, Mentz K, Thomas S, Cardenas-Conejo ZE, et al. D-2-Hydroxyglutarate Interferes With HIF-1α Stability Skewing T-Cell Metabolism Towards Oxidative Phosphorylation and Impairing Th17 Polarization. OncoImmunology (2018) 7(7):e1445454. doi: 10.1080/2162402X.2018.1445454
107. Geltink RIK, Kyle RL, Pearce EL. Unraveling the Complex Interplay Between T Cell Metabolism and Function. Annu Rev Immunol (2018) 36:461–88. doi: 10.1146/annurev-immunol-042617-053019
108. Shen Y, Wen Z, Li Y, Matteson EL, Hong J, Goronzy JJ, et al. Metabolic Control of the Scaffold Protein TKS5 in Tissue-Invasive, Proinflammatory T Cells. Nat Immunol (2017) 18(9):1025–34. doi: 10.1038/ni.3808
109. Kono M, Yoshida N, Maeda K, Tsokos GC. Transcriptional Factor ICER Promotes Glutaminolysis and the Generation of Th17 Cells. Proc Natl Acad Sci (2018) 115(10):2478–83. doi: 10.1073/pnas.1714717115
110. Chang C-H, Curtis Jonathan D, Maggi Leonard B, Faubert B, Villarino Alejandro V, O’Sullivan D, et al. Posttranscriptional Control of T Cell Effector Function by Aerobic Glycolysis. Cell (2013) 153(6):1239–51. doi: 10.1016/j.cell.2013.05.016
111. Guppy M, Greiner E, Brand K. The Role of the Crabtree Effect and an Endogenous Fuel in the Energy Metabolism of Resting and Proliferating Thymocytes. Eur J Biochem (1993) 212(1):95–9. doi: 10.1111/j.1432-1033.1993.tb17637.x
112. Vrisekoop N, den Braber I, de Boer AB, Ruiter AFC, Ackermans MT, van der Crabben SN, et al. Sparse Production But Preferential Incorporation of Recently Produced Naive T Cells in the Human Peripheral Pool. Proc Natl Acad Sci U S A (2008) 105(16):6115–20. doi: 10.1073/pnas.0709713105
113. Michalek RD, Gerriets VA, Jacobs SR, Macintyre AN, MacIver NJ, Mason EF, et al. Cutting Edge: Distinct Glycolytic and Lipid Oxidative Metabolic Programs Are Essential for Effector and Regulatory CD4+ T Cell Subsets. J Immunol (2011) 186(6):3299–303. doi: 10.4049/jimmunol.1003613
114. Zygmunt BM, Węgrzyn A, Gajska W, Yevsa T, Chodaczek G, Guzmán CA. Mannose Metabolism Is Essential for Th1 Cell Differentiation and IFN-γ Production. J Immunol (2018) 201(5):1400–11. doi: 10.4049/jimmunol.1700042
115. Lee K, Gudapati P, Dragovic S, Spencer C, Joyce S, Killeen N, et al. Mammalian Target of Rapamycin Protein Complex 2 Regulates Differentiation of Th1 and Th2 Cell Subsets via Distinct Signaling Pathways. Immunity (2010) 32(6):743–53. doi: 10.1016/j.immuni.2010.06.002
116. Hernandez-Quiles M, Broekema MF, Kalkhoven E. PPARgamma in Metabolism, Immunity, and Cancer: Unified and Diverse Mechanisms of Action. Front Endocrinol (2021) 12:624112. doi: 10.3389/fendo.2021.624112
117. Dang EV, Barbi J, Yang H-Y, Jinasena D, Yu H, Zheng Y, et al. Control of TH17/Treg Balance by Hypoxia-Inducible Factor 1. Cell (2011) 146(5):772–84. doi: 10.1016/j.cell.2011.07.033
118. Berod L, Friedrich C, Nandan A, Freitag J, Hagemann S, Harmrolfs K, et al. De Novo Fatty Acid Synthesis Controls the Fate Between Regulatory T and T Helper 17 Cells. Nat Med (2014) 20(11):1327–33. doi: 10.1038/nm.3704
119. Wang Y, Bi Y, Chen X, Li C, Li Y, Zhang Z, et al. Histone Deacetylase SIRT1 Negatively Regulates the Differentiation of Interleukin-9-Producing CD4+ T Cells. Immunity (2016) 44(6):1337–49. doi: 10.1016/j.immuni.2016.05.009
120. Cluxton D, Petrasca A, Moran B, Fletcher JM. Differential Regulation of Human Treg and Th17 Cells by Fatty Acid Synthesis and Glycolysis. Front Immunol (2019) 10:115. doi: 10.3389/fimmu.2019.00115
121. Shi LZ, Wang R, Huang G, Vogel P, Neale G, Green DR, et al. HIF1alpha-Dependent Glycolytic Pathway Orchestrates a Metabolic Checkpoint for the Differentiation of TH17 and Treg Cells. J Exp Med (2011) 208(7):1367–76. doi: 10.1084/jem.20110278
122. Gerriets VA, Kishton RJ, Johnson MO, Cohen S, Siska PJ, Nichols AG, et al. Foxp3 and Toll-Like Receptor Signaling Balance T(reg) Cell Anabolic Metabolism for Suppression. Nat Immunol (2016) 17(12):1459–66. doi: 10.1038/ni.3577
123. Watson MJ, Vignali PDA, Mullett SJ, Overacre-Delgoffe AE, Peralta RM, Grebinoski S, et al. Metabolic Support of Tumour-Infiltrating Regulatory T Cells by Lactic Acid. Nature (2021) 591(7851):645–51. doi: 10.1038/s41586-020-03045-2
124. Kempkes RWM, Joosten I, Koenen HJPM, He X. Metabolic Pathways Involved in Regulatory T Cell Functionality. Front Immunol (2019) 10:2839. doi: 10.3389/fimmu.2019.02839
125. O’Sullivan D. The Metabolic Spectrum of Memory T Cells. Immunol Cell Biol (2019) 97(7):636–46. doi: 10.1111/imcb.12274
126. Wu H, Estrella V, Beatty M, Abrahams D, El-Kenawi A, Russell S, et al. T-Cells Produce Acidic Niches in Lymph Nodes to Suppress Their Own Effector Functions. Nat Commun (2020) 11(1):4113. doi: 10.1038/s41467-020-17756-7
127. Allison KE, Coomber BL, Bridle BW. Metabolic Reprogramming in the Tumour Microenvironment: A Hallmark Shared by Cancer Cells and T Lymphocytes. Immunology (2017) 152(2):175–84. doi: 10.1111/imm.12777
128. Binnewies M, Roberts EW, Kersten K, Chan V, Fearon DF, Merad M, et al. Understanding the Tumor Immune Microenvironment (TIME) for Effective Therapy. Nat Med (2018) 24(5):541–50. doi: 10.1038/s41591-018-0014-x
129. Certo M, Tsai C-H, Pucino V, Ho P-C, Mauro C. Lactate Modulation of Immune Responses in Inflammatory Versus Tumour Microenvironments. Nat Rev Immunol (2021) 21(3):151–61. doi: 10.1038/s41577-020-0406-2
130. de la Cruz-López KG, Castro-Muñoz LJ, Reyes-Hernández DO, García-Carrancá A, Manzo-Merino J. Lactate in the Regulation of Tumor Microenvironment and Therapeutic Approaches. Front Oncol (2019) 9:1143. doi: 10.3389/fonc.2019.01143
131. Pucino V, Certo M, Bulusu V, Cucchi D, Goldmann K, Pontarini E, et al. Lactate Buildup at the Site of Chronic Inflammation Promotes Disease by Inducing CD4+ T Cell Metabolic Rewiring. Cell Metab (2019) 30(6):1055–74.e8. doi: 10.1016/j.cmet.2019.10.004
132. Evans SS, Repasky EA, Fisher DT. Fever and the Thermal Regulation of Immunity: The Immune System Feels the Heat. Nat Rev Immunol (2015) 15(6):335–49. doi: 10.1038/nri3843
133. O’Sullivan D, Stanczak MA, Villa M, Uhl FM, Corrado M, Klein Geltink RI, et al. Fever Supports CD8+ Effector T Cell Responses by Promoting Mitochondrial Translation. Proc Natl Acad Sci (2021) 118(25):e2023752118. doi: 10.1073/pnas.2023752118
134. Kahan SM, Wherry EJ, Zajac AJ. T Cell Exhaustion During Persistent Viral Infections. Virology (2015) 479-480:180–93. doi: 10.1016/j.virol.2014.12.033
135. Franco F, Jaccard A, Romero P, Yu Y-R, Ho P-C. Metabolic and Epigenetic Regulation of T-Cell Exhaustion. Nat Metab (2020) 2(10):1001–12. doi: 10.1038/s42255-020-00280-9
136. Kolan SS, Li G, Wik JA, Malachin G, Guo S, Kolan P, et al. Cellular Metabolism Dictates T Cell Effector Function in Health and Disease. Scand J Immunol (2020) 92(5):e12956. doi: 10.1111/sji.12956
137. Reina-Campos M, Scharping NE, Goldrath AW. CD8+ T Cell Metabolism in Infection and Cancer. Nat Rev Immunol (2021) 21(11):718–38. doi: 10.1038/s41577-021-00537-8
138. Guglani L, Khader SA. Th17 Cytokines in Mucosal Immunity and Inflammation. Curr Opin HIV AIDS (2010) 5(2):120–7. doi: 10.1097/COH.0b013e328335c2f6
139. Zhang Q, Xiang R, Huo S, Zhou Y, Jiang S, Wang Q, et al. Molecular Mechanism of Interaction Between SARS-CoV-2 and Host Cells and Interventional Therapy. Signal Transduct Target Ther (2021) 6(1):233. doi: 10.1038/s41392-021-00653-w
140. Lokhande AS, Devarajan PV. A Review on Possible Mechanistic Insights of Nitazoxanide for Repurposing in COVID-19. Eur J Pharmacol (2021) 891:173748. doi: 10.1016/j.ejphar.2020.173748
141. Mayi BS, Leibowitz JA, Woods AT, Ammon KA, Liu AE, Raja A. The Role of Neuropilin-1 in COVID-19. PloS Pathog (2021) 17(1):e1009153. doi: 10.1371/journal.ppat.1009153
142. Wang S, Qiu Z, Hou Y, Deng X, Xu W, Zheng T, et al. AXL Is a Candidate Receptor for SARS-CoV-2 That Promotes Infection of Pulmonary and Bronchial Epithelial Cells. Cell Res (2021) 31(2):126–40. doi: 10.1038/s41422-020-00460-y
143. Zhu C, Wei Y, Wei X. AXL Receptor Tyrosine Kinase as a Promising Anti-Cancer Approach: Functions, Molecular Mechanisms and Clinical Applications. Mol Cancer (2019) 18(1):153. doi: 10.1186/s12943-019-1090-3
144. Mullen PJ, Garcia G Jr., Purkayastha A, Matulionis N, Schmid EW, Momcilovic M, et al. SARS-CoV-2 Infection Rewires Host Cell Metabolism and Is Potentially Susceptible to mTORC1 Inhibition. Nat Commun (2021) 12(1):1876–. doi: 10.1038/s41467-021-22166-4
145. Liu X, Zhao J, Wang H, Wang W, Su X, Liao X, et al. Metabolic Defects of Peripheral T Cells in COVID-19 Patients. J Immunol (2021) 206(12):2900–8. doi: 10.4049/jimmunol.2100068
146. Jin C, Luo X, Qian S, Zhang K, Gao Y, Zhou R, et al. Positron Emission Tomography in the COVID-19 Pandemic Era. Eur J Nucl Med Mol Imaging (2021) 48(12):3903–17. doi: 10.1007/s00259-021-05347-7
147. Shi D, Yan R, Lv L, Jiang H, Lu Y, Sheng J, et al. The Serum Metabolome of COVID-19 Patients Is Distinctive and Predictive. Metabolism (2021) 118:154739. doi: 10.1016/j.metabol.2021.154739
148. Kumar V. How Could We Forget Immunometabolism in SARS-CoV2 Infection or COVID-19? Int Rev Immunol (2021) 40(1-2):72–107. doi: 10.1080/08830185.2020.1840567
149. Ajaz S, McPhail MJ, Singh KK, Mujib S, Trovato FM, Napoli S, et al. Mitochondrial Metabolic Manipulation by SARS-CoV-2 in Peripheral Blood Mononuclear Cells of Patients With COVID-19. Am J Physiol Cell Physiol (2021) 320(1):C57–65. doi: 10.1152/ajpcell.00426.2020
150. Codo AC, Davanzo GG, Monteiro L, de Souza GF, Muraro SP, Virgilio-da-Silva JV, et al. Elevated Glucose Levels Favor SARS-CoV-2 Infection and Monocyte Response Through a HIF-1α/Glycolysis-Dependent Axis. Cell Metab (2020) 32(3):437–46.e5. doi: 10.2139/ssrn.3606770
151. Halder S, Mehta AK. 2-Deoxy-D-Glucose: Is This the Final Cure for COVID-19: Or Yet Another Mirage? Eur Rev Med Pharmacol Sci (2021) 25(13):4448–50. doi: 10.26355/eurrev_202107_26234
152. De Biasi S, Meschiari M, Gibellini L, Bellinazzi C, Borella R, Fidanza L, et al. Marked T Cell Activation, Senescence, Exhaustion and Skewing Towards TH17 in Patients With COVID-19 Pneumonia. Nat Commun (2020) 11(1):3434. doi: 10.21203/rs.3.rs-23957/v1
153. Siska PJ, Decking S-M, Babl N, Matos C, Bruss C, Singer K, et al. Metabolic Imbalance of T Cells in COVID-19 Is Hallmarked by Basigin and Mitigated by Dexamethasone. J Clin Invest (2021) 131(22):1–16. doi: 10.1172/JCI148225
154. Guo N, Ye S, Zhang K, Yu X, Cui H, Yang X, et al. A Critical Epitope in CD147 Facilitates Memory CD4+ T-Cell Hyper-Activation in Rheumatoid Arthritis. Cell Mol Immunol (2019) 16(6):568–79. doi: 10.1038/s41423-018-0012-4
155. Carfì A, Bernabei R, Landi F, Gemelli Against C-P-ACSG. Persistent Symptoms in Patients After Acute COVID-19. JAMA (2020) 324(6):603–5. doi: 10.1001/jama.2020.12603
156. Havervall S, Rosell A, Phillipson M, Mangsbo SM, Nilsson P, Hober S, et al. Symptoms and Functional Impairment Assessed 8 Months After Mild COVID-19 Among Health Care Workers. JAMA (2021) 325(19):2015–6. doi: 10.1001/jama.2021.5612
157. Visvabharathy L, Hanson B, Orban Z, Lim PH, Palacio N, Jain R, et al. Neuro-COVID Long-Haulers Exhibit Broad Dysfunction in T Cell Memory Generation and Responses to Vaccination. medRxiv (2021) 2021.08.08.21261763. doi: 10.1101/2021.08.08.21261763
158. Vehar S, Boushra M, Ntiamoah P, Biehl M. Post-Acute Sequelae of SARS-CoV-2 Infection: Caring for the ‘Long-Haulers’. Cleve Clin J Med (2021) 88(5):267–72. doi: 10.3949/ccjm.88a.21010
159. Thompson EA, Cascino K, Ordonez AA, Zhou W, Vaghasia A, Hamacher-Brady A, et al. Metabolic Programs Define Dysfunctional Immune Responses in Severe COVID-19 Patients. Cell Rep (2021) 34(11):1–19. doi: 10.1016/j.celrep.2021.108863
160. LaMere SA, Thompson RC, Meng X, Komori HK, Mark A, Salomon DR. H3K27 Methylation Dynamics During CD4 T Cell Activation: Regulation of JAK/STAT and IL12RB2 Expression by JMJD3. J Immunol (Baltimore Md: 1950) (2017) 199(9):3158–75. doi: 10.4049/jimmunol.1700475
161. Cribbs AP, Terlecki-Zaniewicz S, Philpott M, Baardman J, Ahern D, Lindow M, et al. Histone H3K27me3 Demethylases Regulate Human Th17 Cell Development and Effector Functions by Impacting on Metabolism. Proc Natl Acad Sci (2020) 117(11):6056–66. doi: 10.1073/pnas.1919893117
162. Heming M, Li X, Räuber S, Mausberg AK, Börsch A-L, Hartlehnert M, et al. Neurological Manifestations of COVID-19 Feature T Cell Exhaustion and Dedifferentiated Monocytes in Cerebrospinal Fluid. Immunity (2021) 54(1):164–75.e6. doi: 10.1016/j.immuni.2020.12.011
163. Karki R, Sharma BR, Tuladhar S, Williams EP, Zalduondo L, Samir P, et al. Synergism of TNF-α and IFN-γ Triggers Inflammatory Cell Death, Tissue Damage, and Mortality in SARS-CoV-2 Infection and Cytokine Shock Syndromes. Cell (2021) 184(1):149–68.e17. doi: 10.1016/j.cell.2020.11.025
164. Walker B, McMichael A. The T-Cell Response to HIV. Cold Spring Harb Perspect Med (2012) 2(11):a007054. doi: 10.1101/cshperspect.a007054
165. Vidya Vijayan KK, Karthigeyan KP, Tripathi SP, Hanna LE. Pathophysiology of CD4+ T-Cell Depletion in HIV-1 and HIV-2 Infections. Front Immunol (2017) 8:580. doi: 10.3389/fimmu.2017.00580
166. Porichis F, Kaufmann DE. Role of PD-1 in HIV Pathogenesis and as Target for Therapy. Curr HIV/AIDS Rep (2012) 9(1):81–90. doi: 10.1007/s11904-011-0106-4
167. Fenwick C, Joo V, Jacquier P, Noto A, Banga R, Perreau M, et al. T-Cell Exhaustion in HIV Infection. Immunol Rev (2019) 292(1):149–63. doi: 10.1111/imr.12823
168. Choi W-T, Yang Y, Xu Y, An J. Targeting Chemokine Receptor CXCR4 for Treatment of HIV-1 Infection, Tumor Progression, and Metastasis. Curr Top Med Chem (2014) 14(13):1574–89. doi: 10.2174/1568026614666140827143541
169. Loisel-Meyer S, Swainson L, Craveiro M, Oburoglu L, Mongellaz C, Costa C, et al. Glut1-Mediated Glucose Transport Regulates HIV Infection. Proc Natl Acad Sci USA (2012) 109(7):2549–54. doi: 10.1073/pnas.1121427109
170. Palmer CS, Ostrowski M, Gouillou M, Tsai L, Yu D, Zhou J, et al. Increased Glucose Metabolic Activity Is Associated With CD4+ T-Cell Activation and Depletion During Chronic HIV Infection. AIDS (2014) 28(3):297–309. doi: 10.1097/QAD.0000000000000128
171. Guo H, Wang Q, Ghneim K, Wang L, Rampanelli E, Holley-Guthrie E, et al. Multi-Omics Analyses Reveal That HIV-1 Alters CD4+ T Cell Immunometabolism to Fuel Virus Replication. Nat Immunol (2021) 22(4):423–33. doi: 10.1038/s41590-021-00898-1
172. Hegedus A, Kavanagh Williamson M, Huthoff H. HIV-1 Pathogenicity and Virion Production Are Dependent on the Metabolic Phenotype of Activated CD4+ T Cells. Retrovirology (2014) 11:98. doi: 10.1186/s12977-014-0098-4
173. Angin M, Volant S, Passaes C, Lecuroux C, Monceaux V, Dillies M-A, et al. Metabolic Plasticity of HIV-Specific CD8+ T Cells Is Associated With Enhanced Antiviral Potential and Natural Control of HIV-1 Infection. Nat Metab (2019) 1(7):704–16. doi: 10.1038/s42255-019-0081-4
174. Houben RM, Dodd PJ. The Global Burden of Latent Tuberculosis Infection: A Re-Estimation Using Mathematical Modelling. PloS Med (2016) 13(10):e1002152. doi: 10.1371/journal.pmed.1002152
175. de Martino M, Lodi L, Galli L, Chiappini E. Immune Response to Mycobacterium Tuberculosis: A Narrative Review. Front Pediatr (2019) 7:350. doi: 10.3389/fped.2019.00350
176. Geldmacher C, Zumla A, Hoelscher M. Interaction Between HIV and Mycobacterium Tuberculosis: HIV-1-Induced CD4 T-Cell Depletion and the Development of Active Tuberculosis. Curr Opin HIV AIDS (2012) 7(3):268–75. doi: 10.1097/COH.0b013e3283524e32
177. Barber DL, Mayer-Barber KD, Feng CG, Sharpe AH, Sher A. CD4 T Cells Promote Rather Than Control Tuberculosis in the Absence of PD-1–Mediated Inhibition. J Immunol (2011) 186(3):1598–607. doi: 10.4049/jimmunol.1003304
178. Crowther RR, Qualls JE. Metabolic Regulation of Immune Responses to Mycobacterium Tuberculosis: A Spotlight on L-Arginine and L-Tryptophan Metabolism. Front Immunol (2021) 11:628432. doi: 10.3389/fimmu.2020.628432
179. Schinzel AC, Takeuchi O, Huang Z, Fisher JK, Zhou Z, Rubens J, et al. Cyclophilin D Is a Component of Mitochondrial Permeability Transition and Mediates Neuronal Cell Death After Focal Cerebral Ischemia. Proc Natl Acad Sci USA (2005) 102(34):12005–10. doi: 10.1073/pnas.0505294102
180. Bernardi P, Di Lisa F. The Mitochondrial Permeability Transition Pore: Molecular Nature and Role as a Target in Cardioprotection. J Mol Cell Cardiol (2015) 78:100–6. doi: 10.1016/j.yjmcc.2014.09.023
181. Tzelepis F, Blagih J, Khan N, Gillard J, Mendonca L, Roy DG, et al. Mitochondrial Cyclophilin D Regulates T Cell Metabolic Responses and Disease Tolerance to Tuberculosis. Sci Immunol (2018) 3(23):eaar4135. doi: 10.1126/sciimmunol.aar4135
182. Russell SL, Lamprecht DA, Mandizvo T, Jones TT, Naidoo V, Addicott KW, et al. Compromised Metabolic Reprogramming Is an Early Indicator of CD8+ T Cell Dysfunction During Chronic Mycobacterium Tuberculosis Infection. Cell Rep (2019) 29(11):3564–79.e5. doi: 10.1016/j.celrep.2019.11.034
183. Yan Y, Zhang G-X, Gran B, Fallarino F, Yu S, Li H, et al. IDO Upregulates Regulatory T Cells via Tryptophan Catabolite and Suppresses Encephalitogenic T Cell Responses in Experimental Autoimmune Encephalomyelitis. J Immunol (Baltimore Md: 1950) (2010) 185(10):5953–61. doi: 10.4049/jimmunol.1001628
184. Adams KN, Moguche AO, Plumlee CR, Urdahl KB. TGF-β-Mediated Inhibition of IFN-γ Production by Mycobacterium Tuberculosis-Specific T Cells in the Infected Lung. J Immunol (2016) 196(1 Supplement):65–5.
185. Mehra S, Alvarez X, Didier PJ, Doyle LA, Blanchard JL, Lackner AA, et al. Granuloma Correlates of Protection Against Tuberculosis and Mechanisms of Immune Modulation by Mycobacterium Tuberculosis. J Infect Dis (2012) 207(7):1115–27. doi: 10.1093/infdis/jis778
186. Gautam US, Foreman TW, Bucsan AN, Veatch AV, Alvarez X, Adekambi T, et al. In Vivo Inhibition of Tryptophan Catabolism Reorganizes the Tuberculoma and Augments Immune-Mediated Control of Mycobacterium Tuberculosis. Proc Natl Acad Sci (2018) 115(1):E62–71. doi: 10.1073/pnas.1711373114
187. Mezrich JD, Fechner JH, Zhang X, Johnson BP, Burlingham WJ, Bradfield CA. An Interaction Between Kynurenine and the Aryl Hydrocarbon Receptor Can Generate Regulatory T Cells. J Immunol (2010) 185(6):3190–8. doi: 10.4049/jimmunol.0903670
188. Renner K, Bruss C, Schnell A, Koehl G, Becker HM, Fante M, et al. Restricting Glycolysis Preserves T Cell Effector Functions and Augments Checkpoint Therapy. Cell Rep (2019) 29(1):135–50.e9. doi: 10.1016/j.celrep.2019.08.068
189. Klysz D, Tai X, Robert PA, Craveiro M, Cretenet G, Oburoglu L, et al. Glutamine-Dependent α-Ketoglutarate Production Regulates the Balance Between T Helper 1 Cell and Regulatory T Cell Generation. Sci Signal (2015) 8(396):ra97–ra. doi: 10.1126/scisignal.aab2610
Keywords: T cells, metabolism, immunometabolism, infection, HIV, COVID-19, tuberculosis
Citation: Wik JA and Skålhegg BS (2022) T Cell Metabolism in Infection. Front. Immunol. 13:840610. doi: 10.3389/fimmu.2022.840610
Received: 21 December 2021; Accepted: 17 February 2022;
Published: 14 March 2022.
Edited by:
Paul “Li-Hao” Huang, Fudan University, ChinaReviewed by:
Arunakumar Gangaplara, Miltenyi Biotec, United StatesCopyright © 2022 Wik and Skålhegg. This is an open-access article distributed under the terms of the Creative Commons Attribution License (CC BY). The use, distribution or reproduction in other forums is permitted, provided the original author(s) and the copyright owner(s) are credited and that the original publication in this journal is cited, in accordance with accepted academic practice. No use, distribution or reproduction is permitted which does not comply with these terms.
*Correspondence: Bjørn Steen Skålhegg, Yi5zLnNrYWxoZWdnQG1lZGlzaW4udWlvLm5v
Disclaimer: All claims expressed in this article are solely those of the authors and do not necessarily represent those of their affiliated organizations, or those of the publisher, the editors and the reviewers. Any product that may be evaluated in this article or claim that may be made by its manufacturer is not guaranteed or endorsed by the publisher.
Research integrity at Frontiers
Learn more about the work of our research integrity team to safeguard the quality of each article we publish.