 Zahra Abbas1,2
 Courtney George2,3
 Mathew Ancliffe2,4
 Meegan Howlett1,2
 Anya C. Jones1,5
 Mani Kuchibhotla2Robert J. Wechsler-Reya6
 Nicholas G. Gottardo1,2,7
 Raelene Endersby1,2*
- 1Centre for Child Health Research, University of Western Australia, Perth, WA, Australia
- 2Brain Tumour Research Program, Telethon Kids Cancer Centre, Telethon Kids Institute, Perth, WA, Australia
- 3School of Medical and Health Sciences, Edith Cowan University, Perth, WA, Australia
- 4School of Veterinary and Life Sciences, Murdoch University, Perth, WA, Australia
- 5Cancer Centre Core Research, Telethon Kids Cancer Centre, Telethon Kids Institute, Perth, WA, Australia
- 6NCI-Designated Cancer Center, Sanford Burnham Prebys Medical Discovery Institute, La Jolla, CA, United States
- 7Department of Paediatric and Adolescent Oncology and Haematology, Perth Children’s Hospital, Perth, WA, Australia
Medulloblastoma is the most common childhood brain cancer. Mainstay treatments of radiation and chemotherapy have not changed in decades and new treatment approaches are crucial for the improvement of clinical outcomes. To date, immunotherapies for medulloblastoma have been unsuccessful, and studies investigating the immune microenvironment of the disease and the impact of current therapies are limited. Preclinical models that recapitulate both the disease and immune environment are essential for understanding immune-tumor interactions and to aid the identification of new and effective immunotherapies. Using an immune-competent mouse model of aggressive Myc-driven medulloblastoma, we characterized the brain immune microenvironment and changes induced in response to craniospinal irradiation, or the medulloblastoma chemotherapies cyclophosphamide or gemcitabine. The role of adaptive immunity in disease progression and treatment response was delineated by comparing survival outcomes in wildtype C57Bl/6J and in mice deficient in Rag1 that lack mature T and B cells. We found medulloblastomas in wildtype and Rag1-deficient mice grew equally fast, and that craniospinal irradiation and chemotherapies extended survival equally in wildtype and Rag1-deficient mice, suggesting that tumor growth and treatment response is independent of T and B cells. Medulloblastomas were myeloid dominant, and in wildtype mice, craniospinal irradiation and cyclophosphamide depleted T and B cells in the brain. Gemcitabine treatment was found to minimally alter the immune populations in the brain, resulting only in a depletion of neutrophils. Intratumorally, we observed an abundance of Iba1+ macrophages, and we show that CD45high cells comprise the majority of immune cells within these medulloblastomas but found that existing markers are insufficient to clearly delineate resident microglia from infiltrating macrophages. Ultimately, brain resident and peripheral macrophages dominate the brain and tumor microenvironment and are not depleted by standard-of-care medulloblastoma therapies. These populations therefore present a favorable target for immunotherapy in combination with front-line treatments.
Introduction
Medulloblastoma is the most common malignant brain cancer in children, accounting for over 60% of childhood embryonal brain tumors [reviewed in (1)]. Extensive molecular analyses by multiple groups have revealed that medulloblastomas can be classified according to molecular and histopathological features into four major subgroups (WNT, SHH, Group 3, and Group 4) which vary in their clinical outcomes (2, 3). Standard-of-care treatment consists of radiotherapy and chemotherapy following surgical resection which has not changed for decades, survival outcomes have plateaued (4), and severe treatment-induced toxicity remains a major problem for survivors (1). Approximately 30% of children with medulloblastoma will fail conventional therapy (5). While certain molecular features can identify tumors at high risk of treatment failure, including amplification and/or overexpression of MYC in Group 3 medulloblastoma (6), limited therapeutic options exist for patients following relapse and there are minimal genetic changes in Group 3 tumors that can be therapeutically targeted at this disease stage (7). Consequently, there is an urgent and unmet need to identify new therapies for the treatment of medulloblastoma and to improve quality-of-life following disease control.
Immunotherapy has arisen as a possible adjunct to conventional therapy to improve the efficacy and mitigate the profound neurotoxicity of current medulloblastoma treatments; however, there have been few studies defining the mechanisms by which medulloblastomas evade anti-tumoral immune activity. Despite the successes immunotherapies have had in other cancers, no clinically approved immunotherapy has had proven success in clinical trials for medulloblastoma to date. Although there are several different immunotherapeutic approaches currently in clinical trials for children with medulloblastoma, including immune checkpoint inhibitors, oncolytic viruses, and dendritic cell vaccines, all of these are early phase studies, and none have progressed beyond phase 2. Moreover, as with many early phase clinical trials for pediatric cancer, these agents are being evaluated in children with recurrent or relapsed disease; whereas past clinical trial experience indicates that new therapies for medulloblastoma have the greatest chance of success when applied early in the course of the disease. This is because relapsed medulloblastoma is typically highly treatment resistant and a patient’s likelihood of responding to salvage therapy is low at this disease stage (<5% long-term survival) (5, 8, 9). It is therefore important that new immuno-therapies being considered for medulloblastoma are rationally designed based on the immune cells present within tumors and tested for efficacy in combination with standard first-line therapies like radiotherapy and chemotherapy. However, studies investigating the impact of radiotherapy and chemotherapy on the immune microenvironment of medulloblastoma are limited. As a result, it is poorly understood how compatible standard therapies are with existing or emerging immunotherapeutics.
Here, we have utilized both immune-competent and immunodeficient murine models of aggressive Myc-driven medulloblastoma (10) and characterized adaptive and innate immune cell infiltration in the brain. We describe the impact of the adaptive immune system on tumor growth and treatment response using Rag1 knockout mice. These mice are deficient in V(D)J recombination, resulting in the arrest of T and B cell differentiation at an early stage and subsequent severe combined immunodeficiency (11). In addition, we have defined how the immune microenvironment changes in response to clinically-relevant fractionated craniospinal irradiation (CSI) protocols, or to the clinically used medulloblastoma chemotherapies cyclophosphamide (CPA) or gemcitabine (GEM). We show that these first-line therapies deplete lymphocyte populations in the brain/medulloblastoma microenvironment, and recommend these impacts be considered when designing future up-front treatment protocols that incorporate immunotherapies for medulloblastoma.
Materials and Methods
Preclinical Models
6-12 week old female C57Bl/6J (WT) mice were obtained from the Animal Resource Centre (Perth, Australia). 6-12 week old female C57Bl/6J Rag1-/- (Rag1KO) mice, that lack mature T and B cells (11), were obtained from an on-site breeding colony at the Telethon Kids Institute Bioresources Facility. Mice were group-housed in a pathogen-free facility at the Telethon Kids Institute (12:12 hour light:dark cycle) with access to standard chow and water ad libitum. Mice received sunflower seeds during treatment for enrichment and to maintain healthy weight. All animal procedures were approved by the Animal Ethics Committee of the Telethon Kids Institute and performed in accordance with Australia’s Code for the Care and use of Animals for Scientific Purposes.
The murine allograft model of aggressive Myc-amplified Group 3 medulloblastoma (Myc/p53DD) was generated through retroviral-driven expression of MycT58A, a dominant negative carboxy-terminal fragment of Tp53, GFP and firefly luciferase in CD133-positive cerebellar stem cells as previously described (10). For intracranial implantation, Myc/p53DD cells were harvested from female C57Bl/6J donor mice, suspended in Matrigel (BD Biosciences), and 5,000 cells were implanted per mouse as previously described (12).
Tumor size was monitored using bioluminescence imaging with an IVIS Spectrum (Caliper, USA). Prior to imaging, fur was removed with electric clippers and depilatory cream. Mice received intraperitoneal injections of D-Luciferin [15 mg/kg in Dulbecco’s phosphate-buffered saline (DPBS)] and were anesthetized with isoflurane. During image acquisition, isoflurane was maintained at 1.5-1.8% in oxygen (flow rate 0.5 L/min) and images were acquired every minute for 10 minutes until peak photon flux was recorded. Bioluminescence was used as a surrogate measure of tumor burden and mice were randomized into groups such that the average flux ± standard deviation (SD) was equal across all groups at the start of treatment.
Craniospinal Irradiation (CSI)
Irradiation was performed using a X-RAD SmART small animal image-guided radiation therapy system (Precision X-Ray, USA) employing cone-beam CT guidance with fully assessed spatial and dosimetric accuracy (13). Treatment planning and dose calculations were performed using Monte Carlo simulations in SmART-Plan software (14). Mice were anesthetized with isoflurane, maintained at 1-2% in air delivered via nose cone during treatment. Mice were secured to the irradiation stage with non-adhesive athletic tape to flatten the spine and avoid irradiating abdominal organs. CSI was achieved using two sets of two lateral coplanar beams with 40 mm square collimation delivered to two separate isocenters, with the first set of beams targeting the brain and cervical spine, the second targeting the thoracic and lumbar spine. Mice received a total of 20 Gy CSI fractionated as 10 doses of 2 Gy, delivered on a 5-days-on, 2-days-off schedule for two weeks (15) (Figure 1A). For the sham control group, mice were anesthetized with isoflurane on a 5-days-on, 2-days-off schedule for two weeks for an equal length of time per day as the CSI treatment protocol. Animals were humanely euthanized upon the onset of tumor-related morbidity.
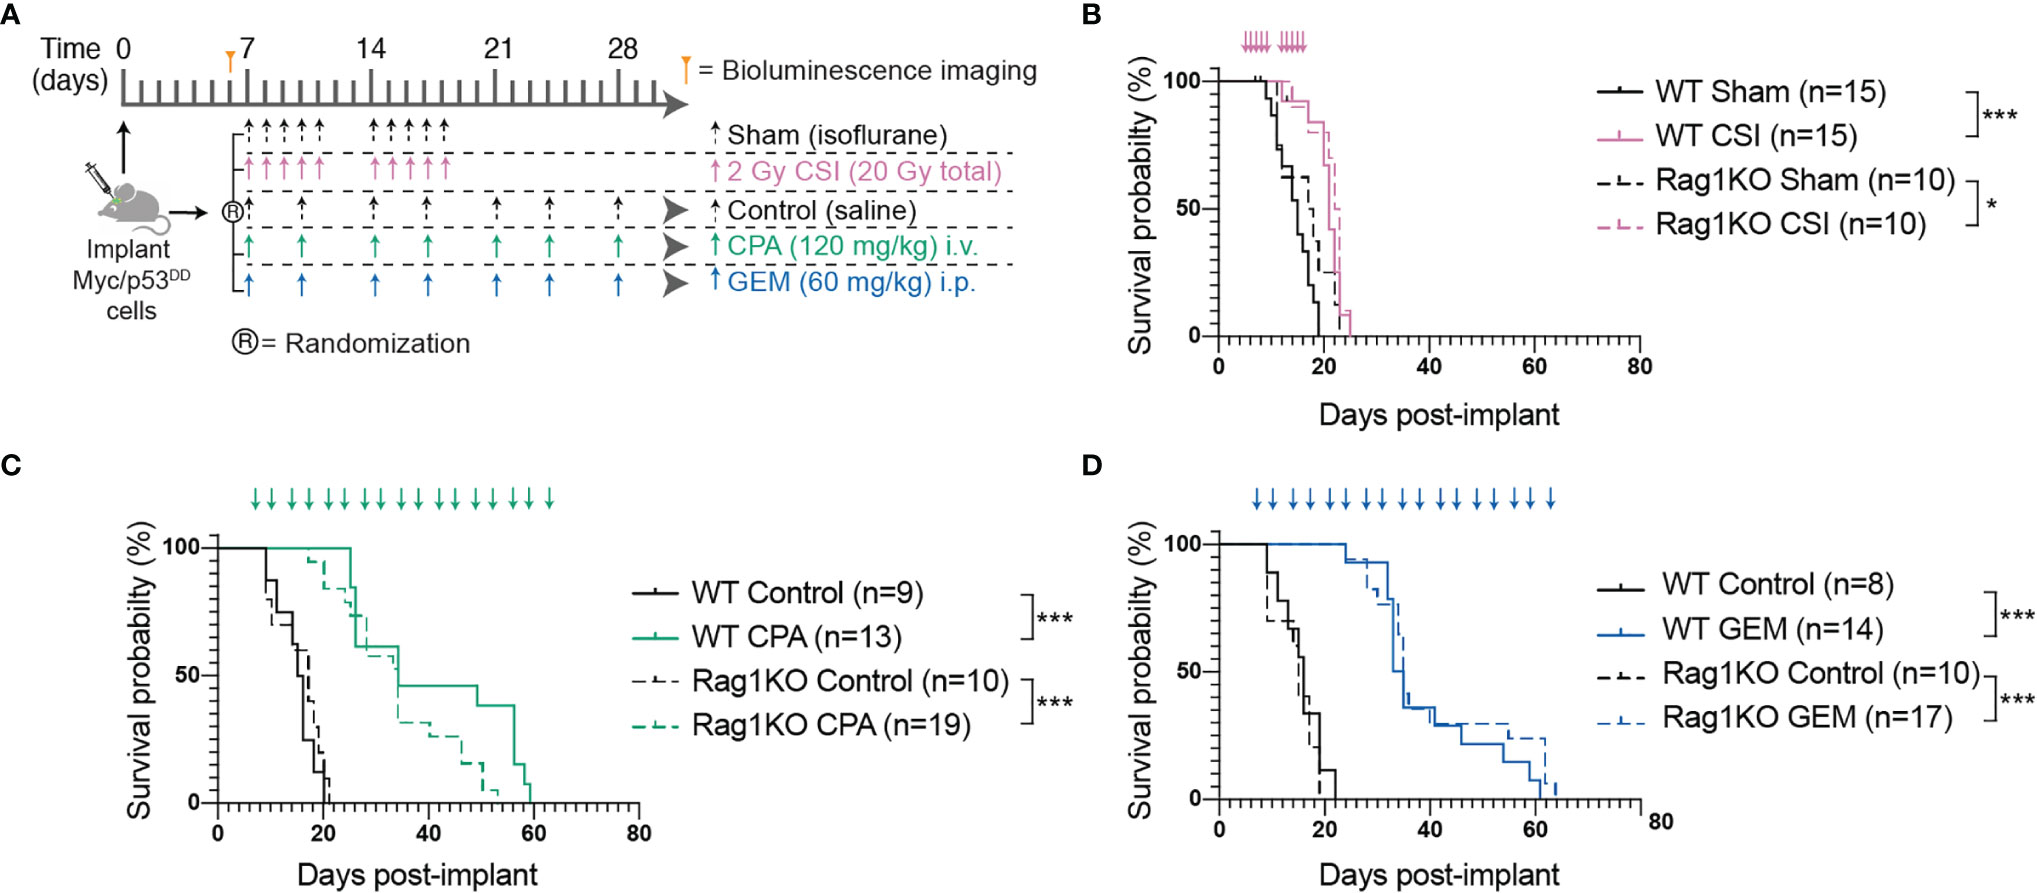
Figure 1 The adaptive immune system does not play a role in Myc/p53DD tumor progression nor treatment efficacy. (A) Schematic diagram illustrating the treatment protocols for craniospinal irradiation (CSI), cyclophosphamide (CPA) and gemcitabine (GEM). (B–D) Survival curves of multiple independent experiments (minimum of two independent experiments per treatment) of WT (solid lines) or Rag1KO (dashed lines) mice treated with (B) CSI (pink), (C) CPA (green), or (D) GEM (blue). Arrows on graphs indicate when treatment was administered. The number of mice per group (n) is shown and significant differences between survival curves determined using log-rank tests is indicated (*P < 0.05; ***P < 0.001).
Chemotherapy
Cyclophosphamide (CPA, Baxter) and gemcitabine (GEM, MedChemExpress) were diluted in phosphate-buffered saline (PBS) and delivered twice weekly (day 7, 10, 14, 17, etc.). CPA was delivered intraperitoneally (i.p.) at 120 mg/kg and GEM was delivered intravenously (i.v.) at 60 mg/kg. Control mice received saline injections via the equivalent route on the same schedule (Figure 1A). Treatment was continued until mice required euthanasia due to tumor-related morbidity.
Flow Cytometry
Single cell suspensions were prepared from whole brains for flow cytometric analysis. Whole brains were minced on a sterile petri dish with a scalpel blade, prior to addition of 5 mL digestion buffer (100 U/mL Collagenase IV (Life Technologies), 10 U/mL DNAse (Sigma-Aldrich) in Hank’s balanced salt solution (HBSS, Gibco)), followed by trituration to obtain a uniform suspension. The tissue suspension was transferred to a gentleMACS C tube (Miltenyi) and further digested on a gentleMACS Octo Dissociator (Miltenyi) for 30 minutes, with constant stirring at 50 RPM at 37°C. Digestion was halted with the addition of 10 mL cold FACS buffer (2% fetal calf serum, 5 mM EDTA in HBSS) and the suspension was strained through a 100 μm filter (Miltenyi). Red blood cells were lysed with red blood cell lysis solution (Miltenyi), cells were resuspended in 10 mL FACS buffer and strained through a 30 μm filter (Miltenyi). To remove myelin, cells were resuspended in 10 mL of 30% Percoll (Sigma-Aldrich) diluted in FACS buffer and centrifuged at 800 g for 30 min at room temperature. The myelin layer was removed, and cells resuspended in DPBS before staining.
Given that chemotherapy is known to have systemic effects, spleen tissue was routinely collected and analyzed alongside brain tissue as a control to characterize the effects of chemotherapy on immune cells outside the central nervous system. In addition, the spleens of mice treated with CSI would have received some off-target irradiation when radiotherapy was delivered to the thoracic and lumbar spine. Spleen dissociation protocols and results can be found in the Supplementary Data (Supplementary Figure 1).
Single cell suspensions were labelled with a viability stain (BD Bioscience Cat #564997) then stained with the following fluorochrome conjugated cell surface marker antibodies: CD45-BV421 (BD Bioscience Cat #563890), IAIE-BV510 (Biolegend Cat #107635), CD11b-BV605 (Biolegend Cat #101257), CD4-BV650 (BD Bioscience Cat #563747), CD8a-BV711 (BD Bioscience Cat #563046), NK1.1-BV786 (Biolegend Cat #108749), B220-PerCP-Cy5.5 (BD Bioscience Cat #552771), F4/80-PE (BD Bioscience Cat #565410), CD3e-PE-CF594 (BD Bioscience Cat #562286), CD19-PECy7 (BD Bioscience Cat #552854), CD11c-APC (BD Bioscience Cat #550261), Ly6G-APC-Cy7 (BD Bioscience Cat #560600). Antibody dilutions and the staining protocol can be found in the Supplementary Material (Supplementary Methods and Supplementary Table 1). Data were acquired on a LSRFortessa X-20 (BD Bioscience, USA) and immune populations were gated using FlowJo (Figure 2). The combination of markers used to define different immune populations is described in Supplementary Table 2. Positively stained cells are presented as a proportion of all CD45-positive cells. Alternatively, calibration beads (BD Bioscience Cat #556296) were added to cell suspensions to quantify the total numbers of immune cells within each tissue sample by comparing the ratio of bead events to cell events. Population statistics were compared and graphed in GraphPad PRISM v8. Gating strategy for populations from Rag1KO mice are shown in Supplementary Figure 2.
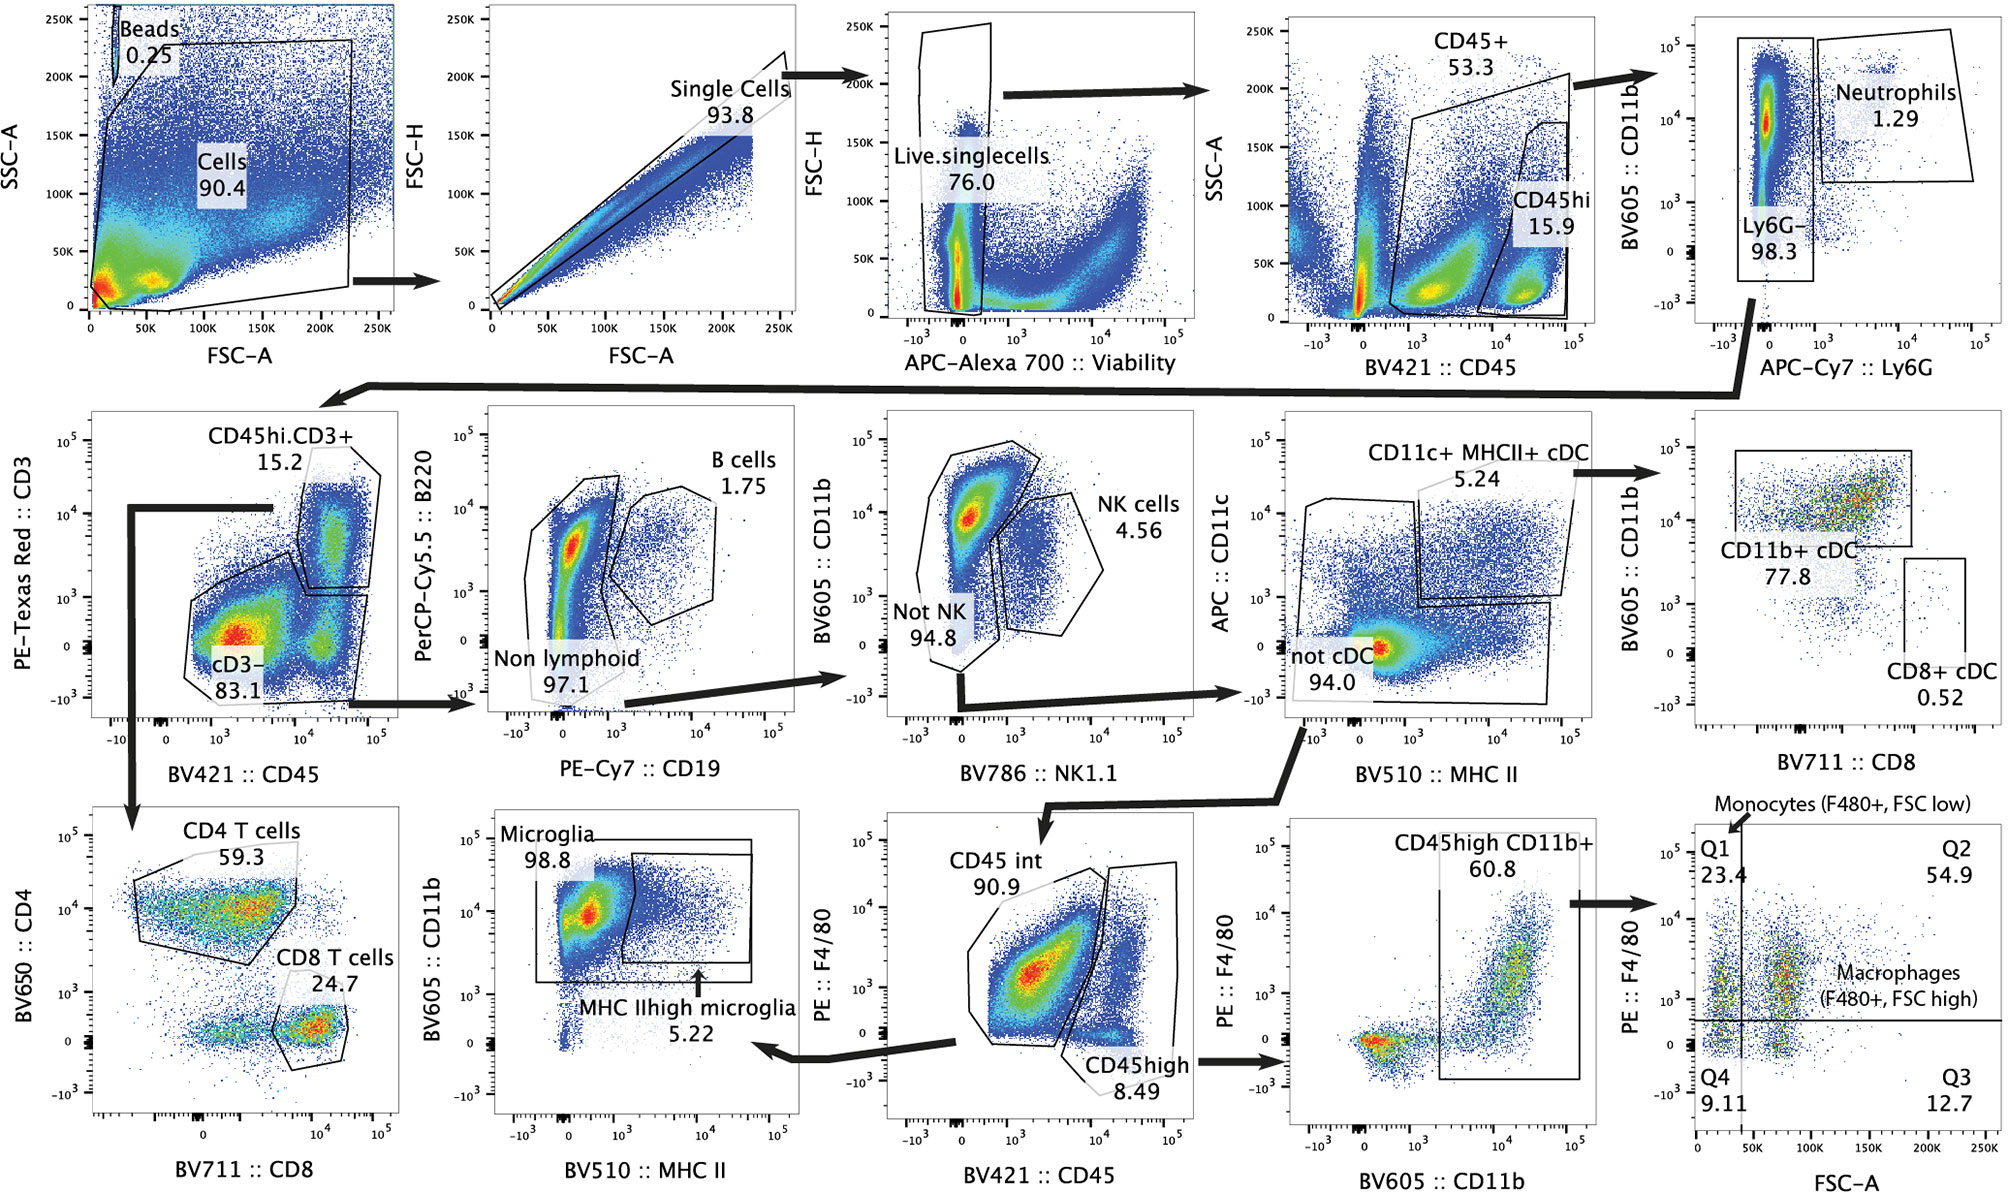
Figure 2 Gating strategy for flow cytometry analysis of mouse brain. Representative plots of gating strategy for immune populations in C57Bl/6J WT brain.
For CSI treated mice, immune cell populations were assessed at two experimental time points. Firstly, tissue was harvested 24 hours following the final (10th) dose of CSI (referred to as “acute”) to capture transient changes in immune populations following CSI. A second time point was captured approximately 1-2 weeks after the cessation of CSI (referred to as “late stage”), when tumor burden was high and mice were moribund, to determine lasting effects of CSI. For all chemotherapy experiments, brains were analyzed when tumor burden was high and caused morbidity requiring euthanasia. Due to the continual dosing schedule (Figure 1), tumor related morbidity and tissue analyses occurred within 2-3 days of chemotherapy dosing. Healthy, non-tumor bearing mice were time-matched to Myc/p53DD bearing mice. To determine proportions of CD45high and CD45intermediate (CD45int) tumor-infiltrating immune cells, untreated Myc/p53DD medulloblastomas from C57Bl/6J WT mice were dissected out from the brain, dissociated as above, and labelled with viability stain (BD Bioscience Cat #564997) and CD45-BV421 (BD Bioscience Cat #563890).
Immunohistochemistry (IHC)
Mice were transcardially perfused with PBS, followed by 4% paraformaldehyde (PFA) in PBS. Brains were further fixed overnight in 4% PFA at 4°C before embedding into paraffin. IHC was performed on 5 μm sections. Briefly, sections were deparaffinized and rehydrated using an ST5010 AutoStainer XL (Leica, Germany). Antigen retrieval was performed using a sodium citrate buffer (1.8 mM citric acid, 8.2 mM sodium citrate), sections were incubated in 3% H2O2 to block endogenous peroxidases, blocked with 10% normal goat serum in Tris buffered saline containing 0.01% Tween 20 (TBS-T) for one hour at room temperature, and incubated with primary antibodies overnight at 4°C in 2% goat serum in TBS-T. Slides were incubated with biotinylated secondary antibodies, then incubated with an streptavidin-conjugated peroxidase reagent (Elite ABC, Vector Labs). Slides were incubated with NovaRED peroxidase substrate (Vector Labs), counterstained with Gill’s Hematoxylin (Vector Labs), dehydrated, and coverslipped with Permount (Fisher Scientific). Slides were stained with the following antibodies: Iba1 (1:800, Wako Chemicals, Cat #019-19741), Tmem119 (1:300, Abcam, Cat #ab209064). Positively-stained cells with evident nuclei were counted from four 1mm2 areas per mouse corresponding to three different areas: normal cortex, areas where the image consisted of 50% tumor and 50% normal brain, or tumor. Data are presented as cells per mm2.
RNA Isolation and Bulk RNA Sequencing
Tumor tissue was dissected from the brain, snap frozen using dry ice and stored at -80°C. Total RNA was isolated from 5-20 mg tumor tissue using the RNeasy Plus Mini Kit (Qiagen) as per the supplied protocol. RNA concentration and purity was assessed on a spectrophotometer (NanoDrop) and total RNA was submitted to GenomicsWA (Perth, Australia) (CSI and Sham samples) or the Australian Genome Research Facility (AGRF) (CPA, GEM, control samples). Samples had an average ± SD RNA integrity number (RIN) of 9.8 ± 0.36 prior to library preparation. Total RNA library preparation (SureSelect, Agilent), rRNA depletion (Ribo-Zero Plus, Illumina) and sequencing were carried out by GenomicsWA or AGRF. Libraries were sequenced on NovaSeq 6000 S1 flow cells as paired-end 150bp reads (Illumina). Raw sequencing data for two independent datasets are available from the European Genome Archives (EGAS00001005847 and EGAS00001005846).
Pre-Processing, Quality Control (QC) and Exploratory Data Analysis
Adapter and quality trimming were applied using CutAdapt (16). Pre-alignment and post-alignment QC were carried out with FastQC (17) and SAMStat (18) respectively. Reads were aligned to the mouse reference genome (GRCm38) using HISAT2 (19) and quantified at the gene-level with summarizedOverlaps() (20). The proportion of mapped reads was 84% (79.7-87%) in CPA/GEM/Control samples and 90% (89.3-91.5%) in CSI/Sham samples.
Data analysis was carried out in the statistical computing environment R (version 4.1.1). Genes with an official MGI Gene Nomenclature Committee symbol and a count per million corresponding to 10 in ≥3 were retained for downstream analysis. Exploratory data analysis was carried out using EDASeq (21) and standard QC plots were used to identify potential outlying samples pre- and post-global-scale median normalization of gene counts. Unwanted variation was removed employing RUVSeq (21).
Estimation of the Cellular Composition With CIBERSORTx
CIBERSORTx (22) was used to estimate the immune cell proportions in medulloblastoma tissue. A published C57Bl/6J WT whole brain single cell dataset (23) (GEO accession GSE128855) was used as the reference dataset containing 8 annotated brain immune cell types (microglia, B cells, NK/NKT cells, T cells, cDC, monocytes, border associated macrophages, neutrophils). The following parameters were used: disabled batch correction, relative run mode, 100 permutations. Cell fractions calculated by CIBERSORTx in treatment groups were compared to their control (CSI vs Sham, CPA and GEM vs Control) by unpaired two-tailed t tests.
Differential Expression Analysis
Differentially expressed genes were identified using edgeR (24). A linear binomial model was fit to the data and a false discovery rate (FDR) for multiple testing was applied. An adjusted P < 0.05 and an absolute log2 fold change > 0.5 (fold change = 1.5) was deemed significant.
Pathway Analysis
Up- and downregulated genes were assessed separately for pathways enrichment using InnateDB (25) version 5.4. Enrichment testing is based on a hypergeometric distribution and P values are corrected using the Benjamini-Hochberg method for multiple testing.
Upstream Driver Analysis
Putative molecular drivers of the observed gene expression patterns were identified using upstream regulator analysis from Ingenuity Systems KnowledgeBase (26). Significance testing is based on a Fisher’s exact test, testing for enrichment against known upstream drivers. The Benjamini-Hochberg method was used to correct for multiple testing. An adjusted P-value < 0.01 and absolute z-score > 2.0 (predicting activation/inhibition of the driver) were deemed significant.
Statistical Analyses
Kaplan-Meier survival curves were compared using the log-rank test. In each survival experiment, treatment groups were compared to their equivalent controls. Unpaired two-tailed t tests were used to compare immune populations for flow cytometry data. Treatments were compared to their control (CSI vs Sham, CPA and GEM vs Control). For CSI experiments, each time-point group was only compared to its time-matched sham (late-stage/acute). Being an exploratory study, P values are stated without multiplicity adjustments (27) and significant differences were defined as P < 0.05 in flow cytometry, IHC, and CIBERSORTx comparisons.
Results
Myc/p53DD Tumor Growth Is Unaffected by a Functional Adaptive Immune System
The majority of preclinical medulloblastoma mouse models utilize immune-deficient strains and the role of the immune system in medulloblastoma growth is poorly defined. To address this, we took advantage of a murine model of Group 3 medulloblastoma that engrafts in C57Bl/6J mice following intracranial implantation and compared tumor growth in wildtype C57Bl/6J mice and C57Bl/6J mice deficient in Rag1. Tumor-free survival of control mice (sham/isoflurane or control/saline) was not different between WT and Rag1KO animals, indicating that growth of this model of Group 3 medulloblastoma is not impacted by the presence or absence of mature T and B cells (Figure 1). To determine the role of the adaptive immune system in response to conventional first-line therapies, medulloblastoma-bearing mice of either strain were treated with CSI or two DNA-damaging chemotherapies used as part of clinical care: CPA or GEM (28) (NCT01878617) (Figure 1A). Compared to control groups, CSI prolonged median survival similarly in WT mice (21 compared to 15 days; P<0.0001) and Rag1KO mice (22.5 compared to 17.5 days; P=0.03). Likewise, response of Myc/p53DD tumors to chemotherapy was similar in WT and Rag1KO mice. CPA prolonged median survival to 34 days in both WT mice (P<0.001) and Rag1KO mice (P<0.0001); while GEM prolonged median survival from 16 days to 34 days in WT mice (P<0.0001) and from 15 to 35 days in Rag1KO mice (P<0.0001). These results indicate that treatment-mediated tumor control is independent of T and B cells in this model of medulloblastoma (Figures 1B–D).
Group 3 Medulloblastoma Growth Stimulates Immune Cell Influx Into the Brain
The finding that the adaptive immune system did not appear to modulate response to therapy was surprising given previous reports of increased CD8+ T cells in murine Group 3 medulloblastoma (29). Furthermore, it is unknown what impact conventional medulloblastoma treatments have on immune cells within the brain. To understand whether these treatments were altering the immune populations in the whole brain, mice harboring Myc/p53DD tumors were administered treatment (or control) as described above, and the immune cells present in brain tissue were assessed by flow cytometry when mice required euthanasia due to tumor-related morbidity, using the gating strategy defined in Figure 2.
In the absence of treatment, we observed that medulloblastoma growth induced an overall influx of immune cells into the brain (Figure 3). Brain-resident microglia in adult mice express lower levels of CD45 compared to bone-marrow derived immune cells, thus can be distinguished using flow cytometry (30, 31). The addition of calibration beads enabled us to analyze absolute cell numbers in the cell suspensions of the entire brain and we observed a significant increase in immune cell numbers (CD45+), both CD45high and microglia (CD45int CD11b+) in the brains of tumor-bearing WT mice compared to healthy age-matched brains. Moreover, we observed increased counts of activated microglia (CD45int CD11b+ MHC IIhigh) (32), classical dendritic cells (cDCs) (CD45high CD11c+ MHC II+, CD11b+), NK cells (CD45high NK1.1+), CD4+ T cells (CD45high CD3+ CD4+), and CD8+ T cells (CD45high CD3+ CD8+), (Figure 3). CD8+ cDCs accounted for a very small proportion of the immune cells, and their counts are not shown. No significant changes were detected in neutrophil (CD45high Ly6G+), B cell (CD45high CD19+ B220+), monocyte (CD45high CD11b+ F4/80+ FSClow) or macrophage (CD45high CD11b+ F4/80+ FSChigh) numbers between normal brains or brains harboring Myc/p53DD medulloblastomas.
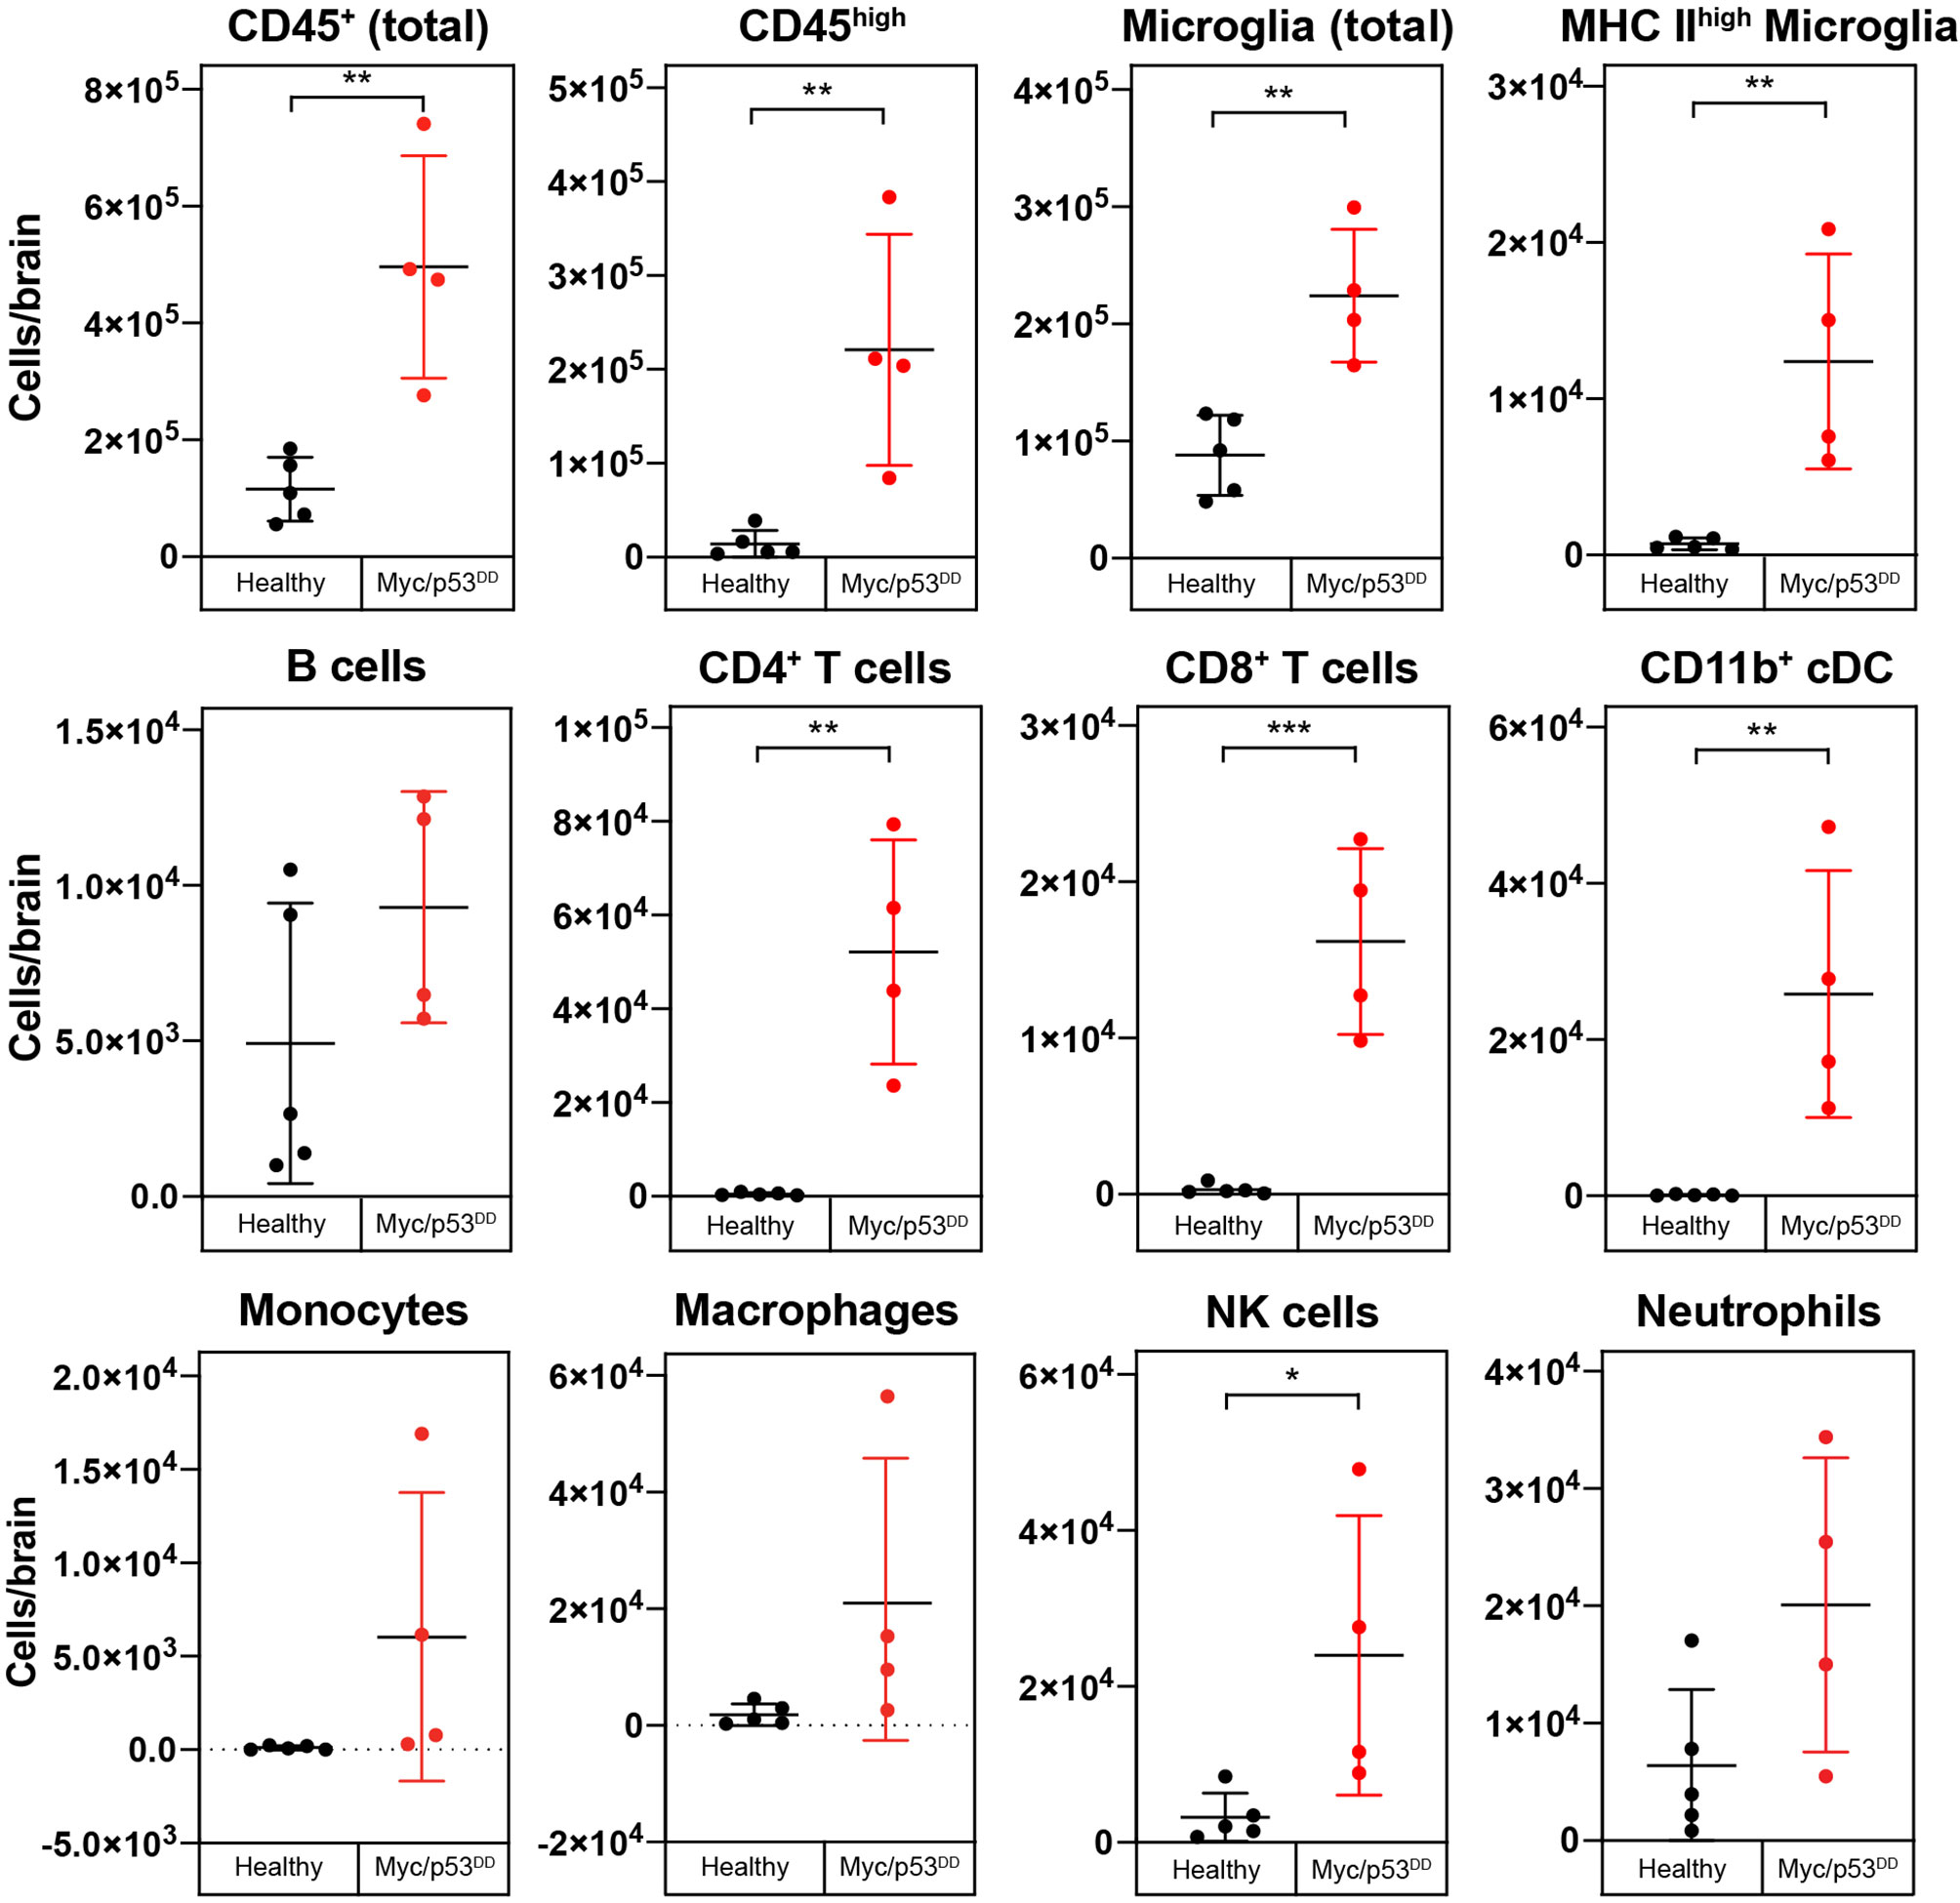
Figure 3 Growth of Myc/p53DD medulloblastoma increases the numbers of infiltrating and resident immune cells in the brain. The immune cell populations from healthy brains of C57Bl/6J WT mice (black circles, n=5) were determined using flow cytometry and compared with the brains of WT mice bearing Myc/p53DD tumors (red circles, n=4). Beads were used and the entire sample was analyzed to determine the total number of the indicated cells in each sample. Tumor-containing brains had significantly higher overall counts of immune cells (CD45+), both infiltrating (CD45high) and resident (microglia) compared to healthy brain. Moreover, an increase in activated microglia (MHC IIhigh), CD4+ T cells, CD8+ T cells, NK cells, and CD11b+ cDCs was observed in Myc/p53DD tumor bearing brains. No significant change in neutrophils, B cells, monocytes or macrophages was observed. Horizontal lines indicate the mean and error bars indicate SD. Comparisons shown to be statistically significant by t test are shown (*P < 0.05; **P < 0.01; ***P < 0.001).
To further demonstrate the changes in immune cell populations caused by medulloblastoma growth in WT mouse brain we compared the changes in immune cell populations relative to each other by quantifying differences as a percentage of all CD45+ cells. As a proportion of all CD45+ immune cells in the brain, significant increases in cDCs, CD4+ T cells, CD8+ T cells, and activated microglia were observed in tumor-bearing brains compared to healthy brains. As a consequence of this influx, the proportion of microglia relative to all immune cells was decreased in tumor-bearing brains compared to healthy brain (Supplementary Figure 3), although as described above, microglial numbers were increased overall.
In Rag1KO mice, growth of Myc/p53DD medulloblastoma also induced an increase in the absolute numbers of microglia in the brain as well as an influx of bone marrow-derived immune cells in the absence of treatment. In addition, we observed a significant increase in CD11b+ cDCs, NK cells, neutrophils, and monocytes (Supplementary Figure 4), reiterating the finding that even in mice lacking an adaptive immune system, medulloblastoma growth induces influx of bone marrow-derived immune cells to the brain. As observed in WT mice, Myc/p53DD tumor growth significantly elevated the number of activated microglia in Rag1KO brains.
CSI Transiently Depletes Bone Marrow-Derived Immune Populations in the Brain
Given this understanding of how the immune microenvironment of brain is altered with medulloblastoma growth, we next characterized the effects of clinical treatments on the immunology of medulloblastoma, starting with CSI. We analyzed brains at two time points following CSI – 24 hours after the final dose of radiation (acute), and at high tumor burden when mice required euthanasia (late-stage) – to determine transient and long-term impacts. In WT mice, CSI resulted in a significant, but transient, reduction in infiltrating bone marrow derived immune cells (CD45high). The proportion of CD4+ T cells, CD8+ T cells, B cells, and CD11b+ cDCs in the brain were all observed to be significantly reduced 24 hours following delivery of the last CSI fraction (Figure 4, squares). In consequence, the proportion of microglia as a percentage of the total immune milieu was significantly higher in CSI treated mice compared to sham treated mice at this time point (Figure 4, squares). Proportions of monocytes and macrophages were unchanged with treatment (Supplementary Figure 5). In contrast, when we examined acute CSI-induced changes in the brains of Rag1KO mice with Myc/p53DD medulloblastoma, only a significant reduction of NK cells was observed 24 hours following CSI (Supplementary Figure 6, squares). WT mouse brains were also assessed upon the development of tumor-related morbidity, which occurred 1-2 weeks following the cessation of CSI. No differences in immune cell populations were detected in CSI treated mice compared to time-matched controls at this late stage (Figure 4, circles), indicating that immune population changes induced by CSI in the brain were temporary. These findings contrast recent reports of irradiation-mediated enhanced immune cell infiltration in a model of SHH medulloblastoma (33).
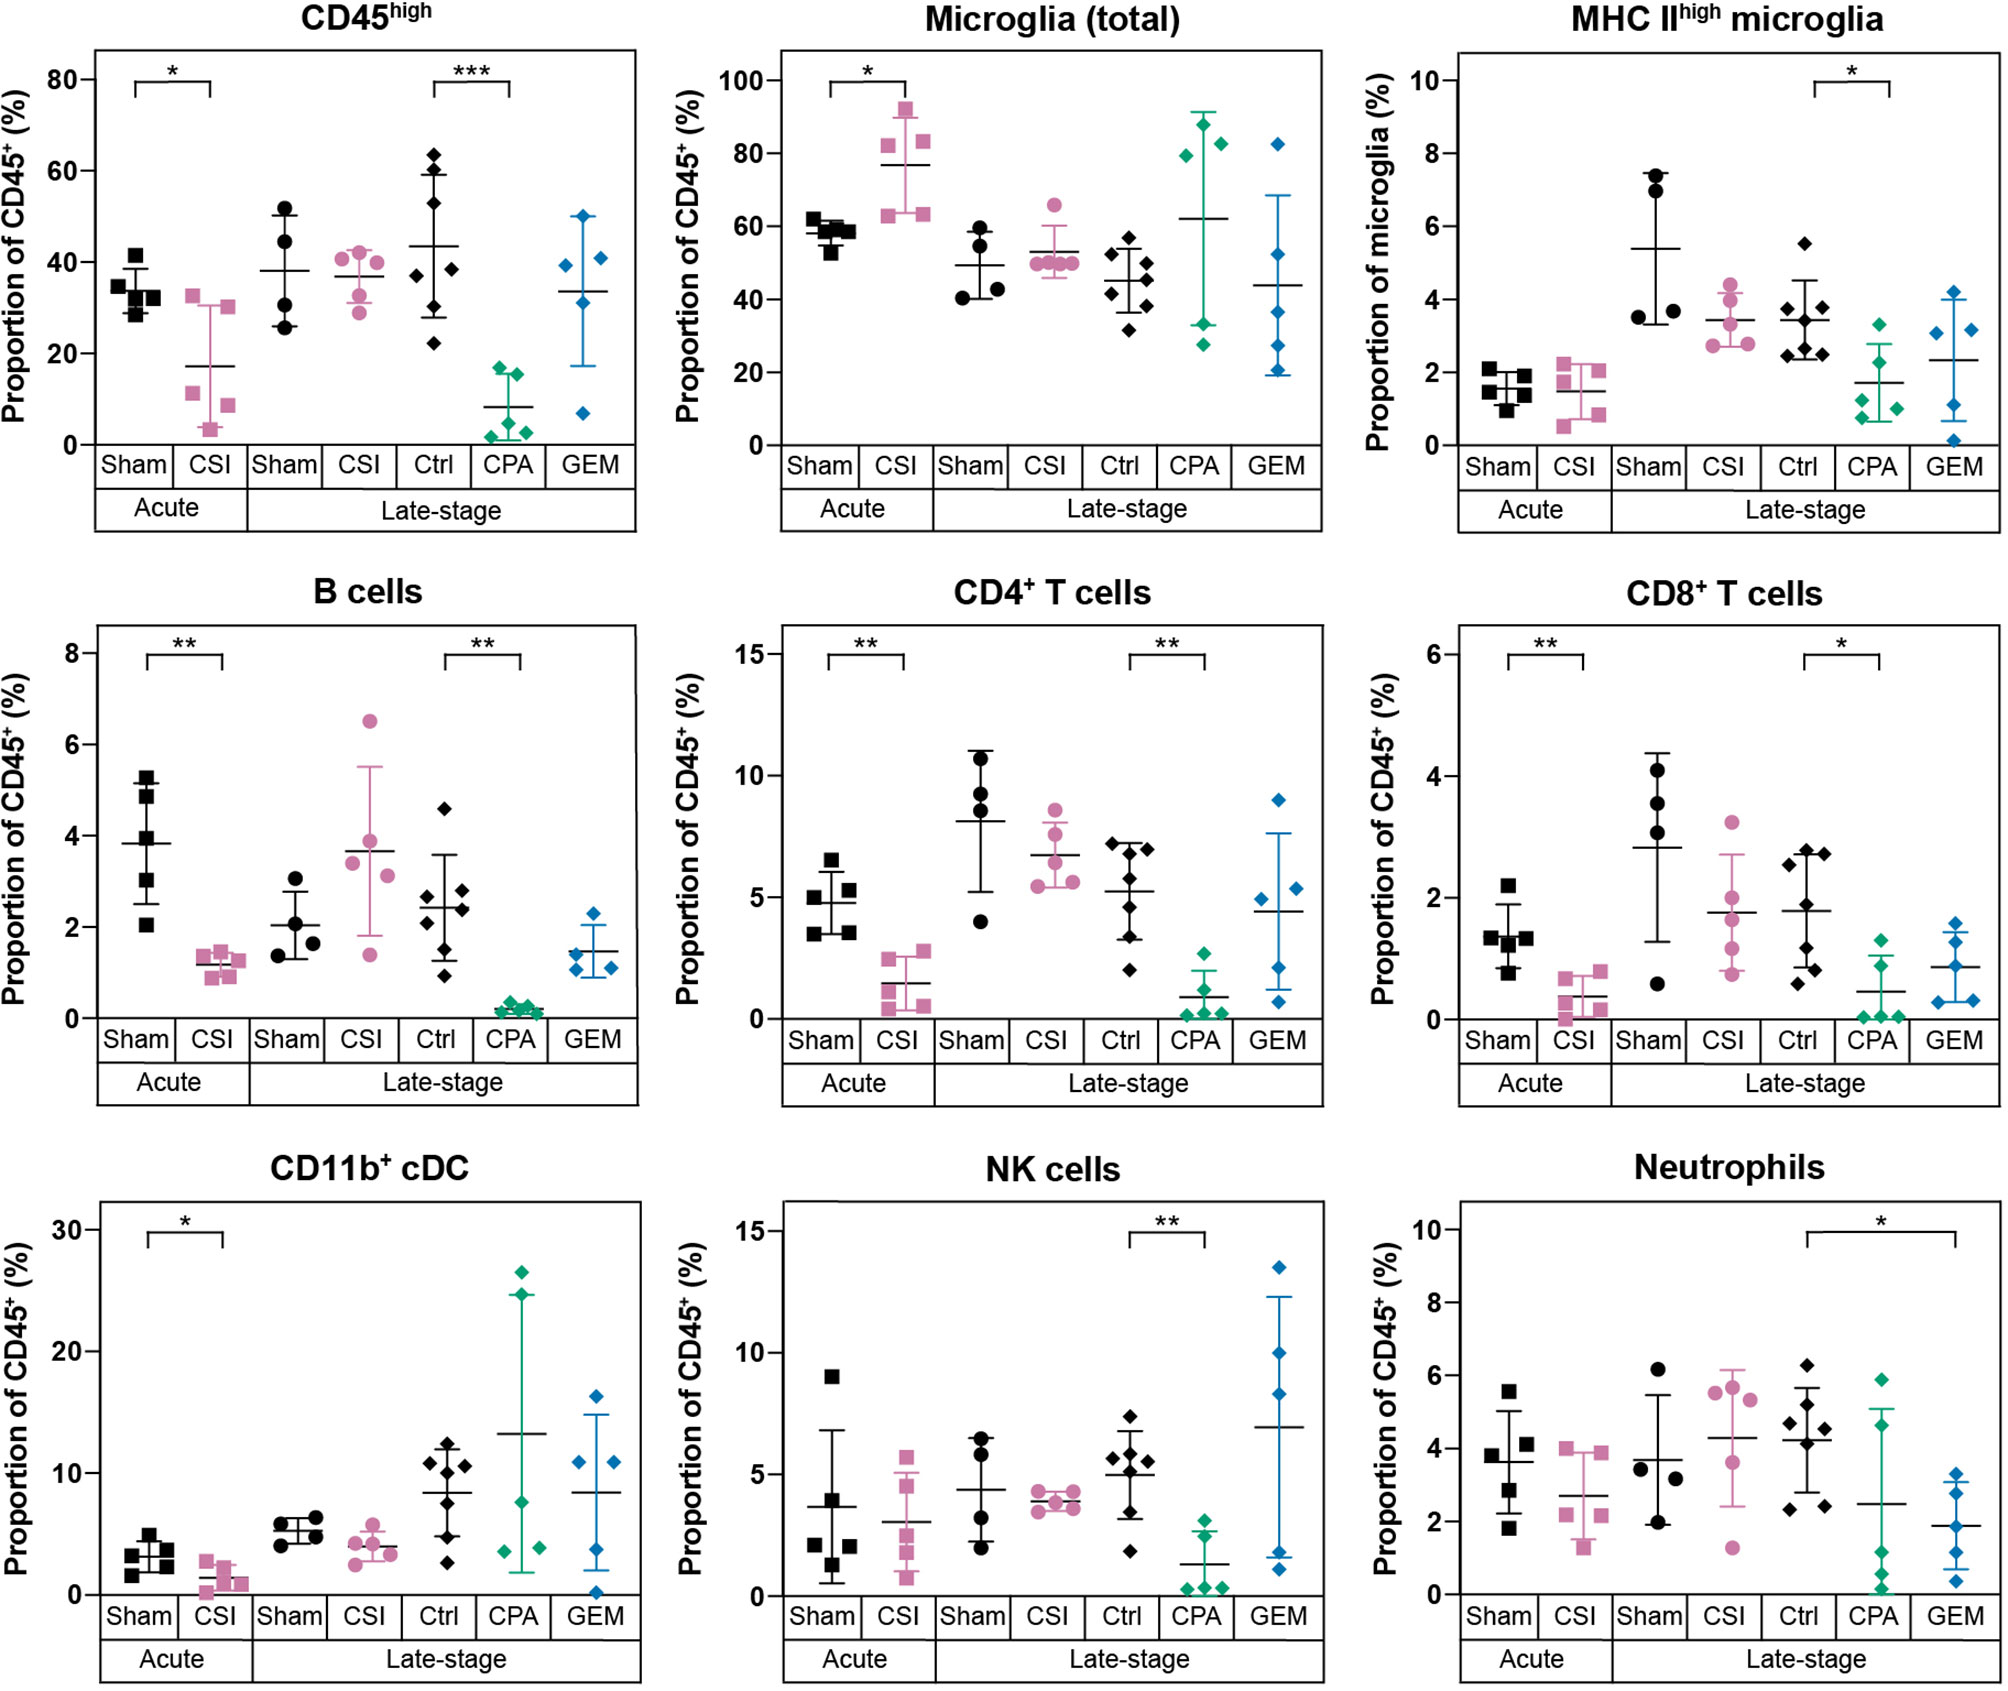
Figure 4 Radiotherapy and chemotherapy alter the immune microenvironment in the brains of C57Bl/6J WT mice with Myc/p53DD medulloblastoma. Immune cell populations (shown as a percentage of all CD45+ cells) in WT brains harboring medulloblastoma following a range of different treatments are shown. From left to right, mice with Myc/p53DD medulloblastoma were treated with either sham (black squares, n=5) or CSI (pink squares, n=5) and harvested 24 hours after the tenth dose (labeled “Acute”), sham (black circles, n=4) or CSI (pink circles, n=5) and harvested upon the development of tumor-related morbidity (labeled “Late stage”), or after treatment with saline (“Ctrl”, black diamonds, n=7), CPA (green diamonds, n=5), or GEM (blue diamonds, n=5) and harvested upon the development of tumor-related morbidity (also labeled “Late stage”). Fractionated CSI resulted in a temporary depletion of infiltrating CD45high immune cells. Specifically, B cells, CD4+ T cells, CD8+ T cells, and CD11b+ cDCs were decreased (pink squares) and in consequence a proportional increase of microglia was observed, whereas this was not observed at a later time point (pink circles). CPA reduced the abundance of B cells, CD4+ T cells, CD8+ T cells, and NK cells, while GEM only significantly depleted neutrophils. Horizontal lines indicate the mean and error bars indicate SD. Each treatment group was compared to the appropriate treatment and time-point matched control by t test, with statistically significant differences indicated (*P < 0.05; **P < 0.01; ***P < 0.001).
CPA Depletes Infiltrating CD45high Immune Cells While GEM has Minimal Impacts on the Immune Microenvironment
Chemotherapeutics, including first-line medulloblastoma drugs CPA and GEM, can achieve an anti-tumor response directly via DNA damaging activity, or indirectly via induction of an immune response through immunogenic cell death, stimulating immune effectors, or inhibiting immune suppressors [reviewed in (34)]. Thus, we sought to characterize the effects of these clinically used chemotherapies on the immune cells within medulloblastoma bearing brains. Brains were analyzed when tumor burden was high (“Late-stage”), which was within 3-4 days of the last chemotherapy dose due to the continual dosing protocol. WT mice treated with CPA had significantly lower proportions of infiltrating immune cells in the brain compared to controls. Proportions of CD4+ T cells, CD8+ T cells, B cells, NK cells and activated microglia were all significantly reduced in CPA treated mice (Figure 4, green diamonds). It is known that CPA can cause leukopenia [reviewed in (35)]. Consistent with this, significant decreases in multiple immune cell populations were also observed in the spleens of mice treated with CPA (Supplementary Figure 1). In contrast, GEM treatment had minimal effects on the immunology of WT mouse brain, resulting only in a proportional reduction of neutrophils (Figure 4, blue diamonds).
Surprisingly, chemotherapy-induced immunodepletion was not observed in the brains of Rag1KO mice. Instead, we observed a significant increase in CD45high immune cells in Rag1KO mice treated with either CPA or GEM (Supplementary Figure 6). The increase of CD45high cells was higher in CPA treated mice, and we observed a concomitant decrease in the proportion of microglia in CPA treated Rag1KO brains.
Medulloblastoma-Infiltrating Myeloid Cells Express Iba1 but Not the Microglial Marker Tmem119
Not surprisingly, our results show that microglia dominate the brain/medulloblastoma immune microenvironment; however, our flow cytometry data did not indicate the spatial distribution of these cells or define if they were interacting with medulloblastoma cells, or instead if they were retained in normal brain. To determine intratumoral distribution of resident (CD45int) and infiltrating (CD45high) immune cells, we dissected out Myc/p53DD tumors from WT mice and assessed proportions of intratumor immune cells with flow cytometry. We found that immune cells account for only 1-2% of the cells within these tumors, and that a majority (76.9 ± 3.88%) of the immune cells within the tumor were CD45high (Figure 5A). However, it has been shown that microglia may up-regulate CD45 under pathological conditions; therefore, our approach of delineating microglia from tumor-infiltrating macrophages on the basis of intermediate versus high CD45 expression may be insufficient (36, 37). To characterize and further delineate the location of resident microglia and infiltrating peripheral myeloid cells in the brain and within Myc/p53DD medulloblastomas, we performed IHC for two myeloid cell markers, Iba1 and Tmem119. Cells staining positively for Iba1, which is a marker of both bone marrow derived macrophages and microglia (38), were observed throughout the brain parenchyma and tumors. The morphology of cells stained with Iba1 varied from ramified in the normal brain, which typifies the resting state of microglia, to a more ameboid state, which typifies the active state, for cells located at the tumor periphery and within medulloblastomas (Figures 5B, C). Cells staining positively for the marker Tmem119, reported to be a specific marker of microglia (39), were observed throughout the normal brain displaying ramified morphology. Tmem119 also stained cells around the tumor edge and these cells displayed more ameboid morphology. However, IHC staining for Tmem119 was completely absent within the tumors suggesting these cells were not microglia (Figures 5B, C), although this is inconsistent with our flow cytometry findings which indicated that at least 23% of intratumoral immune cells should be microglia based on their lower expression of CD45 (CD45int, Figure 5A). Together, our findings suggest that either bone-marrow derived immune cells comprise the majority of the intratumoral immune cells and that microglia do not penetrate the tumor, or, given reports of microglia upregulating CD45 in pathological conditions (36, 37), that microglia downregulate Tmem119 and upregulate CD45 in response to medulloblastoma.
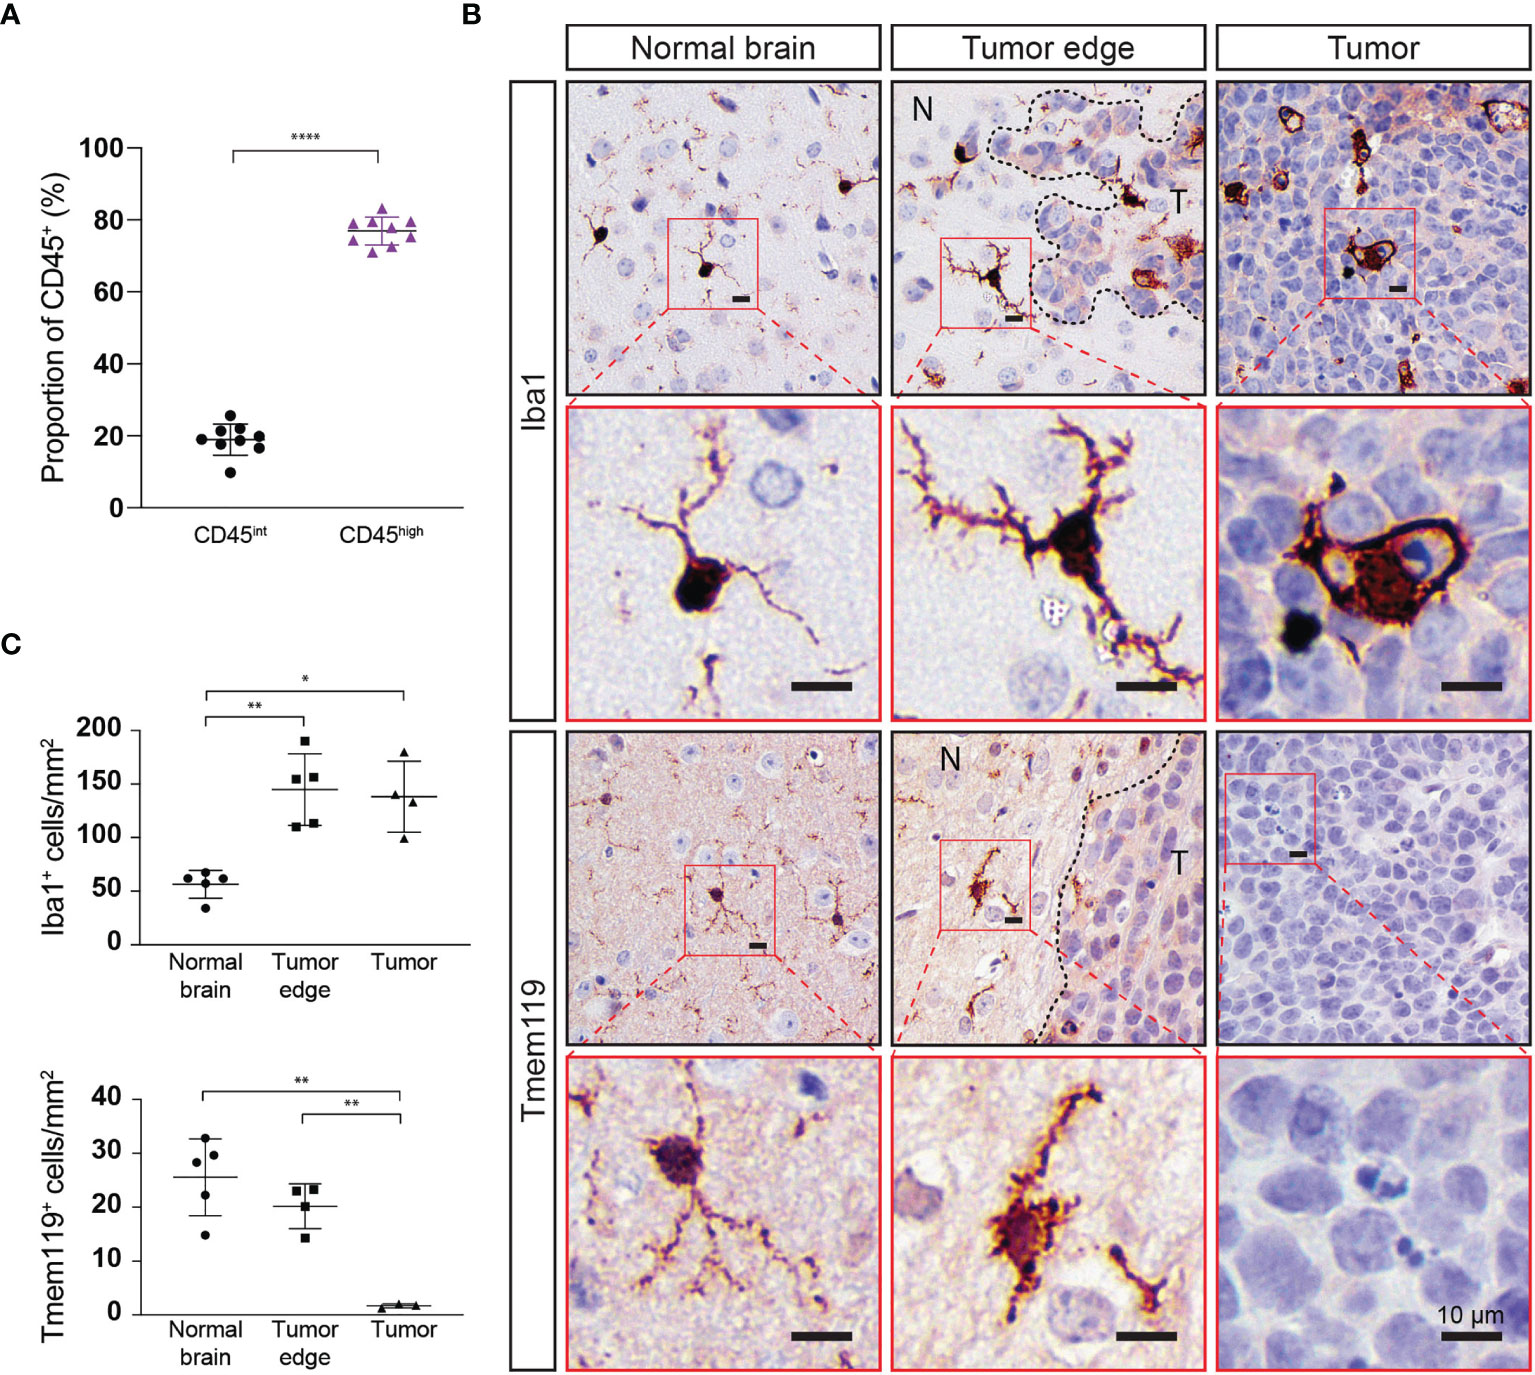
Figure 5 Immune cell populations within Myc/p53DD tumors in WT mouse brain highly express CD45 and do not express Tmem119. (A) Myc/p53DD medulloblastomas (n=8) were dissected away from normal C57Bl6/J WT brain and cells were analyzed by flow cytometry for CD45int (black circles) or CD45high immune cells (purple triangles). Horizontal lines indicate the mean and error bars indicate SD. Comparison by paired t test is shown (****P < 0.0001) demonstrating that CD45high immune cells account for the majority of intratumoral immune cells within Myc/p53DD tumors. (B) WT mouse brain implanted with Myc/p53DD medulloblastoma were examined using IHC for Iba1 and Tmem119. Representative low (black border) and high (red border) magnification images of Iba1 (top) or Tmem119 (bottom) expressing cells demonstrate a resting or ramified appearance in the normal brain (left), but have an activated or ameboid appearance around the edge of medulloblastomas (middle, N indicates normal brain and T indicates tumor), characterized by an increase and thickening of membrane projections. Within tumors (right), Iba1+ cells appear phagocytic, while Tmem119 staining is absent. Nuclei have been counterstained with hematoxylin and the scale bar on each image indicates 10 µm. (C) Quantitation of Iba1 or Tmem119 expressing cells from the brain regions indicated. Each symbol represents an individual mouse, horizontal lines indicate the mean and error bars indicate SD. Each area was compared using t test, with statistically significant differences indicated (*P < 0.05; **P < 0.01).
Immunological Signatures in Medulloblastoma Are Poorly Interpretable Using Bulk RNA Sequencing
To understand what was driving the immunological changes we observed following the administration of first line medulloblastoma treatments, and due to the inability to clearly delineate microglia from macrophages or monocytes through flow cytometry or IHC, we employed bulk RNA sequencing on medulloblastomas following control, sham, CSI, CPA, or GEM treatment. RNA sequencing was carried out on late-stage tumors, as tumors were too small to be isolated at earlier stages. As such, CSI treated samples were harvested 1-2 weeks after treatment cessation, while chemotherapy-treated tumors were harvested within 48-72 hours of drug administration. For scientific rigor, CSI treated mice were compared to sham controls, while chemotherapy-treated mice were compared to saline controls. Principal component analysis plots were used to visualize and identify whether samples clustered by treatment across both mouse strains (Figure 6A). Samples treated with CSI or sham did not cluster according to treatment or genetic background. For chemotherapy treated mice, Rag1KO samples clustered by treatment (Ctrl, CPA, GEM), whilst in WT mice, GEM clustered separately to CPA and Ctrl samples, which overlapped.
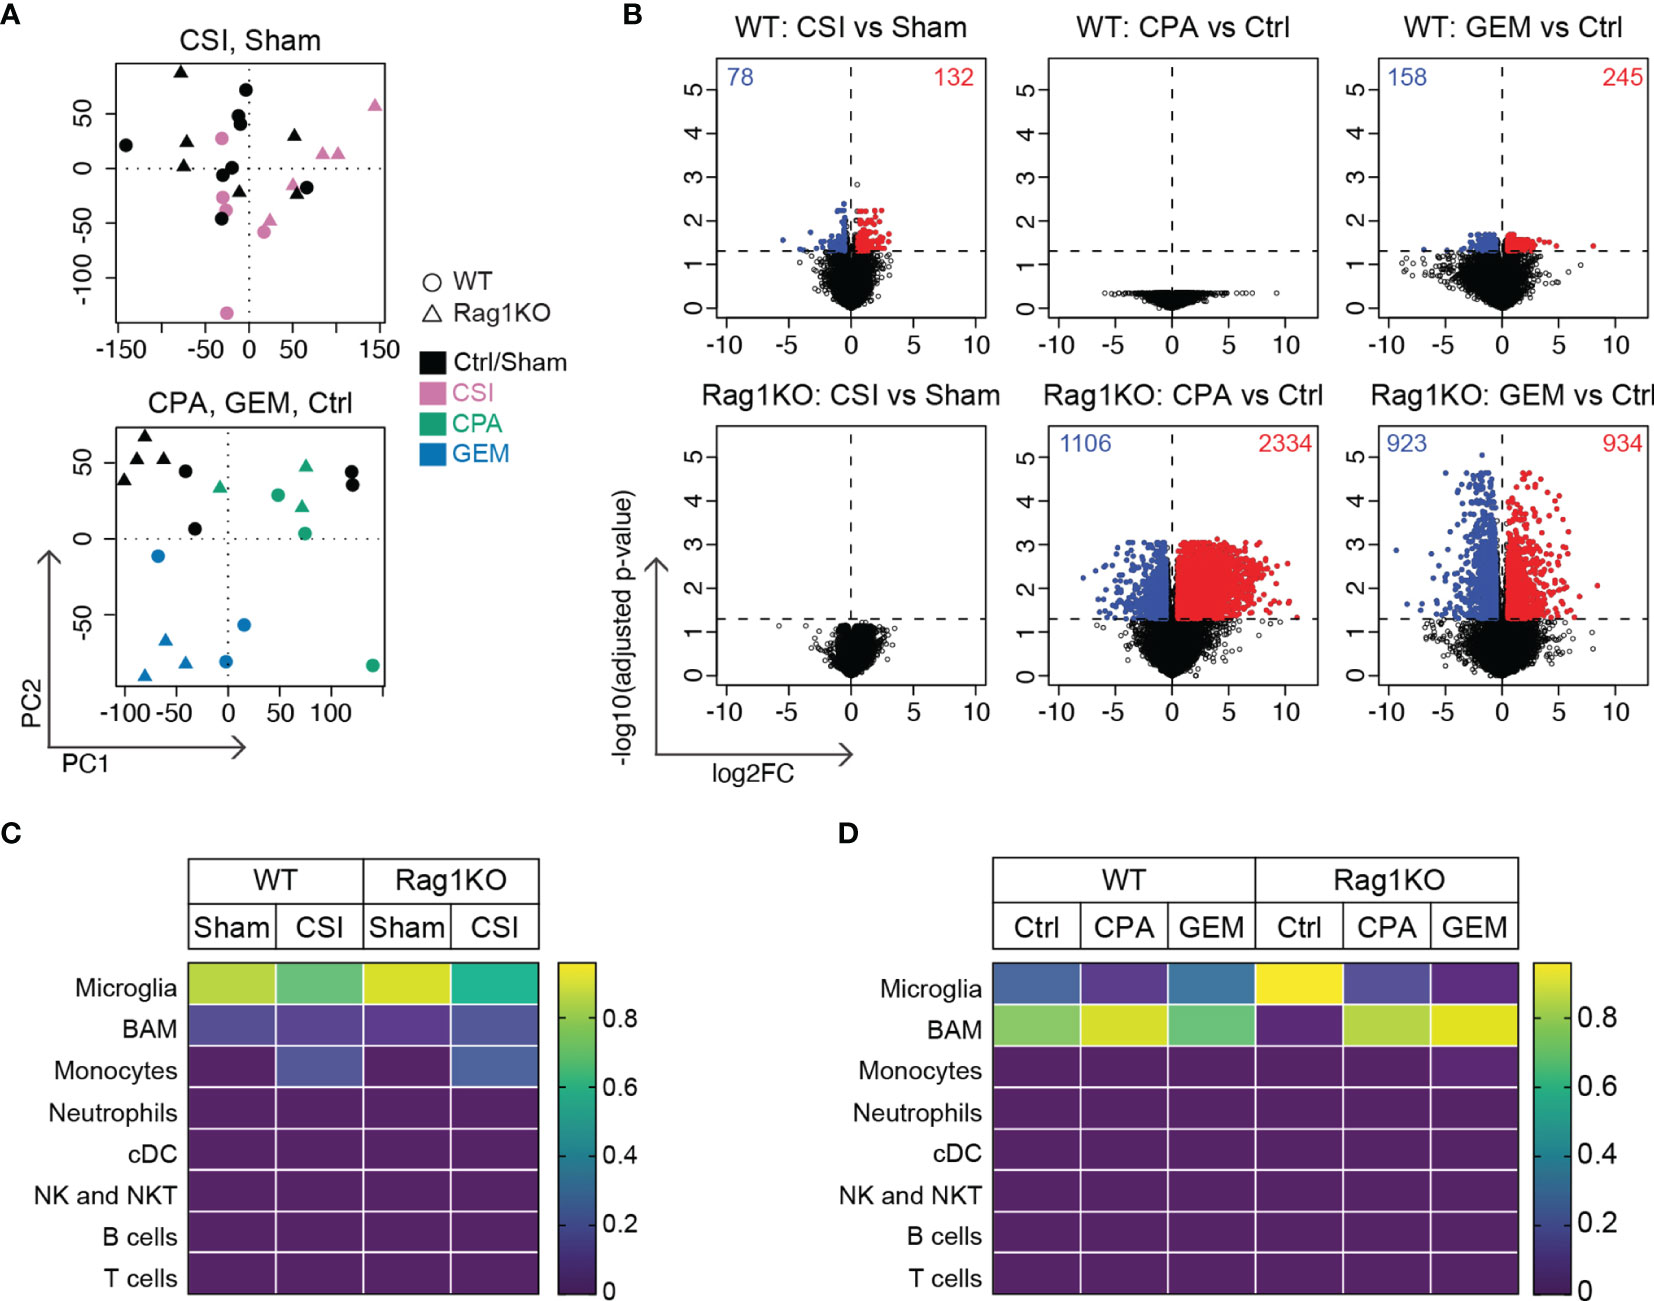
Figure 6 Radiotherapy and chemotherapy induce distinctly different gene expression changes in Group 3 medulloblastoma in immune-competent versus immune-deficient mice. RNA sequencing was performed on Myc/p53DD medulloblastomas from either C57Bl/6J WT mice (circles) or C57Bl/6J Rag1KO mice (triangles) that were harvested upon the development of tumor-related morbidity following treatment with sham, CSI, saline, CPA, or GEM. (A) Principal component analysis plots showing sham treated tumors (black) compared with CSI treated tumors (pink, upper panel), or saline treated tumors (Ctrl, black) compared with CPA (green) or GEM (blue) treated tumors (lower panel). (B) Volcano plots showing DEGs identified using EdgeR in response to CSI, CPA, and GEM treatment in tumors from WT or Rag1KO mice compared to their respective controls (red = upregulated, blue = downregulated) for the six comparisons indicated. The number of significantly differentially expressed genes is shown in each plot. (C) Immune cell fractions in WT and (D) Rag1KO tumor tissue were estimated using CIBERSORTx. Color scale indicates the predicted fraction of the indicated immune cells deconvoluted from bulk tumor transcriptome data. CSI did not significantly alter predicted immune fractions in either strain, nor did chemotherapy in WT tumors. Despite non-significant deconvolution, a reduction in microglial signatures was observed in Rag1KO mice following treatment with either CPA (P=2.0x10⁻⁴) or GEM (P=2.0x10⁻⁵) compared to control, with an increase in transcripts associated with border associated macrophages (BAMs) (P=0.04 and P=1.8x10⁻⁵ respectively). Number of mice in each group were: WT/Sham = 8, WT/CSI = 5, Rag1KO/Sham = 6, Rag1KO/CSI = 5, WT/Ctrl = 4, WT/CPA = 3, WT/GEM = 3, Rag1KO/Ctrl = 4, Rag1KO/CPA = 3, Rag1KO/GEM = 3.
Through differential gene expression analysis, we identified 210 differentially expressed genes (DEGs) in WT CSI treated mice compared to sham (132 upregulated genes, 78 downregulated genes), while no significant changes in gene expression were observed in CSI treated Rag1KO samples compared to sham (Figure 6B, left). In WT mice, there were no DEGs in response to CPA treatment, whilst in Rag1KO CPA treated mice there were 3440 DEGs compared to Ctrl (2334 up, 1106 down). GEM treatment in WT mice induced 403 DEGs (245 up, 158 down) and 1857 DEGs in Rag1KO (934 up, 923 down) compared to Ctrl (Figure 6B).
We applied CIBERSORTx to determine the abundance of immune cell types within the bulk sequenced data and to clarify if these were altered following treatment. Immune signatures were very low, and only microglia, border associated macrophages (BAMs), and monocyte signatures were detected (Figures 6C, D), although these estimates were non-significant (P>0.05). CSI did not appear to significantly alter immune cell composition (Figure 6C). Despite the low signature values, when the computed cell fractions were compared from Rag1KO mice treated with CPA or GEM, microglia were decreased compared to control mice (P=2x10⁻⁴ and P=2x10⁻⁵, respectively), consistent with our flow cytometry findings (Supplementary Figure 6), and BAMs were significantly elevated (P=0.04 and P=1.8x10⁻⁵, respectively) (Figure 6D); no significant differences were observed in WT mice. Ultimately, immune cell composition could not be accurately quantified by deconvoluting our bulk RNA sequencing data likely due to the low abundance of immune cells relative to tumor cells in Myc/p53DD tumors.
Pathway analysis also showed very few differentially expressed genes were associated with the immune system, owing to most genes being from tumor cells rather than from immune cells. Activated pathways in medulloblastomas in WT mice treated with CSI were associated with muscle contraction (P=3.70x10⁻⁵) and myogenesis (P=0.0143), whilst inhibited pathways were related to the neuronal system/ion channels (P=2.32x10⁻⁴). While there were no DEGs identified in CPA-treated medulloblastomas from WT mice, activated pathways in CPA-treated medulloblastomas from Rag1KO mice related to the neuronal system/ion channels (e.g. voltage ion channels, GABA receptors; P=1.94x10-46), signaling by GPCRs (P=7.26x10⁻⁷), MAPK signaling pathway (P=1.62x10⁻⁵), axon guidance (P=4.01x10⁻⁵), and hemostasis (P=3.6x10⁻⁴). Downregulated pathways were associated with ribosomal translation/gene expression (P=5.12x10⁻¹³), collagen biosynthesis/degradation & extracellular matrix (P<2.20x10⁻⁸) and cell cycle/proliferation (P=1.73x10⁻⁷). In response to GEM treatment, common activated pathways in both WT and Rag1KO mice were associated with metabolism (P<7.76x10⁻⁵), whilst ribosomal translation was unique to WT mice, and Hedgehog (P=0.0242), PPAR (P=0.0277) and interleukin signaling pathways (P=0.0281) were only activated in Rag1KO. Common downregulated pathways were associated with hemostasis (P<0.0229) and axon guidance (P<2.82x10⁻⁴); unique pathways in WT were linoleic acid metabolic (P=3.02x10⁻⁴) and p53 signaling (p=0.0449); inhibited pathways in Rag1KO mice only were developmental biology (P=1.70x10⁻⁵), MAPK signaling (P=0.00499), neuronal system (P=0.0277), cell cycle/proliferation (P=0.0262) and WNT signaling (P=0.0439).
Upstream regulator analysis was performed to identify putative drivers of the differentially expressed genes (Supplementary Figure 7). Overall, as expected given the above findings, the data showed limited immune system drivers and an array of activated chemical signatures, particularly in chemotherapy treated Rag1KO mice. In WT mice, the CSI response was driven by growth factor signaling (e.g. EGF, NRG1, ERBB3) and pro-inflammatory regulators (STAT3, PTGS2). In WT mice, GEM responses are driven by metabolic regulators (primarily lipid metabolism), while in Rag1KO mice, CPA and GEM responses are driven by chemical drivers, and cancer associated drivers were inhibited (MYC, SOX4, MYB).
Discussion
Medulloblastoma is one of the most prevalent pediatric cancers. While 5-year survival rates are approximately 70%, particular genetic features are associated with worse prognosis and current clinical approaches require innovative rethinking to identify ways to improve outcomes for those patients. Immunotherapy has recently become a major focus of novel therapy development and there are multiple clinical trials that aim to increase immune cell recognition of medulloblastoma, including oncolytic viral therapy, cancer vaccines and immune checkpoint blockade [reviewed in (40)]. To develop future immunotherapy clinical trials for medulloblastoma that have a strong chance of improved efficacy with reduced adverse effects, a deeper understanding of the interactions between medulloblastoma and either brain resident immune cells or infiltrating immune cells is crucial.
While patient derived xenograft models provide insight into the genetic and molecular basis of medulloblastoma and are valuable in the investigation of molecularly targeted therapies, they do not allow for the study of the whole immune system due to their use of immunocompromised hosts. Ideally, preclinical models for testing novel immunotherapies must recapitulate orthotopic medulloblastoma as well as the immune microenvironment. Immune competent preclinical models are therefore required to complement patient-derived xenograft models in a robust and comprehensive preclinical drug testing pipeline. Here we used an immune-competent murine model of Myc-amplified Group 3 medulloblastoma to investigate changes in intracerebral immune cell populations induced by tumor growth, and for the first time describe the impact of several first line medulloblastoma therapies on the immune microenvironment. Moreover, we repeated this work in Rag1 knockout mice lacking T and B cells to elucidate the role of adaptive immune cells in treatment response.
Our data show that adaptive immune cells account for a small proportion of immune cells in the brains of mice harboring Myc/p53DD tumors. T cells account for between 10-15% of the immune population in Myc/p53DD bearing brain, and B cells account for between 2-6% of the immune populations. Using Rag1 deficient mice, we found that the adaptive immune system does not play a significant role in Myc/p53DD tumor engraftment or growth, nor in treatment-mediated tumor control. Furthermore, both CSI and CPA were found to significantly deplete T cells in the brain. This, combined with the fact that lymphocytes are rare in human Group 3 medulloblastoma (41) and medulloblastoma patients have demonstrated low to undetectable levels of PD-L1 and PD-1 (42–44), suggests that T cell targeted antibody therapies, such as anti-PD-1, are unlikely to succeed in combination with radiotherapy or chemotherapy in medulloblastoma.
On the other hand, microglia dominate the immune milieu of the tumor bearing brain, accounting for between 50-65% of all immune cells. Further, we show that following either radiotherapy or chemotherapy, microglia remain the most abundant immune cell in the brain and thus present as a favorable target for immunotherapy in Group 3 medulloblastoma in combination with frontline therapies. Indeed, recent preclinical data has excitingly shown that treatments targeting myeloid cell immune checkpoints, such as the CD47-SIRPα axis, are highly effective in mouse models of medulloblastoma and other childhood brain cancers (45). Furthermore, it has been suggested that radiotherapy may synergize with monoclonal antibody therapies, on the basis that radiation enhances the visibility of medulloblastoma to the immune system [reviewed in (40)]. Recently, it has been shown that a single 10 Gy dose of radiation can induce an increase in tumor associated macrophages in SHH medulloblastoma (33), however, in our study using a clinically-relevant fractionated CSI protocol did not result in an increase in absolute counts of microglia nor macrophage at either acute or late-stage time points, and no increase in Iba1+ staining was observed in late-stage tumors after CSI (Supplementary Figure 8). For laboratory-based experiments to accurately inform new clinical trials in medulloblastoma, future work should aim to characterize the immune response to fractionated versus unfractionated radiotherapy doses across different medulloblastoma subtypes to better understand the optimal preclinical radiotherapy methods to apply.
In contrast to the effects of fractionated CSI, we found that CPA treatment reduced the proportions of MHC II+ microglia in mouse brain, suggesting this chemotherapy suppresses microglial function. We also examined the effects of GEM on immune cell populations in medulloblastoma, as this drug is currently being investigated as a first-line chemotherapy in Group 3 and Group 4 medulloblastoma (NCT01878617). The only cell population in the brain observed to be affected by GEM were neutrophils which were decreased following treatment. This was unexpected, as in previous cancer studies, GEM selectively depleted myeloid cells and B cells, in both a tumor microenvironment and in lymphoid organs (46, 47), and we observed depletion of T and B cells in the spleen of GEM treated WT mice (Supplementary Figure 1). Importantly, exposure to GEM can also increase tumor antigenicity through upregulation of MHC-I (48), inhibition of tumor-associated macrophages, and improving antigen cross-presentation (49, 50) to aid in immune stimulation and tumor elimination. Our data did not indicate that GEM treatment had these same effects in medulloblastoma, although given these previous studies, additional experiments to better delineate the effects of GEM on medulloblastoma-associated macrophages would be valuable.
Limitations of this study include the techniques and cellular markers used to identify immune populations from brains of mice with medulloblastoma. Flow cytometry is unable to determine the spatial interactions of microglia and infiltrating macrophages within murine medulloblastoma, and importantly our data suggest that the marker Tmem119, often used to distinguish microglia from macrophages, may be an unreliable cellular marker in this context. Using IHC, we observed an abundance of Iba1+ cells throughout medulloblastomas and an absence of Tmem119+ cells, suggesting intratumoral Iba1+ cells were not microglia. However, the absence of intratumoral Tmem119 staining is not consistent with our findings that 23.1% of intratumoral immune cells were CD45int, and presumed microglia. Given previous reports have shown microglia can upregulate CD45 expression in pathological conditions (36, 37), we hypothesize that bone marrow-derived macrophages do not account for the entirety of tumor-infiltrative Iba1+ Tmem119- cells observed, and that microglia may downregulate Tmem119 as they enter medulloblastomas, suggesting a transition of these cells into a more macrophage-like state. While there are a number of methods that can clarify if these cells are activated microglia, such as MHC Class II, Sca-1 (51) or CD68 (52), these markers are also expressed on other myeloid cells, and would need to be assessed in combination with a microglia specific marker such as Sall1 (53).
Microglia and infiltrating macrophages are complex and dynamic in the context of cancer, and they cannot be easily delineated by simple markers. Indeed, recent single cell transcriptomics analysis of human samples revealed that an unexpectedly diverse spectrum of myeloid populations infiltrate medulloblastoma (41). Here, we set out to use transcriptomics to further characterize immune responses to treatment. However, we found that bulk RNA sequencing lacked sensitivity to probe the immunology of these tumors, largely due to the low abundance of intratumoral immune cells within this model of medulloblastoma. As a result, cell fractions were not significantly deconvoluted by CIBERSORTx and downstream comparisons of cell abundances should be carried out with caution. Our RNAseq data suggests that chemotherapy may alter the ratio of myeloid subsets (specifically microglia and BAMs) within the brain, but this requires additional experimental validation, particularly given the flow cytometry markers used here were not able to discriminate between these two cell types. Further examination using makers such as CD206, Siglec-H and CD38 that are expressed on BAMs and not microglia (51), as well as using histological techniques to define the locations of the chemotherapy-affected cells will be important to more accurately define the impacts of chemotherapy on the brain immune microenvironment especially given that the vasculature in the border regions would have different barrier properties compared to the blood-brain barrier of the parenchyma. Future work aimed at better understanding the immune cell dynamics within medulloblastomas may also consider first enriching for CD45+ cells prior to bulk RNA sequencing or employing single cell sequencing or single cell proteomics technologies to detect immune signatures in medulloblastoma tissue, though these methods are accompanied with the caveat of tissue processing induced artefacts [reviewed in (54)]. Our sequencing data was limited by small sample sizes in this exploratory study and, in the case of CSI-treated tumors, by the choice to sample later time points when tumors were larger, but possibly too late after treatment cessation to detect gene expression differences. Further, this study is limited by the intracranial implantation procedure disrupting the skull and meninges, which may mediate peripheral immune influx by promoting an inflammatory response and disrupting the blood brain barrier. Though we have found that the intracranial implantation procedure does not detectably change immune populations in the brain of non-tumor bearing animals (data not shown), genetically engineered spontaneous models of Group 3 medulloblastoma with an intact blood-brain barrier would improve the study of the tumor-immune microenvironment.
The study of the immune infiltrate within medulloblastoma is critical not only for the implementation of optimal radiotherapy and chemotherapy protocols, but very relevant to immunotherapy, a therapeutic modality with increasing use in oncology. Immunotherapies are not standard in the treatment of medulloblastoma, and clinical trials investigating the use of T-cell targeting immunotherapies have proven unsuccessful to date (40). This lack of success is likely a consequence of the immune microenvironment in pediatric brain tumors being very different from that of adult solid tumors in which immune-based therapies have proven successful. Overall, the most consistently abundant immune cell within this model of Group 3 medulloblastoma following radiotherapy or chemotherapy are myeloid cells, which we speculate are a mixture of both brain-resident and bone marrow-derived cells. Should myeloid cell-targeting therapies continue to be developed for medulloblastoma, future work should assess the impacts of radiotherapy and chemotherapy on microglial and macrophage activation and function, to dissect out mechanisms of treatment-induced changes and how this might impact the efficacy of immunotherapies. Building upon our study will be important to address this issue and will facilitate the rational selection of optimal immunotherapeutics for future medulloblastoma clinical trials.
Data Availability Statement
The data presented in the study are deposited in the European Genome-Phenome Archive, accession numbers EGAS00001005846 and EGAS00001005847.
Ethics Statement
All animal studies in this work were reviewed and approved by the Animal Ethics Committee of the Telethon Kids Institute.
Author Contributions
ZA, CG, MH, RE, and NG designed the experiments. ZA, CG, MA, AJ, MK, and RE performed experiments or analyzed data. ZA, CG, MA, AJ, MH, RW-R, NG, and RE were involved in data discussion, drafting, and editing the manuscript. All authors contributed to the article and approved the submitted version.
Funding
This research was funded by The Pirate Ship Foundation. RNA sequencing experiments were partially funded through the Australian Lions Children’s Cancer Research Fund and the Stan Perron Charitable Foundation. RE has support from a Cancer Council of Western Australia Research Fellowship and a Brainchild Fellowship from the Pirate Ship Foundation. NG is supported by the Stan Perron Chair of Paediatric Haematology and Oncology. ZA is supported by a Richard Walter Gibbon Medical Research Scholarship and an Australian Government Research Training Program Scholarship at the University of Western Australia. MA and CG were supported by an Australian Postgraduate Award from the Australian Government. AJ is supported by the Stan Perron Foundation, Australian Lions Children’s Cancer Research Foundation and Channel 7 Telethon Trust. RW-R is supported by funds from the National Cancer Institute (2R01 CA159859, P30 CA30199), the National Institute of Neurological Disorders and Stroke (R35 NS122339, R01 NS096368) and the V Foundation for Cancer Research (D2018-021).
Conflict of Interest
The authors declare that the research was conducted in the absence of any commercial or financial relationships that could be construed as a potential conflict of interest.
Publisher’s Note
All claims expressed in this article are solely those of the authors and do not necessarily represent those of their affiliated organizations, or those of the publisher, the editors and the reviewers. Any product that may be evaluated in this article, or claim that may be made by its manufacturer, is not guaranteed or endorsed by the publisher.
Acknowledgments
We thank Drs. Bree Foley and Jason Waithman for their invaluable advice and discussions in designing the flow cytometry panels, and for sharing Rag1-/- C57Bl/6J mice. We also thank Dr. Tanja Eisemann for her input and assistance in the editing of this manuscript. Library preparation and sequencing was conducted in the Genomics WA Laboratory in Perth, Australia. This facility is supported by BioPlatforms Australia, State Government Western Australia, Australian Cancer Research Foundation, Cancer Research Trust, Harry Perkins Institute of Medical Research, Telethon Kids Institute and the University of Western Australia. We gratefully acknowledge the Australian Cancer Research Foundation and the Centre for Advanced Cancer Genomics for making available Illumina Sequencers for the use of Genomics WA. We also acknowledge support from Bright Blue, the Police Commissioner’s Fund for Sick Kids for other equipment. We thank the Australian Federal Government Department of Health for funding to establish infrastructure used here that support the Zero Childhood Cancer personalized medicine program. Thank you to the Bioresources teams of Telethon Kids Institute for the care of our animals, and the Laboratory Management team, particularly Pradeep Kumar, for maintenance of the flow cytometry and histology facilities. We thank all members of the Telethon Kids Institute Brain Tumour Research team and Cancer Immunotherapy Unit for their advice, suggestions, and discussions during the course of this project.
Supplementary Material
The Supplementary Material for this article can be found online at: https://www.frontiersin.org/articles/10.3389/fimmu.2022.837013/full#supplementary-material
References
1. Northcott PA, Robinson GW, Kratz CP, Mabbott DJ, Pomeroy SL, Clifford SC, et al. Medulloblastoma. Nat Rev Dis Primers (2019) 5(1):11. doi: 10.1038/s41572-019-0063-6
2. Cavalli FMG, Remke M, Rampasek L, Peacock J, Shih DJH, Luu B, et al. Intertumoral Heterogeneity Within Medulloblastoma Subgroups. Cancer Cell (2017) 31(6):737–54.e6. doi: 10.1016/j.ccell.2017.05.005
3. Schwalbe EC, Lindsey JC, Nakjang S, Crosier S, Smith AJ, Hicks D, et al. Novel Molecular Subgroups for Clinical Classification and Outcome Prediction in Childhood Medulloblastoma: A Cohort Study. Lancet Oncol (2017) 18(7):958–71. doi: 10.1016/S1470-2045(17)30243-7
4. Leary SES, Olson JM. The Molecular Classification of Medulloblastoma. Curr Opin Pediatr (2012) 24(1):33–9. doi: 10.1097/MOP.0b013e32834ec106
5. Hill RM, Richardson S, Schwalbe EC, Hicks D, Lindsey JC, Crosier S, et al. Time, Pattern, and Outcome of Medulloblastoma Relapse and Their Association With Tumour Biology at Diagnosis and Therapy: A Multicentre Cohort Study. Lancet Child Adolesc Health (2020) 4(12):865–74. doi: 10.1016/S2352-4642(20)30246-7
6. Kool M, Korshunov A, Remke M, Jones DT, Schlanstein M, Northcott PA, et al. Molecular Subgroups of Medulloblastoma: An International Meta-Analysis of Transcriptome, Genetic Aberrations, and Clinical Data of WNT, SHH, Group 3, and Group 4 Medulloblastomas. Acta Neuropathol (2012) 123(4):473–84. doi: 10.1007/s00401-012-0958-8
7. Richardson S, Hill RM, Kui C, Lindsey JC, Grabovksa Y, Keeling C, et al. Emergence and Maintenance of Actionable Genetic Drivers at Medulloblastoma Relapse. Neuro Oncol (2022) 24(1):153–65. doi: 10.1093/neuonc/noab178
8. Koschmann C, Bloom K, Upadhyaya S, Geyer JR, Leary SES. Survival After Relapse of Medulloblastoma. J Pediatr Hematol/Oncol (2016) 38(4):269–73. doi: 10.1097/MPH.0000000000000547
9. Sabel M, Fleischhack G, Tippelt S, Gustafsson G, Doz F, Kortmann R, et al. Relapse Patterns and Outcome After Relapse in Standard Risk Medulloblastoma: A Report From the HIT-SIOP-PNET4 Study. J Neuro-Oncol (2016) 129(3):515–24. doi: 10.1007/s11060-016-2202-1
10. Pei Y, Moore CE, Wang J, Tewari AK, Eroshkin A, Cho YJ, et al. An Animal Model of MYC-Driven Medulloblastoma. Cancer Cell (2012) 21(2):155–67. doi: 10.1016/j.ccr.2011.12.021
11. Mombaerts P, Iacomini J, Johnson RS, Herrup K, Tonegawa S, Papaioannou VE. RAG-1-Deficient Mice Have No Mature B and T Lymphocytes. Cell (1992) 68(5):869–77. doi: 10.1016/0092-8674(92)90030-G
12. Endersby R, Zhu X, Hay N, Ellison DW, Baker SJ. Nonredundant Functions for Akt Isoforms in Astrocyte Growth and Gliomagenesis in an Orthotopic Transplantation Model. Cancer Res (2011) 71(12):4106–16. doi: 10.1158/0008-5472.CAN-10-3597
13. Feddersen TV, Rowshanfarzad P, Abel TN, Ebert MA. Commissioning and Performance Characteristics of a Pre-Clinical Image-Guided Radiotherapy System. Australas Phys Eng Sci Med (2019) 42(2):541–51. doi: 10.1007/s13246-019-00755-4
14. van Hoof SJ, Granton PV, Verhaegen F. Development and Validation of a Treatment Planning System for Small Animal Radiotherapy: Smart-Plan. Radiother Oncol (2013) 109(3):361–6. doi: 10.1016/j.radonc.2013.10.003
15. Smith SMC, Bianski BM, Orr BA, Harknett G, Onar-Thomas A, Gilbertson RJ, et al. Preclinical Modeling of Image-Guided Craniospinal Irradiation for Very-High-Risk Medulloblastoma. Int J Radiat Oncol Biol Phys (2019) 103(3):728–37. doi: 10.1016/j.ijrobp.2018.10.015
16. Martin M. Cutadapt Removes Adapter Sequences From High-Throughput Sequencing Reads. EMBnetjournal (2011) 17(1):10. doi: 10.14806/ej.17.1.200
17. Andrews S, FASTQC. A Quality Control Tool for High Throughput Sequence Data (2010). Available at: https://www.bioinformatics.babraham.ac.uk/projects/fastqc/.
18. Lassmann T, Hayashizaki Y, Daub CO. Samstat: Monitoring Biases in Next Generation Sequencing Data. Bioinformatics (2011) 27(1):130–1. doi: 10.1093/bioinformatics/btq614
19. Kim D, Langmead B, Salzberg SL. HISAT: A Fast Spliced Aligner With Low Memory Requirements. Nat Methods (2015) 12(4):357–60. doi: 10.1038/nmeth.3317
20. Lawrence M, Huber W, Pagès H, Aboyoun P, Carlson M, Gentleman R, et al. Software for Computing and Annotating Genomic Ranges. PloS Comput Biol (2013) 9(8):e1003118. doi: 10.1371/journal.pcbi.1003118
21. Risso D, Ngai J, Speed TP, Dudoit S. Normalization of RNA-Seq Data Using Factor Analysis of Control Genes or Samples. Nat Biotechnol (2014) 32(9):896–902. doi: 10.1038/nbt.2931
22. Newman AM, Steen CB, Liu CL, Gentles AJ, Chaudhuri AA, Scherer F, et al. Determining Cell Type Abundance and Expression From Bulk Tissues With Digital Cytometry. Nat Biotechnol (2019) 37(7):773–82. doi: 10.1038/s41587-019-0114-2
23. Van Hove H, Martens L, Scheyltjens I, De Vlaminck K, Pombo Antunes AR, De Prijck S, et al. A Single-Cell Atlas of Mouse Brain Macrophages Reveals Unique Transcriptional Identities Shaped by Ontogeny and Tissue Environment. Nat Neurosci (2019) 22(6):1021–35. doi: 10.1038/s41593-019-0393-4
24. Robinson MD, McCarthy DJ, Smyth GK. Edger: A Bioconductor Package for Differential Expression Analysis of Digital Gene Expression Data. Bioinformatics (2010) 26(1):139–40. doi: 10.1093/bioinformatics/btp616
25. Breuer K, Foroushani AK, Laird MR, Chen C, Sribnaia A, Lo R, et al. Innatedb: Systems Biology of Innate Immunity and Beyond–Recent Updates and Continuing Curation. Nucleic Acids Res (2013) 41(Database issue):D1228–D33. doi: 10.1093/nar/gks1147
26. Krämer A, Green J, Pollard J Jr., Tugendreich S. Causal Analysis Approaches in Ingenuity Pathway Analysis. Bioinformatics (2014) 30(4):523–30. doi: 10.1093/bioinformatics/btt703
27. Bender R, Lange S. Adjusting for Multiple Testing—When and How? J Clin Epidemiol (2001) 54(4):343–9. doi: 10.1016/S0895-4356(00)00314-0
28. Martin AM, Raabe E, Eberhart C, Cohen KJ. Management of Pediatric and Adult Patients With Medulloblastoma. Curr Treat Options Oncol (2014) 15(4):581–94. doi: 10.1007/s11864-014-0306-4
29. Pham CD, Flores C, Yang C, Pinheiro EM, Yearley JH, Sayour EJ, et al. Differential Immune Microenvironments and Response to Immune Checkpoint Blockade Among Molecular Subtypes of Murine Medulloblastoma. Clin Cancer Res (2016) 22(3):582–95. doi: 10.1158/1078-0432.CCR-15-0713
30. Sedgwick JD, Schwender S, Imrich H, Dorries R, Butcher GW, Ter Meulen V. Isolation and Direct Characterization of Resident Microglial Cells From the Normal and Inflamed Central Nervous System. Proc Natl Acad Sci (1991) 88(16):7438–42. doi: 10.1073/pnas.88.16.7438
31. O’Koren EG, Mathew R, Saban DR. Fate Mapping Reveals That Microglia and Recruited Monocyte-Derived Macrophages Are Definitively Distinguishable by Phenotype in the Retina. Sci Rep (2016) 6(1):20636. doi: 10.1038/srep20636
32. Wyss-Coray T, Mucke L. Inflammation in Neurodegenerative Disease–A Double-Edged Sword. Neuron (2002) 35(3):419–32. doi: 10.1016/S0896-6273(02)00794-8
33. Dang MT, Gonzalez MV, Gaonkar KS, Rathi KS, Young P, Arif S, et al. Macrophages in SHH Subgroup Medulloblastoma Display Dynamic Heterogeneity That Varies With Treatment Modality. Cell Rep (2021) 34(13):108917. doi: 10.1016/j.celrep.2021.108917
34. Galluzzi L, Buque A, Kepp O, Zitvogel L, Kroemer G. Immunological Effects of Conventional Chemotherapy and Targeted Anticancer Agents. Cancer Cell (2015) 28(6):690–714. doi: 10.1016/j.ccell.2015.10.012
35. Ahlmann M, Hempel G. The Effect of Cyclophosphamide on the Immune System: Implications for Clinical Cancer Therapy. Cancer Chemother Pharmacol (2016) 78(4):661–71. doi: 10.1007/s00280-016-3152-1
36. Honarpisheh P, Lee J, Banerjee A, Blasco-Conesa MP, Honarpisheh P, D’Aigle J, et al. Potential Caveats of Putative Microglia-Specific Markers for Assessment of Age-Related Cerebrovascular Neuroinflammation. J Neuroinflamm (2020) 17(1):366. doi: 10.1186/s12974-020-02019-5
37. Muller A, Brandenburg S, Turkowski K, Muller S, Vajkoczy P. Resident Microglia, and Not Peripheral Macrophages, Are the Main Source of Brain Tumor Mononuclear Cells. Int J Cancer (2015) 137(2):278–88. doi: 10.1002/ijc.29379
38. Sasaki Y, Ohsawa K, Kanazawa H, Kohsaka S, Imai Y. Iba1 Is an Actin-Cross-Linking Protein in Macrophages/Microglia. Biochem Biophys Res Commun (2001) 286(2):292–7. doi: 10.1006/bbrc.2001.5388
39. Bennett ML, Bennett FC, Liddelow SA, Ajami B, Zamanian JL, Fernhoff NB, et al. New Tools for Studying Microglia in the Mouse and Human CNS. Proc Natl Acad Sci USA (2016) 113(12):E1738–46. doi: 10.1073/pnas.1525528113
40. Kabir TF, Kunos CA, Villano JL, Chauhan A. Immunotherapy for Medulloblastoma: Current Perspectives. Immunotarg Ther (2020) 9:57–77. doi: 10.2147/ITT.S198162
41. Riemondy KA, Venkataraman S, Willard N, Nellan A, Sanford B, Griesinger AM, et al. Neoplastic and Immune Single Cell Transcriptomics Define Subgroup-Specific Intra-Tumoral Heterogeneity of Childhood Medulloblastoma. Neuro Oncol (2021) 24(2):273–86. doi: 10.1093/neuonc/noab135
42. Vermeulen JF, Van Hecke W, Adriaansen EJM, Jansen MK, Bouma RG, Villacorta Hidalgo J, et al. Prognostic Relevance of Tumor-Infiltrating Lymphocytes and Immune Checkpoints in Pediatric Medulloblastoma. Oncoimmunology (2018) 7(3):e1398877. doi: 10.1080/2162402X.2017.1398877
43. Hwang K, Koh EJ, Choi EJ, Kang TH, Han JH, Choe G, et al. PD-1/PD-L1 and Immune-Related Gene Expression Pattern in Pediatric Malignant Brain Tumors: Clinical Correlation With Survival Data in Korean Population. J Neurooncol (2018) 139(2):281–91. doi: 10.1007/s11060-018-2886-5
44. Martin AM, Nirschl CJ, Polanczyk MJ, Bell WR, Nirschl TR, Harris-Bookman S, et al. PD-L1 Expression in Medulloblastoma: An Evaluation by Subgroup. Oncotarget (2018) 9(27):19177–91. doi: 10.18632/oncotarget.24951
45. Gholamin S, Mitra SS, Feroze AH, Liu J, Kahn SA, Zhang M, et al. Disrupting the CD47-Sirpα Anti-Phagocytic Axis by a Humanized Anti-CD47 Antibody Is an Efficacious Treatment for Malignant Pediatric Brain Tumors. Sci Trans Med (2017) 9(381):eaaf2968. doi: 10.1126/scitranslmed.aaf2968
46. Nowak AK, Robinson BWS, Lake RA. Gemcitabine Exerts a Selective Effect on the Humoral Immune Response. Cancer Res (2002) 62(8):2353.
47. Suzuki E, Kapoor V, Jassar AS, Kaiser LR, Albelda SM. Gemcitabine Selectively Eliminates Splenic Gr-1+/CD11b+ Myeloid Suppressor Cells in Tumor-Bearing Animals and Enhances Antitumor Immune Activity. Clin Cancer Res (2005) 11(18):6713–21. doi: 10.1158/1078-0432.CCR-05-0883
48. McDonnell AM, Lesterhuis WJ, Khong A, Nowak AK, Lake RA, Currie AJ, et al. Tumor-Infiltrating Dendritic Cells Exhibit Defective Cross-Presentation of Tumor Antigens, But Is Reversed by Chemotherapy. Eur J Immunol (2015) 45(1):49–59. doi: 10.1002/eji.201444722
49. Homma Y, Taniguchi K, Murakami T, Nakagawa K, Nakazawa M, Matsuyama R, et al. Immunological Impact of Neoadjuvant Chemoradiotherapy in Patients With Borderline Resectable Pancreatic Ductal Adenocarcinoma. Ann Surg Oncol (2014) 21(2):670–6. doi: 10.1245/s10434-013-3390-y
50. Eriksson E, Wenthe J, Irenaeus S, Loskog A, Ullenhag G. Gemcitabine Reduces Mdscs, Tregs and Tgfβ-1 While Restoring the Teff/Treg Ratio in Patients With Pancreatic Cancer. J Trans Med (2016) 14(1):282. doi: 10.1186/s12967-016-1037-z
51. Mrdjen D, Pavlovic A, Hartmann FJ, Schreiner B, Utz SG, Leung BP, et al. High-Dimensional Single-Cell Mapping of Central Nervous System Immune Cells Reveals Distinct Myeloid Subsets in Health, Aging, and Disease. Immunity (2018) 48(2):380–95 e6. doi: 10.1016/j.immuni.2018.01.011
52. Stankov A, Belakaposka-Srpanova V, Bitoljanu N, Cakar L, Cakar Z, Rosoklija G. Visualisation of Microglia With the Use of Immunohistochemical Double Staining Method for CD-68 and Iba-1 of Cerebral Tissue Samples in Cases of Brain Contusions. Pril (Makedon Akad Nauk Umet Odd Med Nauki) (2015) 36(2):141–5. doi: 10.1515/prilozi-2015-0062
53. Buttgereit A, Lelios I, Yu X, Vrohlings M, Krakoski NR, Gautier EL, et al. Sall1 is a Transcriptional Regulator Defining Microglia Identity and Function. Nat Immunol (2016) 17(12):1397–406. doi: 10.1038/ni.3585
Keywords: medulloblastoma, immune microenvironment, microglia, immunocharacterization, chemotherapy, craniospinal irradiation, group 3
Citation: Abbas Z, George C, Ancliffe M, Howlett M, Jones AC, Kuchibhotla M, Wechsler-Reya RJ, Gottardo NG and Endersby R (2022) Conventional Therapies Deplete Brain-Infiltrating Adaptive Immune Cells in a Mouse Model of Group 3 Medulloblastoma Implicating Myeloid Cells as Favorable Immunotherapy Targets. Front. Immunol. 13:837013. doi: 10.3389/fimmu.2022.837013
Received: 16 December 2021; Accepted: 08 February 2022;
Published: 03 March 2022.
Edited by:
Orazio Vittorio, University of New South Wales, AustraliaReviewed by:
Maria Vinci, Bambino Gesù Children’s Hospital (IRCCS), ItalyToni Jue, Children’s Cancer Institute Australia, Australia
Copyright © 2022 Abbas, George, Ancliffe, Howlett, Jones, Kuchibhotla, Wechsler-Reya, Gottardo and Endersby. This is an open-access article distributed under the terms of the Creative Commons Attribution License (CC BY). The use, distribution or reproduction in other forums is permitted, provided the original author(s) and the copyright owner(s) are credited and that the original publication in this journal is cited, in accordance with accepted academic practice. No use, distribution or reproduction is permitted which does not comply with these terms.
*Correspondence: Raelene Endersby, cmFlbGVuZS5lbmRlcnNieUB0ZWxldGhvbmtpZHMub3JnLmF1