
94% of researchers rate our articles as excellent or good
Learn more about the work of our research integrity team to safeguard the quality of each article we publish.
Find out more
ORIGINAL RESEARCH article
Front. Immunol., 22 July 2022
Sec. Cancer Immunity and Immunotherapy
Volume 13 - 2022 | https://doi.org/10.3389/fimmu.2022.830606
This article is part of the Research TopicDendritic Cell-primed T Cells in Anti-tumor Immune Responses and Relevant Vaccine StrategiesView all 7 articles
 Xuejiao Li1,2†Huan Du1,3†
 Shenghua Zhan4†Wenting Liu1,4Zhangyu Wang5,6Jing Lan5Longxiang PuYang1Yuqiu Wan1,5
 Qiuxia Qu7Sining Wang1Yang Yang1
 Qin Wang1*
 Fang Xie1*
Accumulating evidence suggests that regulatory B cells (Bregs) play important roles in inhibiting the immune response in tumors. Programmed death 1 (PD-1) and programmed death ligand 1 (PD-L1) are important molecules that maintain the balance of the immune response and immune tolerance. This study aims to evaluate the soluble form of PD-L1 and its function in inducing the differentiation of B lymphocytes, investigate the relationship between soluble PD-L1 (sPD-L1) and B-cell subsets, and explore the antitumor activity of T lymphocytes after PD-L1 blockade in coculture systems. In an effort to explore the role of sPD-L1 in human breast cancer etiology, we examined the levels of sPD-L1 and interleukin-10 (IL-10) in the serum of breast tumor patients and the proportions of B cells, PD-1+ B cells, Bregs, and PD-1+ Bregs in the peripheral blood of patients with breast tumors and assessed their relationship among sPD-L1, IL-10, and B-cell subsets. The levels of sPD-L1 and IL-10 in serum were found to be significantly higher in invasive breast cancer (IBCa) patients than in breast fibroadenoma (FIBma) patients. Meanwhile, the proportions and absolute numbers of Bregs and PD-1+ Bregs in the peripheral blood of IBCa patients were significantly higher than those of FIBma patients. Notably, they were the highest in triple-negative breast cancer (TNBC) among other subtypes of IBCa. Positive correlations of sPD-L1 and IL-10, IL-10 and PD-1+ Bregs, and also sPD-L1 and PD-1+ Bregs were observed in IBCa. We further demonstrated that sPD-L1 could induce Breg differentiation, IL-10 secretion, and IL-10 mRNA expression in a dose-dependent manner in vitro. Finally, the induction of regulatory T cells (Tregs) by Bregs was further shown to suppress the antitumor response and that PD-L1 blockade therapies could promote the apoptosis of tumor cells. Together, these results indicated that sPD-L1 could mediate the differentiation of Bregs, expand CD4+ Tregs and weaken the antitumor activity of CD4+ T cells. PD-L1/PD-1 blockade therapies might be a powerful therapeutic strategy for IBCa patients, particularly for TNBC patients with high level of PD-1+ Bregs.
Invasive breast cancer (IBCa) is the most common cancer that threatens women’s health worldwide (1). Triple-negative breast cancer (TNBC), accounting for approximately 10%–15% of all diagnosed breast cancers, is associated with high tumor heterogeneity, low differentiation, rapid proliferation, early clinical recurrence and metastasis, and poor clinical outcomes (2). Our previous study showed that MDA-MB231 cells from TNBC patient expressed a higher level of programmed death ligand 1 (PD-L1), which induced regulatory B cells (Bregs) under coculture conditions and played an important role in regulating antitumor immune suppression. Dirix et al. and Mittendorf et al. showed that approximately 20% of TNBC tumor tissues express PD-L1, and the majority of these TNBC tumors were grade 3 (3, 4). Our previous study also found PD-L1 expression in 83.6% (112 of 134) of IBCa cases evaluated, which was significantly associated with Tumor Node Metastasis (TNM) staging (5).
Recently, immunotherapy, such as PD-L1/programmed death 1 (PD-1) blockade, has revolutionized the management of multiple solid tumors. Early data have shown promising outcomes in small numbers of advanced TNBC patients treated with PD-L1/PD-1 antagonists, such as atezolizumab and pembrolizumab (6). Immune checkpoint blockade therapies have brought bright prospects for patients with metastatic TNBC (7).
PD-L1, known as CD274 or B7-H1, belongs to the B7 family and is expressed on B lymphocytes, T lymphocytes, monocytes, antigen-presenting cells (APCs), and epithelial cells (8). Furthermore, PD-L1 is expressed in a series of human malignancies and has been reported to play a critical role in suppressing anticancer immunity by binding to the receptor PD-1 (9). Structurally, PD-L1 contains immunoglobulin V (IgV)– and immunoglobulin C (IgC)–like extracellular domains, a transmembrane domain, and a short cytoplasmic domain (10), whereas receptor PD-1 comprises an IgV-like extracellular domain, a transmembrane domain, and a cytoplasmic domain that harbors a cytoplasmic immunoreceptor tyrosine–based inhibitory motif (ITIM) and an immunoreceptor tyrosine–based switch motif (ITSM) (11). Interaction between the extracellular domains of PD-L1 and PD-1 can induce a conformational change in PD-1 that leads to phosphorylation of ITIM and ITSM to reduce the strength of the TCR signal (10). Moreover, the interaction of PD-L1 and PD-1 can transduce inhibitory signals to effector T cells (Teffs) (12).
As one of the B7 family members, the soluble form of PD-L1 was found and initially described in autoimmune disorders, which were thought to be produced by immune cells upon stimulation with proinflammatory cytokines (13). Recent publications have described elevated levels of soluble PD-L1 (sPD-L1) in patients with some human cancers, which could be used as biomarkers reflecting clinical status, treatment response, and disease outcome (14–16). Interestingly, Li et al. and Yazdanpanah et al. found that sPD-L1 plasma levels were significantly increased in TNBC patients and could be used to predict the treatment response to immunotherapy (17, 18). However, studies elucidating the role of sPD-L1 in regulating the function of Bregs in immune suppression are rare.
Here, to investigate sPD-L1 as a soluble form of PD-L1 in immune suppression, we retrospectively evaluated the level of sPD-L1 in the blood plasma of IBCa patients and analyzed the relationship of sPD-L1 expression with the presence of Bregs; clinical characteristics including TNM stage, tumor grade, lymph node infiltration; and the presence of metastases as well as the antitumor activity of T cells in breast cancer and lymphocyte coculture systems.
In this study, the effect of sPD-L1 on regulating the differentiation and functions of B cells and their subsets was further explored, and it provides evidence for the future use of immune checkpoint blockade therapies in IBCa and TNBC patients.
The following monoclonal antibodies and reagents were used in this study: anti-human CD24-PE-cy7 (clone: eBioSN3), anti-human CD4-BV605 (clone: RPA-T4), anti-human CD25-BV421 (clone: M-A251), anti-human CD19-BV605 (clone: SJ25C1), and anti-human PD-1-FITC (clone: MIH4) were purchased from eBioscience (USA); anti-human PD-L1-PE (clone: 291.2A3), anti-human CD38-BV421 (clone: HIT2), and anti-human CD127-PE-cy7 (clone: A019D5) were purchased from BioLegend (USA); anti-human Foxp3-APC (clone: 3G3) and anti-human CD4 MicroBeads were purchased from Miltenyi Biotec (German); CellTrace™ CFSE Cell Proliferation Kit, Annexin V-APC/PI Apoptosis kit, Annexin V-APC/7-AAD Apoptosis kit, and Human IL-10 Uncoated ELISA kit were purchased from Invitrogen (USA); sPD-L1 ELISA kit and anti-human PD-L1 blocking antibody (clone: 2H11) were obtained from Suzhou Bright Scistar Biotechnology (China); Human B-cell enrichment kit (catalog: 19054) was purchased from STEMCELL Technologies (Canada); PrimeScript™ RT Master Mix and SYBR Premix Ex Taq™ were purchased from TaKaRa (Japan); lipopolysaccharide (LPS) was purchased from Sigma-Aldrich (USA); anti-CD3e monoclonal antibody was purchased from Glucan Biotech. (clone: OKT3; China); BD Matrigel™ matrix was purchased from BD Biosciences (USA); sPD-L1 was purchased from Biointron (China); and Transwell plates was purchased from Corning Incorporated (USA).
The following monoclonal antibodies were prepared in our laboratory: anti-human CD28 antibodies (clone: 18G8) (5) and agonist anti-human CD40 monoclonal antibody (clone: 5C11) (19).
Peripheral blood cells and serum of IBCa and fibroadenoma (FIBma) patients were randomly collected from the archive of the First Affiliated Hospital of Soochow University. The samples were centrifuged at 1500 rpm for 10 min, the cell-free sera were stored at −20°C for enzyme-linked immunosorbent assay (ELISA), and the peripheral blood cells were analyzed for cell surface markers by flow cytometry.
The cases from 114 cases of IBCa and 26 cases of FIBma from the breast were analyzed in the present study. None of the patients with IBCa had received any kind of chemical or radiation therapy before surgery. The age of the IBCa patients ranged from 31 to 90 years, with a mean of 53.7 years. The histopathological diagnosis of breast tumors was made according to cellular morphological changes and tissue architecture by using previously established criteria. Fourteen of 114 IBCa cases were graded as well differentiated (12.3%), 73 of 114 were moderately differentiated (64.0%), and the rest (23.7%, 27 of 114) were poorly differentiated. The TNM stage of invasive carcinomas was also assessed following the WHO classification of breast tumors as previously reported (5). Carcinoma specimens were classified as stage T1 (36 of 114, 31.6%), T2 (48 of 114, 42.1%), T3 (19 of 114, 16.7%), and T4 (11 of 114, 9.6%). In addition, local lymph node metastasis occurred in 54 of 114 cases (47.4%) (Supplemental Table 1).
The expression levels of estrogen receptor (ER), progesterone receptor (PR), human epidermal growth factor receptor 2 (HER2), and Ki67 were scored according to the guidelines of the National Comprehensive Cancer Network of our previous report (5). Briefly, a case was considered positive for ER and PR if more than 15% of the tumor cells showed nuclear staining of ER, PR, or Ki67. Positivity for HER2 was scored as “++” when strong and complete membrane staining was present in more than 30% of invasive tumor cells. FIBma biopsies were taken from 26 symptom-free female subjects for which the median age was 50.0 (17~62) years old.
This study was approved by the ethics committee of the University of Soochow Hospitals National Health Service Trust. Patients and healthy volunteers were recruited after informed consent was obtained.
The human breast cancer lines MDA-MB231 and MCF-7 were purchased from American Type Culture Collection (ATCC) and cultured in RPMI 1640 medium (HyClone, Logan, UT, USA) containing 10% heat-inactivated fetal bovine serum (FBS) (Biological Industries, Israel) and 1% penicillin/streptomycin. All breast cancer cell lines used in these studies were assessed by flow cytometry analysis for constitutive cell surface PD-L1 expression (Supplemental Figure 1A).
CD4+ T cells were purified from the peripheral blood of healthy individuals using a CD4+ T-cell–positive isolation kit according to the manufacturer’s instructions (Miltenyi Biotec, Germany). To establish TH0 cell conditions following our previous report, 2 × 10⁵ CD4+ T cells per well in 96-well plates were stimulated with anti-CD3e monoclonal antibody (1 μg/ml) and anti-CD28 monoclonal antibody (1 μg/ml) for 72 h. On day 3, activated CD4+ T cells were collected for coculture experiments.
A human B-cell enrichment kit was used to purify CD19+ B cells from the peripheral blood of healthy individuals according to the manufacturer’s instructions (Miltenyi Biotec, Germany). A total of 2 × 10⁵ purified CD19+ B cells were stimulated with LPS (1 μg/ml), anti-CD40 monoclonal antibody (1 μg/ml, clone: 5C11), or sPD-L1 (10–1,000 ng/ml) for subsequent coculture experiments.
We used a blocking antibody against PD-L1 at different concentrations to block PD-L1 expression on MDA-MB231 cells (Supplemental Figure 1B) for 30 min. At 0.5 h after blocking, the cells were harvested and subjected to analysis of PD-L1 expression by flow cytometry. Each block experiment was performed in triplicate and repeated three times.
CD19+ B-cell and CD4+ T-cell coculture systems were established to study the interactions between immune cells. CD19+ B cells (2 × 10⁵) stimulated with LPS (1 μg/ml) or sPD-L1 (1000 ng/ml) were collected and cultured with activated CD4+ T cells at a ratio of 1:1. On day 1 after coculturing, CD4+ T cells were collected and washed for surface or intracellular staining.
Two coculture systems were established to investigate a potential association between CD19+ B cells and the soluble form of PD-L1 from breast cancer cells. The direct coculture system (DR) was performed as previously reported. Briefly, 2 × 10⁵ CD19+ B cells from healthy individuals stimulated with LPS were collected and cultured with PD-L1hi MDA-MB231 or PD-L1lo MCF-7 cells directly with or without blocking anti–PD-L1 antibody at a ratio of 10:1.
The indirect coculture system (IDR) was performed in Transwell chambers coated with BD Matrigel™ matrix (3 mg/ml) (BD Biosciences, Becton Dickson Labware, Franklin Lakes, NJ). Breast cancer cell lines, either PD-L1hi MDA-MB231 or PD-L1lo MCF-7 cells with or without previously treated anti–PD-L1 blockade, were seeded at 2 × 10⁴ cells per upper chamber well in Transwell culture plates and cocultured with activated CD19+ B cells from healthy individuals at a ratio of 1:10. At 24 h after coculturing, CD19+ B cells from the lower chamber in Transwell culture plates were collected and washed for surface staining.
CD19+ B cell, CD4+ T cell, and breast cancer cell coculture experiments were employed to investigate the antitumor immune response to PD-L1 signal blockade. Breast cancer cell lines, either PD-L1hi MDA-MB231 or PD-L1lo MCF-7 cells with or without anti–PD-L1 blocking antibody treatment previously, were seeded in 96-well culture plates and cocultured with CD19+ B cells stimulated with sPD-L1 or LPS with or without activated CD4+ T cells at a ratio of 1:5:5. Each experiment was performed in triplicate and repeated three times.
The isolated peripheral blood mononuclear cells (PBMCs) were washed in PBS containing 2.5% FBS and incubated with specific fluorochrome-conjugated antibodies for 30 min at 4°C, including CD19-BV605, CD38-BV421, CD24-PE-Cy7, and PD-1-FITC, to identify B-cell surface molecules and CD4-BV605, CD127-PE-Cy7, and CD25-BV421 to identify T-cell surface molecules. After being washed, the labeled cells were resuspended in 0.5 ml of cell staining buffer and analyzed with flow cytometry software (FlowJo version 10, USA). Anti-mouse IgG isotype controls were performed for each staining.
The surface molecules of regulatory T cells (Tregs) were also stained as described above using fluorochrome-conjugated antibodies against CD4-BV605 and CD25-BV421. For intracellular staining, washed cells were fixed with Foxp3 fixation/permeabilization solution and incubated with APC-conjugated anti-Foxp3 antibody in the dark for 30 min. Labeled cells were resuspended in 0.5 ml od cell staining buffer and analyzed with flow cytometry.
Apoptosis was measured using an apoptosis detection kit. Briefly, MDA-MB231 cells stained with carboxyfluorescein diacetate succinimidyl ester (CFSE) were seeded in 96-well plates and incubated with T cells or B cells as described above. Twenty-four hours later, the cells were collected and stained with Annexin V-APC/PI or Annexin V-APC/7AAD and detected with flow cytometry (CytomicsTM FC500, Beckman Coulter, USA). All flow cytometry data were analyzed with FlowJo software (version 10, USA).
The levels of sPD-L1 and interleukin-10 (IL-10) in the serum of patients were determined in duplicate wells using sPD-L1 ELISA kits (Suzhou Bright Scistar, China) and IL-10 ELISA kits (Invitrogen, USA) according to the manufacturer’s instructions.
CD19+ B cells (2 × 10⁵) were treated with LPS, 5C11, or sPD-L1 for 24 h. Twenty-four hours later, CD19+ B cells were collected for RNA isolation and quantitative real-time PCR analysis.
Total RNA was extracted from cells using TRIzol reagent and transcribed to cDNA with a PrimeScript RT Master Mix kit (TaKaRa, Japan) following the manufacturer’s instructions. Quantitative real-time PCR analysis of IL-10 gene expression was performed with a SYBR Green I Master kit (TaKaRa, Japan) (CFX96 Touch™ Real-Time System, Bio-Rad, USA). All data were normalized using β-actin as an internal control. Gene expression was expressed as the fold change from the β-actin level, which was calculated as the 2-ΔΔCt method. In addition, melting curve analysis was performed to assure the specificity of the PCR product in this experiment. The primer sequences used for β-actin and IL-10 are shown in Supplemental Table 2. All experiments were carried out in triplicate.
All of the data are presented as the means ± standard error of the mean and were analyzed using unpaired two-tailed Student’s t-tests or ANOVA. Correlations were determined by the Pearson’s and Spearman’s methods. Statistical significance was defined as P < 0.05. All analyses were performed using SAS 9.2 (SAS Enterprise Guide 3.0, Cary, NC).
To evaluate the role of CD19+ B-cell subsets and PD-1 expression in the peripheral blood of patients (Figures 1A, B), the frequency and absolute number were measured in total CD19+ B cells in IBCa and FIBma. The percentages of PD-1+CD19+ B cells, CD19+CD24+CD38+ B cells, and PD-1+CD19+CD24+CD38+ B cells were significantly increased in patients with IBCa compared to patients with FIBma (P = 0.035, P = 0.0001, and P = 0.010, respectively) (Figure 1C). The average frequency of CD19+ B cells in IBCa patients was lower than that in FIBma patients, but no significant difference was observed (Figure 1C). The absolute numbers of both CD19+CD24+CD38+ B cells and PD-1+CD19+CD24+CD38+ B cells were significantly increased in IBCa compared to FIBma (P = 0.038, P = 0.017, respectively) (Figure 1D). No significant difference was observed in the absolute numbers of CD19+ B cells and PD-1+CD19+ B cells between IBCa and FIBma (P = 0.353) (Figure 1D). Further analysis of the relationships between the percentages and absolute numbers of CD19+ B-cell subsets and the histopathological characteristics of IBCa demonstrated that the percentages and absolute numbers of CD19+ B cells, PD-1+CD19+ B cells, CD19+CD24+CD38+ B cells, and PD-1+CD19+CD24+CD38+ B cells had no significant association with histological grade, lymph node metastasis, TNM stage, tumor size, ER status, or PR status (P > 0.05 for all; Tables 1-4), except that the percentage of PD-1+CD19+ B cells was higher in IBCa with a small tumor size (6.06 ± 6.66%) than in IBCa with a large tumor size (3.86 ± 2.75%) (P = 0.028; Table 1). Although no statistically significant differences were observed, the percentages of PD-1+CD19+ B cells, CD19+CD24+CD38+ B cells, and PD-1+CD19+CD24+CD38+ B cells were increased in TNBC compared to other subtypes of IBCa (Tables 1, 2).
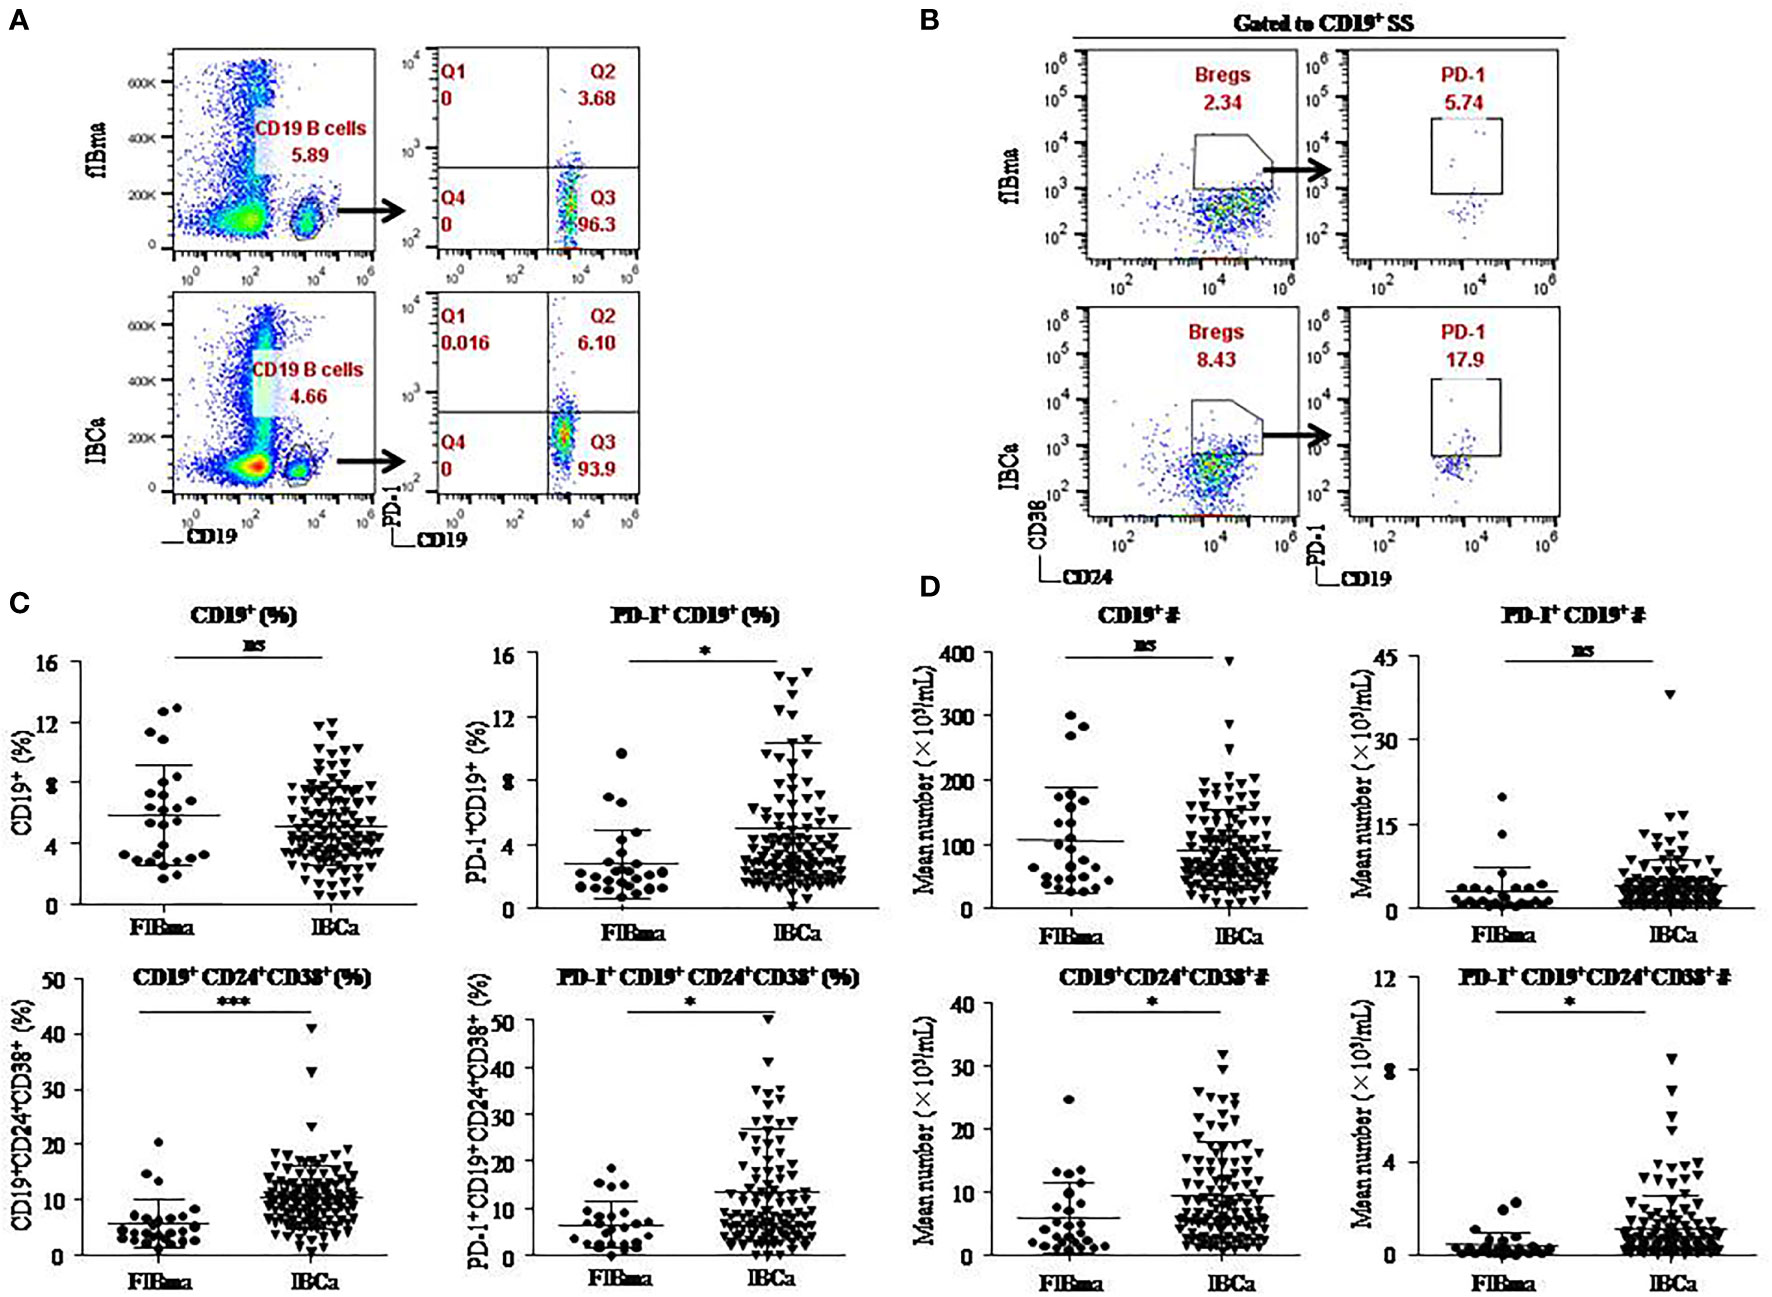
Figure 1 CD19+CD24+CD38+ B lymphocytes predominated in PBMCs of IBCa patients. The percentage and the absolute number of CD19+ B-cell subsets were measured in IBCa patients (n = 114) and FIBma patients (n = 26). PBMCs were isolated from peripheral blood and stained with CD19-BV605, CD24-PE-Cy7, CD38-BV421, and PD-1-FITC for flow cytometry, as described in “Materials and methods”. Representative flow cytometry dot plot of PD-1 expression in total CD19+ B cells (A) and CD24, CD38, and PD-1 expression in CD19+ B cells or CD19+CD24+CD38+ B cells (B). Scatter plots showing the percentage of CD19+ B-cell subsets in FIBma patients and IBCa patients. A significant increase in the frequency of PD-1+CD19+B cells, CD19+CD24+CD38+ B cells, and PD-1+CD19+CD24+CD38+ B cells was observed in IBCa patients compared to FIBma patients (P = 0.035, P = 0.0001, P = 0.010, respectively) (C). The absolute number of CD19+ B-cell subsets in FIBma patients and IBCa patients. The absolute numbers of CD19+CD24+CD38+ B cells and PD-1+CD19+CD24+CD38+ B cells were significantly higher in IBCa patients than in FIBma patients (P = 0.038 and P = 0.017, respectively) (D). All values show the means ± SEM. Data were analyzed by unpaired Student’s t-test. ns, not statistically significant. *P < 0.05 and ***P < 0.001.
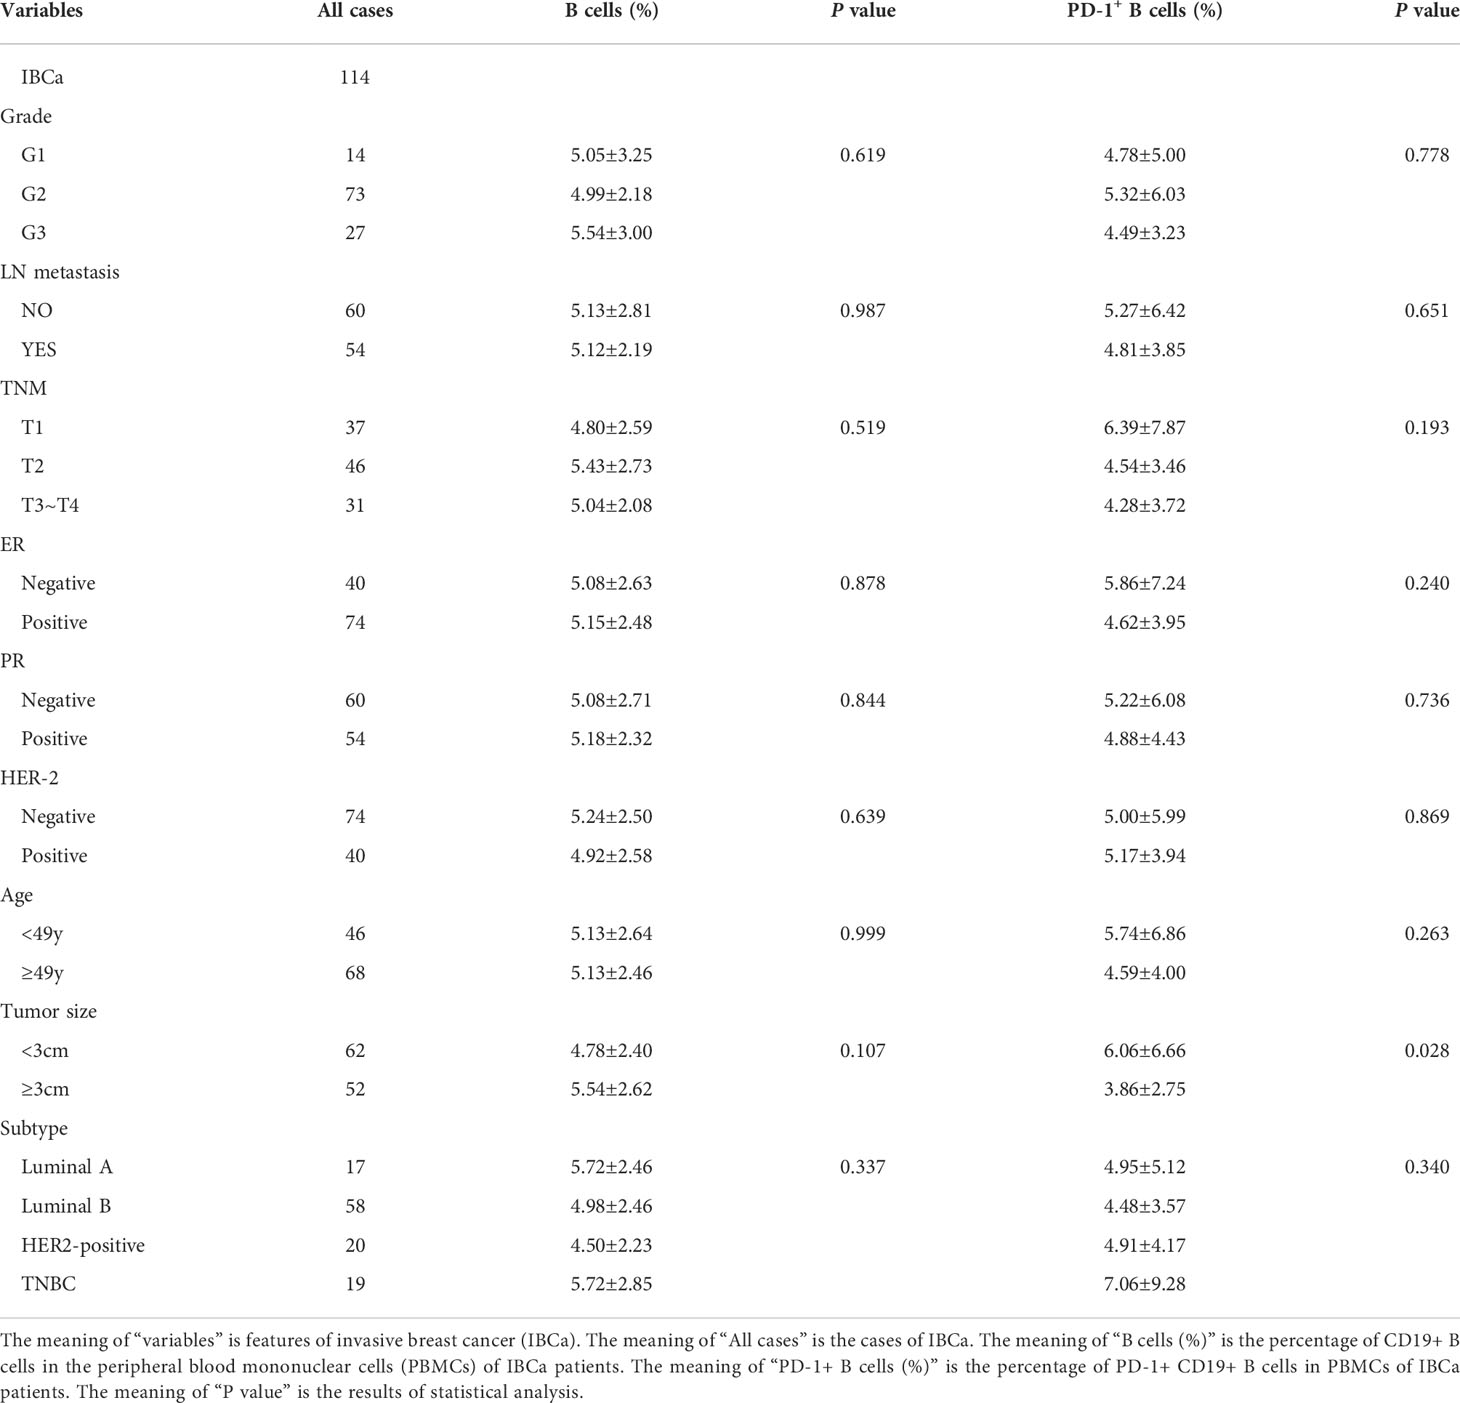
Table 1 Relationship between the proportion of B cells and its subset in PBMCs and the clinicopathological parameters of IBCa patients.
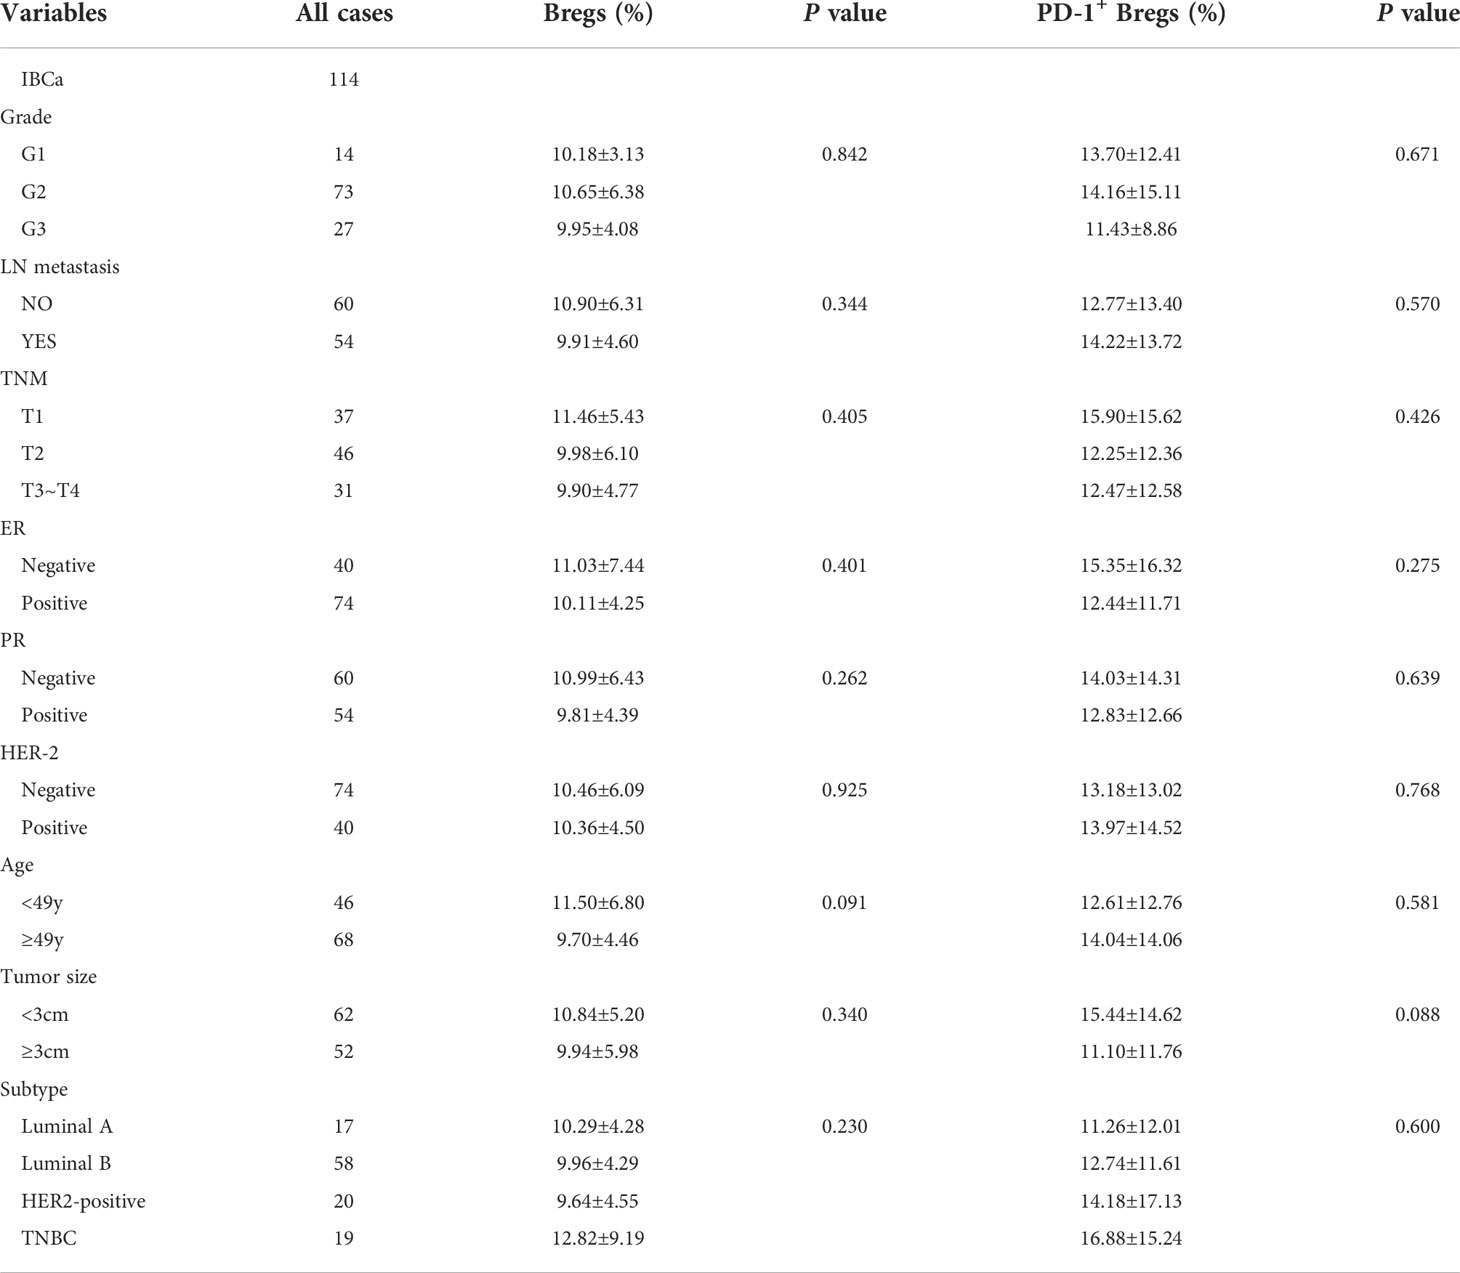
Table 2 Relationship between the proportion of Bregs and its subset in PBMCs and the clinicopathological parameters of IBCa patients.
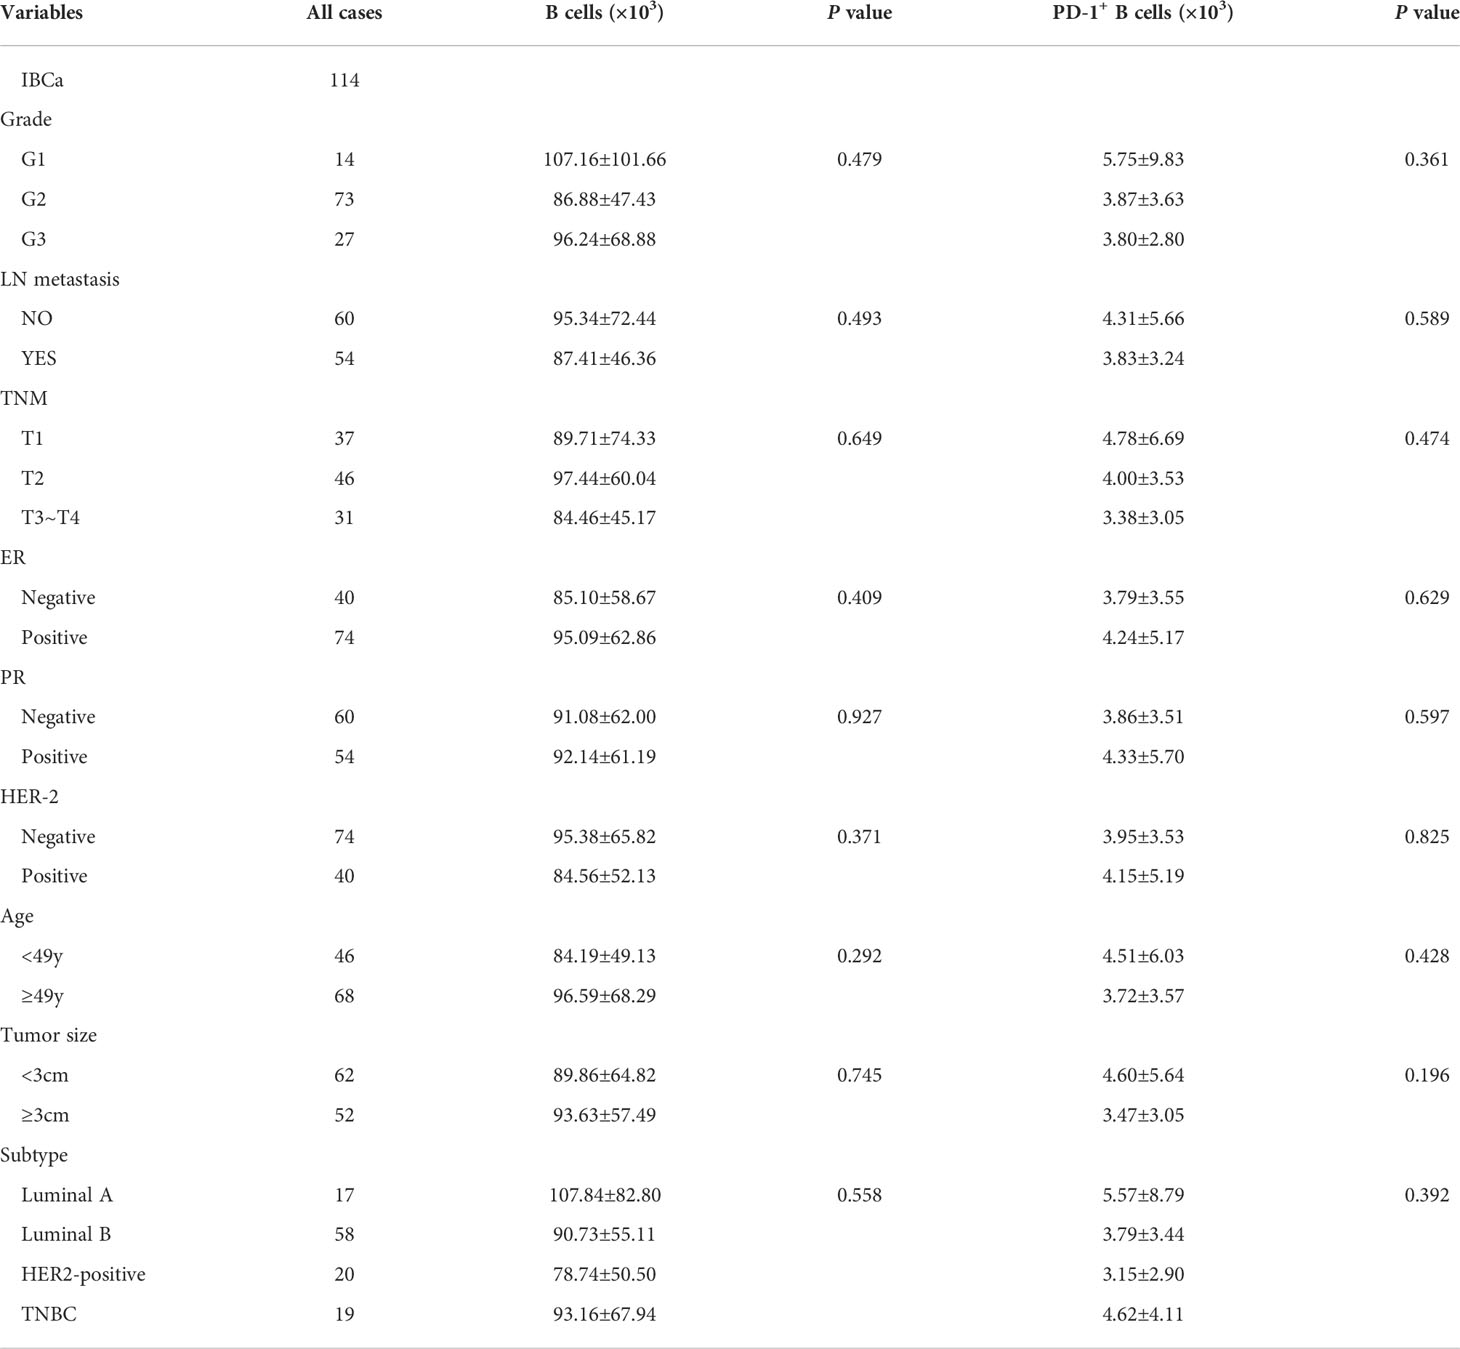
Table 3 Relationship between the absolute number of B cells and its subset in PBMCs and the clinicopathological parameters of IBCa patients.
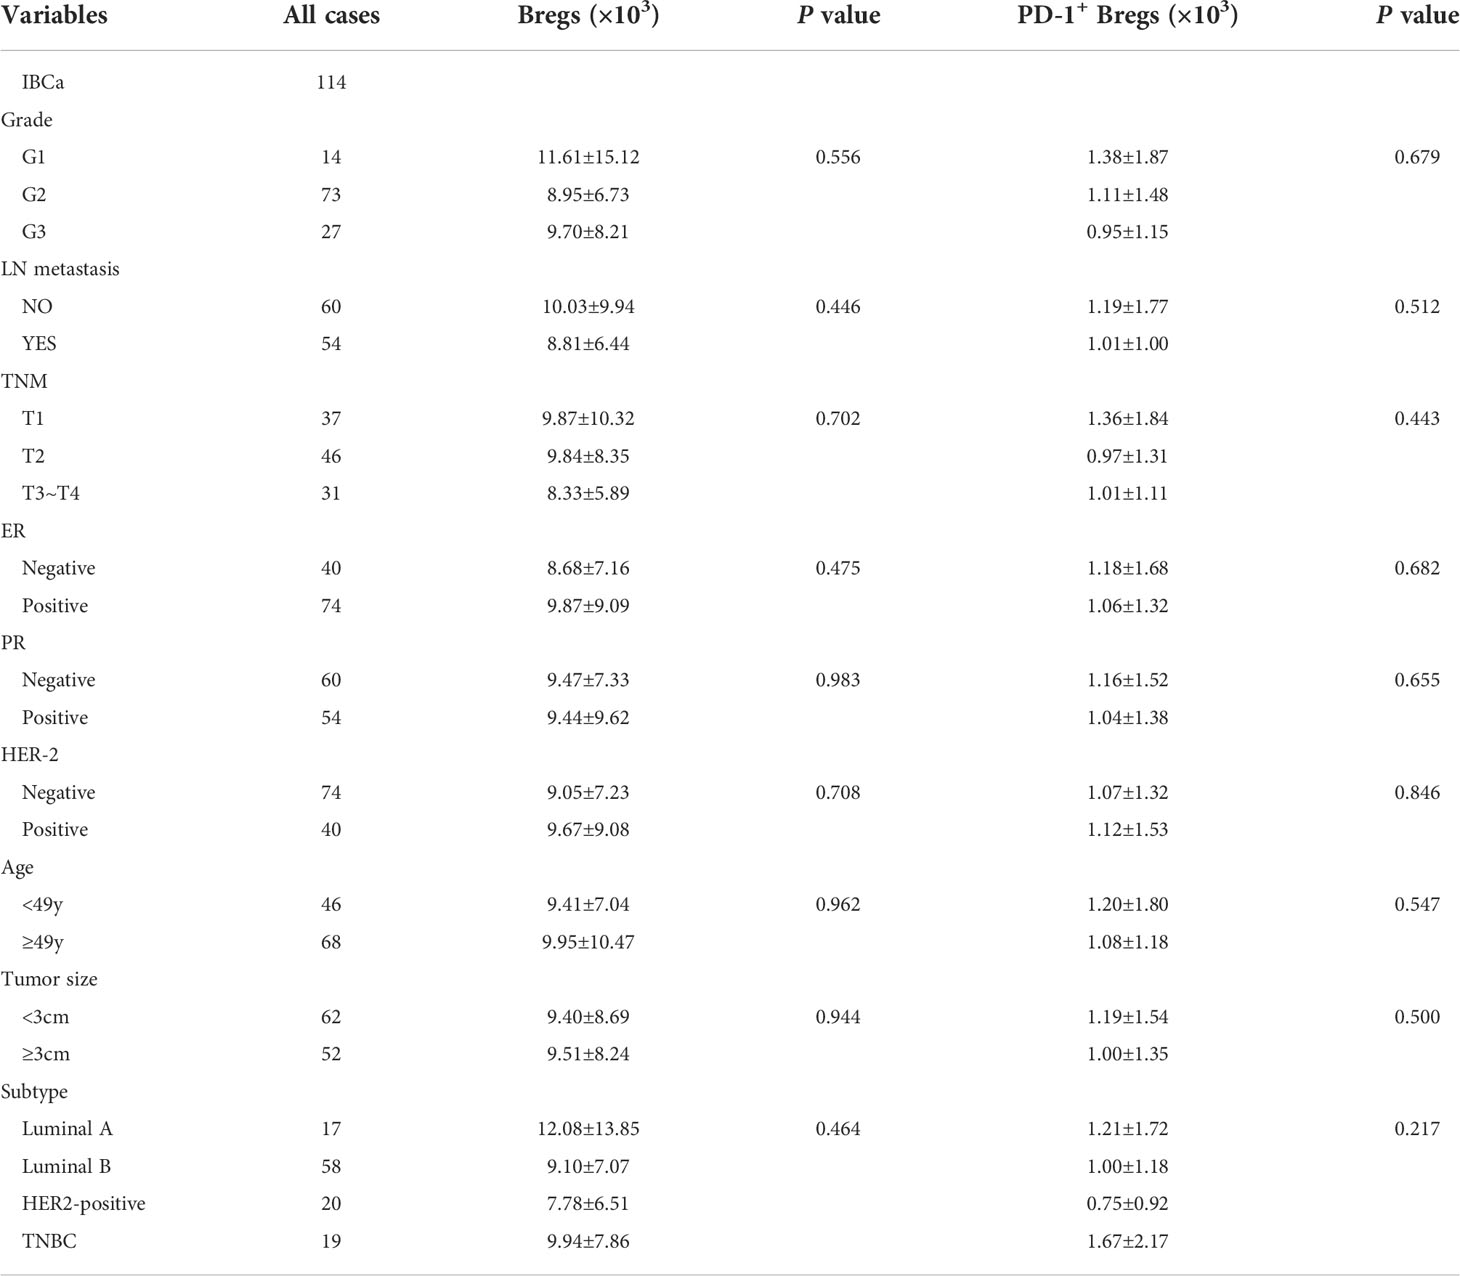
Table 4 Relationship between the absolute number of Bregs and its subset in PBMCs and the clinicopathological parameters of IBCa patients.
As expected, the levels of sPD-L1 and IL-10 in the serum of patients with IBCa measured by ELISA were higher than those with FIBma (P = 0.029 and P = 0.023, respectively) (Figures 2A, B). Further analysis of the relationships between the level of sPD-L1 or IL-10 and the histopathological characteristics of IBCa demonstrated that there were no significant associations with histological grade, lymph node metastasis, TNM stage, tumor size, ER status, or PR status (P > 0.05 for all; Table 5).
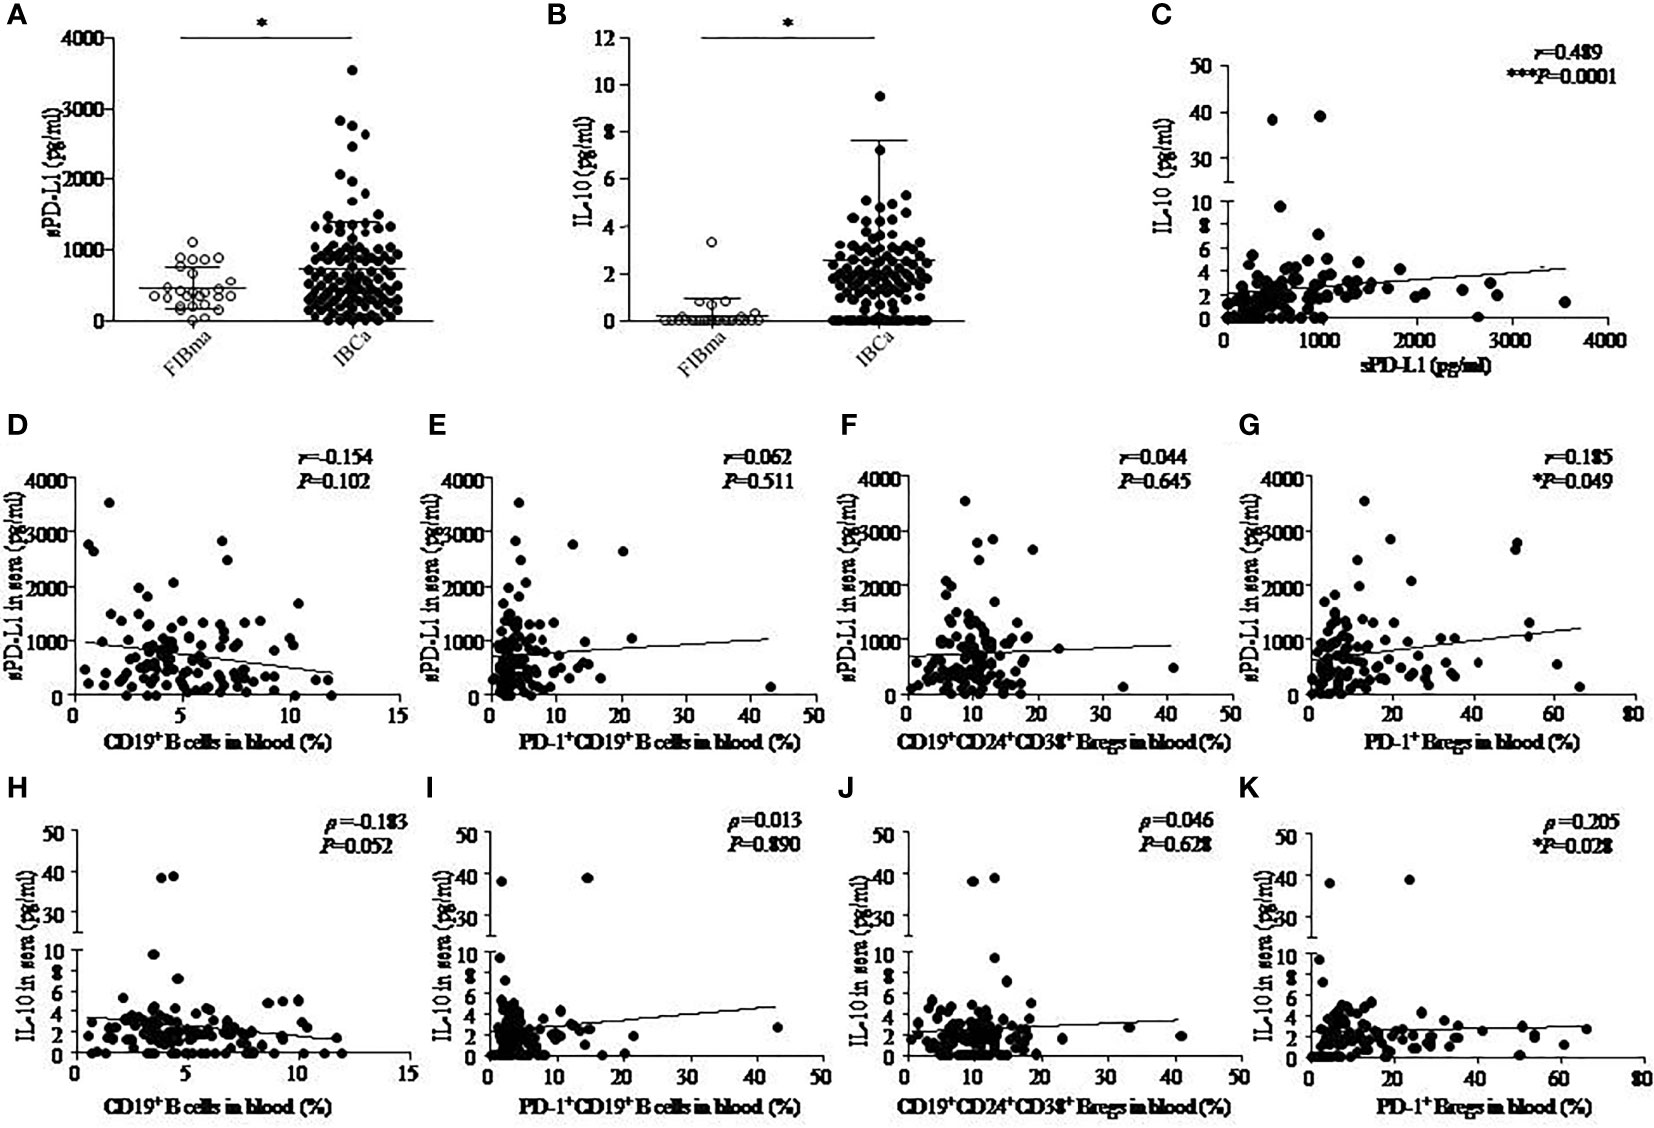
Figure 2 The correlation among IL-10, sPD-L1, and CD19+ B-cell subsets in IBCa. The production of soluble programmed death ligand 1 (sPD-L1) and interleukin-10 (IL-10) in the sera of FIBma (N = 26) and IBCa patients (N = 114) was measured by enzyme-linked immunosorbent assay (ELISA), as described in “Materials and methods”. The correlations between sPD-L1 and IL-10, sPD-L1 and CD19+ B-cell subsets, and also IL-10 and CD19+ B-cell subsets in IBCa patients (N=114) were investigated. sPD-L1 levels in the sera of IBCa patients and FIBma patients (A). IL-10 levels in the sera of IBCa patients and FIBma patients (B). The correlation between the levels of IL-10 and sPD-L1 in the sera from IBCa patients ***P = 0.0001 (C). The correlation between the abundance of CD19+ B cells and sPD-L1 in the sera from IBCa (D). The correlation between the abundance of PD-1+CD19+ B cells and sPD-L1 in the sera from IBCa (E). The correlation between the abundance of CD19+CD24+CD38+ Bregs and sPD-L1 in the sera from IBCa (F). The correlation between the abundance of PD-1+CD19+CD24+CD38+ Bregs and sPD-L1 in the sera from IBCa (G). The correlation between the abundance of CD19+ B cells and IL-10 in the sera from IBCa (H). The correlation between the abundance of PD-1+CD19+ B cells and IL-10 in the sera from IBCa (I). The correlation between the abundance of CD19+CD24+CD38+ Bregs and IL-10 in the sera from IBCa (J). The correlation between the abundance of PD-1+CD19+CD24+CD38+ Bregs and IL-10 in the sera from IBCa (K). Each dot represents an individual patient. All values show the means ± SEM. Data were analyzed by unpaired Student’s t-test (A-B), Pearson’s correlation (C-G), and Spearman’s correlation (H-K). ns, not statistically significant, *P <0.05 and ***P <0.001.
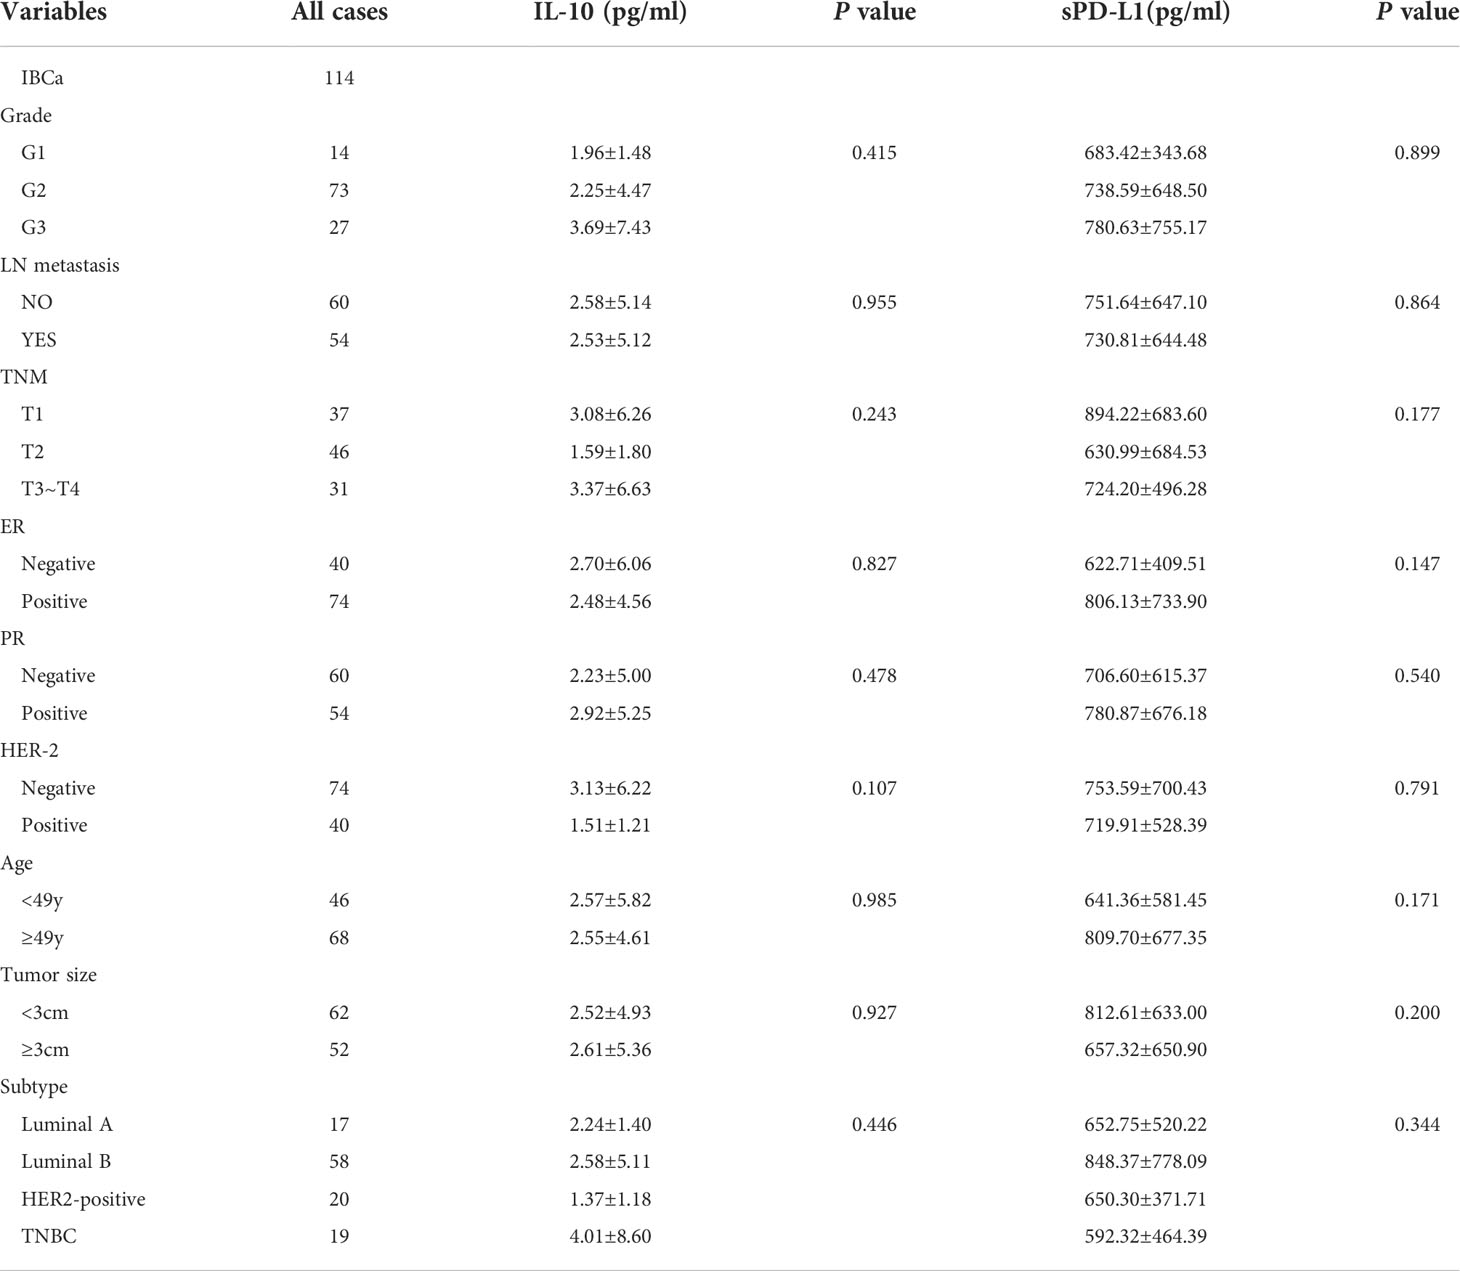
Table 5 Relationship between the level of IL-10 and sPD-L1 in serum and the clinicopathological parameters of IBCa patients.
Furthermore, we investigated the correlations between sPD-L1 and IL-10, sPD-L1 and CD19+ B-cell subsets, and also IL-10 and CD19+ B-cell subsets in IBCa patients. The results showed significantly positive correlations between the levels of sPD-L1 and IL-10 in the serum of IBCa patients (r = 0.489, P = 0.0001; Figure 2C), the percentage of PD-1+CD19+CD24+CD38+ B cells and sPD-L1 levels (r = 0.185, P = 0.049; Figure 2G), and the percentage of PD-1+CD19+CD24+CD38+ B cells and IL-10 levels (ρ = 0.205, P = 0.028; Figure 1K). No significant differences were found, although there was a negative correlation between the percentage of CD19+ B cells and IL-10 in the serum of IBCa patients (ρ = −0.183, P = 0.052; Figure 2H) and the percentage of CD19+ B cells and sPD-L1 in the serum of IBCa patients (r = −0.154, P = 0.102; Figure 2D). No correlations were observed between sPD-L1 levels and the percentage of PD-1+CD19+ B cells (Figure 2E), sPD-L1 and CD19+CD24+CD38+ B cells (Figure 2F), IL-10 and PD-1+ B cells (Figure 2I), or IL-10 and CD19+CD24+CD38+ B cells (Figure 2J).
To determine the role of the PD-1/PD-L1 axis on B-cells differentiation, we established a CD19+ B-cell incubation system in vitro induced by sPD-L1. We detected that the expression levels of CD24 and CD38 increased on total CD19+ B cells (Figure 3A) and that IL-10 secretion increased from CD19+CD24+CD38+ B cells (Figure 3B) in the incubation system. The expression levels of CD24 and CD38 on CD19+ B cells, IL-10 secretion by CD19+CD24+CD38+ B cells, and IL-10 mRNA levels in total CD19+ B cells in the incubation system were significantly increased compared to those in the control group in a dose-independent manner, as were the absolute numbers of CD19+CD24+CD38+ B cells and IL-10+ B cells (Figure 3C, Supplemental Figure 2A). The results indicated that the PD-1/PD-L1 axis may play an important role in CD19+CD24+CD38+ B-cell promotion and IL-10 secretion.
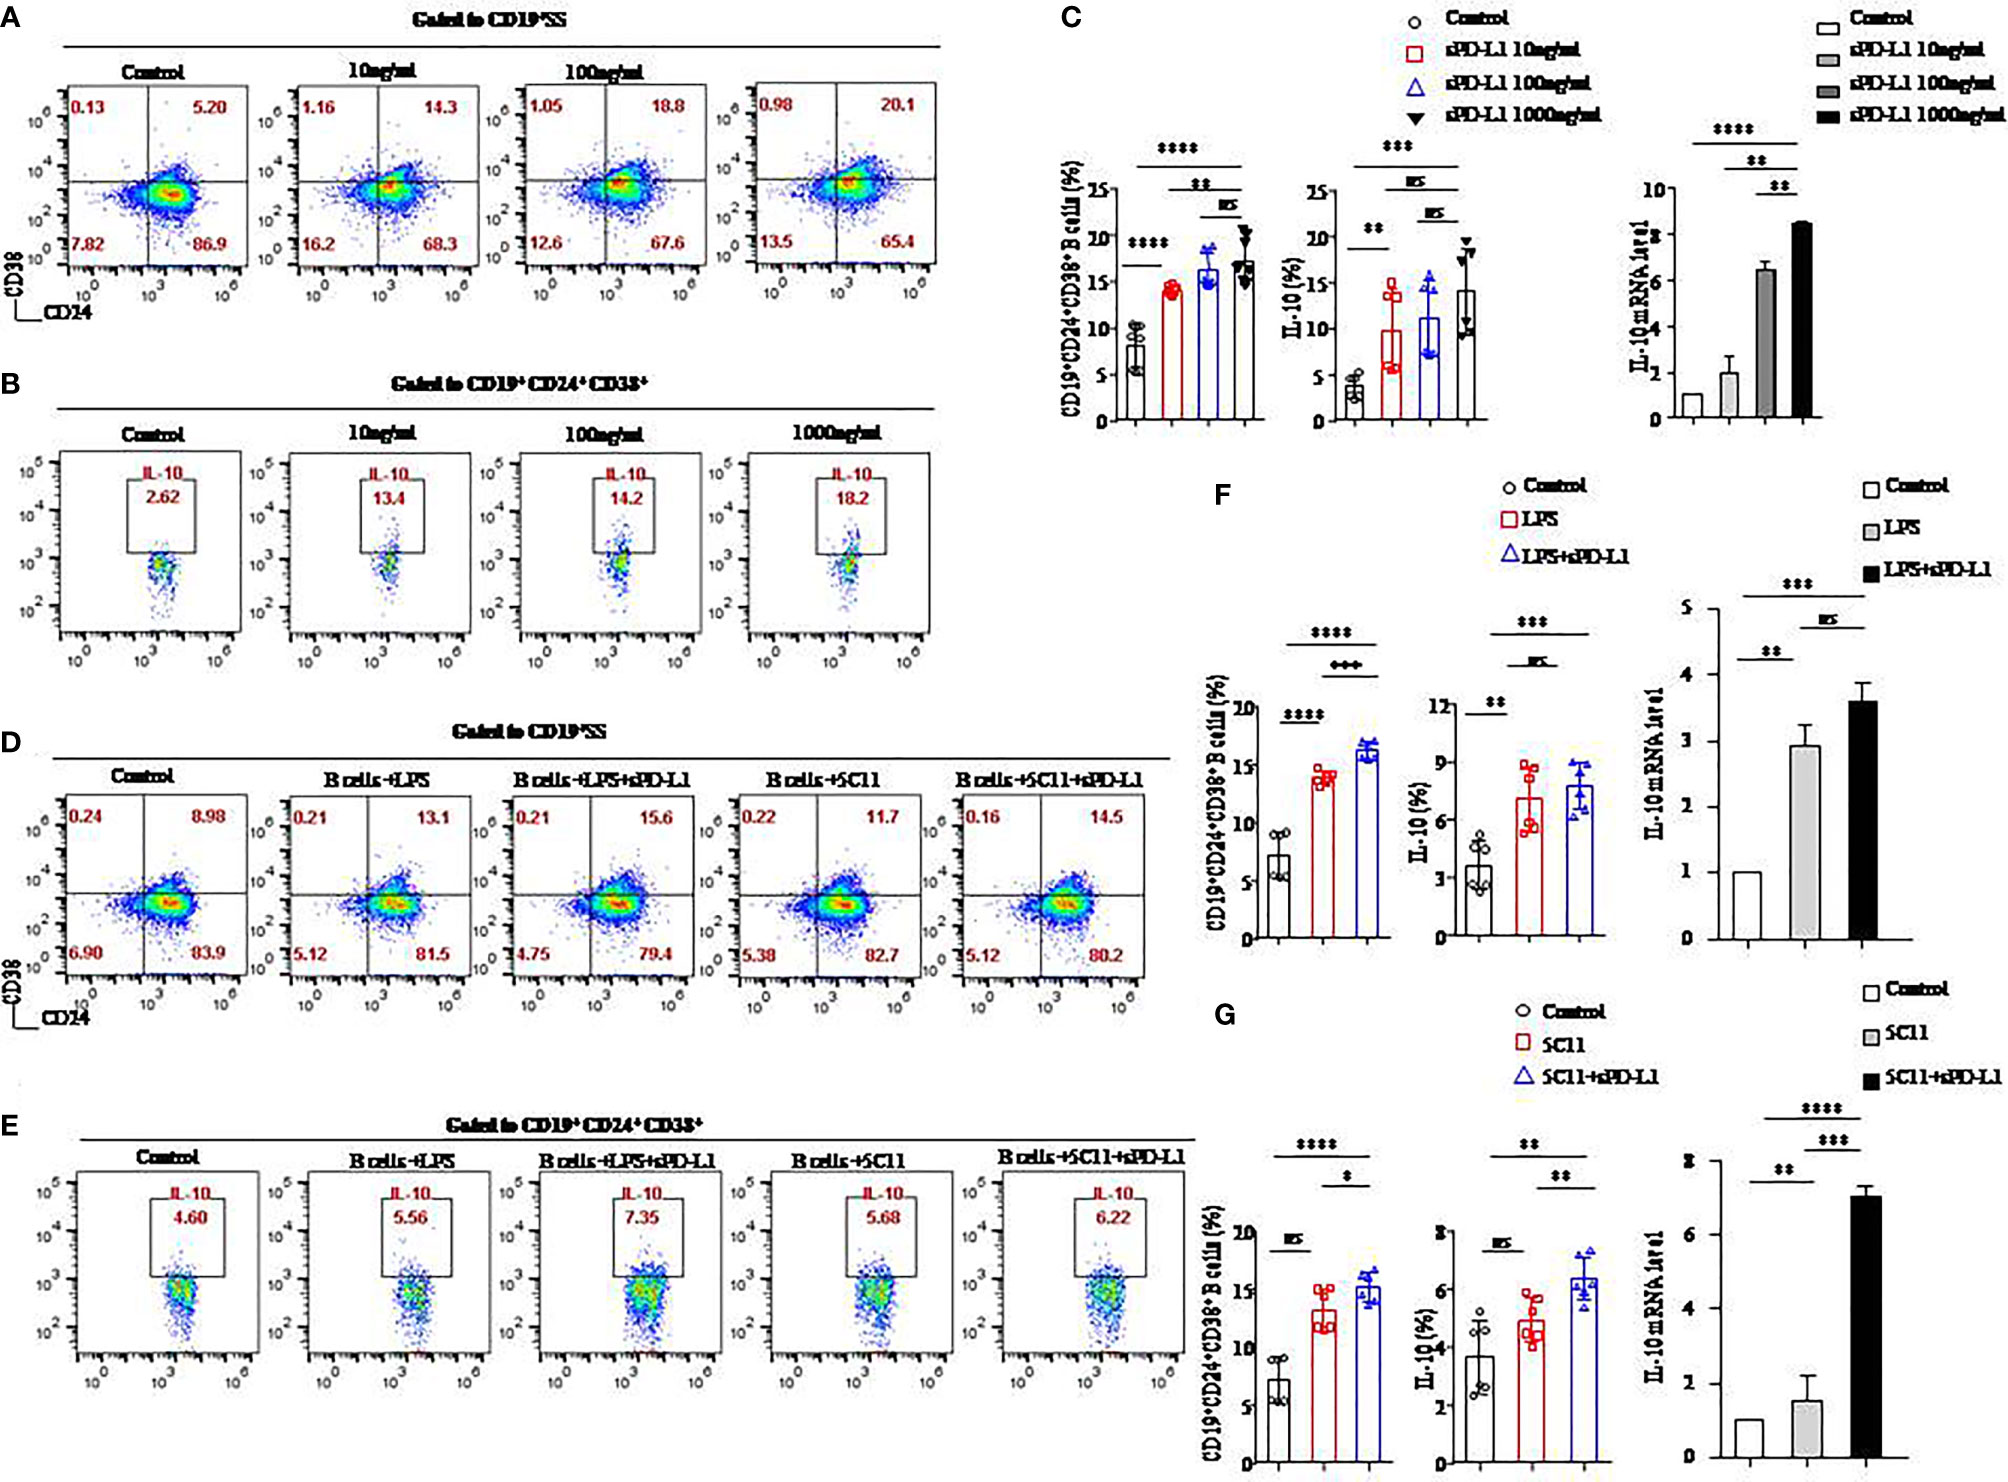
Figure 3 sPD-L1 mediated the differentiation of CD19+ B cells into CD19+CD24+CD38+ Bregs. CD19+ B cells enriched from the peripheral blood of healthy individuals were treated with sPD-L1 at doses from 10, 100, to 1,000 ng/ml. After 2 days, CD19+ B cells were collected and measured by flow cytometry. Representative flow cytometry dot plot of CD24 and CD38 expression in total CD19+ B cells (A) and IL-10 secreted by CD19+CD38+CD24+ B cells (B). The proportion of CD19+CD38+CD24+ B cells (n = 6) and IL-10 secreted by CD19+CD38+CD24+ B cells (n = 6) was measured by flow cytometry (C). The expression of IL-10 mRNA induced by sPD-L1 (C). CD19+ B cells enriched from the peripheral blood of healthy individuals were activated with LPS, 5C11 (anti-CD40 Ab), or sPD-L1 individually or combinatorially, and flow cytometry dot plot of CD24 and CD38 expression in total CD19+ B cells (D) and IL-10 secreted by CD19+CD38+CD24+ B cells (E). The proportion of CD19+CD38+CD24+ B cells (n = 6) and IL-10 secreted by CD19+CD38+CD24+ B cells (n = 6) was measured by flow cytometry, and the expression of IL-10 mRNA induced by LPS or sPD-L1 individually or combinatorially was measured (F). The proportion of CD19+CD38+CD24+ B cells (n = 6) and IL-10 secreted by CD19+CD38+CD24+ B cells (n = 6) were measured by flow cytometry, and the expression of IL-10 mRNA was induced by 5C11 or sPD-L1 individually or combinatorially (G). Data represent the means ± SEM of at least three independent experiments and were analyzed by Student’s t test. ns, not statistically significant. *P <0.05, **P <0.01, *** P <0.001, and ****P <0.0001.
Because LPS and anti-CD40 antibody (5C11) are regarded as stimulators (20) of CD19+ B-cells activation, we further investigated the PD-1/PD-L1 axis on B cells activated by LPS or 5C11 combined with sPD-L1 and evaluated the percentage of CD19+CD24+CD38+ B cells (Figure 3D), IL-10 (Figure 3E) secreted by CD19+CD24+CD38+ B cells, and IL-10 mRNA levels (Figures 3F, G) in total CD19+ B cells. The percentage of CD19+CD24+CD38+ B cells, IL-10 secretion, and IL-10 mRNA levels was significantly increased compared to those in the control group in the LPS-activated incubation system with or without sPD-L1 (P < 0.05 for all; Figure 3F). Although the percentage and absolute number of CD19+CD24+CD38+ B cells were significantly different between the LPS group and the LPS combined with the sPD-L1 group (P = 0.0001; Figure 3F) (P = 0.004; Supplemental Figure 2B), the percentage of IL-10 secretion, IL-10 mRNA levels, and the absolute number of IL-10+ B cells was not significantly different between them (P = 0.426 and P = 0.199, respectively; Figure 3F) (P = 0.190; Supplemental Figure 2B). The highest levels of CD19+CD24+CD38+ B cells and IL-10 secretion and IL-10 mRNA were found in 5C11 combined with sPD-L1 compared to 5C11 alone or not (P<0.05 for all; Figure 3G). Although the percentage of IL-10 secretion was higher in 5C11 combined with the sPD-L1 group than in the 5C11 alone group (P=0.009, Figure 3G), the absolute number of CD19+CD24+CD38+ B cells and IL-10 secretion was not significantly different between the two groups (P = 0.807 and P = 0.899, respectively, Supplemental Figure 2C).
We speculated that sPD-L1 in the serum of IBCa patients will lead to CD19+CD24+CD38+ B-cell promotion and IL-10 secretion and that CD40 signaling might enhance the effects on B-cell differentiation.
To investigate whether sPD-L1 influences the development of Tregs, we cultured CD19+ B cells stimulated by LPS or sPD-L1 with CD4+ T cells collected from allogeneic or autologous healthy individuals. We detected the percentages of CD4+CD25+CD127− T cells (Figure 4A) and Foxp3 on CD4+CD25+ T cells (Figure 4C) in the coincubation system.
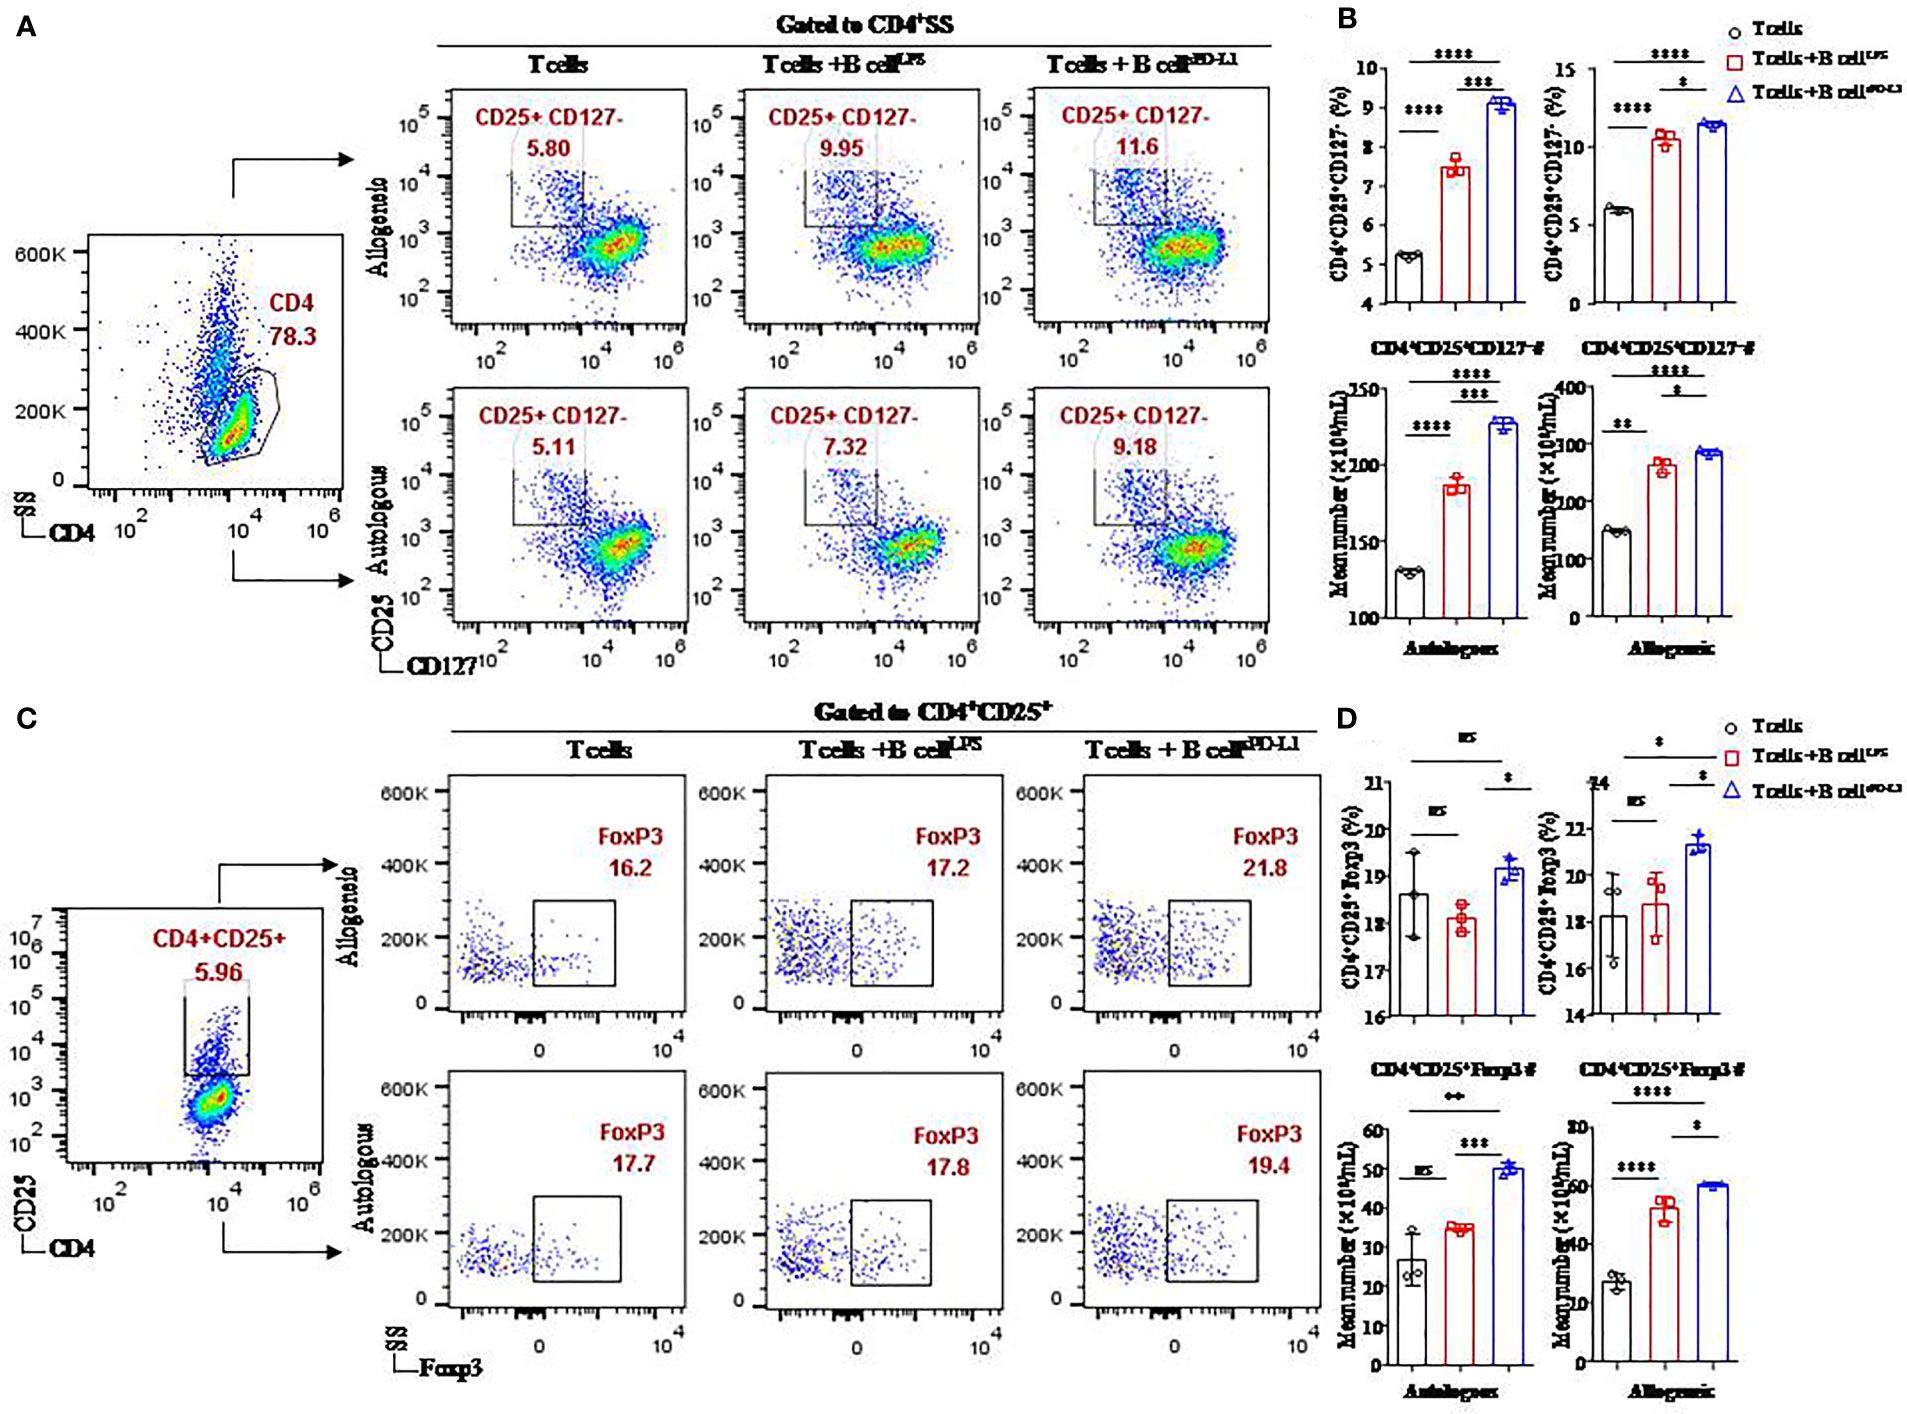
Figure 4 Function of CD19+ B cells stimulated by sPD-L1 in a T/B lymphocyte coculture system. Representative flow cytometry dot plot of CD25+CD127− expression in total CD4+ T cells (A) and Foxp3 expression in CD4+ CD25+ T cells (C) from autologous or allogeneic healthy individuals cocultured with CD19+ B cells pretreated with LPS or sPD-L1. The proportion and the absolute number of CD4+CD25+CD127− T cells (n = 3) were measured by flow cytometry (B), and the proportion and the absolute number of Foxp3 expression in CD4+CD25+ T cells (n = 3) were measured by flow cytometry (D) in the B/T lymphocyte coculture system. Data represent the means ± SEM of at least three independent experiments and were analyzed by Student’s t-test. ns, not statistically significant. *P <0.05, **P <0.01, ***P <0.001, and ****P <0.0001.
Higher levels of CD4+CD25+CD127− T cells (11.43 ± 0.21% or 9.08 ± 0.15%, respectively) were found in CD4+ T cells originating from either allogeneic or autologous healthy individuals cultured with CD19+ B cells pretreated with sPD-L1 (CD19+ B-cellsPD-L1) compared to the CD19+ B-cellLPS group (10.48 ± 0.46% or 7.47 ± 0.22%, respectively) (P = 0.0005, P = 0.032, respectively; Figure 4B) and the control group (5.97 ± 0.19% or 5.21 ± 0.09%, respectively) (P < 0.0001, P < 0.0001, respectively; Figure 4B). Meanwhile, the absolute number of CD4+CD25+CD127− T cells was highest in the CD19+ B-cellsPD-L1 group among the coincubation groups regardless of whether CD4+ T cells were from allogeneic or autologous healthy individuals (P < 0.05 for all; Figure 4B).
Foxp3, a transcription factor of Tregs, was detected in the coincubation system (Figure 4C). The results indicated that the expression of Foxp3 was higher in the CD19+ B-cellsPD-L1 group, in which CD4+ T cells were obtained from allogeneic individuals, than in the CD19+ B-cellLPS group (23.33 ± 0.42% vs. 18.77 ± 1.37%, P = 0.036; Figure 4D) or the control group (23.33 ± 0.42% vs. 18.27 ± 1.79%, P = 0.045; Figure 4D). Similarly, the absolute number of CD4+CD25+ Foxp3+ T cells was also highest in the CD19+ B-cellsPD-L1 group among the three groups (Figure 4D).
We observed that the expression of Foxp3 on CD4+CD25+ T cells in the CD19+ B-cellsPD-L1 group was higher than that in the CD19+ B-cellLPS group with CD4+ T cells originating from autologous individuals (19.13 ± 0.25% vs. 18.10 ± 0.30%, P = 0.010; Figure 4D), but no significant difference was observed between the CD19+ B-cellsPD-L1 group and the control group (19.13 ± 0.25% vs. 18.60 ± 0.90%, P = 0.379; Figure 4D). Moreover, the absolute number of CD4+CD25+Foxp3+ T cells in the CD19+ B-cellsPD-L1 group was significantly higher than those in the CD19+ B-cellLPS and control groups (P = 0.032, P < 0.0001, respectively) (Figure 4D).
Together, these results suggested that sPD-L1 played a critical role in regulating Tregs induction via CD19+ B cells.
As in our previous studies (5), MDA-MB231 (PD-L1hi BC), a TNBC breast cancer cell line, expressed high level of PD-L1 (Supplemental Figure 1A). More importantly, the soluble form of PD-L1 on PD-L1hi BC was reported in our previous research (21). To investigate the function of sPD-L1 from MDA-MB231 on the differentiation of CD19+ B cells, we established MDA-MB231 cells incubated with CD19+ B cells activated by LPS in DR or IDR conditions compared to PD-L1–deficient MCF-7 breast cancer cells (PD-L1lo BC) (Supplemental Figure 1A) (Figure 5A).
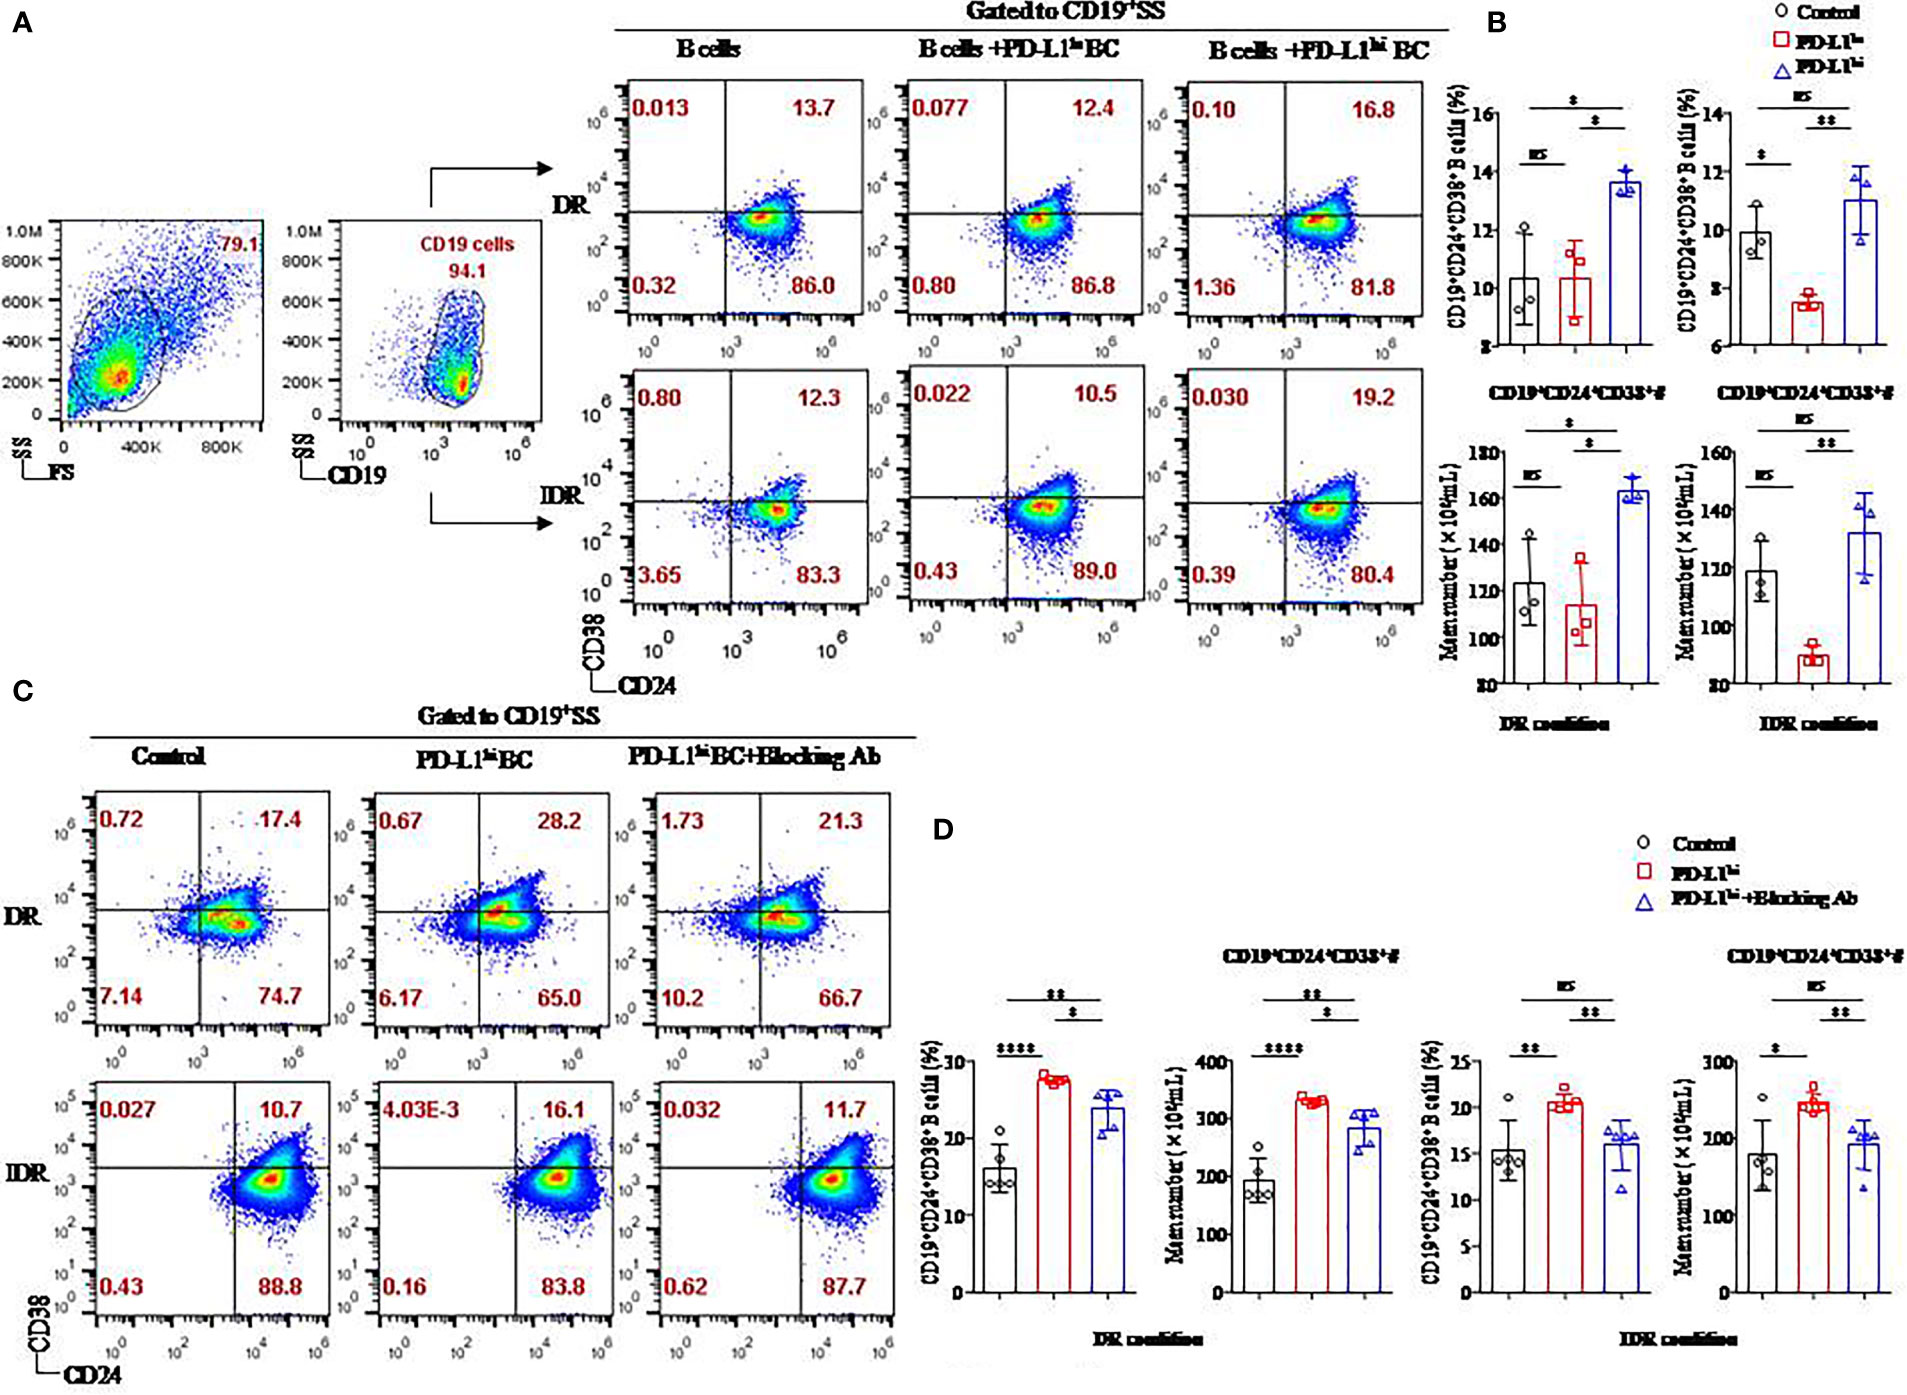
Figure 5 The soluble form of PD-L1 originating from a breast cancer cell line induced CD19+CD24+CD38+ Bregs in coculture systems. Representative flow cytometry dot plot of CD24 and CD38 expression in total CD19+ B cells cultured with PD-L1hi MDA-MB231 cells or PD-L1lo MCF-7 cells in DR or IDR conditions (A). The percentages and the absolute number of CD19+CD38+CD24+ B cells were detected in the culture systems with PD-L1hi MDA-MB231 cells or PD-L1lo MCF-7 cells in DR (n = 3) or IDR (n = 3) conditions (B). Representative flow cytometry dot plot of CD24 and CD38 expression in total CD19+ B cells cultured with PD-L1hi MDA-MB231 with or without PD-L1–blocking antibody treatment in DR or IDR conditions (C). The percentages and the absolute number of CD19+CD38+CD24+ B cells were detected in DR (n = 5) or IDR (n = 5) conditions with PD-L1hi MDA-MB231 cells pretreated with or without PD-L1–blocking antibody (D). Data represent the means ± SEM of at least three independent experiments and were analyzed by Student’s t-test. ns, not statistically significant. *P <0.05, **P <0.01, and ****P <0.0001.
Similar to our previous studies, both a higher percentage and absolute number of CD19+CD24+CD38+ B cells were found in the CD19+ B cells cultured with PD-L1hi BC cells than in the CD19+ B cells cultured with PD-L1lo BC cells or control cells under DR conditions (P < 0.05 for all; Figure 5B). The average frequency and absolute number of CD19+CD24+CD38+ B cells in the PD-L1hi BC group were higher than those in the PD-L1lo BC group under IDR conditions (P = 0.008, P = 0.007, respectively; Figure 5B). Although the percentage and absolute number of CD19+CD24+CD38+ B cells in the PD-L1hi BC group were higher than those in the control group under IDR culture condition, no significant difference was observed between the PD-L1hi BC group and the control group (P = 0.268 and P = 0.269, respectively; Figure 5B).
To confirm whether the induction of CD19+CD24+CD38+ Bregs was due to PD-L1, we blocked the expression of PD-L1 in MDA-MB231 cells by using a specific anti–PD-L1 blocking antibody (Supplemental Figure 1B). PD-L1hi MDA-MB231 cells with PD-L1 blockade were then cocultured with activated CD19+ B cells under DR or IDR conditions (Figure 5C). The percentage and absolute number of CD19+CD24+CD38+ Bregs were reduced in the PD-L1hi BC blockade group compared to the PD-L1hi BC and control groups under DR or IDR culture conditions (P < 0.05 for all; Figure 5D).
These results demonstrated that sPD-L1 from MDA-MB231 cells mediated the differentiation of CD19+ B cells in the coculture system, which could be reduced by an anti-human PD-L1 blocking antibody.
In our present study, sPD-L1 played an important role in mediating the differentiation of CD19+ B cells and promotion of Tregs. We analyzed the influence of sPD-L1 on the survival of PD-L1hi MDA-MB231 in a T-/B-cell/tumor coculture system with CD19+ B cells activated by LPS or sPD-L1 (Figure 6A) and further investigated PD-L1 signal blockade for immunotherapy in PD-L1hi MDA-MB231, a breast cancer cell line of TNBC (Figure 6C).
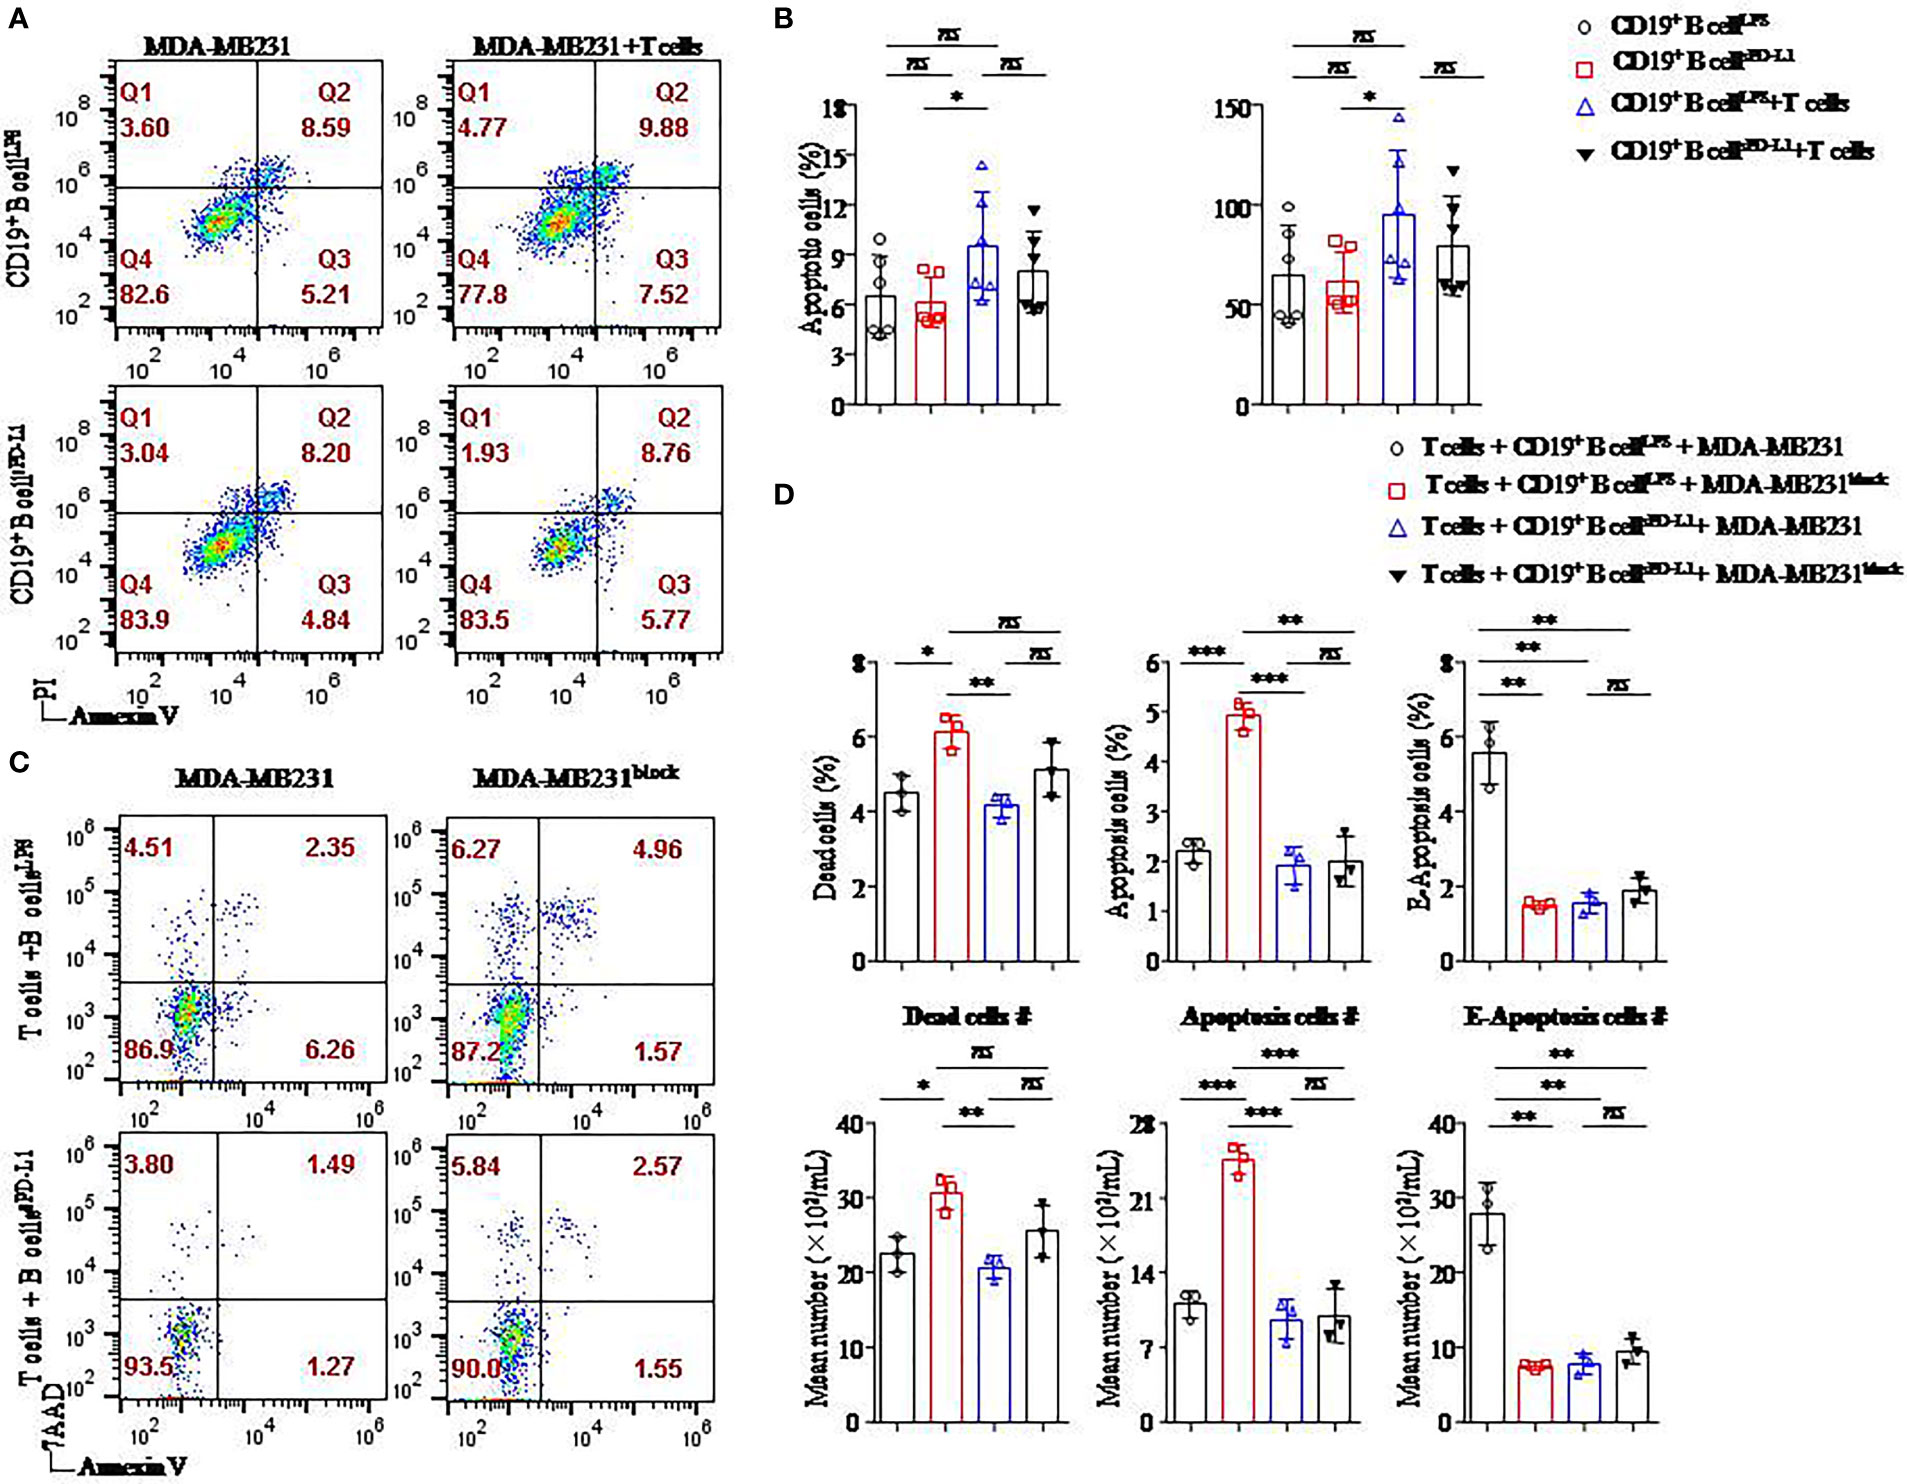
Figure 6 Breast cancer cell apoptosis was induced when the PD-L1 signal was blocked. Representative flow cytometry dot plot of apoptosis of PD-L1hi MDA-MB231 cells cultured with CD4+ T cells and CD19+ B cells pretreated with LPS or sPD-L1 (A). The percentage and absolute number of apoptotic cells were detected in PD-L1hi MDA-MB231 cells (n = 6) cultured with CD19+ B cells pretreated with LPS or sPD-L1 with or without CD4+ T cells (B). Representative flow cytometry dot plot of death, apoptosis, and E-apoptosis of PD-L1hi MDA-MB231 cells with or without PD-L1–blocking antibody treatment in the culture system including CD4+ T cells and B cells pretreated with LPS or sPD-L1 (C). The percentage and the absolute number of dead, apoptotic, and E-apoptotic cells were detected in PD-L1hi MDA-MB231 cells (n = 3) cultured with CD4+ T cells and CD19+ B cells pretreated with LPS or sPD-L1 with or without PD-L1–blocking antibody treatment (D). Data represent means ± SEM of at least three independent experiments and were analyzed by unpaired Student’s t-test. ns, not statistically significant. *P <0.05, **P <0.01, and ***P <0.001.
The highest percentage and absolute number of apoptotic cells were detected on MB-MDA231 cells in T-/B-cell/tumor coculture systems in which CD19+ B cells were stimulated by LPS among the other groups, and the percentages of apoptotic cells were decreased in the coculture experiment in which CD19+ B cells were stimulated by sPD-L1 (Figure 6B). Whether CD19+ B cells were pretreated with LPS or sPD-L1, the percentage and absolute number of apoptotic cells were not significantly different in the coculture system without CD4+ T cells (P > 0.05 for all; Figure 6B). This result indicated that CD19+ B cells mediated the antitumor immune response via CD4+ T cells.
Furthermore, we detected the death of MB-MDA231 cells in the T-/B-cell coculture system, whereas the PD-L1 signal was blocked by a specific antibody or not (Figure 6C). Compared to CD19+ B cells stimulated by LPS or sPD-L1 alone, the percentage and absolute numbers of dead and apoptotic cells increased significantly in the group in which CD19+ B cells were stimulated by LPS with PD-L1 signal blockade (P < 0.05 for all; Figure 6D). Meanwhile, the percentages of dead, apoptotic, and early apoptotic cells were the lowest in the group with CD19+ B cells stimulated by sPD-L1 and recruited when the PD-L1 signal was blocked by the anti–PD-L1 antibody, but no significant difference was detected (P > 0.05 for all; Figure 6D). Moreover, the percentage of early apoptotic cells was the highest in the group in which CD19+ B cells were stimulated by LPS compared to the other groups (P < 0.05 for all; Figure 6D).
We speculated that CD19+ B cells stimulated by LPS played an important role in the antitumor immunity of CD4+ T cells and that PD-L1 signal blockade might enhance the effects on PD-L1hi BC.
Bregs are a novel subset of B cells derived from various B-cell progenitors (5, 22). They show a characteristic expression pattern of CD24, CD38, CD5, CD1d, CD27, and PD-L1 (5, 23–25). Indeed, they can negatively regulate T-cell immune responses to maintain self-tolerance and prevent autoimmunity by secreting anti-inflammatory mediators such as IL-10, IL-35, and transforming growth factor β (TGF-β) (24). IL-10 production has been identified for the function of Bregs (24). In our previous studies, we identified a high percentage of CD19+CD24+CD38+ Bregs in the tumor microenvironment (TME) and peripheral blood of IBCa patients (5, 23). More importantly, we found that the percentage of CD19+CD24+CD38+ Bregs with high levels of IL-10 secretion was positively correlated with Tregs in the peripheral blood of IBCa patients (23).
In the present study, we found that PD-1 expression on CD19+CD24+CD38+ Bregs in PBMCs of IBCa patients was higher than that of FIBma patients. Moreover, a higher level of sPD-L1, a soluble form of PD-L1, was found in the serum of IBCa patients compared with FIBma patients. Additionally, a tight positive correlation was found between serum levels of sPD-L1 and IL-10, as well as between sPD-L1 levels and the percentage of PD-1+CD19+CD24+CD38+ Bregs among PBMCs in IBCa patients. PD-1hi Bregs mediated the reduction and dysfunction of CD8+ T cells in the human hepatocellular carcinoma (26).
Based on the positive correlation between sPD-L1 level and the percentage of PD-1+CD19+CD24+CD38+ Bregs, we further investigated the function of sPD-L1 in the serum of breast cancer patients. Although several functions of sPD-L1 in the TME of advanced pancreatic cancer, hepatocellular carcinoma, and breast cancer have been explored (16, 17), the involvement of sPD-L1 in B-cell differentiation has not been clarified, except for several previous studies showing that sPD-L1 is associated with prognostic prediction and responses to immunotherapies (15, 17). Our findings confirmed that the percentage of CD19+CD24+CD38+ Bregs was markedly increased in a dose-dependent manner by sPD-L1 induction compared with the control. In addition, sPD-L1 treatment also dose-dependently enhanced the secretion of IL-10 by Bregs. Furthermore, we demonstrated that the soluble form of PD-L1, which was found in PD-L1hi MDA-MB231 cells in our previous research (21), could increase the proportion of CD19+CD24+CD38+ Bregs. This effect of sPD-L1 could be inhibited by a specific PD-L1–blocking antibody (Ab). Based on these findings, we hypothesize that sPD-L1 from breast cancer cells actively promotes the differentiation of B cells into Bregs and suppresses antitumor activity both the local TME and the circulation of IBCa patients.
PD-L1, a 40-kDa type I transmembrane protein belonging to the B7 family, is expressed on the surfaces of both immune cells and non-immune cells, such as T cells, B cells, dendritic cells (DCs), macrophages, Tregs, and several types of tumors cells (8). PD-1, a receptor of PD-L1, is an Ig superfamily member expressed on activated T cells and B cells, among others (11). Both PD-L1 and PD-1 are regarded as immune checkpoints, and the interaction between them can inhibit both proliferation and cytokine production by Teffs (9).
Wang et al. previously identified a new subset of B cells expressing PD-1 that could inhibit the functions of CD4+ T cells and CD8+ T cells in differentiated thyroid cancer (26). Xiao et al. demonstrated that this subset of PD-1+ B cells could significantly suppress the response of tumor-specific T cells and enhanced tumor growth via IL-10 in advanced hepatocellular carcinoma (22). In our previous studies, we also observed elevated percentages of CD4+CD25+CD127− Tregs in the peripheral blood of IBCa patients compared with FIBma patients or healthy individuals and a positive correlation between Tregs and CD19+CD24+CD38+ Bregs in IBCa patients. Furthermore, we found that PD-L1 exhibited high expression on Bregs in IBCa patients and that its expression was positively correlated with the proportion of Tregs but negatively correlated with that of PD-1hi Teffs (23).
Tregs, a subset of CD4+ T cells, stably express Foxp3 and CD25, but exhibit no CD127 expression (27). CD4+CD25+CD127− Tregs or CD4+CD25+ Foxp3+ Tregs can inhibit Teff activation and induce Teff apoptosis to maintain peripheral tolerance and immune homeostasis (28, 29). Several studies have also revealed that Tregs play critical roles in regulating antitumor immune suppression and tumor immune escape, metastasis, and relapse (28, 30). In this study, we further investigated and confirmed the immunosuppressive functions of Bregs derived from CD19+ B cells stimulated by sPD-L1 on CD4+ T-cell polarization and differentiation in vitro. We observed that CD19+ B cells pretreated with sPD-L1 could transformed CD4+ T cells originating from allogeneic or autologous sources into CD4+CD25+CD127− Tregs. Meanwhile, Foxp3, a transcription factor expressed specifically in Tregs, was upregulated by sPD-L1 stimulation in the experiments. Tadmor et al. also observed increased Tregs expansion in the spleen, tumor-draining lymph nodes, and tumor beds of wild-type murine tumor model compared with their B-cell–deficient counterparts (31). Flores-Borja and colleagues confirmed that depletion of Bregs favored the activation of T cells and promoted their effector function (32).
Bregs could induce Tregs in vitro (5), and the tumor-evoked Bregs could promote lung metastases in a mouse 4T1 model (33). Lee-Chang et al. revealed local intratumoral depletion of Bregs resulted in improved survival in a murine tumor model (34). PD-L1 signaling can also maintain the expression of Foxp3 during Treg development (33). Based on these finding, we hypothesized that sPD-L1 from breast cancer could increase the proportion of Bregs and IL-10 secretion and induce Treg differentiation and Teff exhaustion (Figure 7).
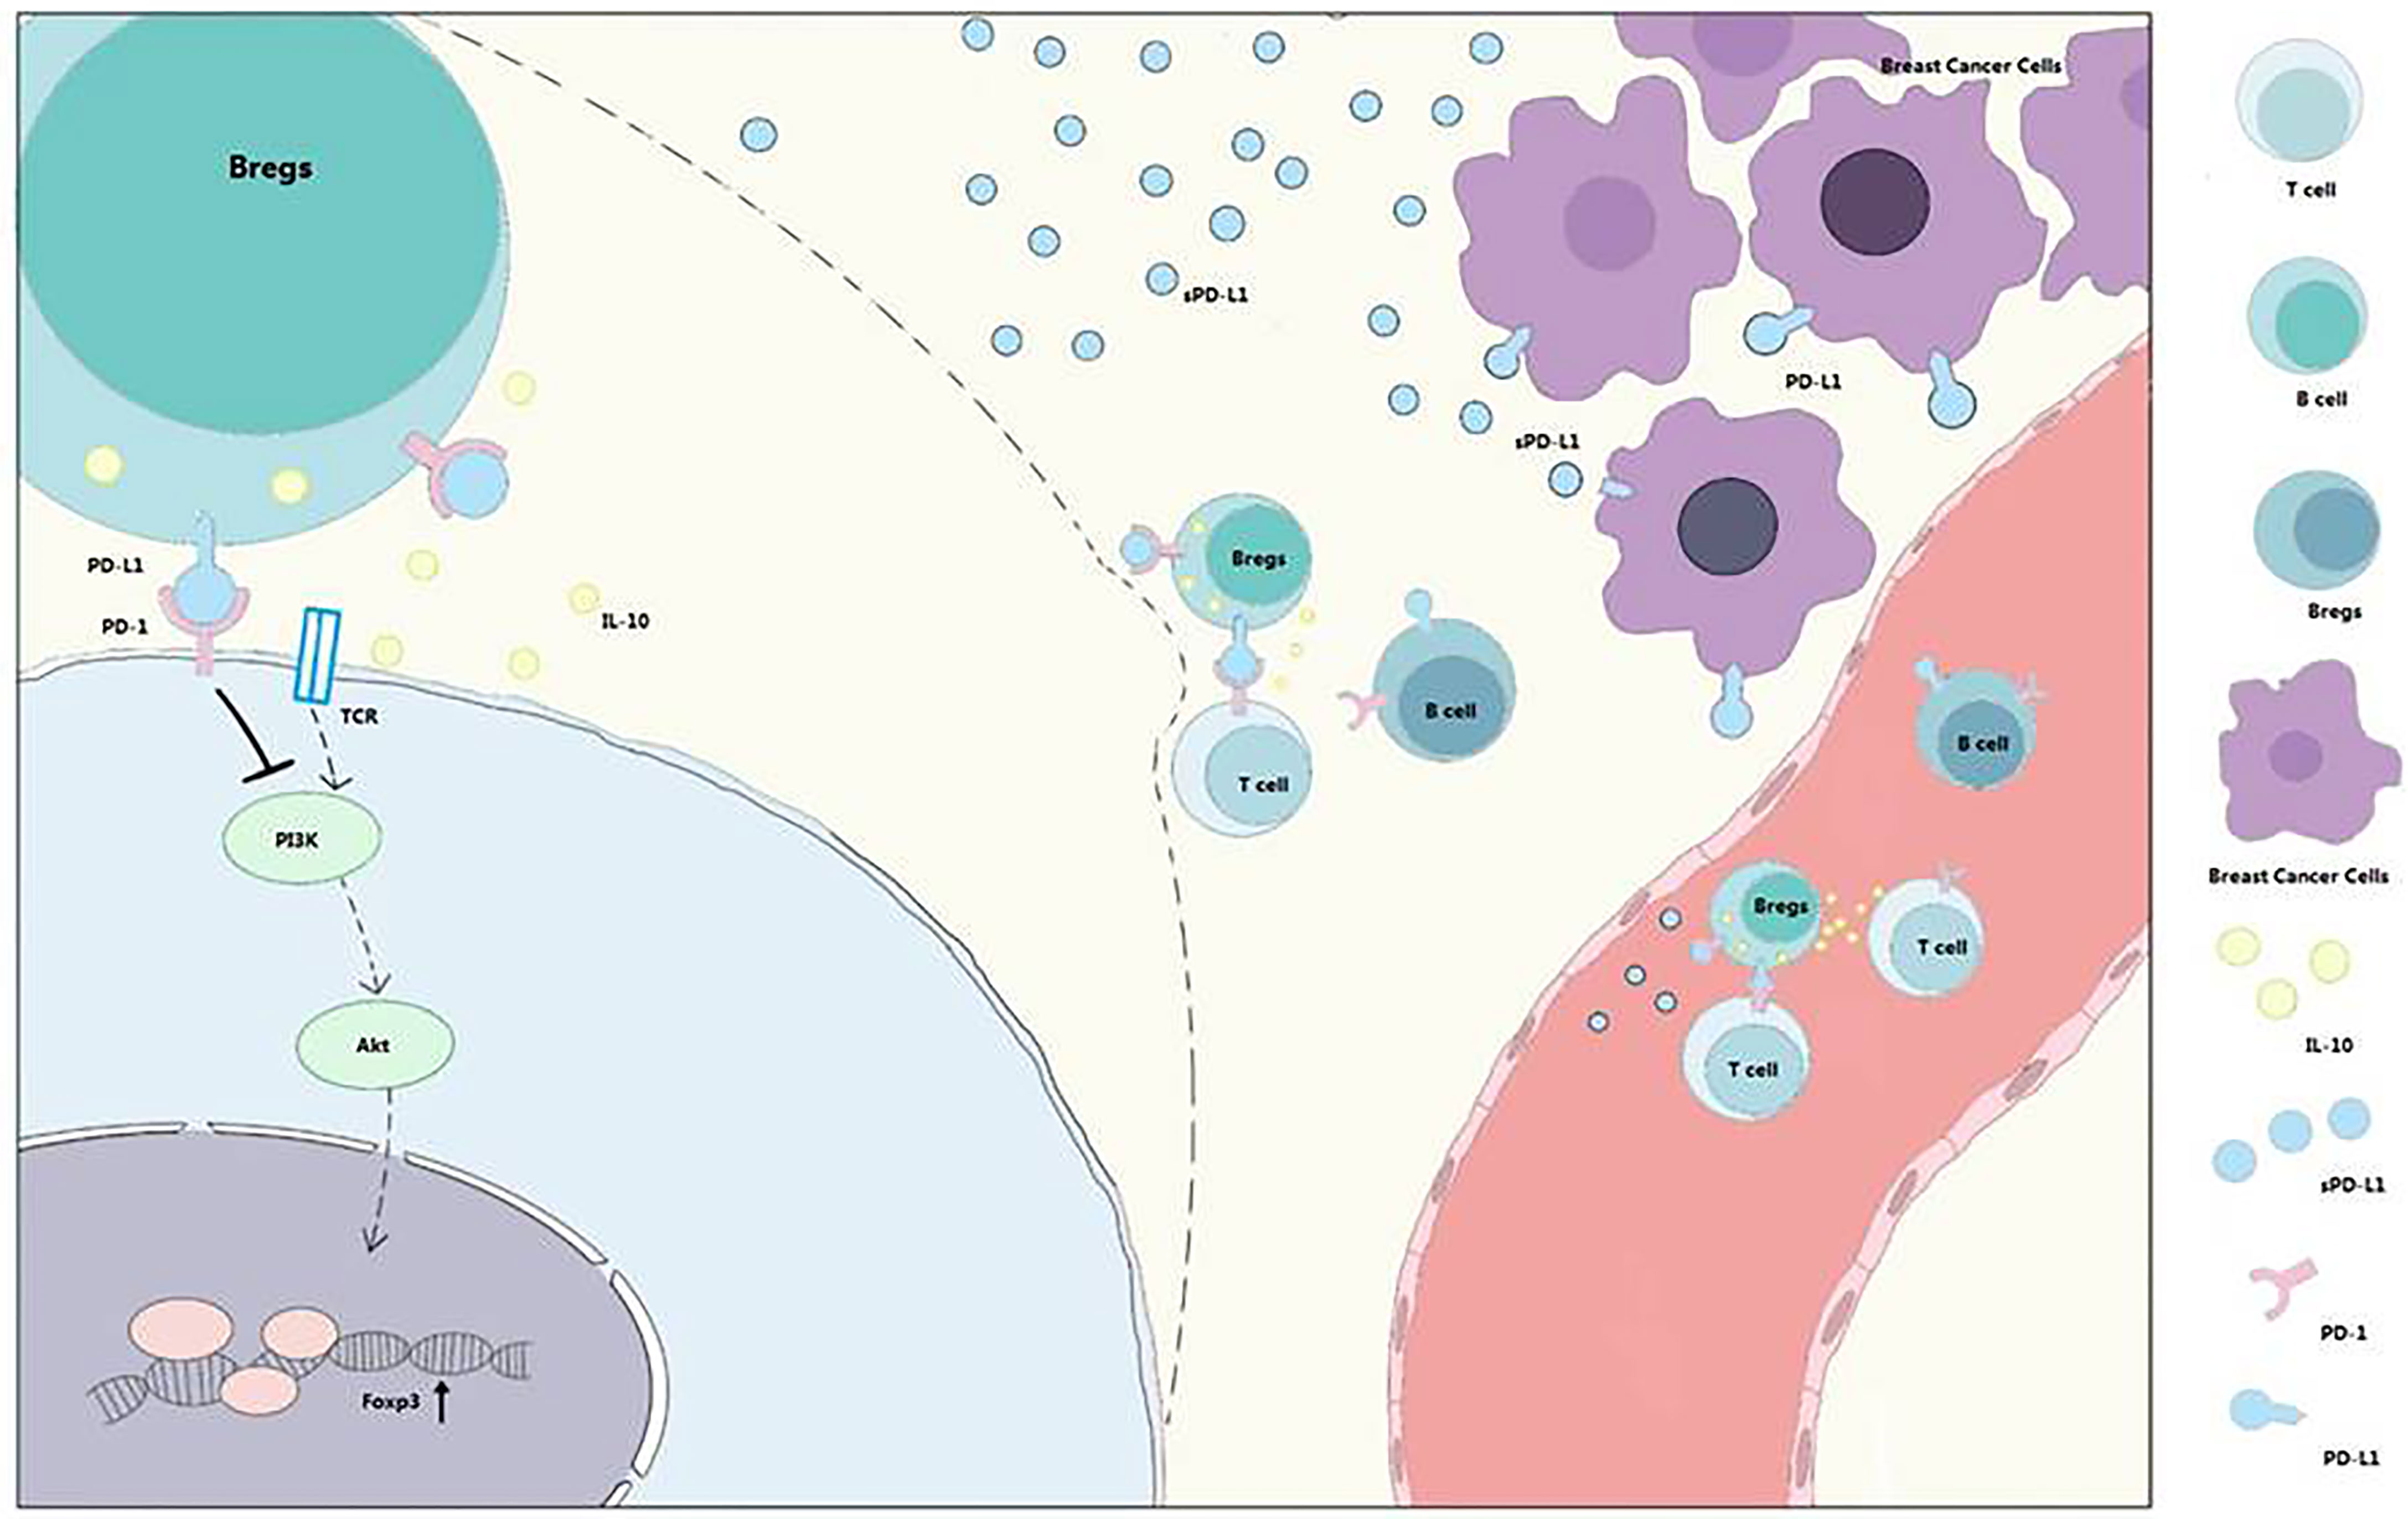
Figure 7 PD-1/PD-L1 signaling in Bregs differentiation and function. Bregs differentiation occurs in the TME or immune system of patients with breast cancer. sPD-L1 from breast cancer could upregulate the expression of CD24 and CD38 on CD19+ B cells and promote IL-10 secretion from CD24+CD38+CD19+ Bregs. With the interaction of B cells and T cells, PD-1/PD-L1 signaling contributes to Tregs promotion and effector T-cell (Teff) exhaustion. Meanwhile, sPD-L1 is also released into blood to further interact with CD19+ B cells and promotes differentiation and promotion of Bregs and Tregs.
Recently, Gallego-Valle et al. reported that combinatory CD40 ligand (CD40L) and bacteria-derived oligodeoxynucleotides (CpG-ODNs) could significantly induce the differentiation of B cells into functional Breg-like cells (35). Similarly, we observed that the proportion and the absolute number of CD19+CD24+CD38+ Bregs were increased in cells stimulated with CD40 agonist Abs and LPS alone or in combination with sPD-L1.
Therefore, we performed activated CD4+ T-cell/CD19+ B-cell/tumor cell coculture experiments to investigate the potential function of Bregs or sPD-L1 for immunotherapy. We observed higher percentages and absolute numbers of apoptotic MB-MDA231 cells in the coculture systems in which CD19+ B cells were activated and reduced percentages of apoptotic breast cancer cells in the coculture systems in which the CD19+ B cells were pretreated with sPD-L1. Furthermore, our finding demonstrated that the percentages and absolute numbers of dead and apoptotic PD-L1hi MDA-MB231 cells increased significantly when the PD-L1 signal was blocked by antagonist antibody in the coculture system.
CD40 is a key costimulatory molecule belonging to the tumor necrosis factor receptor (TNFR) superfamily expressed on the surfaces of B cells, DCs, macrophages, and non-immune cells (36). The ligand for CD40 is CD40L, which is a member of the TNF superfamily (TNFSF) (37). CD40L is expressed on a variety of activated cell types, including activated CD4+ T cells, activated natural killer cells, memory CD8+ T cells, and activated platelets (36, 37). The CD40/CD40L interaction between T cells and B cells is necessary for T-cell activation, as well as for activation, differentiation, and proliferation of B cells (36). Together, these studies demonstrate the prospect of using a CD40 agonist strategy in patients for cancer therapy (36). Nonetheless, the proportion and function of Bregs induced by CD40 agonist alone or combining with sPD-L1 in antitumor action cannot be ignored. Therefore, treatment combining CD40 agonist and PD-L1 or PD-1 antagonist Abs might be more efficient and favor antitumor immunity (38, 39).
Breast cancer is the most commonly diagnosed cancer in females, and the survival rate of breast cancer patients has been increased over the past decade for targeted therapies (1), including tamoxifen for patients with luminal A and luminal B subtypes of IBCa (40) and trastuzumab for HER2-positive IBCa patients (41, 42). However, there are currently no effective therapeutic targets for TNBC patients (negative for ER, PR, and HER2) (1). In the present study, we observed that the percentages of Bregs and PD-1+ Bregs in TNBC patients were the highest among patients with different breast cancer subtypes. Furthermore, we confirmed that sPD-L1 alone or combined with LPS or CD40 agonist Ab could induce Bregs expansion to inhibit the antitumor response. Our study reveals that the levels of sPD-L1 or IL-10 in the serum or PD-1+ Bregs in the PBMCs of breast cancer patients might be predictors for immunotherapy, and combination PD-L1 antagonist and CD40 agonist Abs might be a more efficient immunotherapy for TNBC.
Publicly available datasets were analyzed in this study. This data can be found here: https://www.ncbi.nlm.nih.gov/nuccore/NM_000572.3 and https://www.ncbi.nlm.nih.gov/nucleotide/NM_001101.5?report=genbank&;log$=nuclalign&blast_rank=2&RID=X2V0UP33013.
The studies involving human participants were reviewed and approved by the ethics committee of the medical college of Soochow University, approval number ECSU-201600011. The patients/participants provided their written informed consent to participate in this study.
XL, HD, SZ, QW, and FX designed and performed most of the in vitro experiments. XL, QW, and FX wrote the manuscript. XL, HD, SZ, and LP performed the experiments. SZ, WL, ZW, JL, and YW collected samples and performed experiments. XL, HD, QQ, SW, YY, and FX analyzed all of the data. QW and FX designed and analyzed the study. All authors contributed to the article and approved the submitted version.
This study was funded in part by the National Natural Science Foundation of China (NSFC 81372343, 81772809 and 82073374), the Key University Science Research Project of Jiangsu Province (20KJA180002), and the Priority Academic Program Development of Jiangsu Higher Education Institutions (PAPD).
The authors declare that the research was conducted in the absence of any commercial or financial relationships that could be construed as a potential conflict of interest.
All claims expressed in this article are solely those of the authors and do not necessarily represent those of their affiliated organizations, or those of the publisher, the editors and the reviewers. Any product that may be evaluated in this article, or claim that may be made by its manufacturer, is not guaranteed or endorsed by the publisher.
We thank Prof. Honggeng Guan for his kind support.
The Supplementary Material for this article can be found online at: https://www.frontiersin.org/articles/10.3389/fimmu.2022.830606/full#supplementary-material
Supplementary Figure 1 | The pattern of PD-L1 in breast cancer and its inhibition by specific antibodies. The expression of PD-L1 and PD-1 in breast cancer cell lines was analyzed by flow cytometry. MDA-MB231 cells expressed high levels of PD-L1 (99.1%) compared with MCF-7 cells (11.3%) (A). To confirm the relationship between PD-L1 and CD19+ B cells, a PD-L1-blocking antibody was used to block the expression of PD-L1 at different dilutions (B). Data represent the mean and SEM of at least three independent experiments.
Supplementary Figure 2 | The absolute number of CD19+CD24+CD38+ B cells and IL-10+ B cells induced by sPD-L1. CD19+ B cells enriched from the peripheral blood of healthy individuals were treated with sPD-L1 at doses from 10 ng/mL, 100 ng/mL to 1000 ng/mL. After 2 days, CD19+ B cells were collected, and the absolute numbers of CD19+CD38+CD24+ B cells (n=6) and IL-10+ B cells on CD19+CD38+CD24+ B cells (n=6) were measured by flow cytometry (A). The absolute numbers of CD19+CD38+CD24+ B cells (n=6) and IL-10+ B cells on CD19+CD38+CD24+ B cells (n=6) were measured by flow cytometry induced by LPS or sPD-L1 individually or combinatorially (B). The absolute numbers of CD19+CD38+CD24+ B cells (n=6) and IL-10+ B cells on CD19+CD38+CD24+ B cells (n=6) were measured by flow cytometry induced by 5C11 or sPD-L1 individually or combinatorially (C). Data represent the mean ± SEM of at least three independent experiments and were analyzed by Student’s t test. ns, not statistically significant. *P <0.05, **P <0.01, ***P <0.001, and ****P <0.0001.
1. Waks AG, Winer EP. Breast cancer treatment: A review. JAMA (2019) 321(3):288–300. doi: 10.1001/jama.2018.19323
2. Jhan JR, Andrechek ER. Triple-negative breast cancer and the potential for targeted therapy. Pharmacogenomics (2017) 18(17):1595–609. doi: 10.2217/pgs-2017-0117
3. Dirix LY, Takacs I, Jerusalem G, Nikolinakos P, Arkenau HT, Forero-Torres A, et al. Avelumab, an anti-PD-L1 antibody, in patients with locally advanced or metastatic breast cancer: a phase 1b JAVELIN solid tumor study. Breast Cancer Res Treat (2018) 167(3):671–86. doi: 10.1007/s10549-017-4537-5
4. Mittendorf EA, Philips AV, Meric-Bernstam F, Qiao N, Wu Y, Harrington S, et al. PD-L1 expression in triple-negative breast cancer. Cancer Immunol Res (2014) 2(4):361–70. doi: 10.1158/2326-6066.CIR-13-0127
5. Guan H, Lan Y, Wan Y, Wang Q, Wang C, Xu L, et al. PD-L1 mediated the differentiation of tumor-infiltrating CD19(+) b lymphocytes and T cells in invasive breast cancer. Oncoimmunology (2016) 5(2):e1075112. doi: 10.1080/2162402X.2015.1075112
6. Kwapisz D. Pembrolizumab and atezolizumab in triple-negative breast cancer. Cancer Immunol Immunother CII (2021) 70(3):607–17. doi: 10.1007/s00262-020-02736-z
7. Narayan P, Wahby S, Gao JJ, Amiri-Kordestani L, Ibrahim A, Bloomquist E, et al. FDA Approval summary: Atezolizumab plus paclitaxel protein-bound for the treatment of patients with advanced or metastatic TNBC whose tumors express PD-L1. Clin Cancer Res Off J Am Assoc Cancer Res (2020) 26(10):2284–9. doi: 10.1158/1078-0432.CCR-19-3545
8. Khan AR, Hams E, Floudas A, Sparwasser T, Weaver CT, Fallon PG. PD-L1hi b cells are critical regulators of humoral immunity. Nat Commun (2015) 6:5997. doi: 10.1038/ncomms6997
9. Pardoll DM. The blockade of immune checkpoints in cancer immunotherapy. Nat Rev Cancer (2012) 12(4):252–64. doi: 10.1038/nrc3239
10. Fife BT, Pauken KE, Eagar TN, Obu T, Wu J, Tang Q, et al. Interactions between PD-1 and PD-L1 promote tolerance by blocking the TCR-induced stop signal. Nat Immunol (2009) 10(11):1185–92. doi: 10.1038/ni.1790
11. Patsoukis N, Sari D, Boussiotis VA. PD-1 inhibits T cell proliferation by upregulating p27 and p15 and suppressing Cdc25A. Cell Cycle (2012) 11(23):4305–9. doi: 10.4161/cc.22135
12. Zhou Q, Munger ME, Highfill SL, Tolar J, Weigel BJ, Riddle M, et al. Program death-1 signaling and regulatory T cells collaborate to resist the function of adoptively transferred cytotoxic T lymphocytes in advanced acute myeloid leukemia. Blood (2010) 116(14):2484–93. doi: 10.1182/blood-2010-03-275446
13. Bailly C, Thuru X, Quesnel B. Soluble programmed death ligand-1 (sPD-L1): A pool of circulating proteins implicated in health and diseases. Cancers (2021) 13(12):1–24. doi: 10.3390/cancers13123034
14. Li JW, Wei P, Guo Y, Shi D, Yu BH, Su YF, et al. Clinical significance of circulating exosomal PD-L1 and soluble PD-L1 in extranodal NK/T-cell lymphoma, nasal-type. Am J Cancer Res (2020) 10(12):4498–512.
15. Khan M, Zhao Z, Arooj S, Fu Y, Liao G. Soluble PD-1: Predictive, prognostic, and therapeutic value for cancer immunotherapy. Front Immunol (2020) 11:587460. doi: 10.3389/fimmu.2020.587460
16. Kruger S, Legenstein ML, Rosgen V, Haas M, Modest DP, Westphalen CB, et al. Serum levels of soluble programmed death protein 1 (sPD-1) and soluble programmed death ligand 1 (sPD-L1) in advanced pancreatic cancer. Oncoimmunology (2017) 6(5):e1310358. doi: 10.1080/2162402X.2017.1310358
17. Li Y, Cui X, Yang YJ, Chen QQ, Zhong L, Zhang T, et al. Serum sPD-1 and sPD-L1 as biomarkers for evaluating the efficacy of neoadjuvant chemotherapy in triple-negative breast cancer patients. Clin Breast Cancer (2019) 19(5):326–32.e1. doi: 10.1016/j.clbc.2019.03.008
18. Yazdanpanah P, Alavianmehr A, Ghaderi A, Monabati A, Montazer M, Tahmasbi K, et al. PD-L1 expression in tumor lesions and soluble PD-L1 serum levels in patients with breast cancer: TNBC versus TPBC. Breast Dis (2021) 40(1):43–50. doi: 10.3233/BD-201049
19. Zhou ZH, Wang JF, Wang YD, Qiu YH, Pan JZ, Xie W, et al. An agonist anti-human CD40 monoclonal antibody that induces dendritic cell formation and maturation and inhibits proliferation of a myeloma cell line. Hybridoma (1999) 18(6):471–8. doi: 10.1089/hyb.1999.18.471
20. Wang K, Tao L, Su J, Zhang Y, Zou B, Wang Y, et al. TLR4 supports the expansion of FasL(+)CD5(+)CD1d(hi) regulatory b cells, which decreases in contact hypersensitivity. Mol Immunol (2017) 87:188–99. doi: 10.1016/j.molimm.2017.04.016
21. Chen Y, Wang Q, Shi B, Xu P, Hu Z, Bai L, et al. Development of a sandwich ELISA for evaluating soluble PD-L1 (CD274) in human sera of different ages as well as supernatants of PD-L1+ cell lines. Cytokine (2011) 56(2):231–8. doi: 10.1016/j.cyto.2011.06.004
22. Xiao X, Lao XM, Chen MM, Liu RX, Wei Y, Ouyang FZ, et al. PD-1hi identifies a novel regulatory b-cell population in human hepatoma that promotes disease progression. Cancer Discov (2016) 6(5):546–59. doi: 10.1158/2159-8290.CD-15-1408
23. Guan H, Wan Y, Lan J, Wang Q, Wang Z, Li Y, et al. PD-L1 is a critical mediator of regulatory b cells and T cells in invasive breast cancer. Sci Rep (2016) 6:35651. doi: 10.1038/srep35651
24. Wang Z, Tan F. The blockade of PD-1/PD-L1 pathway promotes the apoptosis of CD19(+) CD25(+) bregs and suppresses the secretion of IL-10 in patients with allergic rhinitis. Scand J Immunol (2020) 91(2):e12836. doi: 10.1111/sji.12836
25. Wang L, Qiu J, Yu L, Hu X, Zhao P, Jiang Y. Increased numbers of CD5+CD19+CD1dhighIL-10+ bregs, CD4+Foxp3+ tregs, CD4+CXCR5+Foxp3+ follicular regulatory T (TFR) cells in CHB or CHC patients. J Trans Med (2014) 12:251. doi: 10.1186/s12967-014-0251-9
26. Wang X, Wang G, Wang Z, Liu B, Han N, Li J, et al. PD-1-expressing b cells suppress CD4(+) and CD8(+) T cells via PD-1/PD-L1-dependent pathway. Mol Immunol (2019) 109:20–6. doi: 10.1016/j.molimm.2019.02.009
27. El Andaloussi A, Lesniak MS. An increase in CD4+CD25+FOXP3+ regulatory T cells in tumor-infiltrating lymphocytes of human glioblastoma multiforme. Neuro-Oncology (2006) 8(3):234–43. doi: 10.1215/15228517-2006-006
28. Zou W. Regulatory T cells, tumour immunity and immunotherapy. Nat Rev Immunol (2006) 6(4):295–307. doi: 10.1038/nri1806
29. Tanoue T, Atarashi K, Honda K. Development and maintenance of intestinal regulatory T cells. Nat Rev Immunol (2016) 16(5):295–309. doi: 10.1038/nri.2016.36
30. Tanaka A, Sakaguchi S. Regulatory T cells in cancer immunotherapy. Cell Res (2017) 27(1):109–18. doi: 10.1038/cr.2016.151
31. Tadmor T, Zhang Y, Cho HM, Podack ER, Rosenblatt JD. The absence of b lymphocytes reduces the number and function of T-regulatory cells and enhances the anti-tumor response in a murine tumor model. Cancer Immunol Immunother CII (2011) 60(5):609–19. doi: 10.1007/s00262-011-0972-z
32. Flores-Borja F, Bosma A, Ng D, Reddy V, Ehrenstein MR, Isenberg DA, et al. CD19+CD24hiCD38hi b cells maintain regulatory T cells while limiting TH1 and TH17 differentiation. Sci Trans Med (2013) 5(173):173ra23. doi: 10.1126/scitranslmed.3005407
33. Francisco LM, Salinas VH, Brown KE, Vanguri VK, Freeman GJ, Kuchroo VK, et al. PD-L1 regulates the development, maintenance, and function of induced regulatory T cells. J Exp Med (2009) 206(13):3015–29. doi: 10.1084/jem.20090847
34. Lee-Chang C, Rashidi A, Miska J, Zhang P, Pituch KC, Hou D, et al. Myeloid-derived suppressive cells promote b cell-mediated immunosuppression via transfer of PD-L1 in glioblastoma. Cancer Immunol Res (2019) 7(12):1928–43. doi: 10.1158/2326-6066.CIR-19-0240
35. Gallego-Valle J, Perez-Fernandez VA, Correa-Rocha R, Pion M. Generation of human breg-like phenotype with regulatory function in vitro with bacteria-derived oligodeoxynucleotides. Int J Mol Sci (2018) 19(6):1–12. doi: 10.3390/ijms19061737
36. Tang T, Cheng X, Truong B, Sun L, Yang X, Wang H. Molecular basis and therapeutic implications of CD40/CD40L immune checkpoint. Pharmacol Ther (2021) 219:107709. doi: 10.1016/j.pharmthera.2020.107709
37. Beatty GL, Li Y, Long KB. Cancer immunotherapy: activating innate and adaptive immunity through CD40 agonists. Expert Rev Anticancer Ther (2017) 17(2):175–86. doi: 10.1080/14737140.2017.1270208
38. Pandey MS, Wang C, Umlauf S, Lin S. Simultaneous inhibition of PD-1 and stimulation of CD40 signaling pathways by anti-PD-L1/CD40L bispecific fusion protein synergistically activate target and effector cells. Int J Mol Sci (2021) 22(21):1–15. doi: 10.3390/ijms222111302
39. Ma HS, Poudel B, Torres ER, Sidhom JW, Robinson TM, Christmas B, et al. A CD40 agonist and PD-1 antagonist antibody reprogram the microenvironment of nonimmunogenic tumors to allow T-cell-Mediated anticancer activity. Cancer Immunol Res (2019) 7(3):428–42. doi: 10.1158/2326-6066.CIR-18-0061
40. Yang G, Nowsheen S, Aziz K, Georgakilas AG. Toxicity and adverse effects of tamoxifen and other anti-estrogen drugs. Pharmacol Ther (2013) 139(3):392–404. doi: 10.1016/j.pharmthera.2013.05.005
41. Loibl S, Gianni L. HER2-positive breast cancer. Lancet (2017) 389(10087):2415–29. doi: 10.1016/S0140-6736(16)32417-5
Keywords: sPD-L1, PD-1+ regulator B cells, regulator T cell, immunosuppression, the triple-negative breast cancer
Citation: Li X, Du H, Zhan S, Liu W, Wang Z, Lan J, PuYang L, Wan Y, Qu Q, Wang S, Yang Y, Wang Q and Xie F (2022) The interaction between the soluble programmed death ligand-1 (sPD-L1) and PD-1+ regulator B cells mediates immunosuppression in triple-negative breast cancer. Front. Immunol. 13:830606. doi: 10.3389/fimmu.2022.830606
Received: 07 December 2021; Accepted: 28 June 2022;
Published: 22 July 2022.
Edited by:
Yunfeng Ma, Xi’an Jiaotong University Health Science Center, ChinaReviewed by:
Farhad Jadidi-Niaragh, Tabriz University of Medical Sciences, IranCopyright © 2022 Li, Du, Zhan, Liu, Wang, Lan, PuYang, Wan, Qu, Wang, Yang, Wang and Xie. This is an open-access article distributed under the terms of the Creative Commons Attribution License (CC BY). The use, distribution or reproduction in other forums is permitted, provided the original author(s) and the copyright owner(s) are credited and that the original publication in this journal is cited, in accordance with accepted academic practice. No use, distribution or reproduction is permitted which does not comply with these terms.
*Correspondence: Fang Xie, eGllZmFuZ0BzdWRhLmVkdS5jbg==; Qin Wang, d2FuZ3Fpbjc4QHN1ZGEuZWR1LmNu
†These authors have contributed equally to this work
Disclaimer: All claims expressed in this article are solely those of the authors and do not necessarily represent those of their affiliated organizations, or those of the publisher, the editors and the reviewers. Any product that may be evaluated in this article or claim that may be made by its manufacturer is not guaranteed or endorsed by the publisher.
Research integrity at Frontiers
Learn more about the work of our research integrity team to safeguard the quality of each article we publish.