 Albert Caballero-Solares1*
 Navaneethaiyer Umasuthan1†
 Xi Xue1
 Tomer Katan1
 Surendra Kumar1
 Jillian D. Westcott2
 Zhiyu Chen1,2
 Mark D. Fast3
 Stanko Skugor4Richard G. Taylor5
 Matthew L. Rise1
- 1Department of Ocean Sciences, Memorial University, St. John’s, NL, Canada
- 2Fisheries and Marine Institute, Memorial University, St. John’s, NL, Canada
- 3Department of Pathology and Microbiology, Atlantic Veterinary College, University of Prince Edward Island, Charlottetown, PE, Canada
- 4Cargill Aqua Nutrition, Cargill, Sea Lice Research Center (SLRC), Sandnes, Norway
- 5Cargill Animal Nutrition and Health, Elk River, MN, United States
Lepeophtheirus salmonis (sea lice) and bacterial co-infection threatens wild and farmed Atlantic salmon performance and welfare. In the present study, pre-adult L. salmonis-infected and non-infected salmon were intraperitoneally injected with either formalin-killed Aeromonas salmonicida bacterin (ASAL) or phosphate-buffered saline (PBS). Dorsal skin samples from each injection/infection group (PBS/no lice, PBS/lice, ASAL/no lice, and ASAL/lice) were collected at 24 h post-injection and used for transcriptome profiling using a 44K salmonid microarray platform. Microarray results showed no clear inflammation gene expression signatures and revealed extensive gene repression effects by pre-adult lice (2,189 down and 345 up-regulated probes) in the PBS-injected salmon (PBS/lice vs. PBS/no lice), which involved basic cellular (e.g., RNA and protein metabolism) processes. Lice repressive effects were not observed within the group of ASAL-injected salmon (ASAL/lice vs. ASAL/no lice); on the contrary, the observed skin transcriptome changes –albeit of lesser magnitude (82 up and 1 down-regulated probes)– suggested the activation in key immune and wound healing processes (e.g., neutrophil degranulation, keratinocyte differentiation). The molecular skin response to ASAL was more intense in the lice-infected (ASAL/lice vs. PBS/lice; 272 up and 11 down-regulated probes) than in the non-infected fish (ASAL/no lice vs. PBS/no lice; 27 up-regulated probes). Regardless of lice infection, the skin’s response to ASAL was characterized by the putative activation of both antibacterial and wound healing pathways. The transcriptomic changes prompted by ASAL+lice co-stimulation (ASAL/lice vs. PBS/no lice; 1878 up and 3120 down-regulated probes) confirmed partial mitigation of lice repressive effects on fundamental cellular processes and the activation of pathways involved in innate (e.g., neutrophil degranulation) and adaptive immunity (e.g., antibody formation), as well as endothelial cell migration. The qPCR analyses evidenced immune-relevant genes co-stimulated by ASAL and lice in an additive (e.g., mbl2b, bcl6) and synergistic (e.g., hampa, il4r) manner. These results provided insight on the physiological response of the skin of L. salmonis-infected salmon 24 h after ASAL stimulation, which revealed immunostimulatory properties by the bacterin with potential applications in anti-lice treatments for aquaculture. As a simulated co-infection model, the present study also serves as a source of candidate gene biomarkers for sea lice and bacterial co-infection.
Introduction
Aquaculture has been called upon to fill the predicted global fish demand-supply gap and nourish the growing human population with high-quality protein and health-promoting omega-3 fatty acids (1, 2). Atlantic salmon (Salmo salar) is one of the most important fish species farmed globally, both in biomass produced and market value; however, the success of Atlantic salmon aquaculture as a growing food-producing industry is threatened by disease outbreaks (3). The parasitic copepod Lepeophtheirus salmonis –commonly referred to as sea louse– is currently one of the main threats to Atlantic salmon aquaculture in the Northern hemisphere (4). The damage of lice outbreaks to the industry goes beyond production losses and the cost of anti-lice treatments [> US$500M only for Norway in 2015; > US$900M globally (5)]. Lice outbreaks at farm sites raise concerns about the welfare of the farmed and wild salmon and negatively influence the public perception of the aquaculture industry (6).
L. salmonis parasitizes a range of salmonids (genera Salmo, Salvelinus, and Oncorhynchus) to feed on their mucous, skin, and blood (7, 8). However, Atlantic salmon have been proven to be particularly susceptible to this parasitic infection (9, 10). The effectiveness of L. salmonis lies in its capacity to suppress Atlantic salmon’s skin inflammatory response during the early stages of the infection (11). During its development to adult, L. salmonis goes through 2 planktonic nauplii stages, a copepodid stage, 2 immobile chalimus stages, and 2 mobile pre-adult stages (7, 8). Failure to expel the juvenile sea lice allows them to continue feeding and develop to motile pre-adult and adult lice. The long duration of the infection and the higher degree of skin damage caused by pre-adult and adult L. salmonis further weakens Atlantic salmon, rendering them an easy target for secondary infections (11).
Co-infection of sea lice and pathogenic bacteria occurs naturally at Atlantic salmon sea cages (12). Co-infections can overwhelm the host’s immune defenses if the two pathogens do not antagonize one another, but rather interact synergistically (i.e., one pathogen increases host susceptibility to the other) (13). For instance, L. salmonis and Moritella viscosa –a Gram-negative bacterium causing winter ulcer disease in salmonids– co-infection hindered Atlantic salmon skin’s ability to heal and increased mortality rates compared with individuals infected with M. viscosa alone (14). The co-infection of Caligus rogercresseyi –the most prevalent parasitic copepod in Chile– and Piscirickettsia salmonis –a Gram-negative bacterium causing salmonid rickettsial septicemia (SRS)– is highly frequent in Chilean salmon farms and seems to be non-competitive (15), which may have severe implications in vaccines’ efficacy, and salmons’ performance and survival (16, 17).
The Gram-negative bacterium Aeromonas salmonicida (subspecies salmonicida) infects multiple internal organs and the skin of salmonids, causing furunculosis, a disease characterized by dermal furuncles and darkening, lethargy, and other mild clinical signs and low mortality rates in its chronic form; septicemia, necrotizing skin lesions, internal bleeding and sudden mass mortalities in its acute form (18). Due to its ubiquitousness among teleost species and environments and the significance of its impacts on fish farming operations (19), A. salmonicida-host (especially salmonids) interactions have increasingly been studied with the expansion of the aquaculture industry (20). Like L. salmonis, A. salmonicida virulence seems linked to its ability to immunosuppress the host (21). Only a few studies have investigated the interacting pathological effects of co-infection of A. salmonicida and a parasite (e.g., the ciliate Philasterides dicentrarchi) or virus [e.g., infectious pancreatic necrosis virus (IPNV)] on farmed fish (22, 23). However, the pathogenicity and virulence of their single infections call for the investigation of L. salmonis and A. salmonicida co-infection.
Previous transcriptomics studies have contributed to identifying the molecular processes underlying the physiological responses of the Atlantic salmon skin to sea lice infection (24–28), and Atlantic salmon and Atlantic cod internal organs to A. salmonicida infection and antigens (29–32). In contrast, our understanding of the Atlantic salmon skin’s global gene expression response to co-infections is just beginning but will aid in developing practical and integrative management strategies for aquaculture (e.g., clinical feeds, vaccines) to improve fish health.
The objective of the present study was to profile –for the first time– the Atlantic salmon skin transcriptome response to pre-adult L. salmonis infection in combination with an intraperitoneal injection of formalin-killed A. salmonicida bacterin. Identically prepared A. salmonicida bacterins had been used in previous studies to examine the innate immune response triggered in the spleen and head kidney of Atlantic cod (Gadus morhua) (29, 30). The inclusion of un-infected controls for both bacterin-treated and saline-treated salmon allowed for 1) assessing the modulatory effects of the A. salmonicida bacterin on the Atlantic salmon skin response to sea lice infection, and 2) analyzing the Atlantic salmon skin transcriptome response to A. salmonicida antigens, which had not been studied before. The consortium for Genomic Research on All Salmonids Project (cGRASP)-designed Agilent 44K salmonid oligonucleotide microarray (33) was the platform chosen for the present experiment given its proven reliability in providing robust Atlantic salmon transcriptomic data (34, 35).
Materials and Methods
Animals
Groups of 35 and 15 salmon smolts [238.9 ± 45.2 g; mean weight ± standard deviation (SD)] were –respectively– allocated in four 620-L tanks in the bio-containment zone at the Cold-Ocean Deep-Sea Research Facility (CDRF, Ocean Sciences Centre, Memorial University, NL, Canada) for the Lepeophtheirus salmonis challenge trial and two 620-L tanks at the Dr. Joe Brown Aquatic Research Building (JBARB, Ocean Sciences Centre) to serve as no-lice infection controls. For a detailed explanation of the fish acclimation process and holding conditions (e.g., flow-through water system), see Supplementary Methods. All procedures followed Canadian Council on Animal Care’s guidelines (approved Memorial University Institutional Animal Care Protocol 17-77-MR).
Sea Lice Challenge
The salmon at CDRF were challenged with L. salmonis copepodids after an acclimation period of 79 days. As previously described (34), in preparation for lice exposure, water flow into the tanks was interrupted, and water volume was reduced by 50%. Oxygen was supplied to the water remaining in the tanks using air diffusers to prevent hypoxia. Then, sea lice copepodids were released into the tanks at a 50 lice/fish ratio and allowed to infect the salmon for 2 h. During the exposure, water dissolved oxygen levels (DO) and temperature were measured every 10 min. Any decrease in DO level during the challenge was quickly addressed by adjusting the air supply and remained above 7.1 mg/L and 72% saturation. No DO supersaturation occurred during the challenge. Water temperature increased by 0.4-0.6 °C on average. No mortalities were recorded. After the 2-h exposure period, the water supply was restored. For further details, see Supplementary Methods.
Injection Challenge and Sample Collection
Four weeks after sea lice exposure, when lice were at the pre-adult stage, lice-infected salmon (CDRF) and non-infected salmon (JBARB) were fasted for 24 h and then subjected to an intraperitoneal (IP) injection of either phosphate-buffered saline (PBS; Gibco/ThermoFisher Scientific, Mississauga, ON, Canada), a solution of polyriboinosinic polyribocytidylic acid (pIC; 2 μg/μL; Sigma-Aldrich, Oakville, ON, Canada), or a suspension of formalin-killed Aeromonas salmonicida [ASAL; PBS-washed and pelleted commercial vaccine (Furogen dip, Novartis Canada, Charlottetown, PE, Canada), resuspended in PBS at an optical density of 1.0 at 600 nm wavelength (29)] (Figure 1A). For each tank at CDRF, 6 fish were injected with PBS, 6 with pIC, and 6 with ASAL at 1 μL/g of fish (wet mass). For each tank at JBARB, 4 fish were injected with PBS, 4-5 fish with pIC, and 4-5 fish with ASAL. At 24 h post-injection, salmon were euthanized by immersion in a seawater bath with 400 mg/L MS-222 (Syndel Laboratories, Vancouver, BC, Canada) and dissected for tissue sample collection. Two 1-cm2 dorsal skin samples were taken from every lice-infected salmon (CDRF): one sample around a louse attachment site and another sample from an adjacent intact skin area (i.e., no lice attached or damaged) (Figure 1B). Dorsal skin samples (also 1 cm2) from non-infected salmon (JBARB) were taken from the area directly posterior to the dorsal fin and dorsal to the lateral line. Skin samples were immediately flash-frozen with liquid nitrogen and stored at -80 °C until processed for RNA extraction. Total lice load was counted. Supplementary Methods contain additional information concerning pIC, ASAL preparations, and the fish handling and sampling procedures.
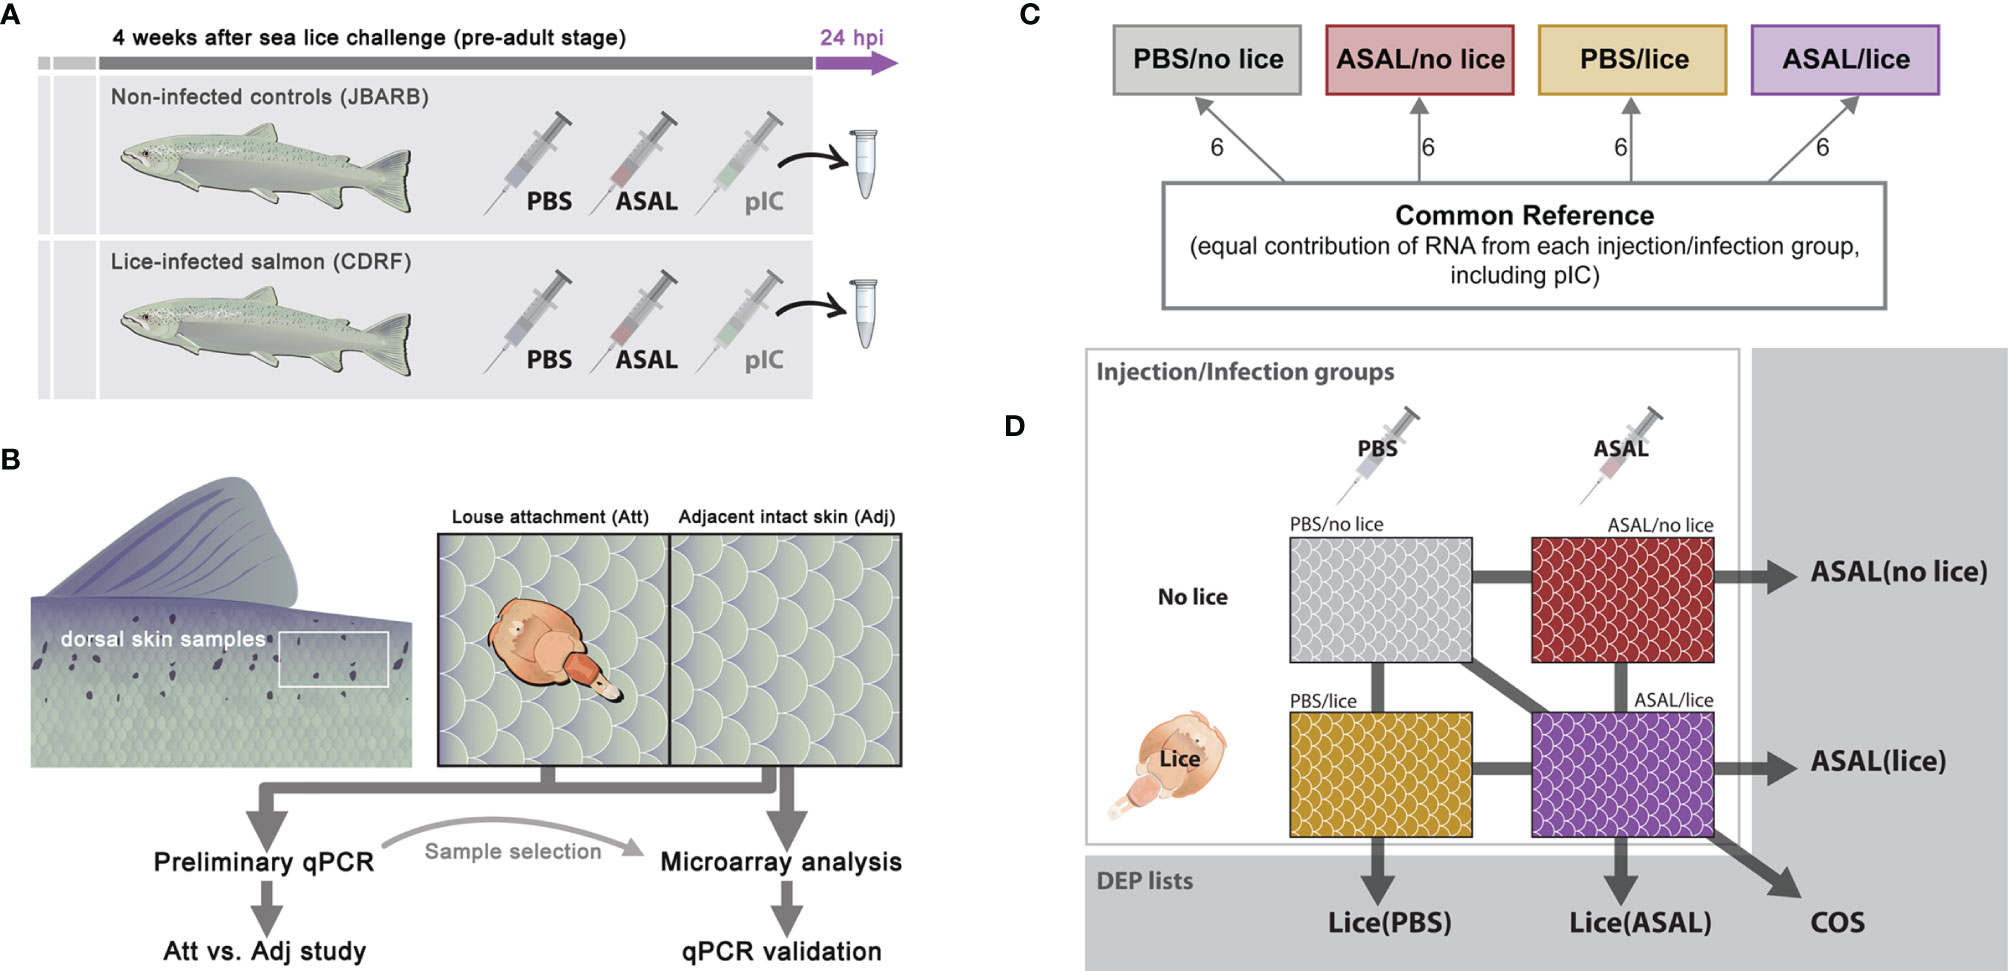
Figure 1 Experimental design of (A) Lice/ASAL co-stimulation trial, (B) skin sample collection on lice-infected salmon (C) 44K microarray experimental design, and (D) microarray data comparisons between injection/infection groups.
RNA Extraction and Purification
Dorsal skin samples were homogenized in TRIzol reagent (Invitrogen/Life Technologies, Burlington, ON, Canada) with stainless steel beads (5 mm; QIAGEN, Mississauga, ON, Canada) using a TissueLyser II (QIAGEN), and subjected to RNA extraction following manufacturers’ instructions. Thirty micrograms of each total RNA sample were treated with 6.8 Kunitz units of DNaseI (RNase-Free DNase Set, QIAGEN) and then column-purified by using the RNeasy Mini Kit (QIAGEN) following the manufacturer’s instructions. The total RNA concentration and purity were assessed by ND-1000 UV spectrophotometry (NanoDrop, Wilmington, DE, USA), and the RNA integrity was examined by 1% agarose gel electrophoresis. RNA samples with tight 18S and 28S ribosomal RNA bands and high A260/280 and A260/230 ratios (> 1.8) were used in transcriptional analyses.
Microarray Experimental Design
The present study included dorsal skin samples collected from the lice-infected salmon injected with PBS and ASAL (i.e., the salmon at CDRF; groups PBS/lice and ASAL/lice) and the non-infected salmon injected with PBS and ASAL (i.e., the salmon at JBARB; groups PBS/no lice and ASAL/no lice). Six biological replicates were allotted to each of the 4 injection/infection groups (i.e., 24 individual fish in total; Figure 1C).
This microarray study aimed to analyze the general skin transcriptome response to sea lice and ASAL co-stimulation, so it only used dorsal skin samples adjacent to louse attachment sites (Figure 1B). As explained in the section Sample Selection for Microarray Analysis, the present study included a complementary real-time quantitative polymerase chain reaction (qPCR) study comparing the mRNA levels of a selection of biomarker genes in the louse attachment (Att) and adjacent (Adj) skin sites (Figure 1B).
The microarray experiment followed Minimum Information About a Microarray Experiment (MIAME) guidelines (36), and it was conducted using cGRASP-designed Agilent 44K salmonid oligonucleotide microarrays [Gene Expression Omnibus (GEO) accession number: GPL11299 (33)]. The arrays were hybridized to anti-sense amplified RNA (aRNA) generated from high integrity and high purity skin total RNA. The analysis employed a common reference microarray experiment design, where the individual fish and the reference aRNA samples were labeled with different fluorescent dyes [Cy5 and Cy3 (GE HealthCare, Mississauga, ON, Canada), respectively]. For more details, see section Microarray Hybridization and Data Acquisition.
The common reference aRNA samples were prepared using pools of equal quantities of RNA from all 24 fish selected for the present study (i.e., PBS and ASAL-injected lice-infected and non-infected salmon; see section Sample Selection for Microarray Analysis), plus 12 additional RNA samples from non-infected (6 samples) and lice-infected (6 samples) salmon injected with pIC (Figure 1C). This design will allow future analyses of the shared molecular responses of Atlantic salmon dorsal skin to ASAL and pIC IP-injections, alone or in combination with lice infection.
Sample Selection for Microarray Analysis
Biological variability associated with resistance to lice infection may interfere with the microarray analysis and lead to results that are not representative of the fish population under experimentation. Therefore, lice-infected fish (CDRF) with total lice counts below or above population average ± 1 SD were not included in the microarray analysis. A total of 7 PBS/lice and 7 ASAL/lice salmon did not comply with this criterion and were not included in the study. In addition, in the interest of sample standardization, only lice-infected salmon that provided intact dorsal skin samples adjacent to an attached louse were considered. Among the excluded lice-infected salmon, there were 6 PBS/lice and 1 ASAL/lice that had intact skin samples taken next to 2 attached lice, and 3 PBS/lice and 8 ASAL/lice that did not present louse attachment and intact adjacent sites on their dorsal skin suitable for sample collection. Eight biological replicates for the PBS/lice and ASAL/lice groups passed sample filtering.
The RNA samples of the infected salmon that passed filtering were subjected to qPCR analysis (Figure 1B). The transcript levels of well-known inflammation [interleukin 1 beta (il1b) and cyclooxygenase-2 (cox2)], acute-phase response (APR) [serum amyloid A-5 protein (saa5)], tissue remodeling [matrix metallopeptidase 13 A (mmp13a)], and anti-bacterial [toll-like receptor 5 A, soluble (tlr5a)] gene biomarkers were qPCR-quantified on Att and Adj skin samples. The methodology for primer design and quality testing, normalizer selection, cDNA synthesis, and qPCR analysis are explained in the qPCR Analyses section and the Supplementary Methods. The obtained qPCR data were analyzed via Principal Component Analysis (PCA; see Statistical Analysis section) to select the 6 most representative biological replicates (i.e., closely clustered in the multivariate space) for each of the 4 injection/infection groups. The gene expression results arising from these analyses have been added here as a complementary qPCR study comparing Att and Adj gene expression signatures.
The 6 biological replicates in the microarray analysis representing the non-infected salmon (JBARB) were randomly selected from 8 PBS/no lice salmon and 9 ASAL/no lice salmon. Lice-infected salmon that passed sample filtering and all non-infected salmon were considered in the qPCR confirmation of the microarray results.
Microarray Hybridization and Data Acquisition
One microgram of DNaseI-treated and column-purified RNA from each individual fish and the common reference pool was in vitro-transcribed into aRNA using the Amino Allyl MessageAmp™ II aRNA Amplification Kit (Ambion, ThermoFisher Scientific, Waltham, MA, USA), following the manufacturer’s instructions. The resulting aRNAs were quality-checked and quantified using agarose gel electrophoresis and ND-1000 UV spectrophotometry (NanoDrop). Twenty micrograms of each aRNA sample were precipitated overnight using a standard ethanol precipitation method and re-suspended in coupling buffer (Ambion). Common reference and individual fish aRNAs were labeled with Cy3 and Cy5, respectively, following the manufacturer’s instructions. The labeled aRNA concentration and labeling efficiency were measured using the microarray feature in the ND-1000 UV spectrophotometer. For each array, an equal quantity (825 ng) of an individual fish Cy5-labeled and reference Cy3-labeled aRNA were fragmented and co-hybridized to a 44K microarray at 65°C for 17 h with rotation (10 rpm) using an Agilent hybridization oven. The array slides were washed immediately after hybridization as per the manufacturer’s instructions and dried by centrifuging at 200 × g for 5 min at room temperature.
Microarray slides were immediately scanned at 5-μm resolution using a SureScan Microarray Scanner System (Agilent) and Microarray Scan Control Software v.9.1 following the built-in Agilent HD 2-color gene expression microarray scan protocol. The signal intensity data were extracted and subjected to linear and LOESS normalization using Agilent Feature Extraction Software v12.0 (Agilent). Probes of low quality (e.g., signal not above background) or with absent values in more than 25% of all 24 arrays were removed from the dataset, and the missing values were imputed using GeneSpring Software v14.9 (Agilent). The final dataset of normalized log2-transformed Cy5/Cy3 ratios consisted of 25,882 probes for all arrays (GEO accession number: GSE186292; https://www.ncbi.nlm.nih.gov/geo/query/acc.cgi?acc=GSE186292).
Microarray Data Analysis
Normalized log2-transformed ratios were analyzed via Significance Analysis of Microarrays (SAM) (37) to identify differentially expressed probes (DEPs) between injection/infection groups at a false discovery rate (FDR) of 5% using the Bioconductor R package siggenes (38). Five SAM comparisons were made between the different injection/infection groups (Figure 1D). The comparison between ASAL/lice and PBS/lice was meant to explore the skin transcriptome response to ASAL in the lice-infected fish [ASAL(lice) DEP list]. The comparison ASAL/no lice vs. PBS/no lice covered the skin transcriptome response to ASAL in the non-infected fish [ASAL(no lice) list]. The PBS/lice vs. PBS/no lice comparison searched for lice-responsive probes in PBS-injected salmon [Lice(PBS) list]. The ASAL/lice vs. ASAL/no lice comparison searched for lice-responsive probes in ASAL-injected salmon [Lice(ASAL) list]. The comparison ASAL/lice vs. PBS/no lice aimed to identify probes responsive to ASAL and lice infection (i.e., co-stimulated DEPs; COS list).
For gene identification in the DEP lists, a previous annotation of the 44K 60mer oligonucleotide probes (39) was updated via BLASTx searches of the contiguous sequences (contigs) used to design the probes against the NCBI non-redundant amino acid (nr) and Swiss-Prot databases (thresholds: E-value < 1e-5, identity percentage > 75%, query coverage >50%). BLASTn searches using the 60mer probes [against the NCBI non-redundant nucleotide (nt) database] were conducted to verify the annotation of the updated probes (threshold: ≤ 2 mismatches; no alignment gaps allowed). Human gene symbols were assigned to the annotated probes based on HUGO Gene Nomenclature Committee (HGNC; https://www.genenames.org/) and/or GeneCards (https://www.genecards.org/) databases.
Network and Gene Ontology Enrichment Analyses
Gene ontology (GO) term enrichment analyses (GTEA) were conducted for each DEP list using ClueGO (40) plugin in Cytoscape (v3.5.1) (41). This analysis disregarded DEP redundancy (i.e., multiple probes annotated as the same gene); it only considered the differentially expressed genes (DEGs) putatively represented by the DEP lists. Right-sided hypergeometric tests (i.e., for GO term over-representation) were performed using the human GO database (UniProt: 27.02.2019) for Biological Processes (BPs), with an adjusted p-value cut-off level (Benjamini-Hochberg test) of 0.05. The entire 44K salmon array was used as the reference gene list. ClueGO linked the over-represented GO terms using kappa statistics (42), thus generating GO term networks. The kappa coefficient threshold for the analysis was 0.4. The relative frequency of up-regulated and down-regulated DEGs was used to calculate the z-score (43) of each GO term arising from the GTEA. The over-represented GO terms were classified, using Gene Ontology Browser (http://www.informatics.jax.org), into 4 functional themes: 1) metabolic processes; 2) cellular processes; 3) immune/stress processes; and 4) development/healing processes. Some GO groups comprised terms from different themes; in such cases, the group is colored according to the theme with the highest number of GO terms. Additional information on kappa statistics and GO term classification criterion can be found in the Supplementary Methods.
qPCR Analyses
Forty-one microarray-identified genes of interest (GOIs) were qPCR-analyzed to confirm the microarray results (see Statistical Analyses for more information). Despite not being microarray-identified, the qPCR confirmation study also included tlr5a to better represent bacterial recognition processes.
First-strand cDNA synthesis and qPCR amplifications were performed following Minimum Information for Publication of qPCR Experiments [MIQE (44)]-compliant methods previously published (34, 35) and described in the Supplementary Methods. A ViiA 7 Real-Time PCR system (Applied Biosystems/Life Technologies, Foster City, CA, USA) was used for the qPCR experiments. Primer pairs were either designed or selected from previous studies, and quality-tested [e.g., single-product amplification, efficiency (45)] as described in Caballero-Solares et al. (46) and Supplementary Methods. All information concerning primer sequences and quality-check results is shown in the Supplemental Table S1.
Five candidate normalizer genes were tested for mRNA level stability across injection/infection groups. These genes were 60S ribosomal protein L32 (rpl32), elongation factor 1-alpha 1 (ef1a1), polyadenylate-binding protein, cytoplasmic 1 (pabpc1), eukaryotic translation initiation factor 3 subunit D (eif3d), ATP binding cassette sub-family f member 2 (abcf2). These candidate normalizer genes were selected based on previous experience with infected or pathogen-associated molecular patterns (PAMP)-challenged Atlantic salmon (35, 47). rpl32 and pabpc1 were chosen as the most stably expressed based on geNorm analyses [M-values 0.160 and 0.158, respectively; qBASE plus, Biogazelle NV, Belgium (48)].
The relative quantity (RQ) of each qPCR-analyzed GOI was calculated using a qBase relative quantification framework (49, 50) through normalization to rpl32 and pabpc1, with amplification efficiencies incorporated. The RQ values of each GOI were calibrated to the sample that had the lowest normalized gene expression (i.e., assigned an RQ value = 1.0).
Statistical Analyses
Microarray data were subjected to Pearson correlation tests to identify significant relationships between expression levels and total lice load. Non-infected salmon were not considered for the correlation analyses. As in previous studies (9, 20, 21), the validity of the microarray results was assessed by a linear regression analysis of qPCR and microarray-derived log2-transformed fold-changes. Gene expression fold-changes were calculated following the formula 2A-B, A and B being the RQs of two different injection/infection groups (e.g., ASAL/lice vs. PBS/no lice) (51).
Total lice load counts were analyzed for PBS/ASAL injection effects using Mann-Whitney U test as the data failed to comply with the normality assumption (Shapiro-Wilk test). Changes in the transcript levels of the qPCR-analyzed genes were modeled using generalized linear models (GLMs). For the qPCR confirmation experiment, the factors tested were ASAL treatment (i.e., PBS/ASAL injection) and L. salmonis infection (i.e., presence/absence). For the complementary qPCR experiment (arising from the preliminary analyses conducted for sample selection), the factors tested were ASAL treatment (i.e., PBS/ASAL injection) and skin site (i.e., Adj/Att). Once modeled, we tested the significance of each factor and the interactions between factors through ANOVA. Pairwise comparisons between injection/infection groups were carried out using estimated marginal means (EMMs). Similar to the microarray data, the qPCR-confirmation results were analyzed for correlation with total lice load counts (Pearson correlation test). Again, non-infected salmon were not considered for the correlation analyses. The microarray and qPCR confirmation experiment datasets were analyzed using Principal Component Analysis (PCA). For the qPCR data-based PCA, the scores of the first two principal components were also subjected to the same statistical analyses as the qPCR confirmation data (i.e., GLMs for lice and ASAL effects; EMMs for inter-group pairwise comparisons).
All statistical analyses –except for GTEA– were conducted using the R environment, more specifically the packages: glm (generalized linear models), car (one-way ANOVA), emmeans (estimated marginal means), corrplot (Pearson correlation), factoextra and ade4 (PCA). Results were plotted using the R packages ggplot2 and ggpubr. The statistical significance threshold was p-value (p) <0.05 for all statistical analyses.
Results
Lice Infection Levels
The entire group of lice-infected salmon (i.e., PBS and ASAL-injected; n = 48) showed an average total lice load of 12.0 ± 5.8 (SD). There were no significant differences in total lice load counts between PBS and ASAL-injected salmon (Mann-Whitney U test; p = 0.985).
Microarray Results
SAM (5% FDR) identified 345 up-regulated and 2,189 down-regulated DEPs in the comparison PBS/lice vs. PBS/no lice [i.e., Lice(PBS) list; Figure 2A and Supplemental Table S2], and 82 up-regulated and 3 down-regulated DEPs in the comparison ASAL/lice vs. ASAL/no lice [i.e., Lice(ASAL) list]. The comparison ASAL/lice vs. PBS/lice [i.e., ASAL(lice) list] identified 272 up-regulated and 11 down-regulated DEPs, whereas ASAL/no lice vs. PBS/no lice [i.e., ASAL(no lice) list] revealed 27 up-regulated DEPs. The skin transcriptome differences between the co-stimulated salmon (i.e., ASAL/lice) and PBS/no lice salmon accounted for 1,878 up-regulated and 3,120 down-regulated DEPs (i.e., COS list). The PCA of the complete microarray dataset showed segregation among the different injection/infection groups in the multivariate space (Supplementary Figure S1). The distance between groups reflected the size of their corresponding DEP list; for example, the largest DEP list (i.e., COS) derived from the two most distant groups in the PCA (i.e., ASAL/lice and PBS/lice).
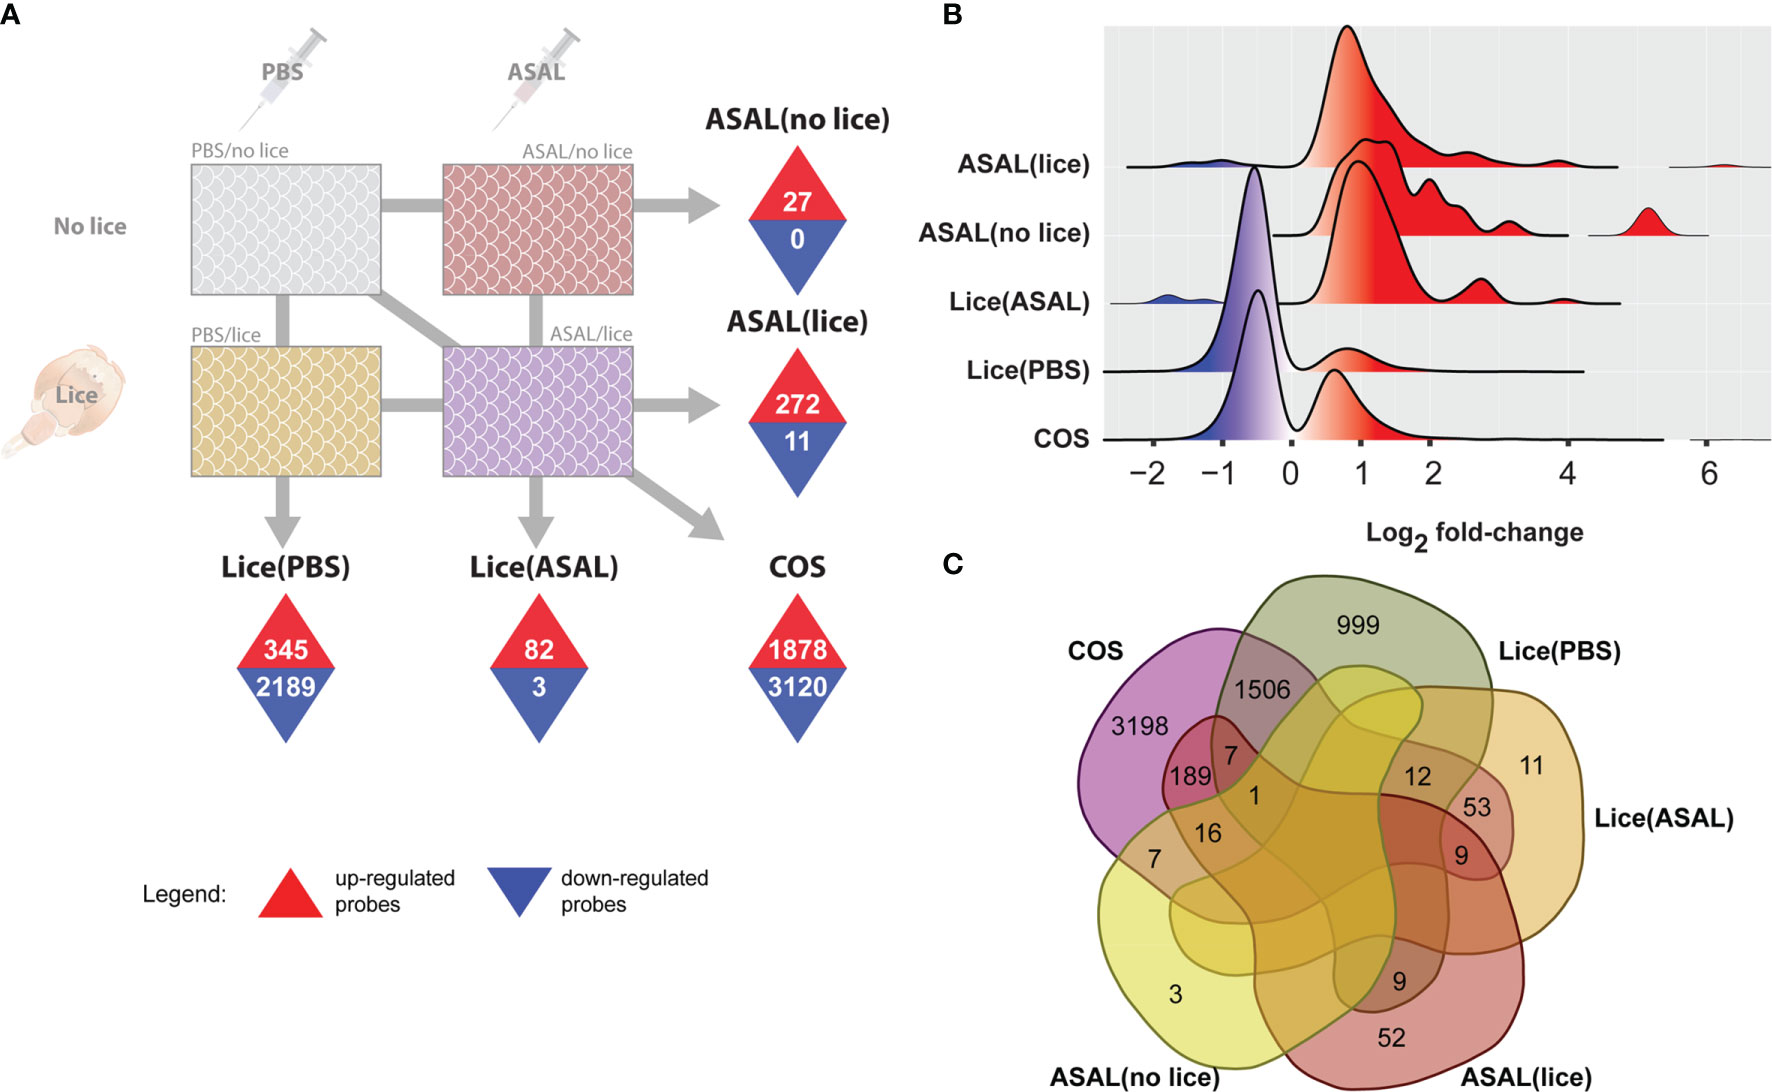
Figure 2 Summary of microarray results. (A) Identified differentially expressed probes (DEPs) using SAM (5% FDR). Numbers inside upward pointing triangles represent the number of up-regulated DEPs; those inside downward pointing triangles represent the number of down-regulated DEPs. (B) Histogram of the frequency density of log2-transformed fold-changes for the different DEPs lists. Tones of red and blue colors indicate up- and down-regulation, respectively. (C) Venn diagram showing the total number of exclusive and overlapped DEPs among lists.
In all DEP lists, the majority of up-regulated probes showed moderate fold-changes [i.e., < 2 log2 fold-change (FC)], although the distribution of the complete lists stretched towards high induction levels (i.e., above 4 log2 FC; Figure 2B). Up-regulated DEPs in ASAL(lice), ASAL(no lice), and Lice(ASAL) had multimodal log2 FC distributions, with a predominant peak close to 1 log2 FC for ASAL(no lice) and Lice(ASAL), and slightly below 1 log2 FC for ASAL(lice). FCs of the up-regulated DEPs in Lice(PBS) and COS lists displayed a single peak below 1 log2 FC. Down-regulated DEPs in Lice(PBS) and COS characteristically showed mild log2 FCs above -1, whereas in Lice(ASAL) and ASAL(lice), they presented some log2 FCs below -1. ASAL(no lice) presented no down-regulated probes.
Of the 4,998 DEPs in the COS list (i.e., 1,878 up + 3,120 down), 3,198 (64% of the total) were COS-exclusive and 1,800 (36%) were shared with other lists (Figure 2C and Supplemental Table S2). Within the shared DEPs, 1,526 were also found in Lice(PBS), 222 in ASAL(lice), 74 in Lice(ASAL), and 24 in ASAL(no lice). Lice(PBS) list comprised 999 exclusive DEPs (39% of the total) and 1,535 DEPs (61%) shared with other lists. Lice(ASAL) had 11 (13%) exclusive and 74 (87%) shared DEPs. ASAL(lice) presented 52 (18%) exclusive and 231 (82%) shared DEPs. ASAL(no lice) list was composed of 3 (11%) exclusive and 24 (89%) shared DEPs. No DEPs were shared between Lice(ASAL) and ASAL(no lice) lists.
Functional Analysis of the Skin Transcriptome Responses
The GTEA found 230 over-represented biological process GO terms (Figure 3A and Supplemental Table S3) in the Lice(PBS) list: 134 (58%) metabolic processes, 75 (33%) cellular processes, and 21 (9%) immune/stress processes. The over-represented metabolic processes in Lice(PBS) focused on nucleic acid (e.g., “mRNA metabolic process”) and protein metabolism (e.g., “protein modification process”). The over-represented cellular processes in Lice(PBS) included organelle organization and biogenesis (e.g., “ribosome biogenesis”), RNA and protein localization and transport (e.g., “intracellular protein transport”), and the regulation of cell signaling (e.g., “regulation of signal transduction by p53 class mediator”) and cell cycle (e.g., “regulation of cell cycle”). Several over-represented immune/stress processes in Lice(PBS) were related to viral infection (e.g., “defense response to virus”); others were related to responses to cytokines (e.g., “positive regulation of response to cytokine stimulus”), and different abiotic stressors (e.g., “cellular response to abiotic stimulus”).
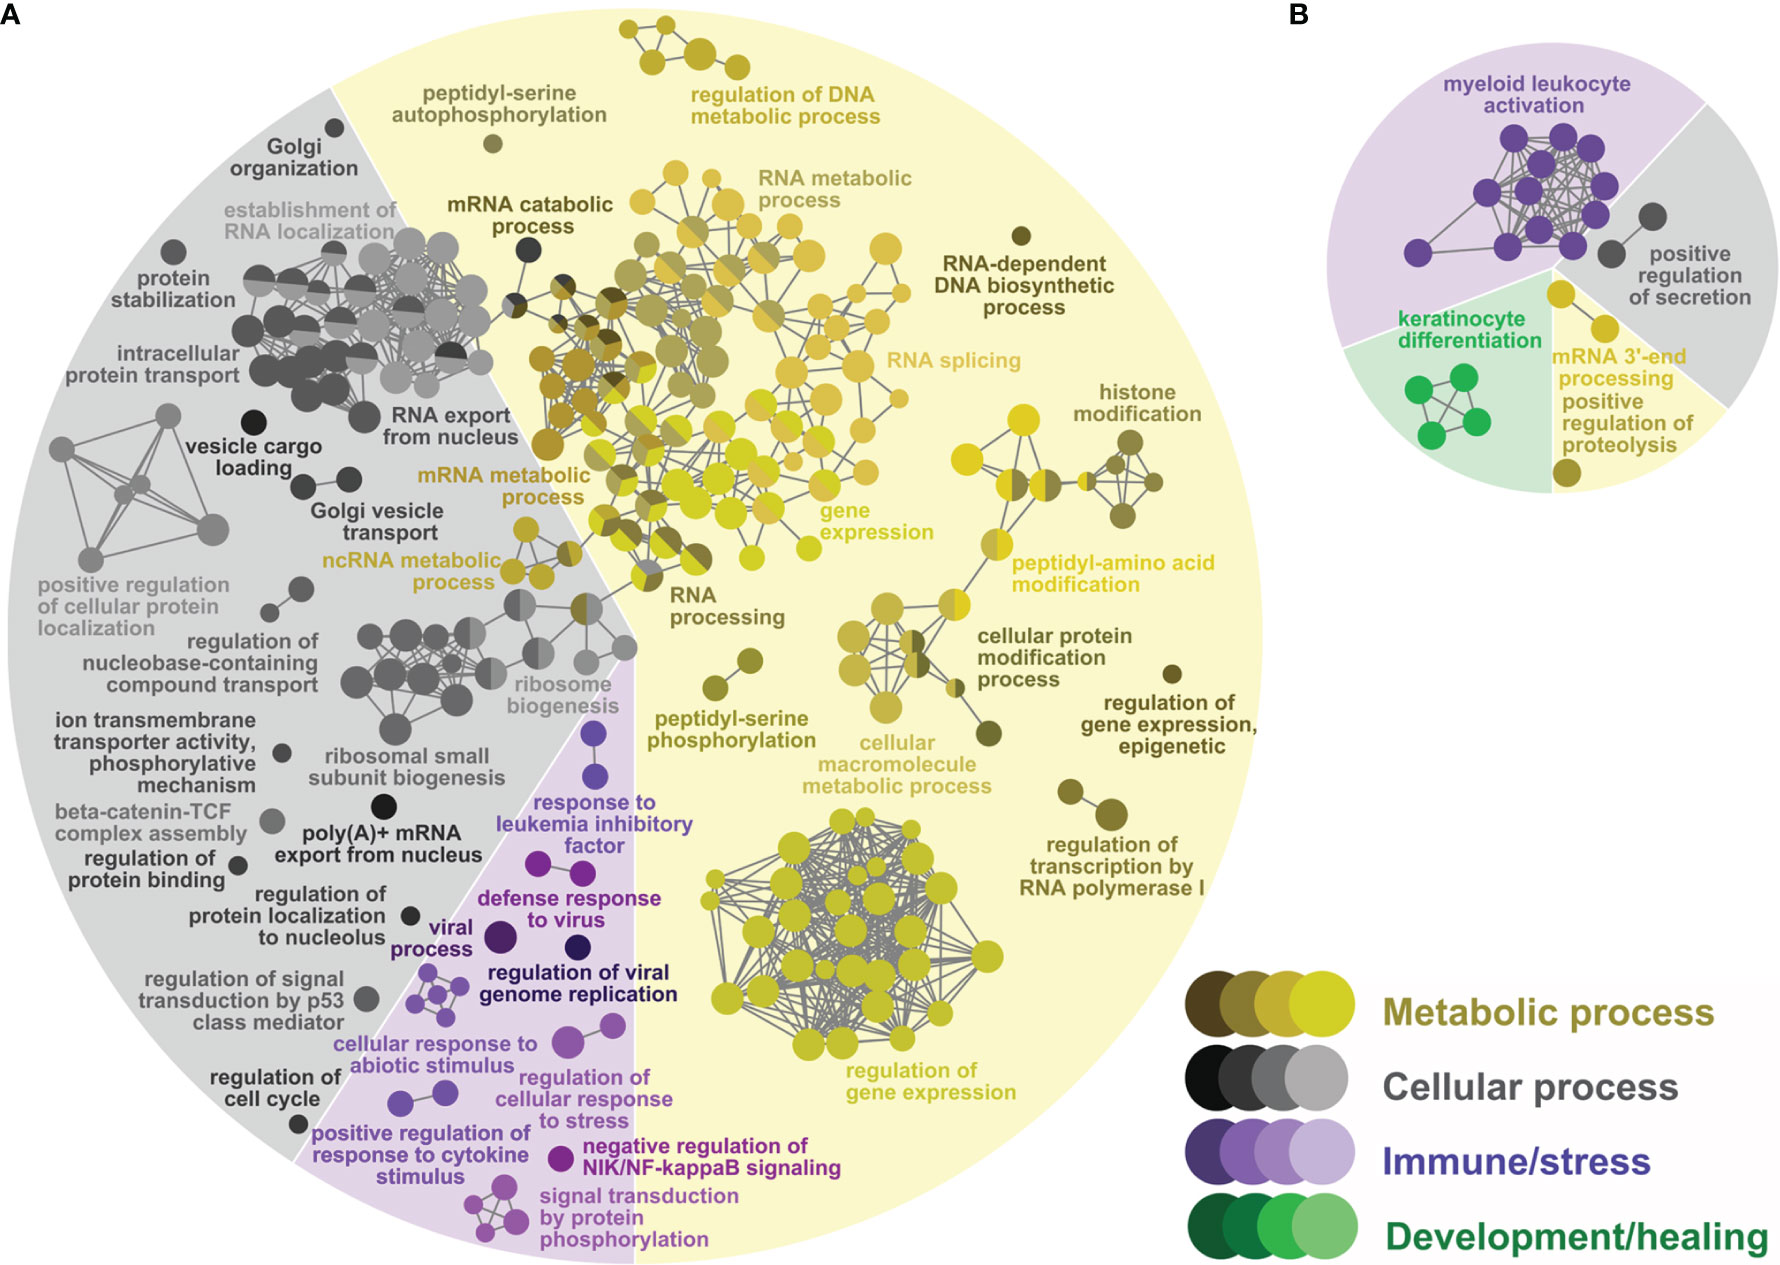
Figure 3 Network GO term enrichment analysis of the differentially expressed genes (DEGs) in (A) the Lice(PBS) list, and (B) the Lice(ASAL) list. Nodes represent over-represented GO terms (right-sided hypergeometric test; adjusted p-value < 0.05). Nodes are colored according to their assigned functional theme. Highly related terms (kappa coefficient > 0.4) are connected with grey lines. Single GO terms (i.e., single node) and GO networks are grouped and colored by functional theme (e.g., metabolic process, immune/stress) and arranged to fit the pie chart sectors representing the proportion of GO terms in each functional theme. Some GO groups comprised terms from different themes; in such cases, the group is colored according to the theme with the highest number of GO terms.
In the Lice(ASAL) list, mostly immune/stress and development/healing processes were over-represented [9 (43% of all 21) and 4 (19%) processes, respectively; Figure 3B and Supplemental Table S4]. All immune/stress processes were related to neutrophil-mediated immunity (i.e., “myeloid leukocyte activation”), whereas all development/healing processes were related to skin development (i.e., “skin development”). The 5 over-represented cellular processes (24%) were grouped with the neutrophil-mediated immunity-related processes [e.g., “exocytosis” in group 4 (Supplemental Table]. The 3 over-represented metabolic processes included proteolysis (e.g., “positive regulation of proteolysis”) and RNA 3’-end processing (e.g., “mRNA 3’-end processing”).
ASAL(lice) presented 77 (26%) and 173 (58%) over-represented cell and immune/stress processes, respectively (Figure 4A and Supplemental Table S5), whereas ASAL(no lice) had 8 over-represented cell processes (36% of all 22) and 14 immune/stress processes (64%) (Figure 4B and Supplemental Table S6). In ASAL(lice), there were cellular processes involved in endocytosis and apoptosis (e.g., “positive regulation of receptor-mediated endocytosis” and “regulation of cell death”, respectively). Some cell processes in ASAL(no lice) were related to cellular ion homeostasis (e.g., “ion homeostasis”). Many cellular processes in ASAL(lice) and ASAL(no lice) were grouped with processes of different themes (e.g., immune/stress processes, development/healing processes) and spanned over various cell signaling pathways, such as the MAPK/ERK pathway [e.g., “regulation of MAPK cascade”, group 7 of the ASAL(lice) list (Supplemental Table S5); “signal transduction”, groups 0 and 7 of the ASAL(no lice) list (Supplemental Table S6)], exocytosis [e.g., “secretion by cell”, group 16 of the ASAL(lice) list (Supplemental Table S5)], and cell chemotaxis [e.g., “cell migration”, group 32 of the ASAL(lice) list (Supplemental Table S6)]. Other immune/stress processes over-represented in ASAL(lice) were related to anti-bacterial responses (e.g., “response to bacterium”), inflammatory response (e.g., “I-kappaB kinase/NF-kappaB signaling”), and lymphocyte activation (e.g., “positive regulation of lymphocyte activation”). Also, ASAL(lice) had over-represented metabolic and development/healing processes, whereas ASAL(no lice) did not (Figure 4B). Most over-represented metabolic processes in ASAL(lice) were associated with proteolysis and regulation of endopeptidase activity (e.g., “positive regulation of proteolysis”). Over-represented development/healing processes in ASAL(lice) related to wound healing and hemostasis (e.g., “regulation of wound healing”), angiogenesis (e.g., “regulation of vasculature development”), and extracellular matrix (ECM) organization (e.g., “extracellular matrix organization”) (Figure 4A).
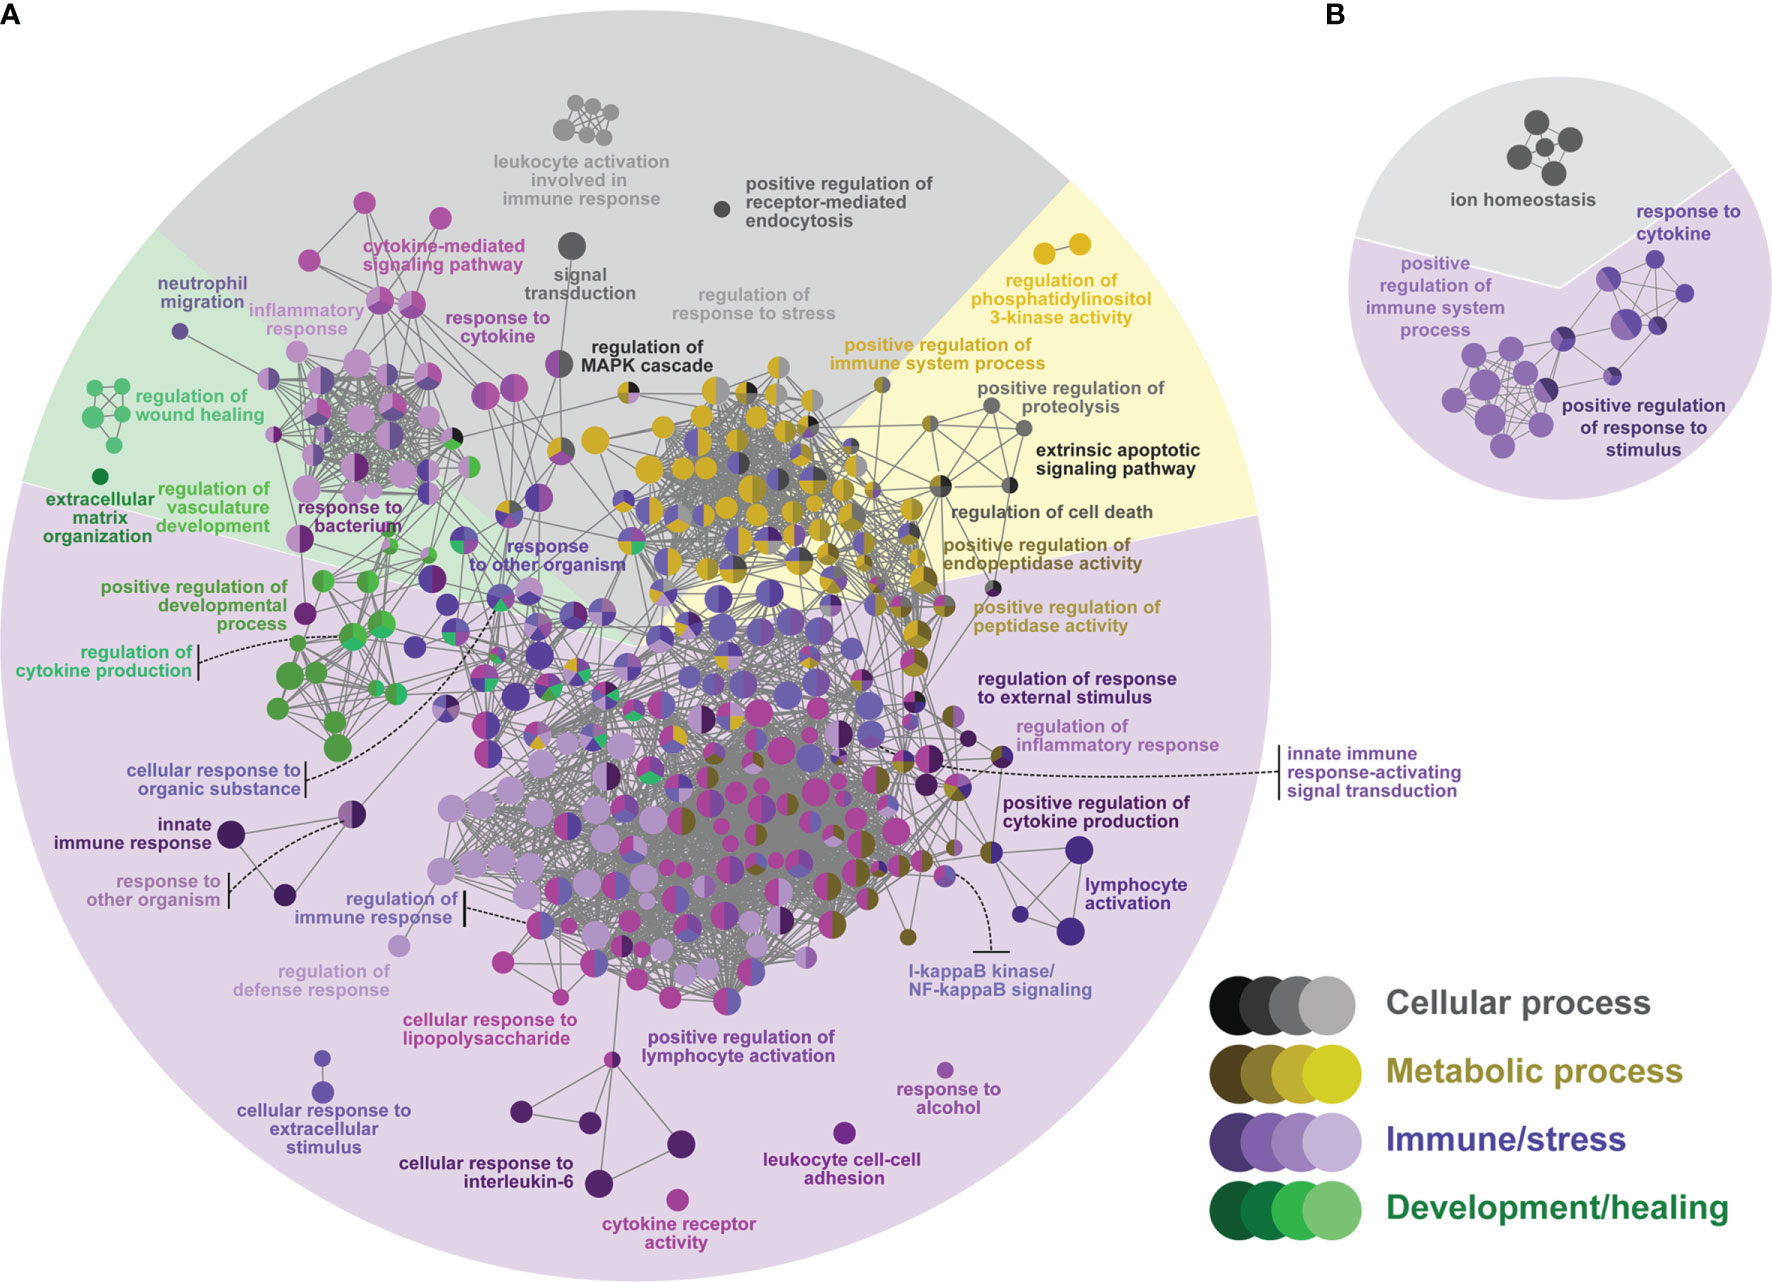
Figure 4 Network GO term enrichment analysis of the differentially expressed genes (DEGs) in (A) the ASAL(lice) list, and (B) the ASAL(no lice) list. Nodes represent over-represented GO terms (right-sided hypergeometric test; adjusted p-value < 0.05). Nodes are colored according to their assigned functional theme. Highly related terms (kappa coefficient > 0.4) are connected with grey lines. Single GO terms (i.e., single node) and GO networks are grouped and colored by functional theme (e.g., metabolic process, immune/stress) and arranged to fit the pie chart sectors representing the proportion of GO terms in each functional theme. Some GO groups comprised terms from different themes; in such cases, the group is colored according to the theme with the highest number of GO terms.
The GTEA found 223 biological processes over-represented by the COS list (Figure 5 and Supplemental Table S7): 116 (52%) were classified as metabolic processes, 55 (25%) as cellular processes, 45 (20%) as immune/stress processes, and 7 (3%) as development/healing processes. Similar to Lice(PBS), most over-represented metabolic processes in the COS list were directly or indirectly related to the metabolism of nucleic acids (e.g., mRNA, ncRNA, DNA) and proteins. Further, the cellular processes spanned over cell organelle organization and biogenesis (e.g., “ribosomal large subunit biogenesis”), RNA and protein localization and transport (e.g., “establishment of RNA localization”), cell signaling (e.g., “regulation of signal transduction by p53 class mediator”), and cell cycle regulation (e.g., “regulation of cell cycle G1/S phase transition”). Among the over-represented immune/stress processes, there were many related to innate and adaptive immune responses (e.g., groups 19 and 27, led by “innate immune response” and “regulation of adaptive immune response”, respectively). Also, there were processes related to viral infection (e.g., “viral process”), neutrophil-mediated immune processes (e.g., “regulated exocytosis”), and response to stress (e.g., “regulation of response to stress”). The development/healing processes involved platelet formation (i.e., group 21, led by “platelet formation”) and endothelial cell migration (e.g., “positive regulation of endothelial cell migration”).
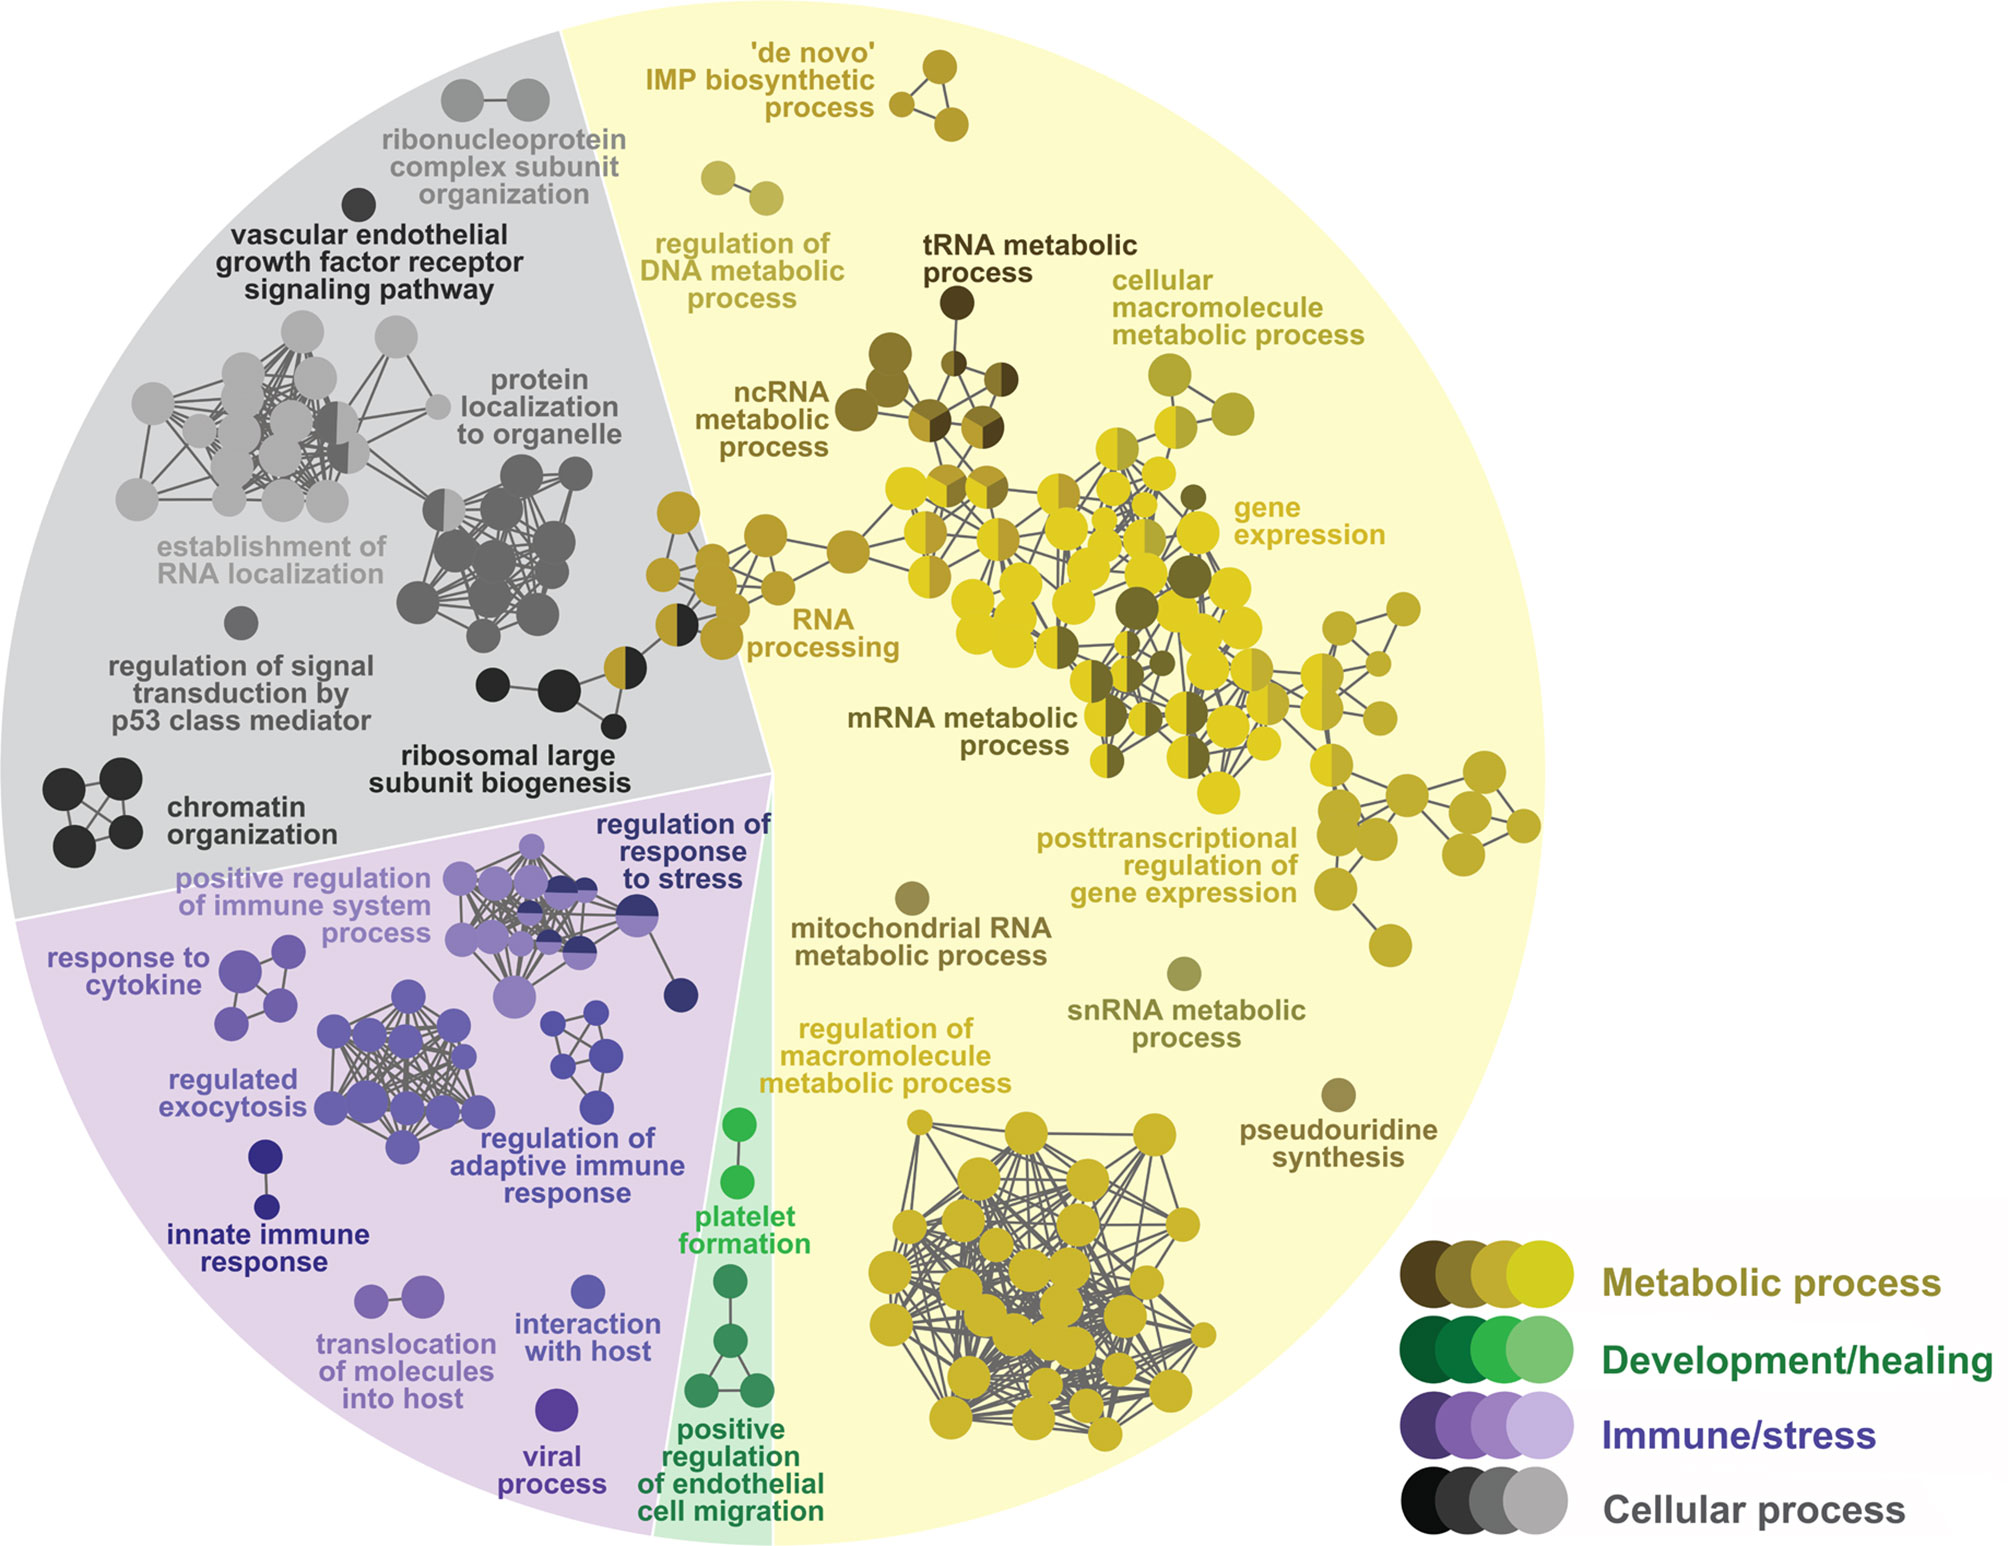
Figure 5 Network GO term enrichment analysis of the differentially expressed genes (DEGs) in the COS list. Nodes represent over-represented GO terms (right-sided hypergeometric test; adjusted p-value < 0.05). Nodes are colored according to their assigned functional theme. Highly related terms (kappa coefficient > 0.4) are connected with grey lines. Single GO terms (i.e., single node) and GO networks are grouped and colored by functional theme (e.g., metabolic process, immune/stress) and arranged to fit the pie chart sectors representing the proportion of GO terms in each functional theme. Some GO groups comprised terms from different themes; in such cases, the group is colored according to the theme with the highest number of GO terms.
Regardless of the theme, down-regulated DEGs were predominant in all the over-represented biological processes of the Lice(PBS) list (Figure 6A). Conversely, all biological processes of the Lice(ASAL), ASAL(no lice), and ASAL(lice) were mostly or exclusively represented by up-regulated DEGs (Figures 6B–D).
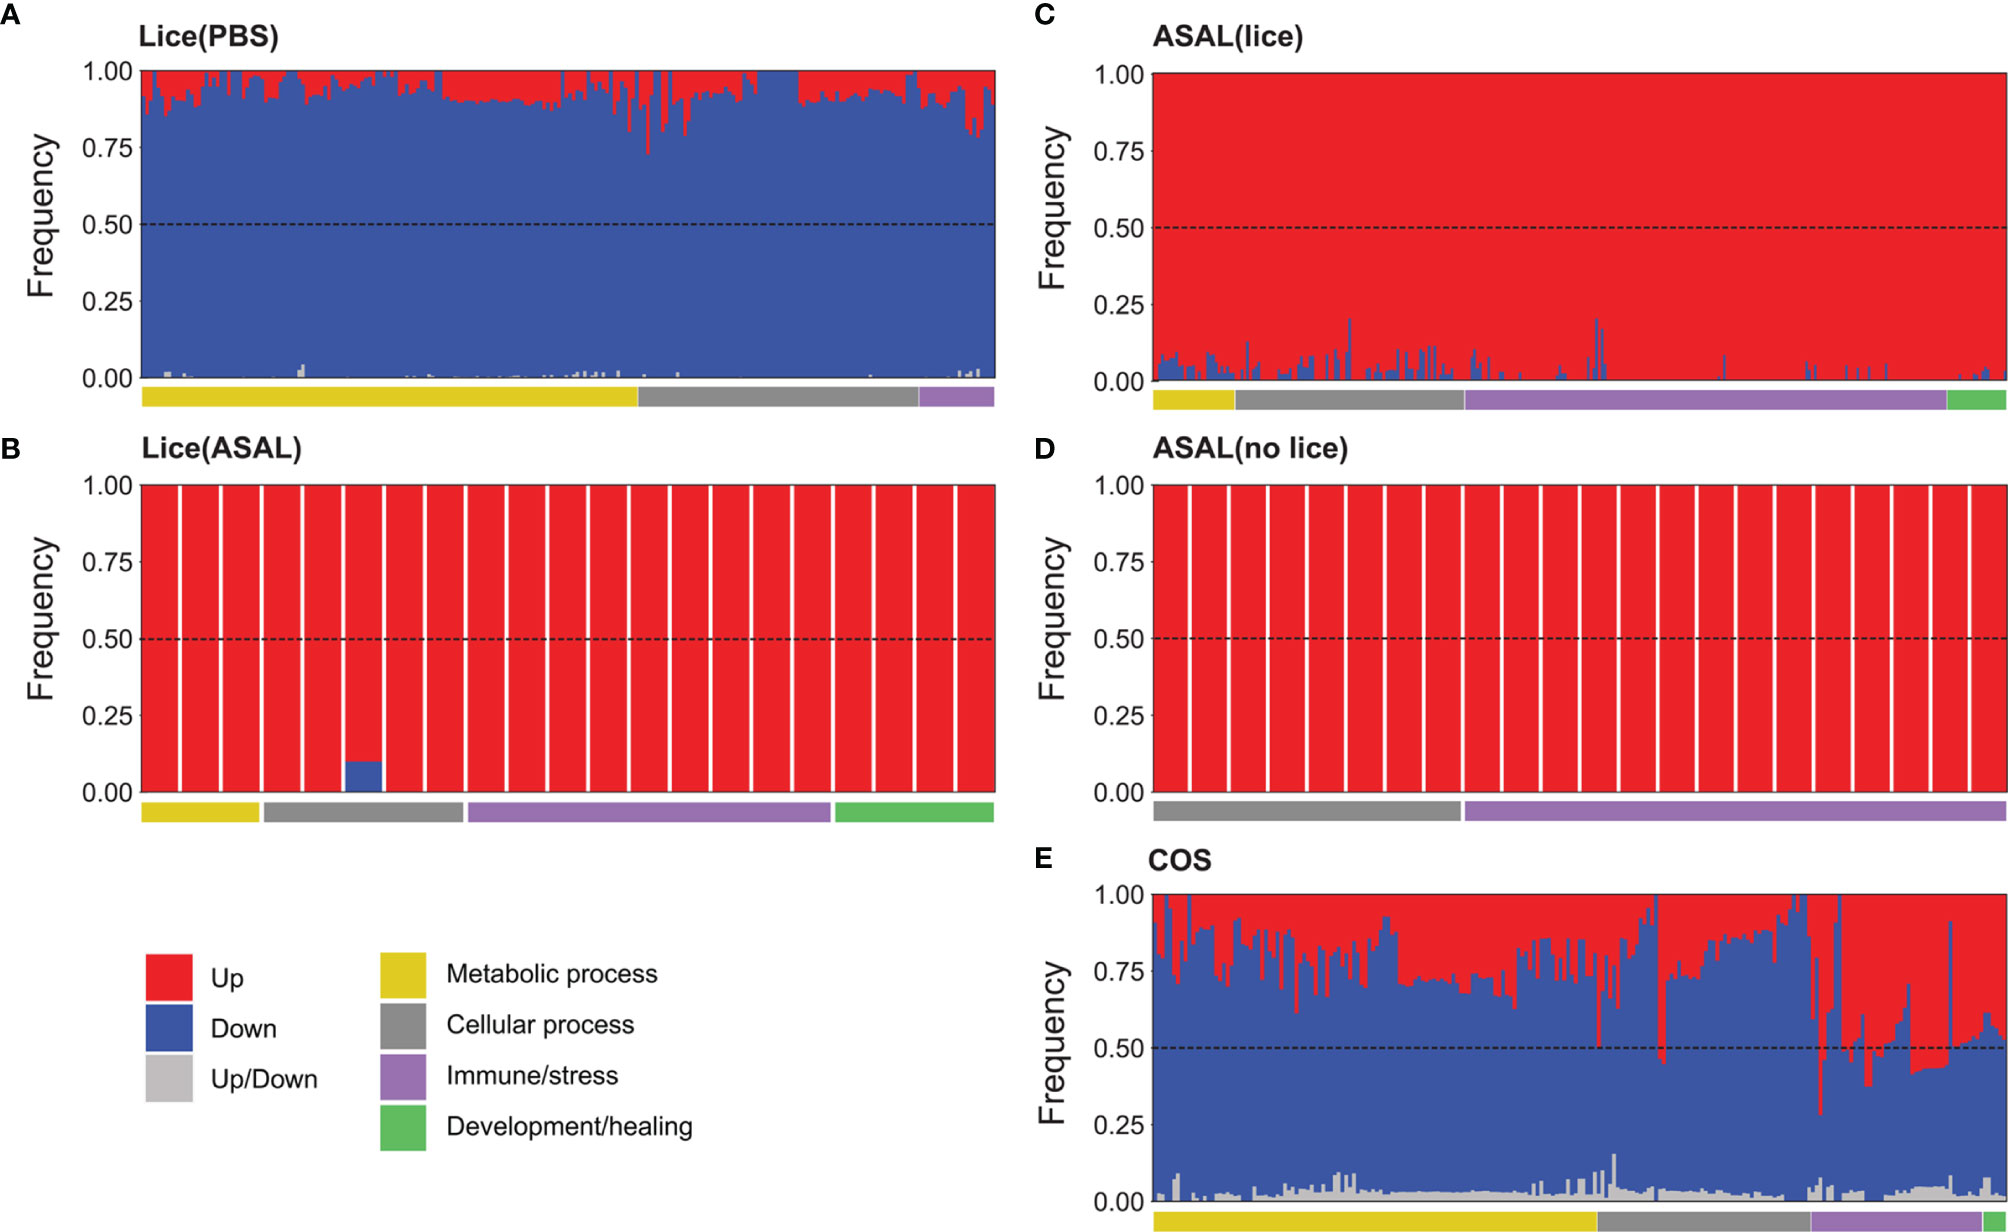
Figure 6 Stacked bar plots showing the relative frequency of differentially expressed genes (DEGs) detected by up-regulated (red) and down-regulated (blue) microarray probes or by both up and down-regulated probes (light grey) for the GO terms over-represented in the (A) Lice(PBS), (B) Lice(ASAL), (C) ASAL(lice), (D) ASAL(no lice), and (E) COS lists. The GO terms are arranged based on their functional theme (e.g., metabolic process, immune/stress; see horizontal bars below the stacked bar plots).
Metabolic and cellular processes in the COS list were predominantly represented by down-regulated genes, except for 2 cellular processes: “regulated exocytosis” and “exocytosis” (both in group 32, together with several immune/stress processes), which were represented by up-regulated genes in a slightly higher proportion than down-regulated genes (Figure 6E; for details see Supplemental Table S7). The up-regulated:down-regulated DEG ratio varied among groups of immune/stress processes. For example, processes involved in viral infection, parasite-host interaction, and regulation of stress response were represented by down-regulated genes mostly. On the other hand, the proportion of up-regulated genes was over that of down-regulated in processes related to, e.g., antigen processing and presentation, cytokine production, innate immune response, negative regulation of adaptive immune response, and neutrophil activation. Development/healing processes related to platelet formation and angiogenesis had somewhat more down-regulated than up-regulated representative DEGs, whereas “vascular endothelial growth factor receptor signaling pathway” was represented by a slightly higher number of up-regulated DEGs (Figure 6E and Supplemental Table S7).
qPCR Analysis of Microarray-Identified Transcripts
The log2 FCs calculated using the qPCR data of the same individuals selected for microarray analysis were significantly linearly correlated with the microarray log2 FCs [Supplementary Figure S2 (‘selected samples’ linear regression model); r2 = 0.838]. Adding more biological replicates to the qPCR log2 FC calculation decreased the correlation with the microarray log2 FCs [Supplementary Figure S2 (‘all samples’ linear regression model); r2 = 0.703], but the linear regression model remained highly significant (p < 0.0001).
The co-stimulated salmon (i.e., ASAL/lice) showed higher transcript levels of the putatively immune-related GOIs toll-like receptor 13 (tlr13), C-type lectin domain family 1 member B (clec1b), hepcidin antimicrobial peptide A (hampa), cathelicidin antimicrobial peptide B (campb), saa5, tyrosine-protein kinase Lyn (lyn), B-cell lymphoma 6 protein (bcl6), interleukin 4 receptor (il4r), and chloride intracellular channel 2 (clic2) than the other injection/infection groups (EMM pairwise comparisons; Figures 7A, D, J, L, M, S, U, V, Y). The mRNA levels of C-type lectin domain family 1 member A (clec1a) and mannose receptor, C type 1 (mrc1) were higher in the ASAL/lice salmon than in the non-infected salmon (i.e., PBS/no lice and ASAL/no lice; Figures 7C, E). Interleukin-8 (cxcl8) and mannose binding lectin 2 B (mbl2b) had higher expression levels in the ASAL/lice salmon than in the PBS-treated salmon (i.e., PBS/no lice and PBS/lice; Figures 7G, O). ASAL/lice salmon had higher arachidonate 5-lipoxygenase activating protein (alox5ap) mRNA levels than ASAL/no lice salmon (Figure 7I). These patterns result from the additive (i.e., for tlr13, clec1a, clec1b, mrc1, cxcl8, mbl2b, bcl6, and clic2) and synergistic (i.e., stronger effects than with the sum of the individual factors; for alox5ap, hampa and il4r) effects of ASAL injection and lice infection (GLM results; Figure 7Z). For tlr5a, il1b, campb, and saa5, GLM analyses showed close to significant effects (i.e., 0.05 < p < 0.1; Figure 7Z) for one of the stimuli: ASAL (i.e., campb, saa5, il1b) or lice (i.e., tlr5a). Pairwise comparisons suggest ASAL+lice additive effects on lyn mRNA levels (Figure 7S), but the GLM results were not significant for lice (p = 0.147; Figure 7Z). tlr5a showed an overall ASAL induction (Figure 7Z), but no significant pairwise differences were found between groups (Figure 7B). Regarding the single-stimulus exclusively responsive GOIs, ASAL up-regulated haptoglobin (hp), interferon regulatory factor 1 A (irf1a), nuclear factor kappa B subunit 2 (nfkb2), and programmed cell death 1 ligand 1 (cd274), regardless of lice infection (Figures 7K, Q, R, X, Z). ASAL alone (i.e., ASAL/no lice) up-regulated hampa, lyn, and clic2 compared with the PBS-treated salmon (Figures 7J, S, Y). On the other hand, lice infection up-regulated mannose binding lectin 2 A (mbl2a) and HLA class II histocompatibility antigen gamma chain (cd74), and down-regulated helicase with zinc finger 2 (helz2), regardless of ASAL treatment (Figures 7N, T, W, Z). The complement C1q C chain (c1qc) transcript levels were higher in PBS/lice salmon than in ASAL/no lice salmon (Figure 7P). Total lice load counts were significantly negatively correlated with tlr13 (Figure 7Z) and close-to-significantly negatively correlated with il1b (p = 0.091; Figure 7Z).
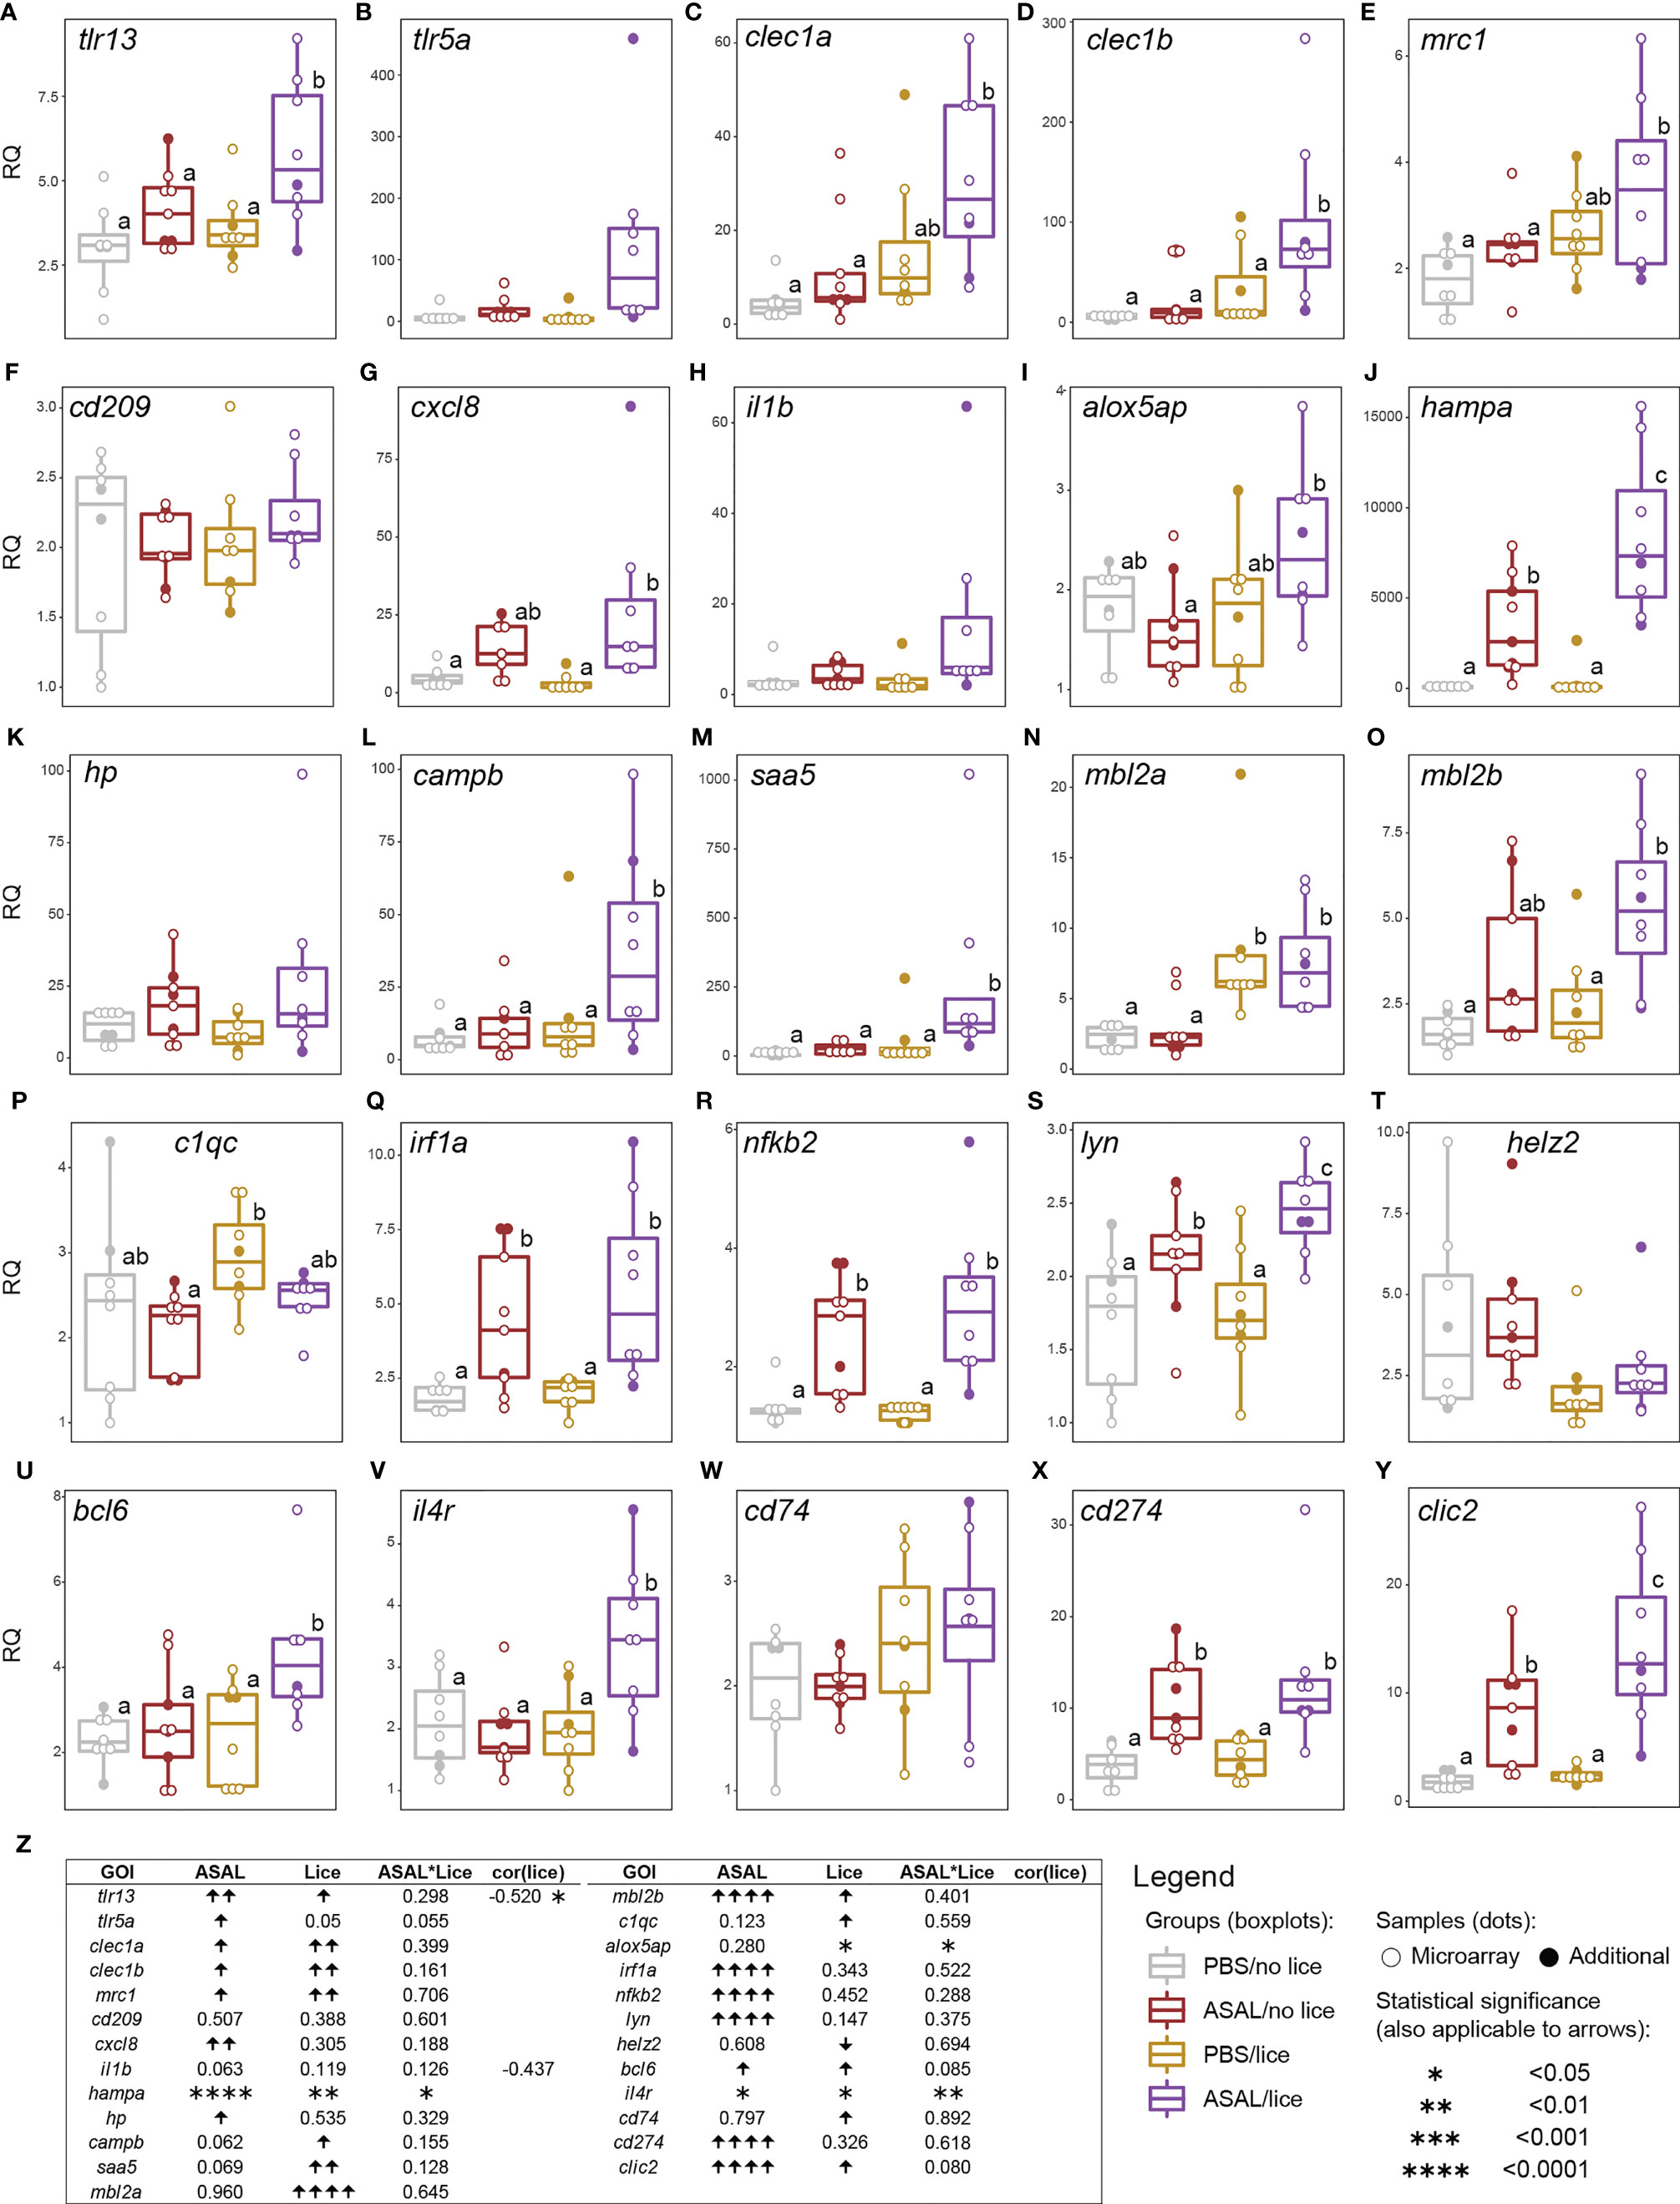
Figure 7 qPCR results of lice, ASAL, and lice+ASAL-responsive genes putatively involved in (A–F) pathogen/damage-associated molecular pattern recognition, (G–I) inflammatory responses, (J–P) innate immune responses, (Q–U) transcriptional regulation in innate and adaptive immune responses, and (V–Y) adaptive immunity-related processes. qPCR data are represented with scatter plot/boxplot overlays (n = 8-9 per injection/infection group). The scatter plot differentiates the additional biological replicates included in the qPCR validation (solid dots) from those selected for microarray analysis (empty dots). Lowercase letters indicate significant differences between groups, as determined by estimated marginal means. (Z) Summary of the results from the generalized linear model (GLM) analysis of the qPCR data and Pearson coefficients (r) for significant gene transcript levels and total lice count correlations. Upward and downward arrows indicate significant up and down-regulation, respectively. Asterisks are used instead of arrows when a significant lice and ASAL interaction (i.e., lice*ASAL) was detected. Asterisks also indicate a significant Pearson correlation. The statistical significance threshold was p < 0.05 for all statistical analyses. il1b’s Pearson coefficient is indicated due to its closeness to statistical significance (i.e., 0.05 < p < 0.10) and physiological relevance.
Among the GOIs putatively involved in cell adhesion, wound healing and mucosal barrier constitution, vascular cell adhesion molecule 1 B (vcam1b), matrix metallopeptidase 2 A (mmp2a), cathepsin B (ctsb), ER membrane protein complex subunit 10 (emc10), calreticulin 3 A and B (calr3a, calr3b), annexin A4 (anxa4), and mucin 2 (muc2) were up-regulated by lice (GLM results; Figure 8R). Lice-infected salmon groups showed higher mmp2a and muc2 mRNA levels than the non-infected (Figures 8D, Q). For vcam1b and anxa4, ASAL/lice salmon showed higher transcript levels than the non-infected salmon (Figures 8B, L). ASAL showed a trend (i.e., close to statistical significance; p = 0.07; Figure 8R) towards ctsb down-regulation, which resulted in significantly lower mRNA levels in ASAL/no lice salmon than lice-infected salmon (Figure 8H). The same pairwise differences were found for calr3a (Figure 8J), and similar pairwise differences for emc10 (i.e., non-infected < PBS/lice; Figure 8I) and calr3b (i.e., ASAL/no lice < PBS/lice; Figure 8K); however, no ASAL effects were detected by the GLM analysis for these genes (Figure 8R). The transcript levels of matrix metallopeptidase 14 (mmp14) and plasminogen activator inhibitor 1 (serpine1) showed an overall induction by ASAL (Figure 8R). ASAL/lice salmon had higher mmp14 expression levels than PBS-injected salmon (Figure 8G). serpine1 did not present significant pairwise differences between groups (Figure 8M). As a result of ASAL*lice interaction, lice infection up-regulated glucosamine (UDP-N-acetyl)-2-epimerase/N-acetylmannosamine kinase (gne) only in the ASAL-injected salmon (i.e., ASAL/lice > ASAL/no lice; Figures 8C, R), and down-regulated mmp13a only in the PBS-injected salmon (i.e., PBS/lice < PBS/no lice; Figures 8E, R), and PBS/lice salmon showed higher sesn1a mRNA levels than the rest of the injection/infection groups (Figures 8P, R). The GOIs vascular cell adhesion molecule 1 A (vcam1a), matrix metallopeptidase 13 B (mmp13b), actinin alpha 1 (actn1), and heme oxygenase 1 (hmox1) did not show significant ASAL or lice effects. Total lice load counts were significantly negatively correlated with ctsb, calr3b, and actn1 (Figure 8R).
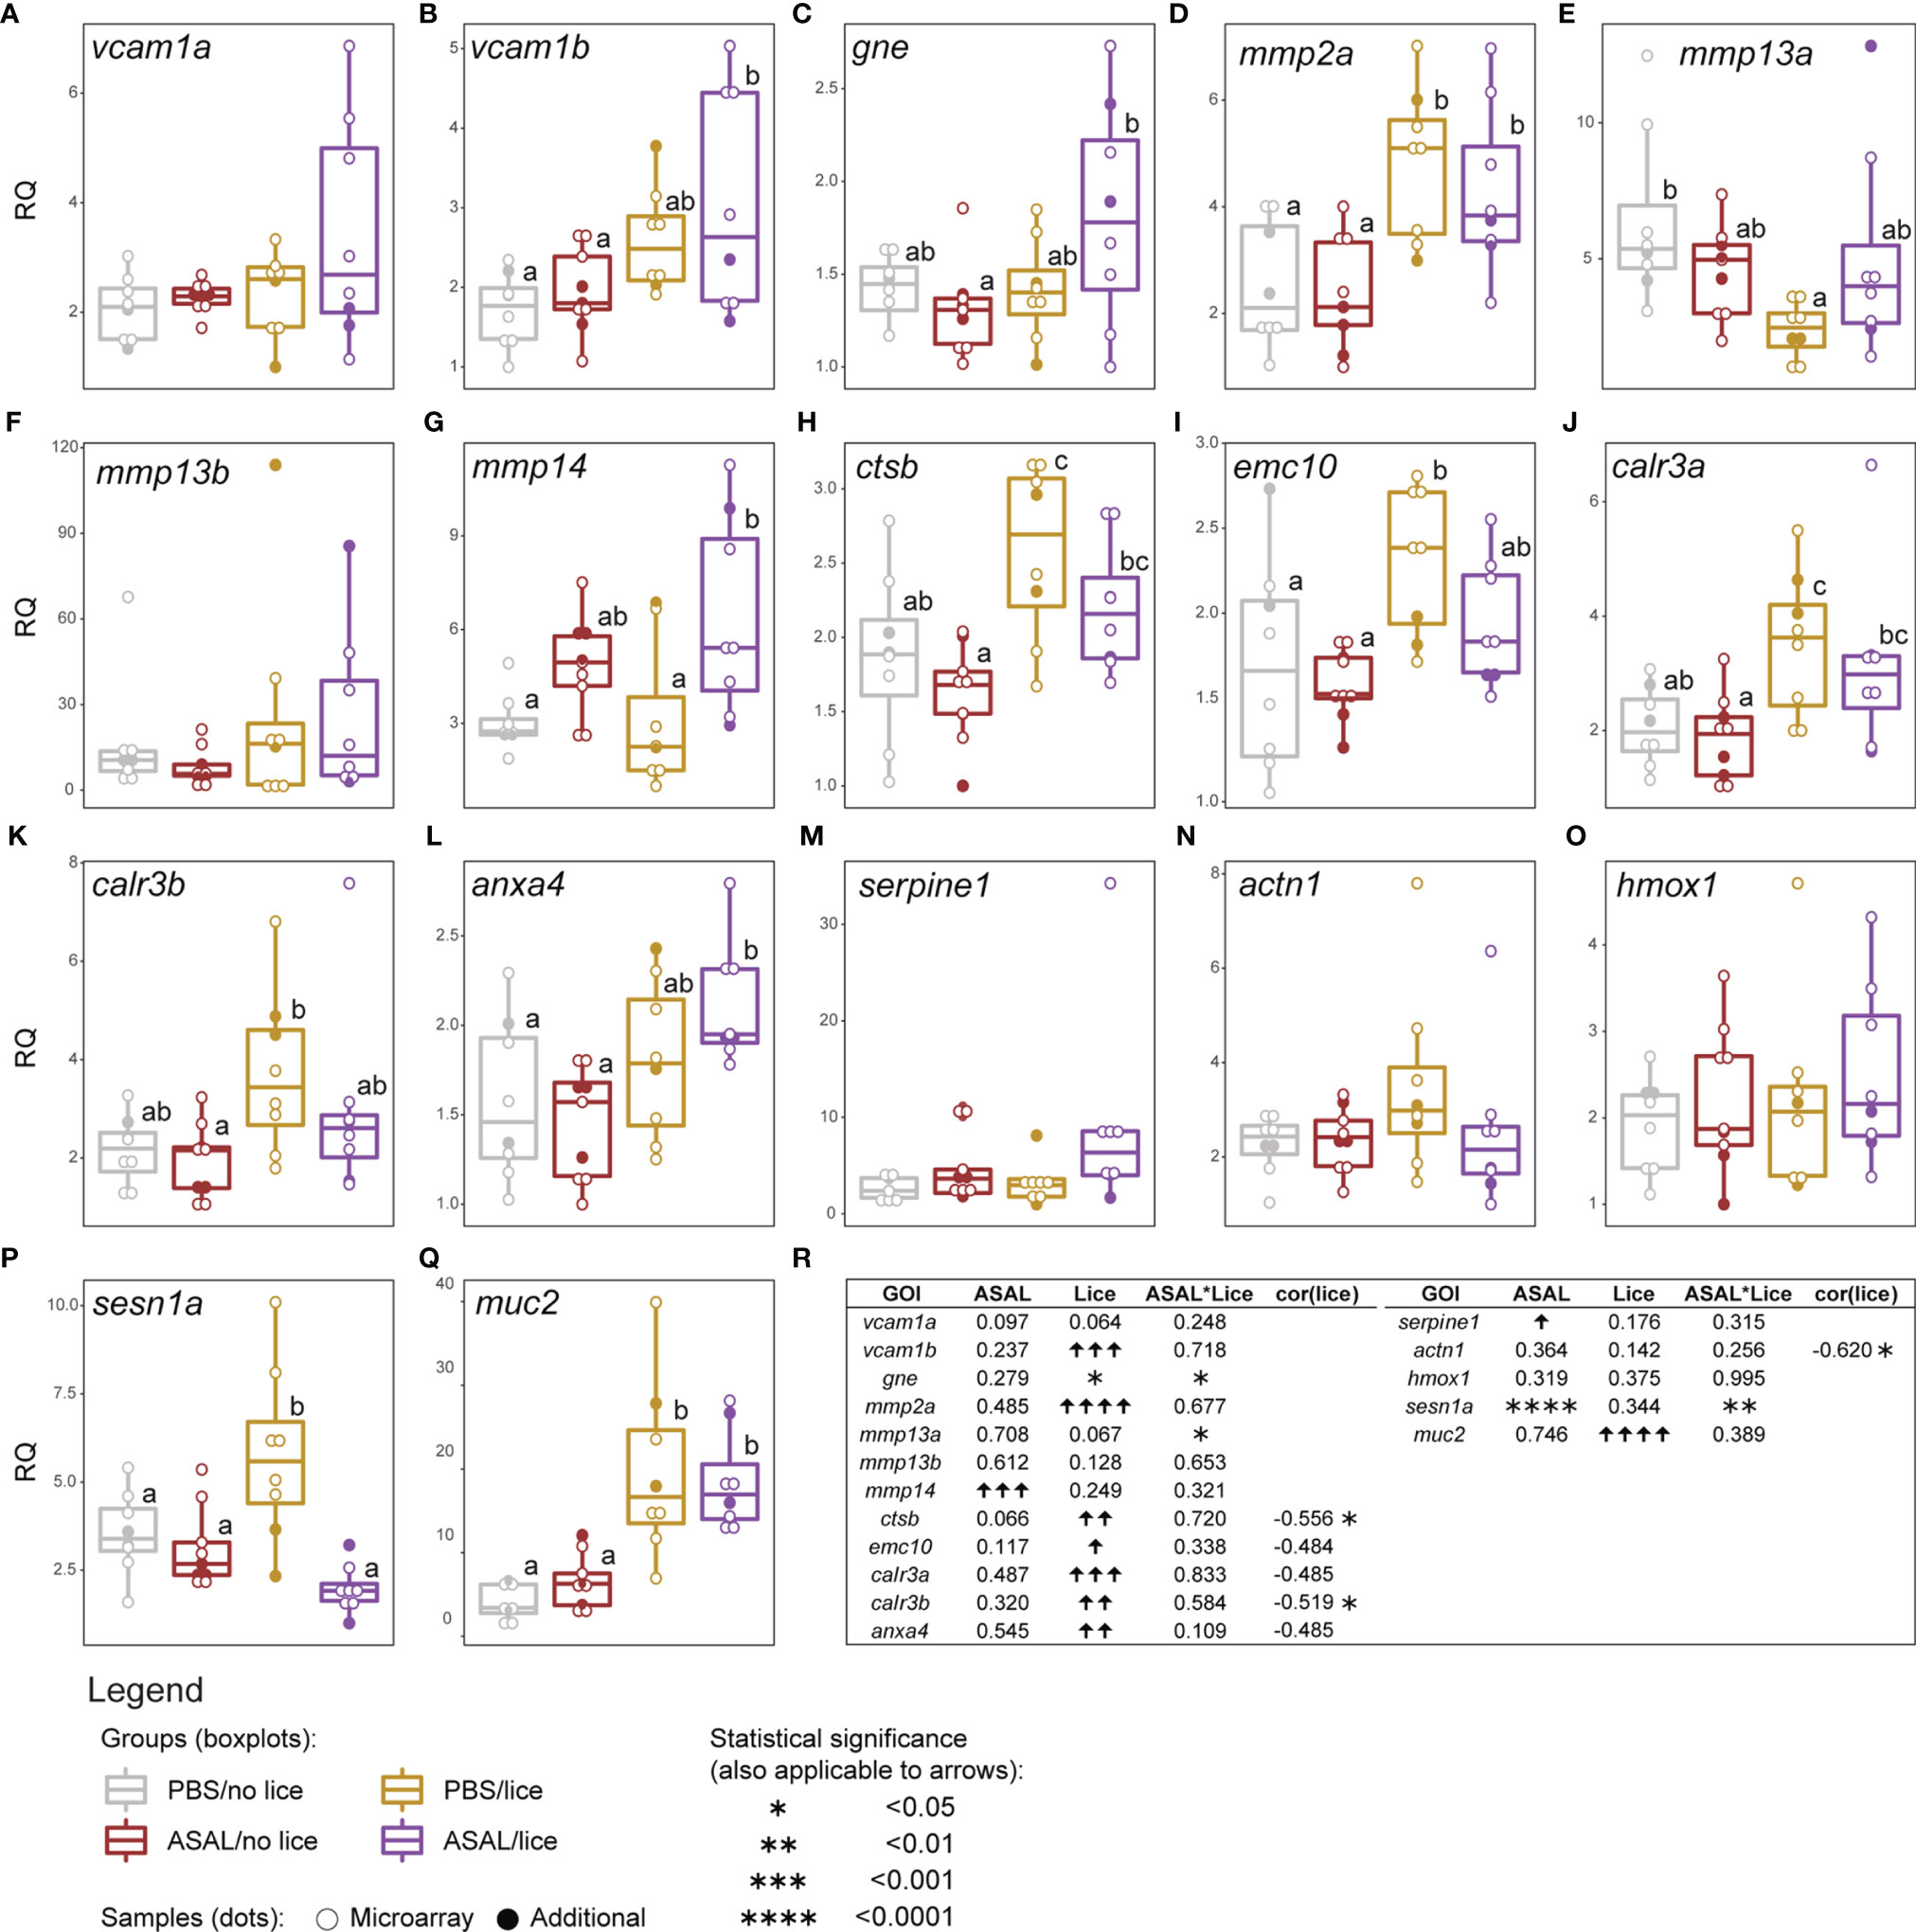
Figure 8 qPCR results of lice, ASAL, and lice+ASAL-responsive genes putatively involved in (A–C) cell adhesion, (D–L) tissue remodeling and development, (M, N) hemostasis and platelet activation, (O, P) heme degradation and protection against oxidative stress, and (Q) constitution of the mucosal barrier. qPCR data are represented with scatter plot and boxplot overlays (n = 8-9 per injection/infection group). The scatter plot differentiates the additional biological replicates included in the qPCR validation (solid dots) from those selected for microarray analysis (empty dots). Lowercase letters indicate significant differences between groups, as determined by estimated marginal means. (R) Summary of the results from the generalized linear model (GLM) analysis of the qPCR data, and the Pearson correlation analysis of gene transcript levels and total lice counts. Upward and downward arrows indicate significant up and down-regulation, respectively. Asterisks are used instead of arrows when significant lice and ASAL interaction (i.e., lice*ASAL) was detected. Asterisks also indicate significant Pearson correlation. The statistical significance threshold was p < 0.05 for all statistical analyses. emc10’s, calr3a’s, and anxa4’s Pearson coefficients are indicated due to their closeness to statistical significance (i.e., 0.05 < p < 0.10) and physiological relevance.
Identification of Gene Expression Patterns
The first two principal components of the PCA explained 54.3% of the variance in the qPCR-analyzed transcripts’ RQs and separated the treatment groups in the multivariate space (Figure 9A). Principal component 1 (PC1) segregated the ASAL/lice salmon (right) from the PBS/lice and ASAL/no lice salmon (center), and the PBS/no lice (left). Principal component 2 (PC2) segregated the PBS/lice salmon (top) from the other three groups (bottom). The top 10 transcripts contributing to PC1 comprised namely transcripts up-regulated by lice infection and ASAL injection in an additive (e.g., clec1a, clec4b, mrc1) or synergistic (e.g., alox5ap, clic2, il4r) fashion (Figure 9B). All transcripts except for sesn1a (lice-induced only in PBS-injected salmon) and helz2 (lice-repressed) had positive PC1 loadings (Figure 9D). Hence, ASAL/lice salmon presented the highest PC1 scores. On the other hand, the top 10 transcripts contributing to PC2 were either up-regulated by lice (positively correlated with PC2 scores; e.g., emc10, ctsb, mmp2a) or ASAL (negatively correlated with PC2 scores; e.g., nfkb2, irf1a, cxcl8) (Figure 9C). Consequently, PBS/lice salmon showed the highest PC2 scores, and ASAL/no lice the lowest. As shown in Figures 9F–H, ASAL and lice-derived effects on PC1 and PC2 scores were statistically significant.
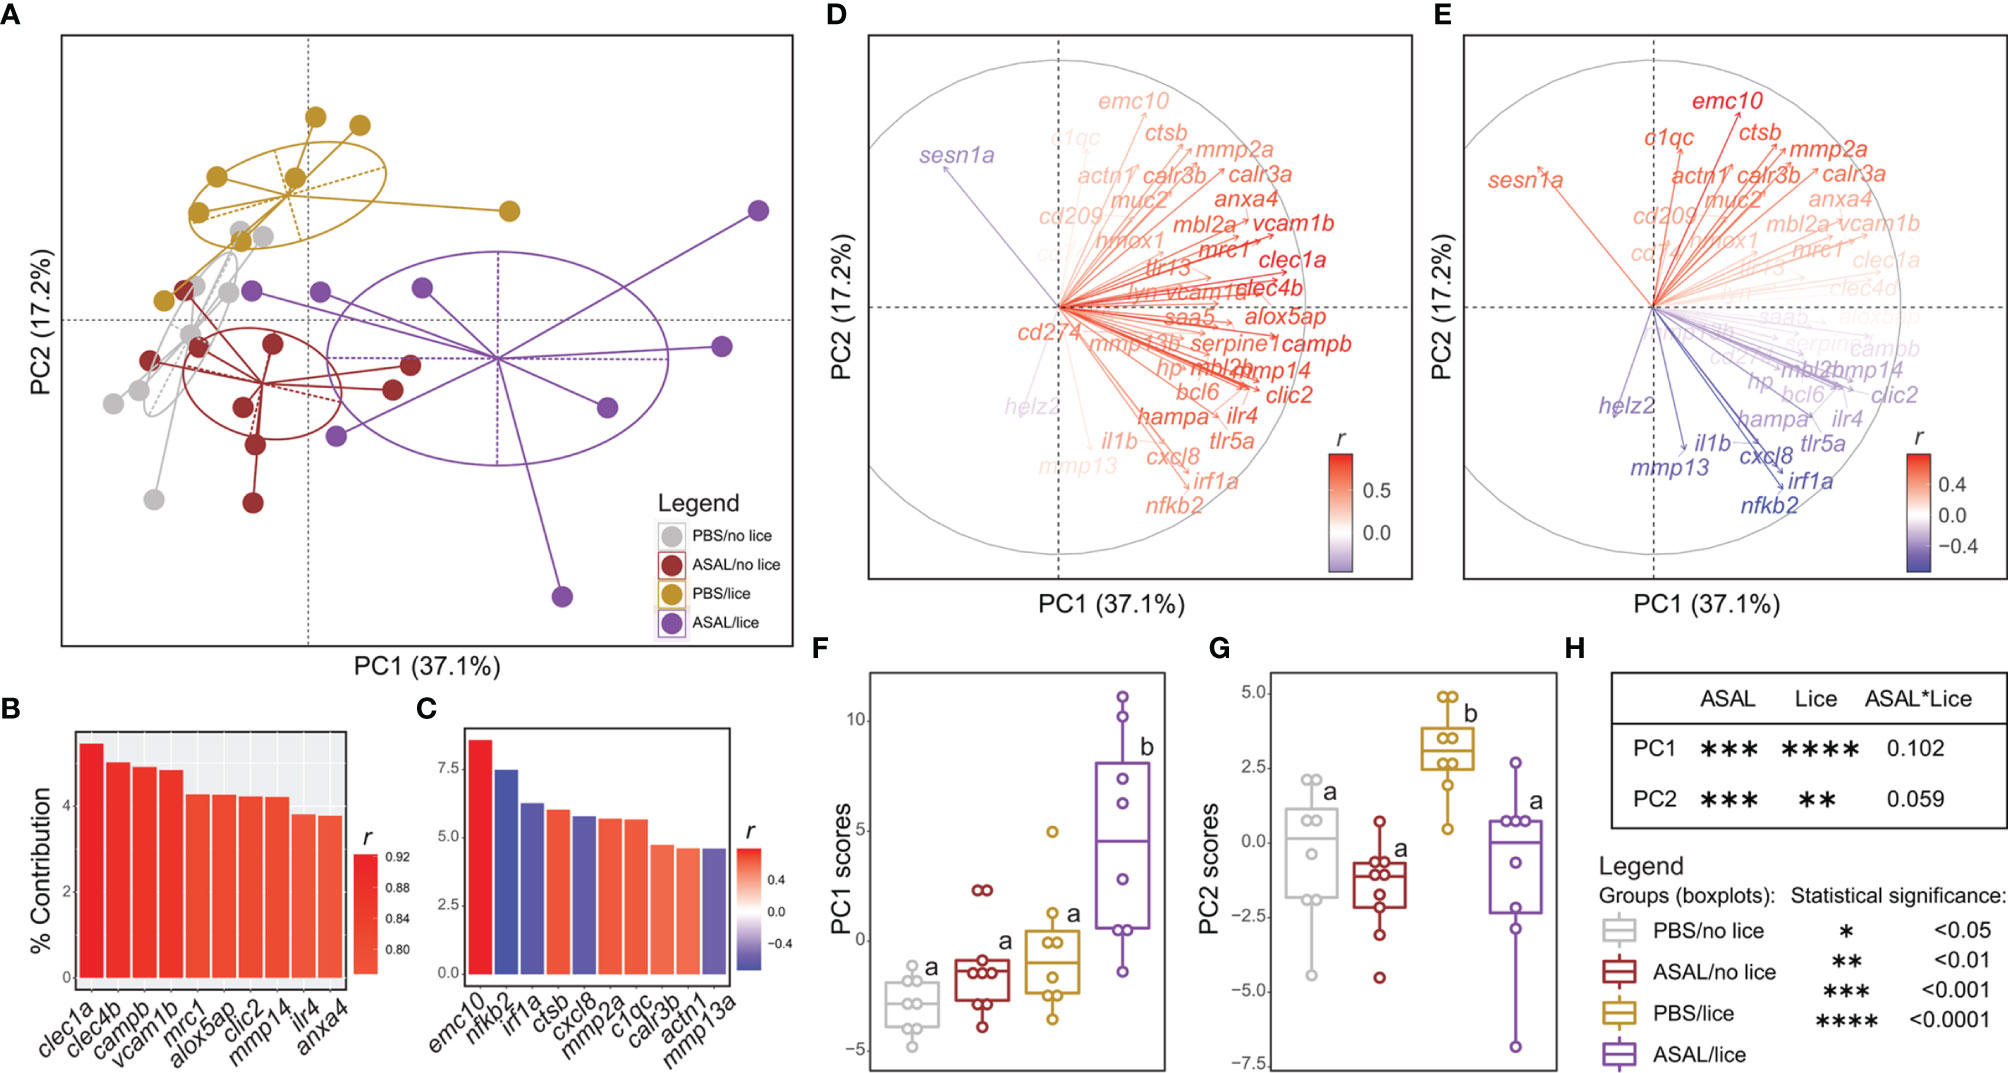
Figure 9 Principal component analysis (PCA) of the microarray validation qPCR data. (A) PCA plot illustrating the distribution of all salmon included in the qPCR validation experiment (n = 33) in the multivariate space. The dots on the plot represent salmon and are colored based on the injection/infection group to which they belong. (B, C) Bar plot representing the top 10 GOIs contributing (%) to the PC1 and PC2 variances, respectively. Each GOI’s bar is colored based on their correlation with the variance explained by PC1 (B) and PC2 (C). (D, E) Loading vector plot showing the association of each GOI with the variance explained by PC1 and PC2. Vectors are colored based on their correlation with PC1’s (D) and PC2’s (E) variances. (F, G) Scatter plot/boxplot overlays representing individual/group PC1 and PC2 score data, respectively. Lowercase letters indicate significant differences between groups, as determined by estimated marginal means. (H) Summary of the results from the generalized linear model (GLM) analysis of the PC1 and PC2 score data. The significance threshold was p < 0.05 for all statistical analyses.
Complementary qPCR Experiment (Att vs. Adj Skin Sites)
None of the selected transcripts showed significantly different expression levels between louse attachment (Att) and adjacent skin sites (Adj) (Figures 10A–F). All transcripts except for saa5 (Figure 10C) were significantly up-regulated by ASAL.
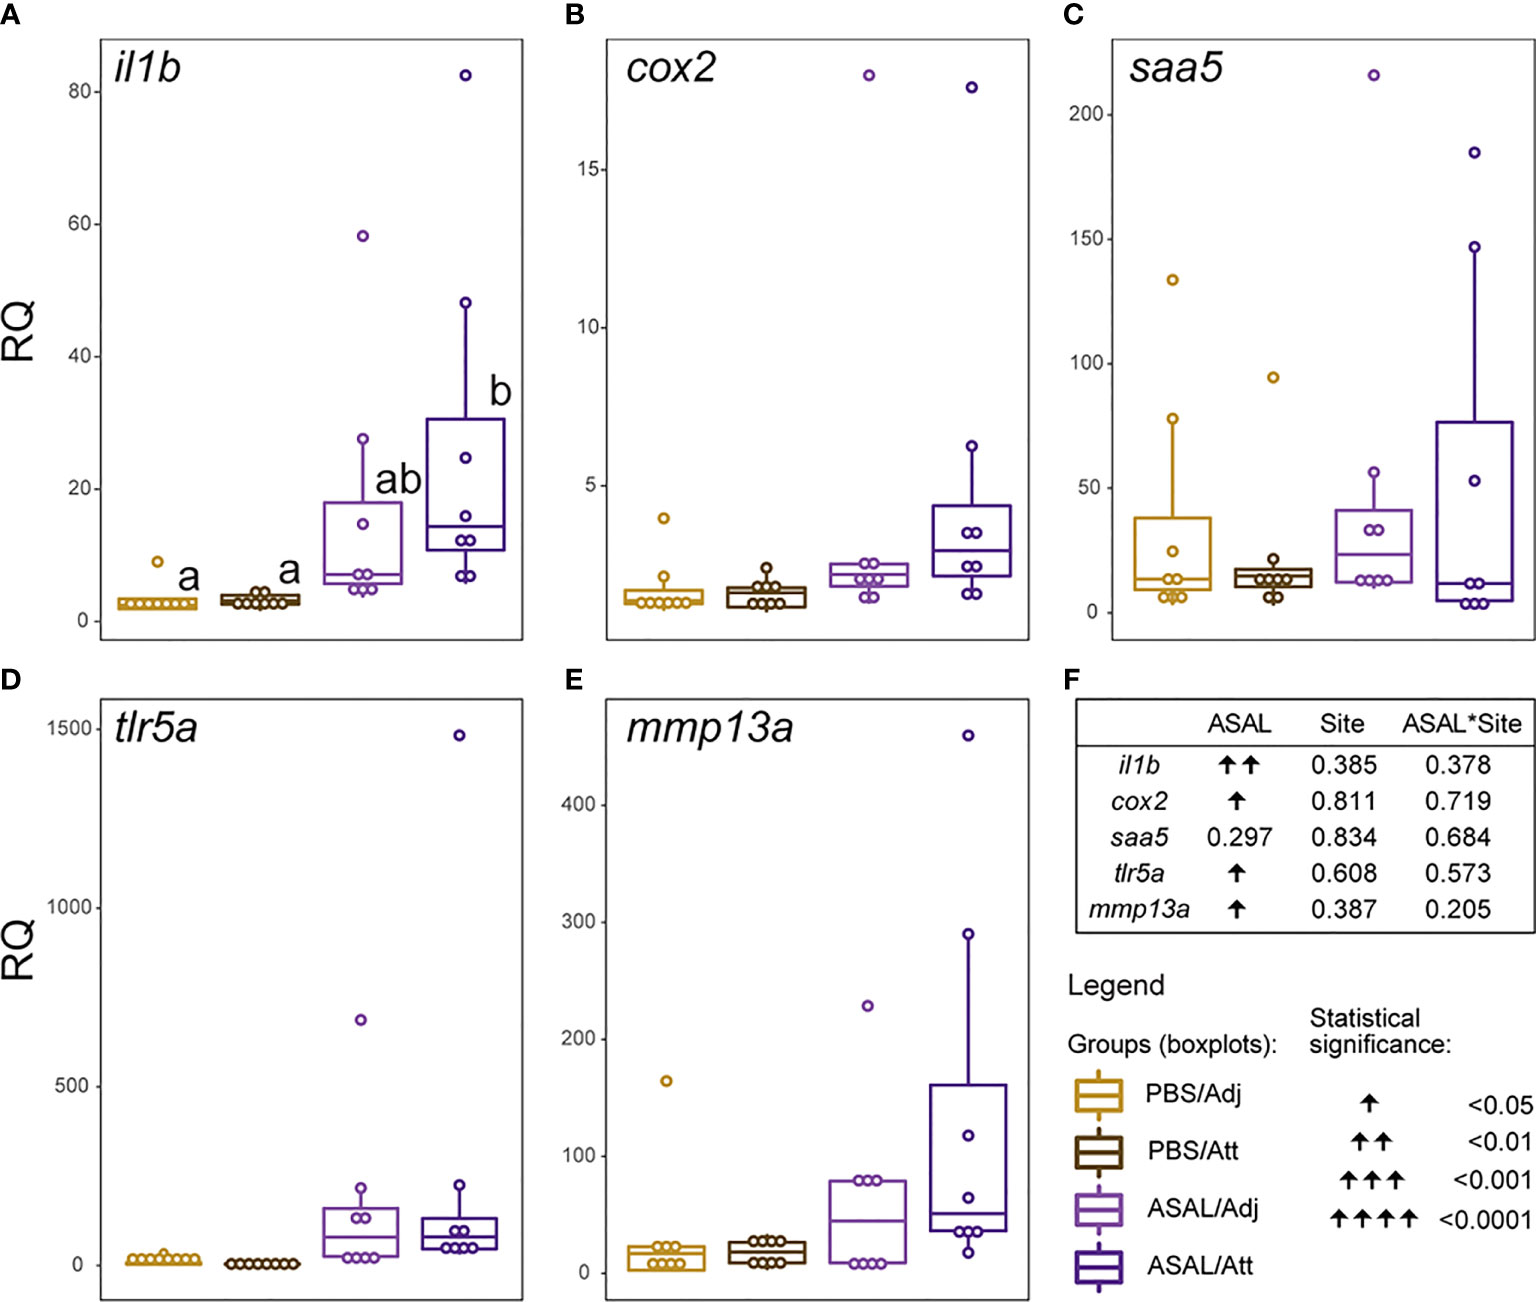
Figure 10 (A–E) Scatter plot/boxplot overlays representing individual/group data of the complementary qPCR experiment examining the differences in the expression levels of a selection of immune-relevant biomarker genes between louse-attachment (Att) and adjacent (Adj) skin sites. Lowercase letters indicate significant differences between groups, as determined by estimated marginal means. (F) Summary of the results from the generalized linear model (GLM) analysis of the qPCR data. The significance threshold was p < 0.05 for all statistical analyses.
Discussion
Skin Transcriptome Response to Lice Infection and Its Modulation by the ASAL Bacterin Stimulus
Pre-adult L. salmonis infection provoked extensive transcriptomic changes (i.e., 2,534 DEPs; Figure 2) in the skin of the PBS-injected salmon [i.e., Lice(PBS) list], characterized by the predominance of repressed transcripts putatively involved in housekeeping metabolic and cellular processes such as nucleic acid/protein metabolism (Figure 6). Umasuthan et al. (34) reported similar biological processes as dysregulated by L. salmonis chalimus I in the fins of Atlantic salmon, although some of these processes were represented mainly by induced genes. The overwhelming over-representation of housekeeping biological processes highlights the lesser representation of transcripts with putative roles in immune/stress processes. Furthermore, most immune/stress response-related transcripts were repressed as well. As confirmed by qPCR analysis, lice infection did not induce the inflammation biomarker genes il1b, cxcl8, and cox2 (52–55) at the louse attachment and/or adjacent dorsal skin sites of PBS-injected salmon (Figures 7, 10). The transcription of il1b and cxcl8 had not shown a significant response to pre-adult L. salmonis infection in Atlantic salmon intact dorsal skin (56), nor had they been microarray-detected in L. salmonis-damaged skin compared with intact skin (24). Sea lice infection has repeatedly been described as immunosuppressing Atlantic salmon directly –via secretion of inflammation response-inhibitory substances– and indirectly –via chronic stress effects– (9, 11, 57). Chronic stress can also force fish into adaptive physiological changes (58–60), which could be responsible for the aforementioned repression of metabolic and cellular processes. Also, Atlantic salmon have shown opposed transcriptomic responses depending on the sea lice life stage (11), which may explain the discrepancy between the present study and Umasuthan et al. (34). Further research is required to determine whether such repression response reflects a physiological coping mechanism by the salmon upon lice infection or the salmon’s metabolism reprogramming by the parasite.
The present microarray and qPCR analyses evidenced pre-adult L. salmonis immunosuppressive effects on the transcript levels of interferon (IFN)-stimulated genes in the PBS-injected salmon (Figure 7 and Supplemental Table S2); for example, radical S-adenosyl methionine domain-containing 2 (rsad2, alias viperin) (46, 61, 62), interferon-induced protein with tetratricopeptide repeats 5 (ifit5) (46, 63, 64), or helz2 (46, 65). In fact, 6 of the GO terms over-represented in Lice(PBS) referred to antiviral processes (e.g., “defense response to virus”). The available literature demonstrates that L. salmonis parasitism hinders Atlantic salmon antiviral responses, thus increasing their susceptibility to viral infection [e.g., to infectious salmon anemia virus (ISAv)] (11, 66). In addition to IFN-dependent signaling pathways, L. salmonis infection in the PBS-injected salmon repressed many genes involved in mitogen-activated protein kinase (MAPK) pathways [e.g., TNF receptor-associated factor 2 (traf2), mapk8, interleukin-1 receptor-associated kinase 4 (irak4)] and stress response [e.g., several heat shock protein (HSP)-encoding genes].
Despite the absence of a clear pro-inflammatory gene expression profile, the Lice(PBS) list presented several up-regulated transcripts putatively involved in fish skin immune defense against pathogens (Figure 7 and Supplemental Table S2). For example, the increased expression of c1qc and mbl2a suggests the activation of both classical and lectin complement systems, respectively (67, 68). The qPCR analyses also confirmed the slight up-regulation of cd74 by L. salmonis infection, which may suggest enhanced MHCII molecule transport for endocytic antigen capture (69). Increased mucus production is a typical feature in Atlantic salmon skin’s response to L. salmonis infection (11). In agreement with the latter, muc2 –encoding a constituent of fish skin mucus (70)– was one of the most intensely induced genes in the Lice(PBS) list. Also, some dysregulated metabolic or cellular processes in Lice(PBS) (e.g., “protein modification process”) can be linked to stress response through the up-regulated genes representing them [e.g., hypoxia-inducible factor 1-alpha (hif1a), a hypoxia biomarker in fish (71); mapk8, reported as responsive to hypotonic stress in Lateolabrax maculatus (72); sesn1a, involved in cell protection against oxidative stress (73)].
The Lice(PBS) list was also characterized for the lack of over-represented development/healing-related biological processes (Figure 3). The list, nevertheless, included some up-regulated genes putatively related to wound healing (Figure 8 and Supplemental Table S2): e.g., anxa4 [tissue regeneration (74)], calr3a and calr3b [hypertrophy-like and thrombopoiesis processes (75, 76)], periostin [postn; ketatinocyte proliferation, myofibroblast differentiation, and fibrillogenesis (77, 78)], and mmp2a [scarring resolution (79)]. In the present study, mmp2a was the only microarray-detected matrix metalloproteinase-encoding gene up-regulated by L. salmonis infection in PBS-injected salmon –mmp13a was lice-repressed–. Umasuthan et al. (34) found decreased transcript levels of mmp2 in Atlantic salmon fins infected with chalimus L. salmonis. Discrepancies in mmp (e.g., mmp13, mmp9, mmp2) transcriptional patterns are common in L. salmonis infection research (24, 27, 28, 34, 80), especially when different sea lice life stages are considered. Like Skugor et al. (24), the protease-encoding transcript ctsb was lice-induced in the Atlantic salmon dorsal skin. ECM degradation by CTSB enables the recruitment of keratinocytes in the wound area in mammals (81). The up-regulation of emc10 by lice infection supports the endothelial cell migration promotion hypothesis (i.e., mmp2a up-regulation) and may suggest new blood vessel formation in the PBS-injected fish (i.e., angiogenesis), based on the mammalian literature (82). Angiogenesis is a necessary process during the proliferative phase of wound healing (78). Some parasites are known to stimulate angiogenesis in their human (83) and fish (84) hosts. However, it seems unlikely that ctsb and emc10 up-regulation could favor L. salmonis infection since ctsb was negatively correlated with total lice counts, while emc10 showed a similar trend (i.e., almost significantly correlated; p = 0.06). Alternatively, increasing the skin’s microvessel density could be a protective mechanism to improve the recruitment of cells with anti-parasitic and wound healing roles (85). In sum, the above results may suggest the occurrence of molecular changes in the intact skin to support wound healing at the louse attachment sites.
Compared with the PBS-injected salmon, lice infection had a substantially lesser effect on the skin transcriptome in the ASAL-injected salmon [i.e., 85 DEPs in the Lice(ASAL) list vs. 2,534 in the Lice(PBS) list; Figure 2]. Furthermore, in contrast with Lice(PBS), Lice(ASAL) was mostly composed of lice-induced transcripts putatively involved in immune/stress and development/healing-related processes (Figure 6). Additionally, the microarray results suggest ASAL injection mitigated lice repressive effects on these genes [i.e., not detected in the Lice(ASAL) list]. As evidenced by ASAL(lice) lists, the ASAL bacterin injection induced a strong immune response in the lice-infected salmon skins (discussed in the next section).
The ASAL-injected salmon showed signs of a more robust immune response to L. salmonis infection than the PBS-injected fish. The Lice(ASAL) list presented highly lice-induced genes (i.e., fold-change >2; Figure 7 and Supplemental Table S2) with roles in APRs [i.e., saa5 (86)], eicosanoid synthesis [i.e., arachidonate lipoxygenase 3 (aloxe3) (87)], antiviral responses [e.g., interferon-induced protein 44 (ifi44) (62, 65)], and T helper 2 (Th2)-type immune response [i.e., interleukin-13 receptor subunit alpha-2 (il13ra2) (88)]. Besides, the Lice(ASAL) list over-represented biological processes related to neutrophil degranulation (Figure 3), which is a key process in innate immune responses (89). Moreover, a pronounced influx of neutrophils in the inflammation site seems to be one of the main features of lice-resistant coho salmon (7, 9, 90). In this sense, the microarray analysis also identified several lice-induced genes potentially encoding neutrophil granule proteins (91) such as antimicrobial peptides (e.g., camp), proteases [ctsb, mmp2a, disintegrin and metalloproteinase domain-containing protein 9 (adam9)], and heat shock 70 kDa protein 4L (hspa4l). Like the PBS-injected salmon, cxcl8 –which encodes a known neutrophil chemoattractant (88, 92)– was not significantly lice-induced in the ASAL-injected salmon. Yet, cxcl8 was one of the main contributors to the segregation of PBS/lice salmon (i.e., no-inflammatory-response phenotype) from the other groups in the PCA (Figure 9). Also, as Braden et al. (90) argued, the induction of acute-phase protein (APP)-encoding genes in the skin –saa5 in the present study– could be behind the recruitment of inflammatory cells in lice-infected Atlantic salmon. Another finding suggesting anti-lice properties for the ASAL treatment was the up-regulation of hampa, which was only observed in the ASAL-stimulated salmon. HAMP decreases the availability of iron in plasma (93), thus constituting an effective defense mechanism against hematophagous parasites like L. salmonis. Indeed, lice-resistant salmonid species and Atlantic salmon fed an anti-lice functional diet showed a strong induction of genes encoding iron-binding proteins (26, 94). Finally, Th2-type gene expression signatures have also been found in the skin of L. salmonis-resistant salmonid species (90). The lice-induction of il13ra2, which encodes an IL13 decoy receptor (88), could be interpreted as a sign of Th2 polarization inhibition. However, the concomitant up-regulation of il4r [Th2 cell biomarker (88)] and genes involved in wound healing (discussed below) may suggest the contrary.
The much smaller size of the Lice(ASAL) list compared with Lice(PBS) may be due to the ceasing of the lice-repressing effects on genes involved in cell housekeeping processes. The dissolution of such extensive transcriptomic changes within the ASAL-injected group made skin development-related transcripts proportionally more important in the Lice(ASAL) list. In addition, 3 of these genes [i.e., aloxe3, desmocollin-2 (dsc2), and fibroblast growth factor receptor 1 (fgfr1)] had induction fold-changes amply above (e.g., 15-fold up-regulation for aloxe3) those of any of the lice-induced genes in the Lice(PBS) list (Supplemental Table S2). ALOXE3 participates in forming the skin permeability barrier in humans (86) and was induced upon thermal stress in the Antarctic fish Notothenia coriiceps (95). DSC2 is a desmosomal cadherin that mediates in mammalian and fish tissue development processes involving cell-cell adhesion (96) and has been found up-regulated in human venous ulcers (97). FGFR1 knockout in murine keratinocytes impaired their migration at the wound edge (98). Other up-regulated tissue regeneration-relevant genes in Lice(ASAL) may imply the stimulation of the canonical Wnt pathway and epithelial-mesenchymal transition [i.e., catenin beta-1 (ctnnb1) (99)], cornification [i.e., keratin 8 (krt8) and envoplakin (evpl) (100)], and cell-cell and cell-ECM adhesions [i.e., integrin subunit alpha V (itgav) (101), fibrillin-1 (fbn1) (102), adam9 (103), and ctsb (81)]. In sum, as a transient activator of the skin’s immune defenses, it could be hypothesized that ASAL injection could have mitigated some of the adverse physiological effects of L. salmonis infection [e.g., immunosuppression, impaired wound healing (11)].
Skin Transcriptome Response to ASAL Bacterin and Its Modulation by Lice Infection
The present study provides the first insights into Atlantic salmon’s skin transcriptomic response 24 h after an intraperitoneal injection of an A. salmonicida bacterin vaccine (ASAL) and its modulation by L. salmonis parasitism. Similar ASAL preparations elicited strong anti-bacterial gene expression responses in the spleen and head kidney of IP-treated steelhead trout (Oncorhynchus mykiss) (104) and Atlantic cod (29–31). Herein, the transcriptome of Atlantic salmon’s skin showed significant changes in response to ASAL (Figure 2), mostly comprised of up-regulated transcripts putatively related to immune/stress processes (Figure 6). The magnitude of these responses was markedly influenced by the absence/presence of L. salmonis infection, with the lice-infected showing a larger number of DEPs than the non-infected [i.e., 283 DEPs in the ASAL(lice) vs. 27 in the ASAL(no lice)]. Nevertheless, and in alignment with previous studies on fish systemic response to ASAL (29–31, 104), both lists shared up-regulated genes encoding proteins putatively involved in iron homeostasis [i.e., hampa (93)], inflammation [e.g., cd274 (alias pdl1), an M1 macrophage biomarker (105)], and proteolysis-mediated immune processes [i.e., cathepsin L (ctsl), with roles in apoptosis, ECM degradation, antigen processing, and mucosal immunity (106–108)] (Figure 7 and Supplemental Table S2). In general, L. salmonis-infected and non-infected salmon shared gene expression signatures suggesting enhanced leukocyte recruitment [i.e., C-C motif chemokine 2 (ccl2, alias mcp-1), lyn, and clic2 (109–111)] and infiltration [i.e., high affinity immunoglobulin gamma Fc receptor I (fcgr1a) (112)], possibly aided by increased angiogenesis and vessel permeability [i.e., G-protein coupled receptor 4 (gpr4) (112, 113)].
The larger number of ASAL-responsive DEPs in the skin of sea lice-infected salmon [i.e., ASAL(lice)] may signify a more vigorous response to the bacterin and the overcoming of some of the lice immunosuppressive effects discussed above. The microarray data from the PBS/lice salmon suggested changes in the skin’s cell composition (e.g., enrichment in keratinocytes and fibroblasts) and increased angiogenesis, which could be a contributing factor to the higher magnitude of the ASAL response in the lice-infected salmon. The limited number of GO terms over-represented in ASAL(no lice) prevented identifying sea lice modulatory effects on the Atlantic salmon skin’s response to ASAL at the biological process level. In any case, the list of over-represented biological processes in ASAL(lice) provided a well-defined picture of the anti-bacterial skin transcriptome response to ASAL in the L. salmonis-infected salmon (Figure 4).
ASAL response in L. salmonis-infected salmon dysregulated molecular pathways related to PAMP detection by pathogen recognition receptors (PRRs; Figure 4). Contributing to the over-represented GO term “toll-like receptor signaling pathway”, there were genes encoding proteins involved in NF-κB activation via myeloid differentiation primary-response protein 88 (MyD88)-dependent signaling [irak4 (114), baculoviral IAP repeat-containing protein 3 (birc3, alias ciap2) (115)] and TRIF-dependent [TRAF family member-associated NF-kappa-B activator (tank) (116)] toll-like receptor (TLR) cascades (Supplemental Table S5). The over-representation of the terms “response to lipopolysaccharide” and “defense response to Gram-positive bacterium” suggests that the detection of different A. salmonicida PAMPs [e.g., lipopolysaccharides (LPS), peptidoglycans] contributed to the observed transcriptomic response to ASAL. The qPCR analysis found two PRR-encoding transcripts tlr5a [bacterial flagellin detection (117)] and tlr13 [bacterial 23S rRNA detection (118)] induced in ASAL/lice compared with PBS/lice salmon (Figure 7). The ASAL induction of TRAF-interacting protein with FHA domain-containing protein A (tifa) and C-type lectin domain family 4 member D (clec4d) may imply the dysregulation of two additional PRR pathways: the α-kinase 1 (ALPK1)-TIFA signaling pathway (119); and the C-type lectin receptor (CLR)/tyrosine-protein kinase (SYK) signaling pathway (120) (Supplemental Table S2).
NF-κB and MAPK pathways activation after PAMP detection induce the production of pro-inflammatory cytokines by innate immune cells (114, 117, 121), such as TNFA, IL1B, IL6, and IL18; and pro-inflammatory prostaglandins via increased COX2 expression. ASAL-injected lice-infected salmon showed up-regulated mRNA levels of il1b and cox2 (Figure 10) and il18 (Supplemental Table S2), as well as multiple genes over-representing “response to interleukin-1” and “response to interleukin-6” (Supplemental Table S5). Previous studies of ASAL-challenged fish showed tnfa and il1b mRNA levels in the spleen and head kidney decreased rapidly after peaking at 3-6 h post-exposure (31, 104). Considering that the skin samples were collected 24 h post-PBS/ASAL treatment, the slight il1b and absence of tnfa and il6 induction observed here may reflect the normal progression of the molecular response of Atlantic salmon skin to ASAL. Nevertheless, as discussed below, a cascade of molecular events triggered by these pro-inflammatory cytokines could be inferred based on the ASAL(lice) list.
IL1B, IL6, and lipid mediators synthesized by the COX2 pathway alter the surrounding cells’ and tissues’ function and structure and cause increased vascular permeability, swelling, cell adhesion, and angiogenesis while promoting the activation, proliferation, and differentiation of leukocytes in mammals and fish (52, 85, 122). The ASAL(lice) list suggests that ASAL treatment in L. salmonis-infected salmon activated pathways promoting angiogenesis and endothelial barrier permeability [e.g., G-protein coupled receptor 4 (gpr4) up-regulation (112, 113)], and cell adhesion [i.e., the induction of intercellular adhesion molecule 1 (icam1) and E-selectin (sele) (85, 113, 123)] (Supplemental Table S2). The ASAL(lice) list also showed a slight up-regulation of serpine1 (Figure 8), which is involved in blood coagulation (hemostasis), and cell adhesion and migration (124, 125). Flavobacterium columnare infection induced serpine1 expression in the skin of channel catfish (Ictalurus punctatus) (126). ECM degradation by MMPs and other proteinases enables angiogenesis and cell migration –hence, it facilitates leukocyte recruitment at the infection/inflammation site (85, 127). Here, ASAL up-regulated mmp14 in the skin of lice-infected salmon (Figure 8). Zebrafish MMP14 has been determined as collagenolytic and necessary for scar resolution (128). The intestine of Japanese flounder (Paralichthys olivaceus) showed high mmp14 induction after immersion vaccination with live attenuated Edwardsiella tarda, which was proposed as a means of enhancing cell migration (129). Taken together, the aforementioned ASAL-induced genes depict putative changes in the skin microvasculature and endothelial function consistent with inflammation and increased leukocyte recruitment.
Within the L. salmonis-infected salmon, and besides serpine1, the ASAL treatment activated the transcription of other genes involved in hemostasis (Supplemental Table S2) such as fibrinogen alpha chain (fga) and P2Y purinoceptor 1 (p2ry1). Fibrinogen is cleaved by thrombin into fibrin, a major component of blood clots, which also assists in tissue repair and immune processes by accumulating phagocytes, endothelial cells, and fibroblasts, as well as cytokines and growth factors (130, 131). As for p2ry1, mammalian P2RY1 (alias P2Y1) is known to exert pro-coagulant effects by mediating in platelet aggregation (132). On the other hand, the ASAL(lice) list also revealed increased mRNA levels of thrombomodulin (thbd), a gene known in mammals for the anti-coagulant function of its protein product (133). ASAL also up-regulated coagulation factor V (f5) in the lice-infected salmon. Post-translational modifications can confer the mammalian F5 either pro- or anticoagulant activity (134). All in all, these results suggest that the coagulation cascade was activated by A. salmonicida bacterin in the intact skin of lice-infected salmon, agreeing with previous studies on fish mucosal tissues exposed to live bacterial pathogens and antigens (126, 129, 135).
Several of the hemostasis-relevant proteins discussed above (e.g., SERPINE1, FGA) fall within the category of APPs in many vertebrates, including fish (136). Although APPs are predominantly expressed by hepatocytes to be secreted into the blood, they can also be produced by endothelial cells and leukocytes activated by pro-inflammatory cytokines (e.g., IL1B and IL6) at the site of infection (136, 137). The ASAL(lice) list showed induced saa5 transcript levels in the lice-infected salmon (Figure 7 and Supplemental Table S2). SAAs are some of the best-known APPs in vertebrates and play various roles in APRs (e.g., lipid metabolism regulation, immunomodulatory activity) (136, 137). The ASAL induction of hampa and, at a much lower extent, hp may have been intended to reduce iron availability for bacterial growth (93, 138). Proteins and transcripts in the complement system –often referred to as involved in APRs (136)– have been identified as responsive to bacterial infection in the fish skin mucus (139). The ASAL(lice) list showed up-regulated transcript levels of mbl2b, complement component C7 (c7), and C3a anaphylatoxin chemotactic receptor (c3ar1). Interestingly, mbl2a only responded to L. salmonis infection, which may suggest regulation divergence between the two mbl2 paralogues and, possibly, different functions [e.g., complement pathway activation after binding lice (MBL2A) or A. salmonicida-specific (MBL2B) carbohydrate PAMPs]. In mammals, C7 takes part in the lysis of target pathogen’s membranes as a component of membrane attack complex (MAC) (68, 140), whereas C3 promotes chemotaxis, degranulation, and reactive oxygen species (ROS) production in C3AR1-expressing myeloid cells (e.g., granulocytes, macrophages) (68). Outside the complement system, ASAL also up-regulated the transcription of lysozyme C (lyz) and campb within the L. salmonis-infected salmon. Fish LYZ and CAMP functional characterization has evidenced bacterial cell wall-lysing activity (141, 142), and both proteins are part of fish skin bactericidal weaponry (70, 139, 143).
In sum, the ASAL-injected Atlantic salmon’s skin transcriptome showed traits of M1/Th1 (i.e., cytotoxic) or M2 (macrophage)/Th2 (i.e., tissue repair)-type immune responses. The activation of M1/Th1 marker genes by ASAL [e.g., ccl2, cd274, cxcl11, cxcl8, cxcl11 (88, 105, 144–146)] was unequivocal (Figure 7 and Supplemental Table S2). However, the present microarray analyses also revealed the putative activation of molecular countermeasures to keep skin’s inflammation and cytotoxic responses to ASAL in check, as inferred from the increased mRNA levels of tank, interleukin-1 receptor type 2 (il1r2), pyrin (mefv), and guanylate-binding protein 1 (gbp1). The anti-inflammatory mechanisms represented by these genes involve the inhibition of 1) pro-inflammatory cytokine production [for tank (116)], 2) IL1B signaling [for il1r2 (147) and mefv (148)], and 3) pro-inflammatory feedback loops [for gbp1 (149)]. The fish skin was previously described as naturally skewed towards the Th2 phenotype (150), possibly for protection against ectoparasites and inflammation-derived self-damage.
Atlantic Salmon Skin Transcriptome Response to Lice and ASAL Co-Stimulation
The discussion of the L. salmonis infection and ASAL injection co-stimulated genes (i.e., COS list, corresponding to the ASAL/lice vs. PBS/no lice comparison) is tightly interwoven with that of the single-stimulus DEP lists, given their large proportion of overlapped DEPs (Figure 2).
Lice(PBS) and COS lists were enriched with genes involved in basic housekeeping metabolic and cellular processes such as gene expression regulation and organelle biogenesis (Figure 5). However, the ratio of up-regulated/down-regulated genes was more balanced in the COS over-represented metabolic and cellular processes than those corresponding to the Lice(PBS) list. As also suggested by the Lice(ASAL) list, the ASAL treatment appeared to have partially mitigated L. salmonis repressive effects on these biological processes. Short-term acute stress challenges (e.g., A. salmonicida bacterin treatment) can revert the detrimental physiological effects of long-term chronic stress (e.g., lice infection) (60).
Lice infection alone did not affect the transcript levels of the pro-inflammatory cytokines il1b, ccl2, cxcl8, and il18 (52, 53, 109); however, lice-infected salmon showed a stronger ASAL induction of these genes compared with the non-infected salmon [i.e., significant differences in ASAL(lice), not in ASAL(no lice)] (Figure 7 and Supplemental Table S2). The COS list also identified significantly increased expression levels for these cytokine-encoding genes; however, their COS fold-changes were relatively lower than those of the ASAL(lice) list. The higher ASAL-induction in ASAL(lice) vs. COS lies in the fact that the first list emphasized ASAL effects over those of lice [i.e., PBS/lice as the reference group in ASAL(lice)]. This phenomenon does not apply to the COS list, which still captures some of the deleterious effects of the parasites on the skin’s physiology (i.e., PBS/no lice fish as the reference group).
The COS list conserves the lice-elicited down-regulation of key antiviral IFN-stimulated genes [e.g., rsad2, ifit5, helz2 (46, 61–65)] detected in the Lice(PBS) list (Figure 7 and Supplemental Table S2). Based on ASAL(lice) and ASAL(no lice) lists, ASAL stimulus did not seem to affect the transcription of these antiviral genes. This lack of responsiveness to bacterial stimuli was previously reported for rsad2 in the Atlantic cod spleen and leukocytes challenged with formalin-killed A. salmonicida and LPS (29, 151). Nevertheless, in contrast to Lice(PBS), the COS list over-represented biological processes related to the activation of innate immune response and myeloid cells (e.g., neutrophils).
Similar to Lice(ASAL) –but to a much greater extent–, the COS list included tens of up-regulated genes encoding proteins found in human neutrophil granules (91) (Figure 7 and Supplemental Table S2). That is the case of the antimicrobial peptides CAMPA and LYZ [cell wall-lysis (141, 142)], the proteinases MMP2A and MMP14 [tissue remodeling and repair via ECM degradation (81, 128)], and the hemoglobin-binding protein HP [bacterial growth hampering (138)]. The COS list presented genes for additional neutrophil granule proteins involved in tissue remodeling and wound healing [e.g., ctsl, ctsz (107)], cell process protection against stress [e.g., hsps (152)], and adaptive immune responses such as T cell activation and differentiation [e.g., plastin-2 (lcp1), fcer1g (153, 154)]. The COS list also evidenced the co-stimulation of integrin beta-3 (itgb3) transcript levels. ITGB3 was previously found in human neutrophil granules (91) and was described to participate in blood coagulation via platelet activation (155).
The neutrophil-related genes in the COS list support the notion that ASAL+lice may have activated key wound healing, angiogenesis, and hemostasis processes –as discussed above for Lice(ASAL) and ASAL(lice) lists. Further, 3 GO terms related to endothelial cell migration –a process only hinted at as lice-activated by mmp2a and emc10 in Lice(PBS) (as previously discussed)– were over-represented by 48-89 DEGs in the COS list (Figure 5 and Supplemental Table S7). Among these COS DEGs, there were up-regulated genes with putative roles in endothelial cell migration promotion [e.g., itgb3, fgfr1, tumor necrosis factor receptor superfamily member 5 (cd40) (156–159)], and down-regulated genes putatively involved in endothelial cell migration inhibition [for example, various histone deacetylases (e.g., hdac2, hdac7) (160)]. Furthermore, the COS list over-represented “angiogenesis”, which included DEGs shared with ASAL(lice) and ASAL(no lice) lice [e.g., gpr4 (112, 113)], but also COS-exclusive DEGs [e.g., vascular endothelial growth factor receptor 2 (kdr) (157)]. Inflammatory and healing processes are enabled by the binding of migrating cells (e.g., leukocytes, platelets) to the damaged or infected tissue (85, 161). Similar to ASAL(lice), the COS list presented several up-regulated genes encoding adhesion molecules for cell-ECM [e.g., itgav (101)], leukocyte-endothelium [e.g., icam1, vcam1b (123)].
As seen for ASAL within the lice-infected salmon [i.e., ASAL(lice)], ASAL+lice co-stimulation (i.e., COS) increased the mRNA levels of several hemostasis-related genes [e.g., serpine1, fga, p2ry1, itgb3 (124, 125, 130, 132, 155)] (Supplemental Table S2). Interestingly, several other DEGs in the COS list over-represented 2 biological processes related to platelet formation, which may suggest thrombocyte involvement in the skin response to ASAL+lice. This list of DEGs included the up-regulation of tyrosine-protein phosphatase non-receptor type 6 (ptpn6) and actn1. Mammalian PTPN6 has been described to promote platelet activation through its mediation in different signaling pathways, including CLEC1B (alias CLEC-2), FCER1G, and ITGB3 (162). Upon binding to their ligands, platelet activation signaling continues its course via protein-tyrosine phosphorylation reactions catalyzed by tyrosine-protein kinases such as LYN (162). This molecular pathway is yet to be described in fish thrombocytes. However, the up-regulation of fcer1g, clec1b, itgb3, and lyn observed in the COS list and its potential thrombocyte connection deserves further investigation. Non-mammalian thrombocyte and mammalian platelet activation involves changes in their morphology that require the reorganization of the actin cytoskeleton (163). qPCR analyses could not confirm actn1 co-stimulation, although it revealed its negative correlation with lice infection level. Although it is unclear how actn1’s unresponsiveness would have affected the hemostatic system of salmon, L. salmonis antithrombotic actions on Atlantic salmon have previously been reported (34).
The present analyses revealed ASAL+lice additive effects on the Atlantic salmon skin transcriptome, which resulted in over-representation of some of the COS-exclusive physiological features discussed above (e.g., platelet-like cell activation), and others involved in innate immune mechanisms. Regarding the complement system (68, 140), ASAL+lice co-stimulation induced mbl2b, c3ar1, c3, c4, C4b-binding protein alpha chain (c4b), and c7 mRNA levels more intensely than single-stimulus exposures (Figure 7 and Supplemental Table S2). The induction of several C-type lectin receptors was also strengthened by co-stimulation, thus alluding to pathways involved in platelet activation and dendritic cell motility (i.e., clec1b), as well as pathogen recognition and Th1/Th17 polarization [i.e., C-type lectin domain family 4 member D (clec4d, alias mcl) and clec1a] (120, 162, 164, 165). An anti-bacterial PRR-encoding gene, tlr13 (118), also showed ASAL+lice additive interaction effects. One of the most highly up-regulated COS-exclusive genes was troponin C (tnnc2), which could be interpreted as an indication of a higher presence of pericyte-like cells (166). Since tnnc2 was previously reported as L. salmonis-repressed in the skin of Atlantic salmon (27), its ASAL+lice co-stimulation provides additional evidence to ASAL enhancement of wound healing in lice-infected salmon. Like ASAL(lice) list, the COS list suggested lice infection boosted ASAL activation of antimicrobial (e.g., hampa, campb), chemotactic (e.g., lect2), and local acute phase (e.g., saa5) responses (53, 93, 136, 137, 141). Furthermore, some genes such as hampa, the Th2 cell biomarker il4r (88), and the M2 macrophage biomarker alox5ap (145) showed synergic (i.e., greater than additive) ASAL and L. salmonis interactive effects.
As suggested by the ASAL(lice) list and observed again in the COS list (Figure 7 and Supplemental Table S2), the presence of increased mRNA levels of M1/Th1 (e.g., cxcl8, lect2, clec4d, cd274, cxcl11) and M2/Th2 (e.g., il4r, ccr8, alox5ap, il1r2) markers suggests a dual nature (i.e., anti-bacterial and tissue repair/protection) for Atlantic salmon’s skin response to ASAL+lice (88, 105, 144, 145, 164, 167). It could be argued that this intermediate phenotype could be beneficial for the fish skin since it would maintain its tissue repair capacity while fortifying its antimicrobial defenses.
Another important feature of the COS list is the exceptionally high presence (compared to the other lists) of genes involved in the adaptive immune system (Figure 5). ASAL+lice up-regulated the transcript levels of class I major histocompatibility complex (MHC) components and antigens [e.g., beta-2-microglobulin (b2m), HLA class I histocompatibility antigens hla-a], and components of immunoproteasomes [e.g., proteasome subunit alpha type-6 (psma6), beta type-5 (psmb5)] (88, 168). These DEGs collectively over-represented the GO term “antigen processing and presentation of peptide antigen via MHC class I”. At the same time, the COS list over-represented GO terms associated with negative regulation of B cell and immunoglobulin mediated processes (e.g., “negative regulation of B cell-mediated immunity”). The observed equilibrium in the ratio of up and down-regulated genes representing those processes suggests a fine-tuned control over antibody-mediated immune response to ASAL+lice co-stimulation. The present qPCR analyses confirmed the ASAL and L. salmonis synergic induction of bcl6 (Figure 7), one of the better-characterized genes/proteins over-representing those GO terms. BCL6 is known in mammals as a transcriptional repressor of germinal center B cell differentiation into plasma cells while promoting B cell proliferation and the formation of high-affinity antibodies (169, 170). The development of vaccines has been and still represents a challenge in the immunization of farmed Atlantic salmon against sea lice (11). Given the present results, the potential use of bacterial PAMPs as sea lice vaccine adjuvant warrants further investigation.
Overall, the COS list contributed to defining the ongoing physiological changes in the dorsal skin of the Lice/ASAL salmon compared with the Lice/PBS (Figure 11). First, ASAL attenuated –but did not resolve– some L. salmonis repressive effects on the transcript levels of antiviral biomarker genes and genes putatively involved in metabolic and cellular processes. Concomitantly, Lice/ASAL salmon showed increased transcriptomic changes suggesting increased leukocyte recruitment and the activation of innate (e.g., neutrophil degranulation) and adaptive (e.g., antibody formation) immune processes, which were not detected in the Lice/PBS salmon. Lastly, ASAL+lice co-stimulation also seemed to promote wound-healing (e.g., hemostasis) and developmental processes (e.g., angiogenesis).
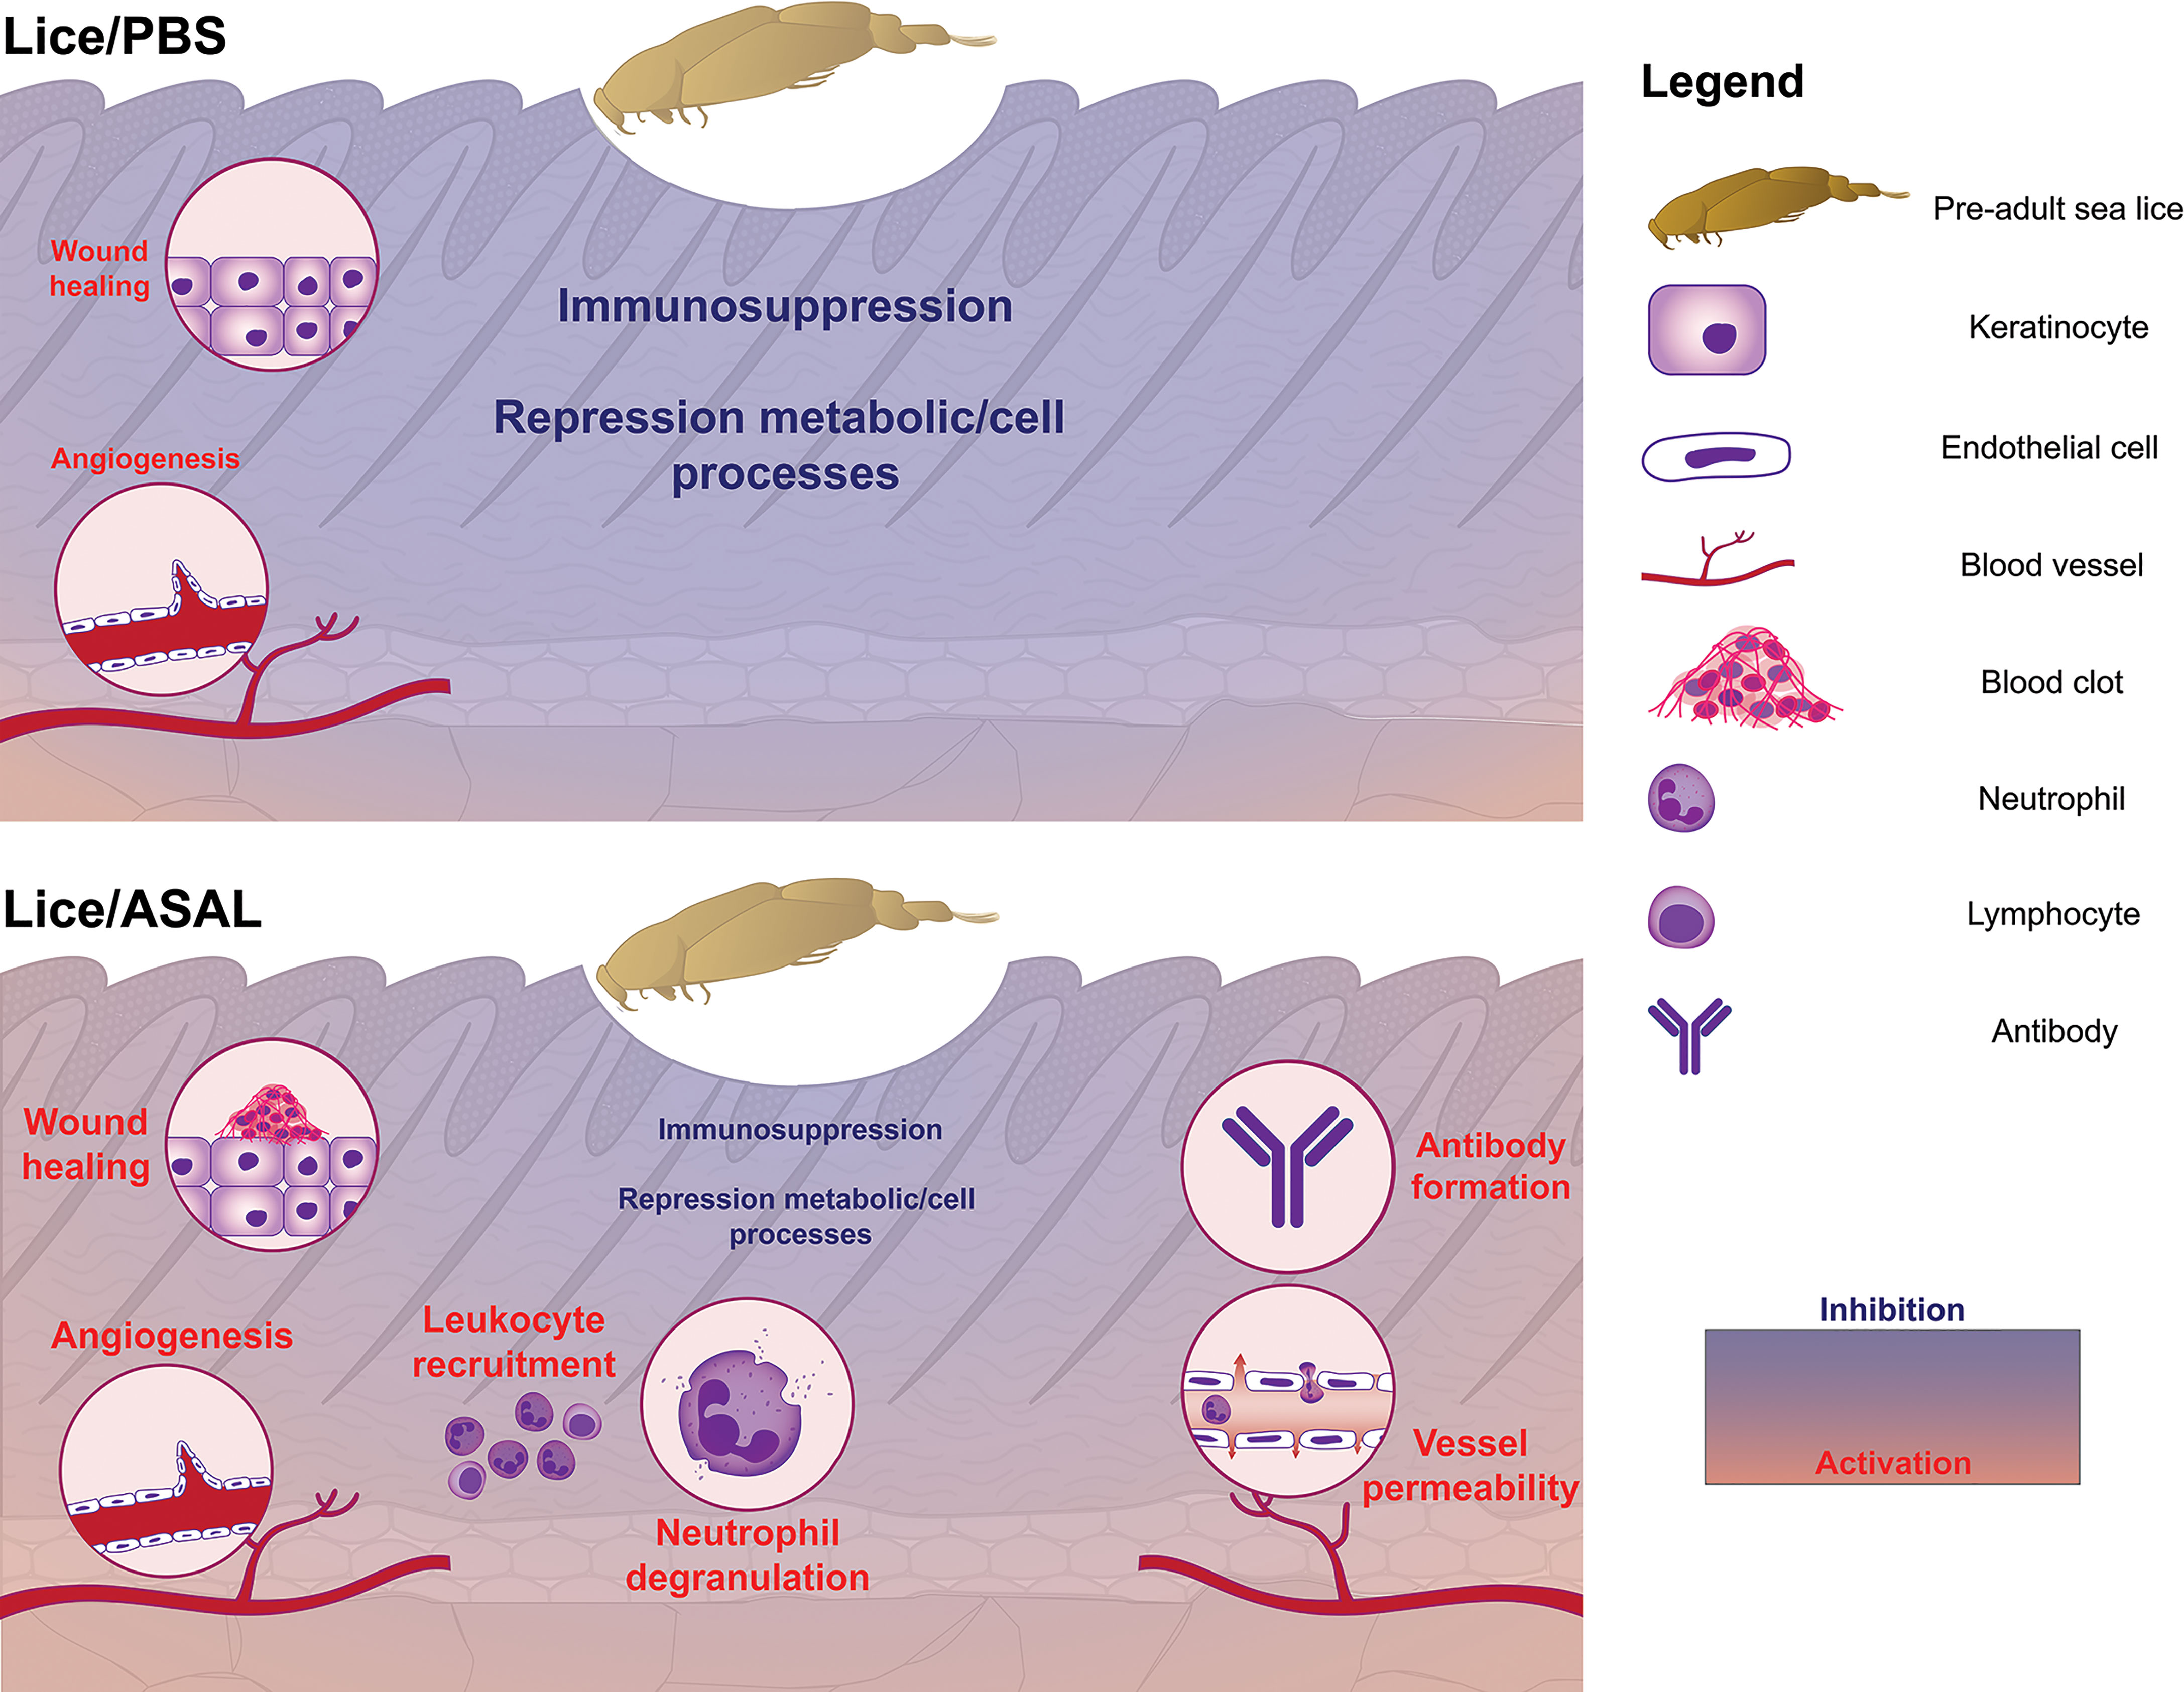
Figure 11 Summary of the main biological processes putatively regulated in response to sea lice infection in the skin of PBS-injected (Lice/PBS; top) and ASAL-injected (Lice/ASAL; bottom) Atlantic salmon, as explained in the Discussion. Biological processes’ names are colored based on whether they were inhibited (blue) or activated (red); their font sizes are proportional to their inhibition/activation extent. The stylized skin section used as the background was colored with a blue-red gradient color scheme representing the proportion of down-regulated/up-regulated genes in the Lice/PBS and Lice/ASAL salmon.
Concluding Remarks
The present study revealed significant interacting effects of L. salmonis and ASAL stimulation in the dorsal skin of Atlantic salmon. ASAL strengthened the immune gene expression response to L. salmonis infection (e.g., APR-and neutrophil degranulation-related genes) and mitigated lice repressive effects on fundamental cellular processes and some antiviral gene levels compared with the PBS controls [Lice(ASAL) vs. Lice(PBS)]. Vice versa, lice-infected salmon showed a more vigorous response to ASAL than the non-infected [ASAL(lice) vs. ASAL(no lice)], possibly due to lice-induced tissue-level changes in the skin (e.g., increased angiogenesis). The ASAL+lice co-stimulation (i.e., COS list) had additive and synergistic effects on the induction of genes involved in innate (e.g., additive: tlr13, clec1a, mbl2b; synergistic: hampa, alox5ap) and adaptive (e.g., additive: bcl6; synergistic: il4r) immune responses, and induced several genes related to wound healing (e.g., hemostasis) and antibody formation.
Experiment replication –preferably with infected and non-infected groups housed in the same facility– and histological analyses in the future will help validate the present study’s findings. Furthermore, salmonid species such as Atlantic salmon show a high retention rate of paralogues from a whole-genome duplication event ~80 Mya (171). This fact represents both an opportunity to advance in evolutionary physiology knowledge and a challenge for interpreting transcriptomics results due to functional divergence between duplicated genes in Atlantic salmon. The differential regulation of mbl2a (lice-inducible) and mbl2b (ASAL-inducible) might be a potential example of functional specialization of two gene copies. The present microarray results may have been influenced by cross-hybridization between paralogous transcripts. Nevertheless, microarray hybridization and paralogue-specific qPCR data showed a high correlation, thus proving the robustness of the study’s claims.
As one of the first transcriptomics studies in the field of co-infection in Atlantic salmon, the present study may serve as a reference for future research with sea lice-infected salmon challenged with other vaccines, PAMPs, or live pathogens. Furthermore, it provides candidate gene biomarkers and putative biological processes responding to sea lice and bacterial single- and co-infection in the skin of Atlantic salmon. Future studies and industrial applications may take advantage of the knowledge generated by this study and evaluate the potential of bacterial compounds and extracts as supplements for clinical feeds and vaccine adjuvants for fish. In sum, these results contribute to improving our understanding of the molecular mechanisms governing the Atlantic salmon’s skin response to sea lice and bacteria co-infection and will help in the improvement of disease management in Atlantic salmon aquaculture.
Data Availability Statement
The datasets presented in this study can be found in online repositories. The names of the repository/repositories and accession number(s) can be found below: https://www.ncbi.nlm.nih.gov/geo/, GSE186292.
Ethics Statement
The animal study was reviewed and approved by the Animal Care Committee of Memorial University (Animal Care Protocol 17-77-MR).
Author Contributions
MLR, RT, MF, and AC-S designed the CDRF and JBARB trials. AC-S supervised the conduction of the trials and coordinated the team that participated in the samplings. AC-S, NU, XX, and ZC were involved in the sea lice copepodid challenge. AC-S, NU, XX, TK, SK, JW, ZC, and MLR were part of the sampling team. AC-S, NU, XX, and MLR designed the microarray and qPCR experiments. NU and XX performed the total RNA and all procedures associated with the generation of the microarray data. AC-S, NU, XX, and TK carried out the qPCR analyses. SK helped with the annotation of the 44K microarray. AC-S analyzed and interpreted the microarray and qPCR results. AC-S led the writing of the manuscript. NU, XX, TK, SK, JW, ZC, MF, SS, RT, and MLR provided comments on the first draft of the manuscript. All authors contributed to the article and approved the submitted version.
Funding
This study was part of the Integrated Pathogen Management of Co-infection in Atlantic Salmon (IPMC) project (Genomic Applications Partnership Program, GAPP #6607), which was funded by the Government of Canada through Genome Canada and Genome Atlantic. The IPMC project was also funded by InnovateNL (Government of Newfoundland and Labrador Department of Tourism, Culture, Industry and Innovation; Leverage R&D award #5401-1019-108), and EWOS Innovation (now part of Cargill, Incorporated). Furthermore, MLR’s research program is supported by a Natural Sciences and Engineering Research Council of Canada (NSERC) Discovery Grant (341304-2012 and 2020-04519), and Ocean Frontier Institute through an award from the Canada First Research Excellence Fund. The publication fee for this article was funded by MLR's NSERC Discovery Grant (2020-04519). AC-S and NU were the recipients of a Mitacs Accelerate Postdoctoral Fellowship during the conduction of the trials. SK’s salary was funded by the Ocean Frontier Institute.
Conflict of Interest
RT and SS are former and current employees of Cargill Inc., respectively, but did not participate in the microarray/qPCR study design, the result interpretation, and the decision to submit the manuscript for publication. NU participated in this study as a postdoctoral fellow at Memorial University but was recently employed by Aquabounty Canada Inc.
The remaining authors declare that the research was conducted in the absence of any commercial or financial relationships that could be construed as a potential conflict of interest.
Publisher’s Note
All claims expressed in this article are solely those of the authors and do not necessarily represent those of their affiliated organizations, or those of the publisher, the editors and the reviewers. Any product that may be evaluated in this article, or claim that may be made by its manufacturer, is not guaranteed or endorsed by the publisher.
Acknowledgments
The authors would like to thank the CDRF and JBARB staff for their contribution to maintaining the fish-holding systems, feeding the fish during the trials, and assisting during the sea lice challenge (CDRF) and samplings (CDRF and JBARB). We thank Huntsman Marine Science Centre for providing the L. salmonis copepodids. We are also grateful to Cara Kirkpatrick (Genome Atlantic, Halifax, Canada) for all the help as the Program Manager for this project. We would like to acknowledge the contribution of ACENET (https://www.ace-net.ca) and Compute Canada (https://www.computecanada.ca) by providing computational resources to update the annotation of the 44K microarray.
Supplementary Material
The Supplementary Material for this article can be found online at: https://www.frontiersin.org/articles/10.3389/fimmu.2022.804987/full#supplementary-material
References
1. Cai J. Aquaculture Growth Potential: Perspective From Short-Term Projection of Fish Demand. FAO Aquacult Newslett (2017) 57:48.
3. Anderson JL, Asche F, Garlock T. Economics of Aquaculture Policy and Regulation. Annu Rev Resour Econom (2019) 11(1):101–23. doi: 10.1146/annurev-resource-100518-093750
4. Abolofia J, Asche F, Wilen JE. The Cost of Lice: Quantifying the Impacts of Parasitic Sea Lice on Farmed Salmon. Mar Resour Econ (2017) 32(3):329–49. doi: 10.1086/691981
5. Brooker AJ, Skern-Mauritzen R, Bron JE. Production, Mortality, and Infectivity of Planktonic Larval Sea Lice, Lepeophtheirus salmonis (Krøyer, 1837): Current Knowledge and Implications for Epidemiological Modelling. ICES J Mar Sci (2018) 75(4):1214–34. doi: 10.1093/icesjms/fsy015
6. Pincinato RBM, Asche F, Bleie H, Skrudland A, Stormoen M. Factors Influencing Production Loss in Salmonid Farming. Aquaculture (2021) 532:736034. doi: 10.1016/j.aquaculture.2020.736034
7. Johnson SC, Fast MD, Wiegertjes G, Flik G. Interactions Between Sea Lice and Their Hosts. Symp Soc Exp Biol (2004) 55:131–59. doi: 10.4324/9780203487709-7
8. Pike AW, Wadsworth SL. Sealice on Salmonids: Their Biology and Control. In: Advances in Parasitology, Baker JR, Muller R, Rollinson D, eds. San Diego, CA, USA: Academic Press (1999). p. 233–337.
9. Johnson S, Albright L. Comparative Susceptibility and Histopathology of the Response of Naive Atlantic, Chinook and Coho Salmon to Experimental Infection With Lepeophtheirus salmonis (Copepoda: Caligidae). Dis Aquat Organ (1992) 14(3):179–93. doi: 10.3354/dao014179
10. Fast MD, Ross NW, Mustafa A, Sims DE, Johnson SC, Conboy GA, et al. Susceptibility of Rainbow Trout Oncorhynchus mykiss, Atlantic Salmon Salmo salar and Coho Salmon Oncorhynchus kisutch to Experimental Infection With Sea Lice Lepeophtheirus salmonis. Dis Aquat Organ (2002) 52(1):57–68. doi: 10.3354/dao052057
11. Fast MD. Fish Immune Responses to Parasitic Copepod (Namely Sea Lice) Infection. Dev Comp Immunol (2014) 43(2):300–12. doi: 10.1016/j.dci.2013.08.019
12. Kotob MH, Menanteau-Ledouble S, Kumar G, Abdelzaher M, El-Matbouli M. The Impact of Co-Infections on Fish: A Review. Vet Res (2016) 47(1):98. doi: 10.1186/s13567-016-0383-4
13. Cox F. Concomitant Infections, Parasites and Immune Responses. Parasitology (2001) 122(S1):S23–38. doi: 10.1017/S003118200001698X
14. Carvalho LA, Whyte SK, Braden LM, Purcell SL, Manning AJ, Muckle A, et al. Impact of Co-Infection With Lepeophtheirus salmonis and Moritella viscosa on Inflammatory and Immune Responses of Atlantic Salmon (Salmo salar). J Fish Dis (2020) 43(4):459–73. doi: 10.1111/jfd.13144
15. Arriagada G, Hamilton-West C, Nekouei O, Foerster C, Müller A, Lara M, et al. Caligus rogercresseyi Infestation is Associated With Piscirickettsia salmonis-Attributed Mortalities in Farmed Salmonids in Chile. Prev Vet Med (2019) 171:104771. doi: 10.1016/j.prevetmed.2019.104771
16. Figueroa C, Bustos P, Torrealba D, Dixon B, Soto C, Conejeros P, et al. Coinfection Takes Its Toll: Sea Lice Override the Protective Effects of Vaccination Against a Bacterial Pathogen in Atlantic Salmon. Sci Rep (2017) 7(1):17817. doi: 10.1038/s41598-017-18180-6
17. Lhorente JP, Gallardo JA, Villanueva B, Carabaño MJ, Neira R. Disease Resistance in Atlantic Salmon (Salmo salar): Coinfection of the Intracellular Bacterial Pathogen Piscirickettsia salmonis and the Sea Louse Caligus rogercresseyi. PloS One (2014) 9(4):e95397. doi: 10.1371/journal.pone.0095397
18. Dallaire-Dufresne S, Tanaka KH, Trudel MV, Lafaille A, Charette SJ. Virulence, Genomic Features, and Plasticity of Aeromonas salmonicida Subsp. salmonicida, the Causative Agent of Fish Furunculosis. Vet Microbiol (2014) 169(1):1–7. doi: 10.1016/j.vetmic.2013.06.025
19. Toranzo AE, Magariños B, Romalde JL. A Review of the Main Bacterial Fish Diseases in Mariculture Systems. Aquaculture (2005) 246(1):37–61. doi: 10.1016/j.aquaculture.2005.01.002
20. Bernoth E-M. Furunculosis: The History of the Disease and of Disease Research. In: Furunculosis, Bernoth EM, Ellis AE, Midtlyng PJ, Olivier G, Smith P, eds. Cambridge, MA, USA: Academic Press (1997) p. 1–20.
21. Frey J, Origgi FC. Type III Secretion System of Aeromonas salmonicida Undermining the Host’s Immune Response. Front Mar Sci (2016) 3(130). doi: 10.3389/fmars.2016.00130
22. Johansen L-H, Eggset G, Sommer A-I. Experimental IPN Virus Infection of Atlantic Salmon Parr; Recurrence of IPN and Effects on Secondary Bacterial Infections in Post-Smolts. Aquaculture (2009) 290(1):9–14. doi: 10.1016/j.aquaculture.2009.02.002
23. Quiroga JR, Ferreiro A, Iglesias R, Estévez JG, Farto R, Nieto T. Susceptibility of Turbot to Aeromonas salmonicida Subsp. salmonicida During a Mixed Experimental Infection With Philasterides dicentrarchi. Bull Eur Ass Fish Pathol (2016) 36(3):119.
24. Skugor S, Glover KA, Nilsen F, Krasnov A. Local and Systemic Gene Expression Responses of Atlantic Salmon (Salmo salar L.) to Infection With the Salmon Louse (Lepeophtheirus salmonis). BMC Genomics (2008) 9(1):498. doi: 10.1186/1471-2164-9-498
25. Sutherland BJG, Covello JM, Friend SE, Poley JD, Koczka KW, Purcell SL, et al. Host–parasite Transcriptomics During Immunostimulant-Enhanced Rejection of Salmon Lice (Lepeophtheirus salmonis) by Atlantic Salmon (Salmo salar). FACETS (2017) 2(1):477–95. doi: 10.1139/facets-2017-0020
26. Sutherland BJG, Koczka KW, Yasuike M, Jantzen SG, Yazawa R, Koop BF, et al. Comparative Transcriptomics of Atlantic Salmo salar, Chum Oncorhynchus keta and Pink Salmon O. gorbuscha During Infections With Salmon Lice Lepeophtheirus salmonis. BMC Genomics (2014) 15(1):200. doi: 10.1186/1471-2164-15-200
27. Krasnov A, Skugor S, Todorcevic M, Glover K, Nilsen F. Gene Expression in Atlantic Salmon Skin in Response to Infection With the Parasitic Copepod Lepeophtheirus salmonis, Cortisol Implant, and Their Combination. BMC Genomics (2012) 13(1):130. doi: 10.1186/1471-2164-13-130
28. Tadiso TM, Krasnov A, Skugor S, Afanasyev S, Hordvik I, Nilsen F. Gene Expression Analyses of Immune Responses in Atlantic Salmon During Early Stages of Infection by Salmon Louse (Lepeophtheirus salmonis) Revealed Bi-Phasic Responses Coinciding With the Copepod-Chalimus Transition. BMC Genomics (2011) 12(1):141. doi: 10.1186/1471-2164-12-141
29. Hori TS, Gamperl AK, Nash G, Booman M, Barat A, Rise ML. The Impact of a Moderate Chronic Temperature Increase on Spleen Immune-Relevant Gene Transcription Depends on Whether Atlantic Cod (Gadus morhua) are Stimulated With Bacterial Versus Viral Antigens. Genome (2013) 56(10):567–76. doi: 10.1139/gen-2013-0090
30. Booman M, Borza T, Feng C, Hori T, Higgins B, Culf A, et al. Development and Experimental Validation of a 20K Atlantic Cod (Gadus morhua) Oligonucleotide Microarray Based on a Collection of Over 150,000 ESTs. Mar Biotechnol (2011) 13(4):733–50. doi: 10.1007/s10126-010-9335-6
31. Feng CY, Johnson SC, Hori TS, Rise M, Hall JR, Gamperl AK, et al. Identification and Analysis of Differentially Expressed Genes in Immune Tissues of Atlantic Cod Stimulated With Formalin-Killed, Atypical Aeromonas salmonicida. Physiol Genomics (2009) 37(3):149–63. doi: 10.1152/physiolgenomics.90373.2008
32. Vanya Ewart K, Belanger JC, Williams J, Karakach T, Penny S, Tsoi SCM, et al. Identification of Genes Differentially Expressed in Atlantic Salmon (Salmo salar) in Response to Infection by Aeromonas salmonicida Using cDNA Microarray Technology. Dev Comp Immunol (2005) 29(4):333–47. doi: 10.1016/j.dci.2004.08.004
33. Jantzen SG, Sanderson DS, von Schalburg KR, Yasuike M, Marass F, Koop BF. A 44K Microarray Dataset of the Changing Transcriptome in Developing Atlantic Salmon (Salmo salar L.). BMC Res Notes (2011) 4(1):88. doi: 10.1186/1756-0500-4-88
34. Umasuthan N, Xue X, Caballero-Solares A, Kumar S, Westcott JD, Chen Z, et al. Transcriptomic Profiling in Fins of Atlantic Salmon Parasitized With Sea Lice: Evidence for an Early Imbalance Between Chalimus-Induced Immunomodulation and the Host’s Defense Response. Int J Mol Sci (2020) 21(7):2417. doi: 10.3390/ijms21072417
35. Eslamloo K, Caballero-Solares A, Inkpen SM, Emam M, Kumar S, Bouniot C, et al. Transcriptomic Profiling of the Adaptive and Innate Immune Responses of Atlantic Salmon to Renibacterium salmoninarum Infection. Front Immunol (2020) 11(2487). doi: 10.3389/fimmu.2020.567838
36. Brazma A, Hingamp P, Quackenbush J, Sherlock G, Spellman P, Stoeckert C, et al. Minimum Information About a Microarray Experiment (MIAME)—toward Standards for Microarray Data. Nat Genet (2001) 29(4):365–71. doi: 10.1038/ng1201-365
37. Tusher VG, Tibshirani R, Chu G. Significance Analysis of Microarrays Applied to the Ionizing Radiation Response. Proc Natl Acad Sci USA (2001) 98(9):5116–21. doi: 10.1073/pnas.091062498
38. Schwender H. Siggenes: Multiple Testing Using SAM and Efron’s Empirical Bayes Approaches. R Package Version 1.64.0. (2020). doi: 10.18129/B9.bioc.siggenes
39. Caballero-Solares A, Xue X, Parrish CC, Foroutani MB, Taylor RG, Rise ML. Changes in the Liver Transcriptome of Farmed Atlantic Salmon (Salmo salar) Fed Experimental Diets Based on Terrestrial Alternatives to Fish Meal and Fish Oil. BMC Genomics (2018) 18(1):796. doi: 10.1186/s12864-018-5188-6
40. Bindea G, Mlecnik B, Hackl H, Charoentong P, Tosolini M, Kirilovsky A, et al. ClueGO: A Cytoscape Plug-in to Decipher Functionally Grouped Gene Ontology and Pathway Annotation Networks. Bioinformatics (2009) 25(8):1091–3. doi: 10.1093/bioinformatics/btp101
41. Shannon P. Cytoscape: A Software Environment for Integrated Models of Biomolecular Interaction Networks. Genome Res (2003) 13:2498–504. doi: 10.1101/gr.1239303
42. Cohen J. Weighted Kappa: Nominal Scale Agreement Provision for Scaled Disagreement or Partial Credit. Psychol Bull (1968) 70(4):213. doi: 10.1037/h0026256
43. Doniger SW, Salomonis N, Dahlquist KD, Vranizan K, Lawlor SC, Conklin BR. MAPPFinder: Using Gene Ontology and GenMAPP to Create a Global Gene-Expression Profile From Microarray Data. Genome Biol (2003) 4(1):R7. doi: 10.1186/gb-2003-4-1-r7
44. Bustin SA, Benes V, Garson JA, Hellemans J, Huggett J, Kubista M, et al. The MIQE Guidelines: Minimum Information for Publication of Quantitative Real-Time PCR Experiments. Clin Chem (2009) 55(4):611–22. doi: 10.1373/clinchem.2008.112797
45. Pfaffl MW. A New Mathematical Model for Relative Quantification in Real-Time RT–PCR. Nucleic Acids Res (2001) 29(9):e45. doi: 10.1093/nar/29.9.e45
46. Caballero-Solares A, Hall JR, Xue X, Eslamloo K, Taylor RG, Parrish CC, et al. The Dietary Replacement of Marine Ingredients by Terrestrial Animal and Plant Alternatives Modulates the Antiviral Immune Response of Atlantic Salmon (Salmo salar). Fish Shellfish Immunol (2017) 64:24–38. doi: 10.1016/j.fsi.2017.02.040
47. Eslamloo K, Kumar S, Caballero-Solares A, Gnanagobal H, Santander J, Rise ML. Profiling the Transcriptome Response of Atlantic Salmon Head Kidney to Formalin-Killed Renibacterium salmoninarum. Fish Shellfish Immunol (2019) 98:937–49. doi: 10.1016/j.fsi.2019.11.057
48. Vandesompele J, De Preter K, Pattyn F, Poppe B, Van Roy N, De Paepe A, et al. Accurate Normalization of Real-Time Quantitative RT-PCR Data by Geometric Averaging of Multiple Internal Control Genes. Genome Biol (2002) 3(7):1–12. doi: 10.1186/gb-2002-3-7-research0034
49. Booman M, Xu Q, Rise ML. Evaluation of the Impact of Camelina Oil-Containing Diets on the Expression of Genes Involved in the Innate Anti-Viral Immune Response in Atlantic Cod (Gadus morhua). Fish Shellfish Immunol (2014) 41(1):52–63. doi: 10.1016/j.fsi.2014.05.017
50. Xue X, Woldemariam TN, Caballero-Solares A, Umasuthan N, Fast DM, Taylor GR, et al. Dietary Immunostimulant CpG Modulates microRNA Biomarkers Associated With Immune Responses in Atlantic Salmon (Salmo salar). Cells (2019) 8(12). doi: 10.3390/cells8121592
51. Hori TS, Gamperl A, Booman M, Nash GW, Rise ML. A Moderate Increase in Ambient Temperature Modulates the Atlantic Cod (Gadus morhua) Spleen Transcriptome Response to Intraperitoneal Viral Mimic Injection. BMC Genomics (2012) 13(1):431. doi: 10.1186/1471-2164-13-431
52. Secombes CJ, Wang T, Bird S. The Interleukins of Fish. Dev Comp Immunol (2011) 35(12):1336–45. doi: 10.1016/j.dci.2011.05.001
53. Zhu L-Y, Nie L, Zhu G, Xiang L-X, Shao J-Z. Advances in Research of Fish Immune-Relevant Genes: A Comparative Overview of Innate and Adaptive Immunity in Teleosts. Dev Comp Immunol (2013) 39(1–2):39–62. doi: 10.1016/j.dci.2012.04.001
54. Simmons DL, Botting RM, Hla T. Cyclooxygenase Isozymes: The Biology of Prostaglandin Synthesis and Inhibition. Pharmacol Rev (2004) 56(3):387–437. doi: 10.1124/pr.56.3.3
55. Gómez-Abellán V, Sepulcre MP. The Role of Prostaglandins in the Regulation of Fish Immunity. Mol Immunol (2016) 69:139–45. doi: 10.1016/j.molimm.2015.09.022
56. Gallardi D, Xue X, Hamoutene D, Lush L, Rise ML. Impact of Origin (Wild vs. Farmed) and Sea Lice (Lepeophtheirus salmonis) Infestation on Expression of Immune-Relevant Genes in Atlantic Salmon (Salmo salar L.) Skin. Aquaculture (2019) 499:306–15. doi: 10.1016/j.aquaculture.2018.09.036
57. Bowers JM, Mustafa A, Speare DJ, Conboy GA, Brimacombe M, Sims DE, et al. The Physiological Response of Atlantic Salmon, Salmo salar L., to a Single Experimental Challenge With Sea Lice, Lepeophtheirus salmonis. J Fish Dis (2000) 23(3):165–72. doi: 10.1046/j.1365-2761.2000.00225.x
58. Barton BA. Stress in Fishes: A Diversity of Responses With Particular Reference to Changes in Circulating Corticosteroids. Integr Comp Biol (2002) 42(3):517–25. doi: 10.1093/icb/42.3.517
59. Wendelaar Bonga SE. The Stress Response in Fish. Physiol Rev (1997) 77(3):591–625. doi: 10.1152/physrev.1997.77.3.591
60. Dhabhar FS. Effects of Stress on Immune Function: The Good, the Bad, and the Beautiful. Immunol Res (2014) 58(2):193–210. doi: 10.1007/s12026-014-8517-0
61. Eslamloo K, Ghorbani A, Xue X, Inkpen SM, Larijani M, Rise ML. Characterization and Transcript Expression Analyses of Atlantic Cod Viperin. Front Immunol (2019) 10(311). doi: 10.3389/fimmu.2019.00311
62. Langevin C, Aleksejeva E, Passoni G, Palha N, Levraud J-P, Boudinot P. The Antiviral Innate Immune Response in Fish: Evolution and Conservation of the IFN System. J Mol Biol (2013) 425(24):4904–20. doi: 10.1016/j.jmb.2013.09.033
63. Chang C-J, Robertsen C, Sun B, Robertsen B. Protection of Atlantic Salmon Against Virus Infection by Intramuscular Injection of IFNc Expression Plasmid. Vaccine (2014) 32(36):4695–702. doi: 10.1016/j.vaccine.2014.05.059
64. Eslamloo K, Xue X, Hall JR, Smith NC, Caballero-Solares A, Parrish CC, et al. Transcriptome Profiling of Antiviral Immune and Dietary Fatty Acid Dependent Responses of Atlantic Salmon Macrophage-Like Cells. BMC Genomics (2017) 18(1):706. doi: 10.1186/s12864-017-4099-2
65. Levraud J-P, Jouneau L, Briolat V, Laghi V, Boudinot P. IFN-Stimulated Genes in Zebrafish and Humans Define an Ancient Arsenal of Antiviral Immunity. J Immunol (2019) 203(12):3361. doi: 10.4049/jimmunol.1900804
66. Cai W, Kumar S, Navaneethaiyer U, Caballero-Solares A, Carvalho LA, Whyte SK, et al. Transcriptome Analysis of Atlantic Salmon (Salmo salar) Skin in Response to Sea Lice and Infectious Salmon Anemia Virus Co-Infection Under Different Experimental Functional Diets. Front Immunol (2022) 12. doi: 10.3389/fimmu.2021.787033
67. Fujita T, Matsushita M, Endo Y. The Lectin-Complement Pathway – Its Role in Innate Immunity and Evolution. Immunol Rev (2004) 198(1):185–202. doi: 10.1111/j.0105-2896.2004.0123.x
68. Dunkelberger JR, Song W-C. Complement and Its Role in Innate and Adaptive Immune Responses. Cell Res (2010) 20(1):34–50. doi: 10.1038/cr.2009.139
69. Moldenhauer G, Henne C, Karhausen J, Möller P. Surface-Expressed Invariant Chain (CD74) is Required for Internalization of Human Leucocyte Antigen-DR Molecules to Early Endosomal Compartments. Immunology (1999) 96(3):473–84. doi: 10.1046/j.1365-2567.1999.00676.x
70. Gomez D, Sunyer JO, Salinas I. The Mucosal Immune System of Fish: The Evolution of Tolerating Commensals While Fighting Pathogens. Fish Shellfish Immunol (2013) 35(6):1729–39. doi: 10.1016/j.fsi.2013.09.032
71. Wenger RH. Cellular Adaptation to Hypoxia: O2-Sensing Protein Hydroxylases, Hypoxia-Inducible Transcription Factors, and O2-Regulated Gene Expression. FASEB J (2002) 16(10):1151–62. doi: 10.1096/fj.01-0944rev
72. Tian Y, Wen H, Qi X, Zhang X, Li Y. Identification of Mapk Gene Family in Lateolabrax maculatus and Their Expression Profiles in Response to Hypoxia and Salinity Challenges. Gene (2019) 684:20–9. doi: 10.1016/j.gene.2018.10.033
73. Budanov AV, Sablina AA, Feinstein E, Koonin EV, Chumakov PM. Regeneration of Peroxiredoxins by P53-Regulated Sestrins, Homologs of Bacterial AhpD. Science (2004) 304(5670):596. doi: 10.1126/science.1095569
74. Saxena S, Purushothaman S, Meghah V, Bhatti B, Poruri A, Meena Lakshmi MG, et al. Role of Annexin Gene and Its Regulation During Zebrafish Caudal Fin Regeneration. Wound Repair Regen (2016) 24(3):551–9. doi: 10.1111/wrr.12429
75. Verhagen JMA, Veldman JH, van der Zwaag PA, von der Thüsen JH, Brosens E, Christiaans I, et al. Lack of Evidence for a Causal Role of CALR3 in Monogenic Cardiomyopathy. Eur J Hum Genet (2018) 26(11):1603–10. doi: 10.1038/s41431-018-0208-1
76. Lim KH, Chang YC, Chiang YH, Lin HC, Chang CY, Lin CS, et al. Expression of CALR Mutants Causes Mpl-Dependent Thrombocytosis in Zebrafish. Blood Cancer J (2016) 6(10):e481–e. doi: 10.1038/bcj.2016.83
77. Walker JT, McLeod K, Kim S, Conway SJ, Hamilton DW. Periostin as a Multifunctional Modulator of the Wound Healing Response. Cell Tissue Res (2016) 365(3):453–65. doi: 10.1007/s00441-016-2426-6
78. Sveen LR, Timmerhaus G, Krasnov A, Takle H, Handeland S, Ytteborg E. Wound Healing in Post-Smolt Atlantic Salmon (Salmo salar L.). Sci Rep (2019) 9(1):3565. doi: 10.1038/s41598-019-39080-x
79. Detry B, Erpicum C, Paupert J, Blacher S, Maillard C, Bruyère F, et al. Matrix Metalloproteinase-2 Governs Lymphatic Vessel Formation as an Interstitial Collagenase. Blood (2012) 119(21):5048–56. doi: 10.1182/blood-2011-12-400267
80. Holm H, Santi N, Kjøglum S, Perisic N, Skugor S, Evensen Ø. Difference in Skin Immune Responses to Infection With Salmon Louse (Lepeophtheirus salmonis) in Atlantic Salmon (Salmo salar L.) of Families Selected for Resistance and Susceptibility. Fish Shellfish Immunol (2015) 42(2):384–94. doi: 10.1016/j.fsi.2014.10.038
81. Büth H, Luigi Buttigieg P, Ostafe R, Rehders M, Dannenmann SR, Schaschke N, et al. Cathepsin B is Essential for Regeneration of Scratch-Wounded Normal Human Epidermal Keratinocytes. Eur J Cell Biol (2007) 86(11):747–61. doi: 10.1016/j.ejcb.2007.03.009
82. Reboll Marc R, Korf-Klingebiel M, Klede S, Polten F, Brinkmann E, Reimann I, et al. EMC10 (Endoplasmic Reticulum Membrane Protein Complex Subunit 10) is a Bone Marrow–Derived Angiogenic Growth Factor Promoting Tissue Repair After Myocardial Infarction. Circulation (2017) 136(19):1809–23. doi: 10.1161/CIRCULATIONAHA.117.029980
83. Haugen B, Karinshak SE, Mann VH, Popratiloff A, Loukas A, Brindley PJ, et al. Granulin Secreted by the Food-Borne Liver Fluke Opisthorchis viverrini Promotes Angiogenesis in Human Endothelial Cells. Front Med (2018) 5(30). doi: 10.3389/fmed.2018.00030
84. Benz GW, Borucinska JD, Greenwald SA. First Descriptions of Early-and Middle-Stage Copepodids of Anthosoma crassum (Dichelesthiidae: Siphonostomatoida) and Lesions on Shortfin Makos (Isurus oxyrinchus) Infected With A. crassum. J Parasitol (2002) 88(1):19–26. doi: 10.1645/0022-3395(2002)088[0019:FDOEAM]2.0.CO;2
85. Kreuger J, Phillipson M. Targeting Vascular and Leukocyte Communication in Angiogenesis, Inflammation and Fibrosis. Nat Rev Drug Discovery (2016) 15(2):125–42. doi: 10.1038/nrd.2015.2
86. Tsoi SCM, Ewart KV, Penny S, Melville K, Liebscher RS, Brown LL, et al. Identification of Immune-Relevant Genes From Atlantic Salmon Using Suppression Subtractive Hybridization. Mar Biotechnol (2004) 6(3):199–214. doi: 10.1007/s10126-002-0101-2
87. Yu Z, Schneider C, Boeglin WE, Marnett LJ, Brash AR. The Lipoxygenase Gene ALOXE3; Implicated in Skin Differentiation Encodes a Hydroperoxide Isomerase. Proc Natl Acad Sci USA (2003) 100(16):9162. doi: 10.1073/pnas.1633612100
88. Secombes CJ, Belmonte R. Overview of the Fish Adaptive Immune System. In: Adams A, editor. Fish Vaccines. Basel: Springer Basel (2016). p. 35–52.
89. Esche C, Stellato C, Beck LA. Chemokines: Key Players in Innate and Adaptive Immunity. J Invest Dermatol (2005) 125(4):615–28. doi: 10.1111/j.0022-202X.2005.23841.x
90. Braden LM, Koop BF, Jones SRM. Signatures of Resistance to Lepeophtheirus salmonis Include a TH2-Type Response at the Louse-Salmon Interface. Dev Comp Immunol (2015) 48(1):178–91. doi: 10.1016/j.dci.2014.09.015
91. Lominadze G, Powell DW, Luerman GC, Link AJ, Ward RA, McLeish KR. Proteomic Analysis of Human Neutrophil Granules. Mol Cell Proteom (2005) 4(10):1503–21. doi: 10.1074/mcp.M500143-MCP200
92. Omaima Harun N, Zou J, Zhang Y-A, Nie P, Secombes CJ. The Biological Effects of Rainbow Trout (Oncorhynchus mykiss) Recombinant Interleukin-8. Dev Comp Immunol (2008) 32(6):673–81. doi: 10.1016/j.dci.2007.10.005
93. Ganz T, Nemeth E. Hepcidin and Iron Homeostasis. Biochim Biophys Acta Mol Cell Res (2012) 1823(9):1434–43. doi: 10.1016/j.bbamcr.2012.01.014
94. Skugor S, Jodaa Holm H, Bjelland AK, Pino J, Evensen Ø, Krasnov A, et al. Nutrigenomic Effects of Glucosinolates on Liver, Muscle and Distal Kidney in Parasite-Free and Salmon Louse Infected Atlantic Salmon. Parasite Vector (2016) 9(1):639. doi: 10.1186/s13071-016-1921-7
95. Kim B-M, Ahn D-H, Kang S, Jeong J, Jo E, Kim B-K, et al. Skin Transcriptome Profiling Reveals the Distinctive Molecular Effects of Temperature Changes on Antarctic Bullhead Notothen. Mol Cell Toxicol (2019) 15(2):163–72. doi: 10.1007/s13273-019-0020-1
96. Goonesinghe A, Luan X-M, Hurlstone A, Garrod D. Desmosomal Cadherins in Zebrafish Epiboly and Gastrulation. BMC Dev Biol (2012) 12(1):1. doi: 10.1186/1471-213X-12-1
97. Stojadinovic O, Pastar I, Vukelic S, Mahoney MG, Brennan D, Krzyzanowska A, et al. Deregulation of Keratinocyte Differentiation and Activation: A Hallmark of Venous Ulcers. J Cell Mol Med (2008) 12(6b):2675–90. doi: 10.1111/j.1582-4934.2008.00321.x
98. Meyer M, Müller A-K, Yang J, Moik D, Ponzio G, Ornitz DM, et al. FGF Receptors 1 and 2 are Key Regulators of Keratinocyte Migration In Vitro and in Wounded Skin. J Cell Sci (2012) 125(23):5690–701. doi: 10.1242/jcs.108167
99. Kemler R, Hierholzer A, Kanzler B, Kuppig S, Hansen K, Taketo MM, et al. Stabilization of β-Catenin in the Mouse Zygote Leads to Premature Epithelial-Mesenchymal Transition in the Epiblast. Development (2004) 131(23):5817–24. doi: 10.1242/dev.01458
100. Presland RB, Dale BA. Epithelial Structural Proteins of the Skin and Oral Cavity: Function in Health and Disease. Crit Rev Oral Biol Med (2000) 11(4):383–408. doi: 10.1177/10454411000110040101
101. Hynes RO. Integrins: Bidirectional, Allosteric Signaling Machines. Cell (2002) 110(6):673–87. doi: 10.1016/S0092-8674(02)00971-6
102. Pfaff M, Reinhardt DP, Sakai LY, Timpl R. Cell Adhesion and Integrin Binding to Recombinant Human Fibrillin-1. FEBS Lett (1996) 384(3):247–50. doi: 10.1016/0014-5793(96)00325-0
103. Nath D, Slocombe PM, Webster A, Stephens PE, Docherty AJ, Murphy G. Meltrin Gamma (ADAM-9) Mediates Cellular Adhesion Through Alpha (6) Beta (1) Integrin, Leading to a Marked Induction of Fibroblast Cell Motility. J Cell Sci (2000) 113(12):2319. doi: 10.1242/jcs.113.12.2319
104. Zanuzzo FS, Urbinati EC, Rise ML, Hall JR, Nash GW, Gamperl AK. Aeromonas salmonicida Induced Immune Gene Expression in Aloe Vera Fed Steelhead Trout, Oncorhynchus mykiss (Walbaum). Aquaculture (2015) 435:1–9. doi: 10.1016/j.aquaculture.2014.09.010
105. Loke PN, Allison JP. PD-L1 and PD-L2 are Differentially Regulated by Th1 and Th2 Cells. Proc Natl Acad Sci USA (2003) 100(9):5336–41. doi: 10.1073/pnas.0931259100
106. Chen J, Zhang L, Yang N, Cao M, Tian M, Fu Q, et al. Characterization of the Immune Roles of Cathepsin L in Turbot (Scophthalmus maximus L.) Mucosal Immunity. Fish Shellfish Immunol (2020) 97:322–35. doi: 10.1016/j.fsi.2019.12.005
107. Fonović M, Turk B. Cysteine Cathepsins and Extracellular Matrix Degradation. Biochim Biophys Acta Gen Subj (2014) 1840(8):2560–70. doi: 10.1016/j.bbagen.2014.03.017
108. Turk V, Turk B, Guncar G, Turk D, Kos J. Lysosomal Cathepsins: Structure, Role in Antigen Processing and Presentation, and Cancer. Adv Enzym Regul (2002) 42:285–303. doi: 10.1016/S0065-2571(01)00034-6
109. Winter C, Taut K, Srivastava M, Länger F, Mack M, Briles DE, et al. Lung-Specific Overexpression of CC Chemokine Ligand (CCL) 2 Enhances the Host Defense to Streptococcus pneumoniae Infection in Mice: Role of the CCL2-CCR2 Axis. J Immunol (2007) 178(9):5828. doi: 10.4049/jimmunol.178.9.5828
110. Yoo SK, Starnes TW, Deng Q, Huttenlocher A. Lyn is a Redox Sensor That Mediates Leukocyte Wound Attraction In Vivo. Nature (2011) 480(7375):109–12. doi: 10.1038/nature10632
111. Xu T, Wang Z, Dong M, Wu D, Liao S, Li X. Chloride Intracellular Channel Protein 2: Prognostic Marker and Correlation With PD-1/PD-L1 in Breast Cancer. Aging (Albany NY) (2020) 12(17):17305–27. doi: 10.18632/aging.103712
112. Jing Z, Xu H, Chen X, Zhong Q, Huang J, Zhang Y, et al. The Proton-Sensing G-Protein Coupled Receptor GPR4 Promotes Angiogenesis in Head and Neck Cancer. PloS One (2016) 11(4):e0152789. doi: 10.1371/journal.pone.0152789
113. Krewson EA, Sanderlin EJ, Marie MA, Akhtar SN, Velcicky J, Loetscher P, et al. The Proton-Sensing GPR4 Receptor Regulates Paracellular Gap Formation and Permeability of Vascular Endothelial Cells. iScience (2020) 23(2):100848. doi: 10.1016/j.isci.2020.100848
114. Rebl A, Goldammer T, Seyfert H-M. Toll-Like Receptor Signaling in Bony Fish. Vet Immunol Immunop (2010) 134(3):139–50. doi: 10.1016/j.vetimm.2009.09.021
115. Damgaard RB, Gyrd-Hansen M. Inhibitor of Apoptosis (IAP) Proteins in Regulation of Inflammation and Innate Immunity. Discovery Med (2011) 11(58):221–31.
116. Kanwal Z, Wiegertjes GF, Veneman WJ, Meijer AH, Spaink HP. Comparative Studies of Toll-Like Receptor Signalling Using Zebrafish. Dev Comp Immunol (2014) 46(1):35–52. doi: 10.1016/j.dci.2014.02.003
117. Zhang J, Kong X, Zhou C, Li L, Nie G, Li X. Toll-Like Receptor Recognition of Bacteria in Fish: Ligand Specificity and Signal Pathways. Fish Shellfish Immunol (2014) 41(2):380–8. doi: 10.1016/j.fsi.2014.09.022
118. Gao F-Y, Pang J-C, Wang M, Lu M-X, Liu Z-G, Cao J-M, et al. Structurally Diverse Genes Encode TLR13 in Nile Tilapia: The Two Receptors can Recognize Streptococcus 23s RNA and Conduct Signal Transduction Through MyD88. Mol Immunol (2021) 132:60–78. doi: 10.1016/j.molimm.2021.01.020
119. Pfannkuch L, Hurwitz R, Traulsen J, Sigulla J, Poeschke M, Matzner L, et al. ADP Heptose, a Novel Pathogen-Associated Molecular Pattern Identified in Helicobacter pylori. FASEB J (2019) 33(8):9087–99. doi: 10.1096/fj.201802555R
120. Dambuza IM, Brown GD. C-Type Lectins in Immunity: Recent Developments. Curr Opin Immunol (2015) 32:21–7. doi: 10.1016/j.coi.2014.12.002
121. Rauta PR, Samanta M, Dash HR, Nayak B, Das S. Toll-Like Receptors (TLRs) in Aquatic Animals: Signaling Pathways, Expressions and Immune Responses. Immunol Lett (2014) 158(1–2):14–24. doi: 10.1016/j.imlet.2013.11.013
122. Campos-Sánchez JC, Esteban MÁ. Review of Inflammation in Fish and Value of the Zebrafish Model. J Fish Dis (2021) 44(2):123–39. doi: 10.1111/jfd.13310
123. Wei H, Lv M, Wen C, Zhang A, Yang K, Zhou H, et al. Identification of an Intercellular Cell Adhesion Molecule-1 Homologue From Grass Carp: Evidence for Its Involvement in the Immune Cell Adhesion in Teleost. Fish Shellfish Immunol (2018) 81:67–72. doi: 10.1016/j.fsi.2018.07.011
124. Kjøller L, Kanse SM, Kirkegaard T, Rodenburg KW, Rønne E, Goodman SL, et al. Plasminogen Activator Inhibitor-1 Represses Integrin- and Vitronectin-Mediated Cell Migration Independently of Its Function as an Inhibitor of Plasminogen Activation. Exp Cell Res (1997) 232(2):420–9. doi: 10.1006/excr.1997.3540
125. Planus E, Barlovatz-Meimon G, Rogers RA, Bonavaud S, Ingber DE, Wang N. Binding of Urokinase to Plasminogen Activator Inhibitor Type-1 Mediates Cell Adhesion and Spreading. J Cell Sci (1997) 110(Pt 9):1091–8. doi: 10.1242/jcs.110.9.1091
126. Li Y, Liu S, Qin Z, Yao J, Jiang C, Song L, et al. The Serpin Superfamily in Channel Catfish: Identification, Phylogenetic Analysis and Expression Profiling in Mucosal Tissues After Bacterial Infections. Dev Comp Immunol (2015) 49(2):267–77. doi: 10.1016/j.dci.2014.12.006
127. Pedersen ME, Vuong TT, Rønning SB, Kolset SO. Matrix Metalloproteinases in Fish Biology and Matrix Turnover. Matrix Biol (2015) 44-46:86–93. doi: 10.1016/j.matbio.2015.01.009
128. Gamba L, Amin-Javaheri A, Kim J, Warburton D, Lien C-L. Collagenolytic Activity is Associated With Scar Resolution in Zebrafish Hearts After Cryoinjury. J Cardiovasc Dev Dis (2017) 4(1):2. doi: 10.3390/jcdd4010002
129. Li X-P, Zhang J. A Live Attenuated Edwardsiella tarda Vaccine Induces Immunological Expression Pattern in Japanese Flounder (Paralichthys olivaceus) in the Early Phase of Immunization. Comp Biochem Physiol C Toxicol Pharmacol (2021) 239:108872. doi: 10.1016/j.cbpc.2020.108872
130. Drew AF, Liu H, Davidson JM, Daugherty CC, Degen JL. Wound-Healing Defects in Mice Lacking Fibrinogen. Blood (2001) 97(12):3691–8. doi: 10.1182/blood.V97.12.3691
131. Luo D, Lin J-S, Parent MA, Mullarky-Kanevsky I, Szaba FM, Kummer LW, et al. Fibrin Facilitates Both Innate and T Cell–Mediated Defense Against Yersinia Pestis. J Immunol (2013) 190(8):4149. doi: 10.4049/jimmunol.1203253
132. Murugappa S, Kunapuli S. The Role of ADP Receptors in Platelet Function. Front Biosci (2006) 11:1977–86. doi: 10.2741/1939
133. Loghmani H, Conway EM. Exploring Traditional and Nontraditional Roles for Thrombomodulin. Blood (2018) 132(2):148–58. doi: 10.1182/blood-2017-12-768994
134. Duga S, Asselta R, Tenchini ML. Coagulation Factor V. Int J Biochem Cell Biol (2004) 36(8):1393–9. doi: 10.1016/j.biocel.2003.08.002
135. Li Z, Liu X, Cheng J, He Y, Wang X, Wang Z, et al. Transcriptome Profiling Provides Gene Resources for Understanding Gill Immune Responses in Japanese Flounder (Paralichthys olivaceus) Challenged With Edwardsiella tarda. Fish Shellfish Immunol (2018) 72:593–603. doi: 10.1016/j.fsi.2017.11.041
136. Bayne CJ, Gerwick L. The Acute Phase Response and Innate Immunity of Fish. Dev Comp Immunol (2001) 25(8):725–43. doi: 10.1016/S0145-305X(01)00033-7
137. Upragarin N, Landman W, Gaastra W, Gruys E. Extrahepatic Production of Acute Phase Serum Amyloid A. Histol Histopathol (2005). 20(4):1295–307. doi: 10.14670/HH-20.1295
138. MacKellar M, Vigerust DJ. Role of Haptoglobin in Health and Disease: A Focus on Diabetes. Clin Diabetes (2016) 34(3):148. doi: 10.2337/diaclin.34.3.148
139. Brinchmann MF. Immune Relevant Molecules Identified in the Skin Mucus of Fish Using -Omics Technologies. Mol Biosyst (2016) 12(7):2056–63. doi: 10.1039/C5MB00890E
140. Würzner R. Modulation of Complement Membrane Attack by Local C7 Synthesis. Clin Exp Immunol (2000) 121(1):8–10. doi: 10.1046/j.1365-2249.2000.01263.x
141. Broekman DC, Zenz A, Gudmundsdottir BK, Lohner K, Maier VH, Gudmundsson GH. Functional Characterization of Codcath, the Mature Cathelicidin Antimicrobial Peptide From Atlantic Cod (Gadus morhua). Peptides (2011) 32(10):2044–51. doi: 10.1016/j.peptides.2011.09.012
142. Yu L-P, Sun B-G, Li J, Sun L. Characterization of a C-Type Lysozyme of Scophthalmus maximus: Expression, Activity, and Antibacterial Effect. Fish Shellfish Immunol (2013) 34(1):46–54. doi: 10.1016/j.fsi.2012.10.007
143. Uribe C, Folch H, Enriquez R, Moran G. Innate and Adaptive Immunity in Teleost Fish: A Review. Vet Med (2011) 56(10):486–503. doi: 10.17221/3294-VETMED
144. Mills CD. Anatomy of a Discovery: M1 and M2 Macrophages. Front Immunol (2015) 6(212). doi: 10.3389/fimmu.2015.00212
145. Wentzel AS, Petit J, van Veen WG, Fink IR, Scheer MH, Piazzon MC, et al. Transcriptome Sequencing Supports a Conservation of Macrophage Polarization in Fish. Sci Rep (2020) 10(1):13470. doi: 10.1038/s41598-020-70248-y
146. Li L, Wei W, Li Z, Chen H, Li Y, Jiang W, et al. The Spleen Promotes the Secretion of CCL2 and Supports an M1 Dominant Phenotype in Hepatic Macrophages During Liver Fibrosis. Cell Physiol Biochem (2018) 51(2):557–74. doi: 10.1159/000495276
147. Neumann D, Kollewe C, Martin MU, Boraschi D. The Membrane Form of the Type II IL-1 Receptor Accounts for Inhibitory Function. J Immunol (2000) 165(6):3350. doi: 10.4049/jimmunol.165.6.3350
148. Papin S, Cuenin S, Agostini L, Martinon F, Werner S, Beer HD, et al. The SPRY Domain of Pyrin, Mutated in Familial Mediterranean Fever Patients, Interacts With Inflammasome Components and Inhibits proIL-1β Processing. Cell Death Differ (2007) 14(8):1457–66. doi: 10.1038/sj.cdd.4402142
149. Honkala AT, Tailor D, Malhotra SV. Guanylate-Binding Protein 1: An Emerging Target in Inflammation and Cancer. Front Immunol (2020) 10(3139). doi: 10.3389/fimmu.2019.03139
150. Salinas I. The Mucosal Immune System of Teleost Fish. Biology (2015) 4(3):525–39. doi: 10.3390/biology4030525
151. Seppola M, Mikkelsen H, Johansen A, Steiro K, Myrnes B, Nilsen IW. Ultrapure LPS Induces Inflammatory and Antibacterial Responses Attenuated In Vitro by Exogenous Sera in Atlantic Cod and Atlantic Salmon. Fish Shellfish Immunol (2015) 44(1):66–78. doi: 10.1016/j.fsi.2015.01.018
152. Ponomarenko M, Stepanenko I, Kolchanov N. “Heat Shock Proteins”. In: Brenner’s Encyclopedia of Genetics, Maloy S, Hughes K. San Diego: Academic Press (2013). p. 402–5.
153. Wabnitz GH, Köcher T, Lohneis P, Stober C, Konstandin MH, Funk B, et al. Costimulation Induced Phosphorylation of L-Plastin Facilitates Surface Transport of the T Cell Activation Molecules CD69 and CD25. Eur J Immunol (2007) 37(3):649–62. doi: 10.1002/eji.200636320
154. Hida S, Yamasaki S, Sakamoto Y, Takamoto M, Obata K, Takai T, et al. Fc Receptor γ-Chain, a Constitutive Component of the IL-3 Receptor, is Required for IL-3-Induced IL-4 Production in Basophils. Nat Immunol (2009) 10(2):214–22. doi: 10.1038/ni.1686
155. Chen YP, Djaffar I, Pidard D, Steiner B, Cieutat AM, Caen JP, et al. Ser-752–>Pro Mutation in the Cytoplasmic Domain of Integrin Beta 3 Subunit and Defective Activation of Platelet Integrin Alpha IIb Beta 3 (Glycoprotein IIb-IIIa) in a Variant of Glanzmann Thrombasthenia. Proc Natl Acad Sci USA (1992) 89(21):10169. doi: 10.1073/pnas.89.21.10169
156. Zhu J, Nathan C, Jin W, Sim D, Ashcroft GS, Wahl SM, et al. Conversion of Proepithelin to Epithelins: Roles of Slpi and Elastase in Host Defense and Wound Repair. Cell (2002) 111(6):867–78. doi: 10.1016/S0092-8674(02)01141-8
157. Soldi R, Mitola S, Strasly M, Defilippi P, Tarone G, Bussolino F. Role of αvβ3 Integrin in the Activation of Vascular Endothelial Growth Factor Receptor-2. EMBO J (1999) 18(4):882–92. doi: 10.1093/emboj/18.4.882
158. Kim J, Kang Y, Kojima Y, Lighthouse JK, Hu X, Aldred MA, et al. An Endothelial Apelin-FGF Link Mediated by miR-424 and miR-503 is Disrupted in Pulmonary Arterial Hypertension. Nat Med (2013) 19(1):74–82. doi: 10.1038/nm.3040
159. Lee A, Papangeli I, Park Y, Jeong H-N, Choi J, Kang H, et al. A Pparγ-Dependent miR-424/503-CD40 Axis Regulates Inflammation Mediated Angiogenesis. Sci Rep (2017) 7(1):2528. doi: 10.1038/s41598-017-02852-4
160. Urbich C, Rössig L, Kaluza D, Potente M, Boeckel J-N, Knau A, et al. HDAC5 is a Repressor of Angiogenesis and Determines the Angiogenic Gene Expression Pattern of Endothelial Cells. Blood (2009) 113(22):5669–79. doi: 10.1182/blood-2009-01-196485
161. Kaneider NC, Leger AJ, Kuliopulos A. Therapeutic Targeting of Molecules Involved in Leukocyte–Endothelial Cell Interactions. FEBS J (2006) 273(19):4416–24. doi: 10.1111/j.1742-4658.2006.05441.x
162. Senis YA. Protein-Tyrosine Phosphatases: A New Frontier in Platelet Signal Transduction. J Thromb Haemost (2013) 11(10):1800–13. doi: 10.1111/jth.12359
163. Bearer EL, Prakash JM, Li Z. Actin Dynamics in Platelets. Int Rev Cytol (2002) 217:137–82. doi: 10.1016/S0074-7696(02)17014-8
164. Miyake Y, Toyonaga K, Mori D, Kakuta S, Hoshino Y, Oyamada A, et al. C-Type Lectin Mcl is an Fcrγ-Coupled Receptor That Mediates the Adjuvanticity of Mycobacterial Cord Factor. Immunity (2013) 38(5):1050–62. doi: 10.1016/j.immuni.2013.03.010
165. Lopez Robles MD, Pallier A, Huchet V, Le Texier L, Remy S, Braudeau C, et al. Cell-Surface C-Type Lectin-Like Receptor CLEC-1 Dampens Dendritic Cell Activation and Downstream Th17 Responses. Blood Adv (2017) 1(9):557–68. doi: 10.1182/bloodadvances.2016002360
166. Robinson P, Lipscomb S, Preston LC, Altin E, Watkins H, Ashley CC, et al. Mutations in Fast Skeletal Troponin I, Troponin T, and β-Tropomyosin That Cause Distal Arthrogryposis All Increase Contractile Function. FASEB J (2007) 21(3):896–905. doi: 10.1096/fj.06-6899com
167. Molgora M, Supino D, Mantovani A, Garlanda C. Tuning Inflammation and Immunity by the Negative Regulators IL-1R2 and IL-1r8. Immunol Rev (2018) 281(1):233–47. doi: 10.1111/imr.12609
168. Kloetzel P-M. Antigen Processing by the Proteasome. Nat Rev Mol Cell Biol (2001) 2(3):179–88. doi: 10.1038/35056572
169. Shaffer AL, Yu X, He Y, Boldrick J, Chan EP, Staudt LM. BCL-6 Represses Genes That Function in Lymphocyte Differentiation, Inflammation, and Cell Cycle Control. Immunity (2000) 13(2):199–212. doi: 10.1016/S1074-7613(00)00020-0
170. Hatzi K, Jiang Y, Huang C, Garrett-Bakelman F, Gearhart Micah D, Giannopoulou Eugenia G, et al. A Hybrid Mechanism of Action for BCL6 in B Cells Defined by Formation of Functionally Distinct Complexes at Enhancers and Promoters. Cell Rep (2013) 4(3):578–88. doi: 10.1016/j.celrep.2013.06.016
Keywords: Atlantic salmon, sea lice, formalin-killed bacterin, Aeromonas salmonicida, skin transcriptome
Citation: Caballero-Solares A, Umasuthan N, Xue X, Katan T, Kumar S, Westcott JD, Chen Z, Fast MD, Skugor S, Taylor RG and Rise ML (2022) Interacting Effects of Sea Louse (Lepeophtheirus salmonis) Infection and Formalin-Killed Aeromonas salmonicida on Atlantic Salmon Skin Transcriptome. Front. Immunol. 13:804987. doi: 10.3389/fimmu.2022.804987
Received: 29 October 2021; Accepted: 21 February 2022;
Published: 24 March 2022.
Edited by:
Geert Wiegertjes, Wageningen University and Research, NetherlandsReviewed by:
Jason W. Holland, University of Aberdeen, United KingdomBen F. Koop, University of Victoria, Canada
Copyright © 2022 Caballero-Solares, Umasuthan, Xue, Katan, Kumar, Westcott, Chen, Fast, Skugor, Taylor and Rise. This is an open-access article distributed under the terms of the Creative Commons Attribution License (CC BY). The use, distribution or reproduction in other forums is permitted, provided the original author(s) and the copyright owner(s) are credited and that the original publication in this journal is cited, in accordance with accepted academic practice. No use, distribution or reproduction is permitted which does not comply with these terms.
*Correspondence: Albert Caballero-Solares, YWNhYmFsbGVyb3NvQG11bi5jYQ==
†Present address: Navaneethaiyer Umasuthan, AquaBounty Canada Inc., Fortune, PE, Canada