
95% of researchers rate our articles as excellent or good
Learn more about the work of our research integrity team to safeguard the quality of each article we publish.
Find out more
ORIGINAL RESEARCH article
Front. Immunol. , 20 January 2023
Sec. Immunological Tolerance and Regulation
Volume 13 - 2022 | https://doi.org/10.3389/fimmu.2022.1092028
 Marte Heimli1
 Siri Tennebø Flåm1
 Hanne Sagsveen Hjorthaug1Don Trinh2
 Michael Frisk3,4Karl-Andreas Dumont5Teodora Ribarska1†Xavier Tekpli1
 Mario Saare1†
 Benedicte Alexandra Lie1*
To prevent autoimmunity, thymocytes expressing self-reactive T cell receptors (TCRs) are negatively selected, however, divergence into tolerogenic, agonist selected lineages represent an alternative fate. As thymocyte development, selection, and lineage choices are dependent on spatial context and cell-to-cell interactions, we have performed Cellular Indexing of Transcriptomes and Epitopes by sequencing (CITE-seq) and spatial transcriptomics on paediatric human thymus. Thymocytes expressing markers of strong TCR signalling diverged from the conventional developmental trajectory prior to CD4+ or CD8+ lineage commitment, while markers of different agonist selected T cell populations (CD8αα(I), CD8αα(II), T(agonist), Treg(diff), and Treg) exhibited variable timing of induction. Expression profiles of chemokines and co-stimulatory molecules, together with spatial localisation, supported that dendritic cells, B cells, and stromal cells contribute to agonist selection, with different subsets influencing thymocytes at specific developmental stages within distinct spatial niches. Understanding factors influencing agonist T cells is needed to benefit from their immunoregulatory effects in clinical use.
Immature T cells, or thymocytes, stem from bone marrow-derived precursors entering the thymus at the junction between the outer cortex and inner medulla of thymic lobules. The subsequent developmental process has been comprehensively studied in mice (1). Following entry, thymocytes are CD4-CD8- double negative (DN), and migrate outwards through the cortex towards the subcapsular zone (2). For the αβ lineage, recombination is first initiated at the Tcrb locus, resulting in a pre-T cell receptor (TCR) complex consisting of a recombined β chain and an invariant α chain (3, 4). After assessment of the pre-TCR complex at the β-selection checkpoint, the Tcra locus of CD4+CD8+ double positive (DP) thymocytes is recombined (5, 6). Alternatively, thymocytes may diverge into the γδ T cell lineage (7).
DP thymocytes move back through the cortex towards the medulla and go through positive selection (8). This results in death by neglect of thymocytes lacking affinity towards self-peptides presented on Major Histocompatibility Complex (MHC) molecules by cortical thymic epithelial cells (cTECs) (9, 10). A second checkpoint termed negative selection occurs largely in the medulla, when thymocytes have reached the CD4+CD8- or CD4-CD8+ single positive (SP) stage. Tissue-specific antigens produced by medullary thymic epithelial cells (mTECs) may be presented by mTECs themselves, but may also be cross-presented by professional antigen-presenting cell (APC) populations such as dendritic cells (DCs) (11, 12). Peripheral antigens can also be presented by migratory DC subsets circulating to the thymus (13). For thymocytes exhibiting strong responsiveness toward the presented self-antigens, one possible outcome would be induction of apoptosis (14).
However, thymocytes exhibiting reactivity towards self-peptides may alternatively diverge towards agonist selected T cell lineages, including CD8αα T cells and regulatory T cells (Tregs). The tolerogenic function of agonist selected T cells has led to a substantial interest in their potential for therapeutic use (15, 16). However, uncertainty remains regarding when during thymocyte development divergence into agonist selected lineages occurs, and which factors influence the lineage decision (17–19). While the affinity of the TCR for presented peptide:MHC complexes has been highlighted as a contributing factor, conflicting evidence regarding the TCR affinity of agonist selected lineages could imply additional layers of regulation (20–24).
The thymocyte response upon encounter of specific antigen requires both recognition of peptide:MHC complexes by the TCR (signal 1), and co-stimulatory signalling (signal 2). Co-stimulatory signalling has been attributed crucial roles during Treg development (25, 26). Stromal and APC populations also produce cytokines, which regulate thymocyte migration in a developmentally timed manner (8, 27–29).
To gain insights into the human thymus, we and others have previously studied gene expression in selected thymic cell populations (30–36). Through the Human Cell Atlas initiative, datasets at single-cell resolution for human tissues are rapidly emerging (37). This resource includes single-cell RNA sequencing data of the human thymus across age groups (38). However, elucidation of heterogeneity among thymic APCs and stromal cells is challenging due to their low abundance, and confounded by the profound effects of ageing and thymic involution. Thymic output is at its highest in early infancy, however, loss of thymic mass and structure during ageing results in a corresponding decline in thymocyte production and egression (39, 40). Finally, as the developmental progression of thymocytes is intricately entwined with migration through distinct microenvironmental niches, there is a need to complement insights gained from dissociated samples with methodologies providing spatial information.
Here, we assess human paediatric thymic samples by Cellular Indexing of Transcriptomes and Epitopes by sequencing (CITE-seq) and spatial transcriptomics. In particular, as a result of a carefully developed enrichment strategy, we provide insights into how distinct subsets of thymic APC and stromal cell populations influence agonist selected thymocyte lineages.
Human paediatric thymic tissues (N=5) were dissociated (Supplementary Table S1). In order to cover both thymocytes and scarce populations of APCs and non-hematopoietic stromal cells, CITE-seq was performed for three samples per donor: (i) prior to enrichment, (ii) after enrichment for APCs using density gradient centrifugation, and (iii) after enrichment for stromal cells through depletion of CD45-expressing cells (Figure 1A; Supplementary Figure S1; Supplementary Table S2). After filtering, 83 847 cells were retained, and all three thymic samples from all five donors were integrated by use of the integration anchor approach implemented in Seurat (41) for a joint downstream analysis. Through manual annotation, according to expression patterns of established marker genes and genes found to be differentially expressed across populations in previously reported single-cell studies, we identified 38 cell populations and developmental stages, including thymocytes, DCs, B cells, thymic epithelial cells (TECs), fibroblasts, endothelial cells and mural cells (Figure 1B; Supplementary Table S3).
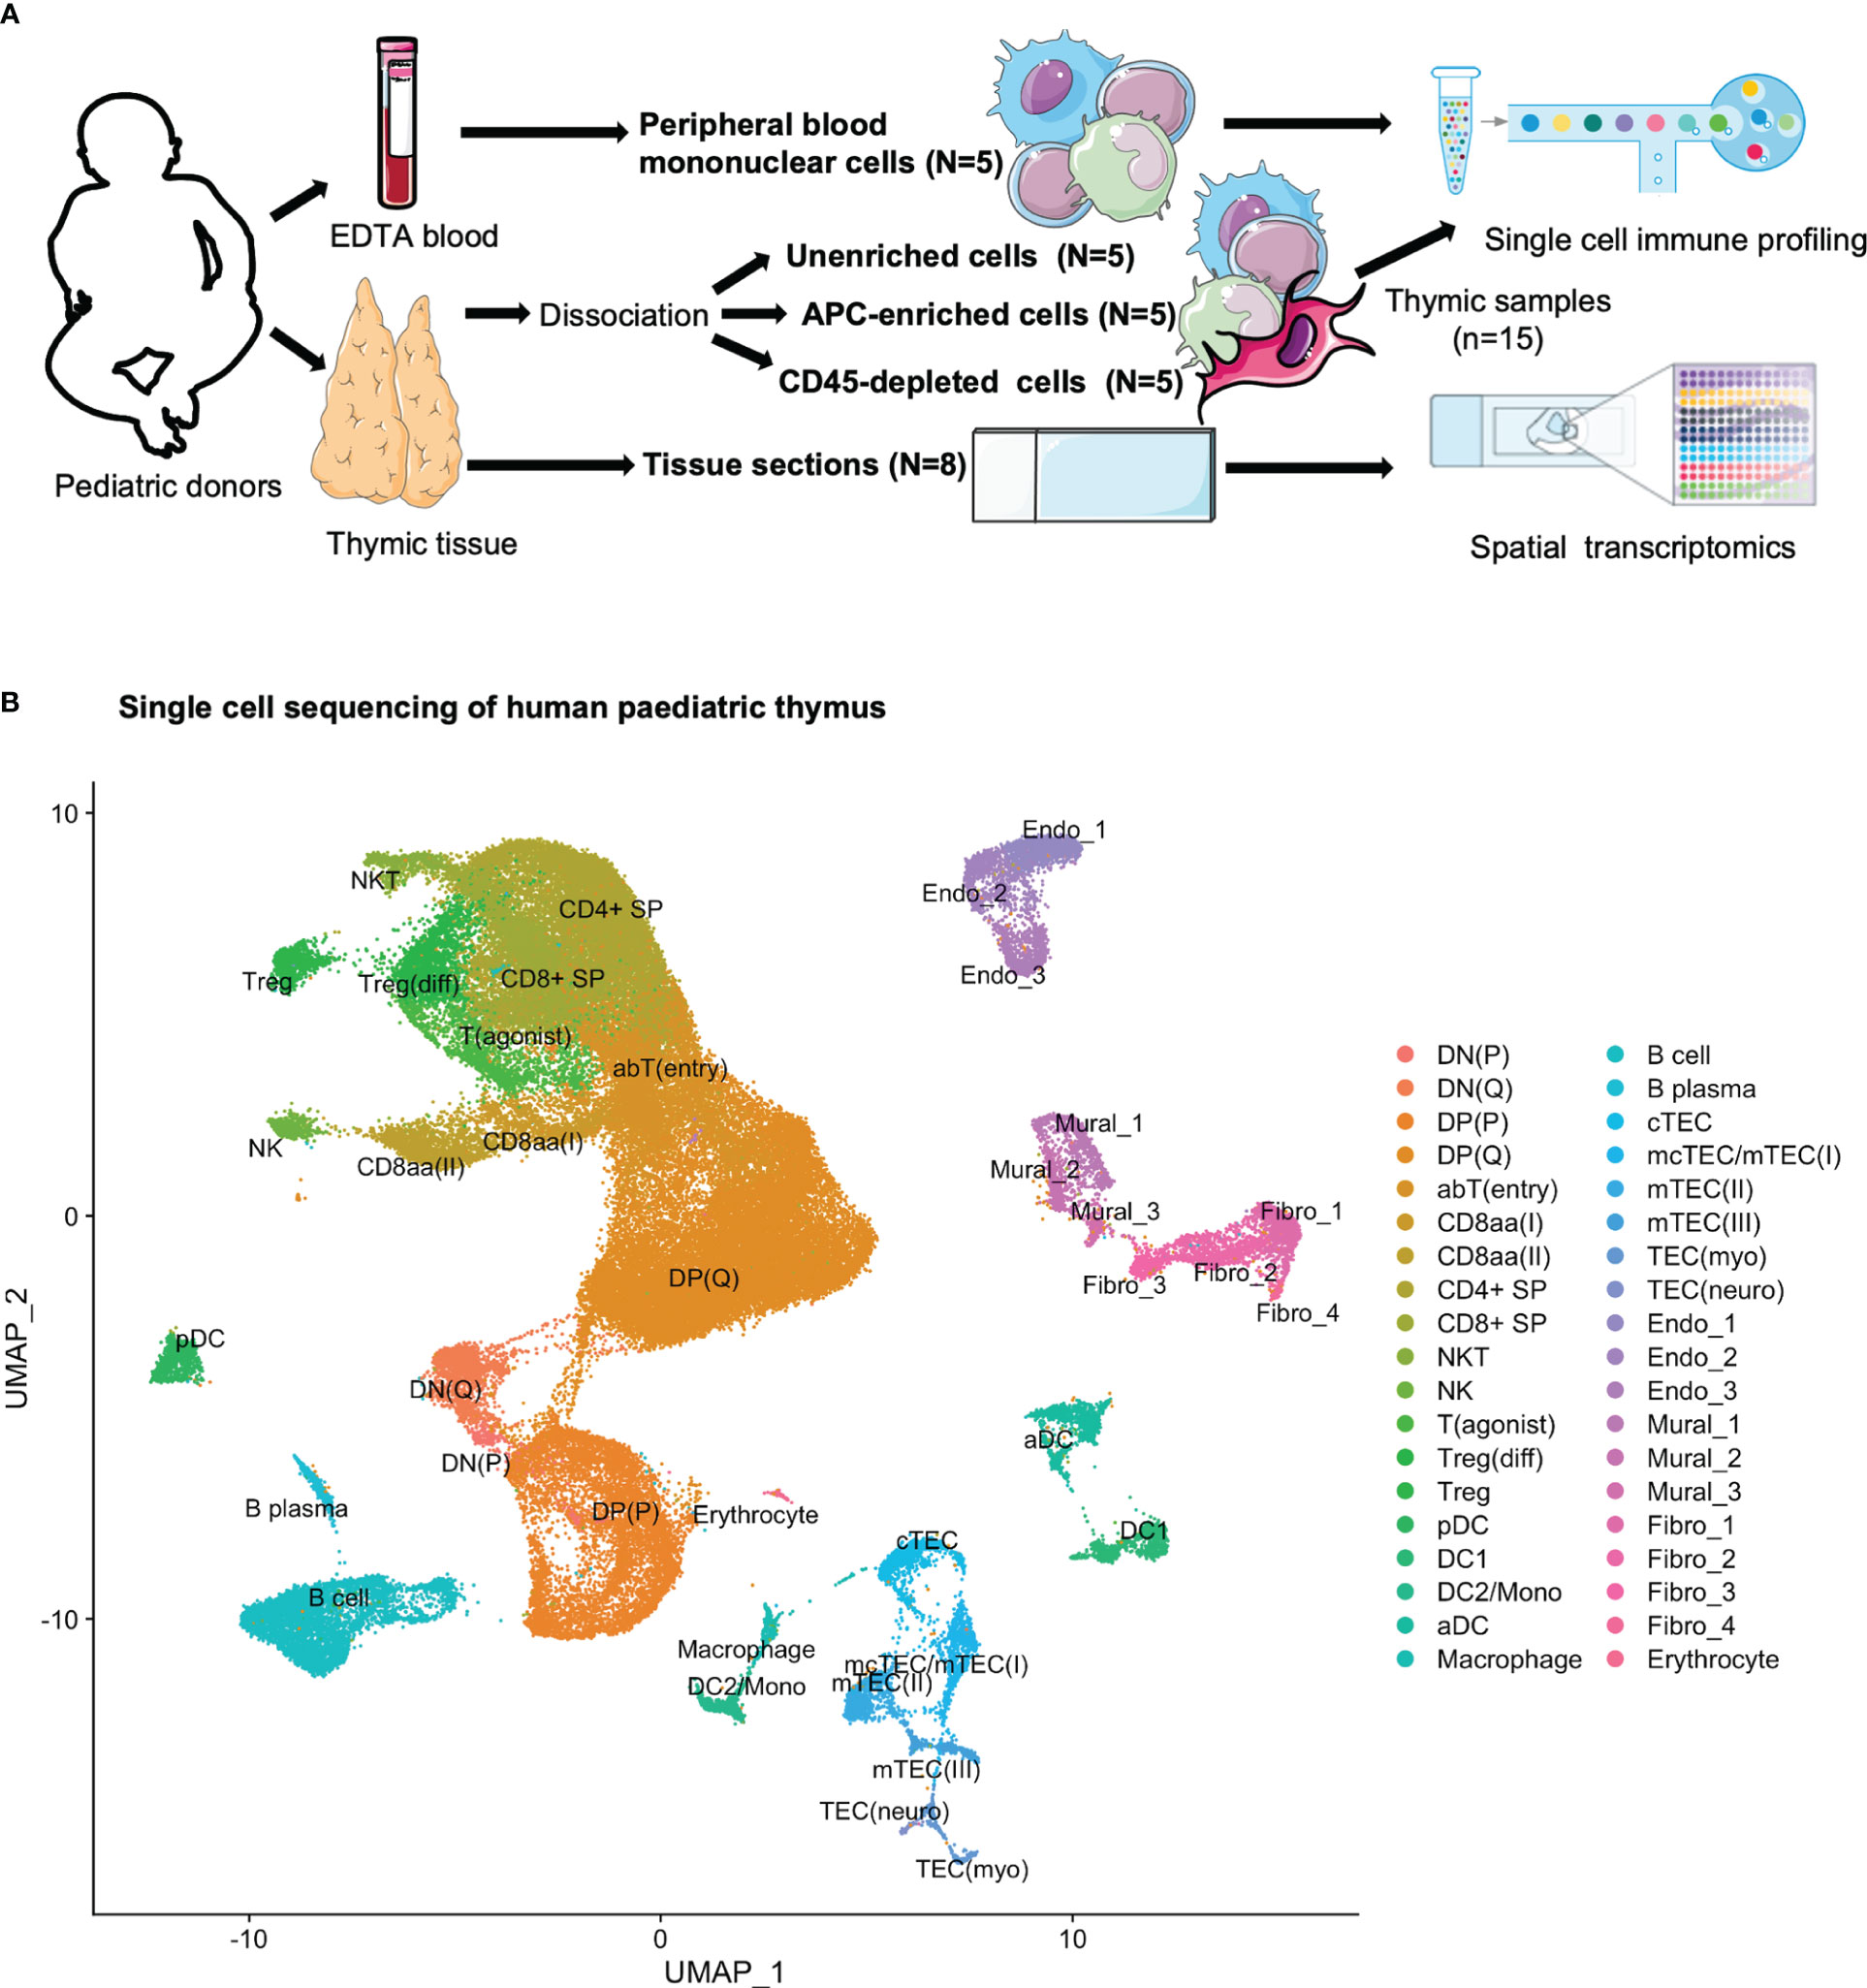
Figure 1 Multimodal profiling of human paediatric thymus. (A) Experimental set-up. Tissue was subjected to dissociation (N=5) or snap frozen (N=8) for sectioning. From donors where tissue was to be dissociated, EDTA blood was also collected. CITE-seq was performed for PBMCs (n=5) and thymic cells (n=15) at three separate stages of dissociation: 1. unenriched, 2. APC enriched, and 3. CD45-depleted. Tissue sections were used for spatial transcriptomics. (B) UMAP of 83 847 cells colour-coded for the cell types identified in thymus.
The distribution of events across each donor was assessed, with no large differences observed (Supplementary Figure S2A). In order to assess how the distribution of annotated cell populations varied across the applied enrichment steps, we assessed the contribution of cell types grouped as “early thymocytes”, “late thymocytes”, “agonist thymocytes”, “hematopoietic_APC”, “non-hematopoietic stromal”, and “other” (Supplementary Figures S2B, C), indicating an increase in late and agonist thymocytes in addition to APCs after density gradient centrifugation, and an increase in non-hematopoietic stromal cells after CD45-depletion. Correspondingly, while unenriched samples consisted largely of thymocytes exhibiting both RNA and protein level expression of CD3 (Supplementary Figure S2D), the APC-enriched and CD45-depeleted samples exhibited an increased proportion of HLA-DRA-expressing cells (Supplementary Figure S2E). The CD45-depleted samples exhibited an increase in stromal cell populations lacking expression of PTPRC/CD45, both at RNA and protein level (Supplementary Figures S2B, E, F). However, the protein level data did appear to suffer from high background staining, a previously noted challenge with the CITE-seq approach (42).
To explore the development and lineage divergence of thymocytes in more detail, the thymocyte compartment, consisting of 62 827 cells annotated as DN(P), DN(Q), DP(P), DP(Q), αβT(entry), CD8αα(I), CD8αα(II), T(agonist), Treg(diff), Treg, or NKT cells, was reanalysed. Due to the substantial influence of cell cycling on the proliferating (P) DN and DP populations, analysis was performed both without and with regression of cell cycle effects, which should mitigate the impact of the cell cycling-associated transcriptional signature upon creation of a low-dimensional representation of the data (Figure 2A; Supplementary Figures S3A, B). In order to account for the gradual progression of thymocytes through distinct developmental stages, pseudotime analysis was performed by Monocle3, which infers a developmental trajectory based progression through a learned sequence of transcriptional changes (43) (Figure 2B; Supplementary Figure S3C). Further analysis was performed on the subset without cell cycle regression (Supplementary Table S4).
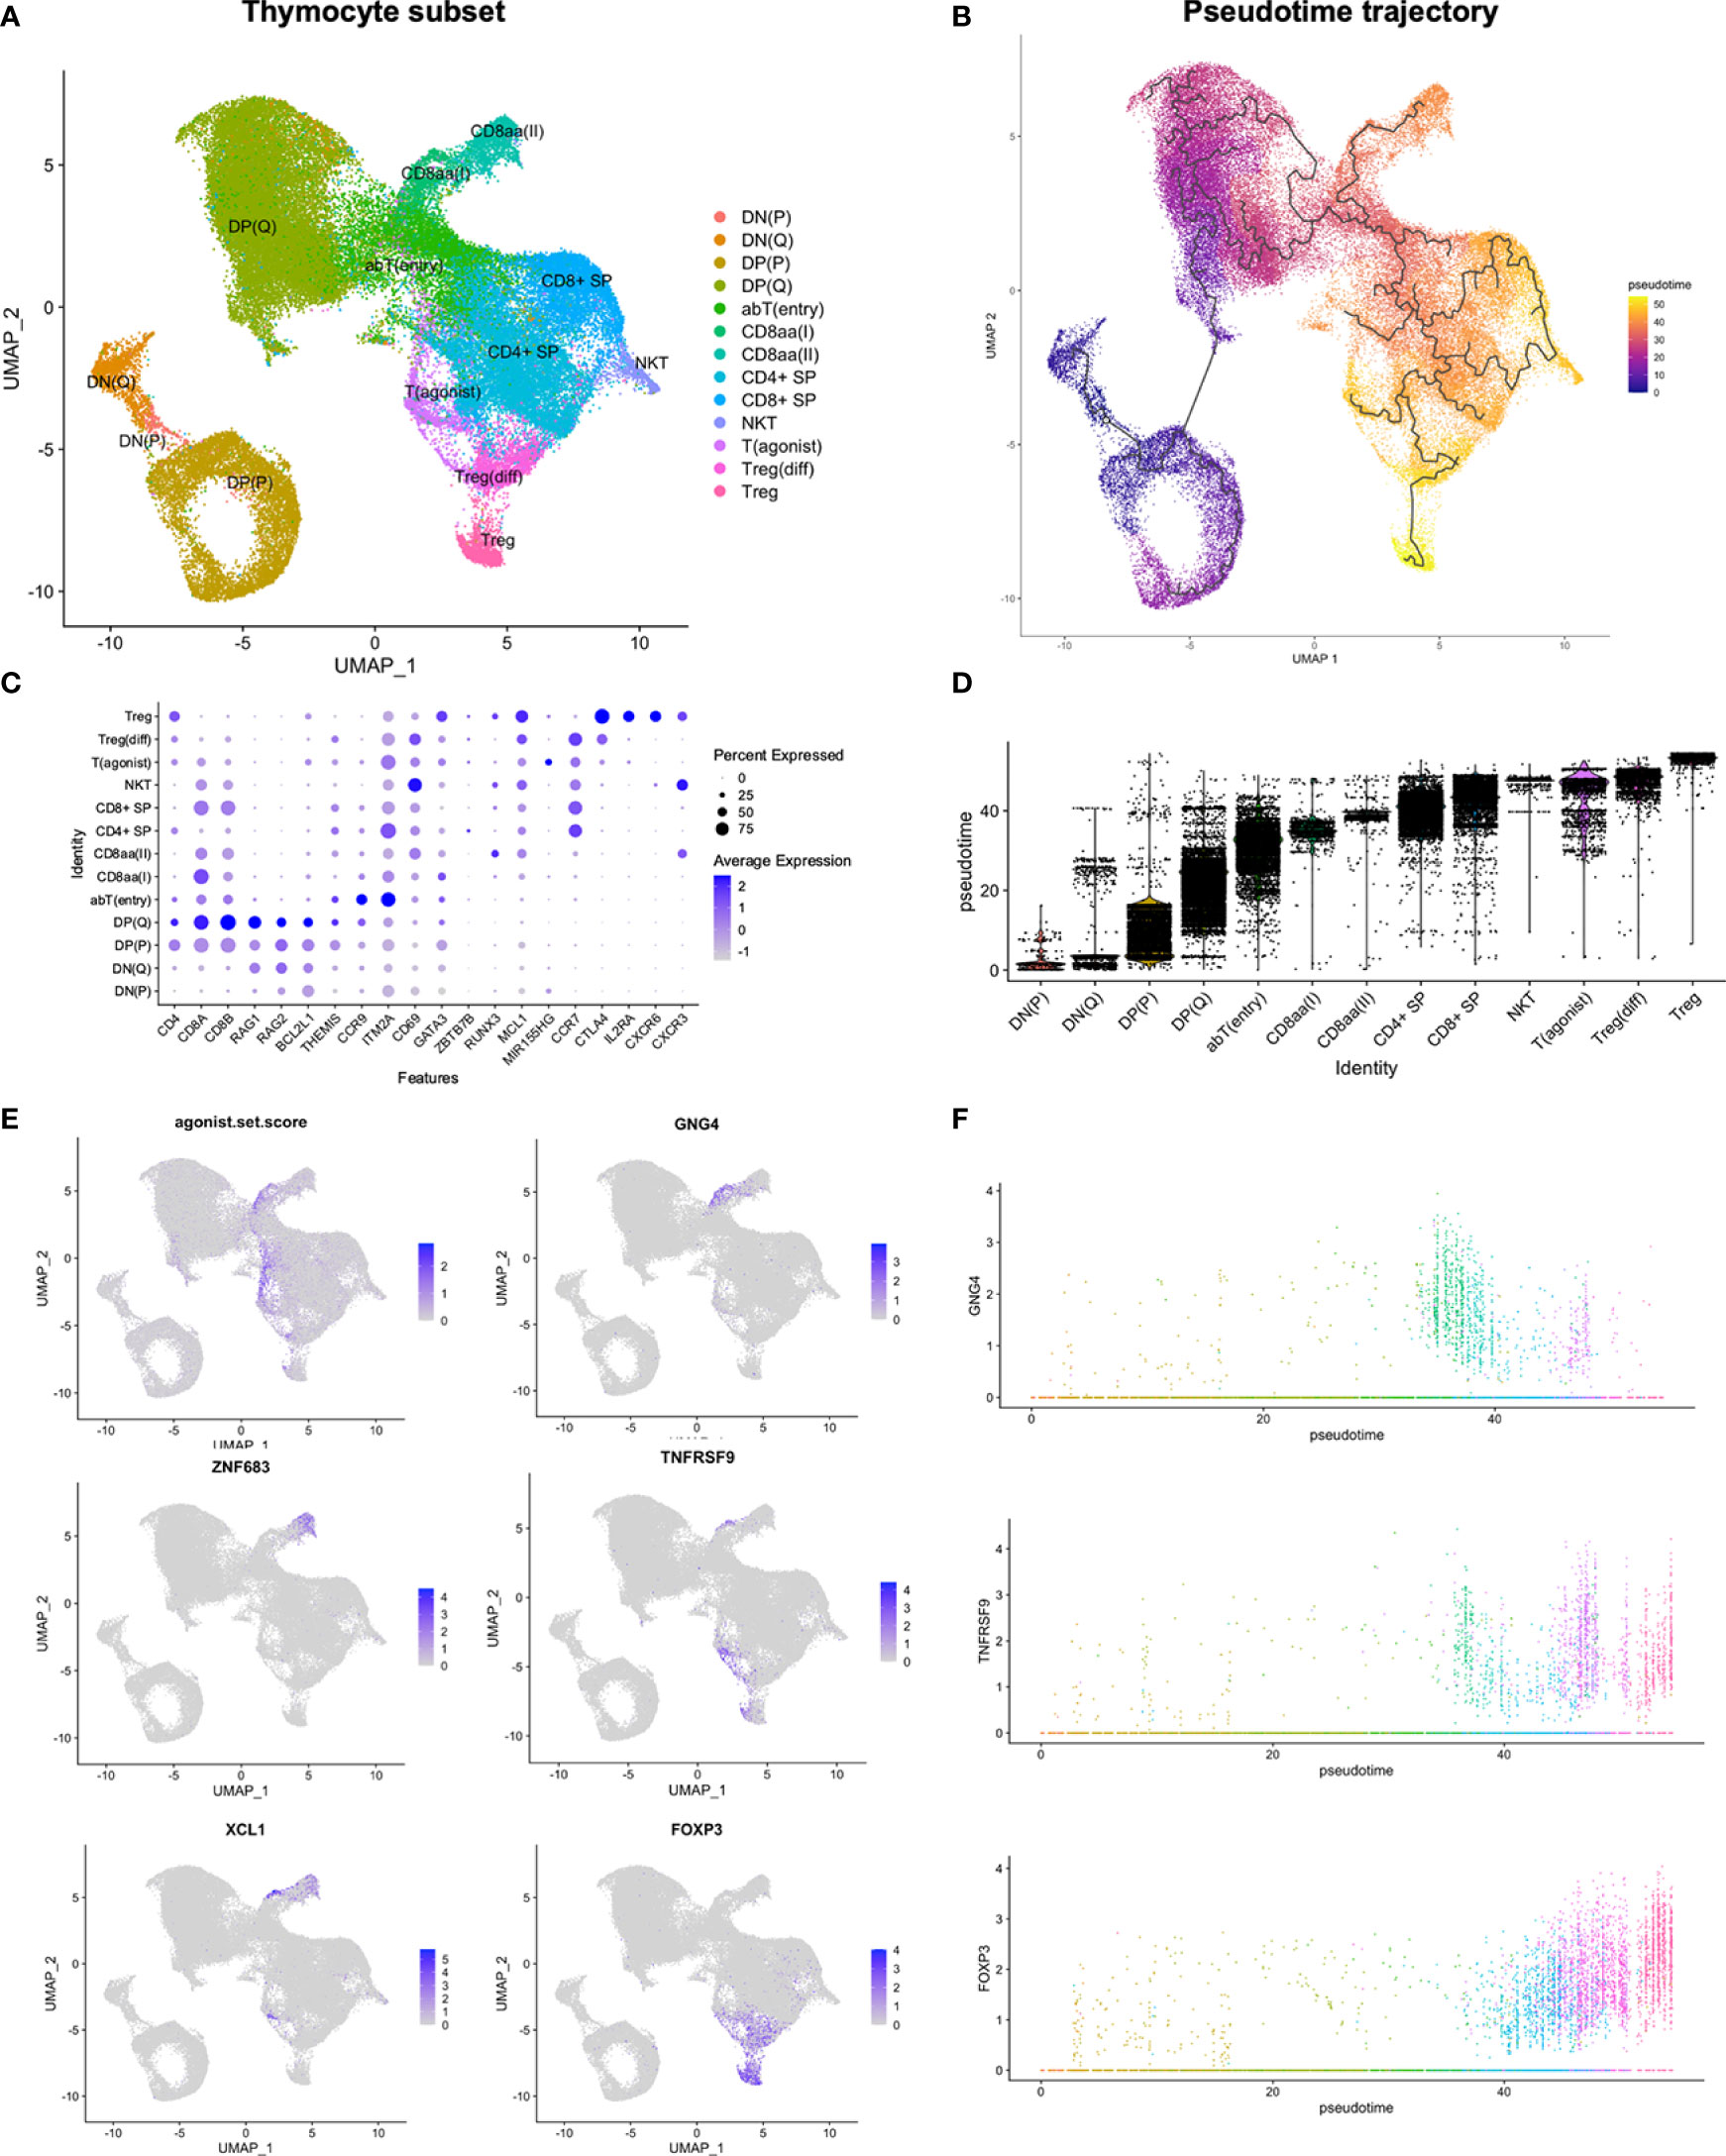
Figure 2 Reanalysis of thymocyte subset. (A) UMAP of thymocyte subset. (B, D) Pseudotime analysis by Monocle3. (C, E) Expression of selected genes in thymocyte subset. The agonist.set.score reflects the mean expression of NR4A1, NR4A3, NFKBID, NFATC1, BCL2L11 and PDCD1. (F) Expression of selected genes in thymocyte subset along pseudotime. Colouring according to annotations in (A).
Overall, thymocytes followed the established development from DN, to DP, to SP, defined by both RNA and protein level expression of CD4 and CD8 (Figure 2C; Supplementary Figure S3A). Quiescent (Q) DP thymocytes expressed RAG1/2 and anti-apoptotic BCL2L1. THEMIS, associated with responsiveness to TCR stimulation (44), was upregulated in late DP(Q) and retained through a stage resembling the previously described αβT(entry) cells (CCR9, ITM2A, TOX2, CD69) (38) (Figure 2C; Supplementary Figure S4A). Finally, ZBTB7B-expressing CD4+ SP cells were predicted to precede RUNX3-expressing CD8+ SP cells in pseudotime, and both SP populations upregulated anti-apoptotic MCL-1 (Figures 2C, D; Supplementary Figure S4A).
Taken together, this suggests a threefold division of human DP thymocytes into stages of proliferation, recombination and selection, in agreement with observations from mice (45, 46). Furthermore, we detected transcriptional changes in genes associated with TCR responsiveness and apoptosis during thymocyte development (Figure 2C; Supplementary Figure S4A), consistent with a model with variable survival ability upon encounter with specific antigen at distinct developmental time points.
A subset of cells within αβT(entry) upregulated expression of pro-apoptotic genes and markers of strong TCR signalling (BCL2L11, NR4A1, NR4A3, NFKBID, NFATC1, PDCD1) (47–49). In order to assess the summarised expression profile, we calculated an “agonist gene set score” as the mean expression of these six genes. This highlighted a divergence of cells with a high gene set score into two distinct branches. One branch consisted of CD8αα(I) and CD8αα(II) cells according to expression of GNG4 and ZNF683, respectively (Figures 2A, E, F). The second branch, termed T(agonist), contained cells at variable developmental time points, spanning cells at earlier stages of development exhibiting the TCR responsive signature, and more mature cells expressing MIR155HG and TNFRSF9 (Figures 2A–E; Supplementary Figures S4B, C).
We also observed FOXP3 expression among later-stage T(agonist) cells, with a further gradual increase for the differentiating Treg (Treg(diff)) and then Treg populations (Figures 2E, F). While the induction of FOXP3 among the more mature T(agonist) cells would fit with a Treg precursor identity, the inferred pseudotime trajectory failed to predict progression along the T(agonist) branch when analysis was performed without cell cycle regression. Divergence into the T(agonist) branch was predicted to occur at two distinct developmental time points, although both of these observations contrasted with what was predicted upon analysis after regression of cell-cycle effects (Supplementary Figure S3C).
Compared to Treg(diff), Treg had higher expression of CXCR6, CXCR3, and IL2RA, and lower expression of CCR7 (Figure 2C). While Treg(diff) appeared as more immature than Treg, both were predicted to arise subsequently to CD4+ SP lineage divergence along pseudotime (Figures 2D, F).
Altogether, a transcriptional signature consistent with strong TCR signalling was upregulated prior to lineage commitment of conventional CD4+ SP or CD8+ SP populations, resulting in deviation from the main thymocyte developmental pathway. While upregulation of genes related to strong TCR signalling was seen at a specific time point, expression of marker genes for distinct agonist selected cell populations and cell states exhibited variable timing of induction.
The DC compartment, consisting of 3012 DCs, were subsetted out, and reanalysed by re-calculation of highly variable features for creation of a new low-dimensional representation and clustering. These clusters were subsequently used for performing a more fine-grained annotation.
The DC subset included one plasmacytoid (pDC) (CLEC4C, CD123) population, two conventional [(DC1 (CLEC9A, CD141, XCR1) and DC2 (CLEC10A, CD1C)] populations, and an aDC population defined by expression of LAMP3 and CCR7 (Figure 1B) (50). DC2 was closely associated with monocytes (CD14, S100A8, S100A9), resulting in a shared label for these two populations in the initial lower-resolution annotations.
After reclustering, DC1 was divided into three clusters, one of which expressed genes related to cell cycling and which was named DC1_cycling (Figures 3A–C; Supplementary Table S5). Although the DC1 marker CLEC9A (51) was expressed in the cycling cluster, expression was reduced relative to remaining DC1 subclusters. The two non-cycling DC1 subclusters differed in XCR1 and CADM1 expression, and were termed DC1_XCR1hi and DC1_XCR1lo, accordingly (52, 53).
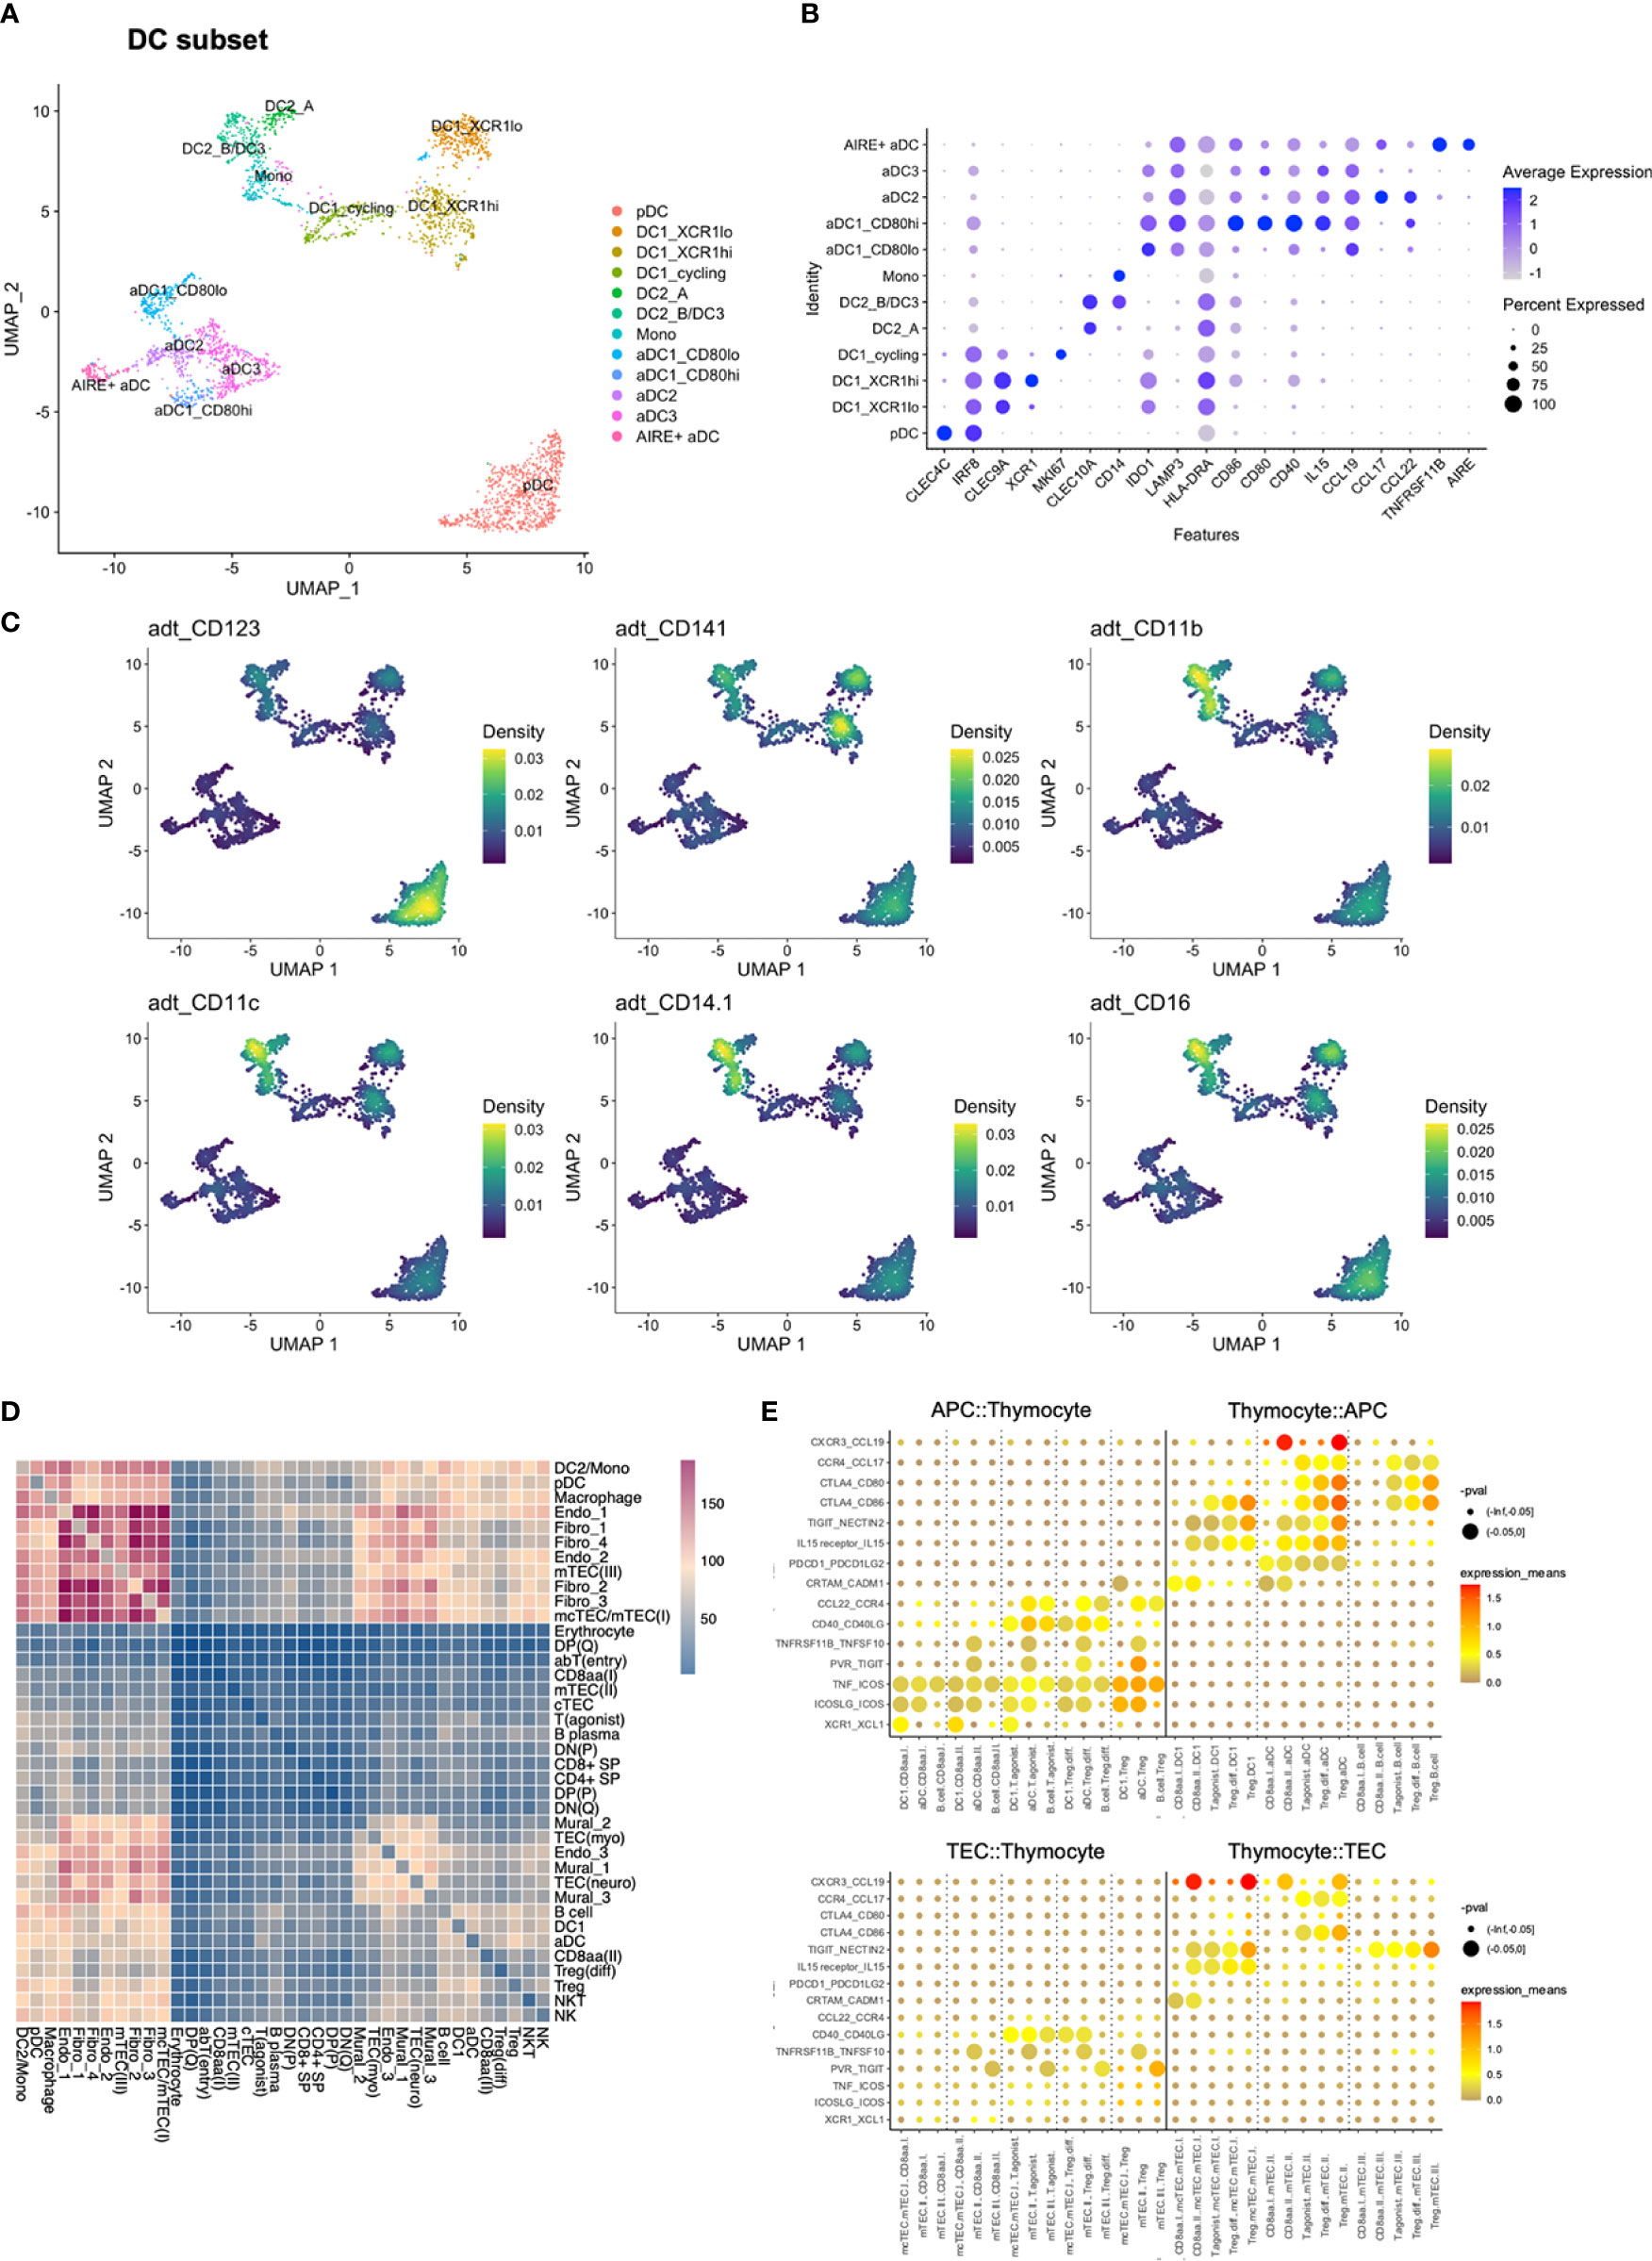
Figure 3 Reanalysis of DC subset and cell-to-cell interactions predicted by cellPhoneDB. (A) UMAP of DC subset. (B) Expression of selected genes in DC subset. (C) Density plot created by Nebulosa showing expression of selected proteins in the DC subset, adt = antibody derived tag. (D) Heatmap showing the number of predicted interactions between each combination of annotated cell types/states. (E) Expression of selected ligand-receptor pairs in selected pairs of cell types/states. Colour represents the mean of the average expression level of molecule 1 in cell type/state 1, and molecule 2 in cell type/state 2.
DC1 and pDC clusters expressed IRF8, suggested to be involved in the differentiation of DC1, but not DC2 (54). IRF8 expression was retained in aDC1 and aDC3, which also expressed IDO1, reported to mediate tolerogenic effects and to be upregulated upon interaction with Tregs (55). However, aDC1 and aDC3 differed by increased HLA-DRA expression in aDC1. CD80 expression was high in aDC3, while aDC1 was spilt into CD80lo and CD80hi subsets. The aDC1_CD80hi subset also exhibited increased expression of CD40 and IL15 (Figures 3A, B).
The DC2/Mononocyte (Mono) cluster was divided into three subclusters. One pertained to monocytes according to expression of CD14, FCN1, and inflammatory markers S100A4 and S100A11. The remaining two both expressed DC2 markers CLEC10A and CD1C (51), and were termed DC2_A and DC2_B/DC3. Among these, DC2_B/DC3 differed from DC2_A by co-expressing the monocyte-associated signature (Figures 3A–C).
The aDC2 cluster was defined by high expression of CCL17 and CCL22. Further, aDC2 and DC2_A both expressed CD1E and IL18, while expression of TMEM176A and TMEM176B was shared between aDC2 and DC2_B/DC3. Interestingly, while TNFRSF11B has previously been reported to be expressed by aDC2s (38), TNFRSF11B-expressing aDCs segregated into a distinct cluster. This cluster was termed AIRE+ aDC based on expression of AIRE, in resemblance to previously reported AIRE-expressing, CCR7+ DCs (56) (Figures 3A, B).
In conclusion, we observed additional heterogeneity among populations of dendritic cells, and observed that the identified subsets exhibited variable expression of several co-stimulatory molecules and chemokines.
We next assessed cell-to-cell interactions using CellPhoneDB after downsampling the full dataset to 30 000 cells (Figures 3D, E). CellPhoneDB is a repository of interacting ligand and receptor pairs, enabling assessment of expression of matched ligand/receptor pairs in order to predict interactions between pairs of cell types.
DC1 was predicted to interact with CD8αα(I) and CD8αα(II) through XCR1-XCL1, as previously reported (38), and the same interaction was predicted for DC1 and T(agonist). The T(agonist), Treg(diff), and Treg populations were further predicted to interact with DC1, and to an even larger degree for aDC, through a number of well-established interactions required for Treg development (Figure 3D; Supplementary Figures S5A, B). Taken together, predicted cell-to-cell interactions by CellphoneDB included several of the signalling molecules that were observed to exhibit differential expression across DC subsets.
In a similar manner as for the DCs, 4369 B cells (CD19, MS4A1) and plasma cells (CD19, JCHAIN) were reanalysed in order to obtain a more fine-grained annotation. This revealed clusters largely separated by Ig class, in addition to one cluster defined by cell cycling (Figure 4; Supplementary Table S5). IGHM was widely expressed, while IGHD, IGHA1-2, and IGHG1-3 were enriched in specific clusters. One cluster appeared as naïve due to increased frequency of IGHD and increased levels of S1PR1, where the latter has been implicated in release of immature B cells from the bone marrow and negatively regulated by the activation marker CD69 (57). One cluster was termed “signalled” due to a signature consistent with strong BCR stimulation, including expression of NR4A1-3 and the CREB-modulator CREM, although still largely expressing IGHD.
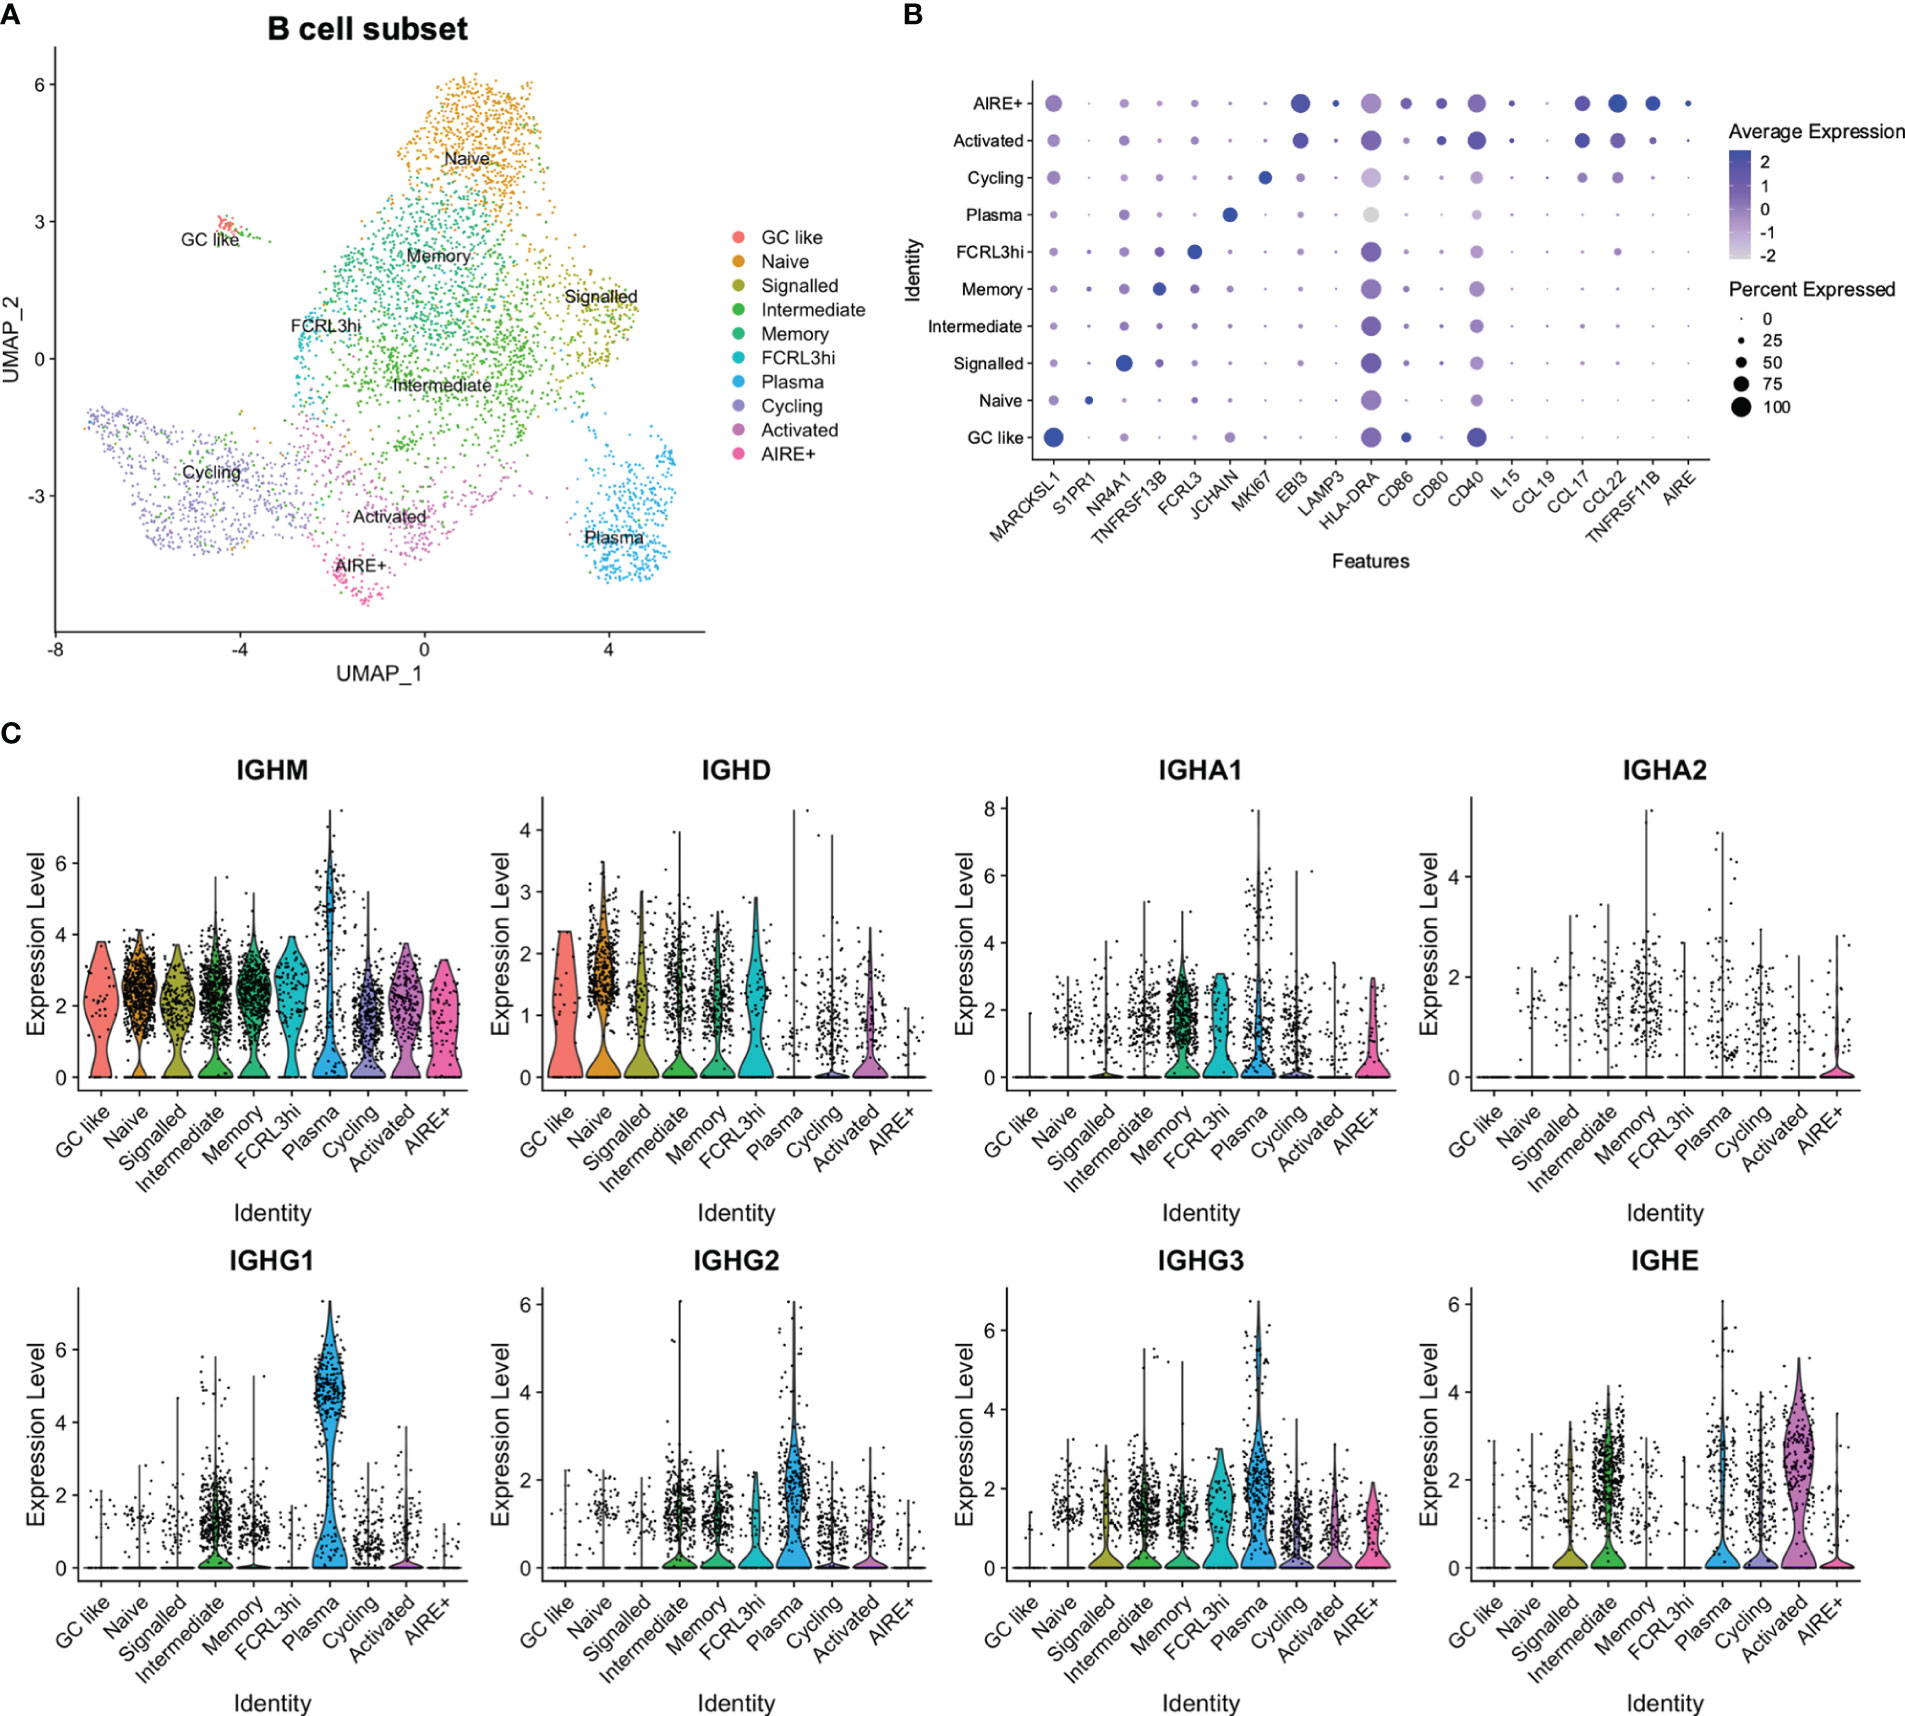
Figure 4 Reanalysis of B cell subset. (A) UMAP of B cell subset. (B) Expression of selected genes in B cell subset. (C) Expression of immunoglobulin genes in B cell subset.
Class-switched B cells fell into distinct clusters mainly according to expression of IGHA1-2, IGHE, or IGHG1-3. The IGHA1-2 enriched cluster appeared to have a memory phenotype according to expression of CD27 and TNRFRSF13B (58), while both IGHE and IGHG1-3 expression was present in a cluster termed “intermediate”. One cluster was identified as plasma cells, with a high abundance of IGHG1-3 expressing cells, and one IGHE-enriched cluster appeared as activated due to expression of EBI3, CD40, and CD80. This activated cluster also expressed CCL17 and CCL22, in resemblance to aDC2. Expression of CCL17 and CCL22 was further observed in a cluster defined by expression of TNFRSF11B, and which contained a low number of AIRE-expressing cells (Figure 4).
High expression of CD40 was also observed in a cluster expressing genes related to germinal centre (GC) B cells (MARCKSL1, NEIL1, MEF2B) (59–61), which was termed “GC like”. Finally, one cluster expressed FCRL3, in resemblance to a previously reported FCRL3hi population (62) (Figures 4A, B), although we did not observe the same increase in other reported upregulated genes.
In sum, we identified subsets of B cells, tracking with processes such as BCR activation, Ig class switching, and cell cycling, and identified similarities in expression profiles of signalling molecules between activated B cells and the aDC2 DC subset.
In the full dataset, TECs could be divided into six subtypes: (1) cTEC (PSMB11, PRSS16, CCL25), (2) immature mcTECs/mTEC(I) (DLK2, CCL2, CCL19, KRT15, CXCL14), (3) AIRE-expressing mTEC(II) (AIRE, HLA-DRA, NTHL1), (4) post-AIRE mTEC(III) (IVL, ANXA1, ANXA9), (5) myeloid TECs (TEC(myo)) (MYOG, MYOD1, DES), and (6) neuroendocrine TECs (TEC(neuro)) (NEUROG1, NEUROD1, BEX1) (Figure 1B). This subset consisting of 3558 TECs, was also reanalysed (Figures 5A–C; Supplementary Table S5).
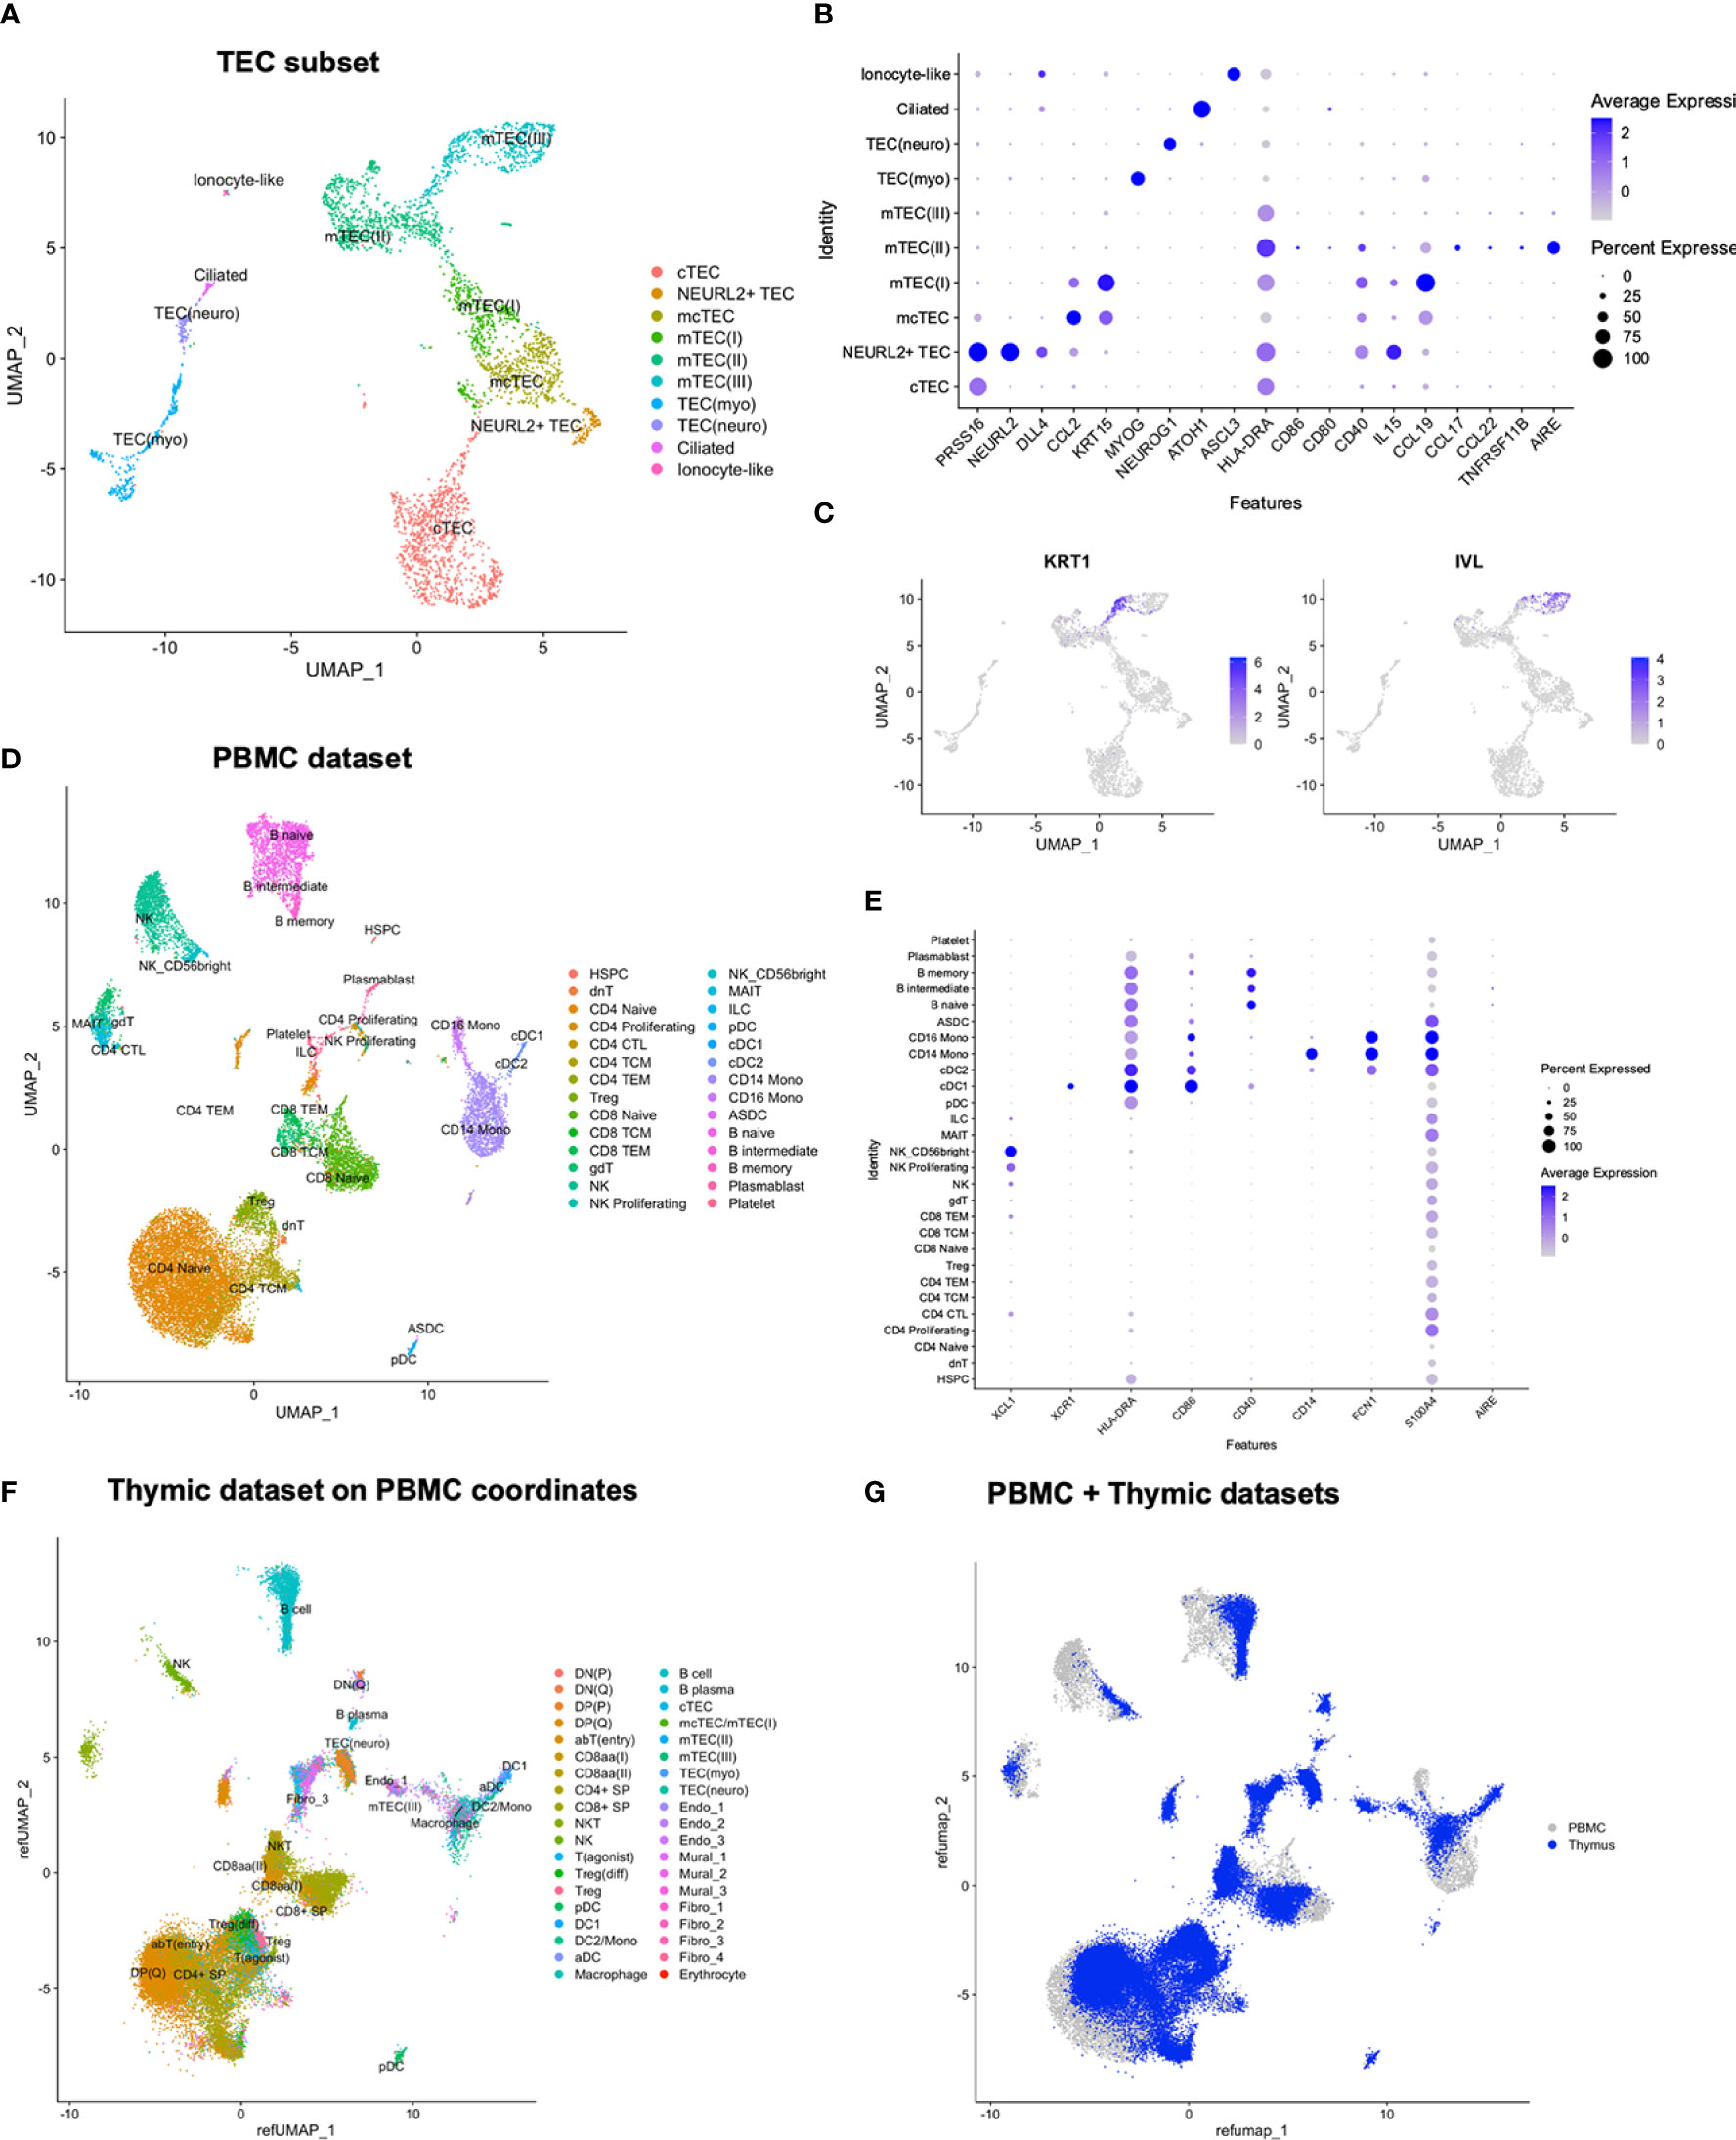
Figure 5 Reanalysis of TEC subset and comparison of thymic and peripheral cell populations. (A) UMAP of TEC subset. (B, C) Expression of selected genes in TEC subset. (D) UMAP of PBMCs with predicted annotations. (E) Expression of selected marker genes in PBMCs. (F) Thymic dataset mapped onto the UMAP coordinates of the PBMC dataset. (G) Merged UMAP of PBMC and thymic datasets after mapping of thymic dataset onto the PBMC UMAP coordinates.
After reanalysis, 10 TEC subtypes were identified, including small subsets expressing ionocyte-like (FOXI1, ASCL3, CFTR, CLCNKB) and ciliated (ATOH1, GFI1, LHX3, FOXJ1) signatures (30). We further highlighted a subset of PRSS16-expressing cells diverging from remaining cTECs. This subset, termed NEURL2+, was defined by expression of NEURL2 and DLL4, and showed a higher resemblance to mcTEC compared to other cTECs (Figure 5B). We noticed a similar divergence of NEURL2+ cTECs in two previously published human thymic datasets by Park et al. and Bautista et al. (30, 38) upon reanalysis of TECs from young paediatric samples only (data not shown). Finally, we observed a division between KRT1+ and IVL+ cells within mTEC(III), potentially implying unresolved heterogeneity among post-AIRE mTECs (Figure 5C).
In order to validate the fine-grained annotations of the TEC subset, we performed label transfer using young paediatric epithelial cells from Park et al. and Bautista et al. (Supplementary Figures S5C–F), which largely conformed with manual annotations, apart from a shift in the border between TEC(neuro) and TEC(myo). Overall, this indicated consistent results across datasets when assessing similar age groups, and highlighted the importance of using samples from a narrow age range to fully reveal thymic cell type heterogeneity.
In order to elucidate interactions between agonist selected thymocytes and TECs, we again interrogated the output from CellPhoneDB (Figures 3D, E). In resemblance to aDCs, TECs were predicted to mediate interactions with agonist-selected thymocyte populations, with interaction through CCL19 mediated by the mcTEC/mTEC(I) cluster, in resemblance to aDC1, and interaction through CCL17 mediated by mTEC(II), in resemblance to aDC2 and activated B cells (Figure 3E; Supplementary Figure S5B). However, overall, mTEC(II) participated in a relatively low number of predicted interactions, in contrast to what was observed for the mcTEC/mTEC(I) and mTEC(III) clusters (Figure 3D).
In addition to supporting previously published TEC subtypes, we identify prospective new subtypes of TECs and pinpoint differences in potential for interactions with agonist selected T cells.
The non-TEC stromal cells included endothelial cells, mural cells, and fibroblasts (Figure 1B, Supplementary Figure S6; Supplementary Table S3). The initial clustering of the full dataset yielded three endothelial (endo) cell clusters, where Endo_1 and Endo_2 resembled venous endothelial cells in expression of ACKR1, and endo_3 resembled arterial endothelial cells (CXCL12, SEMA3G, and HEY1) in addition to expressing NOTCH4 and IL32 (63). Lymphatic endothelial cells were scarce, but identified as a small number of cells within Endo_3 expressing PROX1, FLT4, and LYVE1 (63).
Similarly, mural cells were clustered into Mural_1, Mural_2, and Mural_3 (Figure 1B; Supplementary Figure S6), with Mural_1 having the highest frequency of MYH11-expressing cells, indicative of a contractile phenotype. Mural_3 was distinguished in expression of several chemokines, including CCL21, CCL19 and CXCL12.
Among fibroblasts (fibro), four clusters were identified (Figure 1B; Supplementary Figure S6). Fibro_1 differed from Fibro_2 in increased expression of COL15A1 and SFRP2, while Fibro_2 expressed the highest levels of IL-33. Fibro_3 expressed CXCL9, CXCL10, CD40 and HLA-DRA, and Fibro_2 and Fibro_3 expressed CCL19, indicating an immune-interacting phenotype, which has been related to medullary fibroblasts (64). Fibro_4 expressed DPP4, PI16, SEMA3C, MFAP5, and FBN1, reported to be expressed by capsular fibroblasts in murine thymus studies, as well as a tissue-universal fibroblast subset in cross-tissue human studies (64, 65).
To compare peripheral and thymic cell populations, we analysed peripheral blood mononuclear cells (PBMCs) from the same five donors from which thymic samples for single cell profiling were taken. After filtering, 19 651 cells were integrated, and annotations were predicted by label transfer from a publicly available CITE-seq reference (66) (Figures 5D, E; Supplementary Figure S7A). As expected, the predicted annotations included T cells, B cells, NK (Natural killer) cells, DCs, and monocytes.
For a joint visualisation, the thymic dataset was mapped onto the PBMC UMAP coordinates (Figures 5F, G). In the resulting plot, CD8αα cells were placed near the peripheral γδ T cells, while Treg(diff) was placed near the peripheral Tregs. Among the T(agonist) cells, some mapped to the peripheral Treg population, while others mapped to the CD4 central memory T cells, further pointing to a differentiation decision fork within the T(agonist) population.
Peripheral T cells and B cells were largely naïve. Unlike thymic samples, NR4A1-3 expression was not seen among PBMCs. Further, lack of CCL17 and CCL22 in PBMCs highlights the relevance of the thymic environment in inducing expression of these signalling molecules. CD40 exhibited wide expression among peripheral B cells, but was only seen at lower levels among peripheral DCs, consistent with lack of other aDC markers. Peripheral cDC1s matched their thymic counterparts in expression of XCR1, and the peripheral cDC2 contained inflammatory, monocyte-like cells as observed for thymic DC2 (Figure 5E).
Naïve peripheral T cells widely expressed ITM2A, related to thymocyte selection (45). By contrast, expression of TOX2, similarly related to αβT(entry) thymocytes, was highly restricted among peripheral T cells, and genes related to strong TCR signalling and agonist selection, including NR4A1 and PDCD1, were not expressed. While CXCR3 and CXCR6 have been suggested to be expressed by Tregs recirculating to the thymus from the periphery (36), and found to be expressed in mature thymic Tregs in our dataset, we did not observe expression of these genes among the peripheral Tregs. The XCR1 ligand XCL1 was mainly expressed by NK cells among the PBMCs, particularly in predicted CD56bright NK cells (Figure 5E).
In order to elucidate the spatial organisation of thymic cell populations, we performed spatially resolved RNA sequencing of eight fresh-frozen paediatric human thymic tissue sections (Supplementary Figure S7B) using the Visium spatial transcriptomic solution.
Data from all sections, consisting of 18 329 spots, were integrated, and manual annotation of clusters was performed based on both transcriptional profiles and on the spatial localisation of participating spots (Figures 6A–C, E; Supplementary Figures S7C, S8, S9A; Supplementary Table S6). With this approach, clusters pertaining to the cortex, medulla, cortico-medullary junction and inter-lobular zones could be identified. One cluster was termed “Hemoglobin rich” due to high expression of hemoglobin genes, and three clusters that appeared to consist of spots both at the cortico-medullary junction and the inter-lobular region were given the collective term “inflammatory” according to high expression of an inflammatory gene signature. Inflammatory genes were also expressed by a cluster residing within the thymic medulla, which in addition expressed genes related to mTEC(III). This cluster was termed “Hassall associated”, reflecting on the keratinized structures formed by post-AIRE mTECs (67).
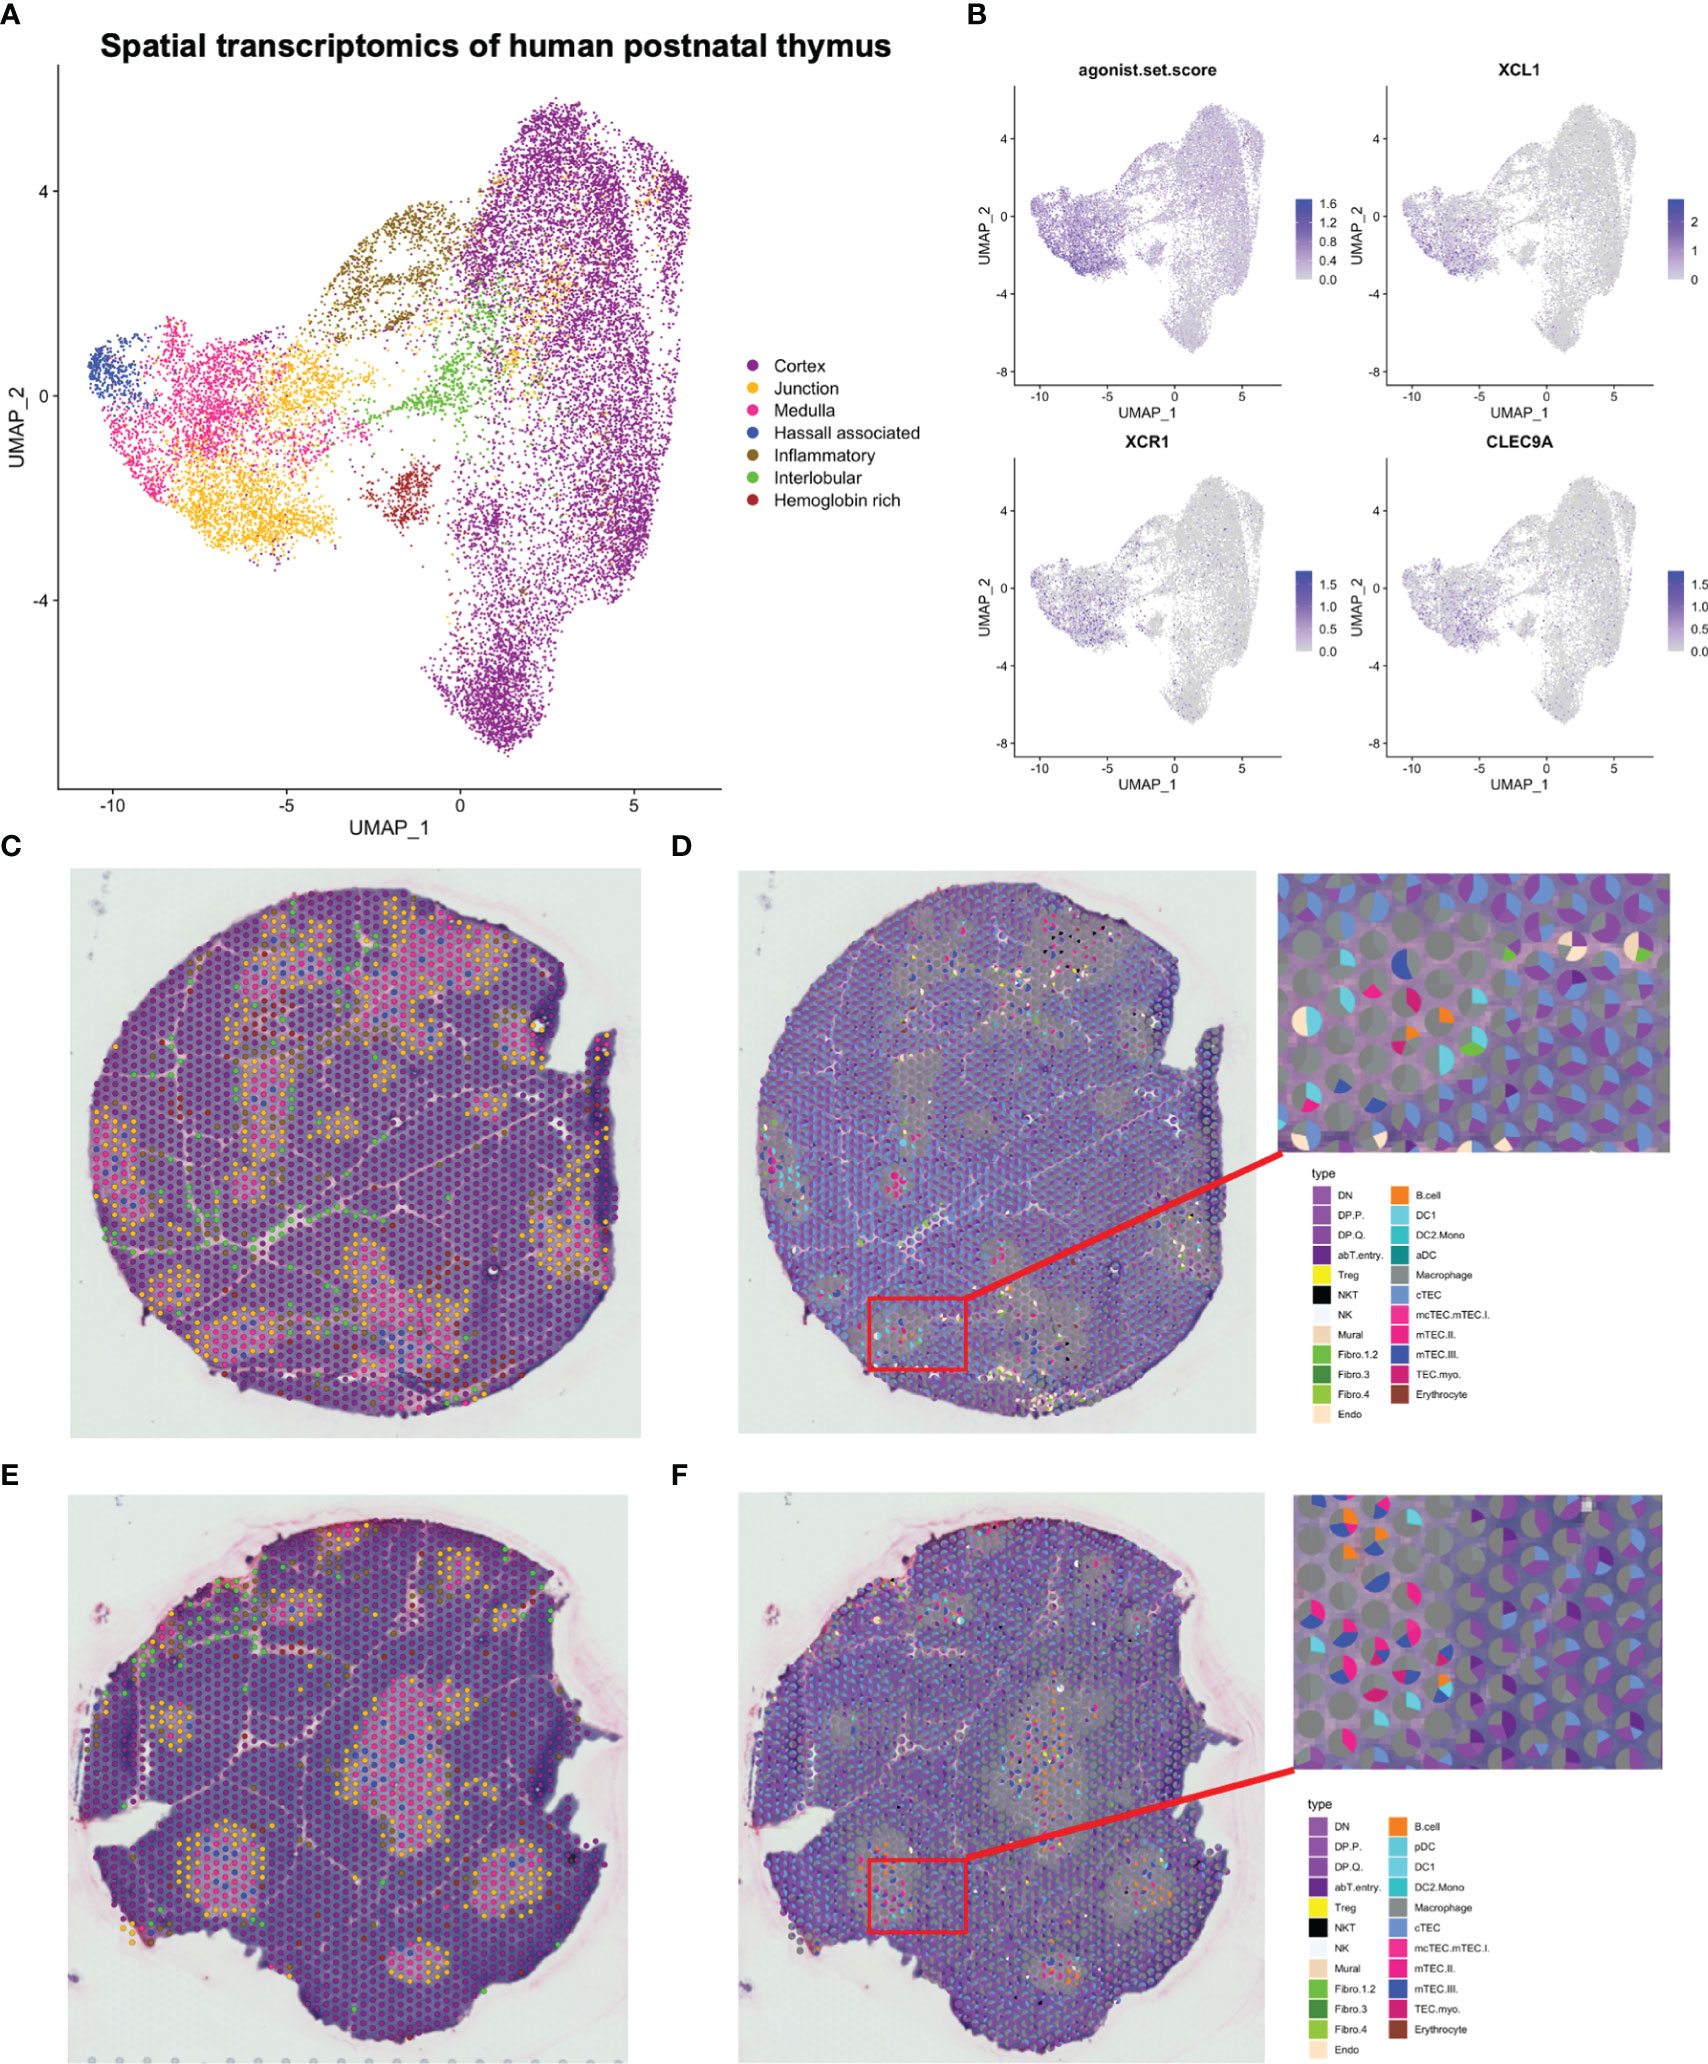
Figure 6 Spatial transcriptomics of human paediatric thymus. (A) UMAP of spatial transcriptomics dataset. (B) Expression of selected marker genes in spatial transcriptomics dataset. The agonist.set.score reflects the mean expression of NR4A1, NR4A3, NFKBID, NFATC1, BCL2L11 and PDCD1. (C, E) Representative tissue sections coloured by annotations in (A). (D, F) Spatial deconvolution of representative tissue sections by SPOTlight.
To deconvolute spots into their cell-type composition, we used SPOTlight with our single cell RNA sequencing dataset as reference (Figures 6D, F). Merging of highly similar clusters was necessary to facilitate building of cell-type specific topic profiles, resulting in 31 uniquely annotated clusters (Supplementary Figure S9B). We observed that the cortical spots largely were composed of DP thymocytes and cTECs, while the medulla exhibited a larger cellular heterogeneity and included mTECs, DCs, and B cells (Figures 6D, F, 7, 8; Supplementary Figure S10).
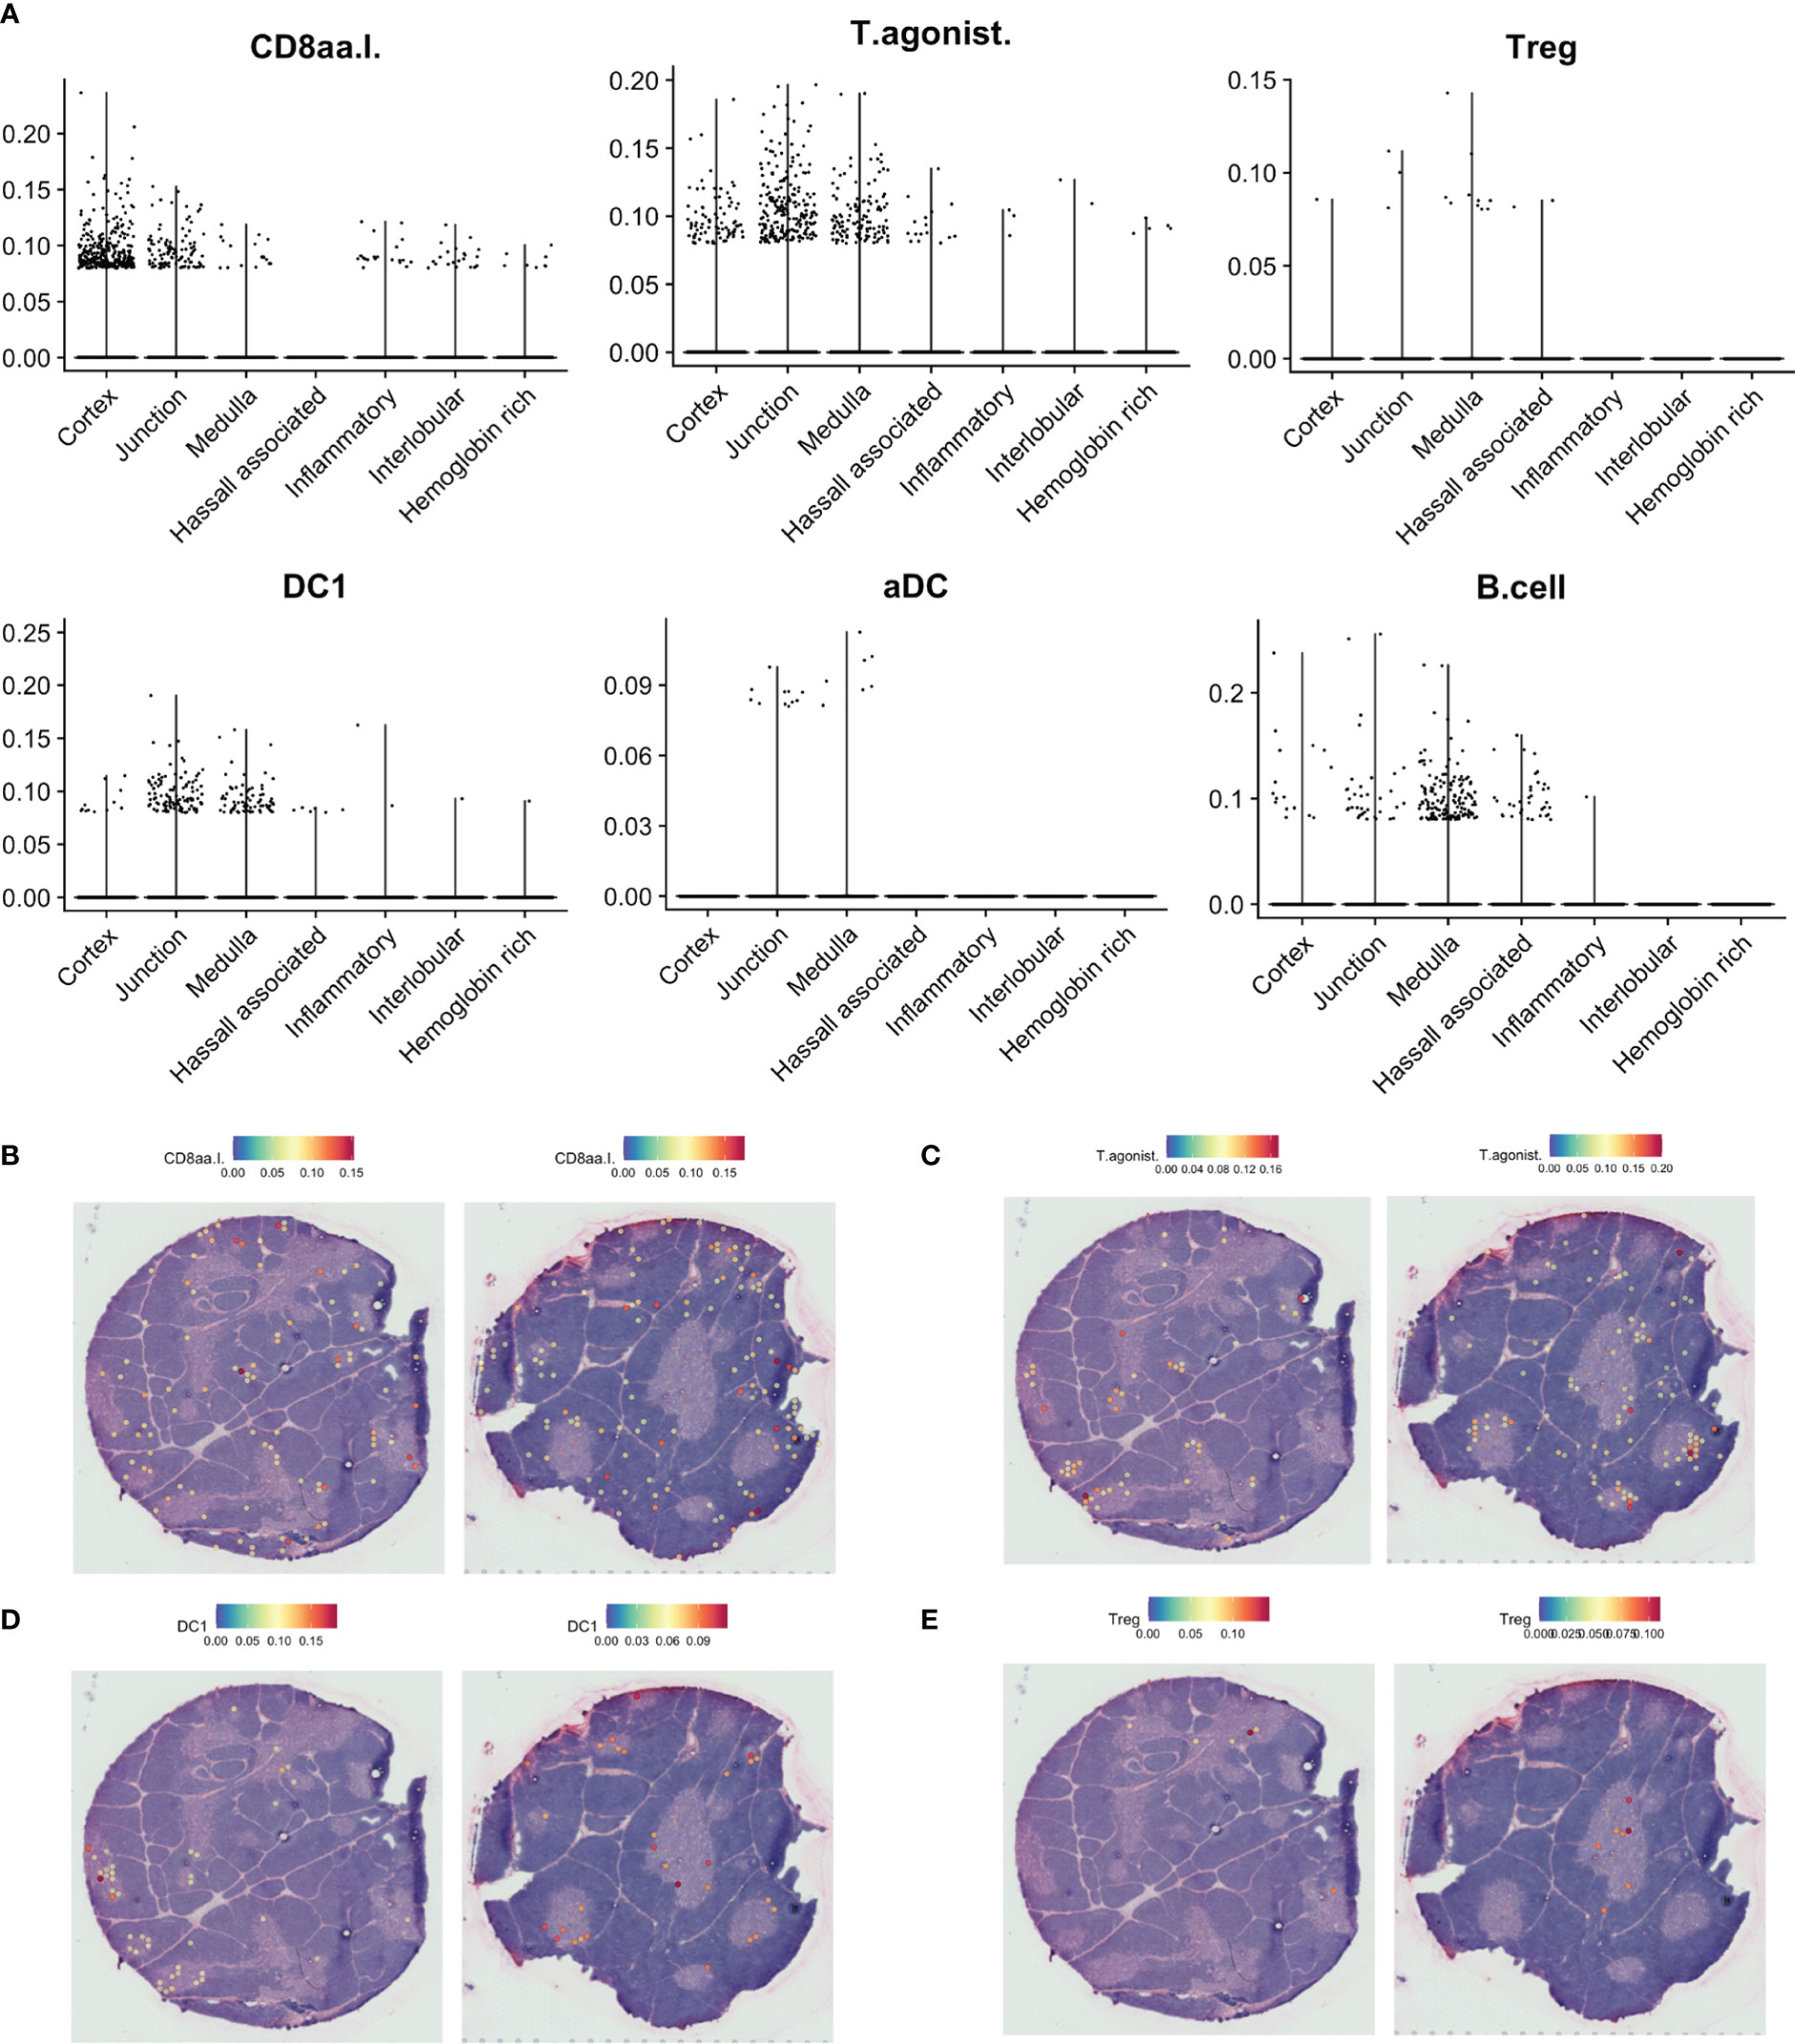
Figure 7 Predicted localisation of selected agonist selected and antigen-presenting cell populations by SPOTlight. (A). Predicted proportion of selected populations among tissue spots. (B–E). Localisation of spots predicted to include selected cell populations on representative tissue sections.
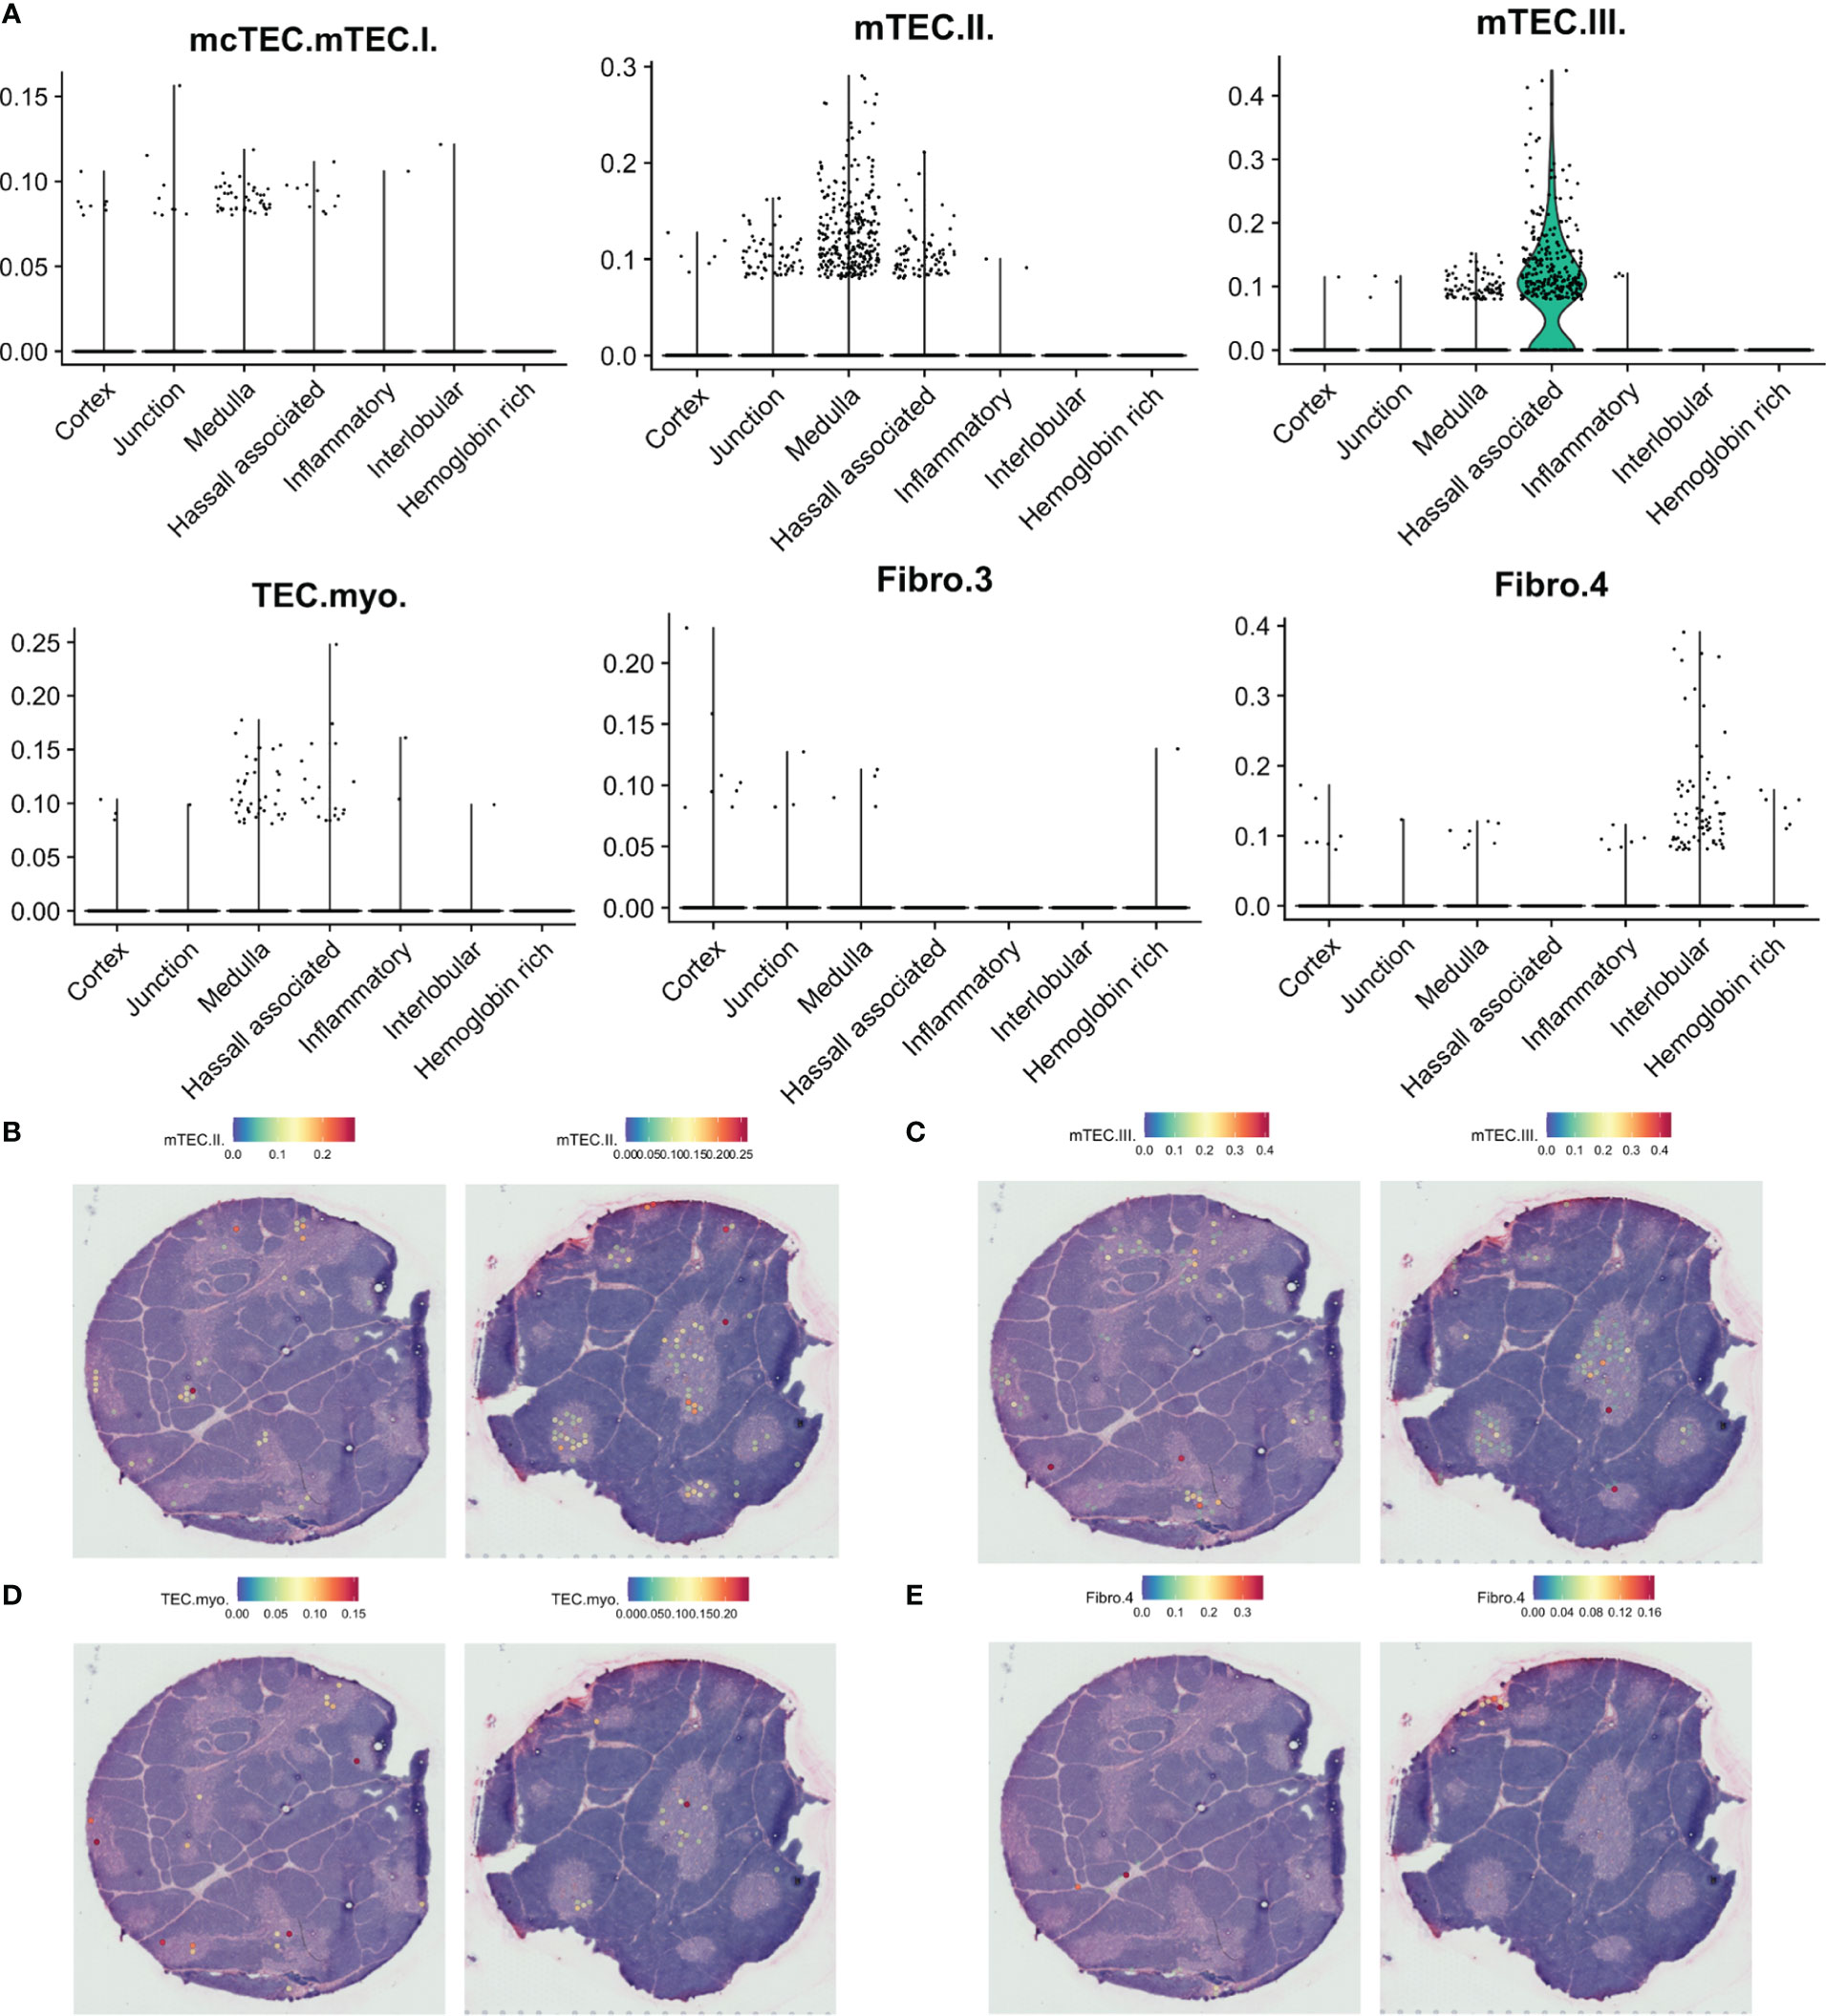
Figure 8 Predicted localisation of selected stromal cell populations by SPOTlight. (A). Predicted proportion of selected populations among tissue spots. (B–E). Localisation of spots predicted to include selected cell populations on representative tissue sections.
While DC1 was predicted to be present in the medulla, this population was also predicted to be largely present at the cortico-medullary junction (Figures 7A, D), fitting with a similar pattern for expression of CLEC9A and XCR1, and coinciding with expression of XCL1 and the previously defined agonist gene set score (Figure 6B). In contrast, FOXP3 expression and predicted Treg contribution had a tendency towards medullary spots (Figures 7A, E).
Finally, we observe differences in the spatial location of fibroblast subsets. While the suggested tissue-remodeling Fibro_4 population was mainly located to interlobular connective tissue, the suggested immune-interacting Fibro_3 population was found deeper within the thymic lobules (Figures 8A, E).
Overall, our findings support recruitment of DC1 cells to the cortico-medullary junction by cells undergoing agonist lineage divergence at an earlier developmental time point, while Treg divergence at later developmental stages and Treg maintenance may be supported by APC and stromal cell populations present within the medullary compartment, expressing a distinct profile of signalling molecules. A schematic summary, representing a hypothetical, possible model of the cellular milieu of thymic agonist selection based on the observations from both our single-cell RNA sequencing and spatial transcriptomics datasets, is provided below (Figure 9).
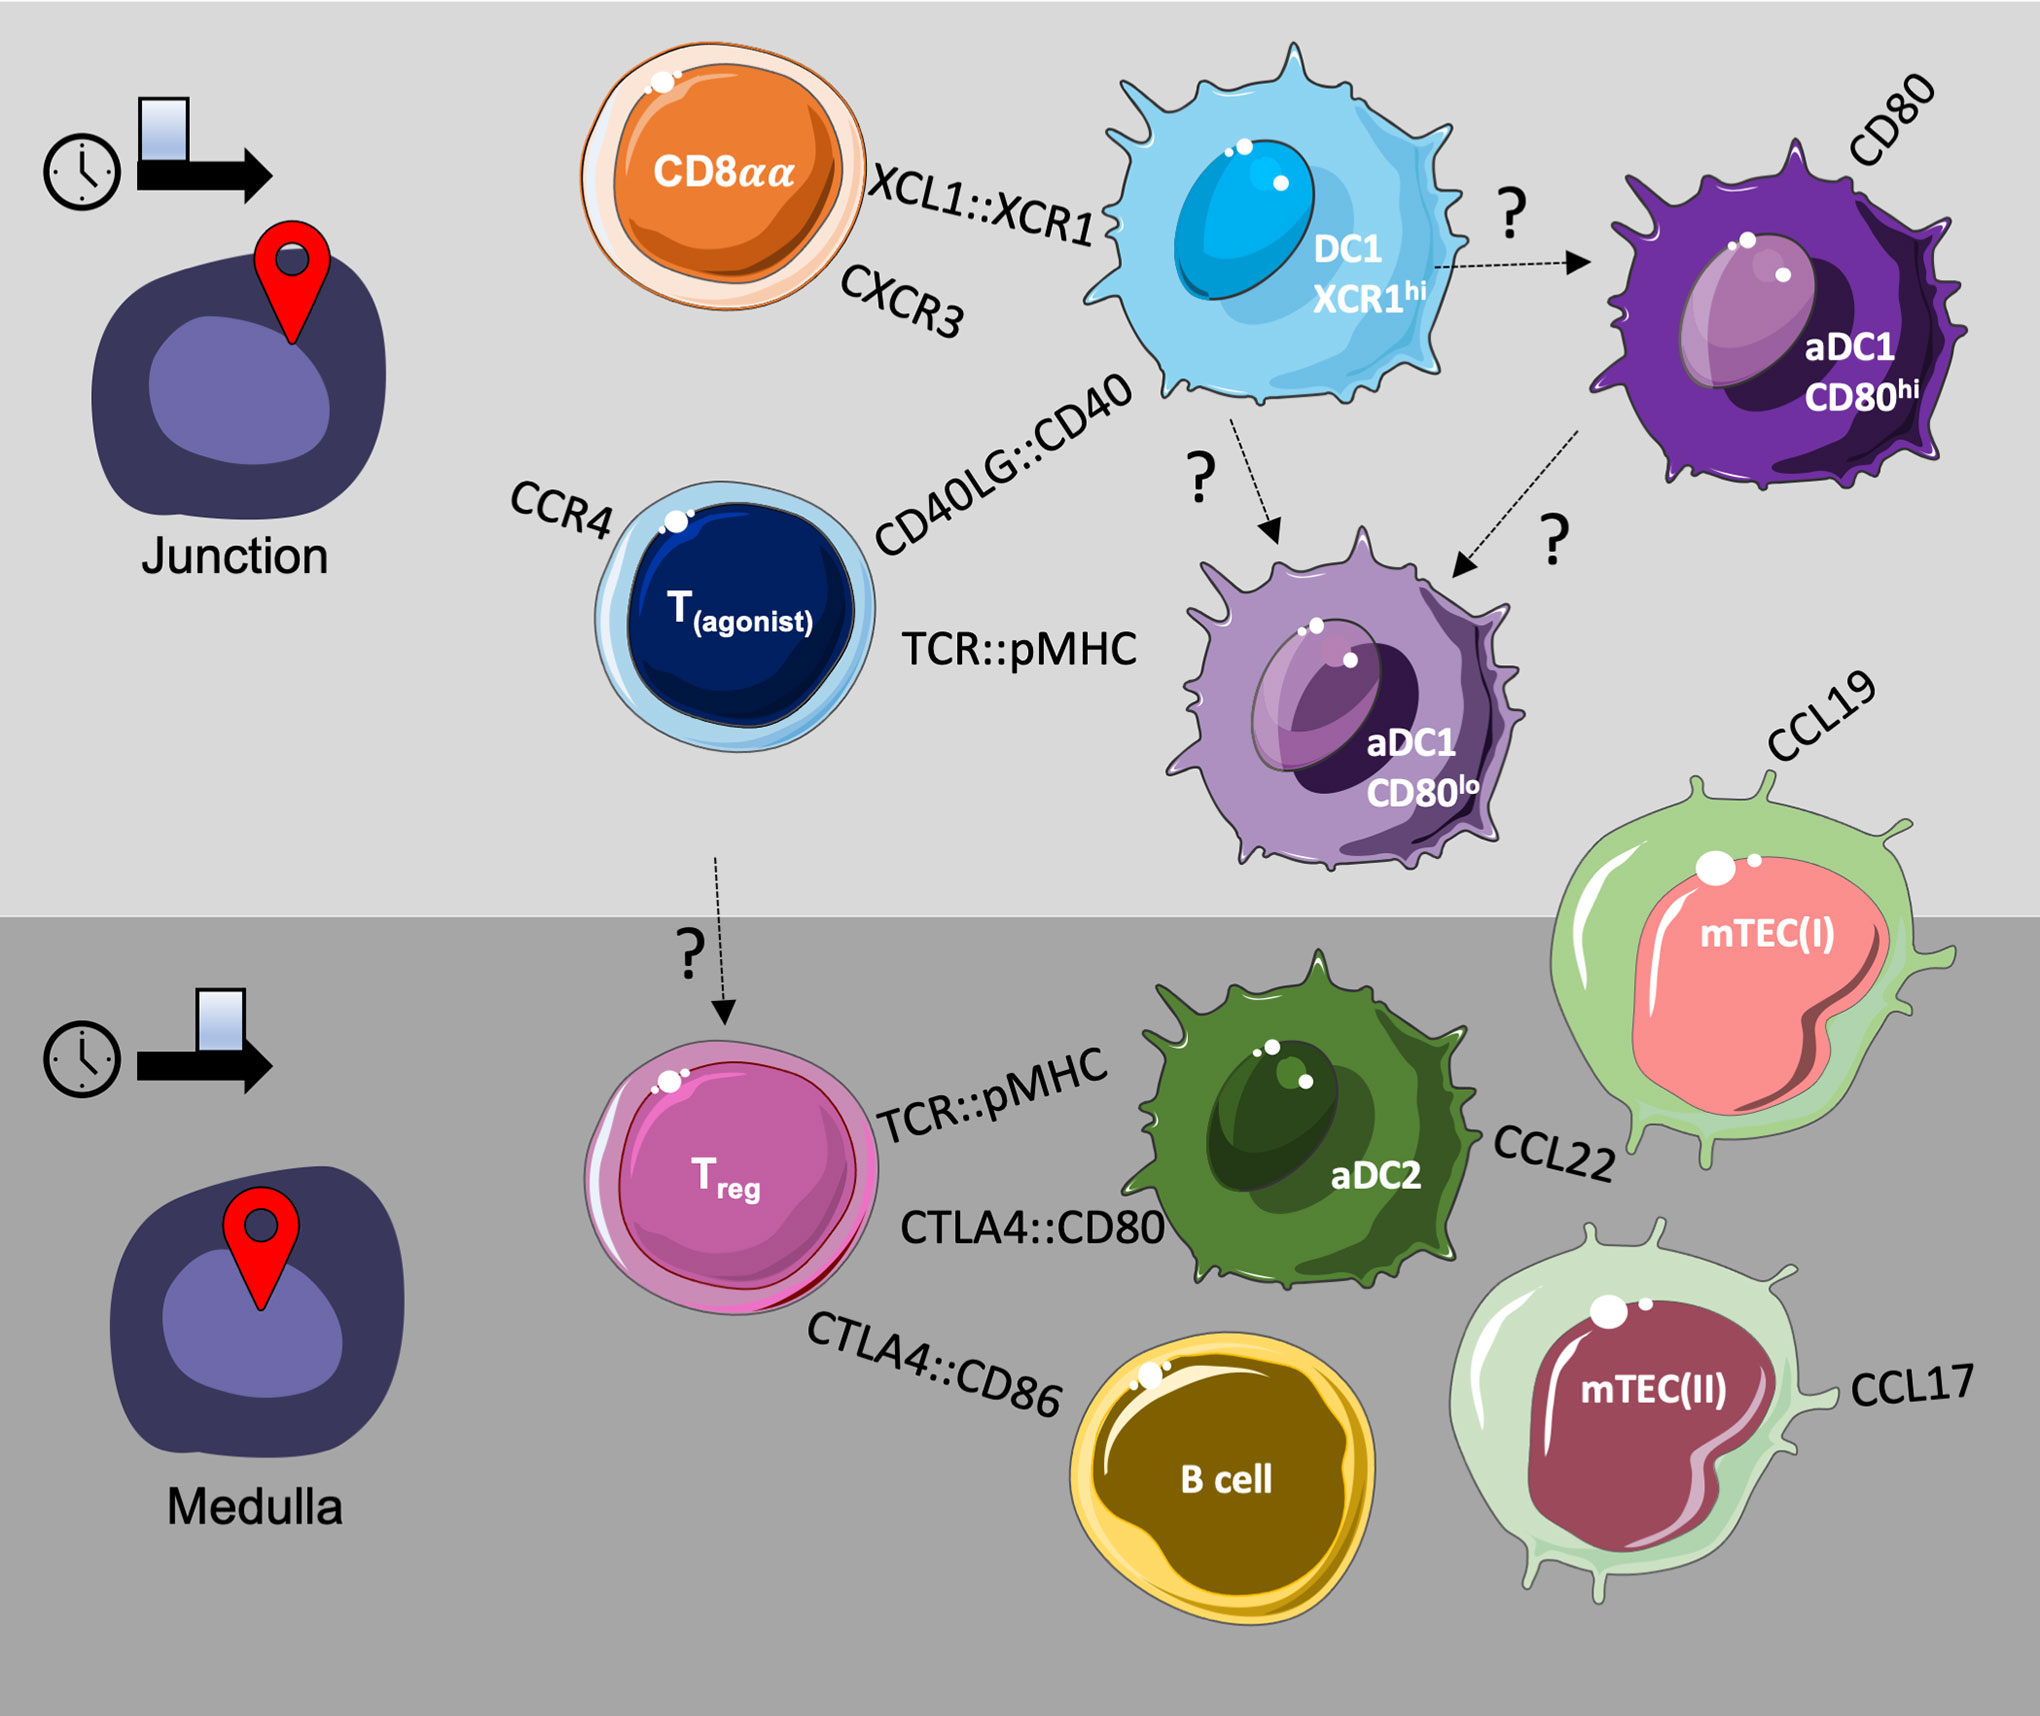
Figure 9 Putative model of the cellular milieu for T agonist selection in the thymus.
The single cell field has evolved towards the inclusion of an increasing number of data modalities. While others have provided single cell RNA sequencing datasets of the human thymus spanning across different age groups (38), or focused on specific cellular compartments (30, 31, 34, 36, 68, 69), we present a comprehensive profiling of samples at a narrow paediatric age range. To this end, we performed spatial transcriptomics of fresh-frozen thymic tissue sections, in addition to CITE-seq of thymic cells sampled at three distinct steps during a gradual enrichment protocol. As a result, we were able to study the developmental trajectory and spatial localisation of thymocytes in concert with the APCs and stromal cells that impose crucial checkpoints and regulatory signalling molecules at specific developmental time points. Our approach not only yielded the expected enrichment for APCs and stromal cells, but also allowed a better overview of thymocytes outside of the otherwise dominating DP(Q) stage. This facilitated exploration of the contributions by non-thymocyte populations to the development and maintenance of agonist selected thymocyte lineages.
The αβT(entry) stage, consisting of cells showing a transcriptional signature associated with T cell activation, appeared to represent a crossroad between the conventional trajectory of CD4+/CD8+ SP lineages, and divergence towards agonist selected lineages. Two branches leading from the αβT(entry) stage to either a CD8αα or a T(agonist) fate exhibited striking similarities, both showing a gradual shift from a signature indicating strong TCR signalling, to a signature of expected marker genes for the respective lineages. A similar gene signature of strong TCR signalling has previously been attributed to thymocyte agonist selection by Chopp et al. (68), who performed single-cell RNA sequencing on human thymocytes after cell sorting in order to cover pre-selection thymocytes, CD69-expressing thymocytes, and CD4+ and CD8+ SP thymocytes. In agreement with our findings, divergence of thymocytes undergoing agonist selection was attributed to a developmental time point prior to CD4+ or CD8+ lineage commitment. However, as in our study, this conclusion was based on inference of a pseudotime trajectory by Monocle3, not by functional experiments. In contrast to our findings, only one agonist-selected branch was identified, which could be due to the employed cell sorting strategy.
The later-stage cells of the T(agonist) branch in our data co-expressed genes related to Tregs, which would be in agreement with this branch representing a potential Treg developmental pathway. Viewing the T(agonist) population as a series of cell states would agree with their predicted wide spread along pseudotime. Like T(agonist), the Treg(diff) cluster exhibited upregulation of Treg marker genes, including FOXP3, and represented a possible Treg progenitor population. However, unlike the T(agonist) cells, Treg(diff) were predicted at a narrow window along pseudotime, subsequent to CD4+ lineage commitment.
In contrast to the division between one early and one mature Treg population reported by Chopp et al. (68), the single cell RNA-sequencing datasets by Park et al. (38) and Morgana et al. (36) report the presence of three distinct Treg and putative Treg precursor populations in the human thymus. Morgana et al. performed cell sorting prior to sequencing in order to cover specific thymocyte subset, while the Park et al. dataset includes samples from a variety of unenriched or enriched samples, with enrichment largely focusing on increasing the coverage of CD45-EpCAM+ epithelial cells.
Based on their observations, Morgana et al. propose a model of continuous development from a population resembling T(agonist), to a population resembling Treg(diff). In contrast, Park et al. propose a model of two distinct developmental pathways, concordant with findings from mice (70). Further, Morgana et al. suggest that their most mature cluster represent recirculating Tregs entering the thymus from the periphery. However, the identification of human recirculating Tregs remains challenging due to lack of established markers. While we observe that our most mature thymic Treg population resembles the proposed recirculating Tregs, including high expression of CXCL3 and CXCL6, a similar signature was not seen for our peripheral Tregs.
While we cannot exclude the possibility that Treg(diff) represents an intermediate Treg precursor state originating from T(agonist), our inferred pseudotime trajectory indicates Treg(diff) to originate from the CD4+ SP population. Low expression of IL2RA was observed among both putative Treg precursor populations in our dataset, which, together with the observation of surface CD25 protein in only one out of the two putative Treg precursors described in mice, underlines the concern raised by Morgana et al. regarding their use of CD25 as a marker for cell sorting prior to single cell sequencing.
A noteworthy difference between the two putative Treg precursors in our dataset was the presence of CD4+CD8+ DP cells among T(agonist) but not Treg(diff). Although the majority of Tregs are derived from mature CD4+ SP thymocytes in murine models, the ability of human DP cells to upregulate FOXP3 upon co-culture with allogeneic primary TECs has been demonstrated (71). Thus, it could be speculated that the T(agonist) branch, in contrast to Treg(diff), demarcate a pathway towards a Treg fate inducible by high-affinity TCR interactions prior to commitment into the CD4+ SP or CD8+ SP lineages, resembling development towards CD8αα cells.
Overall, these findings would be in agreement with the notion that CD8αα lineage commitment occurs at a stringently defined developmental time-point and requires high-affinity TCR interactions with presented peptide:MHC complexes (18, 19, 72). In contrast, Tregs may be derived from thymocytes at variable developmental time-points and exhibit a wide range of TCR affinities (21, 71). However, further studies are needed to elucidate whether T(agonist) represents a continuous pathway distinct from conventional T cell development after an initial branching, or whether thymocytes may diverge from the conventional T cell development towards the T(agonist) branch at distinct developmental time points. In our hands, inference of a pseudotime trajectory graph for divergence and progression of T(agonist) cells provided different predictions upon analysis with or without regression of cell cycle effects. There is also a need to assess how divergence of T(agonist) cells relates to TCR affinity and to the variation in TCR responsiveness observed during the course of thymocyte maturation (44, 73).
It is further worth noting that, in our data, cells among the T(agonist) population, but not Treg(diff), expressed XCL1, which has previously been reported in CD8αα cells and terminally differentiated mTECs. XCL1 has been suggested to act in the recruitment of the cross-presenting CLEC9A+ DC1 population (38, 74). While APCs have been reported to favor a medullary localisation in the human thymus (67), our spatial analyses indicated that the transcriptional signature associated with strong TCR stimulation and subsequent agonist selection was located largely to the cortico-medullary junction. An active recruitment could ensure the availability of DC1 cells at the same location, and indeed, DC1 were predicted to reside both at the cortico-medullary junction and within the medullary compartment in our spatial transcriptomics dataset. However, the lack of single-cell resolution of the Visium technology necessitated computational deconvolution in order to make inferences regarding the cellular composition of capture spots, and uncertainty regarding the quality of the predicted annotations exists, in particular for several of the highly similar thymocyte populations. Still, the predicted localisation of DC1 appeared to fit with expression of CLEC9A, and would also be in agreement with previous reports containing spatial transcriptomics data from the human fetal thymus, highlighting robustness across studies and applied deconvolution methods (75). DC1 could then mature towards the aDC1/aDC3 states, induced in part by interacting with thymocytes through the CD40-CD40LG axis. Binding of CD40 to CD40LG has been reported to mediate activation and “licensing” of APC populations, enhancing their capability for driving Treg generation (26, 76).
The presence of an aDC1_CD80lo population, exhibiting reduced expression of CD80, would be of interest in light of studies highlighting the role of CD80neg/low hematopoietic APCs in the development of thymic IEL precursors in mice (77). By contrast, aDC1_CD80hi expressed comparably higher levels of CD80 and also exhibited the highest levels of IL-15 expression among the DCs, reported to be involved in a second, TCR-independent step of Treg generation in mice, occurring after initial TCR stimulation (78). Such secondary signalling can alternatively be provided by IL-2, and IL-2 availability has been suggested to represent a potential negative feedback mechanism regulating the size of the Treg niche. A differential dependency on IL-15 and IL-2 between the two putative Treg precursors in mice have been suggested (79), presenting an intriguing possibility that the IL-2 feedback loop also affects the progenitor populations differently.
Expression of CD80 and CD40 was also seen among thymic B cells, co-occurring with expression of CCL17 and CCL22 in a cluster enriched in IgE class-switched B cells. These two chemokines have been reported to be upregulated upon stimulation by Hassall-derived TSPL, and to drive the upregulation of FOXP3 in CD4+CD25- precursor cells (26, 80). As such, this could imply a function in divergence of later-stage, CD4+ lineage-committed thymocytes toward a Treg fate within the medulla. In agreement, the highest expression levels of CCL17 and CCL22 in our spatial dataset pertained to medullary spots. However, it should be noted that lower-level expression was also evident among spots locating to the cortico-medullary junction, and that expression of the CCR4 receptor mainly related to the earlier-diverging, strongly TCR-signalled agonist selected populations.
A CCL17+CCL22+ subset has previously been described in a study employing single cell RNA sequencing on CD21-CD35-CD19+ cells from human postnatal thymus (31). The same study further reported a proliferating cluster, also in agreement with our data, and argued that these proliferating B cells differentiated into plasma cells. Intriguingly, this suggested developmental trajectory was further supported by in vitro differentiation of purified cells corresponding to the proliferating B cell cluster. In contrast to our findings, however, this study reported T-cell engagement mainly in a separate CD80/CD86-expressing cluster that was not observed in our study.
Expression of CCL17 and CCL22 was also found to be higher in aDC2 in our data compared to the CD40- and CD80-expressing aDC1. This could imply potential division of labor among aDCs, fitting with lack of XCR1 for junctional recruitment on DC2, the suggested aDC2 precursor (38). However, this suggested lineage relationship was derived from summarised marker gene expression profiles rather than functional experiments, and is further confounded by our observation of heterogeneity among DC2, with one subset expressing a monocyte-like signature, in agreement with findings from the periphery in human studies (51, 81). Whether the non-inflammatory and inflammatory subsets are derived from a common DC lineage has been a matter of debate, although evidence in favor of a separate developmental trajectory has led to the suggestion that the inflammatory subset should be given the independent designation “DC3” (82). In our hands, some similarity to aDC2 was observed for both non-inflammatory DC2_A and inflammatory DC2_B/DC3, but further studies are needed to clarify their relationship to aDC2.
Both the DC and B cell subsets contained TNFRSF11B+AIRE+ clusters, resembling the aDC2 and the activated B cell cluster, respectively. However, although the presence of AIRE-expressing human thymic B cells would agree with previous reports (83), the number of AIRE+ B cells was low, and these cells should be interpreted with caution as they may represent doublets according to high doublet scores.
Intriguingly, among the mTECs, expression of CCL22 and CCL17 was associated with the AIRE+ mTEC(II) population. The AIRE- mcTEC/mTEC(I) and mTEC(III) populations, in contrast, appeared to provide a repertoire of signalling molecules more similar to aDC1, including expression of CCL19. We further note a substantial overall resemblance between the two AIRE- mTEC clusters, mcTEC/mTEC(I) and mTEC(III). However, TEC(III) was defined by expression of an inflammatory signature, which would be in agreement with previous evidence in favor of the Hassall-forming mTEC(III)s also aiding Treg generation by maintaining an inflammatory milieu (67, 80, 84, 85). Expression of KRT1 and IVL localised to distinct subsets within the mTEC(III) cluster, which could imply additional heterogeneity, possibly denoting the transition between mTEC(II) and mTEC(III).
Several genes common to mcTEC/mTEC(I) and mTEC(III) were also expressed by NEURL2+ cTECs. However, the relevance of NEURL2+ cTECs remains to be elucidated. NEURL2 encodes an E3 ubiquitin ligase, and among its substrates is β-catenin, which mediates signalling through the canonical Wnt signalling pathway and has been found to be crucial for commitment of embryonic endodermal epithelial cells to a thymic cell fate (86–89). The NEURL2+ cluster also expressed DLL4, implicated in signalling to Notch1 during lineage commitment of T cell progenitors in mouse (90), and reported to progressively decrease with age. Widespread expression of NEURL2 in previously published embryonic cTEC further suggests an age-dependent effect, which is of interest as changes in regulation of TEC differentiation and function during ageing and onset of thymic involution has been observed (91).
Immunoregulatory signalling was also observed for non-TEC stromal populations, in particular Fibro_3. An immune-regulatory function has previously been attributed to a medullary thymic fibroblast subset in mice, identified by a gradual digestion of thymic tissue developed in order to achieve a physical separation of capsular and medullary fibroblasts. The medullary fibroblasts were suggested to provide cell type-specific antigens for presentation to developing thymocytes (64, 92). By contrast, capsular thymic fibroblasts, which resemble the Fibro_4 population in our data, has been reported to have a tissue-remodeling function (64, 93). Fibro_4 further resembled the mouse tissue-universal Pi16+ fibroblast population, suggested to be capable of developing into tissue-specific, functionally differentiated subsets. In a cross-tissue mouse study of fibroblast subsets, differentiation was suggested to occur by progression through another tissue-universal population denoted by expression of Col15a1 (65), a feature which is shared by Fibro_1 in our dataset. However, differentiated fibroblast subsets arising subsequently to the Col15a1 population appeared to exhibit substantial cross-tissue variation, and as thymic tissue was not represented, this would confound comparisons to populations identified in our study.
In summary, the present work expands current knowledge about thymic agonist selection and signalling provided by subpopulations of thymic APCs and stromal cells. We define a branch point towards a CD8αα or T(agonist) fate occurring at the cortico-medullary junction, coinciding with a highly TCR responsive transcriptional signature and signalling for recruitment and activation of DC1. Subsets of aDCs, possibly derived from DC1 and DC2, defined by distinct profiles of signalling molecules, might point toward roles in separate thymic compartments. Intriguingly, similarities between aDC2, activated B cell, and mTEC(II) were observed. However, their effects on thymocytes diverging towards agonist selected T cell lineages at distinct developmental time points remains to be elucidated. The gained knowledge regarding development and maintenance of agonist selected T cell lineages would be of immense value in the effort to benefit from the immunoregulatory potential of such populations in clinical applications.
Thymic tissue was obtained from young paediatric patients (8 male, 5 female, age span 7 days-13.5 months) undergoing corrective cardiac surgery at the department of cardiothoracic surgery, Oslo University Hospital. In cases where tissue was to be used for single cell immune profiling, 4 ml EDTA blood was sampled from the same patient. The project was approved by the Regional Ethics Committee of South East Norway (REC 31516), and conducted in compliance with the Declaration of Helsinki. Written informed consent was obtained from the parents of the patients. Patients exhibited congenital heart disorders but no other known medical conditions potentially affecting autoimmune risk.
Peripheral blood mononuclear cells were isolated by LymphoPrep™ (Abbott) in SepMate tubes (Stemcell Technologies) according to protocol by Stemcell Techonologies. Isolated cells were subjected to red blood cell removal by the EasySep™ RBC Depletion Reagent (Stemcell Technologies).
Tissue was placed in RPMI-1640 (Sigma-Aldrich) with 10% fetal bovine serum (FBS) on ice immediately after surgical removal, and processing was initiated shortly (30-60 min) after. Connective tissue, blood clots and necrotic tissue were removed before cutting the tissue into 2-4 mm pieces. Tissue pieces were subjected to three rounds of pipetting with a widened pipette tip in RPMI-1640, each time removing the supernatant after allowing tissue pieces to settle. Supernatants from the two last rounds were pooled, filtered through a 70 μm filter, and set aside on ice.
Tissue pieces were subjected to five rounds of enzymatic dissociation using Liberase™ TM. For each round, tissue was distributed across 2-4 gentleMACS™ C tubes (Miltenyi Biotec) in 10 ml enzyme cocktail (RPMI-1640, Liberase™ TM 0.17 U/ml (Sigma-Aldrich), DNaseI 0.1% w/V (Sigma-Aldrich), and placed on a gentleMACS™ Octo Dissociator (Miltenyi Biotec) at 37 °C. Incubation time was 15 min for round 1-4, and 5-30 min for round 5, depending on the amount of undissolved tissue. Further details regarding the gentleMACS™ program are available upon request. C-tubes were centrifuged at 100 x g at room temperature for 30 s. The pellet of undissolved tissue was subjected to a new round of dissociation, while the supernatant (containing released cells) was collected and mixed 1:1 with resuspension buffer (PBS, FBS 5%, EDTA 5 mM, DNaseI 0.1% w/V), before filtration through stacked 70 μm and 30 μm filters and centrifugation 350 x g 4 °C 10 min. The pellet was resuspended in 5-10 ml resuspension buffer and set aside on ice. Released cells from all five rounds were pooled and filtered through a 70 μm filter.
An unenriched sample was set aside, containing 6 x 10⁶ cells kept from the pipetting steps before enzymatic digestion, and 6 x 10⁶ cells kept from the released cells during enzymatic digestion in Liberase™ TM.
Debris remaining after Liberase™ TM dissociation was resuspended in 2.5 ml enzyme cocktail supplemented with 0.25% Trypsin-EDTA (Thermo Fisher Scientific), to a final concentration of 0.05% Trypsin-EDTA (94) and placed in a C tube on a gentleMACS™ Octo Dissociator, and incubated at 37 °C for 45 min, details regarding the gentleMACS™ program available upon request. Released cells were filtered through stacked 70 μm and 30 μm filters, centrifuged 340 x g for 10 min, and resuspended in 5 ml resuspension buffer.
The unenriched sample and cells released during trypsin dissociation were subjected to red blood cell removal as described for PBMC samples. Unenriched sample was subjected to dead cell removal by use of Dead Cell Removal Kit (Miltenyi Biotec).
Cells released during Liberase™ TM dissociation were subjected to OptiPrep™ (Abott) density gradient centrifugation. Cells were centrifuged 340 x g at 4 °C for 10 min, resuspended in resuspension buffer, and centrifuged as before. 1.070 g/ml and 1.061 g/ml gradient solutions were prepared by mixing OptiPrep™ solution with appropriate volume of dilution buffer (MilliQ H2O, NaCl 0.8%, EDTA 5 mM, Tricine-NaOH 10 mM, pH 7.4), and supplementing with 0.1% w/V DNase1. Cell pellet was resuspended in 5 ml 1.070 g/ml gradient per 1 x 10⁹ cells, and 5 ml suspension was transferred to the required number of 15 ml conical tubes. Next, 5 ml of the 1.061 g/ml gradient per tube was added on top of the 1.070 g/ml gradient, followed by a layer of 2.5 ml FBS.
Tubes were centrifuged at 1700 x g 4 °C for 30 min, with brake and acceleration at lowest possible setting. A band of cells residing at the top of the 1.061 g/ml layer was collected, washed in PBS, centrifugation 340 x g 4 °C for 10-15 min, and resuspended in PBS.
Cells collected from OptiPrep™ gradient enrichment were pooled with cells from trypsin dissociation, and subjected to dead cell removal by use of Dead Cell Removal Kit as before. An APC-enriched sample of 200 000 cells was set aside. Remaining cells were subjected to CD45 depletion by use of the EasySep™ Human CD45 depletion kit II (Stemcell Technologies), and 200 000 cells were set aside as the CD45-depleted sample.
200 000 cells from each sample were resuspended in 50 μl staining buffer (PBS, FBS 2%) before addition of 5 μl Human TruStain FcX™ Blocking reagent (Biolegend) and incubation for 10 min at 4°C. 50 μl Antibody pools as indicated in Supplementary Table S2 (further details available upon request) were centrifuged at 14 000 x g 4 °C for 10 min and added to the samples, followed by incubation for 30 min at 4°C. Samples were washed three times in 1.5 ml PBS w/1% BSA, centrifugation 400 x g for 5 min at 4 °C. Cells were resuspended in 200 μl resuspension buffer (PBS, BSA 0.04%) to a concentration of 1000 cells/μl. Samples were subsequently processed according to the Chromium Single Cell 5’ V(D)J Reagent Kit User guide with Feature Barcode Technology for Cell Surface Protein, v1 Chemistry (10x Genomics protocol CG000186, RevD), aiming to recover 10 000 targeted cells. The cDNA amplification was run with 13 cycles for PBMC and unenriched samples, and 15 cycles for the APC-enriched and CD45-depleted samples. For the feature barcoding sample indexing PCR, 6 cycles were run for the unenriched and APC-enriched samples, and 9 cycles were run for the PBMC and CD45-depleted samples.
Sequencing was performed on Illumina NovaSeq S2 flow cell, 100 cycles. According to recommendations by 10x Genomics, a sequencing depth of at least 20 000 read pairs per cell was obtained for the gene expression libraries, and at least 5000 read pairs per cell for the antibody capture libraries.
Thymic tissue was collected as previously described. Tissue was cut into pieces of about 1 cm x 5 cm x 2 cm and snap frozen using liquid nitrogen, embedded in Optimal Cutting Temperature (OCT) reagent, before storing at -80 °C until further processing. Ten 10 μm sections of tissue were collected from each of the frozen tissue samples, and RNA was extracted by the Norgen Bio kit (RNA/DNA/Protein Purification Plus Kit, #47700) to control for the RNA integrity. Sections for hematoxylin and eosin (H&E) staining were performed simultaneously. Only tissue with RIN>7 and good quality H&E staining was used for the Visium Spatial Transcriptomics solution. After optimising the cryosectioning and permeabilisation time, 6 mm pieces of 10 μm were punched out of tissue pieces stemming from eight separate paediatric donors and placed in capture areas on 10x Genomics Visium Spatial gene expression slides. Slides were stored at -80 °C until library preparation (max 4 weeks). Slides were fixed in methanol, followed by H&E staining (10x Genomics protocol CG000160, rev B) and imaged by a LSM800 confocal laser scanning microscope. Next, slides were permeabilised for 12 min, and library preparation was performed according to the Visium Spatial Gene Expression Reagent User Guide (10xGenomics protocol CG000239, rev.D). All incubations and PCRs were performed on a Veriti thermal cycler (Thermo Fisher Scientific). Sequencing was performed on a Illumina NovaSeq SP flow cell, 100 cycles, to a sequencing depth of 32 000 - 83 000 read pairs per tissue covered spot.
For CITE-seq experiments, the raw sequencing data were processed by the 10x Genomics CellRanger v.3.1.1 pipeline. For the spatial transcriptomics data, manual alignment of fiducials was performed using Loupe browser v.5.1.0 (95), before running the 10x Genomics SpaceRanger v.1.2.2 pipeline. The sequences were aligned to the GRh38-2020-A reference genome. Further analysis was performed using Seurat v.4.0.3/4.0.4 (41, 66, 96, 97) under R v.4.0.3/4.1.0-4.1.3 (98). Quality control statistics (Supplementary Table S7) were calculated according to the filtered CellRanger or SpaceRanger output count matrices, where empty droplets are removed.
For thymic samples (unenriched, APC-enriched, and CD45 depleted samples), ambient RNA correction was performed using SoupX v.1.5.2 (99) and doublet scores were calculated by scDblFinder v.1.6.0 (100). Features detected in < 3 cells, and cells with mitochondrial genome content >10% and number of detected features < 500 or > 5500 were removed. For gene expression data, log normalisation was performed, while antibody capture data were normalised by Seurat’s centered log ratio (CLR) approach. Variable features were defined per sample as the top 2000 variable features from the RNA assay. Integration of all thymic samples from all five donors was performed by the reciprocal Principal Component Analysis (RPCA)-based integration anchor workflow implemented in Seurat. The integrated data were scaled, and number of detected features, number of counts, and percentage of mitochondrial content was regressed out. Dimensionality reduction was performed first by PCA, and subsequently on the first 50 principal components by Uniform Manifold Approximation and Projection (UMAP) (101). Clustering was done using the Louvain algorithm with a range of resolutions from 2.2 to 4.0. Manual cell type annotations according to published marker genes was performed on clusters at resolution 3.2. Highly similar clusters were merged. One cluster consisting of 616 cells, driven largely by low quality, was removed, resulting in 83 847 retained cells. As none of the assessed cluster resolutions accurately separated CD4 SP and CD8 SP cells, the CD4 SP and CD8 SP annotations were performed by re-integrating the SP thymocytes, re-doing dimensionality reduction, and re-clustering at resolution 1.2. The proportions of cells of each cell type from each donor are shown in Supplementary Table S8.
Cell-to-cell signalling between annotated populations was inferred by CellPhoneDB v.2.0.0 (102, 103) using default parameters after random downsampling of the annotated dataset to 30 000 cells by use of the sample() function without replacement in base R.
For more focused analyses, subsets of thymocytes, DCs, B cells, and TECs were prepared. For the thymocyte subset, thymocyte clusters from the full dataset were subsetted and re-integrated. Scaling and dimensionality reduction was performed with or without regressing out cell cycle scores, calculated according to expression of lists of cell cycle genes implemented in Seurat. Cell labels from the full dataset were retained. Pseudotime analysis was performed using Monocle3 v.1.0.0 (43, 104–107), with the root node placed in the DN(P) cluster.
The DC subset was prepared from DC populations stemming from APC-enriched and CD45-depleted samples. For integration by Seurat’s CCA-based integration anchor workflow, the k.weight parameter in the IntegrateData() function was reduced to 50 due to low number of cells for some samples. Dimensionality reduction was performed with 30 principal components kept for UMAP, and re-clustering was performed at resolution 0.4. This revealed the presence of clusters expressing T cell, B cell, and stromal cell markers, respectively, with a large proportion of events exhibiting high doublet scores. These clusters were therefore filtered out, and the retained cells were subjected to a new integration, dimensionality reduction and clustering. Manual annotation was performed for clusters at resolution 1.0, with merging of highly similar clusters.
The B cell subset was reanalysed in a similar manner as described for the DC subset, from the B cell and B plasma populations stemming from APC-enriched and CD45-depleted samples, but with one CD45-depleted sample excluded due to low number of cells. In contrast to the analysis of the DC subset, default setting was used for k.weight during integration, and cluster resolution was set to 0.6.
The TEC subset was prepared from TEC populations stemming from CD45-depleted samples. After re-running integration, dimensionality reduction with 30 principal components retained for UMAP, and clustering at resolution 0.8, manual annotation was performed, and highly similar clusters were merged. Two clusters were filtered out due to expression of genes related to mural and endothelial cells, respectively.
The TEC datasets published by Park et al. (38) and Bautista et al. (30) were reanalysed after subsetting on samples from young paediatric donors only, including one donor for the Park et al. TEC dataset, and two donors for the Bautista et al. TEC dataset. Integration was performed for the two donors from the Bautista et al. dataset by the CCA-based integration anchor workflow. For both datasets, UMAP was calculated using the first 30 principal components from PCA. These reanalysed reference datasets were then used for predicting annotations for our TEC subset by Seurat’s label transfer approach.
Both in the full dataset and in each of the subsets, differentially expressed genes between clusters were calculated by the FindMarkers() function in Seurat, setting min.pct to 0.25 and only.pos to TRUE.
For the PBMC data, ambient RNA correction, calculation of doublet scores, and filtering was performed as for the thymic samples, resulting in 19 651 retained cells. Then, Seurat’s SCTransform() function was applied before integration of all five PBMC samples by the CCA-based integration anchor approach, and 30 principal components from PCA were used for UMAP. Cell labels were predicted based on label transfer from a comprehensive PBMC CITE-seq dataset published by Hao et al. (66). Then, samples were reprocessed using the log normalised pipeline in the same manner as for thymic samples, except for retaining 30 principal components for UMAP, in order to facilitate mapping of the thymic samples onto the PBMC UMAP coordinates by Seurat’s MapQuery() function.
For the spatial transcriptomics data, consisting of 18 329 spots across eight tissue sections, normalisation was performed using SCTransform, and integration was performed by Seurat’s CCA-based integration anchor approach. Dimensionality reduction was performed first by PCA, and then on the first 30 principal components by UMAP. Clustering was performed by the Louvain algorithm using a range of resolutions from 0.2 to 2.0. Clusters at resolution 1.4 were annotated according to anatomical niche, inferred by placement of the spots making up the cluster on the H&E images and by differentially expressed genes calculated as for the single cell sequencing data.
In order to deconvolute individual spots into their cell type composition, SPOTlight v.0.1.4 (108) was used. The single cell RNA sequencing dataset was used as the reference, and marker genes for seeding the SPOTlight algorithm were calculated using the FindAllMarkers() function from Seurat, with min.pct and lofgc.threshold set to 0, and only.pos set to TRUE. As specific topic profiles could not be inferred for highly similar cell populations, similar clusters in the reference were merged prior to identifying differentially expressed genes. SPOTlight was then run using these differentially expressed genes together with the top 3000 highly variable genes after downsampling the reference dataset to 100 cells from each annotated population.
Visualisations were prepared using Nebulosa v.1.2.0 (109) and ggplot2 v.3.3.5 (110), in addition to functions implemented in Seurat and SPOTlight. Figure 1A was created using content from 10x Genomics, and Figures 1A, 9 were created using content from Servier Medical Art.
The datasets presented in this study can be found in online repositories. The names of the repository/repositories and accession number(s) can be found below: GSE207206 (GEO).
Conseptualisation, MH, SF, HH, TR, MS, and BL; Methodology, MH, SF, HH, MS, and BL; Formal analysis, MH; Investigation, MH, SF, HH, DT, MF, and MS; Resources, DT, MF, and K-AD; Data curation, MH, SF, HH, and BL; Writing – Original Draft, MH, SF, HH, and BL; Writing – Review & Editing, MH, SF, HH, DT, MF, K-AD, TR, XT, MS, and BL; Visualisation, MH, SF, HH, and BL; Supervision, TR, XT, MS, BL; Project Administration, BL; Funding acquisition, BL. All authors contributed to the article and approved the submitted version.
Funding was provided by the Norwegian Research Council (project number 274718) and the Norwegian Diabetes Association.
We are highly grateful to donors and guardians for their participation in this study. Further, we thank the staff at the Department of Cardiothoracic Surgery at the Oslo University Hospital for facilitating sample collection. Instrumentation used during protocol optimisation was made accessible by the Flow Cytometry core facility at the Oslo University Hospital. The sequencing service was provided by the Norwegian Sequencing Centre (www.sequencing.uio.no), a national technology platform hosted by the University of Oslo and supported by the “Functional Genomics” and “Infrastructure” programs of the Research Council of Norway and the Southeastern Regional Health Authorities. Computational resources were provided by the Norwegian Research Infrastructure Services (NRIS) and Tjenester for Sensitive Data (TSD) facilities, owned by the University of Oslo.
TR was employed by the company Exact Sciences Innovation Ltd.
The remaining authors declare that the research was conducted in the absence of any commercial or financial relationships that could be construed as a potential conflict of interest.
All claims expressed in this article are solely those of the authors and do not necessarily represent those of their affiliated organizations, or those of the publisher, the editors and the reviewers. Any product that may be evaluated in this article, or claim that may be made by its manufacturer, is not guaranteed or endorsed by the publisher.
The Supplementary Material for this article can be found online at: https://www.frontiersin.org/articles/10.3389/fimmu.2022.1092028/full#supplementary-material
1. Petrie HT, Zuniga-Pflucker JC. Zoned out: Functional mapping of stromal signaling microenvironments in the thymus. Annu Rev Immunol (2007) 25:649–79. doi: 10.1146/annurev.immunol.23.021704.115715
2. Lind EF, Prockop SE, Porritt HE, Petrie HT. Mapping precursor movement through the postnatal thymus reveals specific microenvironments supporting defined stages of early lymphoid development. J Exp Med (2001) 194(2):127–34. doi: 10.1084/jem.194.2.127
3. Saint-Ruf C, Ungewiss K, Groettrup M, Bruno L, Fehling HJ, von Boehmer H. Analysis and expression of a cloned pre-T cell receptor gene. Science. (1994) 266(5188):1208–12. doi: 10.1126/science.7973703
4. Tourigny MR, Mazel S, Burtrum DB, Petrie HT. T Cell receptor (TCR)-beta gene recombination: Dissociation from cell cycle regulation and developmental progression during T cell ontogeny. J Exp Med (1997) 185(9):1549–56. doi: 10.1084/jem.185.9.1549
5. Wilson A, Held W, MacDonald HR. Two waves of recombinase gene expression in developing thymocytes. J Exp Med (1994) 179(4):1355–60. doi: 10.1084/jem.179.4.1355
6. Yannoutsos N, Wilson P, Yu W, Chen HT, Nussenzweig A, Petrie H, et al. The role of recombination activating gene (RAG) reinduction in thymocyte development in vivo. J Exp Med (2001) 194(4):471–80. doi: 10.1084/jem.194.4.471
7. Tanigaki K, Tsuji M, Yamamoto N, Han H, Tsukada J, Inoue H, et al. Regulation of alphabeta/gammadelta T cell lineage commitment and peripheral T cell responses by Notch/RBP-J signaling. Immunity. (2004) 20(5):611–22. doi: 10.1016/S1074-7613(04)00109-8
8. Halkias J, Melichar HJ, Taylor KT, Ross JO, Yen B, Cooper SB, et al. Opposing chemokine gradients control human thymocyte migration in situ. J Clin Invest (2013) 123(5):2131–42. doi: 10.1172/JCI67175
9. Takada K, Van Laethem F, Xing Y, Akane K, Suzuki H, Murata S, et al. TCR affinity for thymoproteasome-dependent positively selecting peptides conditions antigen responsiveness in CD8(+) T cells. Nat Immunol (2015) 16(10):1069–76. doi: 10.1038/ni.3237
10. Xing Y, Jameson SC, Hogquist KA. Thymoproteasome subunit-beta5T generates peptide-MHC complexes specialized for positive selection. Proc Natl Acad Sci U S A. (2013) 110(17):6979–84. doi: 10.1073/pnas.1222244110
11. Bachem A, Hartung E, Guttler S, Mora A, Zhou X, Hegemann A, et al. Expression of XCR1 characterizes the Batf3-dependent lineage of dendritic cells capable of antigen cross-presentation. Front Immunol (2012) 3:214. doi: 10.3389/fimmu.2012.00214
12. Hubert FX, Kinkel SA, Davey GM, Phipson B, Mueller SN, Liston A, et al. Aire regulates the transfer of antigen from mTECs to dendritic cells for induction of thymic tolerance. Blood. (2011) 118(9):2462–72. doi: 10.1182/blood-2010-06-286393
13. Li J, Park J, Foss D, Goldschneider I. Thymus-homing peripheral dendritic cells constitute two of the three major subsets of dendritic cells in the steady-state thymus. J Exp Med (2009) 206(3):607–22. doi: 10.1084/jem.20082232
14. Schmitz I, Clayton LK, Reinherz EL. Gene expression analysis of thymocyte selection in vivo. Int Immunol (2003) 15(10):1237–48. doi: 10.1093/intimm/dxg125
15. Bluestone JA, Tang Q. Treg cells-the next frontier of cell therapy. Science. (2018) 362(6411):154–5. doi: 10.1126/science.aau2688
16. Sumida H. Dynamics and clinical significance of intestinal intraepithelial lymphocytes. Immunol Med (2019) 42(3):117–23. doi: 10.1080/25785826.2019.1658516
17. Leishman AJ, Gapin L, Capone M, Palmer E, MacDonald HR, Kronenberg M, et al. Precursors of functional MHC class I- or class II-restricted CD8alphaalpha(+) T cells are positively selected in the thymus by agonist self-peptides. Immunity. (2002) 16(3):355–64. doi: 10.1016/S1074-7613(02)00284-4
18. Oh-Hora M, Komatsu N, Pishyareh M, Feske S, Hori S, Taniguchi M, et al. Agonist-selected T cell development requires strong T cell receptor signaling and store-operated calcium entry. Immunity. (2013) 38(5):881–95. doi: 10.1016/j.immuni.2013.02.008
19. Verstichel G, Vermijlen D, Martens L, Goetgeluk G, Brouwer M, Thiault N, et al. The checkpoint for agonist selection precedes conventional selection in human thymus. Sci Immunol (2017) 2(8):eaah4232. doi: 10.1126/sciimmunol.aah4232
20. Koehli S, Naeher D, Galati-Fournier V, Zehn D, Palmer E. Optimal T-cell receptor affinity for inducing autoimmunity. Proc Natl Acad Sci U S A. (2014) 111(48):17248–53. doi: 10.1073/pnas.1402724111
21. Lee HM, Bautista JL, Scott-Browne J, Mohan JF, Hsieh CS. A broad range of self-reactivity drives thymic regulatory T cell selection to limit responses to self. Immunity. (2012) 37(3):475–86. doi: 10.1016/j.immuni.2012.07.009
22. Plesa G, Zheng L, Medvec A, Wilson CB, Robles-Oteiza C, Liddy N, et al. TCR affinity and specificity requirements for human regulatory T-cell function. Blood. (2012) 119(15):3420–30. doi: 10.1182/blood-2011-09-377051
23. Sprouse ML, Shevchenko I, Scavuzzo MA, Joseph F, Lee T, Blum S, et al. Cutting edge: Low-affinity TCRs support regulatory T cell function in autoimmunity. J Immunol (2018) 200(3):909–14. doi: 10.4049/jimmunol.1700156
24. Wirnsberger G, Hinterberger M, Klein L. Regulatory T-cell differentiation versus clonal deletion of autoreactive thymocytes. Immunol Cell Biol (2011) 89(1):45–53. doi: 10.1038/icb.2010.123
25. Hinterberger M, Wirnsberger G, Klein L. B7/CD28 in central tolerance: costimulation promotes maturation of regulatory T cell precursors and prevents their clonal deletion. Front Immunol (2011) 2:30. doi: 10.3389/fimmu.2011.00030
26. Lu FT, Yang W, Wang YH, Ma HD, Tang W, Yang JB, et al. Thymic b cells promote thymus-derived regulatory T cell development and proliferation. J Autoimmun (2015) 61:62–72. doi: 10.1016/j.jaut.2015.05.008
27. Ehrlich LI, Oh DY, Weissman IL, Lewis RS. Differential contribution of chemotaxis and substrate restriction to segregation of immature and mature thymocytes. Immunity. (2009) 31(6):986–98. doi: 10.1016/j.immuni.2009.09.020
28. Takahama Y. Journey through the thymus: stromal guides for T-cell development and selection. Nat Rev Immunol (2006) 6(2):127–35. doi: 10.1038/nri1781
29. Uehara S, Song K, Farber JM, Love PE. Characterization of CCR9 expression and CCL25/thymus-expressed chemokine responsiveness during T cell development: CD3(high)CD69+ thymocytes and gammadeltaTCR+ thymocytes preferentially respond to CCL25. J Immunol (2002) 168(1):134–42. doi: 10.4049/jimmunol.168.1.134
30. Bautista JL, Cramer NT, Miller CN, Chavez J, Berrios DI, Byrnes LE, et al. Single-cell transcriptional profiling of human thymic stroma uncovers novel cellular heterogeneity in the thymic medulla. Nat Commun (2021) 12(1):1096. doi: 10.1038/s41467-021-21346-6
31. Cordero H, King RG, Dogra P, Dufeu C, See SB, Chong AM, et al. Intrathymic differentiation of natural antibody-producing plasma cells in human neonates. Nat Commun (2021) 12(1):5761. doi: 10.1038/s41467-021-26069-2
32. Gabrielsen ISM, Helgeland H, Akselsen H, HC DA, Sundaram AYM, Snowhite IV, et al. Transcriptomes of antigen presenting cells in human thymus. PLos One (2019) 14(7):e0218858. doi: 10.1371/journal.pone.0218858
33. Helgeland H, Gabrielsen I, Akselsen H, Sundaram AYM, Flam ST, Lie BA. Transcriptome profiling of human thymic CD4+ and CD8+ T cells compared to primary peripheral T cells. BMC Genomics (2020) 21(1):350. doi: 10.1186/s12864-020-6755-1
34. Lavaert M, Liang KL, Vandamme N, Park JE, Roels J, Kowalczyk MS, et al. Integrated scRNA-seq identifies human postnatal thymus seeding progenitors and regulatory dynamics of differentiating immature thymocytes. Immunity. (2020) 52(6):1088–104 e6. doi: 10.1016/j.immuni.2020.03.019
35. Lee MS, Hanspers K, Barker CS, Korn AP, McCune JM. Gene expression profiles during human CD4+ T cell differentiation. Int Immunol (2004) 16(8):1109–24. doi: 10.1093/intimm/dxh112
36. Morgana F, Opstelten R, Slot MC, Scott AM, van Lier RAW, Blom B, et al. Single-cell transcriptomics reveals discrete steps in regulatory T cell development in the human thymus. J Immunol (2022) 208(2):384–95. doi: 10.4049/jimmunol.2100506
37. Regev A, Teichmann SA, Lander ES, Amit I, Benoist C, Birney E, et al. The human cell atlas. Elife (2017) 6:e27041. doi: 10.7554/eLife.27041
38. Park JE, Botting RA, Dominguez Conde C, Popescu DM, Lavaert M, Kunz DJ, et al. A cell atlas of human thymic development defines T cell repertoire formation. Science (2020) 367(6480):eaay3224. doi: 10.1126/science.aay3224.
39. Cowan JE, Takahama Y, Bhandoola A, Ohigashi I. Postnatal involution and counter-involution of the thymus. Front Immunol (2020) 11:897. doi: 10.3389/fimmu.2020.00897
40. Ravkov E, Slev P, Heikal N. Thymic output: Assessment of CD4(+) recent thymic emigrants and T-cell receptor excision circles in infants. Cytom B Clin Cytom (2017) 92(4):249–57. doi: 10.1002/cyto.b.21341
41. Stuart T, Butler A, Hoffman P, Hafemeister C, Papalexi E, Mauck WM 3rd, et al. Comprehensive integration of single-cell data. Cell. (2019) 177(7):1888–902 e21. doi: 10.1016/j.cell.2019.05.031
42. Stoeckius M, Hafemeister C, Stephenson W, Houck-Loomis B, Chattopadhyay PK, Swerdlow H, et al. Simultaneous epitope and transcriptome measurement in single cells. Nat Methods (2017) 14(9):865–8. doi: 10.1038/nmeth.4380
43. Trapnell C, Cacchiarelli D, Grimsby J, Pokharel P, Li S, Morse M, et al. The dynamics and regulators of cell fate decisions are revealed by pseudotemporal ordering of single cells. Nat Biotechnol (2014) 32(4):381–6. doi: 10.1038/nbt.2859
44. Choi S, Warzecha C, Zvezdova E, Lee J, Argenty J, Lesourne R, et al. THEMIS enhances TCR signaling and enables positive selection by selective inhibition of the phosphatase SHP-1. Nat Immunol (2017) 18(4):433–41. doi: 10.1038/ni.3692
45. Li Y, Li K, Zhu L, Li B, Zong D, Cai P, et al. Development of double-positive thymocytes at single-cell resolution. Genome Med (2021) 13(1):49. doi: 10.1186/s13073-021-00861-7
46. Mingueneau M, Kreslavsky T, Gray D, Heng T, Cruse R, Ericson J, et al. The transcriptional landscape of alphabeta T cell differentiation. Nat Immunol (2013) 14(6):619–32. doi: 10.1038/ni.2590
47. Boulet S, Odagiu L, Dong M, Lebel ME, Daudelin JF, Melichar HJ, et al. NR4A3 mediates thymic negative selection. J Immunol (2021) 207(4):1055–64. doi: 10.4049/jimmunol.1901228
48. Pan M, Winslow MM, Chen L, Kuo A, Felsher D, Crabtree GR. Enhanced NFATc1 nuclear occupancy causes T cell activation independent of CD28 costimulation. J Immunol (2007) 178(7):4315–21. doi: 10.4049/jimmunol.178.7.4315
49. Schuster M, Glauben R, Plaza-Sirvent C, Schreiber L, Annemann M, Floess S, et al. IkappaB(NS) protein mediates regulatory T cell development via induction of the Foxp3 transcription factor. Immunity. (2012) 37(6):998–1008. doi: 10.1016/j.immuni.2012.08.023
50. Liu Y, He S, Wang XL, Peng W, Chen QY, Chi DM, et al. Tumour heterogeneity and intercellular networks of nasopharyngeal carcinoma at single cell resolution. Nat Commun (2021) 12(1):741. doi: 10.1038/s41467-021-21043-4
51. Villani AC, Satija R, Reynolds G, Sarkizova S, Shekhar K, Fletcher J, et al. Single-cell RNA-seq reveals new types of human blood dendritic cells, monocytes, and progenitors. Science (2017) 356(6335):eaah4573. doi: 10.1126/science.aah4573
52. Bachem A, Guttler S, Hartung E, Ebstein F, Schaefer M, Tannert A, et al. Superior antigen cross-presentation and XCR1 expression define human CD11c+CD141+ cells as homologues of mouse CD8+ dendritic cells. J Exp Med (2010) 207(6):1273–81. doi: 10.1084/jem.20100348
53. Maier B, Leader AM, Chen ST, Tung N, Chang C, LeBerichel J, et al. A conserved dendritic-cell regulatory program limits antitumour immunity. Nature. (2020) 580(7802):257–62. doi: 10.1038/s41586-020-2134-y
54. Sichien D, Scott CL, Martens L, Vanderkerken M, Van Gassen S, Plantinga M, et al. IRF8 transcription factor controls survival and function of terminally differentiated conventional and plasmacytoid dendritic cells, respectively. Immunity. (2016) 45(3):626–40. doi: 10.1016/j.immuni.2016.08.013
55. Mellor AL, Chandler P, Baban B, Hansen AM, Marshall B, Pihkala J, et al. Specific subsets of murine dendritic cells acquire potent T cell regulatory functions following CTLA4-mediated induction of indoleamine 2,3 dioxygenase. Int Immunol (2004) 16(10):1391–401. doi: 10.1093/intimm/dxh140
56. Fergusson JR, Morgan MD, Bruchard M, Huitema L, Heesters BA, van Unen V, et al. Maturing human CD127+ CCR7+ PDL1+ dendritic cells express AIRE in the absence of tissue restricted antigens. Front Immunol (2018) 9:2902. doi: 10.3389/fimmu.2018.02902
57. Allende ML, Tuymetova G, Lee BG, Bonifacino E, Wu YP, Proia RL. S1P1 receptor directs the release of immature b cells from bone marrow into blood. J Exp Med (2010) 207(5):1113–24. doi: 10.1084/jem.20092210
58. Grosserichter-Wagener C, Franco-Gallego A, Ahmadi F, Moncada-Velez M, Dalm VA, Rojas JL, et al. Defective formation of IgA memory b cells, Th1 and Th17 cells in symptomatic patients with selective IgA deficiency. Clin Transl Immunol (2020) 9(5):e1130. doi: 10.1002/cti2.1130
59. Brescia P, Schneider C, Holmes AB, Shen Q, Hussein S, Pasqualucci L, et al. MEF2B instructs germinal center development and acts as an oncogene in b cell lymphomagenesis. Cancer Cell (2018) 34(3):453–65 e9. doi: 10.1016/j.ccell.2018.08.006
60. Mori H, Ouchida R, Hijikata A, Kitamura H, Ohara O, Li Y, et al. Deficiency of the oxidative damage-specific DNA glycosylase NEIL1 leads to reduced germinal center b cell expansion. DNA Repair (Amst) (2009) 8(11):1328–32. doi: 10.1016/j.dnarep.2009.08.007
61. Xu C, Fang Y, Yang Z, Jing Y, Zhang Y, Liu C, et al. MARCKS regulates tonic and chronic active b cell receptor signaling. Leukemia. (2019) 33(3):710–29. doi: 10.1038/s41375-018-0244-4
62. King HW, Orban N, Riches JC, Clear AJ, Warnes G, Teichmann SA, et al. Single-cell analysis of human b cell maturation predicts how antibody class switching shapes selection dynamics. Sci Immunol (2021) 6(56):eabe6291. doi: 10.1126/sciimmunol.abe6291
63. Li Q, Zhu Z, Wang L, Lin Y, Fang H, Lei J, et al. Single-cell transcriptome profiling reveals vascular endothelial cell heterogeneity in human skin. Theranostics. (2021) 11(13):6461–76. doi: 10.7150/thno.54917
64. Nitta T, Tsutsumi M, Nitta S, Muro R, Suzuki EC, Nakano K, et al. Fibroblasts as a source of self-antigens for central immune tolerance. Nat Immunol (2020) 21(10):1172–80. doi: 10.1038/s41590-020-0756-8
65. Buechler MB, Pradhan RN, Krishnamurty AT, Cox C, Calviello AK, Wang AW, et al. Cross-tissue organization of the fibroblast lineage. Nature. (2021) 593(7860):575–9. doi: 10.1038/s41586-021-03549-5
66. Hao Y, Hao S, Andersen-Nissen E, Mauck WM 3rd, Zheng S, Butler A, et al. Integrated analysis of multimodal single-cell data. Cell. (2021) 184(13):3573–87 e29. doi: 10.1016/j.cell.2021.04.048
67. Mikušová R, Mešt’anová V, Polák S, Varga I. What do we know about the structure of human thymic hassall’s corpuscles? A histochemical, immunohistochemical, and electron microscopic study. Ann Anatomy (2017) 211:140–8. doi: 10.1016/j.aanat.2017.02.006
68. Chopp LB, Gopalan V, Ciucci T, Ruchinskas A, Rae Z, Lagarde M, et al. An integrated epigenomic and transcriptomic map of mouse and human alphabeta T cell development. Immunity. (2020) 53(6):1182–201 e8. doi: 10.1016/j.immuni.2020.10.024
69. Le J, Park JE, Ha VL, Luong A, Branciamore S, Rodin AS, et al. Single-cell RNA-seq mapping of human thymopoiesis reveals lineage specification trajectories and a commitment spectrum in T cell development. Immunity. (2020) 52(6):1105–18 e9. doi: 10.1016/j.immuni.2020.05.010
70. Owen DL, Mahmud SA, Sjaastad LE, Williams JB, Spanier JA, Simeonov DR, et al. Thymic regulatory T cells arise via two distinct developmental programs. Nat Immunol (2019) 20(2):195–205. doi: 10.1038/s41590-018-0289-6
71. Nunes-Cabaco H, Caramalho I, Sepulveda N, Sousa AE. Differentiation of human thymic regulatory T cells at the double positive stage. Eur J Immunol (2011) 41(12):3604–14. doi: 10.1002/eji.201141614
72. Kurd NS, Hoover A, Yoon J, Weist BM, Lutes L, Chan SW, et al. Factors that influence the thymic selection of CD8αα intraepithelial lymphocytes. Mucosal Immunol (2021) 14(1):68–79. doi: 10.1038/s41385-020-0295-5
73. Davey GM, Schober SL, Endrizzi BT, Dutcher AK, Jameson SC, Hogquist KA. Preselection thymocytes are more sensitive to T cell receptor stimulation than mature T cells. J Exp Med (1998) 188(10):1867–74. doi: 10.1084/jem.188.10.1867
74. Lei Y, Ripen AM, Ishimaru N, Ohigashi I, Nagasawa T, Jeker LT, et al. Aire-dependent production of XCL1 mediates medullary accumulation of thymic dendritic cells and contributes to regulatory T cell development. J Exp Med (2011) 208(2):383–94. doi: 10.1084/jem.20102327
75. Suo C, Dann E, Goh I, Jardine L, Kleshchevnikov V, Park JE, et al. Mapping the developing human immune system across organs. Science (2022) 376(6597):eabo0510. doi: 10.1126/science.abo0510
76. Zheng J, Liu Y, Lau YL, Tu W. CD40-activated b cells are more potent than immature dendritic cells to induce and expand CD4(+) regulatory T cells. Cell Mol Immunol (2010) 7(1):44–50. doi: 10.1038/cmi.2009.103
77. Lee ST, Georgiev H, Breed ER, Ruscher R, Hogquist KA. MHC class I on murine hematopoietic APC selects type a IEL precursors in the thymus. Eur J Immunol (2021) 51(5):1080–8. doi: 10.1002/eji.202048996
78. Lio CW, Hsieh CS. A two-step process for thymic regulatory T cell development. Immunity. (2008) 28(1):100–11. doi: 10.1016/j.immuni.2007.11.021
79. Santamaria JC, Borelli A, Irla M. Regulatory T cell heterogeneity in the thymus: Impact on their functional activities. Front Immunol (2021) 12:643153. doi: 10.3389/fimmu.2021.643153
80. Watanabe N, Wang YH, Lee HK, Ito T, Wang YH, Cao W, et al. Hassall's corpuscles instruct dendritic cells to induce CD4+CD25+ regulatory T cells in human thymus. Nature. (2005) 436(7054):1181–5. doi: 10.1038/nature03886
81. Dutertre CA, Becht E, Irac SE, Khalilnezhad A, Narang V, Khalilnezhad S, et al. Single-cell analysis of human mononuclear phagocytes reveals subset-defining markers and identifies circulating inflammatory dendritic cells. Immunity. (2019) 51(3):573–89 e8. doi: 10.1016/j.immuni.2019.08.008
82. Ginhoux F, Guilliams M, Merad M. Expanding dendritic cell nomenclature in the single-cell era. Nat Rev Immunol (2022) 22(2):67–8. doi: 10.1038/s41577-022-00675-7
83. Gies V, Guffroy A, Danion F, Billaud P, Keime C, Fauny JD, et al. B cells differentiate in human thymus and express AIRE. J Allergy Clin Immunol (2017) 139(3):1049–52 e12. doi: 10.1016/j.jaci.2016.09.044
84. Laan M, Salumets A, Klein A, Reintamm K, Bichele R, Peterson H, et al. Post-aire medullary thymic epithelial cells and hassall's corpuscles as inducers of tonic pro-inflammatory microenvironment. Front Immunol (2021) 12:635569. doi: 10.3389/fimmu.2021.635569
85. Metzger TC, Khan IS, Gardner JM, Mouchess ML, Johannes KP, Krawisz AK, et al. Lineage tracing and cell ablation identify a post-aire-expressing thymic epithelial cell population. Cell Rep (2013) 5(1):166–79. doi: 10.1016/j.celrep.2013.08.038
86. Bongiovanni A, Romancino DP, Campos Y, Paterniti G, Qiu X, Moshiach S, et al. Alix protein is substrate of ozz-E3 ligase and modulates actin remodeling in skeletal muscle. J Biol Chem (2012) 287(15):12159–71. doi: 10.1074/jbc.M111.297036
87. Campos Y, Qiu X, Zanoteli E, Moshiach S, Vergani N, Bongiovanni A, et al. Ozz-E3 ubiquitin ligase targets sarcomeric embryonic myosin heavy chain during muscle development. PLos One (2010) 5(3):e9866. doi: 10.1371/journal.pone.0009866
88. Nastasi T, Bongiovanni A, Campos Y, Mann L, Toy JN, Bostrom J, et al. Ozz-E3, a muscle-specific ubiquitin ligase, regulates beta-catenin degradation during myogenesis. Dev Cell (2004) 6(2):269–82. doi: 10.1016/S1534-5807(04)00020-6
89. Zuklys S, Gill J, Keller MP, Hauri-Hohl M, Zhanybekova S, Balciunaite G, et al. Stabilized beta-catenin in thymic epithelial cells blocks thymus development and function. J Immunol (2009) 182(5):2997–3007. doi: 10.4049/jimmunol.0713723
90. Fiorini E, Ferrero I, Merck E, Favre S, Pierres M, Luther SA, et al. Cutting edge: thymic crosstalk regulates delta-like 4 expression on cortical epithelial cells. J Immunol (2008) 181(12):8199–203. doi: 10.4049/jimmunol.181.12.8199
91. O'Neill KE, Bredenkamp N, Tischner C, Vaidya HJ, Stenhouse FH, Peddie CD, et al. Foxn1 is dynamically regulated in thymic epithelial cells during embryogenesis and at the onset of thymic involution. PLos One (2016) 11(3):e0151666. doi: 10.1371/journal.pone.0151666
92. Nitta T, Ota A, Iguchi T, Muro R, Takayanagi H. The fibroblast: An emerging key player in thymic T cell selection. Immunol Rev (2021) 302(1):68–85. doi: 10.1111/imr.12985
93. Davidson S, Coles M, Thomas T, Kollias G, Ludewig B, Turley S, et al. Fibroblasts as immune regulators in infection, inflammation and cancer. Nat Rev Immunol (2021) 21(11):704–17. doi: 10.1038/s41577-021-00540-z
94. Miller CN, Proekt I, von Moltke J, Wells KL, Rajpurkar AR, Wang H, et al. Thymic tuft cells promote an IL-4-enriched medulla and shape thymocyte development. Nature. (2018) 559(7715):627–31. doi: 10.1038/s41586-018-0345-2
95. Zheng GX, Terry JM, Belgrader P, Ryvkin P, Bent ZW, Wilson R, et al. Massively parallel digital transcriptional profiling of single cells. Nat Commun (2017) 8:14049. doi: 10.1038/ncomms14049
96. Butler A, Hoffman P, Smibert P, Papalexi E, Satija R. Integrating single-cell transcriptomic data across different conditions, technologies, and species. Nat Biotechnol (2018) 36(5):411–20. doi: 10.1038/nbt.4096
97. Satija R, Farrell JA, Gennert D, Schier AF, Regev A. Spatial reconstruction of single-cell gene expression data. Nat Biotechnol (2015) 33(5):495–502. doi: 10.1038/nbt.3192
98. R Core Team. R: A language and environment for statistical computing. Vienna, Austria: R Foundation for Statistical Computing (2022). Available at: https://www.R-project.org/.
99. Young MD, Behjati S. SoupX removes ambient RNA contamination from droplet-based single-cell RNA sequencing data. Gigascience. (2020) 9(12):giaa151. doi: 10.1093/gigascience/giaa151
100. Germain P, Lun A, Macnair W, Robinson M. Doublet identification in single-cell sequencing data using scDblFinder. f1000research (2021) 10:979. doi: 10.12688/f1000research.73600.1
101. Becht E, McInnes L, Healy J, Dutertre CA, Kwok IWH, Ng LG, et al. Dimensionality reduction for visualizing single-cell data using UMAP. Nat Biotechnol (2019) 37(1):38–44. doi: 10.1038/nbt.4314.
102. Efremova M, Vento-Tormo M, Teichmann SA, Vento-Tormo R. CellPhoneDB: Inferring cell-cell communication from combined expression of multi-subunit ligand-receptor complexes. Nat Protoc (2020) 15(4):1484–506. doi: 10.1038/s41596-020-0292-x
103. Vento-Tormo R, Efremova M, Botting RA, Turco MY, Vento-Tormo M, Meyer KB, et al. Single-cell reconstruction of the early maternal-fetal interface in humans. Nature. (2018) 563(7731):347–53. doi: 10.1038/s41586-018-0698-6
104. Cao J, Spielmann M, Qiu X, Huang X, Ibrahim DM, Hill AJ, et al. The single-cell transcriptional landscape of mammalian organogenesis. Nature. (2019) 566(7745):496–502. doi: 10.1038/s41586-019-0969-x
105. Levine JH, Simonds EF, Bendall SC, Davis KL, Amir el AD, Tadmor MD, et al. Data-driven phenotypic dissection of AML reveals progenitor-like cells that correlate with prognosis. Cell. (2015) 162(1):184–97. doi: 10.1016/j.cell.2015.05.047
106. Qiu X, Mao Q, Tang Y, Wang L, Chawla R, Pliner HA, et al. Reversed graph embedding resolves complex single-cell trajectories. Nat Methods (2017) 14(10):979–82. doi: 10.1038/nmeth.4402
107. Traag VA, Waltman L, van Eck NJ. From louvain to Leiden: Guaranteeing well-connected communities. Sci Rep (2019) 9(1):5233. doi: 10.1038/s41598-019-41695-z
108. Elosua-Bayes M, Crowell HL. SPOTlight: `SPOTlight`: Spatial transcriptomics deconvolution (2022). Available at: https://github.com/MarcElosua/SPOTlight.
109. Alquicira-Hernandez J, Powell JE. Nebulosa recovers single cell gene expression signals by kernel density estimation. Bioinformatics (2021) 37(16):2485–7. doi: 10.1101/2020.09.29.315879
Keywords: human thymus, autoimmunity, T cell development, T agonist selection, antigen-presenting cells, single-cell RNA sequencing, spatial transcriptomics, multi-modal
Citation: Heimli M, Flåm ST, Hjorthaug HS, Trinh D, Frisk M, Dumont K-A, Ribarska T, Tekpli X, Saare M and Lie BA (2023) Multimodal human thymic profiling reveals trajectories and cellular milieu for T agonist selection. Front. Immunol. 13:1092028. doi: 10.3389/fimmu.2022.1092028
Received: 07 November 2022; Accepted: 22 December 2022;
Published: 20 January 2023.
Edited by:
Kathleen P. Pratt, Uniformed Services University of the Health Sciences, United StatesReviewed by:
Daniel Leventhal, Generate Biomedicines, Inc., United StatesCopyright © 2023 Heimli, Flåm, Hjorthaug, Trinh, Frisk, Dumont, Ribarska, Tekpli, Saare and Lie. This is an open-access article distributed under the terms of the Creative Commons Attribution License (CC BY). The use, distribution or reproduction in other forums is permitted, provided the original author(s) and the copyright owner(s) are credited and that the original publication in this journal is cited, in accordance with accepted academic practice. No use, distribution or reproduction is permitted which does not comply with these terms.
*Correspondence: Benedicte Alexandra Lie, Yi5hLmxpZUBtZWRpc2luLnVpby5ubw==
†Present address: Teodora Ribarska, Exact Sciences Innovation Ltd., Oxford, Oxfordshire, United Kingdom
Mario Saare, Institute of Genomics, University of Tartu, Tartu, Estonia
Disclaimer: All claims expressed in this article are solely those of the authors and do not necessarily represent those of their affiliated organizations, or those of the publisher, the editors and the reviewers. Any product that may be evaluated in this article or claim that may be made by its manufacturer is not guaranteed or endorsed by the publisher.
Research integrity at Frontiers
Learn more about the work of our research integrity team to safeguard the quality of each article we publish.