 Xing Zhou1,2,3Jiacheng Wei1,2,3
 Liang Li4Zhenfeng Shu4Ling You5,6Yang Liu7,8Ruozhu Zhao1,2,3Jiacheng Yao1,7Jianbin Wang1,7
 Minmin Luo7,8Yousheng Shu4
 Kexin Yuan5,6*
 Hai Qi1,2,3,9,10*
- 1Tsinghua-Peking Center for Life Sciences, Beijing, China
- 2Laboratory of Dynamic Immunobiology, Institute for Immunology, Tsinghua University, Beijing, China
- 3Department of Basic Medical Sciences, School of Medicine, Tsinghua University, Beijing, China
- 4Department of Neurology, Huashan Hospital, State Key Laboratory of Medical Neurobiology, Institute for Translational Brain Research, MOE Frontiers Center for Brain Science, Fudan University, Shanghai, China
- 5Department of Bioengineering, School of Medicine, Tsinghua University, Beijing, China
- 6IDG/McGovern Institute for Brain Research, Tsinghua University, Beijing, China
- 7School of Life Sciences, Tsinghua University, Beijing, China
- 8National Institute of Biological Science, Beijing, China
- 9Beijing Key Laboratory for Immunological Research on Chronic Diseases, Tsinghua University, Beijing, China
- 10Beijing Frontier Research Center for Biological Structure, Tsinghua University, Beijing, China
Microglial abnormalities may contribute to neurodevelopmental disorders. PTEN is implicated as a susceptibility gene for autism spectrum disorders and its germline ablation in mice causes behavioral abnormalities. Here we find postnatal PTEN deletion in microglia causes deficits in sociability and novel object recognition test. Mutant mice harbor markedly more activated microglia that manifest enhanced phagocytosis. Interestingly, two-week postponement of microglia PTEN ablation leads to no social interaction defects, even though mutant microglia remain abnormal in adult animals. Disturbed neurodevelopment caused by early PTEN deletion in microglia is characterized by insufficient VGLUT1 protein in synaptosomes, likely a consequence of enhanced removal by microglia. In correlation, in vitro acute slice recordings demonstrate weakened synaptic inputs to layer 5 pyramidal neurons in the developing cortex. Therefore, microglial PTEN safeguards integrity of neural substrates underlying sociability in a developmentally determined manner.
Introduction
Microglia are tissue-resident macrophages in the central nervous system. Their progenitors develop in the yolk sac, migrate into the embryonic brain and by local proliferation populate the entire brain throughout life (1–4). Microglia participate in synaptic pruning, remodeling and maturation, particularly during postnatal neurodevelopment (5–7). Ablation of CX3CR1, a chemokine receptor that is expressed by microglia and mediates microglia-neuron interactions (8), leads to impaired synapse maturation, decreased functional brain connectivity, and autism-like abnormal behaviors (9, 10). Mice lacking the Triggering Receptor Expressed On Myeloid Cells 2 (TREM2), which in the brain is mainly expressed by microglia, exhibit a loss of microglia and abnormally increased spine densities selectively in the hippocampal CA1 region, and these mice suffer from behavioral defects (11). On the other hand, increasing evidence also indicates that, in adult brain, microglia actively probe neuronal states and play important roles in damage clearance, immune protection, trophic support and neuroplasticity (12–16). Phenotypic and functional abnormalities of microglia are intimately associated with neurodegenerative diseases. Prominently, in rodent models of neurodegenerative diseases including the Alzheimer’s disease (AD) and Amyotrophic lateral sclerosis (ALS), microglia display a stereotypic disease-associated microglia (DAM) phenotype (17), which appears to be an inflammatory state driven by a TREM2-dependent pathway (18). While the disease-associated microglia phenotype may or may not be a cause of pathogenesis, it is clear that changes to microglia, particularly those genetically determined, could lead to behavioral phenotypes either via a neurodevelopmental route in infants or children or via a functional route in adults.
The autism spectrum disorder (ASD) is a heterogenous group of neurodevelopmental disorders that are characterized by childhood-onset impairment of communication and social skills combined with the presence of repetitive behaviors. Genetic predisposition play a significant role, with ~1000 genes by some estimate potentially contributing to ASD susceptibility (19). Certain monogenic mutations greatly increase the risk of ASD, such as those affecting FMR1 in fragile X syndrome (20, 21), MECP2 in Rett syndrome (22), and TSC1 and TSC2 in Tuberous Sclerosis Complex (23). A commonly dysregulated pathway in these syndromic ASDs is the PI3 kinase and mTOR pathway (24). Dysregulation of PI3K and mTOR activities in neurons affects migration, axon formation and targeting, dendritic growth and spine development, potentially contributing to ASD pathogenesis directly (24). Phosphatase and Tensin Homolog (PTEN) is a tumor suppressor and a main lipid phosphatase that negatively regulates PI3K/Akt/mTOR pathways, which are vital to normal functions of essentially all cell types (25). Mutations of PTEN are found in ASD patients, particularly those with macrocephaly (26–30). In mice, Nse-cre-driven Pten deletion in a subset of neurons in the cortex and hippocampus leads to macrocephaly and deficits in social interactions reminiscent of ASD (31, 32), indicating a neuronal root of ASD pathogenesis due to loss of PTEN function. Given the fact that PTEN is universally expressed, other cell types may also contribute. Indeed, studies of PTEN mutations that cause cytoplasmic- or nuclear-predominant localization have revealed abnormalities of not only neurons but also glial cells, including microglia, in association with ASD-like behavioral phenotypes. In particular, dysregulated subcellular PTEN localization cause aberrant microglia activation with increased phagocytic activities (33, 34). Consistent with the idea that abnormal microglia functions may be involved in ASD pathogenesis due to PTEN mutations (33, 35–37), microglial overexpression of eIF4E leads to elevated protein synthesis and functional disturbance of microglia, altered synapse density, and ASD-like behaviors in mice (37). Our current study is designed to specifically probe how PTEN in microglia may regulate microglia-neuron crosstalk and whether microglial PTEN perturbation could affect neurodevelopment and animal behaviors. We report postnatal PTEN deletion in microglia immediately after birth leads to accumulation of activated microglia, accompanied by reduced synapse density and markedly changed firing patterns of cortical layer 5 (L5) pyramidal neurons, leading to impaired sociability later in life. Postponement of genetic deletion by 14 days completely avoided neuronal and behavioral impairment, demonstrating a developmental period during which intact microglia are essential for normal neural substrates underlying sociability.
Results
Postnatal Pten ablation in microglia leads to deficits in sociability and novelty exploration
To investigate a potential role for PTEN in microglia in shaping animal behaviors, we created mice with inducible Pten deletion in a microglia-specific manner by breeding Cx3cr1CreERT2/+ mice with Ptenfl/fl mice. To specifically examine PTEN-controlled microglial functions during postnatal neurodevelopment, as detailed in Methods and illustrated in Figure 1A, we injected tamoxifen into the stomach of newborn Cx3cr1CreERT2/+Ptenfl/fl and littermate control Cx3cr1CreERT2/+Pten+/+ mice daily from postnatal day 0 (P0) to day 2 (P2). In this system, microglia and other cells in the brain are intact throughout embryonic development. To verify the efficiency of Pten deletion by this procedure, microglia were isolated at different time points to test PTEN protein expression. As compared to cells from littermate control mice, microglia from Cx3cr1CreERT2/+Ptenfl/fl mice largely lost PTEN protein as early as one week after the tamoxifen injection and remained so for as long as we tested (Figures S1A, B). Taking advantage of the EYFP expression from the knock-in Cx3cr1CreERT2 allele, we used anti-GFP antibody to stain for EYFP on tissue sections and verified that the targeted cells were essentially all Iba-1+ microglia but not astrocytes (S100b+), oligodendrocytes (Olig2+), or neurons (NeuN+) (Figures S1C, D). For convenience, we subsequently call tamoxifen-treated Cx3cr1CreERT2/+Ptenfl/fl and Cx3cr1CreERT2/+Pten+/+ mice mPTENKO(0) and mPTENWT(0), respectively.
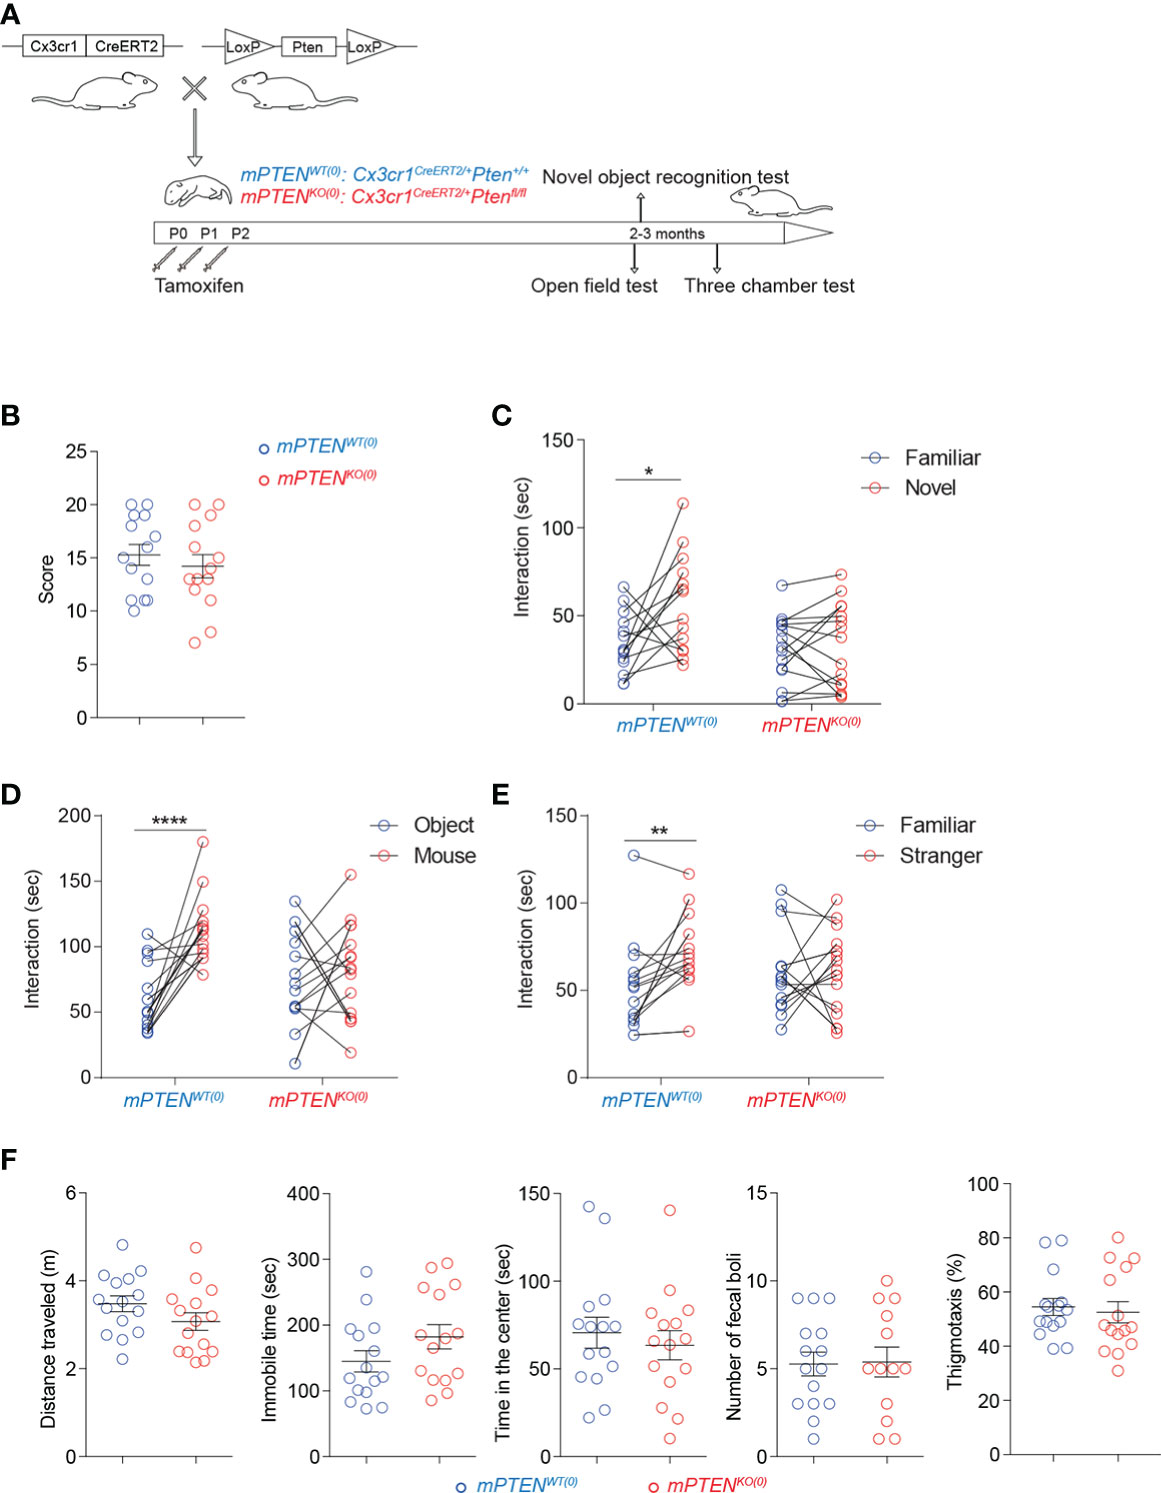
Figure 1 Postnatal Pten ablation in microglia leads to deficits in sociability and novelty exploration (A) Experimental scheme. (B) Numbers of marbles buried in 30 min during the marble-burying test (mPTENWT(0), n=14; mPTENKO(0), n=14). (C) Time spent exploring a novel versus a familiar object by mPTENWT(0) (n=14) or mPTENKO(0) (n=15) mice in the novel object recognition test. (D) Time spent interacting with an inanimate object or a mouse by mPTENWT(0) (n=17) or mPTENKO(0) (n=17) mice in the three-chamber interaction test. (E) Time spent interacting with a familiar or a stranger mouse by mPTENWT(0) (n=17) or mPTENKO(0) (n=17) mice in the three-chamber test. (F) Locomotor activities and thigmotaxis in the open-field test. Total distance traveled (m), total time of being immobile (sec), total time of being in the center (sec), number of fecal boli left and thigmotaxis by individual mPTENWT(0) (n=15) and mPTENKO(0) (n=15) mice. *P < 0.05, **P < 0.01, ****P < 0.0001, by unpaired (open field and marble-burying) or paired (novel objection recognition and three-chamber interaction) t tests.
To examine behavioral consequences of postnatal PTEN deletion in microglia, we first compared mPTENKO(0) and mPTENWT(0) mice (>8 weeks old) in a marble-burying test, which could reveal signs of ASD-like repetitive behaviors and potentially increased anxieties (38). As shown in Figure 1B, the two groups of mice were comparable. On the other hand, when tested in a novel object recognition test (NORT), mPTENKO(0) mice failed to exhibit a preference for exploring the novel object, unlike their mPTENWT(0) counterparts (Figure 1C). In social interaction tests, whereas mPTENWT(0) mice showed a clear preference for interacting with a companion mouse than with an inanimate object (Figure 1D) and for interacting with a stranger than with a familiar mouse (Figure 1E), the mPTENKO(0) mice did not show such preferences (Figures 1D, E). The failure of mPTENKO(0) mice to pass these tests did not result from grossly impaired locomotor abilities or increased anxieties, as they performed as well as the wildtype counterparts in the open-field test (Figure 1F). These data demonstrate impaired sociability and exploration of novel objects resulting from postnatal PTEN ablation in microglia.
Postnatal Pten ablation leads to accumulation of activated microglia
To characterize changes of postnatal microglial development and function caused by Pten ablation, we first examined their progressive expansion. We chose the cerebral cortex for two reasons. First, microglia from different brain regions are quite heterogeneous (39), and cerebral cortex represents an abundant source of microglia. Second, cortical functions are important for social behaviors (40, 41). As shown in Figures 2A, B, the density of Iba-1+ microglia gradually increased to reach a stable plateau by 2-3 months after birth (hereafter “young adult” is used to specifically refer to 2- to 3-month-old mice), with the most rapid expansion taking place during the second week of postnatal development. When Pten was ablated from microglia, these cells accumulated almost twice as fast to reach approximately the plateau density by P14; in young adult mice or older animals, the density of mPTENKO(0) microglia in cerebral cortex was only slightly albeit statistically significant higher than that of mPTENWT(0) cells (Figures 2A, B). We did not observe differences in density or distribution of neurons, astrocytes, or oligodendrocytes in the two types of mice (Figure S1E). Individual mutant microglia exhibited markedly different morphology in that their cell bodies were enlarged, with thickened cellular processes extending shorter and fewer branches, indicative of an activated state (42), as seen in both somatosensory (Figure 2C) and auditory cortices (Figure 2D). Consistent with these morphological patterns, mPTENKO(0) microglia from young adult mice expressed higher levels of F4/80 and CD86 (Figures 2E, F), which are upregulated in activated microglia (43).
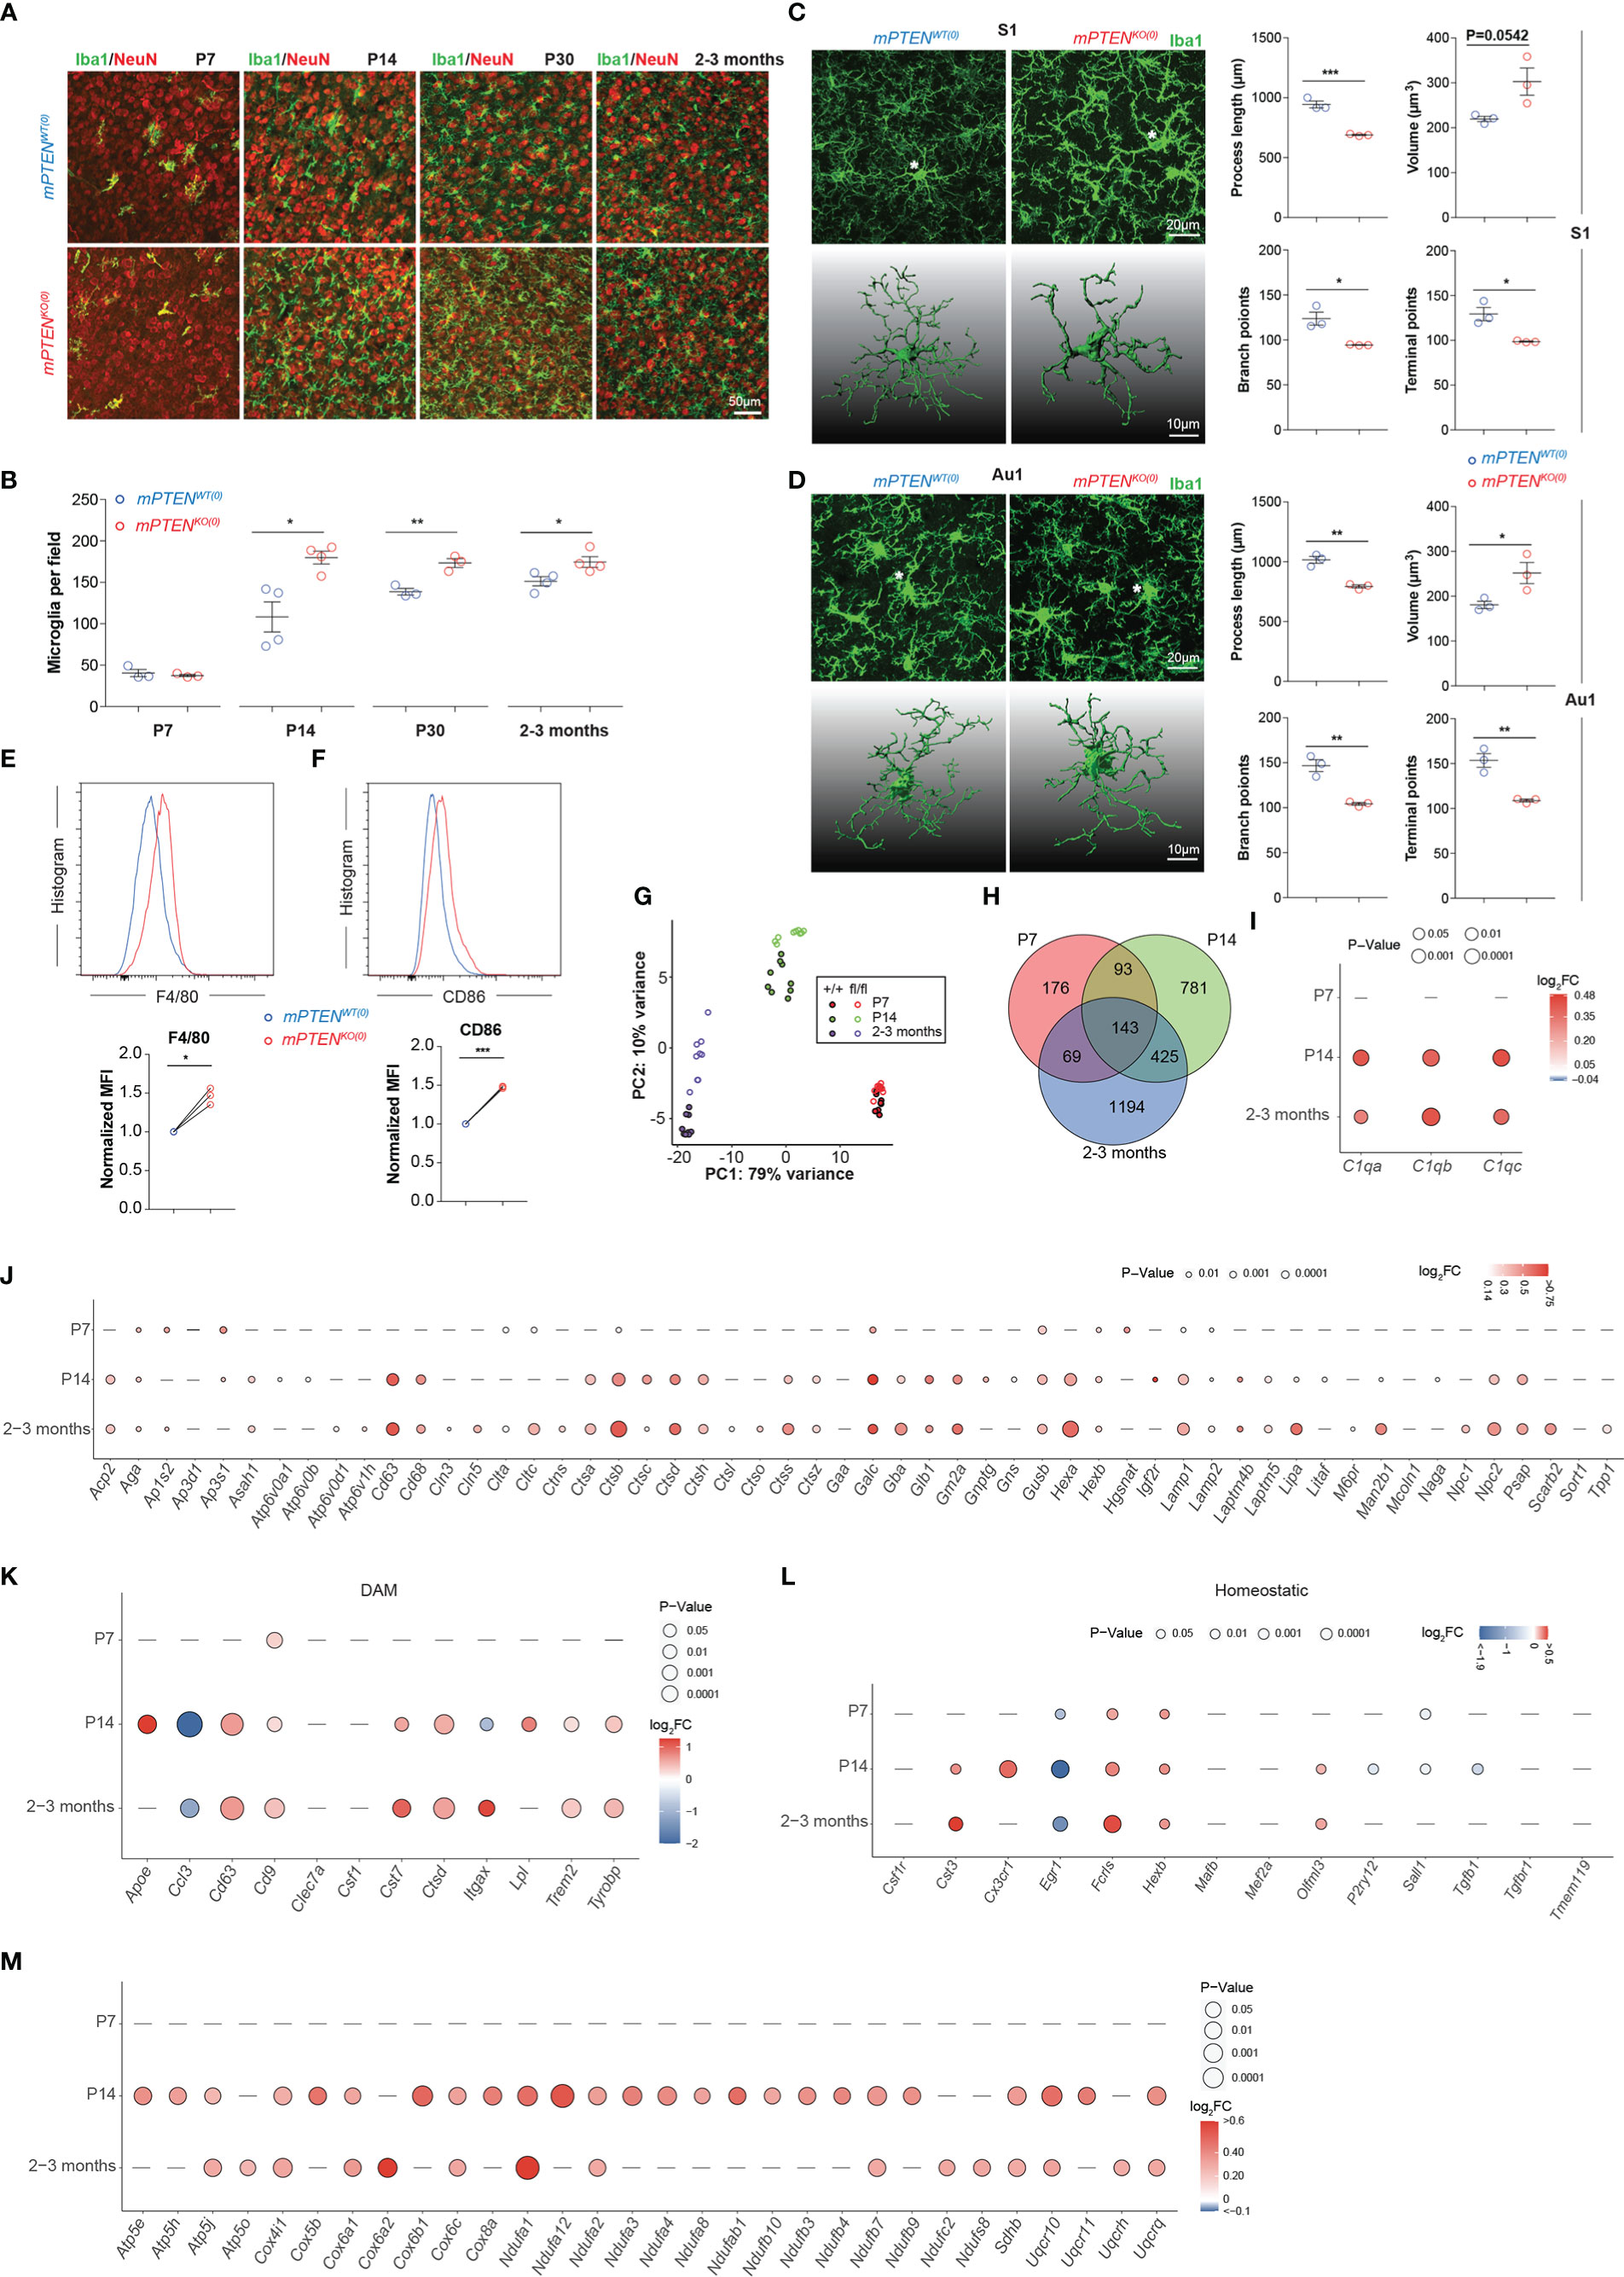
Figure 2 Microglia phenotypes after postnatal Pten ablation. (A) Representative images of Iba1-stained microglia (green) in the context of NeuN staining (red) in the somatosensory cortex (coronal sections) of mPTENWT(0) and mPTENKO(0) mice at indicated time points. (B) Numbers of Iba1+ microglia per field (0.4 mm2), as quantified from (A). Each dot represents a mouse (microglia quantitated in n=5-10 fields per mouse), and lines denote mean±s.e.m. (P7, P14, P30, and 2-3 months, N=3, 4, 3, 3 mice). (C) Left, maximum intensity projection images (top) and 3-D reconstruction of the asterisked microglia (bottom) from the somatosensory cortex (S1) of 2- to 3-month-old mice, mPTENWT(0) or mPTENKO(0) as indicated; Right, automated morphometric analyses of microglial process length, volume, number of branch points, and number of dendrite terminal points. Each dot represents a mouse (5-10 cells per mouse), and lines denote mean±s.e.m. of individual mice. (D) Microglia from the auditory (Au1) cortex, analyzed and presented exactly as in (C). (E, F) Representative histograms (top) and normalized MFI (bottom) of F4/80 (E) and CD86 (F) staining of mPTENWT(0) and mPTENKO(0) microglia (2- to 3-month-old mice). Each pair of line-connected dots represents one of the three independent experiments conducted. In each experiment, microglia of each genotype were pooled from 2 mice. *P < 0.05, **P < 0.01, ***P < 0.001 by unpaired t test (B-F). (G) Transcriptomic PCA analyses of sort-purified cortical microglia from P7, P14 and 2-3 months. (H) Venn diagram of DEGs between wildtype and PTEN-ablated microglia at P7, P14 to 2-3 months. (I) A bubble plot showing differential expression of indicated complement genes (X axis) at indicated time points (Y axis). Bubble color, Log2FC=Log2(mPTENKO(0)/mPTENWT(0)); bubble size, levels of statistical significance defined by P values; a dash indicates no significant difference observed. (J) A bubble plot showing differential expression of lysosome-related genes at indicated time points, formatted as in (I). (K, L) A bubble plot showing differential expression of indicated DAM (K) and homeostatic (L) genes, formatted as in (I). (M) A bubble plot showing differential expression of indicated mitochondria-related genes, formatted as in (I).
Next, we conducted transcriptomic profiling of mPTENWT(0) and mPTENKO(0) microglia isolated from postnatal day 7 (P7) mice, postnatal day 14 (P14) mice and 2- to 3-month-old young adult mice. By principal component analyses, we found that mPTENWT(0) and mPTENKO(0) microglia from the same time of postnatal development were grouped together, whereas microglia of the same genotype, either mPTENWT(0) or mPTENKO(0), displayed divergent transcriptomes across different time points of postnatal development (Figure 2G). Therefore, while microglia-intrinsic Pten deletion led to changes in cell abundance and morphology, it did not completely alter the overall trajectory of postnatal microglial development, which involves progressive changes of the transcriptome at a larger scale (44).
At a finer scale, on the other hand, the number of genes differentially expressed by wildtype and mPTENKO(0) microglia increased over time (Figure 2H, Table S1). Prominently, genes encoding C1q components (C1qa, C1qb, and C1qc) were significantly upregulated in mutant microglia at P14 and later (Figure 2I). We also observed increased C1q protein by immunostaining on tissue sections (Figures S2A, B). Many lysosome-related genes (as defined by the KEGG pathway), including Cd68 and those encoding cathepsins, were expressed at significantly higher levels in PTEN-deficient microglia at P14 and later (Figure 2J). Interestingly, many genes upregulated in the DAM signature, which reflects an inflammatory microglia state observed in neurodegenerative diseases including AD and ALS (17, 18), were also expressed at higher levels in mPTENKO(0) than in mPTENWT(0) microglia at P14 and later (Figure 2K). On the other hand, general downregulation of microglia homeostatic genes (e.g. P2ry12, Cx3cr1, Cst3, Tmem119, Olfml3, Hexb, Fcrls, Csf1r, Tgfbr1, Mef2a, Mafb) seen in the DAM signature (44–46) did not occur, as expression of most of these genes were either unchanged or increased in mPTENKO(0) microglia (Figure 2L). Gene set enrichment analyses further revealed that, at all three time points examined, genes upregulated in mPTENKO(0) microglia enriched those in KEGG pathways of oxidative phosphorylation, AD, and the Parkinson’s disease (PD; Figures S3A-C). A shared feature of these three KEGG pathways is that they all contain many genes encoding mitochondrial components (Table S2), reflecting the fact that mitochondria dysfunctions are implicated in the pathogenesis of AD and PD (47). As shown in Figure 2M, many mitochondria-related genes categorized in the 3 pathways are expressed at higher levels in mPTENKO(0) than in mPTENWT(0) microglia from P14 or young adult mice.
Combined together, these profiling data suggest that PTEN ablation leads to an activated microglia state that features enhanced oxidative phosphorylation, increased phagocytosis, and possibly altered C1q-dependent synapse pruning (48).
Microglia without PTEN are more phagocytic
Phagocytosis is important for microglial homeostatic and defense functions (49, 50). PTEN could directly regulate phagosome membrane trafficking, because its enzymatic activities reduce membrane PIP3 concentration (51, 52). KEGG pathway enrichment analysis of upregulated genes in mPTENKO(0) microglia reveals lysosome pathway is most significantly enriched at all three time points examined (Figure S3D). Consistent with the mRNA-seq results (Figure 2J), mPTENKO(0) microglia expressed higher levels of intracellular CD68 protein at P14 (Figures 3A, B). By flow cytometry, freshly isolated mPTENKO(0) microglia were able to phagocytose more zymosan particles in vitro (Figure 3C), indicating that the intrinsic phagocytic capability is enhanced in PTEN-deficient microglia.
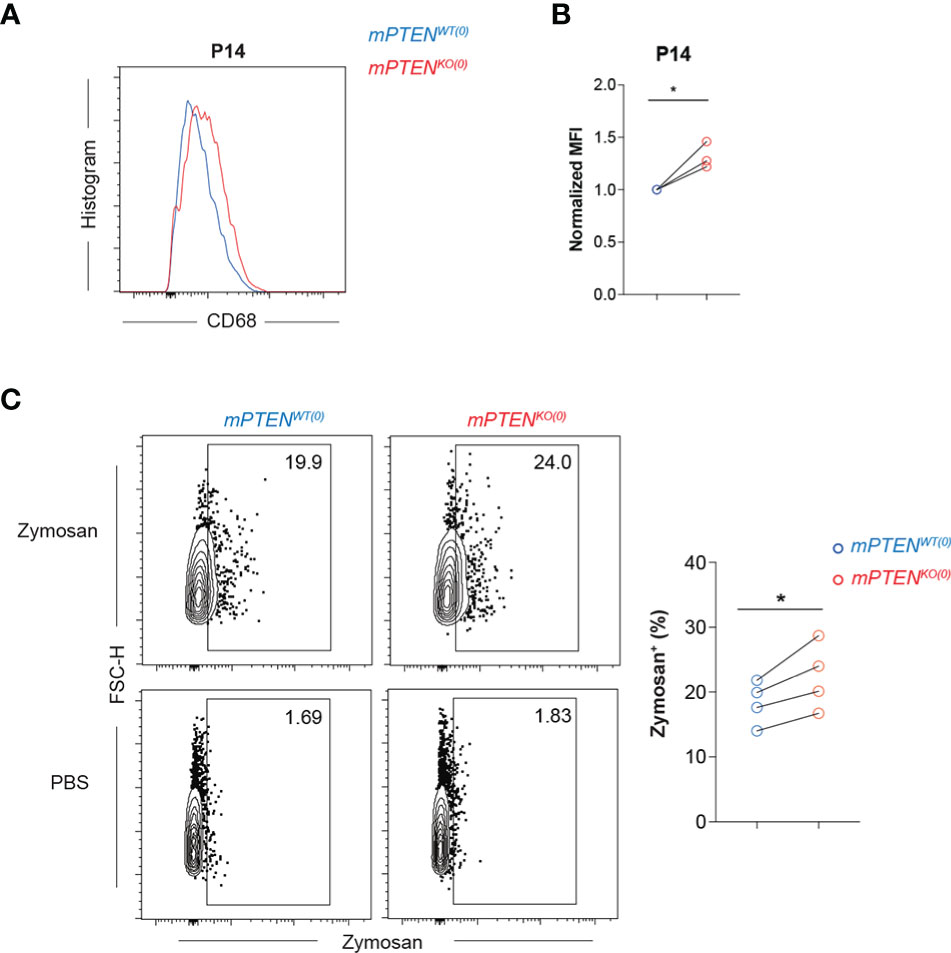
Figure 3 Microglia without PTEN are more phagocytic (A, B) Histograms (A) and normalized MFI (B) of CD68 staining on mPTENWT(0) (blue) and mPTENKO(0) (red) microglia at P14. Each pair of line-connected dots represents one of the three independent experiments conducted. In each experiment, cortical microglia of each genotype were pooled from 2 male mice. (C) Contour plots showing freshly isolated microglia at P7 that were incubated in vitro with 0.2 mg/ml zymosan or PBS for 1.5 h. The scatter plot shows summary data of the percentage of zymosan-containing microglia of the indicated genotype. Each dot represents one experiment, and in each experiment microglia of cerebral cortex were pooled from 4-5 male mice. Lines denote mean ± s.e.m. *P < 0.05, by paired t test.
A critical window for microglia PTEN to shape neural development underlying sociability
To directly test whether PTEN deletion from microglia earlier in postnatal life is causative for defective sociability observed later in life, we injected tamoxifen into separate groups of Cx3cr1CreERT2/+Ptenfl/fl and littermate control Cx3cr1CreERT2/+Pten+/+ mice on postnatal day 14 to create mPTENKO(14) and mPTENWT(14) mice. PTEN deletion was verified by Western blotting with sorted microglia, as done in Figure S1B.
Interestingly, microglia remained of overactive features in young adult mPTENKO(14) mice. Mutant microglia were more abundant than their wildtype counterpart (Figure 4A), and their cellular processes were thickened and shorter with fewer branches (Figures 4B, C). The transcriptome of those mPTENKO(14) microglia was globally similar to that of microglia from mPTENKO(0) mice (Figure S4A), which is consistent with the PCA result for mPTEN(0) mice that microglia from the same age tend to cluster together (Figure 2G). Genes encoding C1q components (C1qa, C1qb, and C1qc) were also upregulated in mPTENKO(14) microglia (Figure S4B).
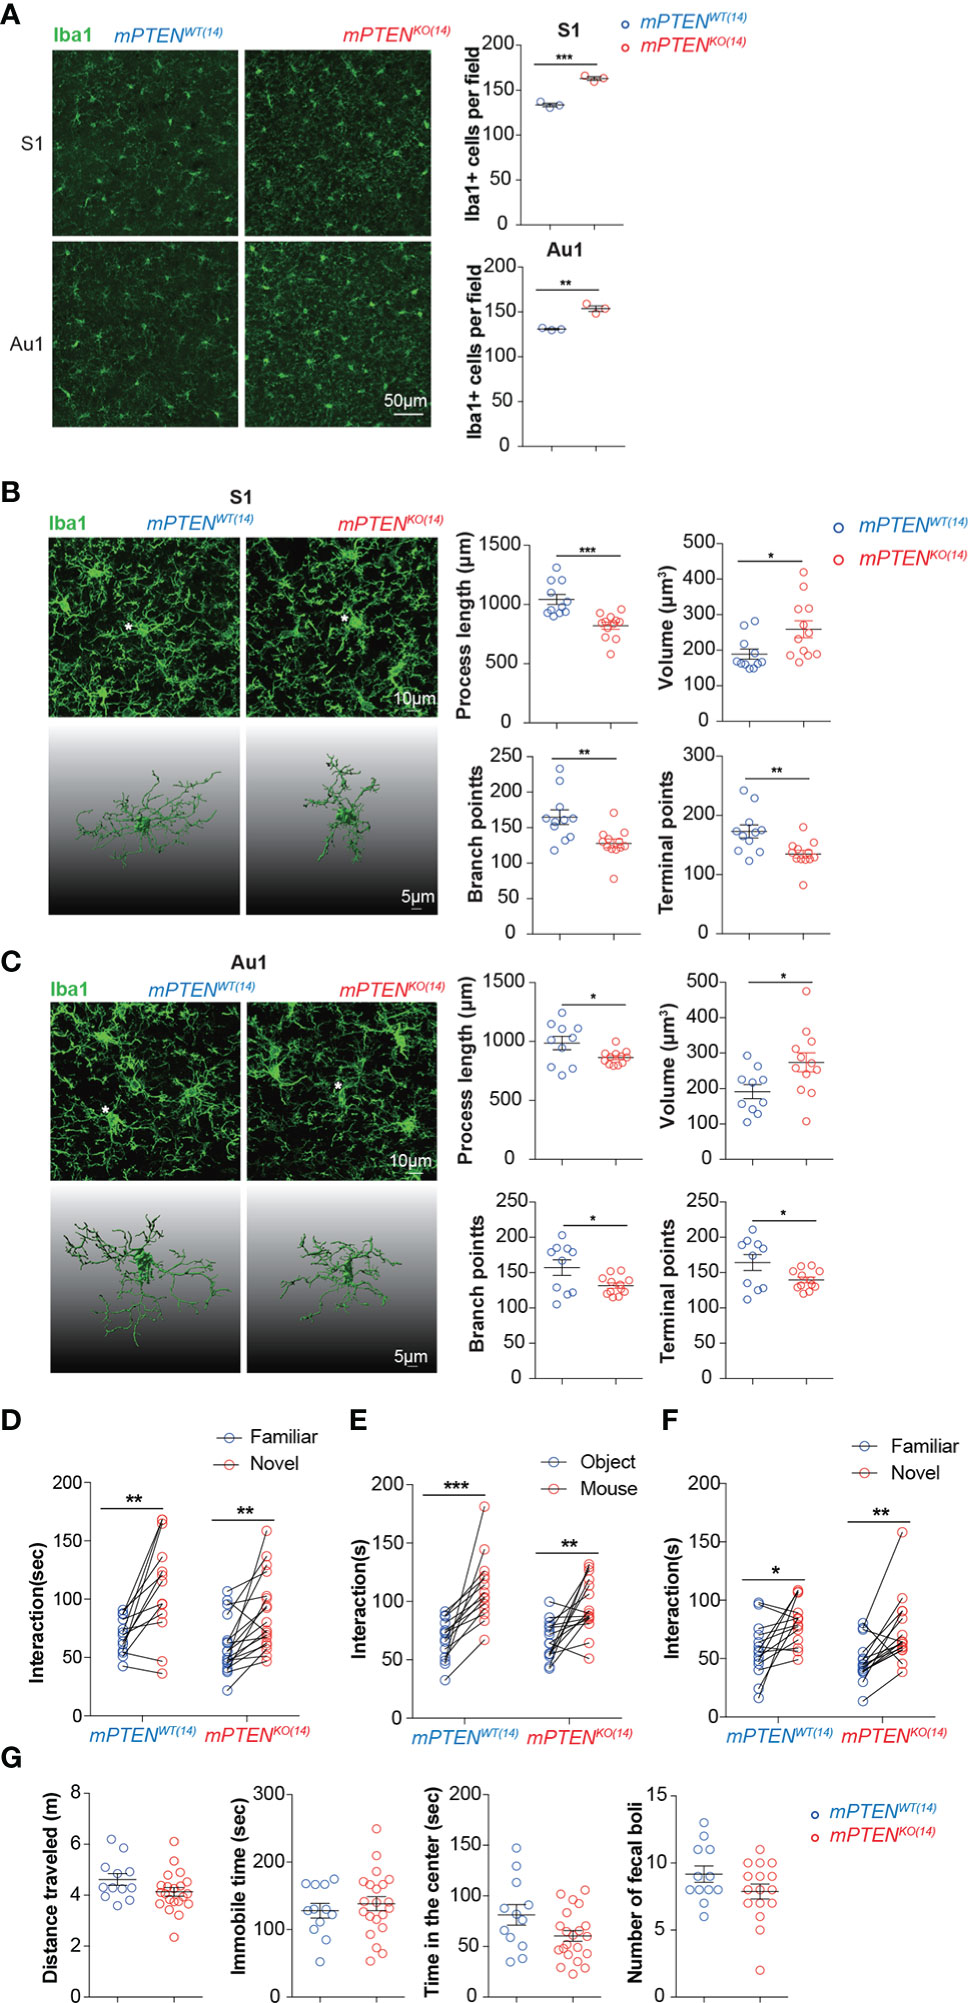
Figure 4 A critical window for microglia PTEN functions. (A) Representative images of Iba1-stained microglia in the S1 and Au1 cortex of mPTENWT(14) and mPTENKO(14) mice of 2-3 months of age. Right: numbers of Iba1+ microglia per field (0.4 mm2). Each dot represents a mouse (3 fields per mouse), and lines denote mean±s.e.m. (3 mice). (B) Left, maximum intensity projection images (top) and 3-D reconstruction of the asterisked microglia (bottom) from the somatosensory cortex (S1) of 2- to 3-month-old mice, mPTENWT(14) or mPTENKO(14) as indicated; Right, automated morphometric analyses of microglial process length, volume, number of branch points, and number of dendrite terminal points. Each dot represents one 3-D reconstructed microglia, and lines denote mean ± s.e.m. Data were collected from 3 mice, each contributing 3-4 randomly chosen microglia in the S1 cortex. (C) Microglia from the auditory (Au1) cortex, analyzed and presented exactly as in (B). *P < 0.05, **P < 0.01, ***P < 0.001, by unpaired t tests. (D) Time spent exploring a novel versus a familiar object by mPTENWT(14) (n=13) or mPTENKO(14) (n=18) mice in the novel object recognition test. (E, F) Time spent interacting with an inanimate object or a mouse (E), a familiar or a stranger mouse (F) by mPTENWT(14) (n = 14) or mPTENKO(14) mice (n=16) in the three-chamber test. (G) Locomotor activities in the open-field test. Total distance traveled (m), total time of being immobile (sec), total time of being in the center (sec), and number of fecal boli left by individual mPTENWT(14) (n = 12) and mPTENKO(14) (n = 12) mice. *P < 0.05, **P < 0.01, ***P < 0.001 by unpaired (open field) or paired (novel objection recognition and three-chamber interaction) t tests.
Despite those similar abnormalities between mPTENKO(14) and mPTENKO(0) microglia in adult animals, mPTENKO(14) mice performed normally in novel object recognition and social interaction tests (Figures 4D, G). Further transcriptome analysis showed that the number of differentially expressed genes between mPTENKO(14) and mPTENWT(14) microglia in young adult mice was greatly reduced, compared to that observed between mPTENKO(0) and mPTENWT(0) microglia (1411 vs 1831, Table S3). Fewer lysosome genes were upregulated in mPTENKO(14) microglia as compared to those upregulated in mPTENKO(0) microglia (Figure S4C, Figure 2J). GSEA analysis indicates that genes differentially expressed between mPTENKO(14) and mPTENWT(14) microglia were no longer enriched with KEGG pathways implicated in AD and PD, although those implicated in oxidative phosphorylation were still enriched (Figure S4D). Consistently, the number of enriched KEGG pathways was dramatically decreased compared to that enriched in mPTEN(0) mice, although lysosome pathway was still enriched (Figure S4E). Most DAM signature genes and mitochondria-related genes that were upregulated in mPTENKO(0) microglia were not differentially expressed in mPTENKO(14) microglia (Figures S4F, G).
Taken together, these data indicate that the first 2 weeks are the most critical period during which PTEN in microglia must be intact in order to safeguard brain circuit development underlying normal sociability.
Impaired neurodevelopment in mPTENKO(0) mice
Because synapses and circuit connections are often altered in ASD (53–55), we further examined synaptic changes as a result of microglial PTEN deletion. We prepared synaptosomes from 2-3-month cerebral cortex and probed different presynaptic and postsynaptic components by Western blotting. A significant reduction in presynaptic VGLUT1 and synaptophysin was observed in mPTENKO(0) as compared to control synaptosomes, whereas postsynaptic protein PSD95, the NMDA receptor subunit GluN2B, and Gephyrin were not appreciably altered (Figures 5A, B). By immunostaining of tissue sections, we found that the density of VGLUT1 puncta was significantly reduced in deep layers of somatosensory and auditory cortices in P14 mPTENKO(0) mice (Figures 5C, D). Excitatory synapses, as identified by colocalized VGLUT1 and PSD95 staining, showed a significantly reduced density in these mutant mice (Figures 5E, F). To investigate whether the reduction of presynaptic VGLUT1 correlates with more phagocytic microglia at P14, we examined VGLUT1 staining together with Iba-1 and CD68. As shown in Figures 5G-K, Iba-1+ microglia in P14 mPTENKO(0) L5 contained more VGLUT1 puncta within CD68+ vesicles. These data strongly suggest that mutant microglia has already been more actively removing VGLUT1-containing pre-synapses in the early developmental stage.
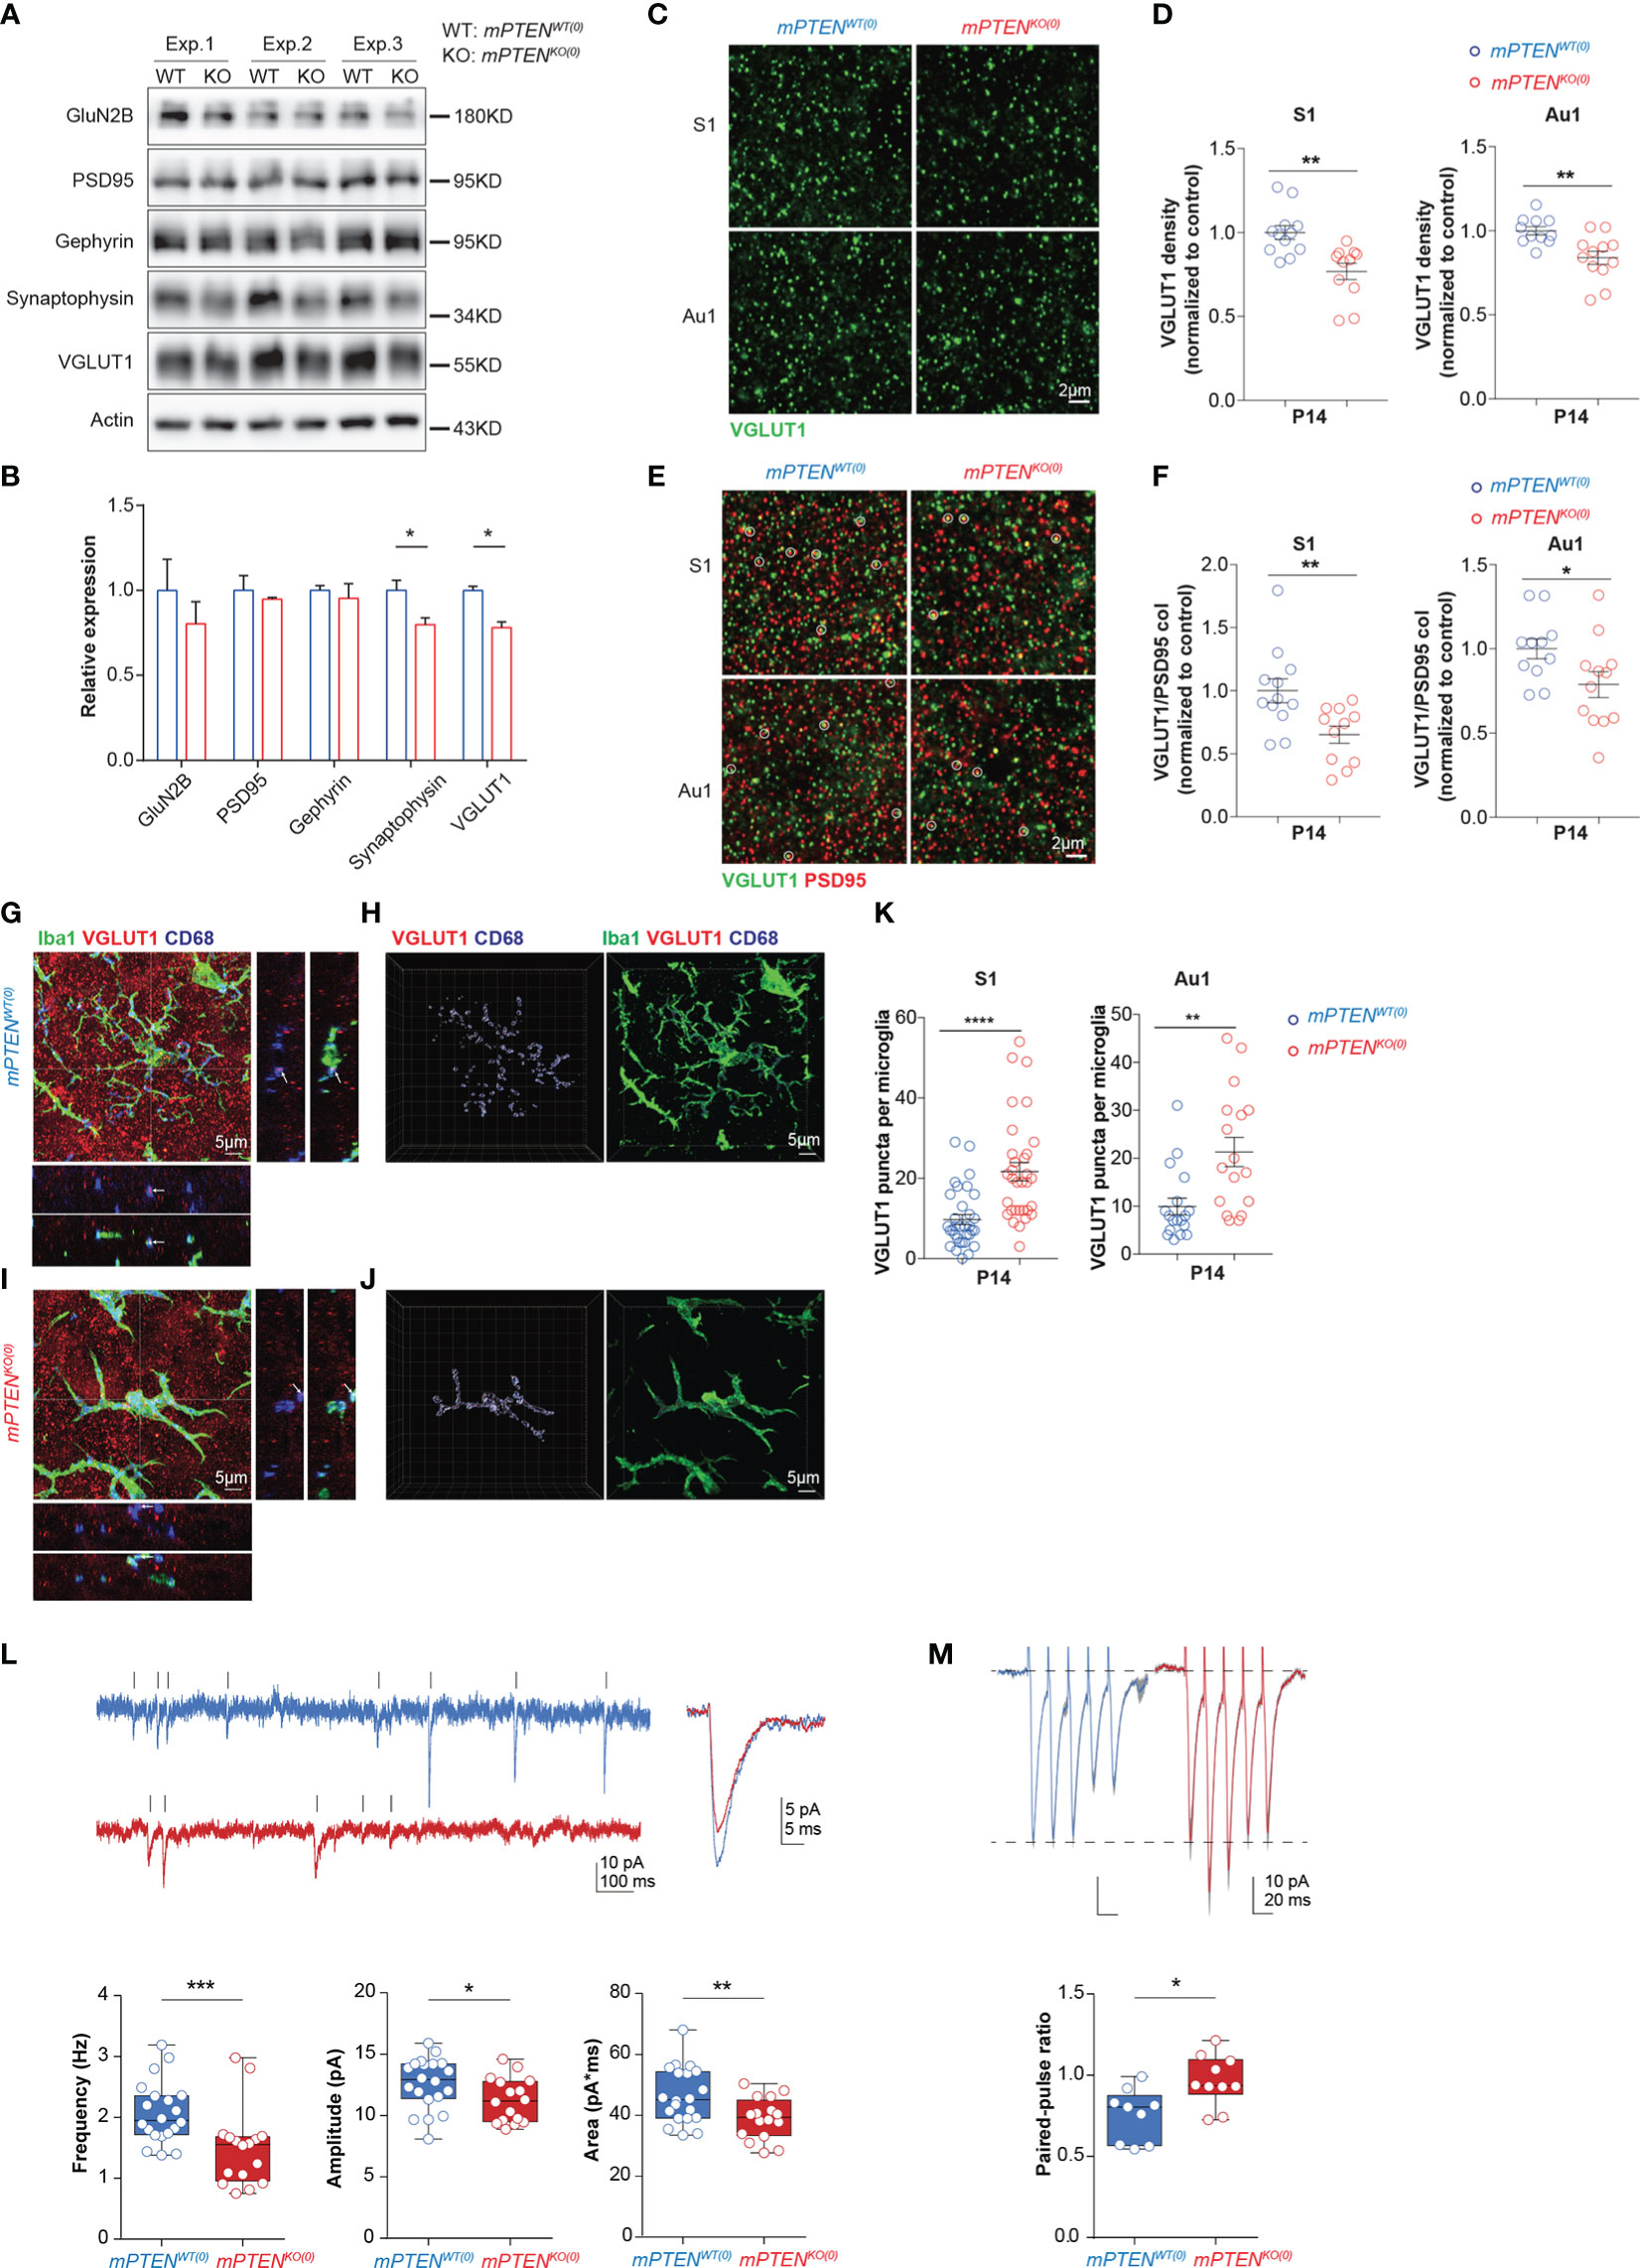
Figure 5 Defects of mPTENKO(0) mice at P14. (A, B) Western blotting of presynaptic proteins (VGLUT1, synaptophysin), postsynaptic proteins (PSD95, GluN2B), and inhibitory synaptic protein Gephyrin in 2-3-month cortex (A) and actin-normalized expression levels (B). Bar graphs show mean±s.e.m. of the three (Exp. #1, #2, #3) experiments. *P < 0.05 by unpaired t test. (C, D) Representative images of VGLUT1 staining of the S1 and Au1 cortex (C), and scatter plots showing densities of VGLUT1 puncta in S1 and Au1 cortex (D). (E, F) Representative images of VGLUT1 and PSD95 staining of the S1 and Au1 cortex, with VGLUT1/PSD95 co-localized puncta highlighted with circles (E), and scatter plots showing densities of VGLUT1/PSD95 puncta in the S1 and Au1 cortex (F). Data were collected from 3 mice per genotype (for each mouse, 5 fields in S1 and 5 fields in Au1 cortex). Each symbol is one field, and lines denote mean ± s.e.m. *P<0.05, **P<0.01, by unpaired t tests. (G-J) Maximum intensity projection image of an mPTENWT(0) (G) or mPTENKO(0) (I) Iba-1+ (green) microglia that contains VGLUT1+ (red) puncta within CD68+ vesicles (blue). XZ and YZ views show localization of VGLUT1 puncta within CD68 vesicles at crossing points highlighted in projection images. 3-D views of the images in (G, I) are shown in (H, J), respectively, with VGLUT1, CD68 and Iba-1 staining rendered as iso-surfaces in Imaris. (K) Numbers of VGLUT1 puncta per microglia in S1 (left) and Au1 (right) cortex. Each symbol in scatter plots represents one 3-D reconstructed microglia, and lines denote mean ± s.e.m. Data were collected from 3 P14 mice of each genotype, each contributing 5-6 randomly chosen microglia in the S1 and Au1 cortex, respectively. **P < 0.01, ****P < 0.0001, by unpaired t tests. (L) Example recordings of mEPSCs of L5 pyramidal neurons from P14-16 mPTENWT(0) and mPTENKO(0) brain slices, and the average mEPSC amplitude, frequency and area (mPTENWT(0): n=20, 3 mice; mPTENKO(0): n=16, 3 mice). Mann-Whitney tests for amplitude and area, unpaired t test for frequency. (M) Examples of evoked EPSCs and quantification of the paired-pulse ratio of the evoked EPSCs (mPTENWT(0): n=9, 3 mice; mPTENKO(0): n=10, 3 mice); unpaired t test. *P < 0.05, **P < 0.01, ***P < 0.001.
Given perturbed microglia-synapse interactions observed (mostly L5), we explored early-life functional changes of neurons by electrophysiology. Disrupted intrahemispheric and intracortical functional connectivity are implicated in abnormal social behaviors (56), and L5 pyramidal neurons account for the largest fraction of intracortical output (57). Degraded auditory information processing and transfer would impair speech recognition and communication in human (58, 59). We therefore conducted in vitro recordings from L5 pyramidal neurons in the auditory cortex. Consistent with the decrease of VGLUT1 contents and reduction of excitatory synapses in mPTENKO(0) cortex, whole-cell patch clamp recordings from L5 pyramidal neurons in acute slices revealed markedly reduced frequency, amplitude and area of miniature excitatory postsynaptic currents (mEPSC) in L5 pyramidal neurons in P14 auditory cortex (Figure 5L). Furthermore, paired-pulse ratios were significantly increased in mPTENKO(0) L5 pyramidal cells (Figure 5M), suggesting a decrease in release probability of glutamate vesicles from presynaptic terminals. Because levels of postsynaptic AMPA receptor GluA1 and GluA2 subunits showed no difference in synaptosomes of P14 mPTENKO(0) and mPTENWT(0) mice (data not shown), the decreased mEPSC amplitude potentially results from reduced quantal size (i.e. less glutamate in presynaptic vesicles) due to the reduced level of VGLUT1 expression (60).
These data support the possibility that defects introduced during the critical period of postnatal neurodevelopment underlie behavioral abnormalities later in life.
Normal neuronal properties in young adult mPTENKO(14) mice
Consistent with normalized social behaviors of mPTENKO(14) mice, synaptosomes from the mPTENKO(14) cerebral cortex contained normal amounts of all presynaptic and postsynaptic proteins tested, including VGLUT1 (Figures S5A, B). mPTENKO(14) cortices in young adult mice had a similar level of VGLUT1 puncta (Figures S5C, D), and the density of VGLUT1+PSD95+ synapses was no longer reduced (Figures S5E, F). Therefore, when postponed beyond 2 weeks after birth, PTEN deletion in microglia does not cause neuronal and behavioral abnormalities as seen with earlier deletion.
Discussion
Microglia play an important role in synaptic pruning for normal brain development (50). In the well-studied climbing fiber of the cerebellum and the dorsal lateral geniculate nucleus of the visual system, critical pruning takes place during the early postnatal period in rats and mice (61–63). During this critical period of neurodevelopment, microglia remove weaker presynaptic inputs in the dorsolateral geniculate nucleus in a complement-dependent manner (7). Our study demonstrates that microglia-specific Pten deletion, when induced immediately after birth but not after two weeks, causes profound defects in neuronal development and functions, leading to abnormal social behaviors later in life. The most likely explanation for this narrow window of effect is that certain circuits underlying social behaviors are abnormally sculpted by mutant microglia in the first 2 weeks or so after birth. Indeed, without PTEN, microglia become intrinsically more phagocytic, express more C1q components, and expand much more during the first 2 weeks postnatally. These effects in combination cause inappropriately exaggerated removal of synapses. Beyond 2 weeks after birth, even though PTEN deletion still causes increased phagocytosis and complement expression by microglia, circuits critical for social behaviors are likely already established and could not be fundamentally altered. Given the complexity of social behaviors, it is at present difficult to pinpoint particular circuitries that are being altered by mutant microglia. It is tempting to speculate that, as circuits are being established during the critical period of neurodevelopment, abnormally pruned connections have a propagating negative impact on subsequent circuit formation in a feedforward manner. Behaviors that depend on complex circuitries are probably vulnerable to abnormal pruning during the critical period. Given the well-documented implications of PTEN de novo mutations in human ASD (26–30), microglial abnormalities caused by an intrinsic lack of PTEN regulation of phagocytosis and cell expansion could be one contributing factor for the ASD pathogenesis.
Mice carrying germline loss-of-function alleles of Cx3cr1 or Trem2, two genes with microglia-restricted expression in the central nervous system, exhibit defects in sociability (10, 11). Specifically, CX3CR1 deficiency causes decreased microglia numbers within the first month of life and a transient increase in dendritic spine density between the second to third postnatal week in the hippocampus (5), leading to immature synaptic multiplicity that persists into the adulthood (10). The triggering receptor expressed on myeloid cells 2 (TREM2) is a phagocytic receptor implicated in numerous neurodegenerative disorders (64). Hippocampal microglia from TREM2-deficient mice are numerically reduced and impaired in phagocytosis, while CA1 neurons exhibit an increased spine density in 3- but not 13-week-old mice (11). In both models, functional connectivity among different brain regions is reduced (10, 11), consistent with an association between ASD and long-range functional disconnections (65, 66). An interesting contrast provided in our study is that enhanced phagocytosis by a markedly enlarged population of PTEN-deficient microglia causes a specific decrease of VGLUT1-containing excitatory synapses. These changes are evident by 2 weeks with markedly altered electrophysiological properties of L5 pyramidal neurons, underlying defective social interactions later in life.
PTEN counteracts PI3K signaling, which is required for phagocytosis and would be triggered downstream of chemokine receptors including CX3CR1. It is therefore somewhat surprising that we only observed defects in social interactions and novel object recognition but not the wider range of additional behavioral abnormalities of TREM2- or CX3CR1-deficient mice (11, 67). CX3CR1 and TREM2 likely trigger additional signaling pathways, and it is an intriguing possibility that distinct receptors and signaling processes in microglia may differentially control sculpture of different circuits in various brain regions. On the other hand, in contrast to our time-resolved, cell-specific, inducible gene perturbation strategy, CX3CR1- and TREM2-deficient models previously studied invoke genetic lesion in the germline. It is less clear how CX3CR1 and TREM2 functions in embryo and how impairment of those embryonic functions might impact on microglia-mediated pruning postnatally. We speculate that, when examined in a time- and cell type-resolved manner, other genes associated with neurodevelopmental disorders may be found to contribute to disease phenotypes also via microglia in addition to neuron-intrinsic routes. By the same token, whereas our study can pinpoint the importance of microglial PTEN-dependent functions in the first two postnatal weeks, effects of PTEN loss-of-function in embryonic microglia remain unknown, and such effects might also be relevant to aspects of ASD pathogenesis in patients carrying PTEN mutations.
Beyond implications for ASD, it is interesting to note that when PTEN is deleted immediately after birth, microglia at P14 and the young adult stage show signs of the DAM signature, which is initially defined in the context of AD and ALS (17, 18). On the other hand, when PTEN deletion is postponed for 2 weeks, the DAM signature becomes much less evident in adult microglia. This is in contrast to genes in the lysosome or oxidative phosphorylation pathways and genes encoding complement components, which are expressed at increased levels by adult microglia no matter whether PTEN is deleted earlier or late. These observations suggest that PTEN deletion per se does not intrinsically lead to a DAM signature. Instead, the disease state of the brain caused by postnatal PTEN deletion in microglia likely makes a significant and reciprocal impact on microglia to induce a DAM-like state. In the same vein, even though PTEN protein is completely lost already by P7 when the Pten gene is deleted immediately after birth, those mitochondria-related genes implicated in oxidative phosphorylation, AD and PD (Figure 2M) are not significantly changed until P14, when neuronal abnormalities are evident (Figure 5). Again, it appears that neuronal abnormalities as an external force significantly affect microglia and contribute to their altered gene expression program. Deciphering complex interactions between neurons and microglia and their reciprocal regulation is likely a key to understanding of nervous system diseases.
Materials and methods
Mice
Ptenfl/fl (Jax 006440), Cx3cr1CreER (Jax 021160), Thy1-YFP (Jax 003782) were originally purchased from the Jackson Laboratory. All mice were maintained on the C57BL/6 background, and were maintained under specific pathogen-free conditions. All mice analyzed were male mice. All animal experiments were conducted in accordance of government and Tsinghua guidelines for animal welfare and approved by Tsinghua Institution Animal Care and Use Committee.
Postnatal Pten gene ablation in microglia
To induce Pten deletion, newborn littermates derived from a Cx3cr1CreER/CreERPtenfl/+×Cx3cr1+/+Ptenfl/+ breeding scheme were given 50 μg tamoxifen in sunflower oil (Sigma) daily on P0, P1 and P2 (68). Those of the desired Cx3cr1CreER/+Ptenfl/fl and Cx3cr1CreER/+Pten+/+ genotypes were subsequently used as mPTENKO(0) and mPTENWT(0), respectively. For more delayed postnatal Pten deletion, littermates derived from the same breeding scheme were given two doses of 50 mg/kg body weight by gavage on P12 and P14 to produce mPTENWT(14) and mPTENKO(14) mice.
Behavioral analyses
Young adult male mice of 2 to 3 months of age were used for all behavioral tests.
The marble-burying test
The marble-burying test was performed in novel cages (390×200×172 cm) containing 5 cm-thick fresh bedding materials. Twenty glass marbles (16 mm in diameter) were arranged evenly on the surface of the bedding in a 4×5 format. Each mouse was allowed to freely explore for 30 min before the number of buried marbles was counted, which were those with at least two thirds covered with beddings.
The open-field test
The open-field test was performed in an open arena (40×40×40 cm). Each mouse was allowed to freely explore for 10 min. Mouse movement was recorded by a video camera and analyzed by Any-maze software. Occasionally, some animals did not attempt to explore at all and were excluded from analysis. The basal locomotor activity was evaluated by the total distance traveled, and the anxiety level was evaluated by the total time immobile, total time spent in the center area (20×20 cm), and the number of fecal boli left during the test.
The novel object recognition test
The novel object recognition test was performed in an open arena (40×40×40 cm). Individual mice were habituated to the arena for 10 min. Twenty-four hours after the habituation, individual mice were allowed to explore the arena with two identical objects for 10 min (training phase); 30 min later, the mice were reintroduced into the arena for 10 min with one of the objects replaced with a novel one (test phase). Mice were considered to explore the object when reaching within 3 cm to the object. Exploration time was calculated by the Any-maze software.
The social interaction test
The social interaction test was performed in a three-chamber apparatus (60×45×25 cm). Mice were individually habituated to the chamber for 10 min. Twenty-four hours after the habituation, test mice were individually placed back into the middle chamber, while each of the side chambers contains a plastic cage, one empty and one housing an unfamiliar mouse of the same sex; interactions were analyzed for 10 min, and interaction time (within 3 cm to either cage) was calculated by the Anymaze software. Thirty minutes later, mice were reintroduced into the chamber for 10 min, with one cage housing the previously encountered mouse and the other housing a stranger mouse, and interaction analysis was repeated. Occasionally, some animals did not attempt to explore any chamber in the two tests above and were excluded from analysis.
Isolation and flow cytometry analysis of microglia
Mice were anesthetized and transcardiacally perfused with PBS, the brains were quickly removed and the cortex were isolated in ice-cold HBSS (Gibico). The cortex was homogenized with the Kimble Dounce tissue grinder and then subjected to centrifugation through 30%/70% discontinuous Percoll (GE) gradient. The microglia-enriched fraction at the interface was washed with ice-cold PBS and then resuspended in the MACS buffer (PBS supplemented with 1% FBS and 5mM EDTA) for subsequent procedures. The cells were blocked for 10 min with Fc-blocker (Clone 2.4G2: 20 μg/ml; BioXcell), and then were incubated with the following antibodies for 30 min on ice: PerCPcy5.5 anti-CD45 (104), PE anti-CD86 (GL-1) from Biolegend, PE-Cy7 anti-CD11b (M1/70) from BD Biosciences, eFluor 450 anti-F4/80 (BM8) from eBioscience, rabbit anti-Tmem119 (106-6) from Abcam. For Tmem119, cells were washed and further stained with the secondary antibody AF647 anti-rabbit IgG (catalog: A21245) for 30 min. For intracellular staining of PTEN (138G6, CST) and PE anti-CD68 (eBioscience), the CytoFix/Perm Kit (BD Biosciences) was used according to the manufacture’s protocol. All cytometric data were collected on a LSRII or an Aria III cytometer (BD Biosciences) and were analyzed with FlowJo software (TreeStar). Dead cells were excluded from analysis according to the 7-AAD (Biotium) staining, for intracellular staining zombie yellow (Biolegend) was used to label dead cells.
RNA-seq analysis of microglia
The library was prepared based on the modified smart-seq2 protocol with modifications to sort 1000 cells instead of single cell. For each group, cerebral cortex isolated from 2-3 male mice were pooled together, microglia were sorted on an Aria III cytometer (BD Biosciences) as 7-AAD-CD45+CD11b+ GFP+ cells, 1000 microglia were sorted directly into a 0.2-ml PCR tube containing 6 μl lysis buffer. After that, RNA was reverse transcribed into cDNAs, which were subjected to PCR amplification for 14 cycles. The libraries were sequenced by Illumina HiSeq X Ten System. Sequencing data were mapped to Gencode M20 using Salmon (version 0.8.1) (69) and gene expression matrix was processed using the DESeq2 (version 1.22.2) (70) and visualized by showing the first 3 dimensions calculated by plotPCA function. All differential expression analyses were performed by DESeq2 according to the software manual. The standard KEGG pathway genesets are publicly available at https://www.genome.jp/kegg/pathway.html. Gene Set Enrichment Analysis (GSEA) was performed using GSEA_4.2.1 software. The KEGG gene set from MSigDB database was chosen as the reference gene set. Pathways with FDR < 0.05 and p < 0.05 were identified as significant. Bubble plots were generated in R (https://www.r-project.org) using the ‘ggplot’ function in the ggplot2 package. The differentially expressed genes with Log2FoldChange (mPTENKO/mPTENWT) and P-Value were used as inputs. The color bar represents Log2FoldChange (mPTENKO/mPTENWT) values and the size of each dot represents the P-Value. KEGG pathways of upregulated differentially expressed genes were enriched by using DAVID.
Immunostaining and morphological analyses of microglia
Brains were removed from mice that were sequentially perfused with PBS and 4% paraformaldehyde, post-fixed overnight, dehydrated in 30% sucrose and embedded in OCT (Sakura). Cryosections (40 μm) were blocked in the staining buffer (PBS containing 5% serum and 0.3% Triton-X) for 2 hrs at room temperature, and incubated with primary antibodies diluted in the same buffer overnight at 4°C. Sections were washed and further stained with the secondary antibody in the dark for 2 hrs at room temperature. The sections were counterstained with DAPI (Biotium), washed and mounted with the ProlongGold Antifade reagent (Invitrogen). Images were collected using an Olympus FV1000 upright microscope (20×) or a Nikon A1Rsi spectral confocal system and Ti-E inverted research microscope (100×). The primary antibodies included rabbit anti-Iba1 (catalog: 019-19741, Wako), goat anti-Iba1 (catalog: ab5076, Abcam), rat anti-CD68 (catalog: MCA1957, Bio-Rad), rabbit anti- VGLUT1 (catalog: 13502, Synaptic Systems), mouse anti-NeuN (catalog: MAB377, millipore), mouse anti-PSD95 (catalog: MAB1596, millipore), rabbit anti Olig2 (catalog: ab109186, Abcam), rabbit anti-S100(catalog: ab52642, Abcam), chicken anti-GFP (catalog: GFP-1010, AVES). Secondary antibodies included Alexa Fluor 488-, 555-, 647-conjugated secondary antibodies against rabbit, goat, mouse, chicken or rat IgG (Life Technologies). For 3D reconstruction, images were captured on a Nikon A1Rsi spectral confocal microscope with 100× lens at a 1024×1024 XY resolution and a 0.2-μm Z-step and analyzed with the Imaris software (Bitplane). Microglia including cellular processes were reconstructed automatically in Imaris, verified manually, and subjected to morphometric analyses by the Filament tracer module. For certain experiments, VGLUT1-positive puncta and the VGLUT1/PSD95 colocalization were quantified using the Spot module of Imaris software. Two spots are considered co-localized when the distance between centers of the two spots is less than the diameter of either spot. A spot diameter of 0.2 μm is empirically determined to be suitable for PSD95 and VGLUT1, and this is applied to automatic analyses of all samples to ensure no human bias was introduced. The inclusion of VGLUT1 in CD68+ lysosomes of microglia were analyzed using the Spot and Surface modules of Imaris software.
Synaptosome preparation
Mice were perfused with PBS. Isolated cortex pooled from 2 mice per sample were homogenized with a dounce homogenizer in 5ml 0.32M sucrose in 4mM HEPES (pH 7.4) and centrifuged at 1000 g for 10 min at 4°C to remove nuclei and debris. The supernatant was transferred to a new tube and centrifuged at 30000 g for 10 min at 4°C, the crude synaptosome pellet was resuspended in 1 ml of 0.32M sucrose and then layered on top of a discontinuous sucrose gradient (1.0 and 1.2M sucrose) and centrifuged at 120,000 g for 2 hours at 4°C. The synaptosomal fraction was isolated from the gradient interface and diluted into 0.32M sucrose and centrifuged at 200,000 g for 30 min at 4°C. The resulting synaptosomes in the pellet were resuspended in 50 mM HEPES/2mM EDTA solution. The quality of synaptosome preparation was verified by enrichment of synaptic proteins as assessed by Western blotting.
Western blotting
Proteins from isolated synaptosomes were loaded on 10% SDS-PAGE gel and then transferred to PVDF membranes, blocked in 5% nonfat milk, and incubated with primary antibodies, which included rabbit anti VGLUT1 (Synaptic Systems), mouse anti-PSD95 (Millipore), mouse anti-Gephyrin (Synaptic Systems), rabbit anti GluN2B (Synaptic Systems), rabbit anti-Synaptophysin (Abcam) overnight at 4°C. Lysates from microglia were incubated with the primary antibody rabbit anti PTEN (Cell Signaling Technology). Membranes were then incubated with HRP-conjugated secondary antibodies, and immunoblots were developed with enhanced chemiluminescence (Thermo Fisher Scientific). Images were analyzed with ImageJ software.
Ex vivo phagocytosis assay
Microglia freshly isolated from P7 mice were rested in DMEM (Thermo Fisher Scientific, Gibco) supplemented with 2% FBS for 45 min at 37°C and then incubated in the same media containing 0.2 mg/ml pHrodo Zymosan BioParticles (Life Technologies) for 1.5 h at 37°C. After incubation cells were washed and analyzed by FACS.
Electrophysiological recording
Slice preparation
Coronal slices of the auditory cortex (AC) were obtained from juvenile (P14-16) mPTENKO(0) and mPTENWT(0) mice. Mice were anesthetized with sodium pentobarbital (50 mg/kg, i.p.). After mice showed no reflex to foot pitch, juvenile mice were decapitated directly, while young adult mice were perfused with ice-cold sucrose-based ACSF (NaCl was replaced by equiosmolar sucrose, i.e., 213 mM) transcardially before decapitation. The brains were dissected out and immersed in the same solution. Slices with a thickness of 250 μm were cut in this sucrose-based solution with a vibratome (VT 1200S, LEICA). After slicing, they were immediately transferred to an incubation chamber filled with normal ACSF (see below) and maintained at 34.5°C for 30-40 minutes and then at room temperature before use. For recording, individual slices were transferred to a recording chamber perfused with normal ACSF at 34.5°C. An infrared differential interference contrast (IR-DIC) microscope (BX-51WI, Olympus) was used for visualization of individual cells in the slice. The normal ACSF contained (in mM) 126 NaCl, 2.5 KCl, 2 MgSO4, 2 CaCl2, 26 NaHCO3, 1.25 NaH2PO4 and 25 dextrose (315 mOsm, pH 7.4). To record the mEPSC, we added tetrodotoxin (TTX, 1μM) and picrotoxin (PTX, 50 μM) to the normal ACSF to block Na+-action potentials and GABAA receptor mediated inhibitory synaptic transmission, respectively. To evoke EPSCs mediated by non-NMDA receptors, we added PTX (50 μM) as well as AP-5 (50 μM, an NMDA receptor antagonist). All solutions were equilibrated with 95% O2 and 5% CO2.
In vitro whole-cell recordings
Layer 5 pyramidal cells (PCs) with apparent apical dendrites were identified through IR-DIC optics. We performed whole-cell recordings from PCs using patch pipettes with an impedance of 4-7 MΩ when filled with Cs+ internal solution containing (in mM) CsCH3SO3 138, CsCl 3, MgCl2 2, Na2ATP 2, HEPES 10, EGTA 0.2 (pH = 7.4, Osm = 289). In some experiments, biocytin (0.2%) was also added to the internal solution for post hoc staining. Voltage-clamp recordings were achieved using a MultiClamp 700B amplifier (Molecular Devices). We used Power1401-3A together with Spike2 (version 10, Cambridge Electronic Design) for data acquisition. Current signals were filtered at 10 kHz and sampled at 25 kHz. The mEPSCs were recorded at a holding potential of -70 mV. A segment of 60-second current trace after the initial 120-second recording was included for analysis. The evoked EPSCs were also recorded at -70 mV. Electrical stimulations (100 μs in duration, 5-10 μA in amplitude) were delivered to the neighboring tissue of recorded PCs at layer 5 (100 μm away) using a similar patch pipette filled with ACSF. For each cell, we obtained 15 paired EPSCs at 50 Hz. The paired-pulse stimulation was applied every 10 seconds.
All data was acquired and analyzed by experimenters blind to animal groups. To obtain properties of mEPSCs, we used Minianlaysis (Synaptosoft) to detect and analyze individual mEPSC events semi-automatically. The mEPSC threshold was set at 5 pA. A waveform with rising time and decay time constant less than 2 and 8 ms, respectively, was considered as an mEPSC event. The paired-pulse ratio was the amplitude ratio of paired EPSCs (i.e., EPSC2/EPSC1). Statistics was performed with Prism (version 6, GraphPad). To compare between groups, we obtained data from at least 8 cells from different animals (at least 3 mice). Data were presented as median together with the interquartile range (IQR) and 99% tails. For the comparison of two independent observations, unpaired Student’s t-test (two tailed) was used for data that passed the normality test; non-normal data were compared using Mann-Whitney test.
Statistics
The sample size was not statistically pre-determined but empirically estimated to be sufficient in accord with standards in the field. No randomization in our animal experiments was necessary, because only age- and sex-matched mice of different genotypes were compared. Experimenters were blinded to the mouse genotype during behavioral tests and electrophysiological recordings. Statistical analyses were performed using Graphpad Prism. Unpaired Student’s t tests were used to compare different groups unless indicated otherwise. Specifically, paired Student’s t tests were performed to analyze data collected in NORT, three-chamber tests (Figures 1C-E, Figures 4D-F) and ex vivo phagocytosis assay (Figure 3C). Mann–Whitney U-tests were performed to analyze data that show skewed distributions, including the amplitude and area of mEPSC in P14 mice (Figure 5L) collected by whole-cell recording in brain slices.
Data availability statement
The datasets presented in this have been deposited at the Genome Sequence Archive under the accession number CRA005932 and are publicly available.
Ethics statement
The animal study was reviewed and approved by Tsinghua Institution Animal Care and Use Committee.
Author contributions
HQ and KY conceptualized the study. XZ conducted a majority of the experiments and designed parts of the study. JCW conducted behavioral experiments and together with RZ Western blotting analyses. LL and ZS under the supervision of YS conducted a majority of in vitro recording. YL under the supervision of ML conducted part of in vitro recording. JY under the supervision of JBW conducted RNA-seq analysis. All authors contributed to data interpretation., HQ supervised the work together with KY, and wrote the paper with XZ and KY. All authors contributed to the article and approved the submitted version.
Funding
This work was funded in part by the Tsinghua-Peking Center for Life Sciences and Beijing Municipal Science & Technology Commission. This work was also funded in part by the Bill & Melinda Gates Foundation and the Howard Hughes Medical Institute. The findings and conclusions within are those of the authors and do not necessarily reflect positions or policies of the Bill & Melinda Gates Foundation or the Howard Hughes Medical Institute. KY receives funding from National Natural Science Foundation of China (31871057, 81527901), Beijing Municipal Science & Technology Commission (Z181100001518004, Z181100001518006), Guoqiang Institute and Center for Brain-Inspired Computing Research (CBICR), Tsinghua University. YS receives funding from National Natural Science Foundation of China (32130044, 31630029).
Conflict of interest
The authors declare that the research was conducted in the absence of any commercial or financial relationships that could be construed as a potential conflict of interest.
Publisher’s note
All claims expressed in this article are solely those of the authors and do not necessarily represent those of their affiliated organizations, or those of the publisher, the editors and the reviewers. Any product that may be evaluated in this article, or claim that may be made by its manufacturer, is not guaranteed or endorsed by the publisher.
Supplementary material
The Supplementary Material for this article can be found online at: https://www.frontiersin.org/articles/10.3389/fimmu.2022.1059364/full#supplementary-material
Supplementary Figure 1 | Validation of postnatal Pten deletion in mPTEN(0) microglia and quantitation of neuron, astrocyte, oligodendrocyte densities. (A) Histograms of intracellular PTEN staining of mPTENWT(0) and mPTENKO(0) microglia at indicated time points after birth. (B) Western blotting of PTEN protein expression in FACS-sorted microglia from mPTENWT(0) and mPTENKO(0) mice at indicated time points. In each experiment, P7 microglia of each genotype were pooled from 3-5 mice, microglia of each genotype at 2 to 3 months were pooled from 2 mice. (C, D) Co-staining for EYFP (anti-GFP) and different cell-specific markers (Iba1: microglia; S100: astrocyte; Olig2: oligodendrocyte; NeuN: neuron) in S1 (C) and Au1 (D) cortices of 2- to 3-month-old mPTENWT(0) mice. (E) Numbers of neurons, astrocytes and oligodendrocytes per field (0.4 mm2). Each dot represents a mouse (quantitated in n=3 fields per mouse), and lines denote mean±s.e.m. (N=3, 3, 3 mice).
Supplementary Figure 2 | Expression of C1q protein in cortex. (A) Representative images of C1q staining in the somatosensory cortex of mPTENWT(0) and mPTENKO(0) 2-3-month mice. (B) Quantification of MFI of C1q signals. Each dot represents a mouse (quantitated in n=4 fields per mouse), and lines denote mean±s.e.m. (N=4, 4 mice). ** <0.01 by t test.
Supplementary Figure 3 | Gene set enrichment analysis and KEGG pathway analysis. (A-C) Enrichment plots of indicated gene sets in genes differentially expressed between mPTENWT(0) and mPTENKO(0) mice at P7 (A), P14 (B), and 2 to 3 months after birth (C). ES, enrichment score; NES, normalized enrichment score; FDR, false discovery rate. (D) KEGG pathway enrichment analysis of the upregulated DEGs from P7, P14 and 2 to 3 months mPTENKO(0) microglia compared to the age matched mPTENWT(0) control. (FDR<0.05 & Padj<0.05)
Supplementary Figure 4 | Transcriptome analysis of mPTEN(14) microglia. (A) Transcriptomic PCA analyses of sort-purified cortical microglia from mPTEN(14) mice of 2 to 3 months of age, together with mPTEN(0) mice at P7, P14 and 2-3 months (data in Fig 2). (B) A bubble plot showing differential expression (or lack of it) of complement genes. Bubble color, Log2FC=Log2(mPTENKO(0)/mPTENWT(0)); bubble size, levels of statistical significance defined by P values; a dash indicates no significant difference observed. (C) A bubble plot showing differential expression (or lack of it) of indicated lysosome-related genes, formatted as in (B, D) GSEA, showing enrichment of the oxidative phosphorylation pathway in those genes upregulated in mPTENKO(14). (E) KEGG pathway enrichment analysis of the upregulated DEGs from 2 to 3 months mPTENKO(14) microglia compared to the age matched mPTENWT(14) control. (FDR<0.05 & Padj<0.05). (F) A bubble plot showing differential expression (or lack of it) of indicated DAM signature genes, formatted as in (B, G) A bubble plot showing differential expression (or lack of it) of indicated mitochondria-related genes, formatted as in (B).
Supplementary Figure 5 | Neuronal analysis of mPTEN(14) mice. (A, B) Western blotting of presynaptic proteins (VGLUT1, synaptophysin), postsynaptic proteins (PSD95, GluN2B), and inhibitory synaptic protein Gephyrin in the 2-to-3-month cortex of mPTENWT(14) and mPTENKO(14) mice (A) and quantification of their actin-normalized expression levels (B). Bar graphs show mean±s.e.m. of the three (Exp. #1, #2, #3) experiments. (C, D) Representative images of VGLUT1 staining of the S1 and Au1 cortex of mPTENWT(14) and mPTENKO(14) mice (C), and scatter plots showing densities of VGLUT1 puncta in S1 and Au1 cortex (D). (E, F) Representative images of VGLUT1 and PSD95 staining of the S1 and Au1 cortex of mPTENWT(14) and mPTENKO(14) mice, with VGLUT1/PSD95 co-localized puncta highlighted with circles (E), and scatter plots showing densities of VGLUT1/PSD95 puncta in the S1 and Au1 mPTEN(14) cortex (F). Data were collected from 3 mice of 2-3 months of age per genotype, 5 fields of S1 and 5 fields of Au1 cortex per mouse. Each symbol is one field, and lines denote mean ± s.e.m.
Supplementary Table 1 | The differentially expressed genes between mPTENWT(0) and mPTENKO(0) microglia isolated from P7, P14 and 2-3 month mice.
Supplementary Table 2 | List of genes belonging to KEGG pathways including oxidative phosphorylation, AD and PD.
Supplementary Table 3 | The differentially expressed genes between mPTENWT(14) and mPTENKO(14) microglia isolated from 2-3 month mice.
References
1. Ginhoux F, Greter M, Leboeuf M, Nandi S, See P, Gokhan S, et al. Fate mapping analysis reveals that adult microglia derive from primitive macrophages. Science (2010) 330(6005):841–5. doi: 10.1126/science.1194637
2. Huang Y, Xu Z, Xiong S, Sun F, Qin G, Hu G, et al. Repopulated microglia are solely derived from the proliferation of residual microglia after acute depletion. Nat Neurosci (2018) 21(4):530–40. doi: 10.1038/s41593-018-0090-8
3. Li Q, Barres BA. Microglia and macrophages in brain homeostasis and disease. Nat Rev Immunol (2017) 18(4):225–42. doi: 10.1038/nri.2017.125
4. Schulz C, Perdiguero E, Chorro L, Szabo-Rogers H, Cagnard N, Kierdorf K, et al. A lineage of myeloid cells independent of myb and hematopoietic stem cells. Science (2012) 336(6077):86–90. doi: 10.1126/science.1219179
5. Paolicelli RC, Bolasco G, Pagani F, Maggi L, Scianni M, Panzanelli P, et al. Synaptic pruning by microglia is necessary for normal brain development. Sci (New York NY) (2011) 333(6048):1456–8. doi: 10.1126/science.1202529
6. Tremblay M-ÈÈ, Lowery RL, Majewska AK. Microglial interactions with synapses are modulated by visual experience. PloS Biol (2010) 8(11):e1000527. doi: 10.1371/journal.pbio.1000527
7. Schafer DP, Lehrman EK, Kautzman AG, Koyama R, Mardinly AR, Yamasaki R, et al. Microglia sculpt postnatal neural circuits in an activity and complement-dependent manner. Neuron (2012) 74(4):691–705. doi: 10.1016/j.neuron.2012.03.026
8. Paolicelli R, Bisht K, Tremblay M-È. Fractalkine regulation of microglial physiology and consequences on the brain and behavior. Front Cell Neurosci (2014) 8:129. doi: 10.3389/fncel.2014.00129
9. Hoshiko M, Arnoux I, Avignone E, Yamamoto N, Audinat E. Deficiency of the microglial receptor CX3CR1 impairs postnatal functional development of thalamocortical synapses in the barrel cortex. J Neurosci (2012) 32(43):15106–11. doi: 10.1523/JNEUROSCI.1167-12.2012
10. Zhan Y, Paolicelli RC, Sforazzini F, Weinhard L, Bolasco G, Pagani F, et al. Deficient neuron-microglia signaling results in impaired functional brain connectivity and social behavior. Nat Neurosci (2014) 17(3):400–6. doi: 10.1038/nn.3641
11. Filipello F, Morini R, Corradini I, Zerbi V, Canzi A, Michalski B, et al. The microglial innate immune receptor TREM2 is required for synapse elimination and normal brain connectivity. Immunity (2018) 48(5):979–91.e8. doi: 10.1016/j.immuni.2018.04.016
12. Butovsky O, Weiner HL. Microglial signatures and their role in health and disease. Nat Rev Neurosci (2018) 19(10):622–35. doi: 10.1038/s41583-018-0057-5
13. Cserep C, Posfai B, Lenart N, Fekete R, Laszlo ZI, Lele Z, et al. Microglia monitor and protect neuronal function through specialized somatic purinergic junctions. Science (2020) 367(6477):528–37. doi: 10.1126/science.aax6752
14. Wang C, Yue H, Hu Z, Shen Y, Ma J, Li J, et al. Microglia mediate forgetting via complement-dependent synaptic elimination. Science (2020) 367(6478):688–94. doi: 10.1126/science.aaz2288
15. Badimon A, Strasburger HJ, Ayata P, Chen X, Nair A, Ikegami A, et al. Negative feedback control of neuronal activity by microglia. Nature (2020) 586(7829):417–23. doi: 10.1038/s41586-020-2777-8
16. Nguyen PT, Dorman LC, Pan S, Vainchtein ID, Han RT, Nakao-Inoue H, et al. Microglial remodeling of the extracellular matrix promotes synapse plasticity. Cell (2020) 182(2):388–403 e15. doi: 10.1016/j.cell.2020.05.050
17. Keren-Shaul H, Spinrad A, Weiner A, Matcovitch-Natan O, Dvir-Szternfeld R, Ulland TK, et al. A unique microglia type associated with restricting development of alzheimer's disease. Cell (2017) 169(7):1276–90 e17. doi: 10.1016/j.cell.2017.05.018
18. Krasemann S, Madore C, Cialic R, Baufeld C, Calcagno N, El Fatimy R, et al. The TREM2-APOE pathway drives the transcriptional phenotype of dysfunctional microglia in neurodegenerative diseases. Immunity (2017) 47(3):566–81 e9. doi: 10.1016/j.immuni.2017.08.008
19. Berg JM, Geschwind DH. Autism genetics: searching for specificity and convergence. Genome Biol (2012) 13(7):247. doi: 10.1186/gb-2012-13-7-247
20. Crawford DC, Acuna JM, Sherman SL. FMR1 and the fragile X syndrome: human genome epidemiology review. Genet Med (2001) 3(5):359–71. doi: 10.1097/00125817-200109000-00006
21. Hagerman R, Hoem G, Hagerman P. Fragile X and autism: Intertwined at the molecular level leading to targeted treatments. Mol Autism (2010) 1(1):12. doi: 10.1186/2040-2392-1-12
22. Amir RE, Van den Veyver IB, Wan M, Tran CQ, Francke U, Zoghbi HY. Rett syndrome is caused by mutations in X-linked MECP2, encoding methyl-CpG-binding protein 2. Nat Genet (1999) 23(2):185–8. doi: 10.1038/13810
23. Curatolo P, Moavero R, Roberto D, Graziola F. Genotype/Phenotype correlations in tuberous sclerosis complex. Semin Pediatr Neurol (2015) 22(4):259–73. doi: 10.1016/j.spen.2015.10.002
24. Winden KD, Ebrahimi-Fakhari D, Sahin M. Abnormal mTOR activation in autism. Annu Rev Neurosci (2018) 41(1):1–23. doi: 10.1146/annurev-neuro-080317-061747
25. Worby CA, Dixon JE. PTEN. Annu Rev Biochem (2014) 83(1):641–69. doi: 10.1146/annurev-biochem-082411-113907
26. Butler MG, Dasouki MJ, Zhou XP, Talebizadeh Z, Brown M, Takahashi TN, et al. Subset of individuals with autism spectrum disorders and extreme macrocephaly associated with germline PTEN tumour suppressor gene mutations. J Med Genet (2005) 42(4):318. doi: 10.1136/jmg.2004.024646
27. Buxbaum JD, Cai G, Chaste P, Nygren G, Goldsmith J, Reichert J, et al. Mutation screening of the PTEN gene in patients with autism spectrum disorders and macrocephaly. American journal of medical genetics part b. Neuropsychiatr Genet (2007) 144B(4):484–91. doi: 10.1002/ajmg.b.30493
28. Goffin A, Hoefsloot LH, Bosgoed E, Swillen A, Fryns JP. PTEN mutation in a family with cowden syndrome and autism. Am J Med Genet (2001) 105(6):521–4. doi: 10.1002/ajmg.1477
29. Kurata H, Shirai K, Saito Y, Okazaki T, Ohno K, Oguri M, et al. Neurodevelopmental disorders in children with macrocephaly: A prevalence study and PTEN gene analysis. Brain Dev (2018) 40(1):36–41. doi: 10.1016/j.braindev.2017.07.005
30. McBride KL, Varga EA, Pastore MT, Prior TW, Manickam K, Atkin JF, et al. Confirmation study of PTEN mutations among individuals with autism or developmental delays/mental retardation and macrocephaly. Autism Res (2010) 3(3):137–41. doi: 10.1002/aur.132
31. Kwon C-HH, Luikart BW, Powell CM, Zhou J, Matheny SA, Zhang W, et al. Pten regulates neuronal arborization and social interaction in mice. Neuron (2006) 50(3):377–88. doi: 10.1016/j.neuron.2006.03.023
32. Zhou J, Parada LF. PTEN signaling in autism spectrum disorders. Curr Opin Neurobiol (2012) 22(5):873–9. doi: 10.1016/j.conb.2012.05.004
33. Sarn N, Jaini R, Thacker S, Lee H, Dutta R, Eng C. Cytoplasmic-predominant pten increases microglial activation and synaptic pruning in a murine model with autism-like phenotype. Mol Psychiatry (2021) 26(5):1458–71. doi: 10.1038/s41380-020-0681-0
34. Sarn N, Thacker S, Lee H, Eng C. Germline nuclear-predominant pten murine model exhibits impaired social and perseverative behavior, microglial activation, and increased oxytocinergic activity. Mol Autism (2021) 12(1):41. doi: 10.1186/s13229-021-00448-4
35. Salter MW, Stevens B. Microglia emerge as central players in brain disease. Nat Med (2017) 23(9):1018–27. doi: 10.1038/nm.4397
36. Ben Haim L, Rowitch DH. Functional diversity of astrocytes in neural circuit regulation. Nat Rev Neurosci (2017) 18(1):31–41. doi: 10.1038/nrn.2016.159
37. Xu ZX, Kim GH, Tan JW, Riso AE, Sun Y, Xu EY, et al. Elevated protein synthesis in microglia causes autism-like synaptic and behavioral aberrations. Nat Commun (2020) 11(1):1797. doi: 10.1038/s41467-020-15530-3
38. Thomas A, Burant A, Bui N, Graham D, Yuva-Paylor LA, Paylor R. Marble burying reflects a repetitive and perseverative behavior more than novelty-induced anxiety. Psychopharmacol (Berl) (2009) 204(2):361–73. doi: 10.1007/s00213-009-1466-y
39. Grabert K, Michoel T, Karavolos MH, Clohisey S, Baillie KJ, Stevens MP, et al. Microglial brain region-dependent diversity and selective regional sensitivities to aging. Nat Neurosci (2016) 19(3):504–16. doi: 10.1038/nn.4222
40. Lenschow C, Brecht M. Barrel cortex membrane potential dynamics in social touch. Neuron (2015) 85(4):718–25. doi: 10.1016/j.neuron.2014.12.059
41. Rao RP, Mielke F, Bobrov E, Brecht M. Vocalization-whisking coordination and multisensory integration of social signals in rat auditory cortex. Elife (2014) 3:e03185. doi: 10.7554/eLife.03185
42. Erny D, Hrabe de Angelis AL, Jaitin D, Wieghofer P, Staszewski O, David E, et al. Host microbiota constantly control maturation and function of microglia in the CNS. Nat Neurosci (2015) 18(7):965–77. doi: 10.1038/nn.4030
43. Jurga AM, Paleczna M, Kuter KZ. Overview of general and discriminating markers of differential microglia phenotypes. Front Cell Neurosci (2020) 14:198. doi: 10.3389/fncel.2020.00198
44. Matcovitch-Natan O, Winter DR, Giladi A, Vargas Aguilar S, Spinrad A, Sarrazin S, et al. Microglia development follows a stepwise program to regulate brain homeostasis. Science (2016) 353(6301):aad8670. doi: 10.1126/science.aad8670
45. Butovsky O, Jedrychowski MP, Moore CS, Cialic R, Lanser AJ, Gabriely G, et al. Identification of a unique TGF-beta-dependent molecular and functional signature in microglia. Nat Neurosci (2014) 17(1):131–43. doi: 10.1038/nn.3599
46. Gautier EL, Shay T, Miller J, Greter M, Jakubzick C, Ivanov S, et al. Gene-expression profiles and transcriptional regulatory pathways that underlie the identity and diversity of mouse tissue macrophages. Nat Immunol (2012) 13(11):1118–28. doi: 10.1038/ni.2419
47. Lin MT, Beal MF. Mitochondrial dysfunction and oxidative stress in neurodegenerative diseases. Nature (2006) 443(7113):787–95. doi: 10.1038/nature05292
48. Stevens B, Allen NJ, Vazquez LE, Howell GR, Christopherson KS, Nouri N, et al. The classical complement cascade mediates CNS synapse elimination. Cell (2007) 131(6):1164–78. doi: 10.1016/j.cell.2007.10.036
49. Hong S, Dissing-Olesen L, Stevens B. New insights on the role of microglia in synaptic pruning in health and disease. Curr Opin Neurobiol (2016) 36:128–34. doi: 10.1016/j.conb.2015.12.004
50. Wilton DK, Dissing-Olesen L, Stevens B. Neuron-glia signaling in synapse elimination. Annu Rev Neurosci (2019) 42:107–27. doi: 10.1146/annurev-neuro-070918-050306
51. Gunzl P, Schabbauer G. Recent advances in the genetic analysis of PTEN and PI3K innate immune properties. Immunobiology (2008) 213(9-10):759–65. doi: 10.1016/j.imbio.2008.07.028
52. Leslie NR, Batty IH, Maccario H, Davidson L, Downes CP. Understanding PTEN regulation: PIP2, polarity and protein stability. Oncogene (2008) 27(41):5464–76. doi: 10.1038/onc.2008.243
53. Hashem S, Nisar S, Bhat AA, Yadav SK, Azeem MW, Bagga P, et al. Genetics of structural and functional brain changes in autism spectrum disorder. Transl Psychiatry (2020) 10(1):229. doi: 10.1038/s41398-020-00921-3
54. Sacai H, Sakoori K, Konno K, Nagahama K, Suzuki H, Watanabe T, et al. Autism spectrum disorder-like behavior caused by reduced excitatory synaptic transmission in pyramidal neurons of mouse prefrontal cortex. Nat Commun (2020) 11(1):5140. doi: 10.1038/s41467-020-18861-3
55. Anderson GR, Galfin T, Xu W, Aoto J, Malenka RC, Sudhof TC. Candidate autism gene screen identifies critical role for cell-adhesion molecule CASPR2 in dendritic arborization and spine development. Proc Natl Acad Sci U.S.A. (2012) 109(44):18120–5. doi: 10.1073/pnas.1216398109
56. Minshew NJ, Williams DL. The new neurobiology of autism: cortex, connectivity, and neuronal organization. Arch Neurol (2007) 64(7):945–50. doi: 10.1001/archneur.64.7.945
57. Harris JA, Mihalas S, Hirokawa KE, Whitesell JD, Choi H, Bernard A, et al. Hierarchical organization of cortical and thalamic connectivity. Nature (2019) 575(7781):195–202. doi: 10.1038/s41586-019-1716-z
58. Shannon RV, Zeng FG, Kamath V, Wygonski J, Ekelid M. Speech recognition with primarily temporal cues. Science (1995) 270(5234):303–4. doi: 10.1126/science.270.5234.303
59. Ahissar E, Nagarajan S, Ahissar M, Protopapas A, Mahncke H, Merzenich MM. Speech comprehension is correlated with temporal response patterns recorded from auditory cortex. Proc Natl Acad Sci U.S.A. (2001) 98(23):13367–72. doi: 10.1073/pnas.201400998
60. Wilson NR, Kang J, Hueske EV, Leung T, Varoqui H, Murnick JG, et al. Presynaptic regulation of quantal size by the vesicular glutamate transporter VGLUT1. J Neurosci (2005) 25(26):6221–34. doi: 10.1523/JNEUROSCI.3003-04.2005
61. Altman J. Postnatal development of the cerebellar cortex in the rat. II. phases in the maturation of purkinje cells and of the molecular layer. J Comp Neurol (1972) 145(4):399–463. doi: 10.1002/cne.901450402
62. Huberman AD, Feller MB, Chapman B. Mechanisms underlying development of visual maps and receptive fields. Annu Rev Neurosci (2008) 31:479–509. doi: 10.1146/annurev.neuro.31.060407.125533
63. Riccomagno MM, Kolodkin AL. Sculpting neural circuits by axon and dendrite pruning. Annu Rev Cell Dev Biol (2015) 31:779–805. doi: 10.1146/annurev-cellbio-100913-013038
64. Ulland TK, Colonna M. TREM2 - a key player in microglial biology and Alzheimer disease. Nat Rev Neurol (2018) 14(11):667–75. doi: 10.1038/s41582-018-0072-1
65. Courchesne E, Pierce K. Why the frontal cortex in autism might be talking only to itself: local over-connectivity but long-distance disconnection. Curr Opin Neurobiol (2005) 15(2):225–30. doi: 10.1016/j.conb.2005.03.001
66. Modi ME, Sahin M. Translational use of event-related potentials to assess circuit integrity in ASD. Nat Rev Neurol (2017) 13(3):160–70. doi: 10.1038/nrneurol.2017.15
67. Rogers JT, Morganti JM, Bachstetter AD, Hudson CE, Peters MM, Grimmig BA, et al. CX3CR1 deficiency leads to impairment of hippocampal cognitive function and synaptic plasticity. J Neurosci (2011) 31(45):16241–50. doi: 10.1523/JNEUROSCI.3667-11.2011
68. Parkhurst CN, Yang G, Ninan I, Savas JN, Yates JR 3rd, Lafaille JJ, et al. Microglia promote learning-dependent synapse formation through brain-derived neurotrophic factor. Cell (2013) 155(7):1596–609. doi: 10.1016/j.cell.2013.11.030
69. Patro R, Duggal G, Love MI, Irizarry RA, Kingsford C. Salmon provides fast and bias-aware quantification of transcript expression. Nat Methods (2017) 14(4):417–9. doi: 10.1038/nmeth.4197
Keywords: microglia, PTEN, phagocytosis, VGLUT1, autism spectrum disorders, cerebral cortex, auditory cortex, layer 5
Citation: Zhou X, Wei J, Li L, Shu Z, You L, Liu Y, Zhao R, Yao J, Wang J, Luo M, Shu Y, Yuan K and Qi H (2022) Microglial Pten safeguards postnatal integrity of the cortex and sociability. Front. Immunol. 13:1059364. doi: 10.3389/fimmu.2022.1059364
Received: 01 October 2022; Accepted: 24 November 2022;
Published: 14 December 2022.
Edited by:
Xiao-Yi Xiong, Chengdu University of Traditional Chinese Medicine, ChinaReviewed by:
Xiaokuang Ma, The University of Arizona College of Medicine – Phoenix, United StatesMin-Soo Kwon, CHA University, South Korea
Wenxin Ma, National Eye Institute (NIH), United States
Copyright © 2022 Zhou, Wei, Li, Shu, You, Liu, Zhao, Yao, Wang, Luo, Shu, Yuan and Qi. This is an open-access article distributed under the terms of the Creative Commons Attribution License (CC BY). The use, distribution or reproduction in other forums is permitted, provided the original author(s) and the copyright owner(s) are credited and that the original publication in this journal is cited, in accordance with accepted academic practice. No use, distribution or reproduction is permitted which does not comply with these terms.
*Correspondence: Hai Qi, cWloYWlAdHNpbmdodWEuZWR1LmNu; Kexin Yuan, a2V4aW55dWFuQG1haWwudHNpbmdodWEuZWR1LmNu