 Xuanyan Cai1,2Huiyan Zha1,2Zhaoxu Yang1,2Yiwen Du1,2Xiaoyang Dai1,2
 Bo Yang1,2
 Jiajia Wang1,2*
 Qiaojun He1,2,3*
 Qinjie Weng1,2,3*
- 1Center for Drug Safety Evaluation and Research, College of Pharmaceutical Sciences, Zhejiang University, Hangzhou, China
- 2Zhejiang Province Key Laboratory of Anti-Cancer Drug Research, College of Pharmaceutical Sciences, Zhejiang University, Hangzhou, China
- 3The Second Affiliated Hospital, Zhejiang University School of Medicine, Hangzhou, China
Chronic liver disease (CLD) is an extremely common clinical condition accompanied by sustained inflammatory response leading to tissue damage. Transforming growth factor-β1 (TGF-β1) is known as a master immune regulator in CLDs, but the association between TGF-β1 polymorphisms and CLD risk is controversial and inconclusive, and the genetic dominance of CLDs remains unknown. In this study, the relationship between TGF-β1 polymorphisms and CLD susceptibility is systematically analyzed based on 35 eligible studies. Individuals with the TGF-β1-509 allele (TT or CT) or codon 10 allele (Pro/Pro) show an increased risk of CLDs. Subgroup analyses indicate TGF-β1-509C/T has a significant correlation with cirrhosis and chronic hepatitis C, codon 10 is associated with chronic hepatitis B occurrence, and codon 25 exhibits a relationship with autoimmune hepatitis risk. Missense mutations in G29E, A105S, D191N, and F321L of TGF-β1 are the genetic factors of HCC susceptibility. Furthermore, the TGF-β1 gene expression is significantly elevated in CLD patients, and the TGF-β1 codon 263 is located close to the region where the TGF-β1 dimerization interacts, indicating the TGF-β1 codon 263 variant may affect the secretion of TGF-β1 by altering its dimerization. Together, our findings provide new insights into the immune regulator gene TGF-β1 polymorphisms as susceptibility factors for CLD occurrence and regulators for TGF-β1 expression, which have implications for the regulation of immune factors during CLD development.
Introduction
Chronic liver disease (CLD) is a continuous and gradual process caused by multifactorial etiologies including genetic factors. The pathogenesis of CLD is complicated and is related to sustained inflammatory response leading to tissue damage (1, 2). Chronic hepatotoxic injuries, such as hepatitis B virus (HBV) or hepatitis C virus (HCV) infections, autoimmune hepatitis (AIH), non-alcoholic steatohepatitis (NASH) and alcohol abuse, can severely impair liver functions, progressing to cirrhosis, hepatocellular carcinoma (HCC) or even liver failure (1). CLDs represent big challenges to the public health system worldwide, which account for more than 800 million individuals and approximately 2 million deaths per year in the world (1–3). Interestingly, the risk of CLDs varies from one individual to another (4–6), indicating that the host genetic factors might determine the susceptibility of CLDs.
Transforming growth factor-β1 (TGF-β1), a member of the TGF-β super-family, is regarded as a crucial immune regulator in a variety of CLDs (7). In the hepatocarcinogenic process, TGF-β1 functions as an anti-inflammatory cytokine that promotes immune surveillance escape in HCC, leading to cell migration and invasion (8–10). TGF-β also activates SMAD2/3 and cooperates with IL-21 activity to promote naïve CD4+ T cell generation of Th17 cells, contributing to NASH-associated liver inflammation and HCC (11, 12). In the pathogenesis of chronic hepatitis, TGF-β1 leads to prolonged HBV/HCV infections via increasing T regulatory lymphocyte activation and recruiting these cells to the infected livers (13–15). During fibrogenesis, TGF-β1 could be secreted by different immune cells, such as hepatic macrophages and regulatory T lymphocytes, and induce hepatic stellate cells to transform into proliferative fibrogenic myofibroblasts, synthesizing and secreting excess collagen (16–18).
Several studies have found that single-nucleotide polymorphisms (SNPs) of TGF-β1 may play important roles in CLDs. Up to now, TGF-β1-509C/T (rs1800469) and TGF-β1 codon 10 (rs1800470) polymorphisms have been reported to have a potential relationship with the susceptibility of HBV/HCV-induced cirrhosis or HCC (19–25). However, the findings are contradictory and inconclusive. Specifically, one study pointed out that patients with the TGF-β1-509 TT genotype were significantly associated with cirrhosis risk (24), while another study concluded that the TGF-β1-509C/T polymorphism had a limited role in predicting cirrhosis occurrence (21, 22). Similar controversial results were also found in HCC risk prediction (19, 20, 23, 25). In addition, although TGF-β1 genetic variation occurs in cirrhosis and HCC, two etiologies of CLDs, whether TGF-β1 polymorphisms are associated with other types of CLD risk and which polymorphisms are high genetic dominance of CLDs remain unidentified.
A series of studies found that TGF-β1 expression was significantly higher in patients with cirrhosis (26, 27), and upregulated in tumor tissues of HCC (28–30). Clinic studies showed that individuals with TGF-β1-509C/T or codon 10 displayed increased plasma concentration of TGF-β1, implying that TGF-β1 polymorphisms may regulate TGF-β1 expression in CLD patients (21, 31–33). However, how these genetic variants intervene the transcription, translation, or protein 3D structure of TGF-β1 is complicated and mysterious. The investigation between TGF-β1 genetic variants and TGF-β1 expression will have great implications for the development of CLDs.
Accordingly, we performed a systematic meta-analysis to determine the associations between SNPs of immune regulator gene TGF-β1 and CLD susceptibility. We assessed the TGF-β1 polymorphisms in diverse etiologies and identified a strong association of specific TGF-β1 gene variants with different CLD types. Furthermore, we applied bioinformatic analysis to establish TGF-β1 expression in CLDs with different etiologies and explore the potential way by which TGF-β1 polymorphisms affect its expression. Consequently, our findings reveal a previously unidentified role of TGF-β1 polymorphisms in predicting CLD susceptibility and the underlying mechanisms involved.
Materials and methods
Study selection and identification
The analysis was conducted following the Preferred Reporting Items for Systematic Reviews and Network Meta-Analyses (PRISMA) guidelines (34). We searched English-language publications in Embase, Pubmed, Web of Science, Cochrane Library, and HuGe Navigator from database inception through June 2022 that reported the TGF-β1 polymorphisms and CLDs in humans. We used various combinations of the search terms to screen for relevant studies: ((TGFB1 OR TGF beta 1 OR Transforming Growth Factor OR TGF-β) AND (single nucleotide polymorphism OR SNP OR genetic variation OR genetic polymorphism OR Polymorphism OR Variant OR Variation OR Mutation OR Genome-wide Association Study OR Genetic Association Study)) AND (Non-Alcoholic Fatty Liver Disease OR Non-Alcoholic Fatty Liver OR Non-Alcoholic Steatohepatitis OR NASH OR NAFLD). Three investigators independently selected the references and reviewed the study abstracts and full text.
The inclusion criteria were as follows: (1) studies evaluating the association between TGF-β1 polymorphisms and CLD risk, (2) studies including case and control populations, (3) the incidence of TGF-β1 polymorphisms in case and control groups, and (4) studies with sufficient available data to estimate an odds ratio (OR) with its 95% confidence interval (95% CI). OR is a precise estimate of the occurrence of a specific event. The involved studies should meet all of the above criteria. Exclude any studies with errors or inconsistent data. All potentially eligible trials were considered regardless of outcomes.
Data extraction and quality assessment
The following information was extracted for each eligible study: the name of the first author, the publication year, the country of origin, ethnicity, genotyping method, sex, disease type, sample sizes of cases and controls, and genotype number in cases and controls. In our study, we used the Newcastle-Ottawa Scale (NOS) to assess the quality (35). The NOS contains the following 3 dimensions: selection, comparability, and exposure, covered by 8 items. The overall score was nine, with higher scores indicating better quality. Studies with a score of 4-6 were deemed intermediate quality, and those with a score > 7 were deemed high quality.
Gene expression, mutation, and transcription factor analysis of TGF-β1
The TGF-β1 gene expression profiles were downloaded from the Gene Expression Omnibus (GEO) database: GSE202853 (HCC), GSE25097 (Cirrhosis), GSE38941 (CHB), GSE154055 (CHC), GSE159676 (AIH), GSE28619 (Alcohol hepatitis) and GSE48452 (NASH). Expression profiles of these datasets were reanalyzed using R and correlated packages (http://www.r-project.org/). We used cBioPortal (https://www.cbioportal.org/) to investigate the gene mutation of TGF-β1 in HCC (36). The transcription factors of TGF-β1 were downloaded from Genecard, Ominer, Promo, and TRRUST databases.
Single-cell RNA sequencing analysis
We reanalyzed the published scRNA-seq data of human liver cirrhosis from GSE136103 (37). The raw reads were aligned to the mm10 (Ensembl 84) reference genomes, utilizing an in-house pipeline of the Cell Ranger v5.0.1 Single-Cell Software Suite from 10X Genomics. Additional analysis was then executed by the “Seurat” (v4.0.0) package for R (v4.0.4) (https://www.r-project.org/). Genes expressed in fewer than three cells in a sample were excluded, as were cells that expressed fewer than 200 genes or mitochondrial gene content > 10% of the total UMI count. In addition, cells were used for further analysis if they passed an expressed gene threshold of 4000 genes. Cluster identification was based on the 50 most significant principal components. Cell type recognition was automatically annotated by the software “SingleR” (v3.15) (38). All uniform manifold approximation and projection (UMAP) visualizations and violin plots were produced using Seurat functions in conjunction with the ggplot2.
Structure modeling of TGF-β1
The crystal structure of residues between 1 and 29 was not solved by experiments, and we modeled it using the GalaxyHomomer method of GalaxyWeb (39, 40). The best model predicted by GalaxyWeb was applied for the following analysis.
Statistical analysis
The Hardy-Weinberg Equilibrium (HWE) is a useful indicator of genotype frequencies within a population and whether they are based on a valid definition of alleles and a randomly mating sample, which was measured in the controls by Pearson’s chi-square test (P < 0.05 was considered a departure from HWE). Statistical analysis was performed by RevMan 5.3 (Cochrane Community, 2014), which generated a forest plot, pooled ORs, and 95% CIs for each risk factor. We calculated the pooled ORs and 95% CIs to assess the association between TGF-β1 polymorphisms and the susceptibility to CLDs. The significance of the ORs was determined with the Z-test, which is used to infer the probability of difference with the theory of standard normal distribution, and P < 0.05 was considered statistically significant. The heterogeneity assumption was evaluated by the Cochrane I2 test and Q-statistic (Phet) (41). When the Phet > 0.1 and I2 < 50%, the fixed-effects (FE) model was adopted to calculate the pooled ORs; otherwise, the random-effects (RE) model was applied. The publication bias was assessed using funnel plots generated by RevMan 5.3. The Begg’s test (42) and Egger’s test (43) were also used to evaluate publication bias performed by Stata 15 (StataCorp 2017, Dallas, Texas, USA).
Results
Study selection and study characteristics
A total of 2,636 references were identified through Embase, Pubmed, Web of Science, Cochrane Library, and HuGe Navigator, of which 2,479 were excluded for irrelevance and duplication. After reviewing 157 articles, 88 articles did not satisfy the selection criteria, leaving 69 studies for detailed full-text evaluation. Ultimately, 35 studies were judged to meet the inclusion criteria for this meta-analysis (Figure 1).
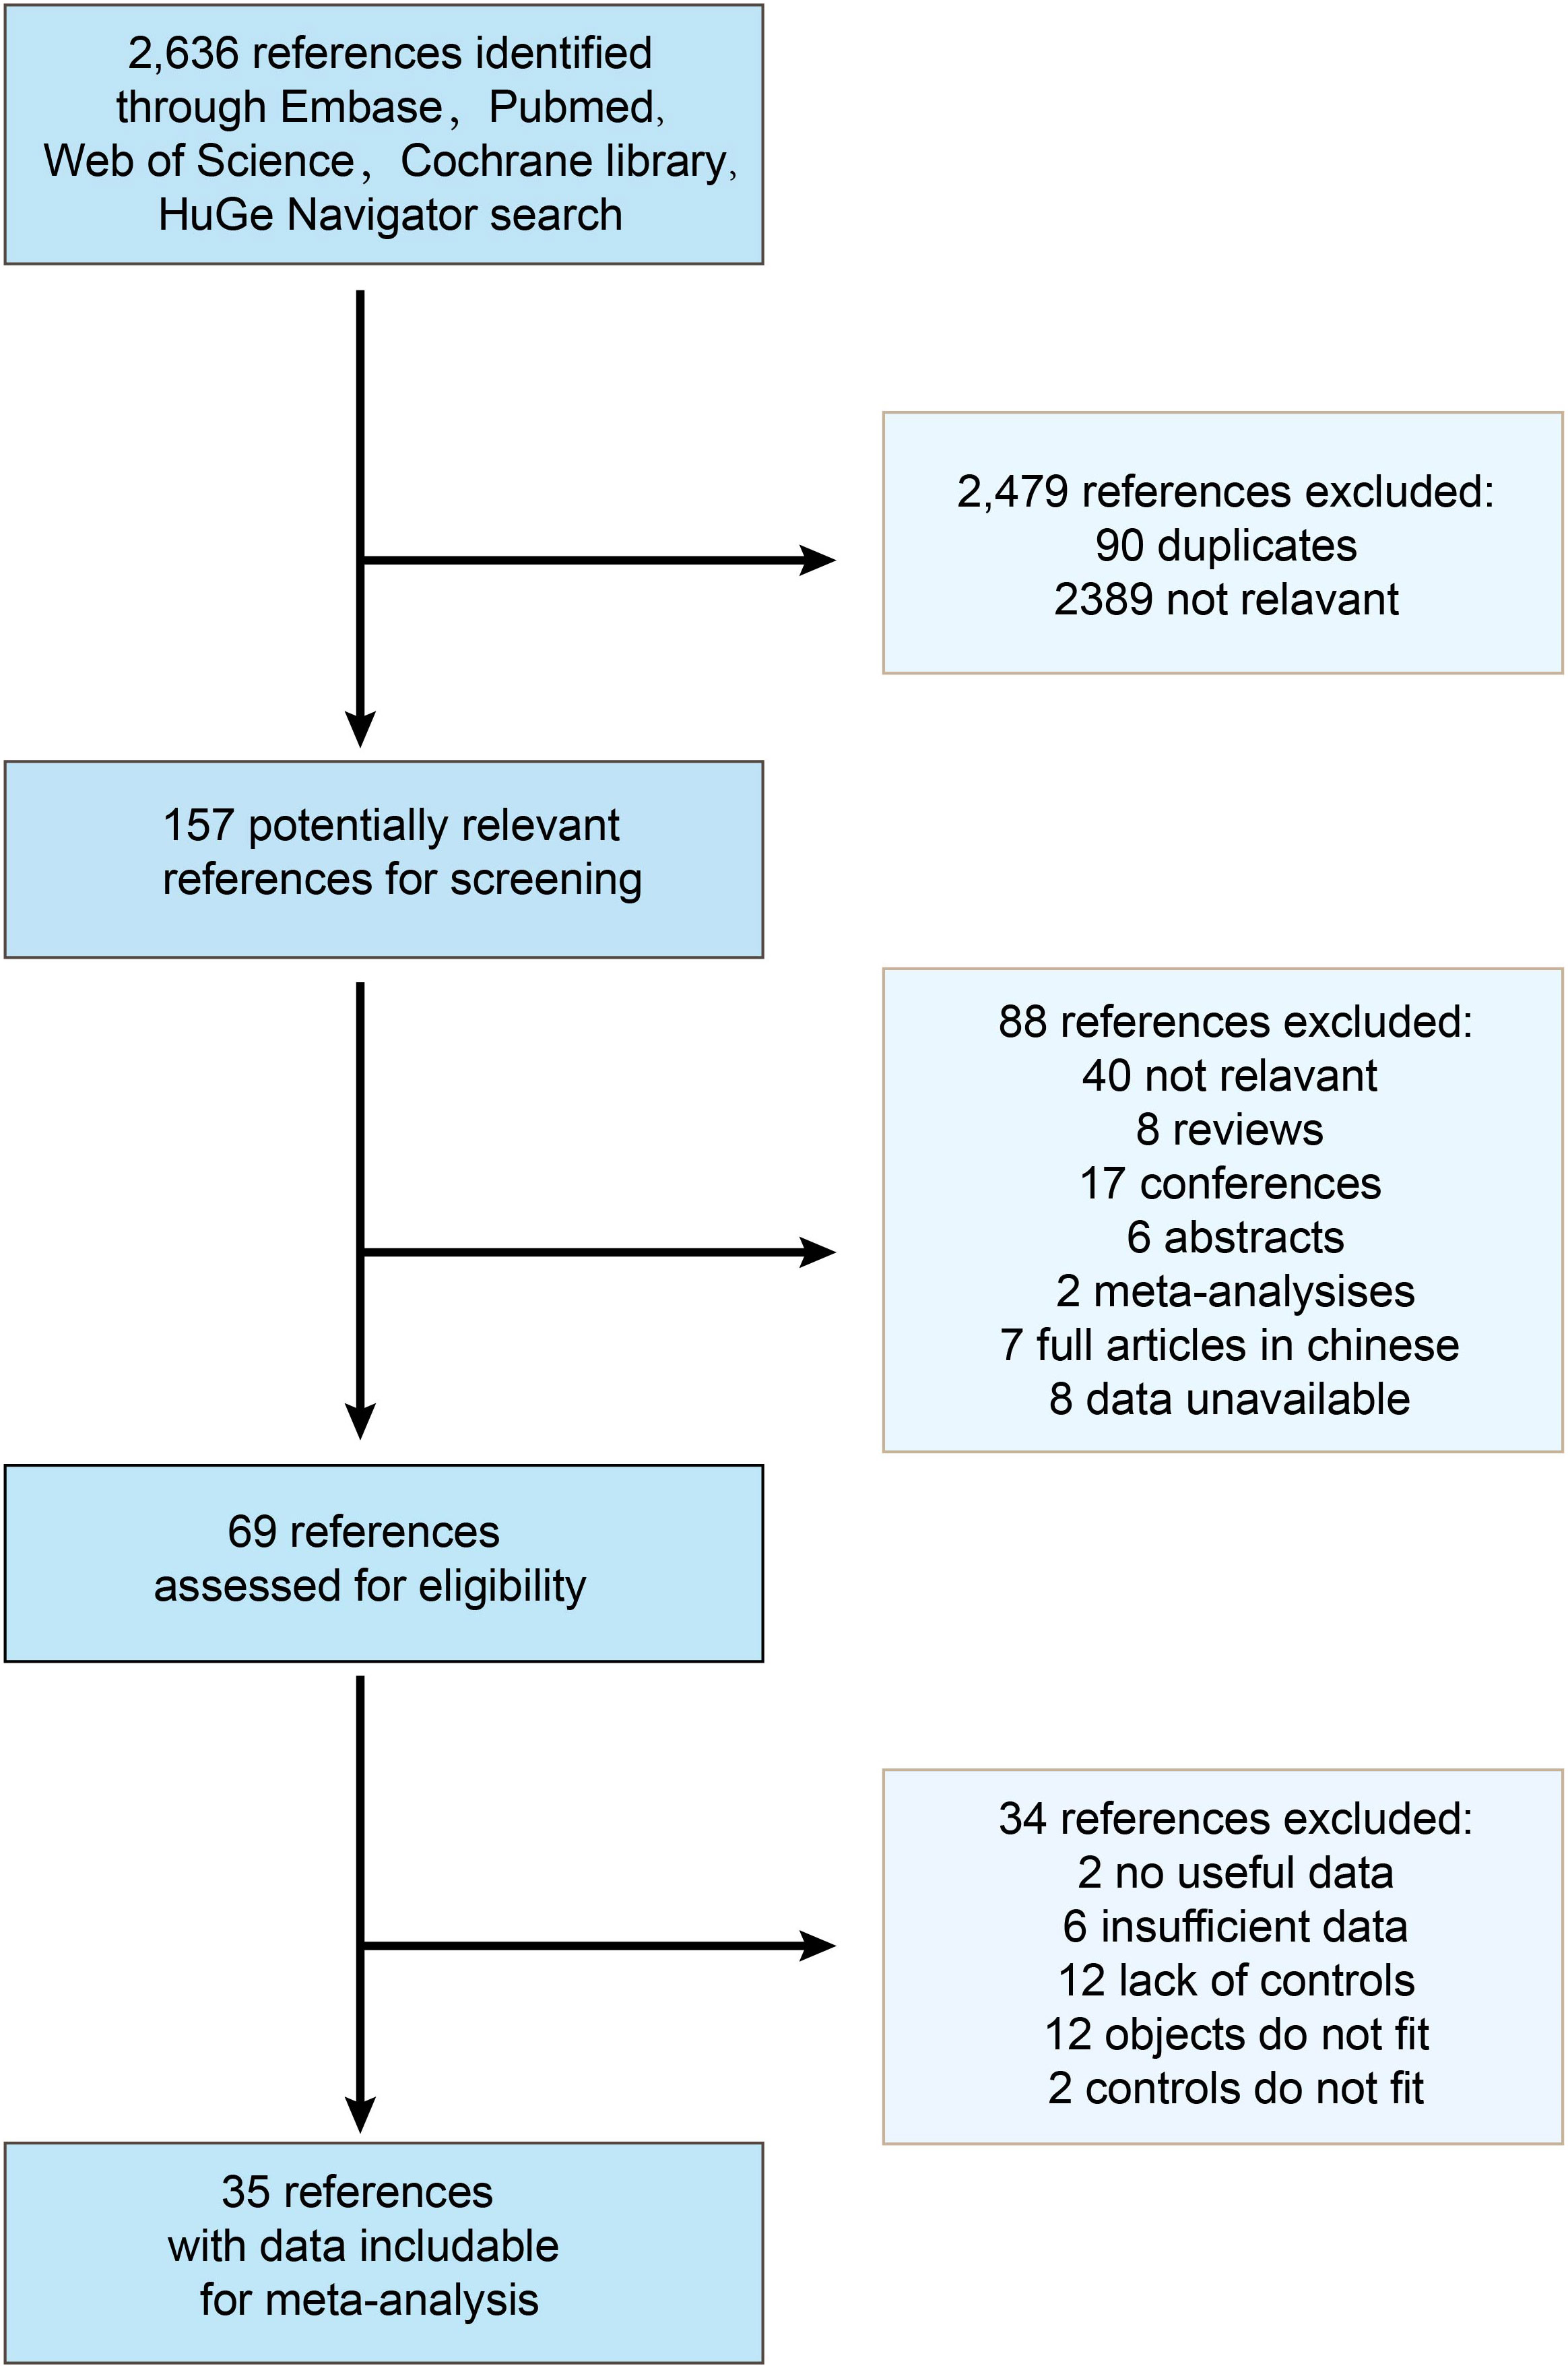
Figure 1 Flow chart of the study selection process. 35 studies were determined to be eligible for inclusion in the meta-analysis.
The eligible 35 studies included 5,225 patients with a variety of CLDs, such as HCC, cirrhosis, chronic hepatitis B (CHB), chronic hepatitis C (CHC), AIH, alcoholic liver disease (ALD), and primary biliary cirrhosis (PBC). These studies were performed in countries around the globe, including China, America, India, Brazil, Spain, Italy, Iran, Mexico, Japan, Pakistan, Turkey, and Egypt, and were mixed-sex, showing the data are comprehensive and extensive. Moreover, we assessed the quality of 35 studies based on the NOS criteria (35). All of these studies exhibited comparatively high quality with a score of more than six (Table 1).
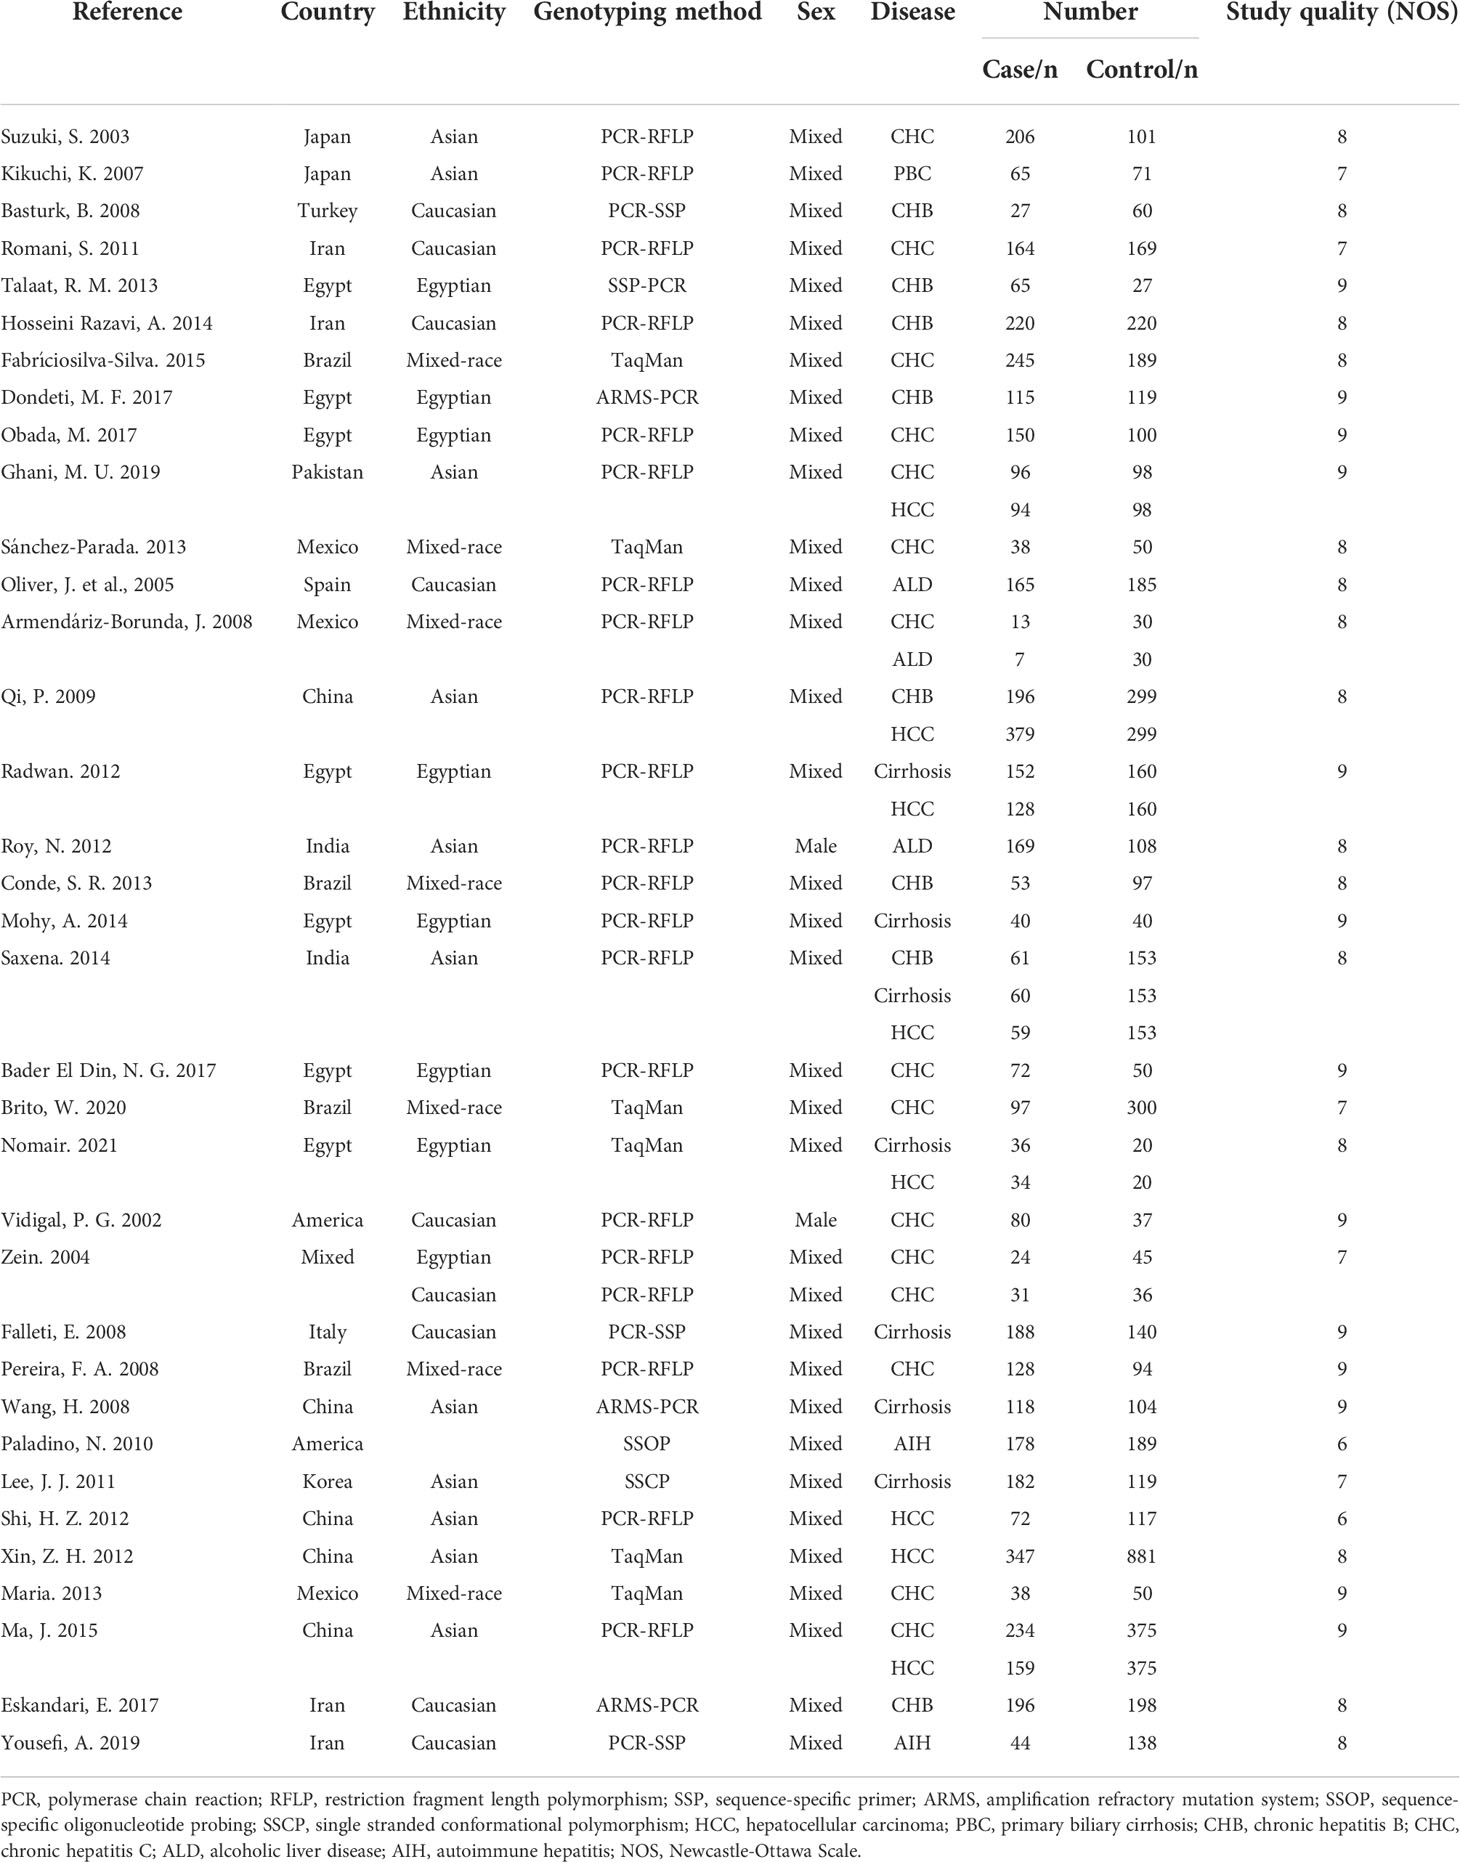
Table 1 The characteristics of included studies.
Genotype distributions of TGF-β1 polymorphisms
Five TGF-β1 polymorphisms participated in these 35 studies, including TGF-β1-509C/T (rs1800469), TGF-β1 codon 10 (rs1800470), TGF-β1 codon 25 (rs1800471), TGF-β1-800G/A (rs1800468) and TGF-β1 codon 263 (rs1800472) polymorphisms. The genotypes and allele frequencies of every TGF-β1 polymorphism distribution in the involved studies were summarized: TGF-β1-509C/T (Table 2), TGF-β1 codon 10 (Table 3), TGF-β1 codon 25 (Table 4), TGF-β1-800G/A (Table S1) and TGF-β1 codon 263 (Table S2). According to the HWE examination, genotype distributions in controls of the overwhelming majority of studies were in agreement with HWE except for several studies. Thus, studies with HWE less than 0.05 were excluded for further meta-analysis.
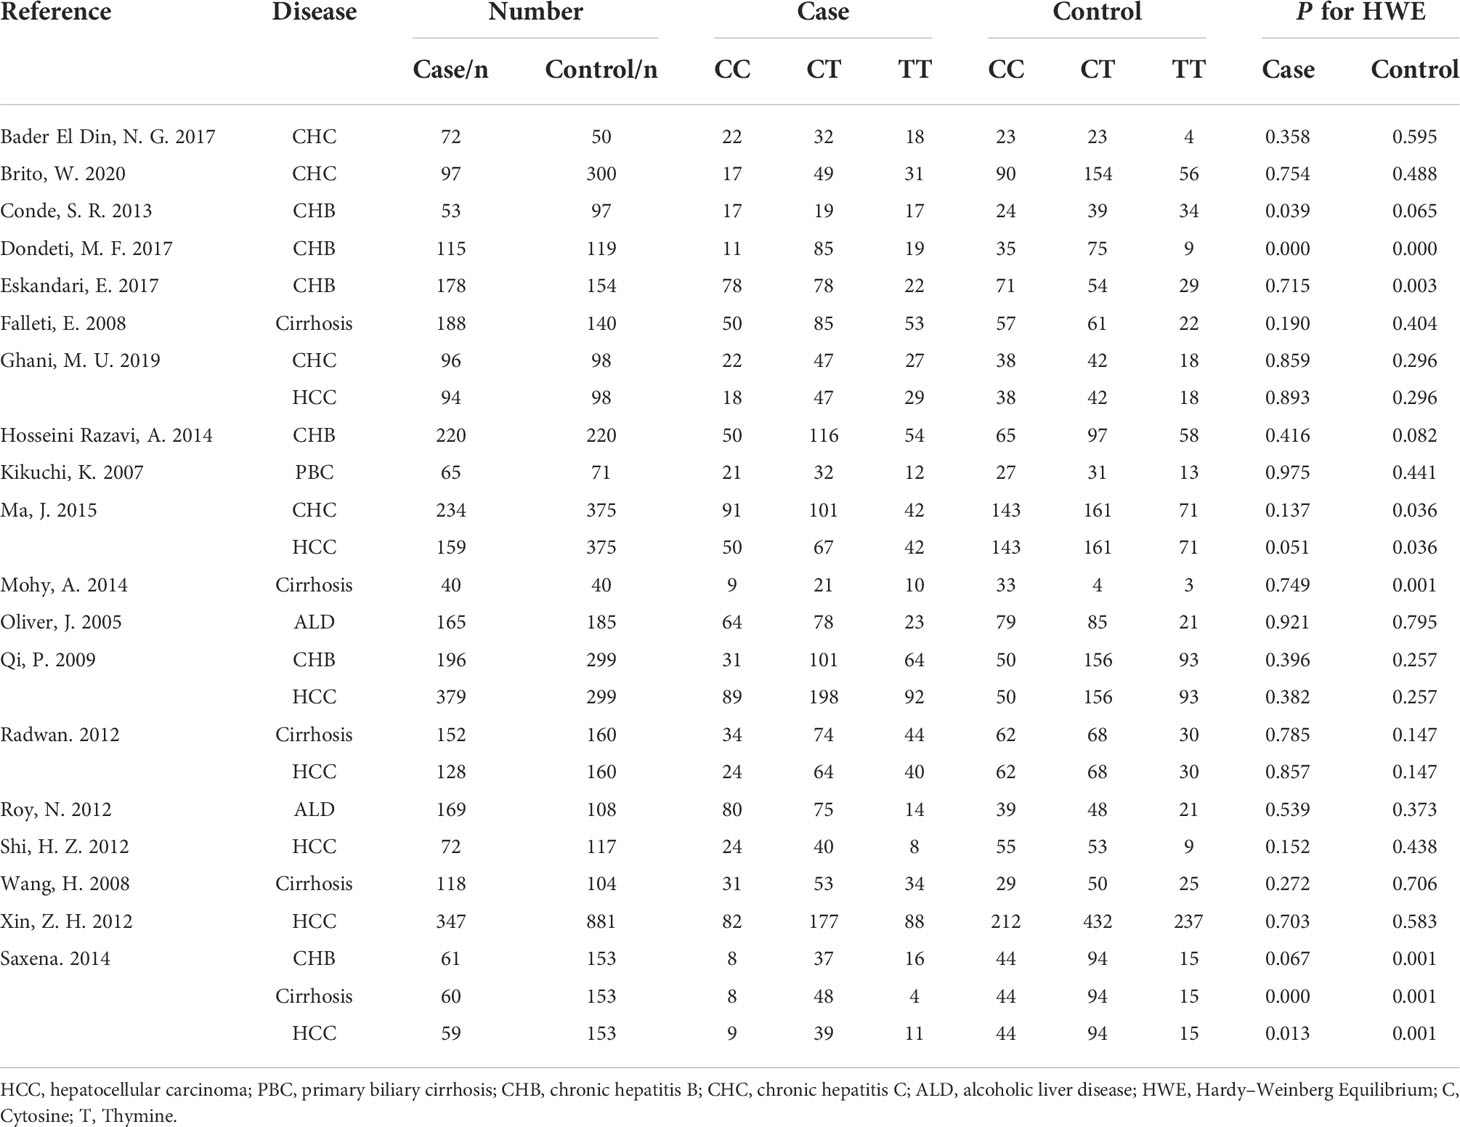
Table 2 The genotype and allele frequencies of TGF-β1-509C/T distribution of included studies.
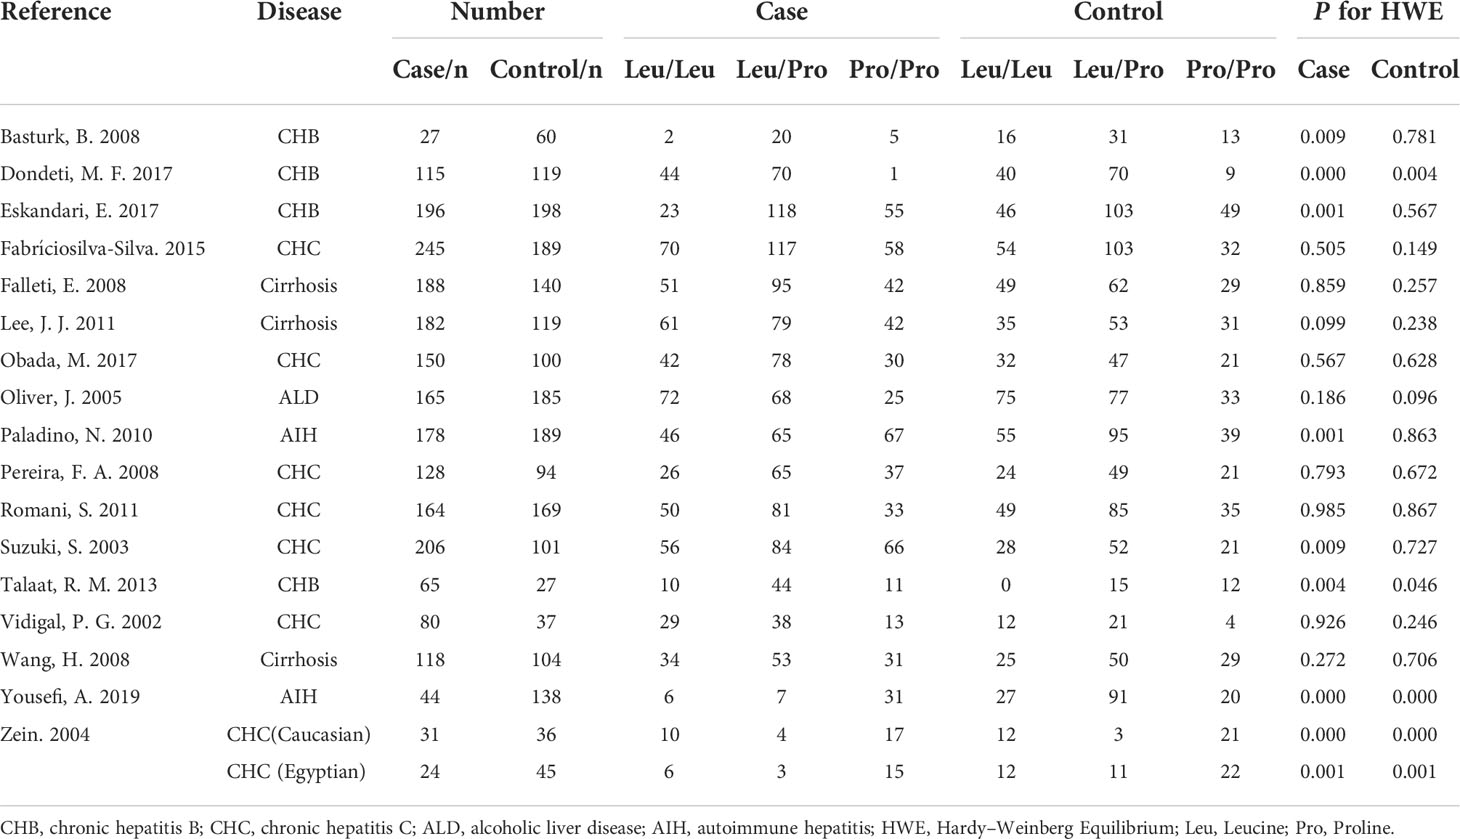
Table 3 The genotype and allele frequencies of TGF-β1 codon 10 distribution of included studies.
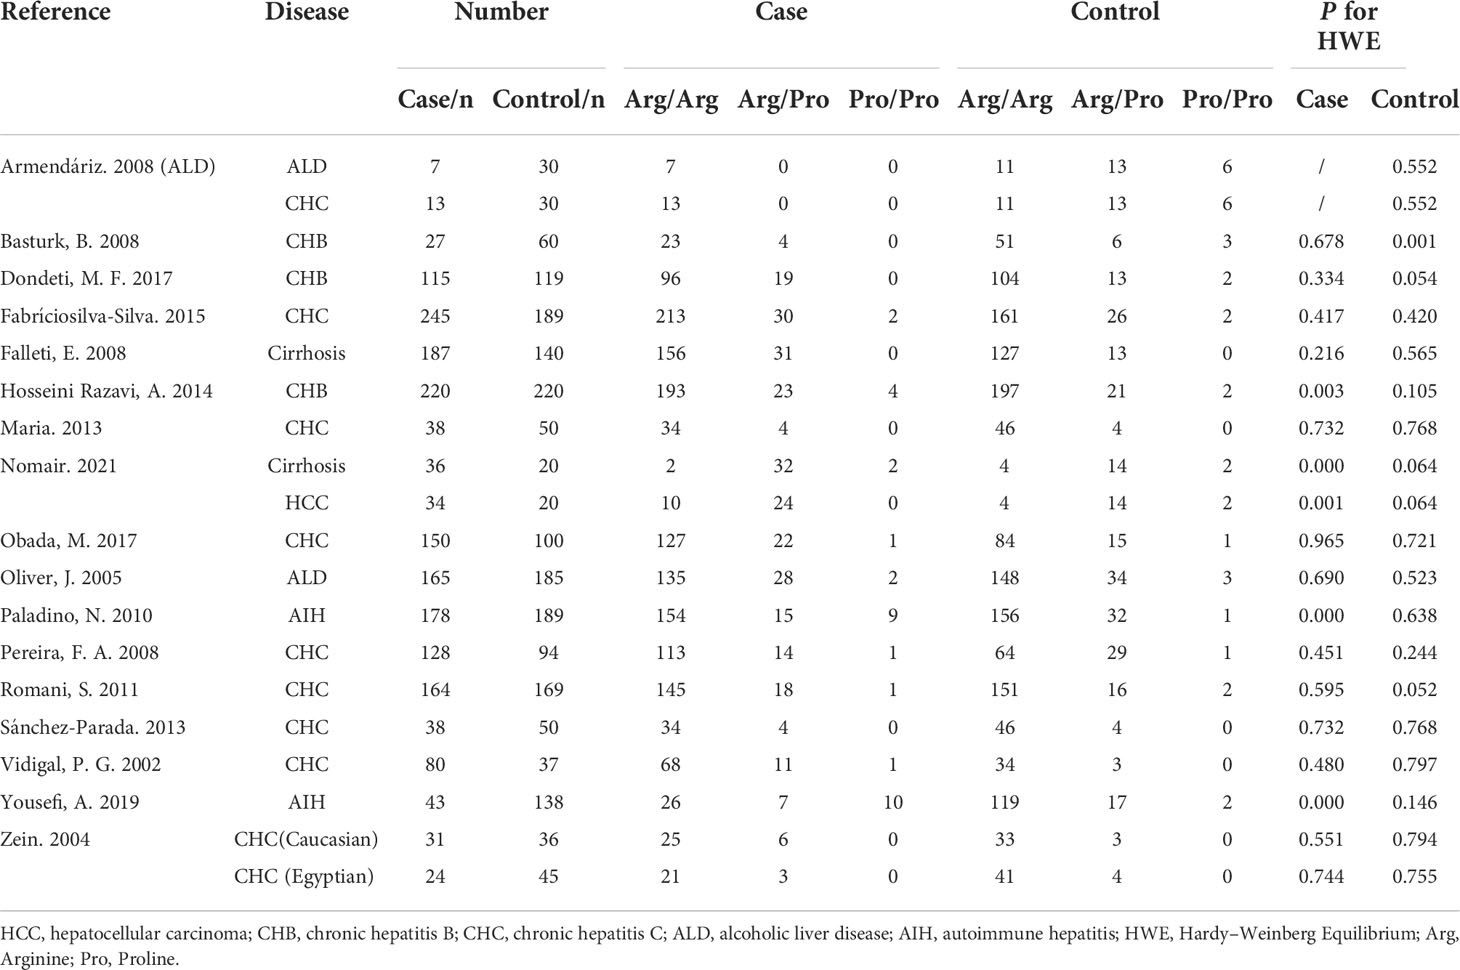
Table 4 The genotype and allele frequencies of TGF-β1 codon 25 distribution of included studies.
Relationship between TGF-β1 polymorphisms and CLD Risk
The results of CLD risk associated with three SNPs (TGF-β1-509C/T, codon 10, and codon 25) under five genetic models were summarized in Table 5. Given that less than three references were available on TGF-β1-800G/A and codon 263 polymorphisms, a further meta-analysis was not performed for these two variants.
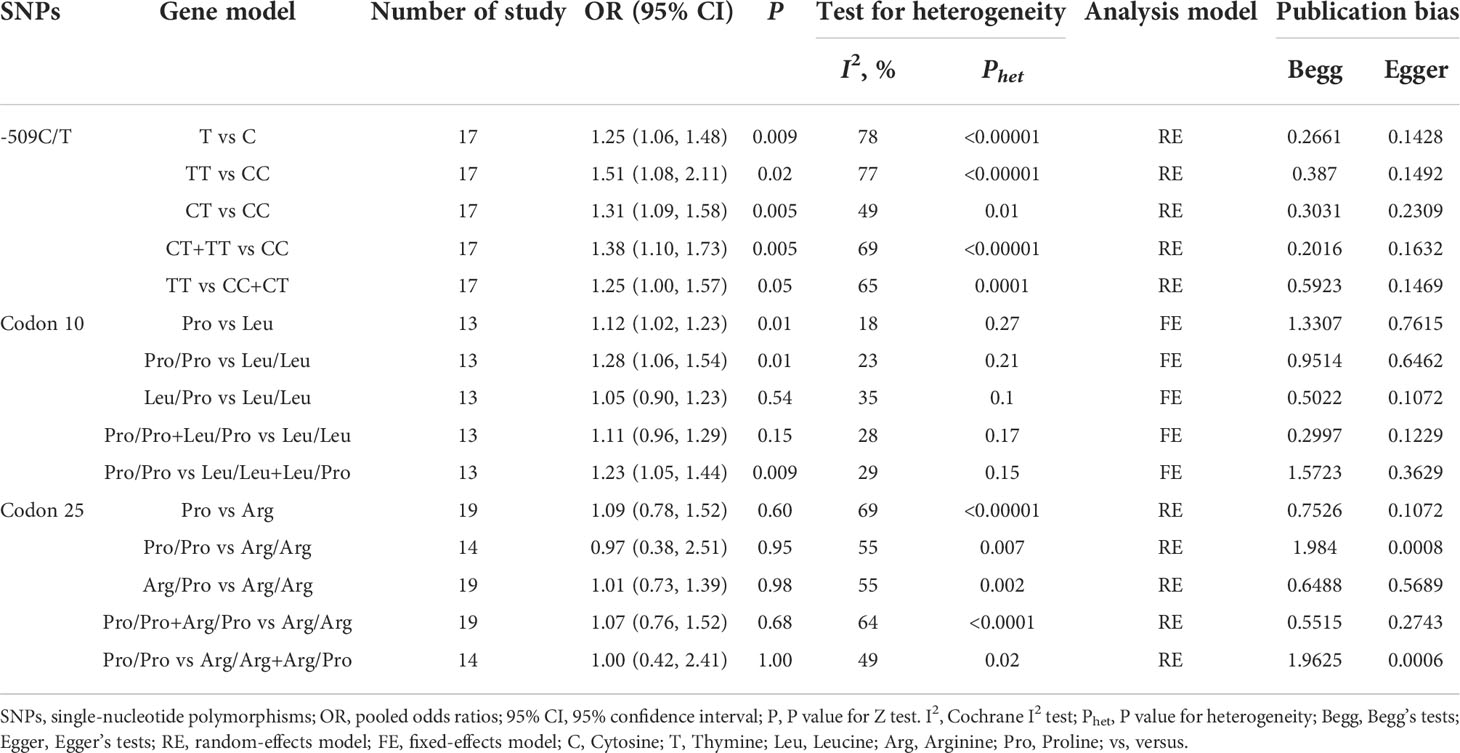
Table 5 Main results of the meta-analysis of TGF-β1 polymorphisms in CLDs.
Seventeen studies were involved in determining the association between TGF-β1-509C/T polymorphism and CLD risk. The sample number of the cases and control groups were 2,611 and 3,387, respectively. Except for the recessive model (TT vs CC+CT), the other four genetic models showed a significant association of TGF-β1-509C/T polymorphism with CLD risk (Figure 2; Table 5). The pooled OR of allele model (T vs C) was 1.25 (95% CI: 1.06-1.48, p = 0.009). The pooled OR of homozygote model (TT vs CC) was 1.51 (95% CI: 1.08-2.11, p = 0.02). The pooled OR of heterozygote model (CT vs CC) was 1.31 (95% CI: 1.09-1.58, p = 0.005). The pooled OR of dominant model (CT+TT vs CC) was 1.38 (95% CI: 1.10-1.73, p = 0.005). Taken together, these results showed that TGF-β1-509C/T was significantly associated with an increased risk of CLDs.
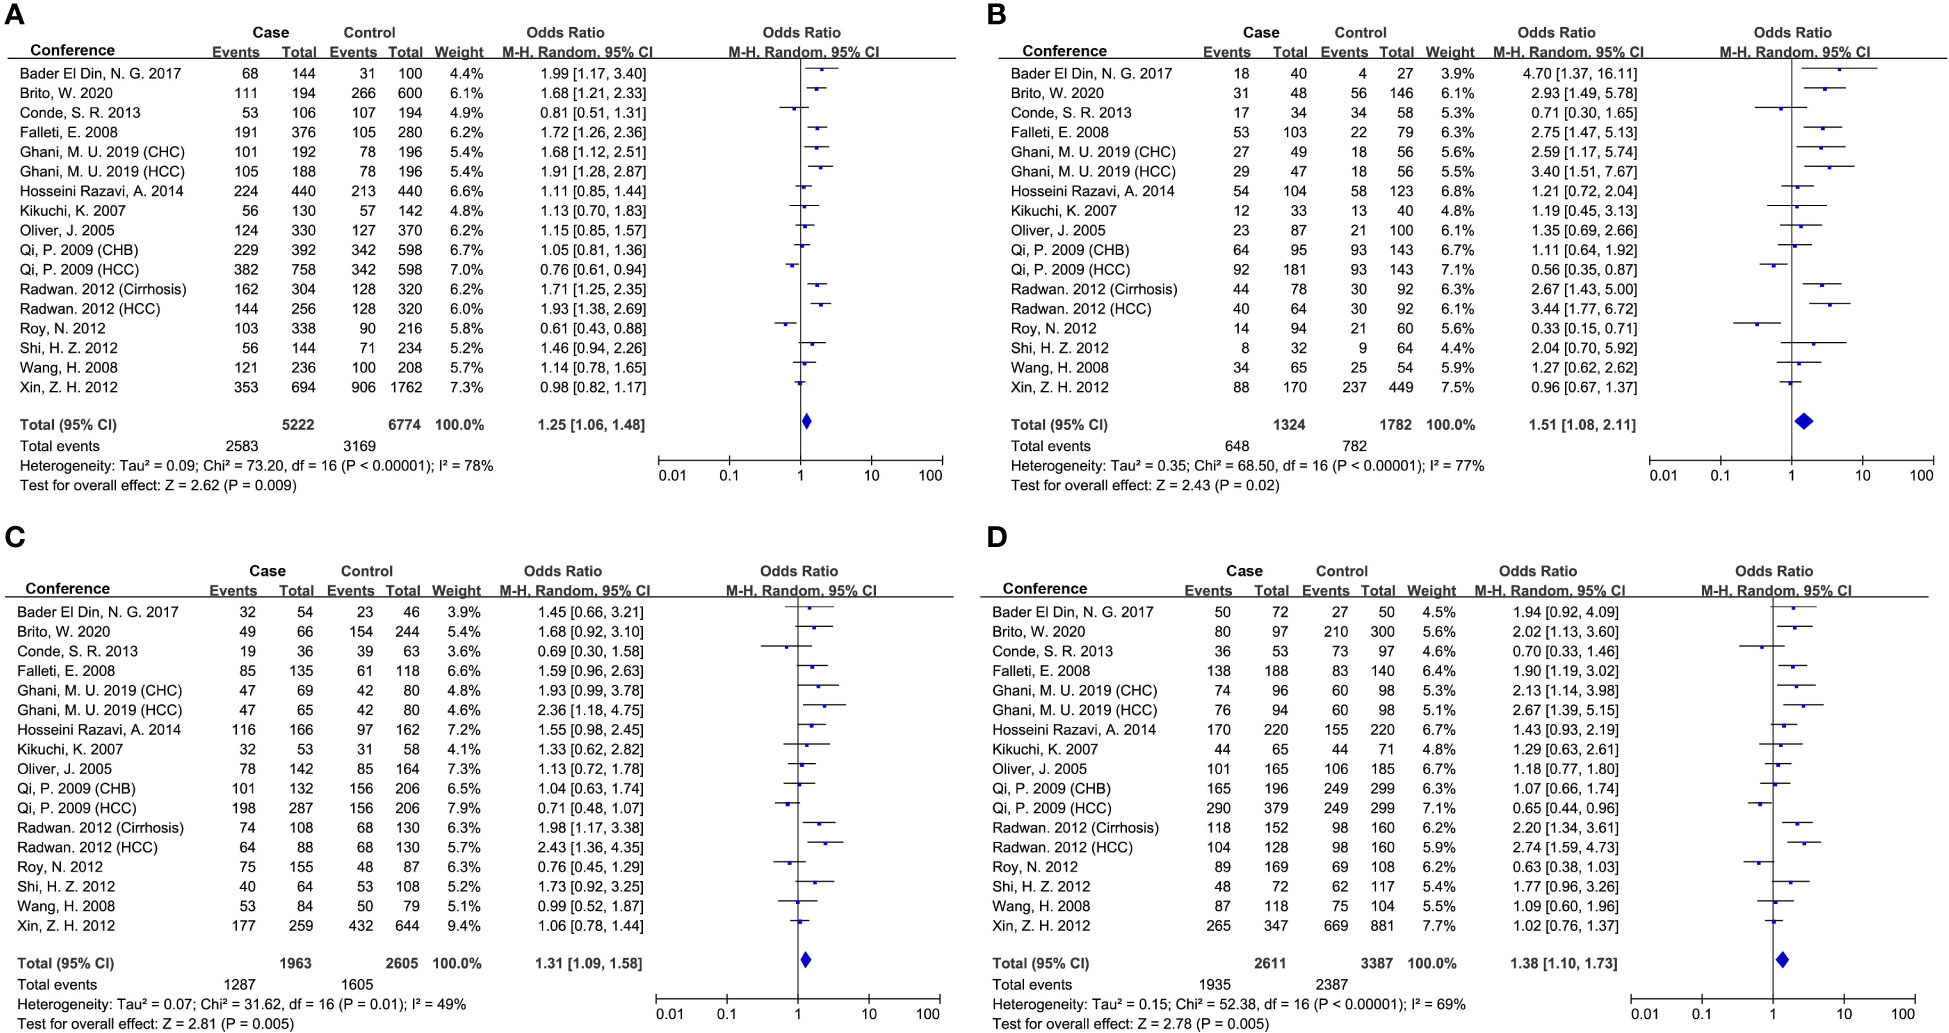
Figure 2 Forest plot of OR with 95% CI for associations between TGF-β1-509C/T polymorphism and CLD risk. (A) allele model, T vs C; (B) homozygote model, TT vs CC; (C) heterozygote model, CT vs CC; (D) dominant model, CT +TT vs CC. OR, pooled odds ratios; 95% CI, 95% confidence interval; T, Thymine; C, Cytosine.
Thirteen studies were involved in determining the association between TGF-β1 codon 10 polymorphism and CLD risk. The sample number of the cases and control groups were 2,027 and 1,685, respectively. Three genetic models showed association with susceptibility to CLDs (Figure 3; Table 5), including allele model (Pro vs Leu, OR: 1.12, 95% CI: 1.02-1.23, p = 0.01), homozygote model (Pro/Pro vs Leu/Leu, OR: 1.28, 95% CI: 1.06-1.54, p = 0.01) and recessive model (Pro/Pro vs Leu/Leu+Leu/Pro, OR: 1.23, 95% CI: 1.05-1.44, p = 0.009). Together, our results indicated that patients with the TGF-β1 codon 10 Pro/Pro genotype would have a higher CLD occurrence.
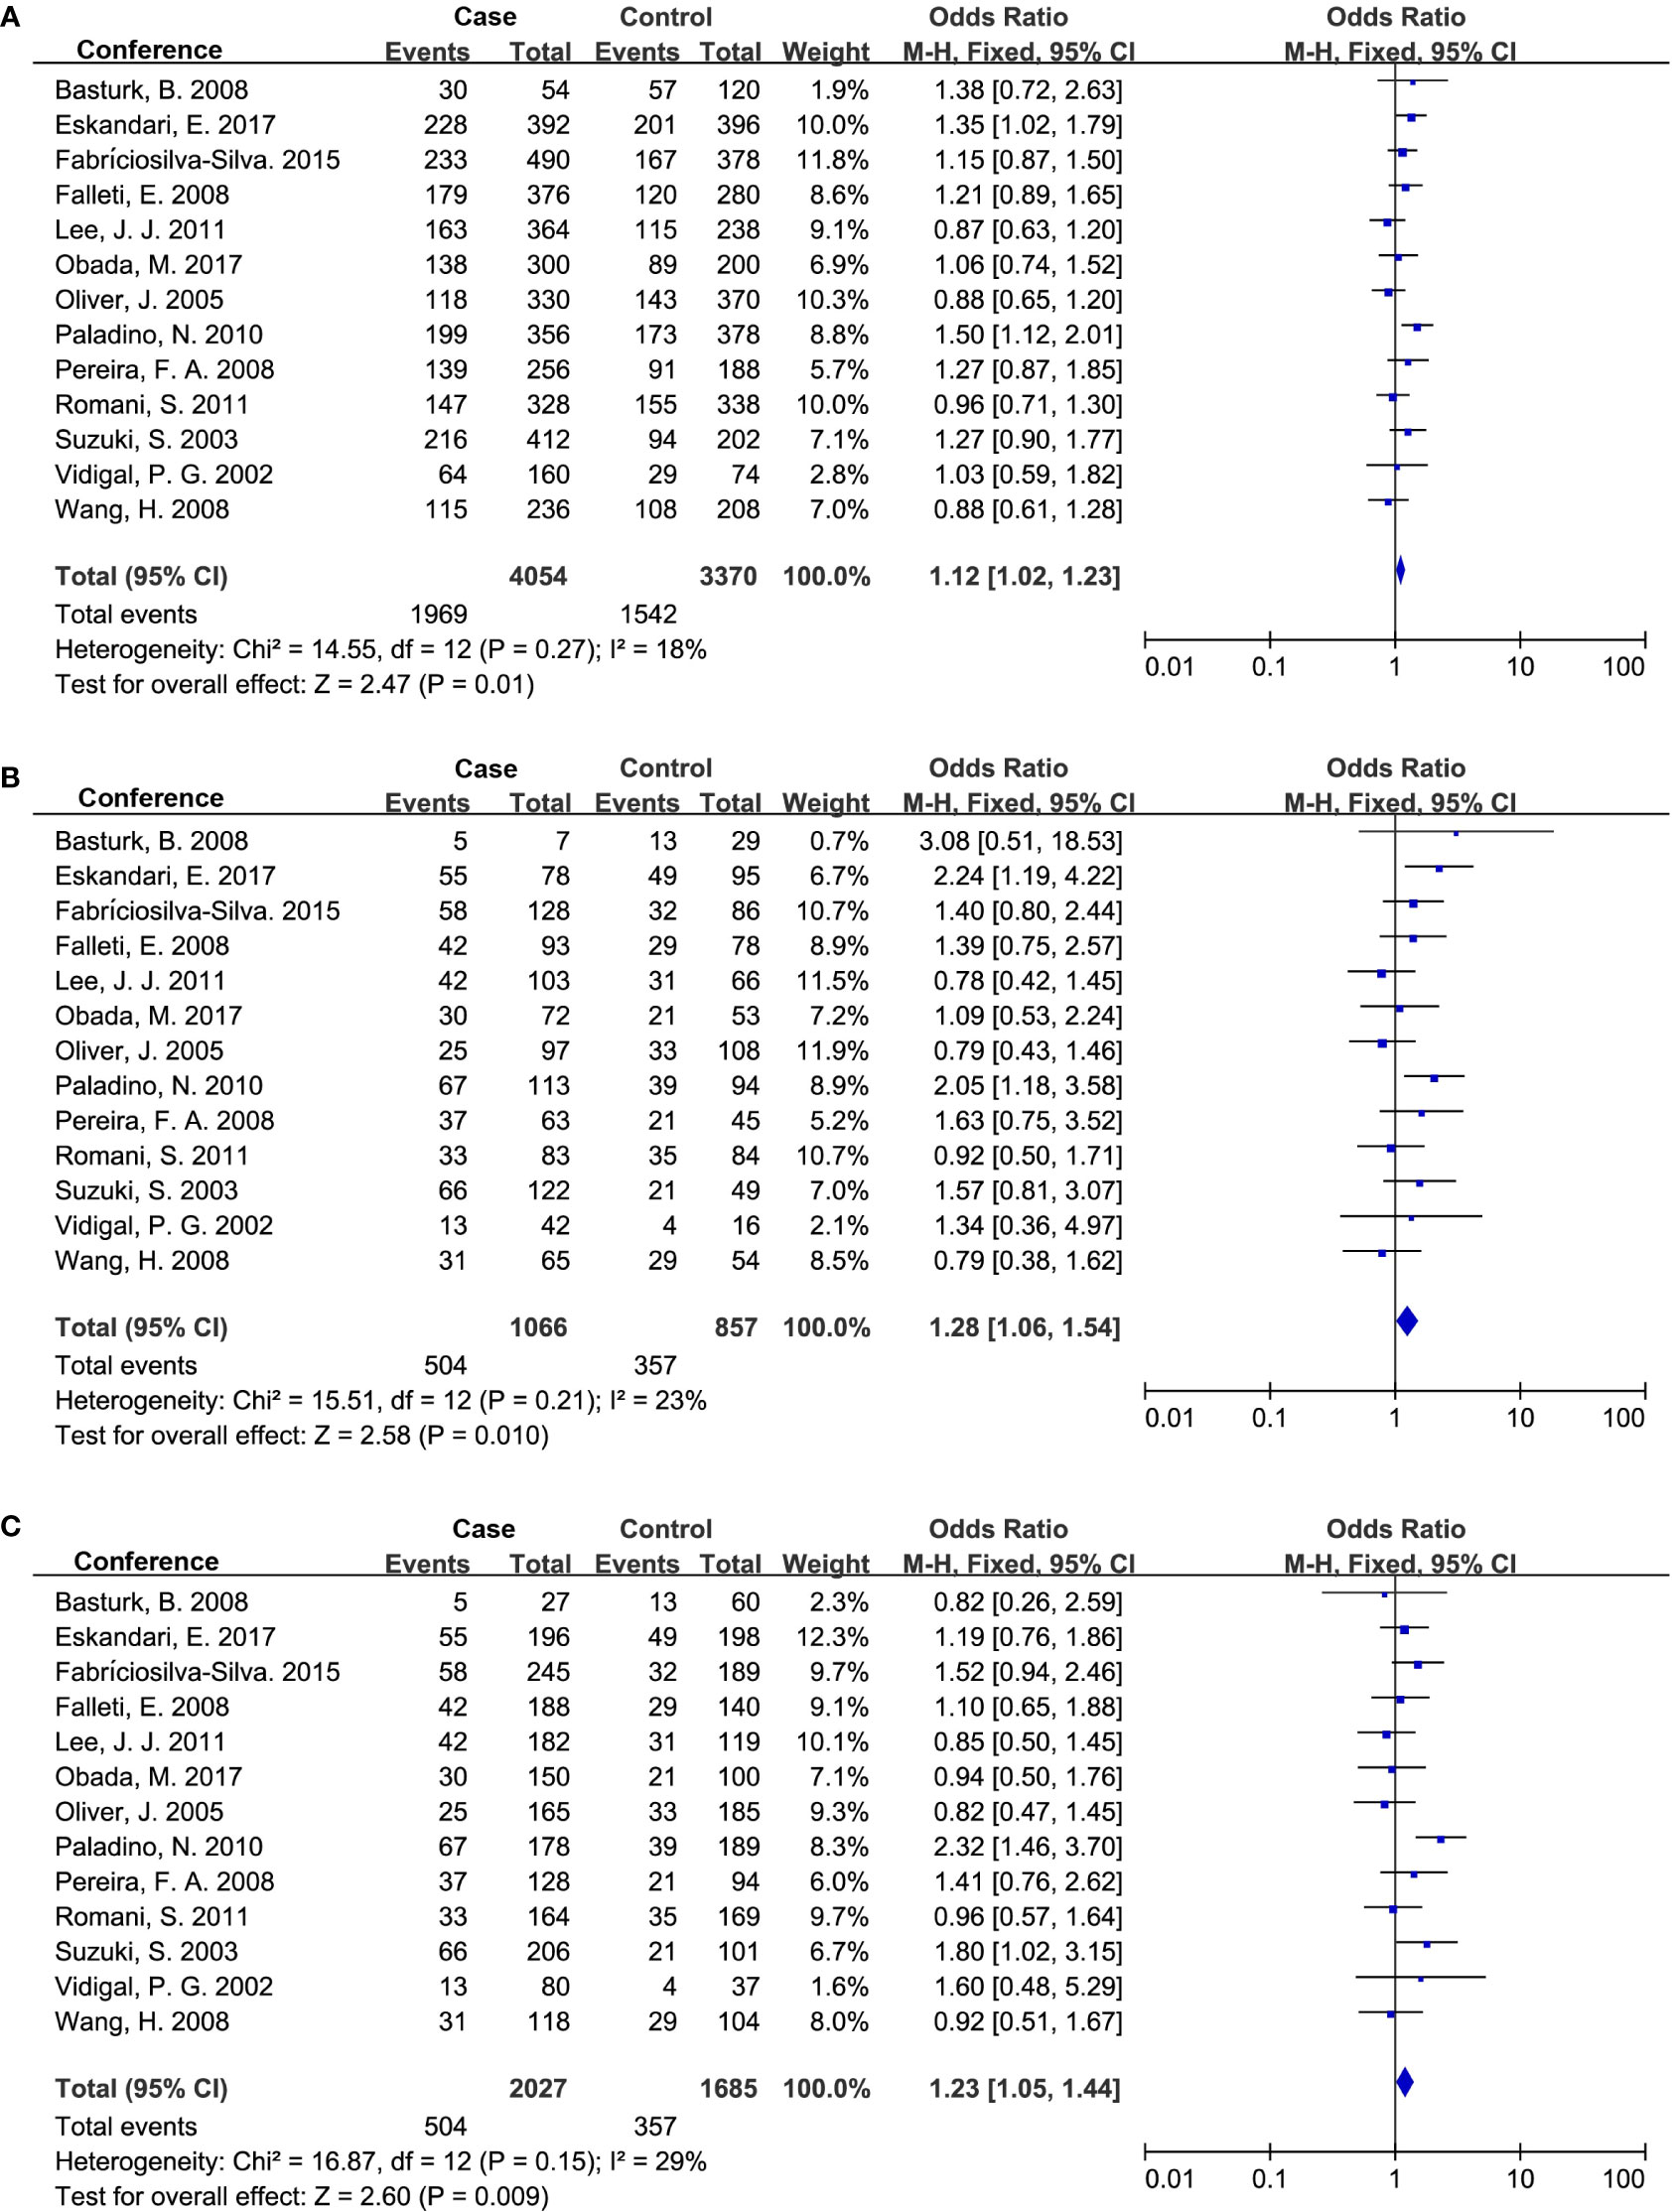
Figure 3 Forest plot of OR with 95% CI for associations between TGF-β1 codon 10 polymorphism. (A) dominant model, Pro vs Leu) and CLD risk; (B) homozygote model, Pro/Pro vs Leu/Leu; (C) recessive model, Pro/Pro vs Leu/Leu+Leu/Pro. OR, pooled odds ratios; 95% CI, 95% confidence interval; Pro, Proline; Leu, Leucine.
Nineteen studies were involved in determining the association between TGF-β1 codon 25 polymorphism and CLD risk. The sample number of the cases and control groups were 1,896 and 1,861, respectively. In our study, TGF-β1 codon 25 polymorphism had no significant association with the susceptibility to CLDs (Table 5).
Subgroup analysis by etiologies
We conducted a subgroup analysis to assess the effect of etiology on the relationship between TGF-β1 polymorphisms and CLD risk. As illustrated in Table 6, patients with the TGF-β1-509 TT genotype had a significantly higher risk of cirrhosis or CHC, consistent with a previous study (24). Lamentedly, TGF-β1-509C/T polymorphism had a limited role in HCC susceptibility. The TGF-β1 codon 10 polymorphism was significantly associated with CHB risk (Table 7), which was distinct from the current literature that TGF-β1 codon 10 polymorphism was not associated with the HBV/HCV-induced cirrhosis or HCC (19–21, 24). In addition, we concluded that the TGF-β1 codon 25 polymorphism had a potential relationship in patients with AIH for the first time (Table 8).
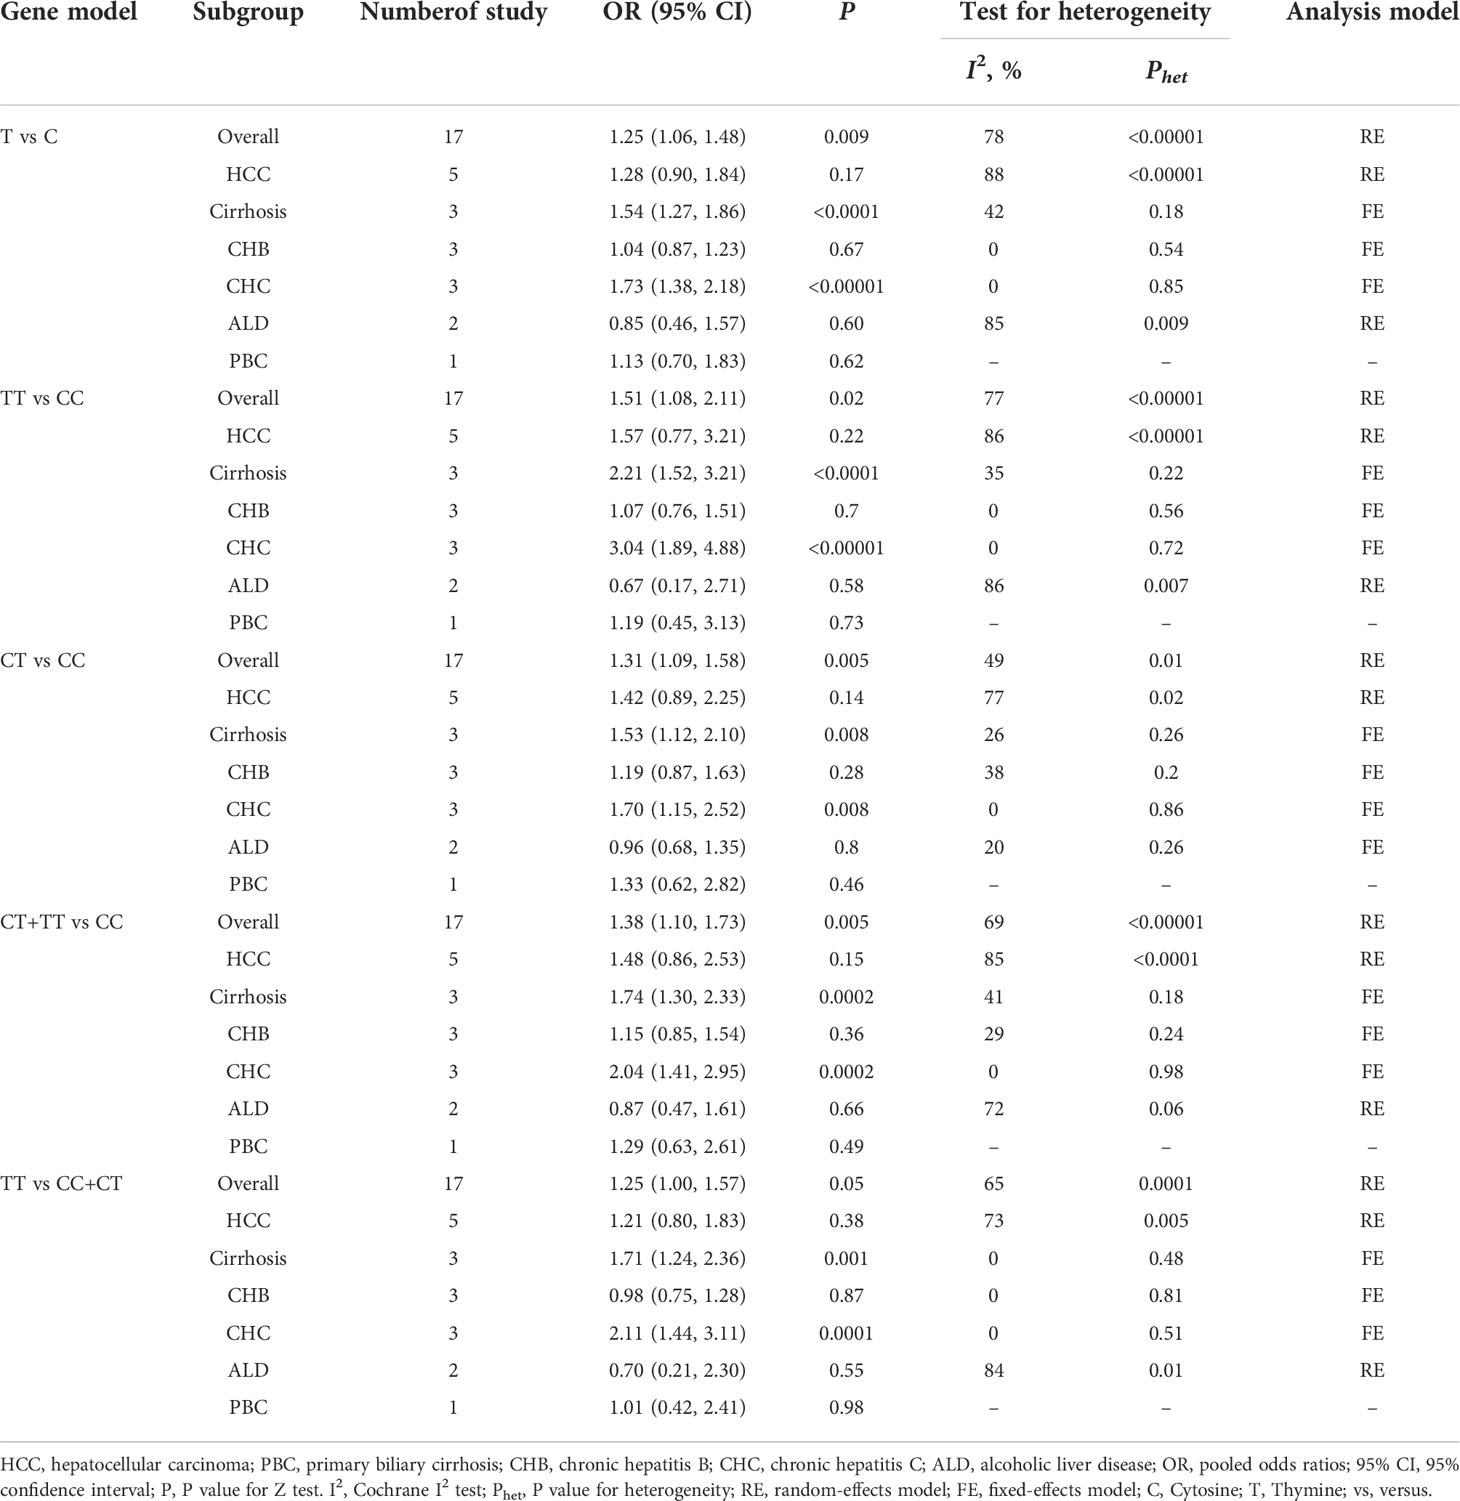
Table 6 Subgroups results of the role of TGF-β1-509C/T polymorphism in different CLDs.
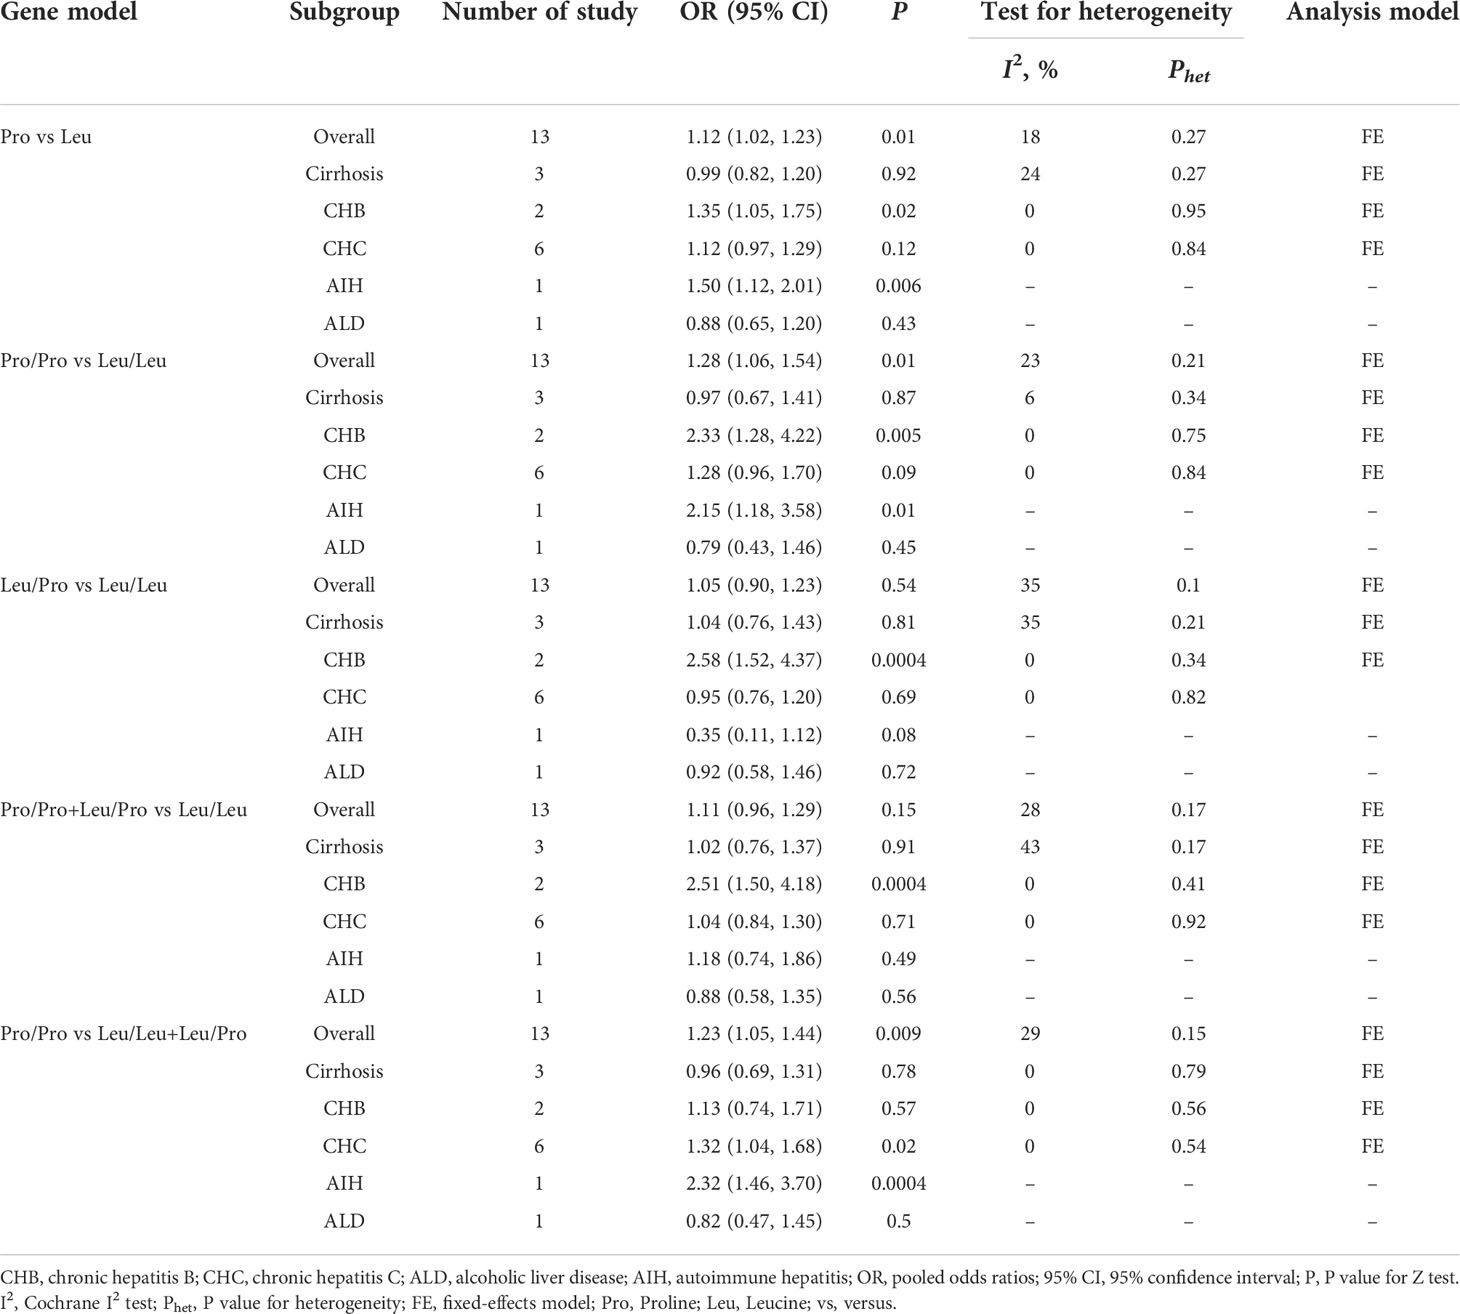
Table 7 Subgroups results of the role of TGF-β1 codon 10 polymorphism in different CLDs.
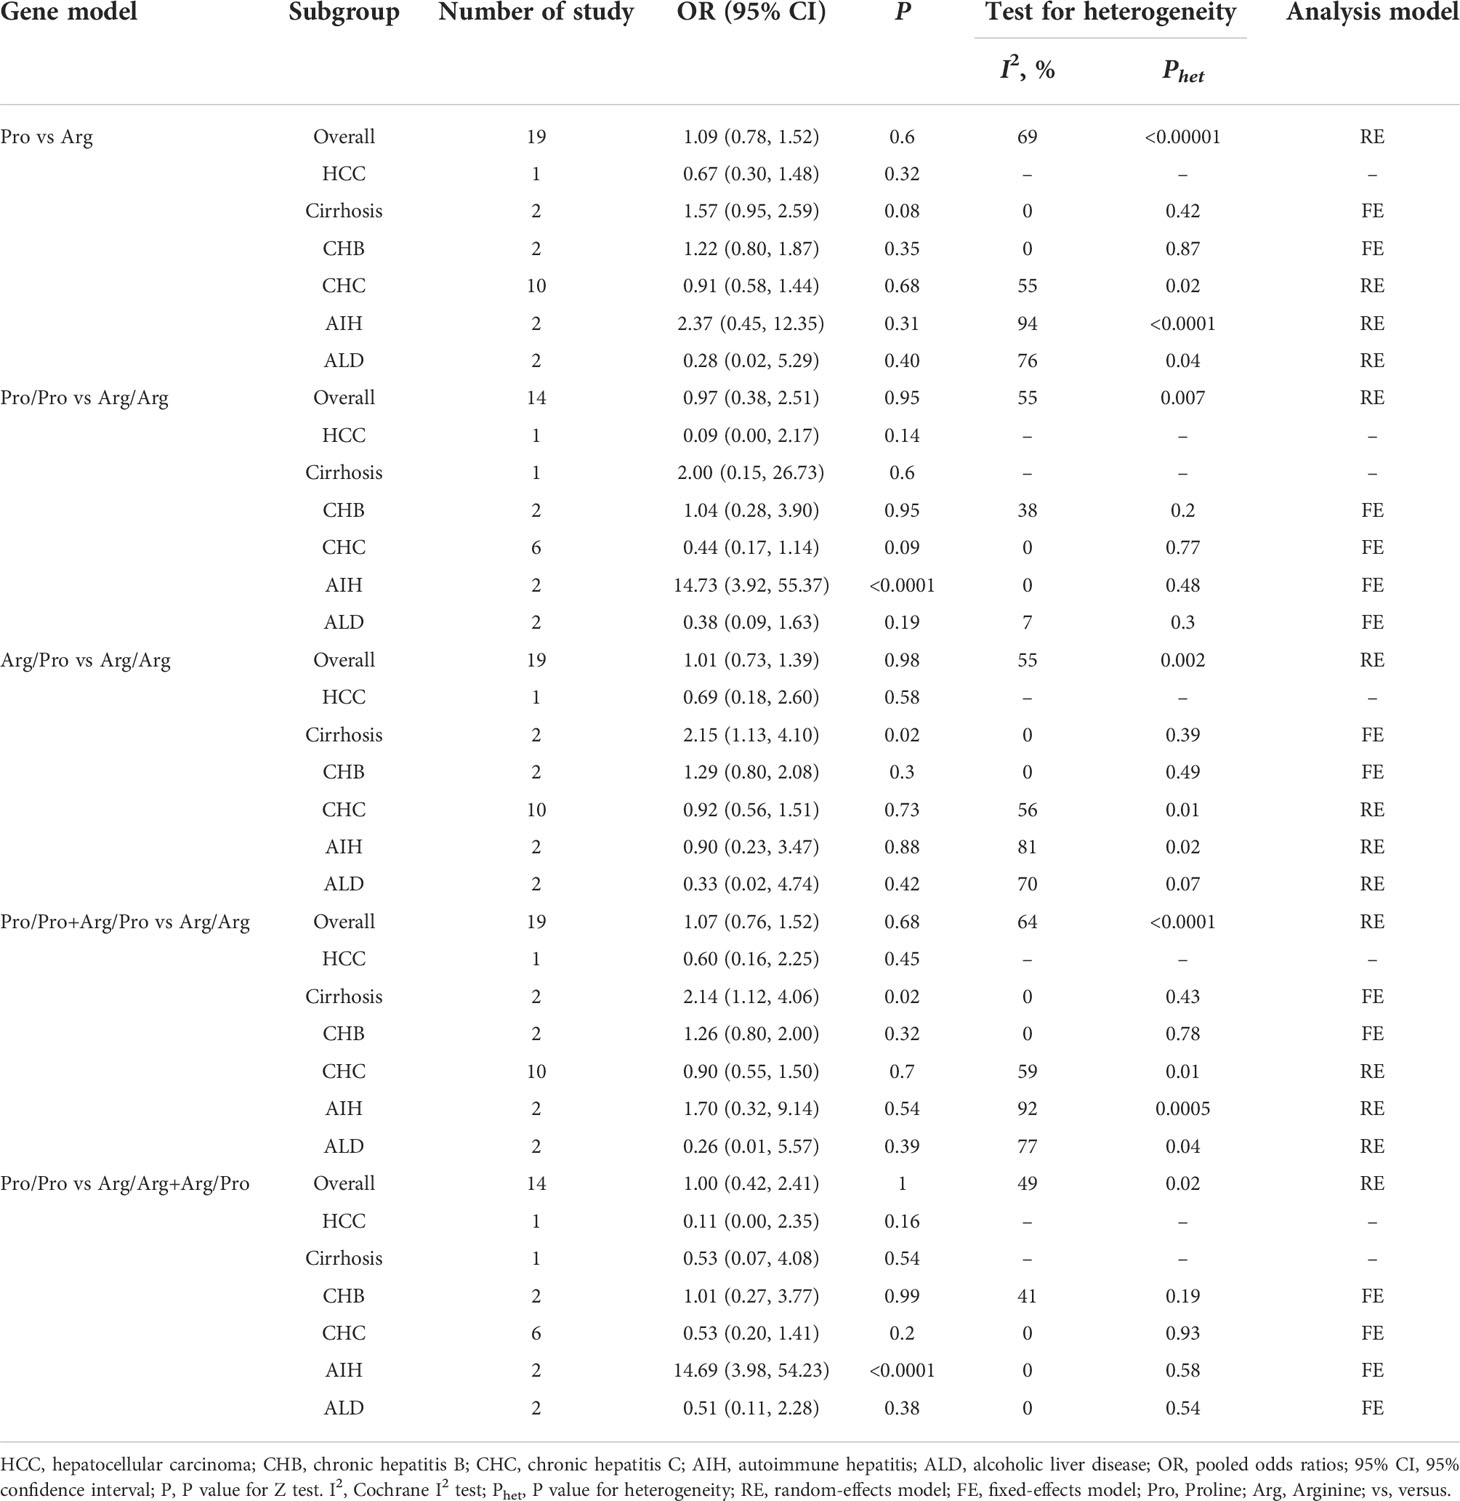
Table 8 Subgroups results of the role of TGF-β1 codon 25 polymorphism in different CLDs.
Sensitivity analysis
We performed a leave-one-out sensitivity analysis to ascertain the stability of the meta-analysis by removing a single study at a time under the random-effects model. As shown in Tables S3, S4, the statistical significance of the result was not altered when a single study was omitted, indicating that our results were reliable and stable.
Publication bias
We assessed the publication bias with the Begg’s and Egger’s test, and used a funnel plot to graphically represent the bias. Our results showed there was no publication bias in studies associated with TGF-β1-509C/T and codon 10 (Table 5). Similarly, the funnel plots were approximately symmetric, indicating no evidence of potential publication bias (Figure 4).
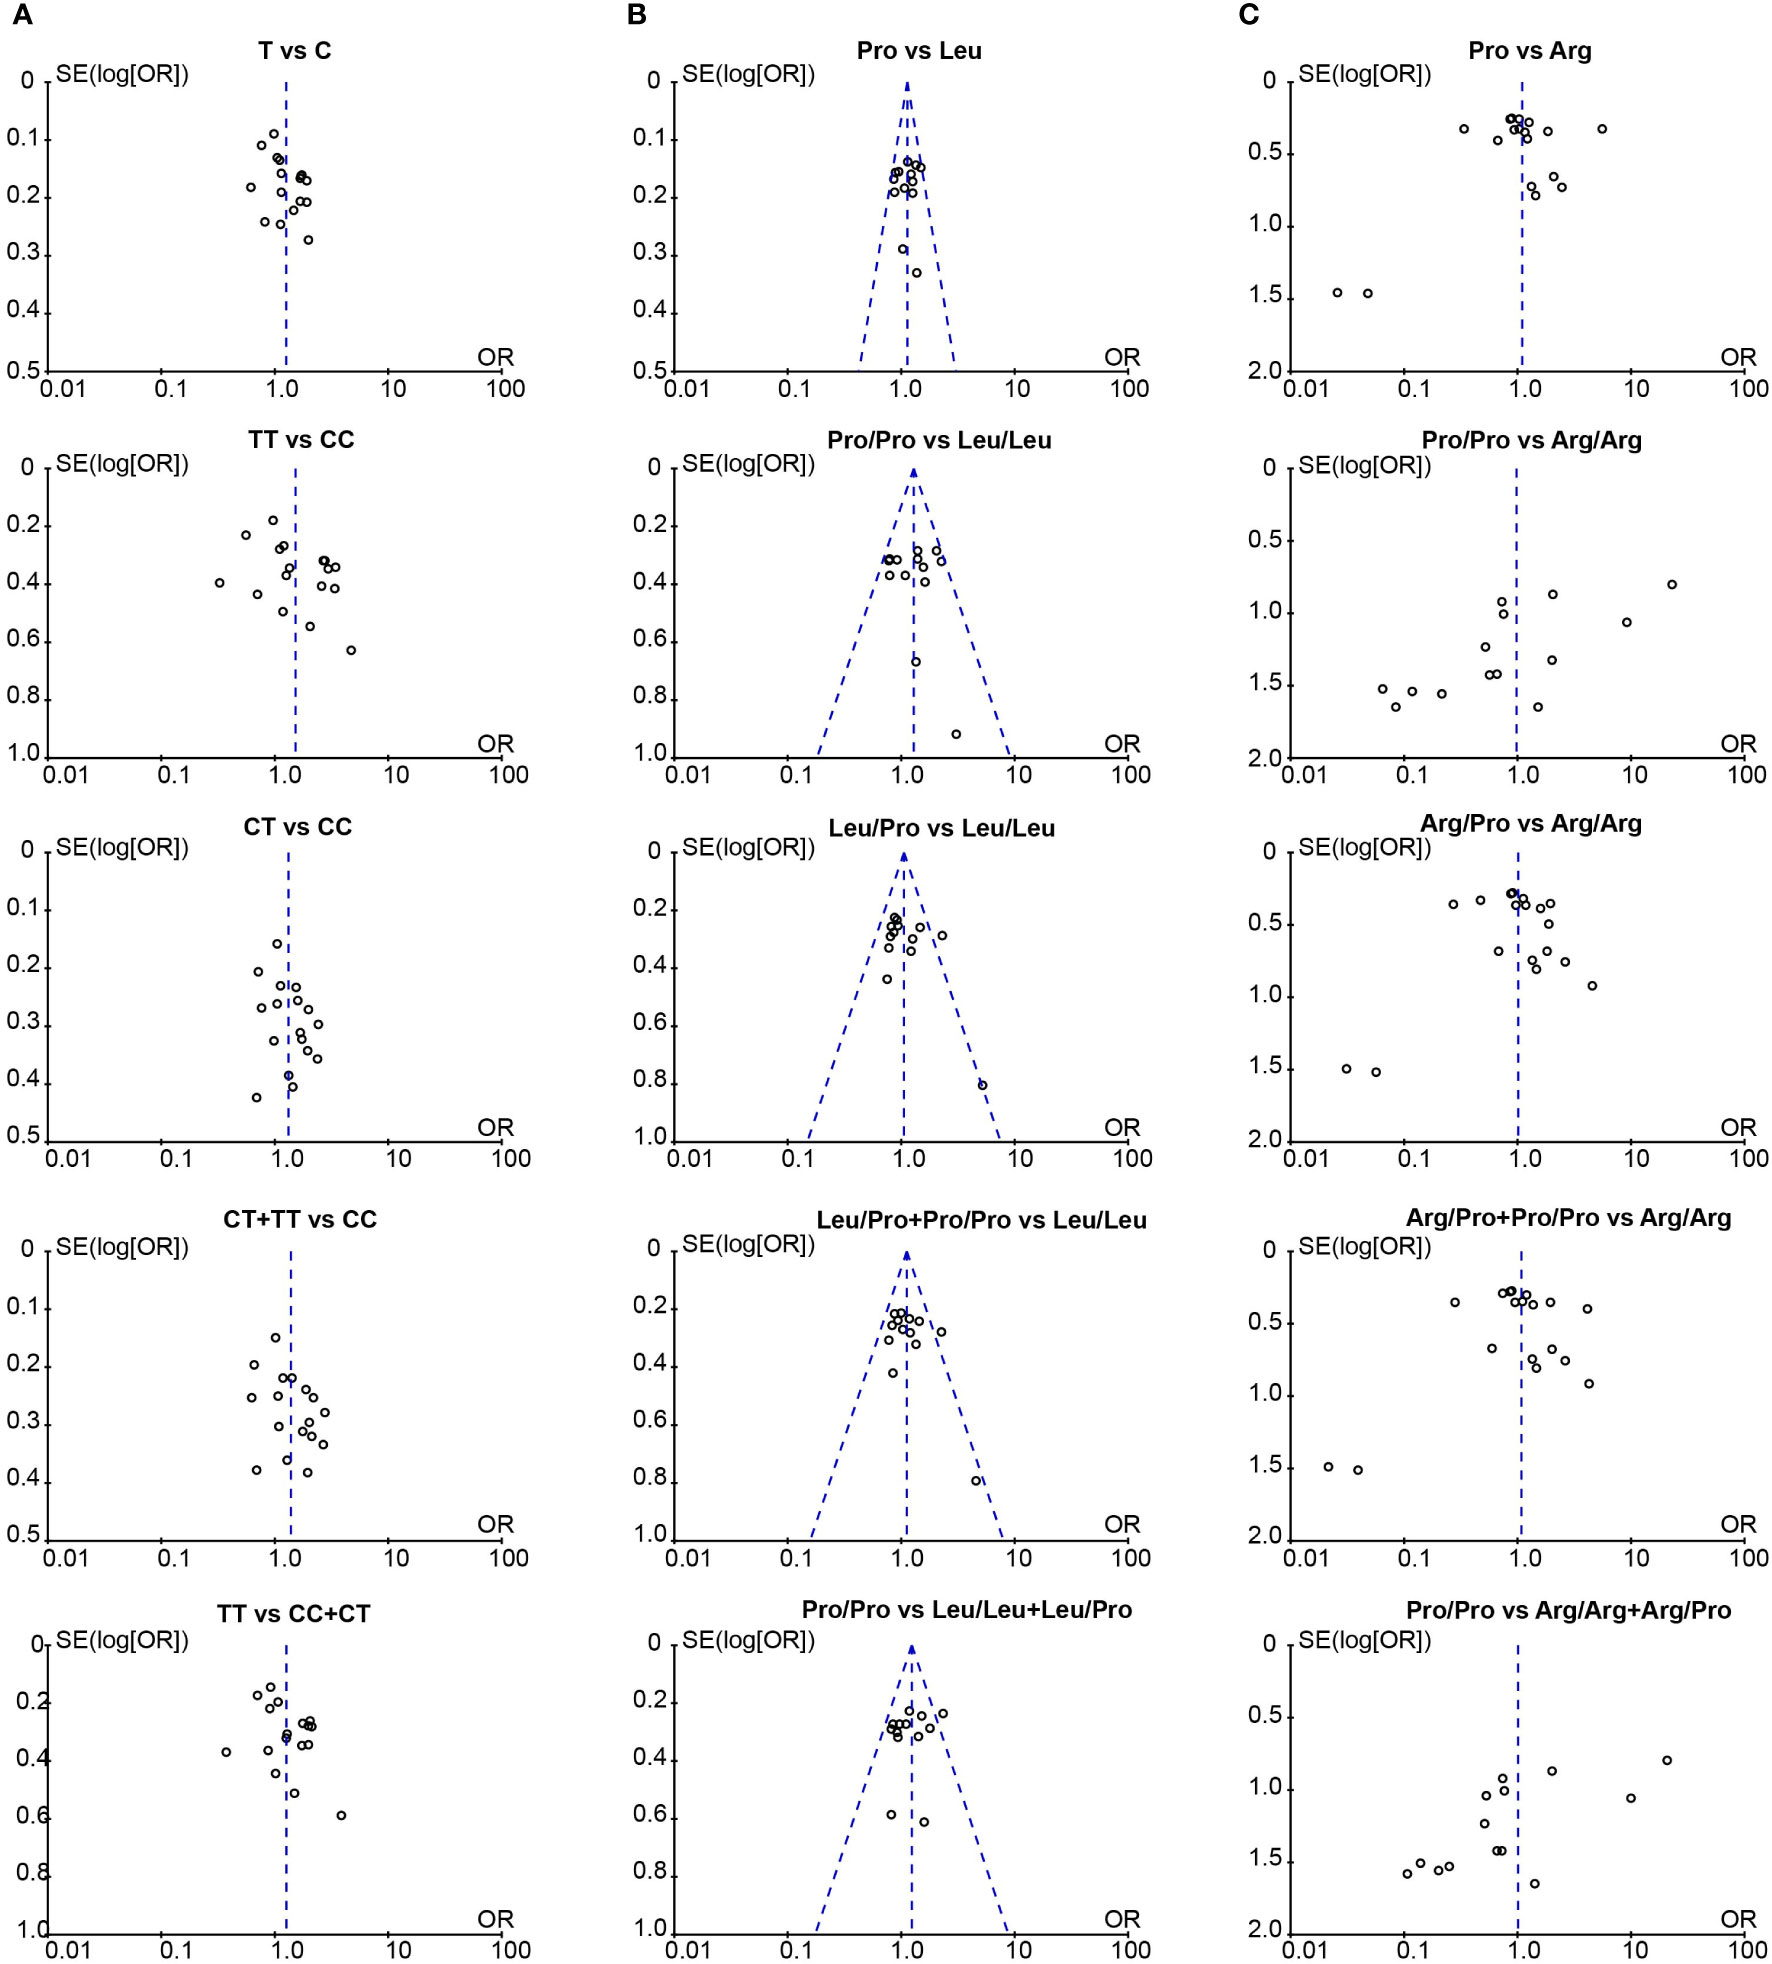
Figure 4 The funnel plot for publication bias assessment in the meta-analysis. (A) Funnel plot of TGF-β1-509C/T polymorphism and CLD risk; (B) Funnel plot of TGF-β1 codon 10 polymorphism and CLD risk; (C) Funnel plot of TGF-β1 codon 25 polymorphism and CLD risk. T, Thymine; C, Cytosine; Pro, Proline; Leu, Leucine; Arg, Arginine.
TGF-β1 gene expression in human CLDs
Studies have shown that TGF-β1-509C/T and codon 10 displayed increased expression and plasma concentration of TGF-β1 (21, 31–33), implying that TGF-β1 genetic variants could affect TGF-β1 protein expression. Here, the association of TGF-β1 polymorphisms with the gene expression of TGF-β1 was explored. We firstly evaluated the TGF-β1 mRNA levels in all sorts of CLD patients based on GEO datasets (Figure 5). Compared to healthy controls, a significantly higher mRNA level of TGF-β1 was observed in patients with CHB, AIH, NASH and cirrhosis (Figures 5A-D). Nevertheless, there were no significant differences in TGF-β1 expression between control and patients with CHC, alcohol hepatitis, and HCC (Figures 5E-G). Furthermore, we integrated all data and compared the difference in TGF-β1 mRNA levels. Results showed that the gene expression of TGF-β1 was markedly higher in CLD patients compared to healthy controls (Figure 5H).
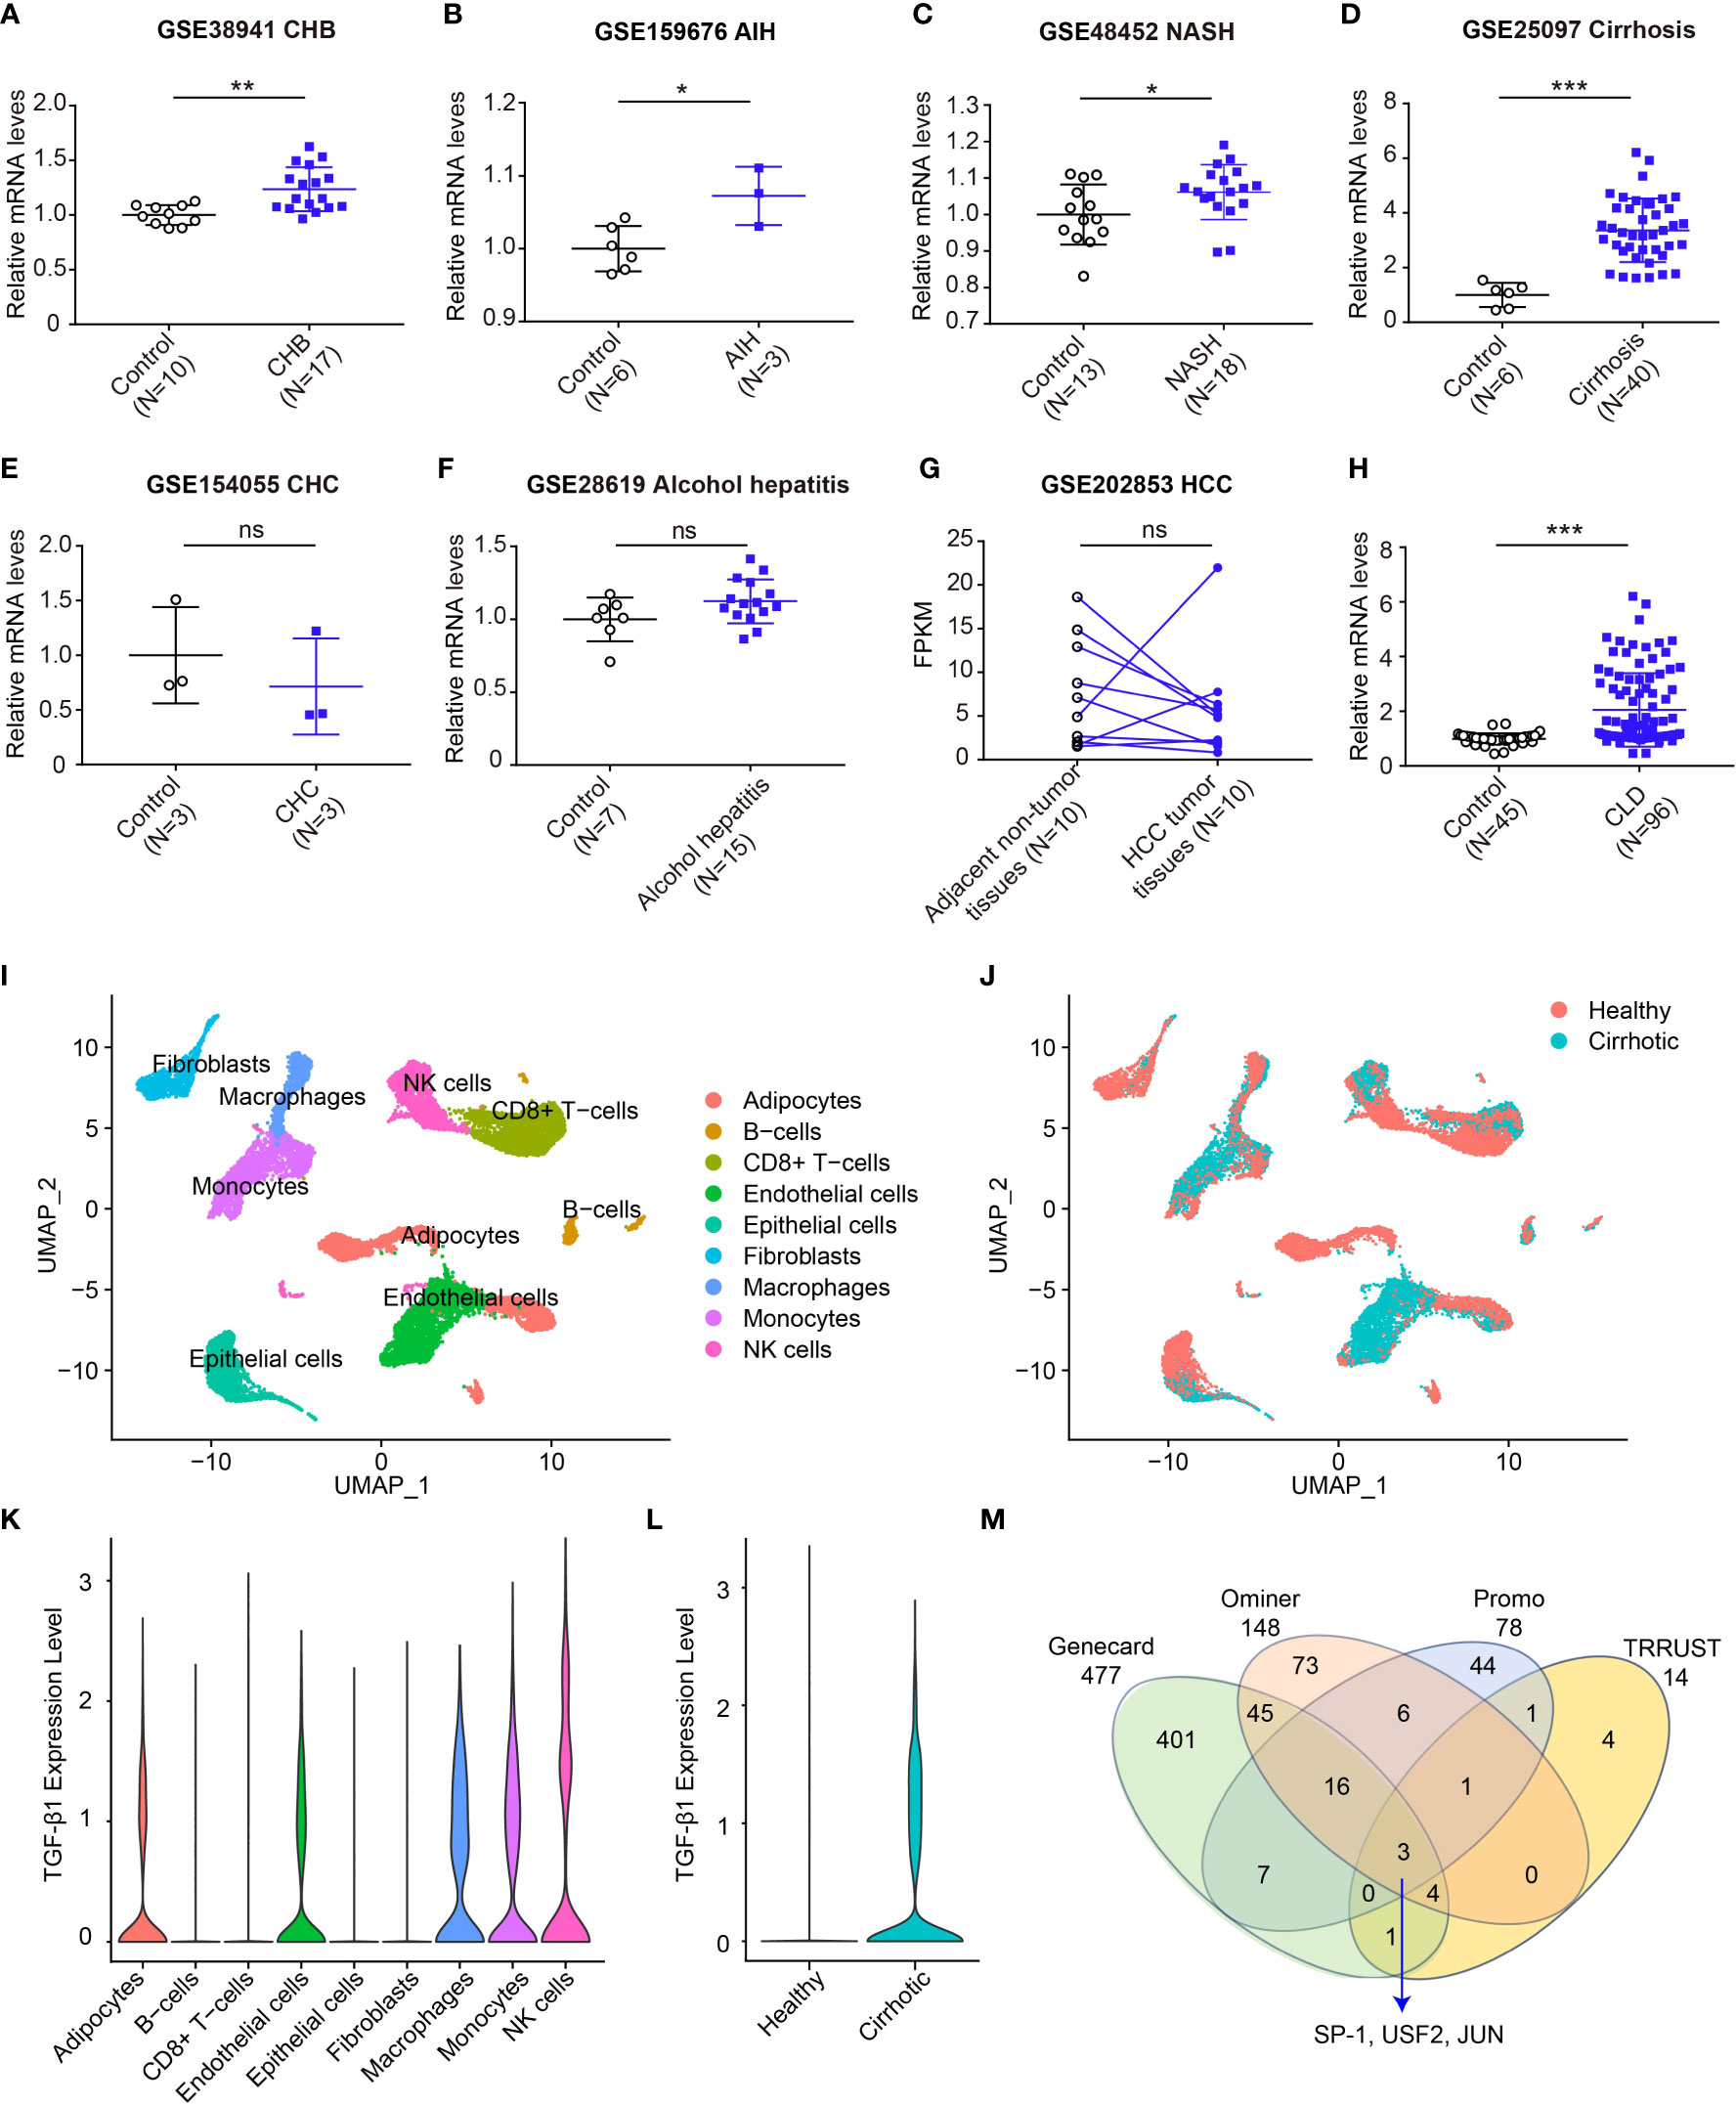
Figure 5 Expression of TGF-β1 mRNA increases in CLDs. (A-F) Transcript levels of TGF-β1 in healthy individuals or patients with CHB (A, GSE38941), AIH (B, GSE159676), NASH (C, GSE48452), cirrhosis (D, GSE25097), CHC (E, GSE154055), and alcohol hepatitis (F, GSE28619); (G) Transcript levels of TGF-β1 in adjacent non-tumor or HCC tumor (GSE202853); (H) Transcript levels of TGF-β1 in healthy individuals or patients with CLDs; (I, J) UMAP plot showing all liver non-parenchymal cells dependent on the cluster (I) and dependent on the origin (J); (K) TGF-β1 gene expression in all cell clusters; (L) TGF-β1 gene expression in healthy individuals and liver cirrhosis patients; (M) The transcription factor analysis of TGF-β1. Data are mean ± SD. *P<0.05, **P<0.01, and ***P<0.001 vs. Control. ns, not significant. Significance was calculated by two-tailed unpaired Student’s t-test.
Among these etiologies of CLDs, the TGF-β1 mRNA level was the most significantly associated with cirrhosis (Figure 5D). We further explored the TGF-β1 expression patterns in a published scRNA-seq dataset of human liver non-parenchymal cells from patients with cirrhosis and healthy individuals (37). Unsupervised clustering using UMAP uncovered nine cell lineages containing cells from both healthy and cirrhotic livers (Figures 5I, J). TGF-β1 was mainly expressed in natural killer (NK) cells, macrophages, monocytes, adipocytes and endothelial cells (Figure 5K). Notably, cirrhotic patients had a significantly elevated expression of TGF-β1 (Figure 5L). Above all, these data further demonstrated a remarkable association between TGF-β1 gene expression and CLDs.
Transcription analysis of TGF-β1
TGF-β1-509C/T and -800G/A are located in the promoter region at positions -509 and -800, which might result in a transcript shift of TGF-β1 by affecting the activity of the promoter. Transcription factors bind DNA in a sequence-specific way and play an important role in regulating gene transcription. Thus, we wonder if the TGF-β1 genetic variants interfere with the DNA binding of its transcription factors. We combined the candidates that were reported in Genecard, Ominer, Promo, and TRRUST databases to identify the most potential transcription factors involved in TGF-β1 transcription. Based on the overlapping data, we eventually identified three transcription factors, including specific protein-1 (SP-1), upstream stimulatory factor 2 (USF2), and JUN (Figure 5M).
SP-1 is the main nuclear protein involved in the regulation of TGF-β1 gene activation, which can greatly boost the activity of the TGF-β1 promoter (44–47). There are 11 conserved sequences of SP-1 binding sites (5’-GGGCGG) in the human TGF-β1 promoter. According to the present findings, TGF-β1-509C/T and -800G/A genetic variants weren’t involved in the binding sites of SP-1 in the TGF-β1 promoter, revealing these two variants may not affect the transcriptional regulation of SP-1 on TGF-β1 gene.
USF2 belongs to the basic helix-loop-helix leucine zipper family of transcription factors characterized by a highly conserved COOH-terminal domain responsible for dimerization and DNA binding (48, 49). Studies found that high glucose concentrations could induce USF2 binding to the TGF-β1 promoter region -1013/-1002, enhancing TGF-β1 promoter activity (50, 51). In addition, two specific binding sites for USF were identified in the TGF-β1 promoter: -1,846 approximately -1,841 (CACATG) and -621 approximately -616 (CATGTG) (52), which did not include the positions -509 and -800. Thus, the current study provides no evidence that TGF-β1-509C/T and -800G/A could influence the transcriptional regulation of USF2 on the TGF-β1 gene.
JUN is a transcription factor that recognizes and binds to the activator protein-1 (AP-1) consensus motif (53). Studies have validated that TGF-β1 could induce transcription of JUN mRNA through SMAD7 dependent/independent feedback manner (54, 55). Moreover, one study found that JUN could be involved in the promoter of TGF-β1, while its role and binding site in the TGF-β1 promoter were unknown (56). More investigations should be taken to uncover the binding site of JUN in the TGF-β1 promoter, then to determine if the binding sites covered the position of TGF-β1-509C/T and -800G/A genetic variants, and finally to figure out the underlying mechanism by which TGF-β1 polymorphism regulated the binding activity between transcription factors and TGF-β1 promoter to affect TGF-β1 transcription.
Structural analysis of TGF-β1 protein
The TGF-β1 codon 10 (CTG > CCG), codon 25 (CGG > CCG), and codon 263 (ACC > ATC) variants lead to amino-acid substitutions Leu10Pro, Arg25Pro, and Thr263Ile (Table S5). We investigated these codon variants based on the TGF-β1 crystal structure. TGF-β1 encodes a polypeptide comprising a signal peptide with 29 residues, a 249-residue pro-domain (latency-associated peptide), and a 112-residue growth factor (GF) domain (Figure 6A) (57, 58). And TGF-β1 is covalently linked to form dimers in the endoplasmic reticulum (58, 59). We modeled the overall crystal structure of TGF-β1 using the GalaxyHomomer method of GalaxyWeb (39, 40) and selected the best-predicted model for further analysis.
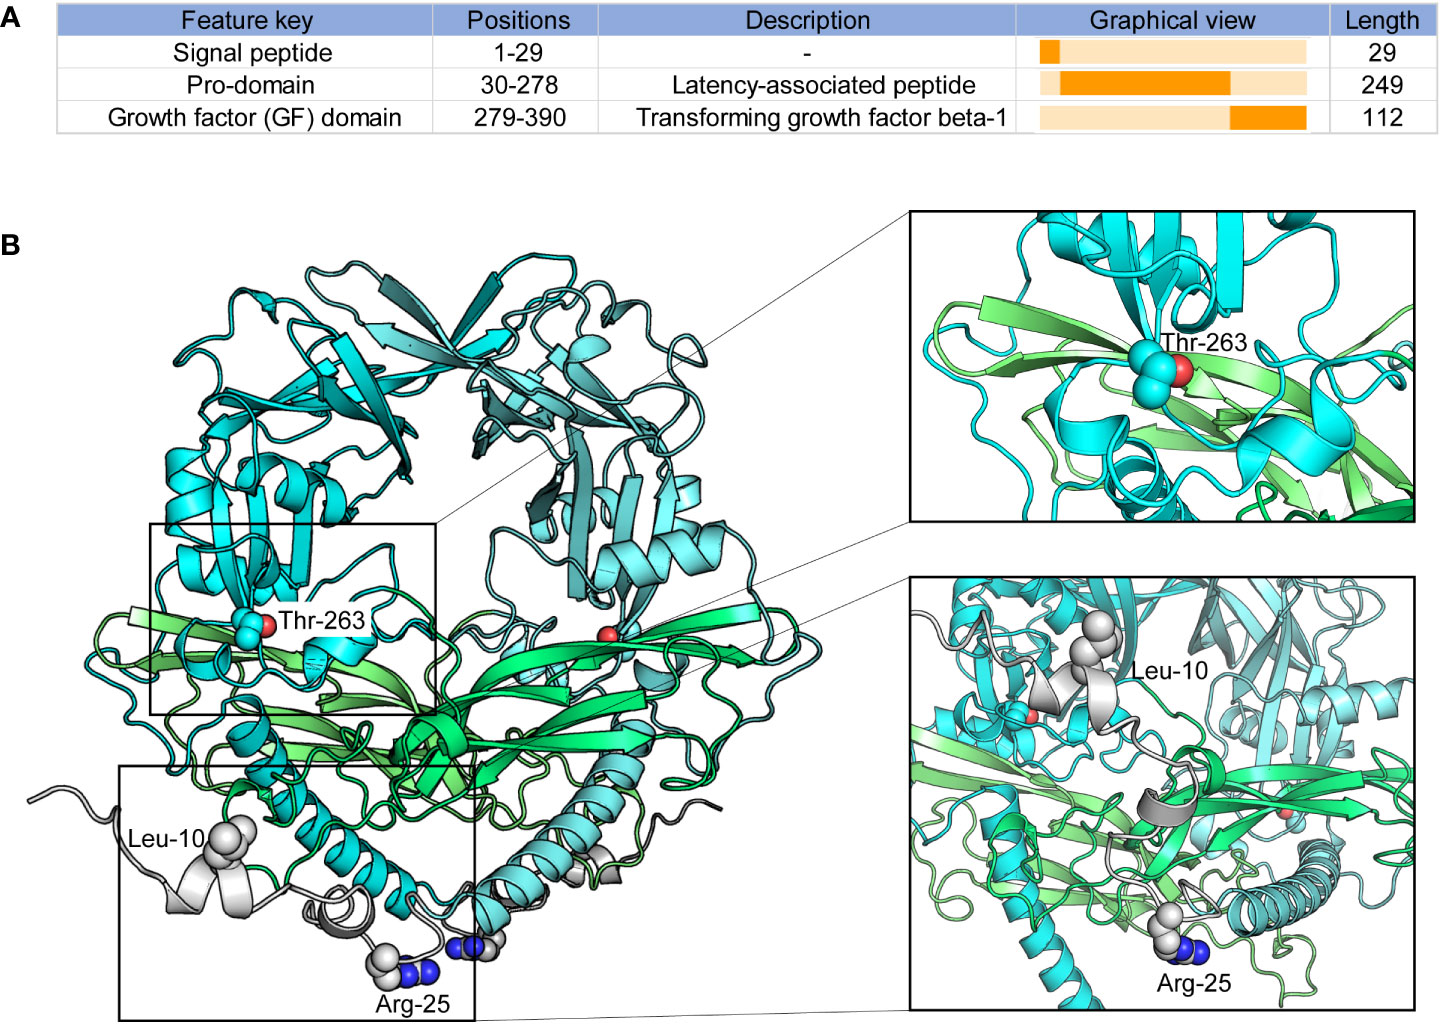
Figure 6 Peptide features and structure of TGF-β1. (A) Peptide features of TGF-β1; (B) Overall structure of TGF-β1. Protein structures and residues are shown in cartoon and sphere representation, respectively.
As illustrated in Figure 6B, TGF-β1 codon 10 and codon 25 were located in the signal peptide of TGF-β1, which domain hasn’t been confirmed based on experiments. We could not conclude any more results on how TGF-β1 codon 10 and codon 25 variants affect the 3D structure of TGF-β1. Our results showed that the TGF-β1 codon 263 was located in the pro-domain, close to the region where the TGF-β1 dimerization interacts, implying that the TGF-β1 codon 263 variant may alter the dimerization of TGF-β1. Latent TGF-β1 is covalently linked to form disulfide dimers and binds to the latent TGF-β binding protein (LTBP) (57–59). Once TGF-β1 was released from the LTBP, TGF-β1 could be secreted and interact with membrane receptors to initiate signal transduction (58, 60). Therefore, the TGF-β1 codon 263 variant might affect the binding of TGF-β1 to LTBP by altering the dimerization of TGF-β1, thus affecting TGF-β1 secretion and signal transduction.
Discussion
In the present study, we pooled 35 studies and conducted a meta-analysis to evaluate the frequency of TGF-β1 SNPs in CLD patients and healthy individuals. To our knowledge, this is the first systematic review and meta-analysis to comprehensively assess all TGF-β1 SNPs associated with CLDs. Our results revealed that the TGF-β1-509C/T and codon 10 were significantly associated with CLD risk. Individuals with the TGF-β1-509 (TT or CT allele) or codon 10 (Pro/Pro allele) showed an increased risk of CLDs in the overall population. In particular, we identified that TGF-β1-509C/T was strongly associated with patients with cirrhosis or CHC, while TGF-β1 codon 10 was more associated with patients with CHB. TGF-β1 codon 25 exhibited a relationship with AIH risk. Moreover, we identified that the mRNA level of TGF-β1 was significantly higher in a variety of CLDs, and explored the potential mechanisms by which TGF-β1 polymorphisms influence CLD risk based on transcription factors and protein structure of TGF-β1.
CLDs are extremely common clinical conditions caused by diverse etiologies, such as CHB, CHC, AIH, cirrhosis, NASH, ALD, PBC and HCC, affecting the health of millions of people (1, 2). When the inflammatory balance is disrupted in the liver, sustained inflammation responses can lead to the occurrence of CLDs. TGF-β1 encoded by TGF-β1 is a multifunctional immune regulator that contributes to various immunologic processes in CLDs (9). TGF-β1 not only shows the anti-inflammatory and immune surveillance properties in HCC but could also promote T cell differentiation and activation in CHB, CHC and NASH (11–15). Studies have indicated that TGF-β1 genetic variants could trigger the susceptibility of CLDs, acting as a potential candidate for predicting CLD risk. Up to now, a few studies have investigated the relationship between TGF-β1-509C/T and codon 10 polymorphisms and the risk of HBV/HCV-induced cirrhosis and HCC. However, these results were inconsistent and controversial (Table S6). Some studies showed that the TGF-β1-509 TT genotype showed an association with HCV-induced cirrhosis and HCC (20, 23, 24), and the TGF-β1 codon 10 Pro/Pro genotype had a slight effect on HCC risk (20). But more studies just did not detect a significant association between TGF-β1 polymorphisms and cirrhosis or HCC susceptibility (19, 21, 22, 25). As a whole, there was no systematic study to evaluate the association of TGF-β1 polymorphisms in CLDs. Our study consolidated all available data with TGF-β1 polymorphisms associated with diverse etiologies of CLDs and identified that TGF-β1-509C/T and codon 10 polymorphisms were highly associated with an increased risk of CLDs for the first time. TGF-β1-509C/T was significantly associated with CLD susceptibility under all genetic models except the recessive model (TT vs CC+CT; Table 5). For TGF-β1 codon 10, the fixed-effect meta-analysis showed that the Pro/Pro genotype conferred a significantly increased risk to CLDs under the allele contrast model (pooled OR = 1.28, 95% CI: 1.06-1.54; Table 5). Lamentedly, the TGF-β1 codon 25 showed no relationship with LCD risk (Table 5).
In the subgroup analysis based on etiologies, we found that TGF-β1-509C/T had a statistical association with cirrhosis and CHC under all genetic models (Table 6), consistently with the previous study (24). The TGF-β1 codon 10 was significantly associated with CHB under allele model (pooled OR = 1.35, 95% CI: 1.05-1.75), homozygote model (pooled OR = 2.33, 95% CI: 1.28–4.22), heterozygote model (pooled OR = 2.58, 95% CI: 1.52-4.37) and dominant model (pooled OR = 2.51, 95% CI: 1.50-4.18) (Table 7). Interestingly, TGF-β1 codon 25 Pro/Pro genotype showed a statistically significant association with AIH risk under homozygote model (pooled OR = 14.73, 95% CI: 3.92-55.37) and recessive model (pooled OR = 14.69, 95% CI: 3.98-54.23) (Table 8). Taken together, our data demonstrated that TGF-β1-509C/T and codon 10 polymorphisms could be feasible to screen for individuals at risk for CLDs, especially for cirrhosis, CHB, and CHC.
Studies have observed that TGF-β1-509C/T and codon 10 polymorphisms were associated with HCC risk (20). However, we didn’t reveal similar results based on the involved 35 eligible studies (Tables 6 and 7). To get clear on which TGF-β1 polymorphism could affect HCC risk, we analyzed the TGF-β1 variants on the cBioPortal database. Our results showed that the most common variants of TGF-β1 in HCC were missense mutations in G29E, A105S, D191N, and F321L, which might be the more precise genetic factors of TGF-β1 to influence HCC susceptibility (Figure S1).
The fact that CLDs have different pathogenic and pathogenesis and are regulated by various genes. Based on our findings that TGF-β1 polymorphisms contribute differently to CLD susceptibility, we hypothesized that TGF-β1 polymorphism might be associated with CLD-related genes and play distinct regulatory roles. Lamentedly, the relationship between TGF-β1 polymorphism and CLD-related genes has not been identified, except the different interactions between TGF-β1 signaling and CLD-related genes, such as Ki67 and P53, well-known HCC-related genes (61). A positive correlation between the activated TGF-β1 signaling pathway and high Ki67 expression due to the abnormal proliferation of cancer cells in tumor tissues (62). P53 mutants affected the transcriptional activation of TGF-β (63, 64). Overall, the interactions between TGF-β1 polymorphism and different CLD-related genes are interesting and undiscovered, which is worth further studies.
To reduce sampling bias in case-control studies, studies in which TGF-β1 SNPs demonstrated a departure from HWE in controls were excluded. Furthermore, sensitivity analysis was also applied to evaluate the potential source of heterogeneity of TGF-β1-509C/T and codon 25 (Tables S3, S4). After removing a single study at a time under the random-effects model, the positive association between TGF-β1-509C/T and the CLD risk was not changed (Table S3). In the current study, we did not observe any publication bias in TGF-β1-509C/T and codon 10 (Table 5; Figure 4), confirming our findings that TGF-β1-509C/T and codon 10 were positively associated with CLD risk.
Studies have shown that the mRNA and protein levels of TGF-β1 were significantly upregulated in patients with cirrhosis (26, 27), and TGF-β1 expression was higher in tumor tissues of HCC (28–30). Clinic studies revealed that TGF-β1 gene variants could affect TGF-β1 levels in individuals. For instance, individuals with TGF-β1-509C/T or codon 10 showed an increased level of TGF-β1 expression (31–33). However, the underlying mechanism is still unclear. Accordingly, we comprehensively analyzed the TGF-β1 mRNA levels in different etiologies of CLDs and observed that TGF-β1 was higher in patients with CHB, AIH, NASH and cirrhosis, compared to healthy controls (Figures 5A-D). Moreover, we integrated the different types of CLDs and validated that TGF-β1 was significantly upregulated in CLD patients (Figure 5H). Collectively, these results suggested that high TGF-β1 expression may be a promising biomarker for CLD diagnosis.
The TGF-β1-509C/T and -800G/A are located in the promoter region at positions -509 and -800, separately, which might change the transcription of TGF-β1 by affecting the binding between transcription factors and TGF-β1. We explored the potential transcription factors of TGF-β1 based on publicly available databases and observed three crucial transcription factors of TGF-β1 (Figure 5M). Studies have reported the binding sites of SP-1 and USF2 in the TGF-β1 promoter, which did not cover the position of TGF-β1-509C/T and -800G/A genetic variants. Based on the current results, transcriptional regulation of SP-1 or USF2 in TGF-β1 did not affect TGF-β1 expression associated with TGF-β1-509C/T and -800G/A. On the other hand, studies have found that JUN was occupied in the TGF-β1 promoter, but the binding sites haven’t been reported (56). Guess that if we could figure out the vital transcription factors of TGF-β1 with the binding sites covering -509 or -800 in the TGF-β1 promoter region, we might uncover the underlying mechanisms by which TGF-β1-509C/T and -800G/A affect TGF-β1 levels in patients with CLDs. Nevertheless, our findings could provide an idea of how TGF-β1 genetic variants in the promoter affect TGF-β1 expression.
In the endoplasmic reticulum, the pro-domain and GF domain of latent TGF-β1 are covalently linked to form disulfide dimers (57–59). At the same time, the pro-domain binds to the potential TGF-β binding protein to form disulfide connections. And after being released from its latent form, TGF-β1 is secreted and directly interacts with membrane receptors to initiate signal transduction (58, 60). TGF-β1 codon 10, codon 25, and codon 263 change the amino-acid substitutions, possibly leading to changes in TGF-β1 expression and secretion. We investigated the potential effects of TGF-β1 codon variants based on the crystal structure of the TGF-β1 protein. The 1-29 of the TGF-β1 domain as a signal peptide hasn’t been solved based on experiments. Thus, we can’t conclude any useful results for TGF-β1 codon 10 and codon 25 variants. As shown in Figure 6, codon 263 was located close to where the dimerization of TGF-β1 interacts. Consequently, we had a hypothesis that the TGF-β1 codon 263 variant may affect the dimerization of TGF-β1 in the endoplasmic reticulum and then change the TGF-β1 secretion, which remains further defined.
Conclusion
Our analysis provides evidence supporting TGF-β1-509C/T (rs1800469) and TGF-β1 codon 10 (rs1800470) as susceptibility factors for CLD occurrence for the first time (Figure 7). TGF-β1-509 TT genotype and T allele were correlated with increased CLD risk, specifically with cirrhosis and CHC-induced CLD individuals. The TGF-β1 codon 10 polymorphism was also correlated with increased CLD susceptibility, playing a more significant role in predicting the occurrence of CHB. Our exploration of the underlying mechanisms by which TGF-β1 polymorphisms affect CLD risk by regulating TGF-β1 expression would provide a better understanding of the association between the immune regulator and CLD pathogenesis. Notwithstanding the significant findings obtained from the current study, several limitations should still be considered. First, the pathogenesis of CLDs is sophisticated and engages potential interactions between genes and the environment. More studies with sufficient statistics are required for a more thorough assessment. Second, except for etiology, TGF-β1 polymorphisms on CLD susceptibility could be affected by ethnicity, sex, age, etc. We did not carry out a subgroup analysis to assess these effects on the association between TGF-β1 polymorphisms and CLD risk. Third, the sample size of our study was relatively small, and we had two studies with NOS scores of 6, which were of intermediate quality. Finally, we did not perform a meta-analysis on TGF-β1-800G/A and codon 263 for the small sample size of aggregate analysis. Further investigation should be carried out to verify this relationship and explore other aspects of the CLD risk.
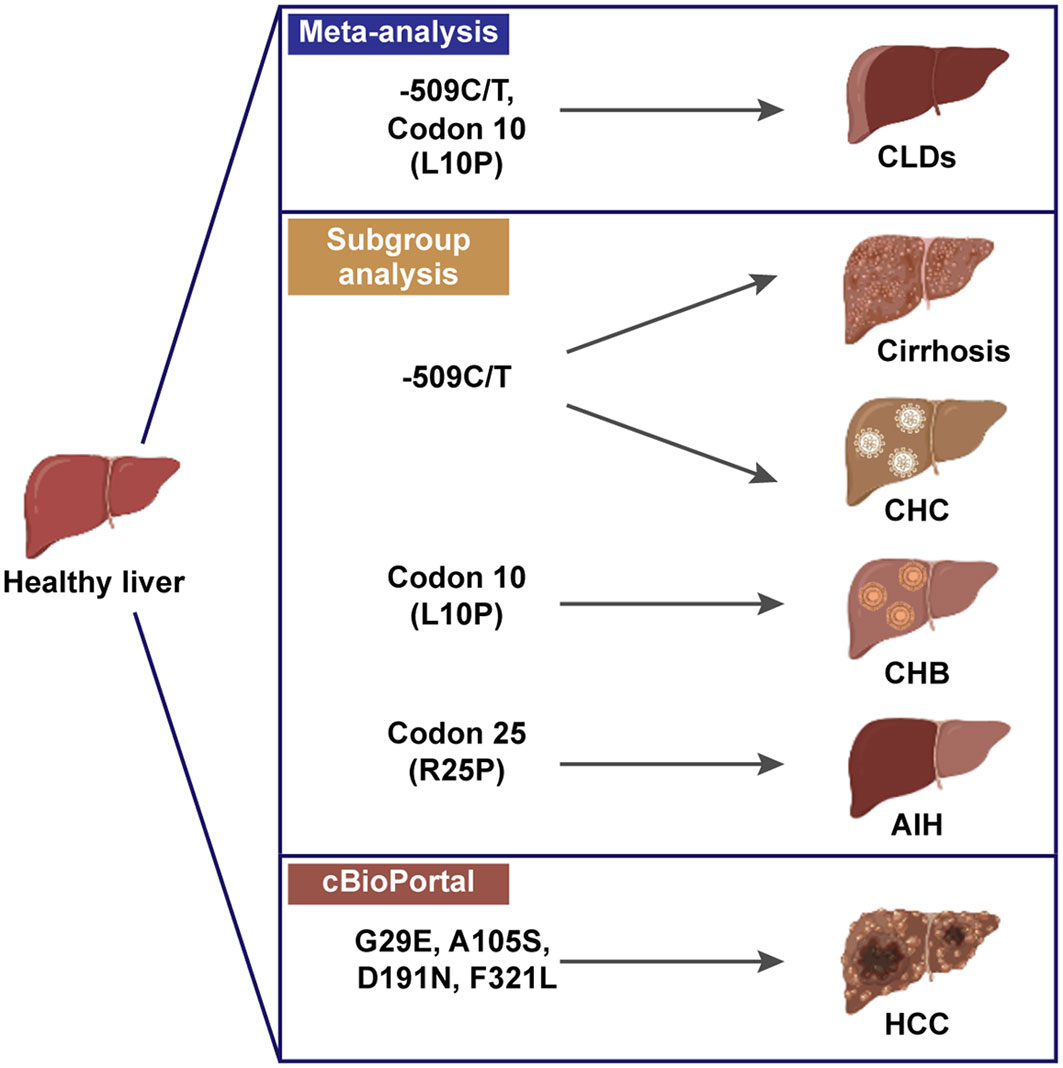
Figure 7 Schematic of TGF-β1 polymorphisms in susceptibility of CLDs, created in BioRender.com.
Data availability statement
The original contributions presented in the study are included in the article/Supplementary Material. Further inquiries can be directed to the corresponding authors.
Author contributions
Conceptualization, QW, JW, QH, BY, and XC. methodology, XC, HZ, ZY and YD. software, XC and ZY. validation, HZ, ZY, YD and XD. investigation, XC and ZY. data curation, JW, XC and ZY. writing—original draft preparation, QW, JW and XC. writing—review and editing, QW, JW and XC. All authors contributed to the article and approved the submitted version.
Funding
This research was funded by the Zhejiang Provincial Natural Science Foundation (No. LY22H310001, No. LR21H310001) and the Fundamental Research Funds for the Central Universities.
Conflict of interest
The authors declare that the research was conducted in the absence of any commercial or financial relationships that could be construed as a potential conflict of interest.
Publisher’s note
All claims expressed in this article are solely those of the authors and do not necessarily represent those of their affiliated organizations, or those of the publisher, the editors and the reviewers. Any product that may be evaluated in this article, or claim that may be made by its manufacturer, is not guaranteed or endorsed by the publisher.
Supplementary material
The Supplementary Material for this article can be found online at: https://www.frontiersin.org/articles/10.3389/fimmu.2022.1058532/full#supplementary-material
References
1. Marcellin P, Kutala BK. Liver diseases: A major, neglected global public health problem requiring urgent actions and large-scale screening. Liver Int (2018) 38:2–6. doi: 10.1111/liv.13682
2. Ramachandran P, Matchett KP, Dobie R, Wilson-Kanamori JR, Henderson NC. Single-cell technologies in hepatology: new insights into liver biology and disease pathogenesis. Nat Rev Gastroenterol Hepatol (2020) 17:457–72. doi: 10.1038/s41575-020-0304-x
3. Sepanlou SG, Safiri S, Bisignano C, Ikuta KS, Merat S, Saberifiroozi M, et al. The global, regional, and national burden of cirrhosis by cause in 195 countries and territories, 1990-2017: a systematic analysis for the global burden of disease study 2017. Lancet Gastroenterol (2020) 5:245–66. doi: 10.1016/S2468-1253(19)30349-8
4. Purohit V, Brenner DA. Mechanisms of alcohol-induced hepatic fibrosis: A summary of the Ron Thurman symposium. Hepatology (2006) 43:872–8. doi: 10.1002/hep.21107
5. Kim YJ, Lee HS. Single nucleotide polymorphisms associated with hepatocellular carcinoma in patients with chronic hepatitis b virus infection. Intervirology (2005) 48:10–5. doi: 10.1159/000082089
6. Han ZG. Functional genomic studies: Insights into the pathogenesis of liver cancer. Annu Rev Genom Hum G (2012) 13:171–205. doi: 10.1146/annurev-genom-090711-163752
7. Batlle E, Massague J. Transforming growth factor-beta signaling in immunity and cancer. Immunity (2019) 50:924–40. doi: 10.1016/j.immuni.2019.03.024
8. Matsuzaki K, Seki T, Okazaki K. TGF-beta signal shifting between tumor suppression and fibro-carcinogenesis in human chronic liver diseases. J Gastroenterol (2014) 49:971–81. doi: 10.1007/s00535-013-0910-2
9. Gough NR, Xiang XY, Mishra L. TGF-beta signaling in liver, pancreas, and gastrointestinal diseases and cancer. Gastroenterology (2021) 161:434–+. doi: 10.1053/j.gastro.2021.04.064
10. Larson C, Oronsky B, Carter CA, Oronsky A, Knox SJ, Sher D, et al. TGF-beta: a master immune regulator. Expert Opin Ther Targets (2020) 24:427–38. doi: 10.1080/14728222.2020.1744568
11. Gomes AL, Teijeiro A, Buren S, Tummala KS, Yilmaz M, Waisman A, et al. Metabolic inflammation-associated IL-17A causes non-alcoholic steatohepatitis and hepatocellular carcinoma. Cancer Cell (2016) 30:161–75. doi: 10.1016/j.ccell.2016.05.020
12. Chen J, Gingold JA, Su X. Immunomodulatory TGF-beta signaling in hepatocellular carcinoma. Trends Mol Med (2019) 25:1010–23. doi: 10.1016/j.molmed.2019.06.007
13. Paquissi FC. Immunity and fibrogenesis: The role of Th17/IL-17 axis in HBV and HCV-induced chronic hepatitis and progression to cirrhosis. Front Immunol (2017) 8. doi: 10.3389/fimmu.2017.01195
14. Li N, Yamamoto G, Fuji H, Kisseleva T. Interleukin-17 in liver disease pathogenesis. Semin Liver Dis (2021) 41:507–15. doi: 10.1055/s-0041-1730926
15. Karimi-Googheri M, Daneshvar H, Nosratabadi R, Zare-Bidaki M, Hassanshahi G, Ebrahim M, et al. Important roles played by TGF-beta in hepatitis b infection. J Med Virol (2014) 86:102–8. doi: 10.1002/jmv.23727
16. Tsuchida T, Friedman SL. Mechanisms of hepatic stellate cell activation. Nat Rev Gastroenterol Hepatol (2017) 14:397–411. doi: 10.1038/nrgastro.2017.38
17. Cai XY, Wang JJ, Wang JC, Zhou Q, Yang B, He QJ, et al. Intercellular crosstalk of hepatic stellate cells in liver fibrosis: New insights into therapy. Pharmacol Res (2020) 155:104720. doi: 10.1016/j.phrs.2020.104720
18. Kisseleva T, Brenner D. Molecular and cellular mechanisms of liver fibrosis and its regression. Nat Rev Gastroenterol Hepatol (2021) 18:151–66. doi: 10.1038/s41575-020-00372-7
19. Xiang TX, Cheng N, Li XN, Wu XP. Association between transforming growth factor-beta 1 polymorphisms and hepatocellular cancer risk: A meta-analysis. Hepatol Res (2012) 42:583–90. doi: 10.1111/j.1872-034X.2011.00958.x
20. Guo Y, Zang CB, Li YJ, Yuan L, Liu QJ, Zhang LY, et al. Association between TGF-beta 1 polymorphisms and hepatocellular carcinoma risk: A meta-analysis. Genet Test Mol Bioma (2013) 17:814–20. doi: 10.1089/gtmb.2013.0268
21. Wu XD, Zeng K, Gong CS, Chen JH, Chen YQ. Transforming growth factor-beta genetic polymorphisms on development of liver cirrhosis in a meta-analysis. Mol Biol Rep (2013) 40:535–43. doi: 10.1007/s11033-012-2090-1
22. Lu WQ, Qiu JL, Huang ZL, Liu HY. Enhanced circulating transforming growth factor beta 1 is causally associated with an increased risk of hepatocellular carcinoma: a mendelian randomization meta-analysis. Oncotarget (2016) 7:84695–704. doi: 10.18632/oncotarget.13218
23. Toshikuni N, Matsue Y, Minato T, Hayashi N, Tsuchishima M, Tsutsumi M. Association between transforming growth factor-beta 1-509 c > T variants and hepatocellular carcinoma susceptibility: A meta-analysis. J Gastroen Hepatol (2016) 31:423–3. doi: 10.4149/neo_2016_615
24. Guo P, Sun X, Feng X, Zhang C. Transforming growth factor-beta1 gene polymorphisms with liver cirrhosis risk: A meta-analysis. Infect Genet Evol (2018) 58:164–70. doi: 10.1016/j.meegid.2017.12.019
25. Zhang C, Ye Z, Zhang Z, Zheng J, Tang Y, Hou E, et al. A comprehensive evaluation of single nucleotide polymorphisms associated with hepatocellular carcinoma risk in Asian populations: A systematic review and network meta-analysis. Gene (2020) 735:144365. doi: 10.1016/j.gene.2020.144365
26. Gabriel A, Ziolkowski A, Radlowski P, Tomaszek K, Dziambor A. Hepatocyte steatosis in HCV patients promotes fibrosis by enhancing TGF-beta liver expression. Hepatol Res (2008) 38:141–6. 10.1111/j.1872-034X.2007.00258.x
27. Mohagheghi S, Geramizadeh B, Nikeghbalian S, Khodadadi I, Karimi J, Khajehahmadi Z, et al. Intricate role of yes-associated protein1 in human liver cirrhosis: TGF-beta1 still is a giant player. IUBMB Life (2019) 71:1453–64. doi: 10.1002/iub.2052
28. Wang B, Liu T, Wu JC, Lou SZ, Chen R, Lu LG, et al. STAT3 aggravates TGF-beta1-induced hepatic epithelial-to-mesenchymal transition and migration. BioMed Pharmacother (2018) 98:214–21. doi: 10.1016/j.biopha.2017.12.035
29. Peng L, Yuan XQ, Zhang CY, Ye F, Zhou HF, Li WL, et al. High TGF-beta1 expression predicts poor disease prognosis in hepatocellular carcinoma patients. Oncotarget (2017) 8:34387–97. doi: 10.18632/oncotarget.16166
30. Ning J, Ye Y, Bu D, Zhao G, Song T, Liu P, et al. Imbalance of TGF-beta1/BMP-7 pathways induced by M2-polarized macrophages promotes hepatocellular carcinoma aggressiveness. Mol Ther (2021) 29:2067–87. doi: 10.1016/j.ymthe.2021.02.016
31. Grainger DJ, Heathcote K, Chiano M, Snieder H, Kemp PR, Metcalfe JC, et al. Genetic control of the circulating concentration of transforming growth factor type beta1. Hum Mol Genet (1999) 8:93–7. doi: 10.1093/hmg/8.1.93
32. Dunning AM, Ellis PD, McBride S, Kirschenlohr HL, Healey CS, Kemp PR, et al. A transforming growth factor beta 1 signal peptide variant increases secretion in vitro and is associated with increased incidence of invasive breast cancer. Cancer Res (2003) 63:2610–5.
33. Taubenschuss E, Marton E, Mogg M, Frech B, Ehart L, Muin D, et al. The L10P polymorphism and serum levels of transforming growth factor beta1 in human breast cancer. Int J Mol Sci (2013) 14:15376–85. doi: 10.3390/ijms140815376
34. Moher D, Liberati A, Tetzlaff J, Altman DG, Grp P. Preferred reporting items for systematic reviews and meta-analyses: The PRISMA statement. J Clin Epidemiol (2009) 62:1006–12. doi: 10.1016/j.jclinepi.2009.06.005
35. GA Wells BS, O’Connell D, Peterson J, Welch V, Losos PT M, et al. The Newcastle-Ottawa Scale (NOS) for assessing the quality of nonrandomised studies in meta-analyses. (2011). Availabe at: http://www.ohri.ca/programs/clinical_epidemiology/oxford.asp.
36. Gao JJ, Aksoy BA, Dogrusoz U, Dresdner G, Gross B, Sumer SO, et al. Integrative analysis of complex cancer genomics and clinical profiles using the cBioPortal. Sci Signal (2013) 6:pl1. doi: 10.1126/scisignal.2004088
37. Ramachandran P, Dobie R, Wilson-Kanamori JR, Dora EF, Henderson BEP, Luu NT, et al. Resolving the fibrotic niche of human liver cirrhosis at single-cell level. Nature (2019) 575:512–8. doi: 10.1038/s41586-019-1631-3
38. Aran D, Looney AP, Liu L, Wu E, Fong V, Hsu A, et al. Reference-based analysis of lung single-cell sequencing reveals a transitional profibrotic macrophage. Nat Immunol (2019) 20:163–72. doi: 10.1038/s41590-018-0276-y
39. Ko J, Park H, Heo L, Seok C. GalaxyWEB server for protein structure prediction and refinement. Nucleic Acids Res (2012) 40:W294–297. doi: 10.1093/nar/gks493
40. Baek M, Park T, Heo L, Park C, Seok C. GalaxyHomomer: a web server for protein homo-oligomer structure prediction from a monomer sequence or structure. Nucleic Acids Res (2017) 45:W320–4. doi: 10.1093/nar/gkx246
41. Higgins JP, Thompson SG, Deeks JJ, Altman DG. Measuring inconsistency in meta-analyses. BMJ (2003) 327:557–60. doi: 10.1136/bmj.327.7414.557
42. Begg CB, Mazumdar M. Operating characteristics of a rank correlation test for publication bias. Biometrics (1994) 50:1088–101. doi: 10.2307/2533446
43. Egger M, Davey Smith G, Schneider M, Minder C. Bias in meta-analysis detected by a simple, graphical test. BMJ (1997) 315:629–34. doi: 10.1136/bmj.315.7109.629
44. Shih SC, Claffey KP. Role of AP-1 and HIF-1 transcription factors in TGF-beta activation of VEGF expression. Growth Factors (2001) 19:19–34. doi: 10.3109/08977190109001073
45. Martin-Gallausiaux C, Beguet-Crespel F, Marinelli L, Jamet A, Ledue F, Blottiere HM, et al. Butyrate produced by gut commensal bacteria activates TGF-beta1 expression through the transcription factor SP1 in human intestinal epithelial cells. Sci Rep-Uk (2018) 8:9742. doi: 10.1038/s41598-018-28048-y
46. Datto MB, Li JM, Shen X, Hu PP, Yu Y, Wang XF. Sp1, but not Sp3, functions to mediate promoter activation by TGF-beta through canonical Sp1 binding sites. Nucleic Acids Res (1998) 26:2449–56. doi: 10.1093/nar/26.10.2449
47. Chen H, Zhou Y, Chen KQ, An G, Ji SY, Chen QK, et al. Anti-fibrotic effects via regulation of transcription factor Sp1 on hepatic stellate cells. Cell Physiol Biochem (2012) 29:51–60. doi: 10.1159/000337586
48. Littlewood TD, Evan GI. Transcription factors 2: helix-loop-helix. Protein Profile (1995) 2:621–702.
49. Zhu Y, Casado M, Vaulont S, Sharma K. Role of upstream stimulatory factors in regulation of renal transforming growth factor-beta1. Diabetes (2005) 54:1976–84. doi: 10.2337/diabetes.54.7.1976
50. Wang SX, Skorczewski J, Feng X, Mei L, Murphy-Ullrich JE. Glucose up-regulates thrombospondin 1 gene transcription and transforming growth factor-beta activity through antagonism of cGMP-dependent protein kinase repression via upstream stimulatory factor 2. J Biol Chem (2004) 279:34311–22. doi: 10.1074/jbc.M401629200
51. Weigert C, Brodbeck K, Sawadogo M, Haring HU, Schleicher ED. Upstream stimulatory factor (USF) proteins induce human TGF-beta 1 gene activation via the glucose-response element-1013/-1002 in mesangial cells - up-regulation of USF activity by the hexosamine biosynthetic pathway. J Biol Chem (2004) 279:15908–15. doi: 10.1074/jbc.M313524200
52. Kim KS, Jung HS, Chung YJ, Jung TS, Jang HW, Lee MS, et al. Overexpression of USF increases TGF-beta1 protein levels, but G1 phase arrest was not induced in FRTL-5 cells. J Korean Med Sci (2008) 23:870–6. doi: 10.3346/jkms.2008.23.5.870
53. Qing J, Zhang Y, Derynck R. Structural and functional characterization of the transforming growth factor-beta -induced Smad3/c-jun transcriptional cooperativity. J Biol Chem (2000) 275:38802–12. doi: 10.1074/jbc.M004731200
54. Thakur N, Hamidi A, Song J, Itoh S, Bergh A, Heldin CH, et al. Smad7 enhances TGF-beta-Induced transcription of c-jun and HDAC6 promoting invasion of prostate cancer cells. iScience (2020) 23:101470. doi: 10.1016/j.isci.2020.101470
55. Liu F, Shang YX. Sirtuin 6 attenuates epithelial-mesenchymal transition by suppressing the TGF-beta1/Smad3 pathway and c-jun in asthma models. Int Immunopharmacol (2020) 82:106333. doi: 10.1016/j.intimp.2020.106333
56. Yue J, Mulder KM. Requirement of Ras/MAPK pathway activation by transforming growth factor beta for transforming growth factor beta 1 production in a smad-dependent pathway. J Biol Chem (2000) 275:35656. doi: 10.1016/S0021-9258(20)88877-2
57. Shi M, Zhu J, Wang R, Chen X, Mi L, Waltz T, et al. Latent TGF-beta structure and activation. Nature (2011) 474:343–9. doi: 10.1038/nature10152
58. Hinck AP, Mueller TD, Springer TA. Structural biology and evolution of the TGF-beta family. Cold Spring Harb Perspect Biol (2016) 8:a022103. doi: 10.1101/cshperspect.a022103
59. ten Dijke P, Arthur HM. Extracellular control of TGFbeta signalling in vascular development and disease. Nat Rev Mol Cell Biol (2007) 8:857–69. doi: 10.1038/nrm2262
61. Xu LX, He MH, Dai ZH, Yu J, Wang JG, Li XC, et al. Genomic and transcriptional heterogeneity of multifocal hepatocellular carcinoma. Ann Oncol (2019) 30:990–7. doi: 10.1093/annonc/mdz103
62. Moretti S, Pinzi C, Berti E, Spallanzani A, Chiarugi A, Boddi V, et al. In situ expression of transforming growth factor beta is associated with melanoma progression and correlates with Ki67, HLA-DR and beta 3 integrin expression. Melanoma Res (1997) 7:313–21. doi: 10.1097/00008390-199708000-00006
63. Vousden KH, Prives C. Blinded by the light: The growing complexity of p53. Cell (2009) 137:413–31. doi: 10.1016/j.cell.2009.04.037
Keywords: transforming growth factor-β1, polymorphisms, susceptibility, chronic liver disease, cirrhosis
Citation: Cai X, Zha H, Yang Z, Du Y, Dai X, Yang B, Wang J, He Q and Weng Q (2022) Genetic dominance of transforming growth factor-β1 polymorphisms in chronic liver disease. Front. Immunol. 13:1058532. doi: 10.3389/fimmu.2022.1058532
Received: 30 September 2022; Accepted: 31 October 2022;
Published: 16 November 2022.
Edited by:
Yujing Zhang, Nanjing University, ChinaReviewed by:
Theodore Cory, University of Tennessee Health Science Center (UTHSC), United StatesDameng Li, Xuzhou Medical University, China
Copyright © 2022 Cai, Zha, Yang, Du, Dai, Yang, Wang, He and Weng. This is an open-access article distributed under the terms of the Creative Commons Attribution License (CC BY). The use, distribution or reproduction in other forums is permitted, provided the original author(s) and the copyright owner(s) are credited and that the original publication in this journal is cited, in accordance with accepted academic practice. No use, distribution or reproduction is permitted which does not comply with these terms.
*Correspondence: Qinjie Weng, d2VuZ3FpbmppZUB6anUuZWR1LmNu; Qiaojun He, cWlhb2p1bmhlQHpqdS5lZHUuY24=; Jiajia Wang, d2FuZ2ppYWppYTMzMDFAemp1LmVkdS5jbg==