 Huiping Li1*
 Meixin Hu1
 Zhuxi Huang2,3
 Yi Wang1Ying Xu2,3Jingxin Deng1Ming Zhu2,3
 Weijun Feng2,3*Xiu Xu1*
- 1Department of Child Health Care, Children’s Hospital of Fudan University, National Children’s Medical Center, Shanghai, China
- 2Institute of Pediatrics, Children’s Hospital of Fudan University, Shanghai, China
- 3Shanghai Key Laboratory of Medical Epigenetics, International Co-laboratory of Medical Epigenetics and Metabolism, Institutes of Biomedical Sciences, Shanghai Medical College, Fudan University, Shanghai, China
Methyl CpG binding protein 2 (MeCP2) is a DNA methylation reader protein. Mutations in MeCP2 are the major cause of Rett syndrome (RTT). Increasing evidence has shown that dysregulated immunity and chronic subclinical inflammation are linked to MeCP2 deficiency and contribute to RTT development and deterioration. The meninges surrounding the central nervous system (CNS) contain a wide repertoire of immune cells that participate in immune surveillance within the CNS and influence various brain functions; however, the characterization and role of meningeal immunity in CNS with MeCP2 deficiency remain poorly addressed. Here, we used single-cell sequencing to profile Mecp2-deficient meningeal immune cells from the dura mater, which has been reported to contain the most meningeal immune cells during homeostasis. Data showed that the meninges of Mecp2-null mice contained the same diverse immune cell populations as control mice and showed an up-regulation of immune-related processes. B cell populations were greater in Mecp2-null mice than in control mice, and the expression of genes encoding for immunoglobulins was remarkably higher. Mecp2-deficient meninges also contained more cytotoxic CD8+ T cells than control meninges. With increased interferon-γ transcription in T and natural killer cells, meningeal macrophages showed decreased suppression and increased activity in Mecp2-deficienct mice. Together, these findings provide novel insights into meningeal immunity, which is a less studied aspect of neuroimmune interactions in Mecp2-mutated diseases, and offer an essential resource for comparative analyses and data exploration to better understand the functional role of meningeal immunity in RTT.
Introduction
Methyl CpG binding protein 2 (MeCP2) is a DNA methylation reader protein, which is able to recognize DNA and histone methylation marks and acts as a methylation-dependent transcriptional modulator within the context of chromatin (1). MeCP2 exerts both transcriptionally repressive and activating functions by interacting with various cofactors, thereby affecting a myriad of genes. MeCP2 mutations account for 90-95% of classic Rett syndrome (RTT) cases and typically cause the deterioration of acquired psychomotor skills, including the regression of motor and communicative skills, repetitive hand movements, seizures, irregular breathing, ataxia, and autistic features (2).
Although the loss of functional MeCP2 in neurons is thought to cause the majority of symptoms associated with RTT, increasing evidence has shown that dysregulated immunity and chronic subclinical inflammation are also linked to MeCP2 deficiency (3). For instance, several studies have highlighted the role of microglia, which are the primary brain-resident macrophages, in RTT during brain development (4, 5). Additionally, MeCP2 can regulate T cells by influencing the expression of the Forkhead box P3 (Foxp3) transcription factors (6), and MeCP2 deficiency has been associated with enhanced NF-κB signaling in human peripheral blood mononuclear cells (PBMCs) and the human monocyte line THP1 (7).
The meninges surrounding the central nervous system (CNS) comprise a triple layer of membranes, including the pia mater, arachnoid mater, and dura mater. In recent years, the meninges have been found to not only physically protect the CNS, but to also contain a wide repertoire of immune cells that constitute meningeal immunity. Meningeal immune cells and the cytokines they produce participate in immune surveillance within the CNS; influence the response to CNS injury (8) and chronic neurodegenerative conditions; and regulate higher brain functions, such as cognition and social behavior (9). Notably, meningeal macrophages are lost during disease progression in Mecp2-null mice (10). Although macrophages are the major cell population in the meninges (11, 12), the characteristics and roles of meningeal immunity in the CNS with MeCP2 deficiency remain poorly understood.
Here, we applied a single-cell sequencing to profile Mecp2-deficient meningeal immune cells from the dura mater, which has been reported to have the most numerous meningeal immune cells in homeostasis (13).
Methods
2.1. Mice
Female B6.129P2(C)-Mecp2tm1.1Bird/J (Heterozygous Mecp2 knockout, Jax:003890) mice were purchased from the Jackson Laboratory (Bar Harbor, ME, USA) and maintained in laboratory on a C57BL/6 background. The mice were maintained and bred in-house under standard 12-h light-dark cycle conditions. They were provided with standard rodent chow and sterilized tap water ad libitum. Male B6.129P2(C)-Mecp2tm1.1Bird/J mice (Hemizygote Mecp2 knockout, Mecp2-null mice) at 4-8 weeks of age were used for the experiments, and age-matched wild-type (WT) mice were used as controls. All experiments were approved by the Institutional Animal Care and Use Committee of Fudan University (No. 2019-289).
2.2. Isolation of CD45-positive cells from whole dura matter
One-month-old mice were euthanized by an overdose of Avertin (2, 2, 2-Tribromoethanol, 20 mg/mL) and transcardially perfused with 20 mL ice-cold phosphate-buffered saline (PBS). The mice were immediately decapitated posterior to the occipital bone. After the removal of the overlying skin and muscles from the skull, the dorsal part of the skull was carefully removed to isolate the dura. Then, the dura was cut into small pieces in ice-cold RPMI 1640 medium (Gibco, Thermo Fisher Scientific, Waltham, MA, USA) and incubated with an enzyme mix (0.25% Trypsin and 10 U mL-1 collagenase type I) at 37°C for 15 min. The solution was gently passed through 70 mm nylon mesh cell strainers using a sterile plastic plunger to yield a single-cell suspension. The single-cell suspension was then centrifuged at 300 g for 10 min. After the supernatant was removed completely, the cell pellet was resuspended in FACS buffer (pH 7,4; 0.1 M PBS; 1 mM Ethylene-Diamine-Tetra-Acetic acid (EDTA); 1% bovine serum albumin (BSA)). CD45-positive cells were subjected to magnetic separation using CD45 MicroBeads (Miltenyi Biotec, Bergisch Gladbach, Germany) according to the manufacturer’s instructions. The cells were placed on ice during all steps except during enzymatic digestion and were prepared for single-cell RNA sequencing (scRNA-seq) or flow cytometry.
2.3. ScRNA-seq using 10x Genomics platform
Single CD45+ immune cells were freshly isolated from the dura using the procedure described above. For Mecp2-null mice, dura from three individual mice were pooled and the experiments were repeated twice. For WT mice, the dura from two and three individual mice were pooled in two repeated experiments. Sequencing was performed by OE Biotech Co., Ltd. (Shanghai, China). Cellular suspensions were loaded onto a GemCode Single Cell Instrument (10x Genomics, Pleasanton, CA, USA) to generate single-cell gel beads-in-emulsion (GEMs) and scRNA-seq libraries using Chromium Next GEM Single Cell 3′ Gel Beads and Library Kit v3.1 (10x Genomics) according to the manufacturer’s instructions. RNA transcripts were uniquely barcoded within single cells and reverse-transcribed into barcoded cDNAs to generate a single multiplexed library. Indexed libraries were sequenced using a NovaSeq 6000 System (Illumina, San Diego, CA, USA) with 2 × 150 paired-end reads.
2.4. ScRNA-seq data processing
We processed the unique molecular identifier (UMI) count matrix using the Seurat R package (v3.1.1) (14). Cellular barcodes were demultiplexed using the Cell Ranger software pipeline (v5.0.0) provided by 10× Genomics. Cells with log10GenesPerUMI <0.7 were filtered out to remove low-quality cells and likely multiplet captures. Low-quality cells with >10% of the counts belonging to mitochondrial genes and >5% of the counts belonging to hemoglobin genes were discarded. DoubletFinder package (v2.0.2) was used to identify potential doublets (15). After applying these quality control criteria, 12,129 cells from Mecp2-null mice and 13,794 cells from WT mice were included in downstream analyses. Library size normalization was performed using the NormalizeData function in Seurat. Gene expression measurements for each cell were normalized to total expression using “LogNormalize”, multiplied by a scaling factor (10,000 by default), and the results were log-transformed.
Cells were visualized using a two-dimensional Uniform Manifold Approximation and Projection (Umap) algorithm with the RunnUMAP function. The FindVariableGenes, FindClusters, and FindAllMarkers functions in Seurat were used to select variable genes, cluster cells, and identify marker genes, respectively. Differentially expressed genes (DEGs) were identified using the FindMarkers function. P value < 0.05 and |log2foldchange| > 0.58 were set as the thresholds for significant differential expression. Gene ontology (GO) enrichment, Kyoto encyclopedia of genes and genomes (KEGG) pathway enrichment analysis, gene set variation analysis (GSVA), single-cell rEgulatory network inference and clustering (SCENIC), cell-cell communication, and pseudotime analysis were performed as described in previous studies (16–20).
2.5. Intracisterna magna injection
For meningeal lymphatic drainage experiments, intracisterna magna (i.c.m.) injection was performed as described previously (21). After mice were anaesthetized by intraperitoneal injection with Avertin (250μL/10g), skin on the back of the neck was shaved and cleaned with 75% ethanol, and a 1 cm midline incision was made to expose the cisterna magna. Next, the cisterna magna was injected slowly with 2 μL of fluorescent beads (FluoSpheres Carboxylate-Modified Microspheres, yellow-green, 0.5μm, ThermoFisher) using micro-syringes (Figure 1F). After injection, the needle was left in place for 2 min to avoid cerebrospinal fluid (CSF) backflow. The mice were then sutured and allowed to recover on a heating pad. Deep cervical lymph nodes (dCLNs), which are the major meningeal lymphatic draining lymph nodes (21, 22), were harvested 2 h after i.c.m. injection for immunofluorescence staining.
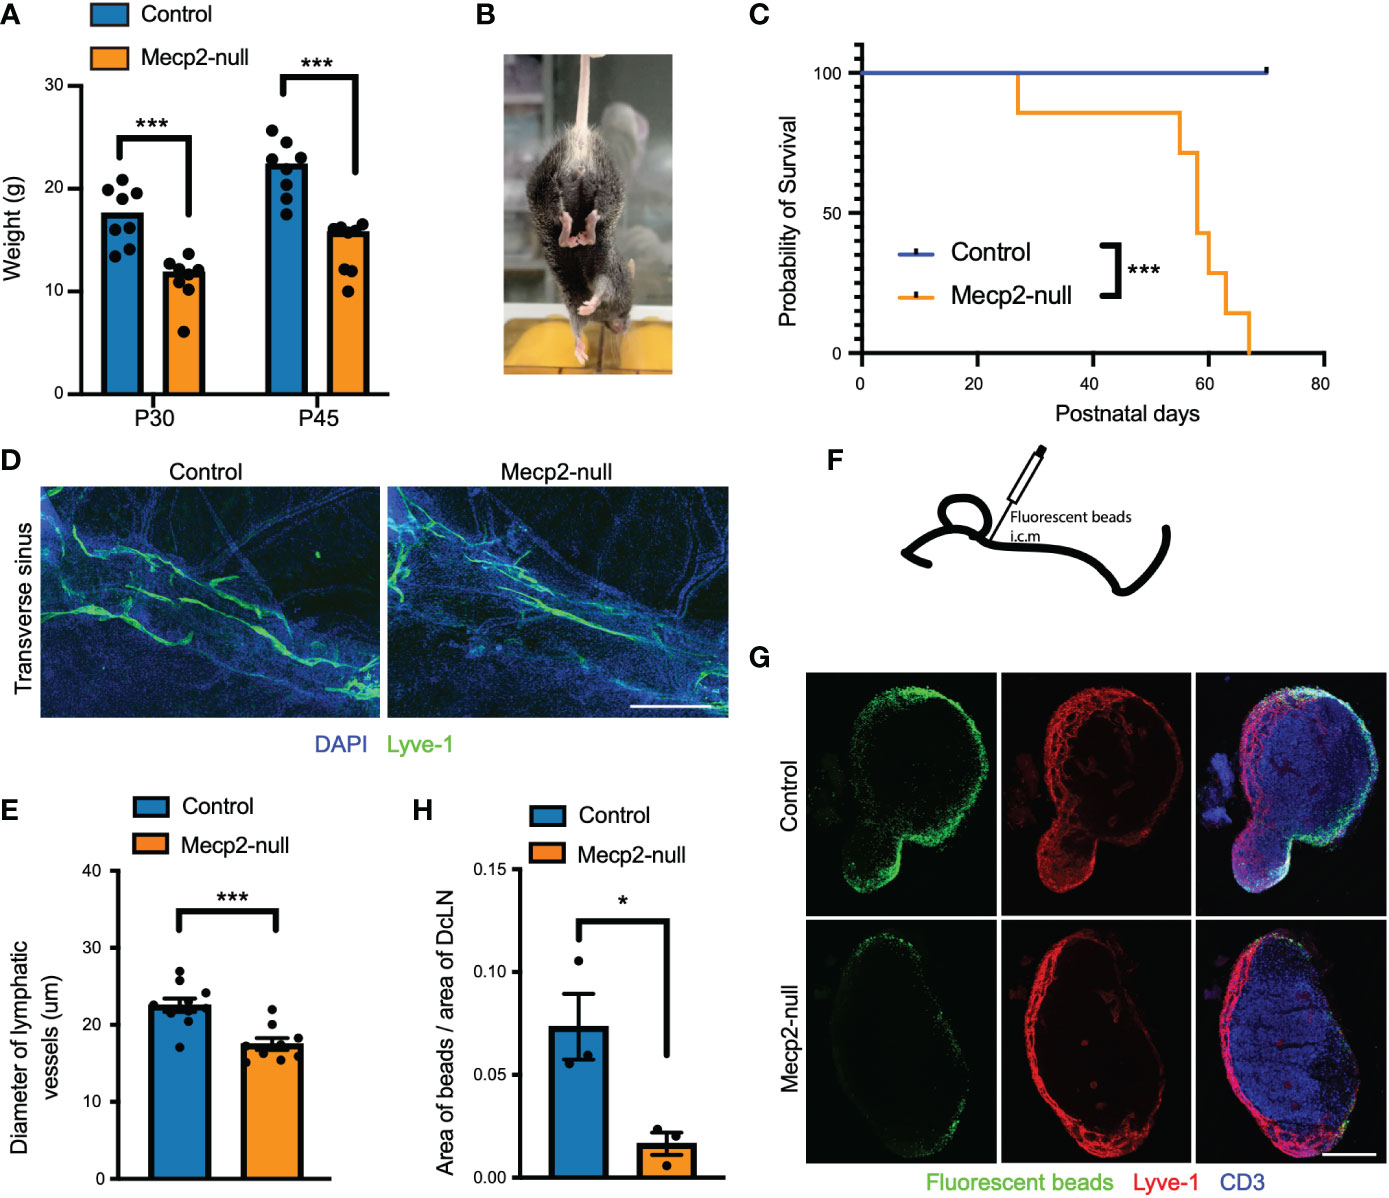
Figure 1 RTT-like phenotypes and deficiency of meningeal lymphatics in Mecp2-null mice. (A) Bar graph showing retarded growth of Mecp2-null mice compared to control at postnatal days 30 and 45 (n=8). P=0.0003 (P30) and P=0.00006 (P45), multiple t tests. (B) Representative images of hindlimb clasping in a Mecp2-null mouse at postnatal day 45. (C) Kaplan-Meier survival plot for control and Mecp2-null mice. (n=7 per group). P=0.0001 by the Log-rank test. (D) Representative images of the transverse sinus of dura maters with Lyve-1 (green) staining for 1-month-old control and Mecp2-null mice. Scale bars: 500μm. (E) Quantification of the diameter of Lyve-1+ lymphatic vessels (n=10 for control mice; n=9 for Mecp2-null mice). Data represent the mean ± SEM. P = 0.0005, two-tailed unpaired t test. (F) Schematic of intracisterna magna injection with fluorescent beads. (G) Representative images showing dCLNs with fluorescent beads (green), Lyve-1 (red), and CD3 (blue) staining in control and Mecp2-null mice. Scale bars: 250μm. (H) Quantification of the percentage of fluorescent beads coverage of the dCLNs from control and Mecp2-null mice (n=3 per group). Data represent the mean ± SEM. P = 0.0281, two-tailed unpaired t test. *p < 0.05, ***p < 0.001.
2.6. Flow cytometry
CD45-positive cells isolated from the dura mater were stained for extracellular markers using rat anti-CD45 FITC-conjugated (11-0451-82; eBioscience), rat anti-CD3 PE-conjugated (12-0193-82; eBioscience), and rat anti-CD11b APC-conjugated (17-0112-82; eBioscience). Live/dead cells were selected using a Zombie Aqua Fixable Viability Kit (423101, BioLegend). Fluorescence data were collected using a FACSCelesta flow cytometer (BD Company) and analyzed using FlowJo software (v10). Cells were gated using the height, area, forward and side scatter, and live cells with negative Zombie Aqua staining. Cells were gated for the appropriate markers of cell types.
2.7. Immunofluorescence staining
After transcardial perfusion with ice-cold PBS and 4% paraformaldehyde (PFA), whole dura maters with the skullcap or dCLNs were dissected from one-month-old mice and post-fixed in 4% PFA at 4 °C. Dura maters were then peeled from the skullcap. The dCLNs were dehydrated using PBS containing 30% sucrose and sliced into 40 μm-thick sections onto gelatin-coated slides. For immunohistochemistry, dura maters or dCLNs sections were incubated in blocking buffer (PBS containing 1% BSA, 2% donkey serum, 0.2% Triton X-100, and 0.1% Tween 20) for 1 h at room temperature (RT). Then, dura maters or sections were moved to appropriate dilutions of the following primary antibodies in blocking buffer for overnight at 4°C: rat anti-CD3 eFluor 660-conjugated (1:200; 50-0032-82; eBioscience), rat anti-Lyve-1 AF488-conjugated (1:200; 53-0443-82; eBioscience), rat anti-Lyve-1 eFluor 570-conjugated (41-0443-82, eBioscience), rat anti-IFN-γ PE/Cyanine7-conjugated (1:200; 505826; BioLegend), and rabbit anti-MeCP2 (1:200; 3456; Cell Signaling). Goat anti-rabbit Alexa Fluor 594 secondary antibody (1:1000; A-11012; Invitrogen) were incubated 1 hour at RT in necessity. Before whole-mounted with Aqua-Mount (Lerner) under coverslips, dura maters or dCLNs sections were staining with 1:10000 DAPI (Sigma-Aldrich) and washed with PBST (PBS containing 0.2% Triton X-100 and 0.1% Tween 20) 3 times for 15 min at RT.
Images were acquired using Leica TSC SP8 confocal system with a 10× (0.4 NA), 20× (0.75 NA), or 40× (0.85 NA) objectives. FIJI software (NIH) was used for image quantitative assessments. The diameter of lymphatic vessels was measured each 50 μm alongside the transverse sinus of dura mater, and the mean was calculated for each sample. Bead coverage in the dCLNs was quantified by dividing the area of GFP fluorescence over the area of the lymph node, as indicated by Lyve-1 and CD3 staining. The density of CD3-positive cells or IFN-γ was determined by dividing the number of CD3-labeled cells or the IFN-γ-positive area per section by the area of dura maters.
2.8. Statistical analysis
Statistical analysis was performed by GraphPad PRISM 8. Data were compared using two-tailed unpaired Student’s t-tests, multiple t tests, and Kaplan-Meier survival plot. Statistical significance was defined as p < 0.05.
Results
3.1. RTT-like phenotypes and meningeal lymphatics in Mecp2-null mice
As reported previously (5, 23), Mecp2-null mice (male B6.129P2(C)-Mecp2tm1.1Bird/J) displayed RTT-like phenotypes, including significantly retarded growth, hindlimb clasping, and short postnatal life expectancy (Figures 1A–C). In addition, we observed meningeal lymphatics deficiency in Mecp2-null mice, as indicated by a decrease in the diameter of meningeal lymphatic vessels (Figures 1D, E) and a decrease in the drainage of CSF fluorescent beads from the cisterna magna into dCLNs (Figures 1G, H). Meningeal lymphatics play important roles in the development and recirculation of CNS immune cells (21, 24); hence, these observations suggest that meningeal immunity may be altered in Mecp2-null mice.
3.2. Meningeal immune cell diversity
To identify meningeal immune changes associated with Mecp2 deficiency, we generated 12,129 and 13,794 high-quality single-cell transcriptomes for meningeal immune cells (CD45+ cells) from six Mecp2-null and five WT mice, respectively (Figure 2A). Cells from the various mice were also pooled into a single dataset, and color-coded Umap plots were generated to visualize the origin of each cell (Figure 2B). Immune cells formed 18 major clusters that expressed varying levels of Ptprc, a gene encoding CD45 (Supplementary Figure S1A, B). We classified the different cell types based on the expression levels of the most variable genes and the shared expression features of known marker genes (Figure 2C; Supplementary Figure S1C). Consistently with the results of previous studies on Mecp2 in immune system (6, 10), we found that meningeal immune cells expressed Mecp2 (Supplementary Figure S2).

Figure 2 Single-cell transcriptomics survey of dura immune cells from WT and Mecp2-deficienct mice. (A) Schematic of the experimental approach (created with Biorender.com). 10× chromium scRNA-seq for CD45+ immune cells isolated from dura maters of 1-month-old WT (control) and Mecp2-deficienct (Mecp2-null) mice. (B) Umap plot displaying 10 dura immune cell types from control and Mecp2-null mice. Colored show annotated cell types. (C) Violin plots showing the expression levels of 13 specific marker genes for different cell types. (D) Frequency of each cell type in control and Mecp2-null mice. (E) Heatmap of group-specific DEGs. Color indicates relative gene expression, with representative genes shown together. (F) The top 30 most enriched GO terms for DEGs in control and Mecp2-null group.
The dura maters of both control and Mecp2-null mice contained diverse immune cell populations, including macrophages, B cells, dendritic cells (DCs), monocytes, neutrophils, mast cells, T cells, innate lymphoid cells-2 (ILC-2), and natural killer (NK) cells (Figure 2B). Obvious differences in the cell populations were observed between Mecp2-null mice and control mice, with a loss of macrophages and an increase in B cells (Figure 2D). According to previous studies (5, 10), Mecp2 deficiency causes the decline of macrophages and microglia, which are specific types of myeloid cells resident in the brain. Surprisingly, we found that the frequency of B cell populations was almost 1.5 times higher in Mecp2-null mice. The expression of genes encoding immunoglobulins, such as Ighg2c, Igha, Ighg2b, Igkc, Iglc2, Iglc1, and Iglc3, was also markedly higher in Mecp2-null mice than in control mice (Figure 2E). Other DEGs included CC chemokine (Ccl8), histones (Hist1h1e, Hist1h1c), transcription factor (Fos), protein phosphatase (Dusp2), and thioredoxin-binding protein (Txnip) (Figure 2E; Supplementary Data Sheet 1). GO enrichment analysis revealed the up-regulation of immune-related processes and regulation of transcription in Mecp2-null mice, including the B cell receptor signaling pathway, innate immune response, and DNA-transcription factor activity (Figure 2F).
3.3. Meningeal B cell activity
Although B cells accounted for the main changes observed in the meninges of Mecp2-null mice, little is known about their characteristics under homeostasis. We also observed an increase in the B cell population in the dura maters of Mecp2-null mice by flow cytometry (Figure 3A). The B cell population was then re-clustered into seven clusters (C1 to C7) on a single Umap space (Figure 3B). B cells from the Mecp2-null and control mice occupied overlapping territories; however, the frequencies of C2 and C3 were reversed between the two groups (Figure 3C). Consistent with previous studies by Wang et al. (25) and Brioschi et al. (26), the seven sub-clusters formed a consecutive development trajectory of B lineage cells (Figure 3D). Mature B cells (C1 and C3) expressed high levels of Ighd, Ighm, and Ms4a1. Meanwhile, immature B cells (C2) expressed high levels of Ighm, but not Ighd. In cycling pre-B cells (C4 and C5) the expression of Top2a, H2afx, and Mki67 was upregulated. Pre-B cells (C6) expressed high levels of Vpreb1, Vpreb3, Dntt, Lef1, and Rag1, while plasma cells (C7) highly expressed Prdm1 and Il10.
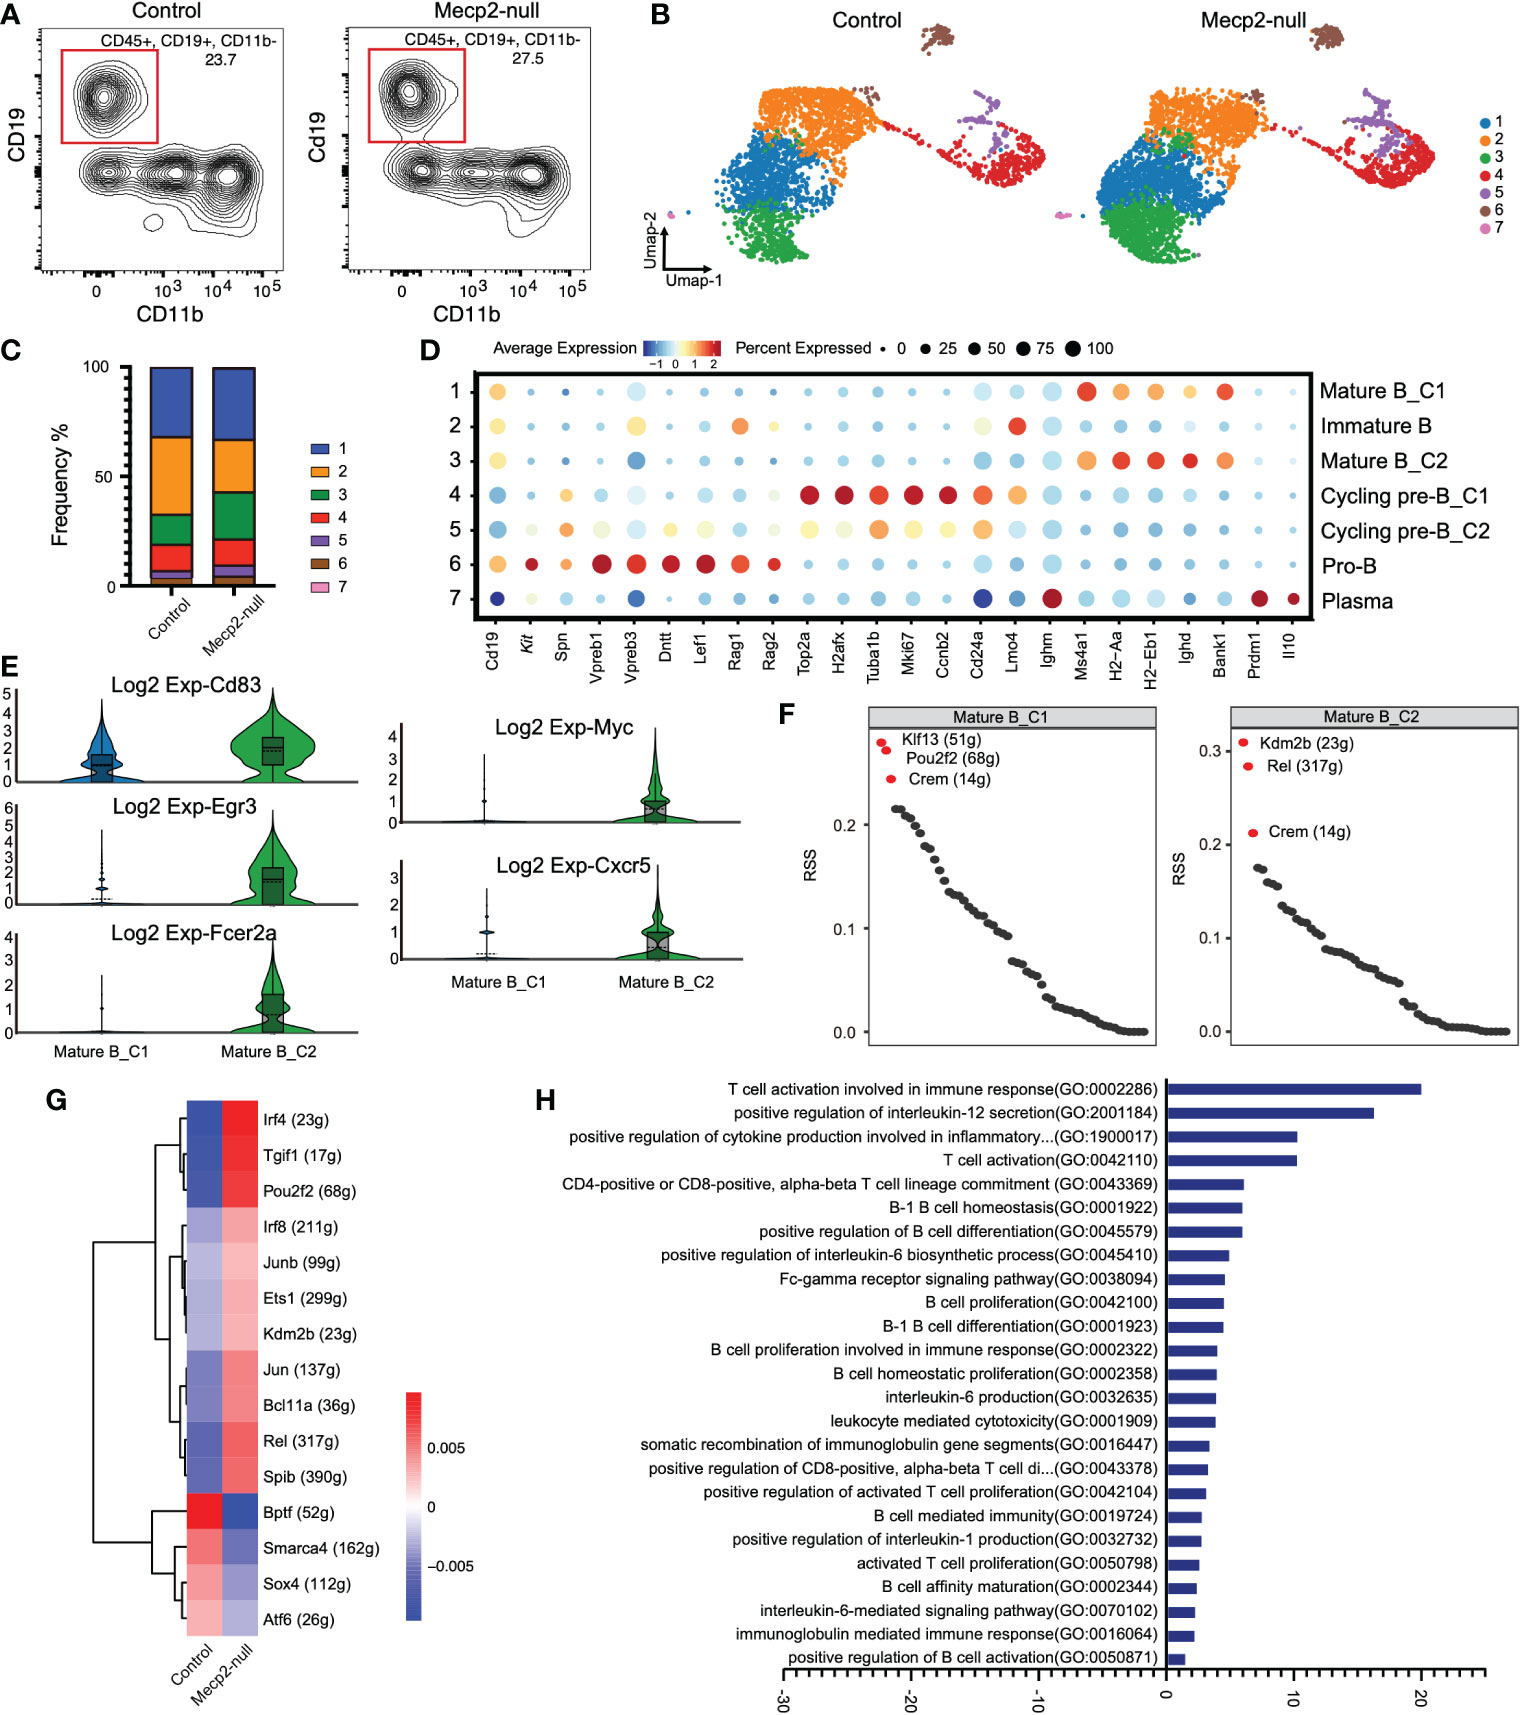
Figure 3 Gene expression and characterization of B cells compared to control and Mecp2-null mice. (A) Representative flow cytometry contour plot showing the proportion of B cells within the CD45+ population in the dura of control and Mecp2-null mice. B cells were gated as CD45+CD19+ and CD11b-. n=3 for each group. (B) Distribution of seven B cell clusters on the Umap plot for two groups. Clusters are rank-ordered by size. (C) Bar plots showing cell cluster distribution within different groups. (D) Dot plots displaying the relative expression of selected B cell marker genes (columns) across clusters (rows) in (B). Dot size indicates the fraction of cells in the clusters that express a gene. Color indicates the Z-score of mean gene expression in the cluster (Z-score of average log2). (E) Violin plots of Cd83, Egr3, Fcer2a, Myc, and Cxcr5 expression in control and Mecp2-null mice. (F) Rank for regulons in cluster1 and cluster2 of mature B cells (Mature B_C1 and Mature B_C2) based on regulon specificity score (RSS). (G) Heatmap of regulon activity score (RAS) in two groups. Rows represent different regulons and columns represent mouse groups. (H) Bar plot showing different enriched pathways comparing in Mecp2-null and control mice determined using GSVA. T-values > 0 represent up-regulated pathways.
In Mecp2-null mice, the C3 cluster of mature B cells (Mature B_C2) expanded and strongly expressed B cell activation markers, such as Cd83, Egr3, Fcer2a, Myc, and Cxcr5 (Figure 3E). Analysis of the regulon most highly associated with this subset revealed a high regulon specificity score for transcription factors Kdm2b, Rel, and Crem compared to the mature B_C1 cluster (C1) (Figure 3F). The regulon activity heatmap also showed increased activities for Kdm2b and Rel in Mecp2-null mice (Figure 3G).
In addition, we ranked the estimated pathway activities for individual B cells using GSVA. This approach revealed the strong enrichment of T cell activation involved in the immune response, positive regulation of Il-12 secretion, positive regulation of cytokine production involved in the inflammatory response, and B cell activation and proliferation (Figure 3H).
3.4. Cytotoxic activity of T lymphocytes
To better understand T cell activation in Mecp2-deficient mice, we re-clustered ILC2s, NK cells, and T cells into seven clusters (Figure 4A). The major cell types were identified by defining genes for CD4+ T cells (C1) characterized by Cd3e and Cd4 expression; CD8+ T cells (C2) characterized by Cd3e and Cd8 expression; ILC2s (C3) characterized by Gata3 expression; NK cells (C4) characterized by Nrc1 and Klrd1 expression and without Cd3e expression; NKT cells (C5) characterized by Cd3 and Klrd1 expression; regulatory T cells (Treg, C6) characterized by Cd3e, Cd4, and Foxp3 expression; and γ-δ T cells (C7) characterized by Cd3e and Tcrg-C1 expression (Figure 4B). The frequencies of ILC2, NK cell, and T cell populations were affected by Mecp2 deficiency. Mecp2-null mice had higher frequencies of CD4+ T cells, CD8+ T cells, NK, and NKT cells. In contrast, the frequencies of ILC2s and γ-δ T cells were lower (Figure 4C). Immunofluorescence staining for CD3 also showed a higher density of CD3 positive cells in dura mater of Mecp2-null mice (Figures 4D, E).
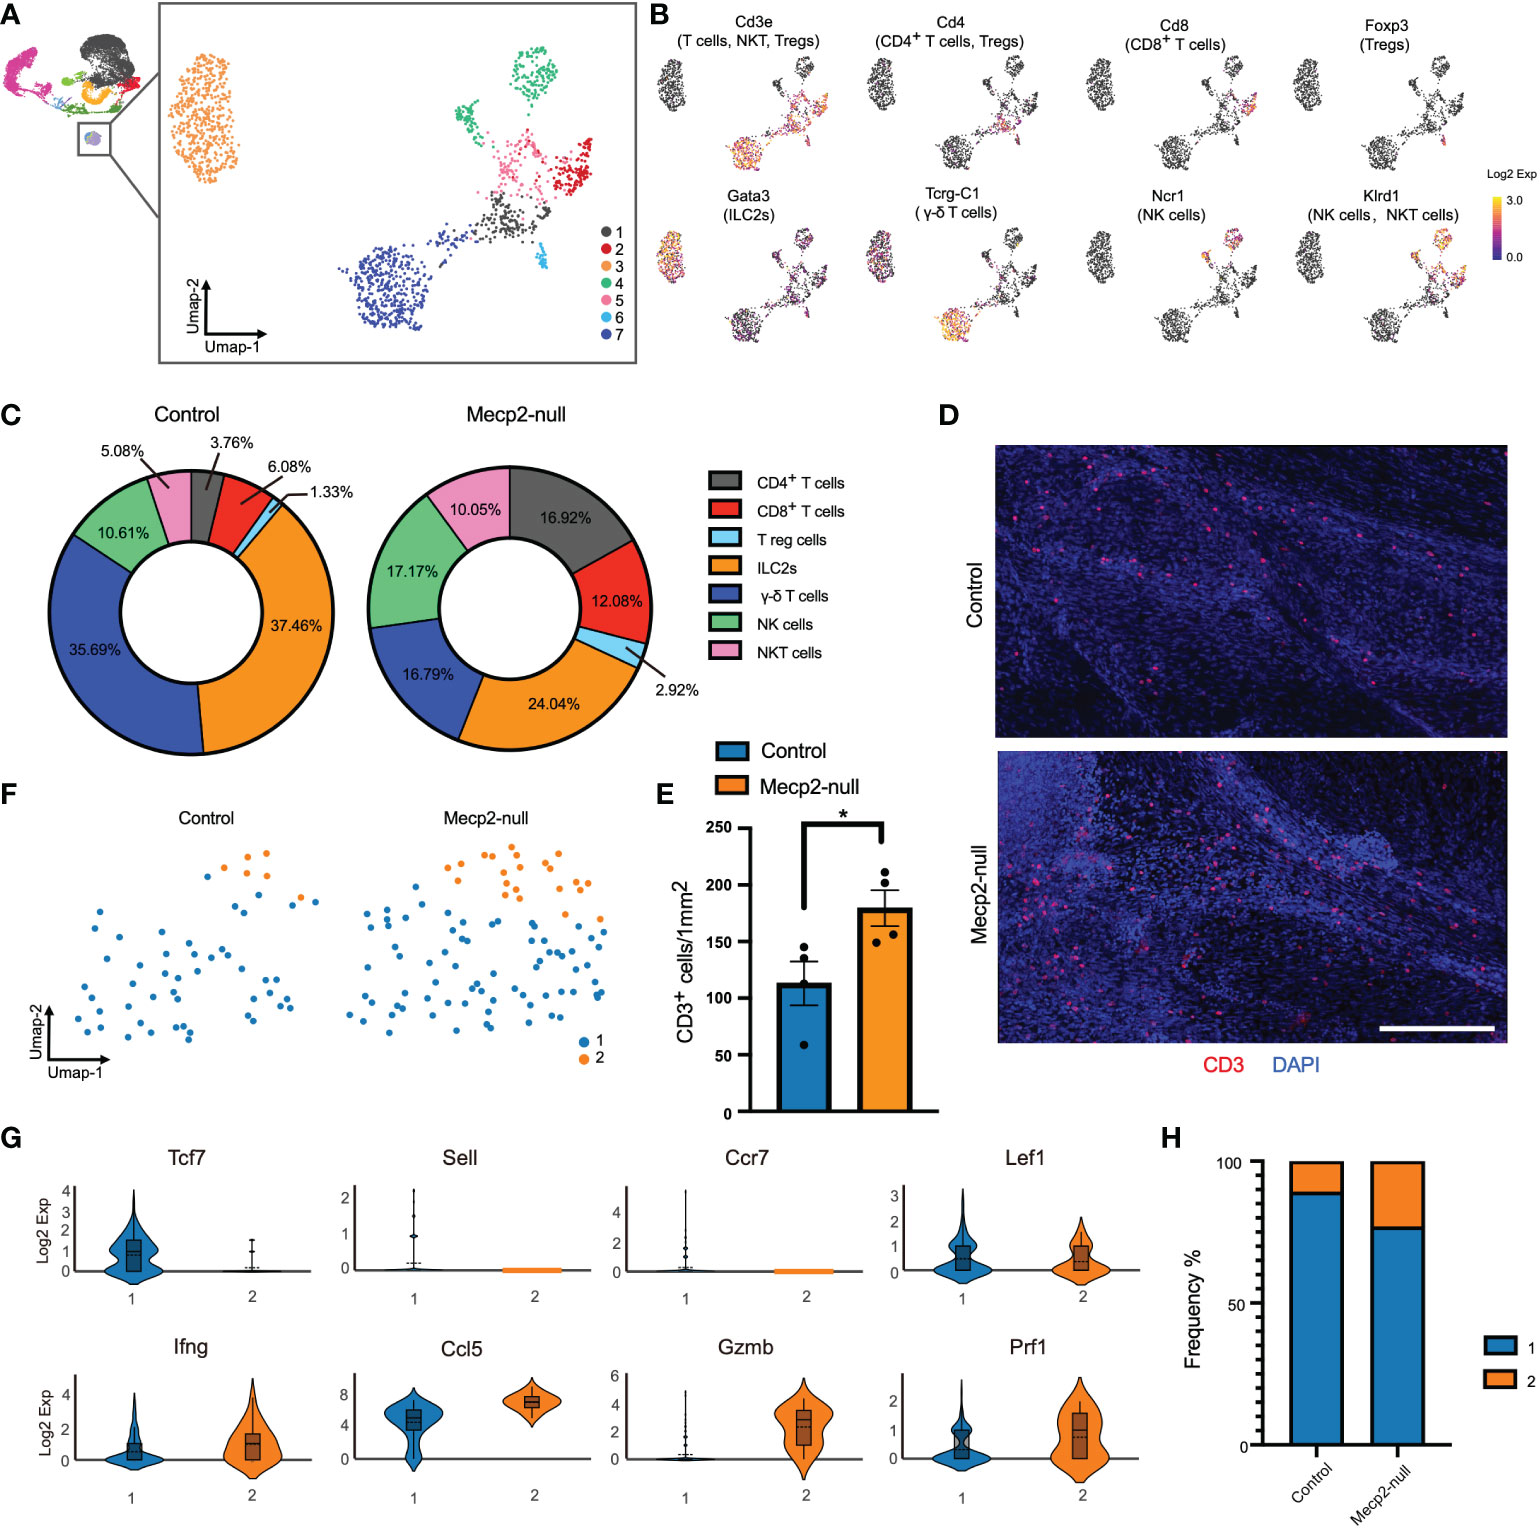
Figure 4 Increased T cell cytotoxicity in Mecp2-deficienct mice. (A) Umap plot showing the distributions of seven clusters for T cells, NK cells, and ILC2s. (B) Umap plots showing the expression of signature genes for CD4+ T, CD8+ T, Tregs, γ-δ T, ILC2s, NK, and NKT cells. (C) Percentages of each cell population among the total meningeal T cells, NK cells, and ILC2s in control and Mecp2-null mice. (D) Representative confocal images of CD3 (red)-positive cells in the dura maters of control and Mecp2-null mice. Scale bars: 250μm. (E) Quantification of the density of CD3-positive cells in the dura maters of control and Mecp2-null mice (n=4 per group). Data represent the mean ± SEM. *p < 0.05, P = 0.0371, two-tailed unpaired t test. (F) Umap plots indicating the two sub-clusters of CD8+ T cells. (G) Violin plots representing the expression of resting state (top row) and cytotoxicity/activated (bottom row) related markers. (H) Frequency of two sub-clusters of CD8+ T cells in control and Mecp2-null mice.
CD8+ T cells are a critical population of MHC I-restricted T cells that directly kill infected or damaged cells. Differential gene expression from the scRNA-seq data of CD8+ T cells resolved the subsets and functional states into two subsets (Figure 4F). Subset 1 showed higher Tcf7, Sell, CCr7, and Lef1 expression, which corresponded with the resting state of CD8+ T cells (Figure 4G). Subset 2 showed increased expressions of Ifng (encoding interferon-γ; IFN-γ), Ccl5, Gzmb, and Prf1, which are associated with cytotoxicity and activation (Figure 4H). The distribution of subset 2 was more enriched in Mecp2-null mice than in the control group, suggesting that the cytotoxic activity of T lymphocytes was enhanced in Mecp2-null mice.
3.5. IFN-γ transcription and cell-cell interactions
CD8+ T cells of Mecp2-null mice displayed increased expression of Ifng, which encodes IFN-γ. IFN-γ is the only member of the type II class of interferons and plays a critical role in both innate and adaptive immunity (27). Yang et al. reported that Mecp2 overexpression results in defective IFN-γ secretion and suggested that MeCP2 could be a regulatory factor in Ifng transcription (28). Here, compared to that in control mice, we found that Mecp2-null mice had higher Ifng expression in NK, CD8+ T, CD4+ T, and NKT cells (Figures 5A, B). Immunofluorescence staining further revealed that IFN-γ expression was higher in the dura maters of Mecp2-null mice (Figures 5C, D). However, the expression of the IFN-γ receptors, Ifngr1 and Ifngr2, was not significantly affected by Mecp2 deficiency, with the exception of high Ifngr2 expression in Treg cells (Figure 5E). CellChat was used to explore the differences in intercellular communication networks of the IFN-II signaling pathway between control and Mecp2-null mice, which were visualized using circle plots. Mecp2-null mice showed more complex intercellular communication in the IFN-II signaling pathway (Figures 5F, G).
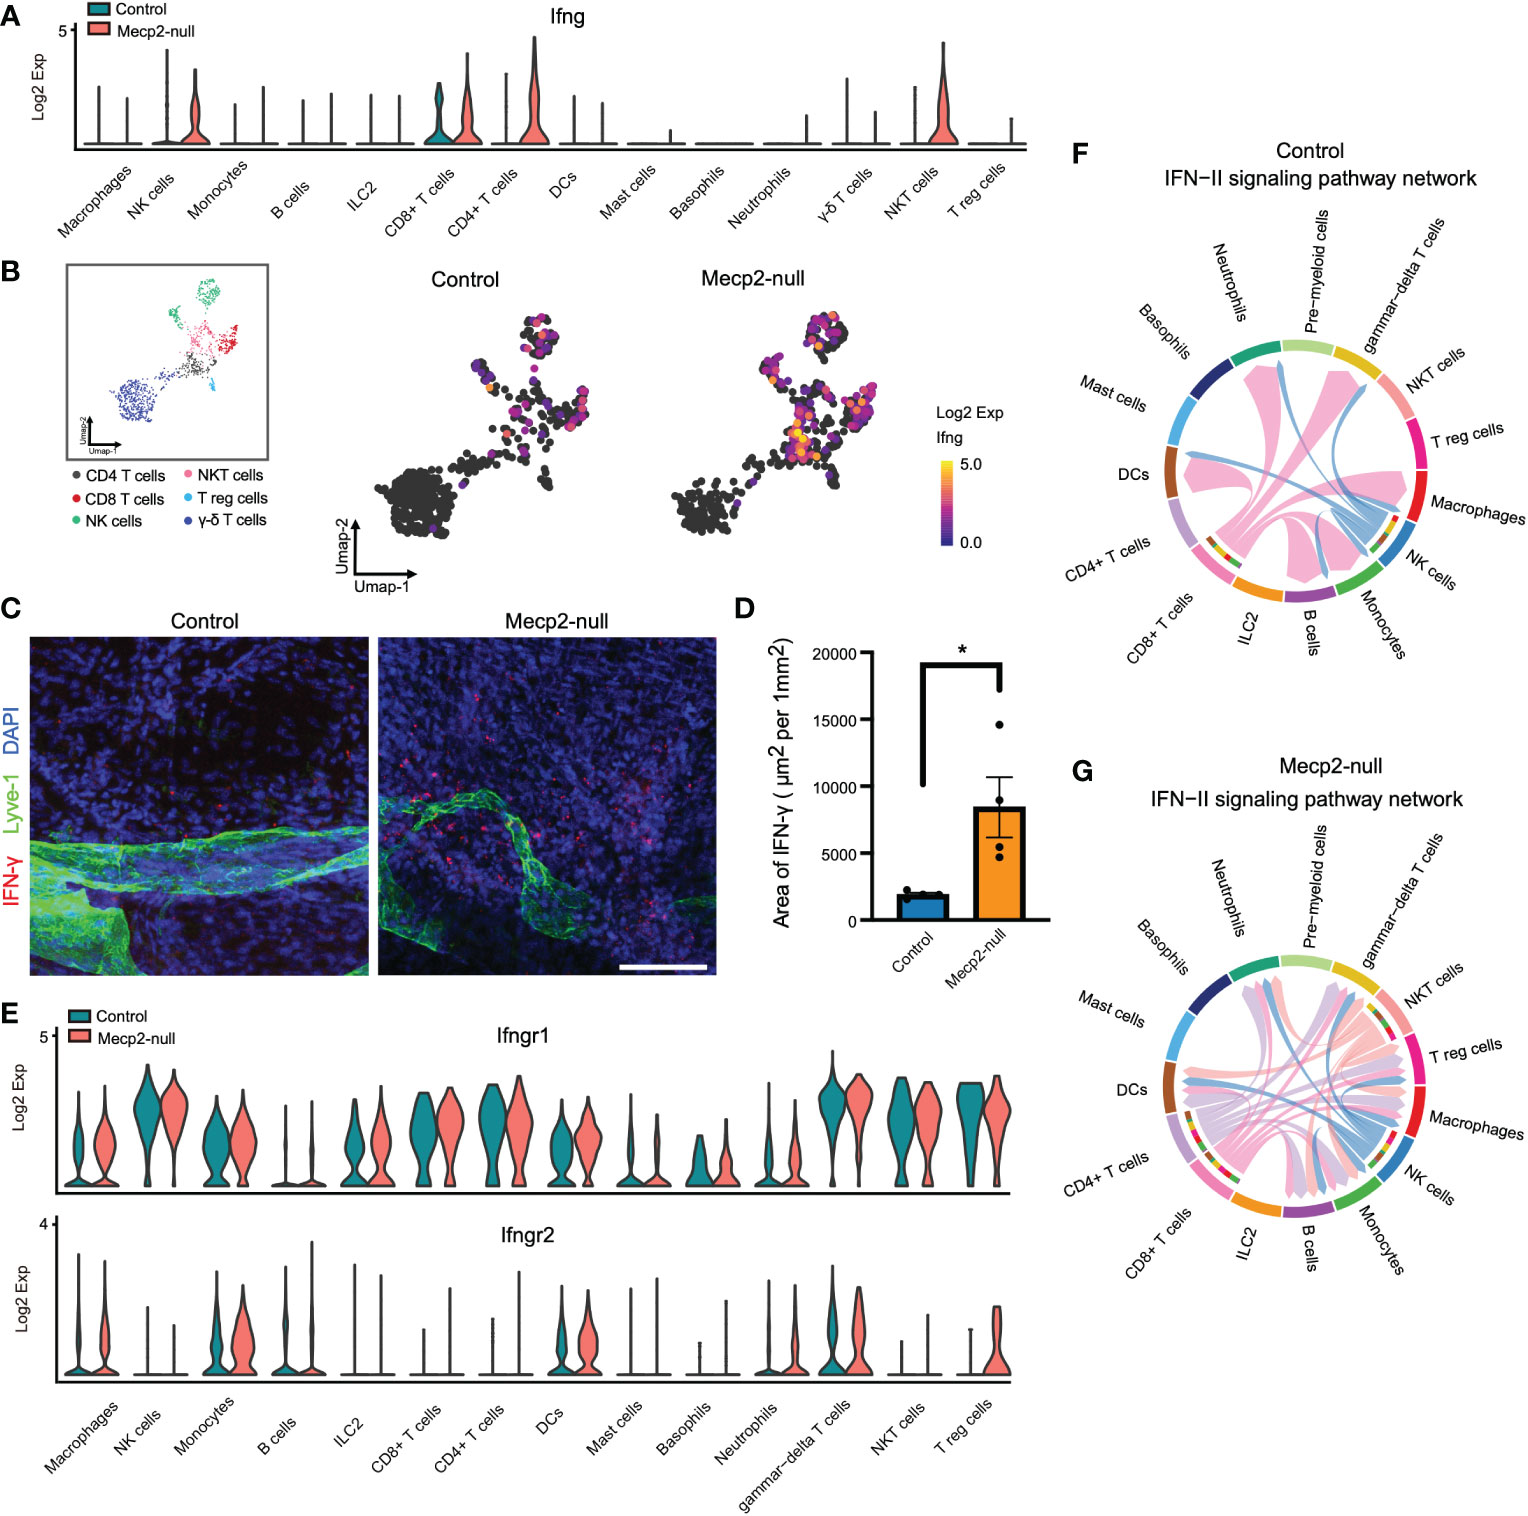
Figure 5 scRNA-seq analysis of IFN-II signaling pathway upregulation in multiple Mecp2-deficient cell populations. (A) Violin plots showing Ifng expression in different meningeal immune cells from control and Mecp2-null mice. (B) Umap plots depicting Ifng expression in the main producer cells. (C) Representative confocal images of IFN-γ (red) with lymphatic vessel endothelial receptor 1 (Lyve-1, Green) in the dura maters of control and Mecp2-null mice. Scale bars: 100μm. (D) Quantification of the area of IFN-γ in the dura maters of control and Mecp2-null mice (n=4 per group). Data represent the mean ± SEM. *p < 0.05, P = 0.0278, two-tailed unpaired t test. (E) Violin plots showing the expression of IFN-γ receptors (Ifngr1 and Ifngr2) in different meningeal immune cells in control and Mecp2-null mice. (F) Chord diagram visualizing cell-cell communication for the IFN-II signaling pathway in WT mice. (G) Chord diagram visualizing the cell-cell communication for IFN-II signaling pathway in Mecp2-null mice.
3.6. Macrophages activated in response to IFN-γ in Mecp2-null mice
IFN-γ plays a key role in macrophage activation and reinforces the M1 phenotype (29). To stratify the activity of macrophages, we re-clustered the macrophage population into five subpopulations based on the expression level of signature genes (Figure 6A). Although Mecp2-deficient meningeal macrophages mainly overlapped with those in the control group, some obvious differences were observed, especially in subclusters 1 and 2 (Figure 6B). We examined the top 50 up-regulated genes in the macrophage subclusters. Subclusters 1, 2, and 5 fell into the MHC II low group (11), which exhibited high Lyve1 and Gas6 expression (Figure 6C), while subclusters 3 and 4 fell into the MHC II high group, which exhibited high H2-Aa and Cd72 expression (Figure 6C). Subcluster 1 displayed increased expression of Rcan1, which encodes a small protein that inhibits calcineurin phosphatase activity and acts as a central negative regulator of inflammation (30).
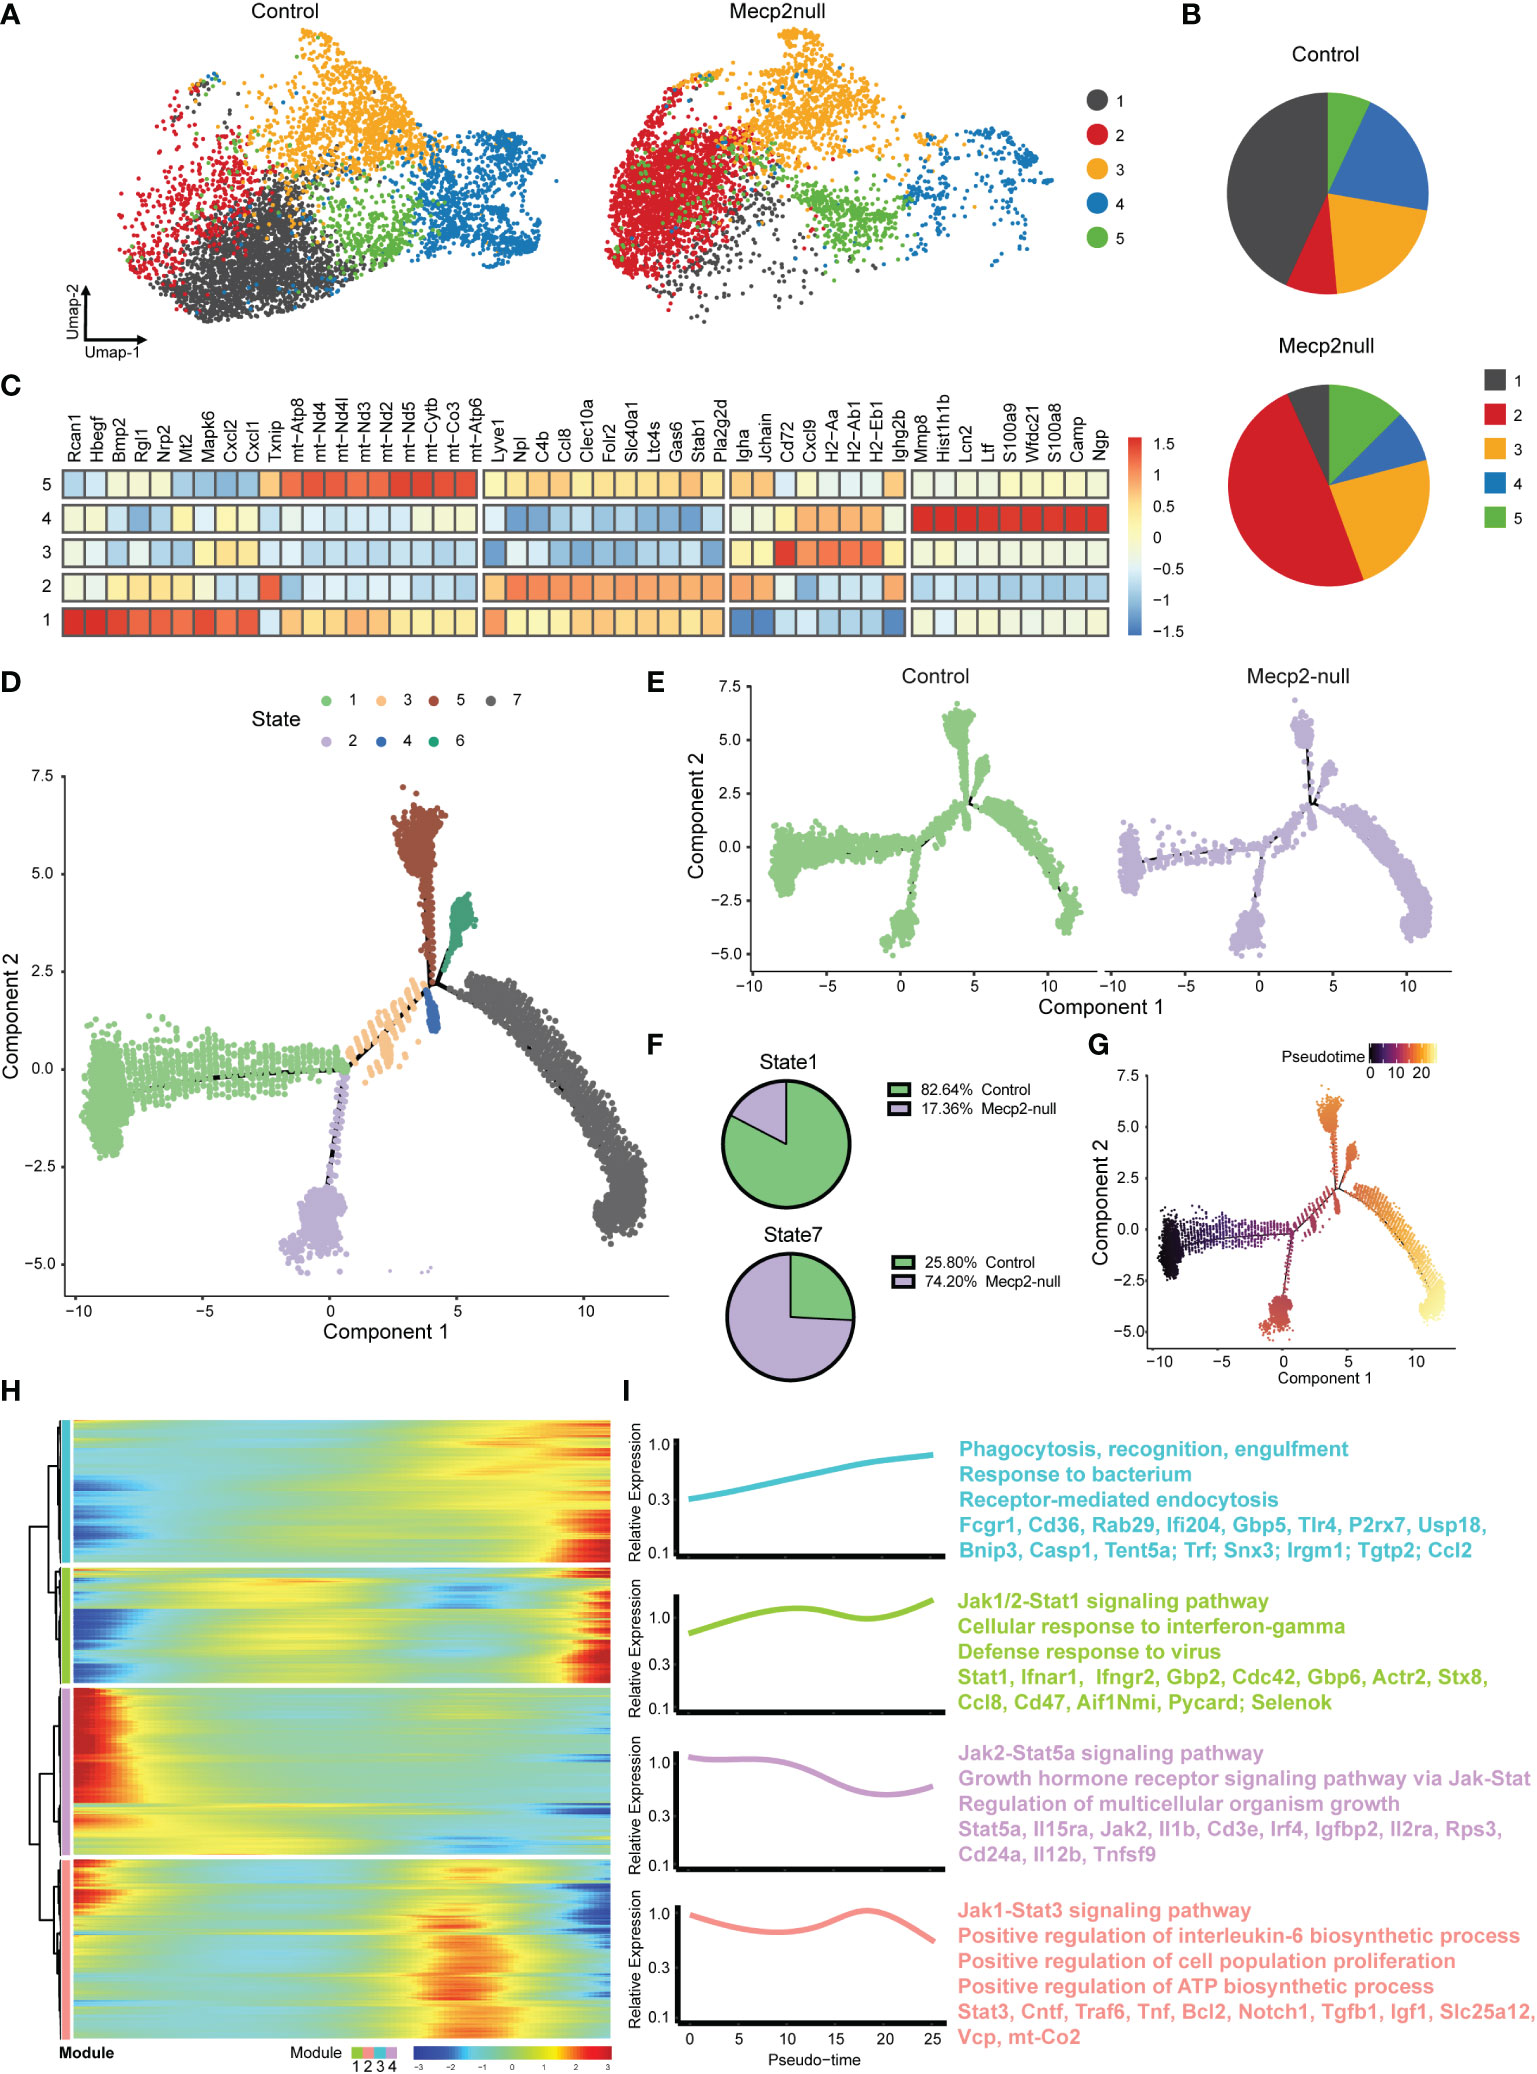
Figure 6 MeCP2 deficiency macrophages have increased response to IFN-γ. (A) Umap plots showing the clusters of WT and Mecp2-deficienct macrophages. (B) Pie chart showing the distribution of five clusters in WT and Mecp2-deficienct meningeal macrophages. (C) Heat map displaying the relative expression fold change (log2) of the top 50 up-regulated genes in macrophage clusters identified in (A). (D) Visualization of the seven cell states predicted using the Monocle2 algorithm. (E) Trajectories for control and Mecp2-null mice. (F) Numbers expressed as percentages of control (green) and Mecp2-null (purple) macrophages in state 1 (top) and state 7 (bottom) cell populations, respectively. (G) Pseudotime of macrophages indicated by gradient color intensity from dark to bright, indicating the progression from the early to late pseudotime. (H) Heatmap displaying genes ordering during pseudotime. Color gradient from blue to red indicates low to high relative expression levels. (I) The GO and KEGG of enriched functions and pathways for the significantly differentially expressed (SDE) genes.
Finally, we performed SCORPIUS trajectory inference on the macrophages. The macrophages were divided into seven states (Figure 6D). The cell trajectory patterns of Mecp2-deficient mice shifted from state 1 to state 7 (Figure 6E), with gene expression profiles changing dynamically along the trajectory. The most predictive genes were clustered into modules, which revealed the transcriptional gradients of genes that were lost or gained in pseudotime (Figure 6H). IFN-γ mediates the polarization of macrophages to an “M1-like” state by activating Janus kinase (Jak)-signal transducer and activator of transcription 1 (Stat1) (31). GO analyses indicated that the late pseudotime, which consisted mainly of state 7, was enriched for the genes involved in phagocytosis, recognition, engulfment, and the Jak1/2-Stat1 signaling pathway. Conversely, early pseudotime mainly consisted of state 1 and was enriched for genes in the Jak2-Stat5a and Jak1-Stat3 signaling pathways (Figure 6I). Taken together, these results indicate that macrophages are activated in response to IFN-γ in Mecp2-null mice.
Discussion
Due to the unique position and structural composition of the meninges, and the functional characteristics of meningeal immune cells, meningeal immunity plays an important role in maintaining the CNS under healthy and disease conditions (12, 32). MeCP2 is expressed in immune cells. Polymorphisms in MeCP2 have been linked to increased susceptibility to autoimmune diseases, and alterations in MeCP2 expression levels affect immune function and cytokine production (3, 33). However, little is known about changes in meningeal immunity in the absence of MeCP2 and the role of meningeal immunity in RTT progression. Using single-cell genomic analysis, we explored the meningeal immune niche of pre-phenotypic Mecp2-deficienct mice, which displayed mild symptoms but were less affected by systemic damage. The meninges of Mecp2-null mice contained diverse immune cell populations like control mice and showed an up-regulation of immune-related processes, including the B cell receptor signaling pathway, cytotoxic activities of T lymphocytes, and macrophage activities. Furthermore, Mecp2 deficiency increased IFN-γ transcription and cell-cell interactions mediated by the IFN-II signaling pathway.
Interestingly, our findings on meningeal immunity with Mecp2 deficiency have some similarities and differences compared to previous studies. Papini et al. (34) demonstrated that patients with RTT showed a consistent and highly significant increase in the serum IgM fraction and we found that the expression of immunoglobulin-family genes in Mecp2 deficient meningeal immune cells (Ighg2c, Igha, Ighg2b, Igkc, etc.) was abnormally high (Figure 1). Li et al. (6) found that Mecp2 is essential for maintaining stable Foxp3 expression and the lineage identity of mature Tregs during inflammation, but is dispensable for the initial induction of Foxp3 expression during Treg development. Consistently, we observed no loss in Foxp3 expression or decrease in the number of Tregs in our immune cell population with no inflammatory challenge (Figure 3B). Leoncini et al. (35) showed that significantly reduced plasma levels of IFN-γ in patients with MeCP2-mutated RTT; however, we observed enhanced IFN-γ transcription in MeCP2-deficient meningeal immune cells (Figure 4), indicating that meningeal immunity is unique.
IFN-γ is a dimerized soluble cytokine that was originally identified as a ‘macrophage-activating factor’ (31). IFN-γ concentrations in the brain are elevated in certain pathologies, including multiple sclerosis, cerebral ischemia, and neurotrauma (36). In this study, we found that Mecp2-null mice lost a population of meningeal macrophages with high Rcan1 expression, which suppresses macrophage activity and negatively regulates inflammation. SCORPIUS trajectory inference showed that the state enriched for phagocytosis, recognition, engulfment, and the Jak1/2-Stat1 signaling pathway (activated by the IFN-γ receptor) was enhanced in Mecp2-deficienct meningeal macrophages. Thus, the abnormally enhanced innate immune response observed in Mecp2-deficienct meningeal immunity may participate in the onset and progression of RTT by causing low-grade neuroinflammation, as reported by Pecorlli et al. (3). However, the cellular targets of IFN-γ extend beyond immune cells. Due to the exclusion system of cerebrospinal fluid, meningeal soluble mediators, such as cytokines, have limited ability to enter and affect the brain parenchyma under steady-state conditions (37). With the expression of IFN-γ receptors in the membranes of neurons (36), IFN-γ has been known to regulate dendrite morphology, inhibit the formation of excitatory synapses in sympathetic neurons and the neocortex (38), and promote inhibitory currents in GABAergic neurons in the prefrontal cortex (39). Furthermore, studies have shown that reduced dendritic complexity, synaptic strength, and dysfunction of GABAergic neurons contribute towards RTT (40–42).
There is still much to understand regarding how meningeal immunity affects neuronal function. It remains unclear how the association of meningeal immunity changes with the progression of MeCP2-mutated diseases. Accumulating evidence has shown that meningeal immunity supports the brain function and may play potential roles in neurodegenerative diseases (9, 43, 44). Indeed, Mecp2-mutant rodents and humans have severely impaired brain function and progressive aggravation (45). Meningeal immunity is thought to support the brain function by secreting cytokines that could be carried by the CSF to corresponding receptors expressed in the brain parenchyma (32). Deficiency in meningeal-derived cytokines, such as IL-4, IL-13, and IL-17α, has been shown to impaired learning, memory, social, and anxiety-like behaviors (9, 43, 46). Based on our findings, we propose a model associating heterogeneity in meningeal immunity with the progression of disease in Mecp2-null mice (Figure 7). In Mecp2-null mice, immune-related processes including the B cell receptor signaling pathway, cytotoxic T lymphocyte activities, and macrophage activities are up-regulated. This heterogeneity of meningeal immune cells and activity status alters the secretion of cytokines (especially IFN-γ), which can enter the brain parenchyma through CSF and affect neuronal function. However, further research is required to confirm the role of meningeal immunity in RTT development.
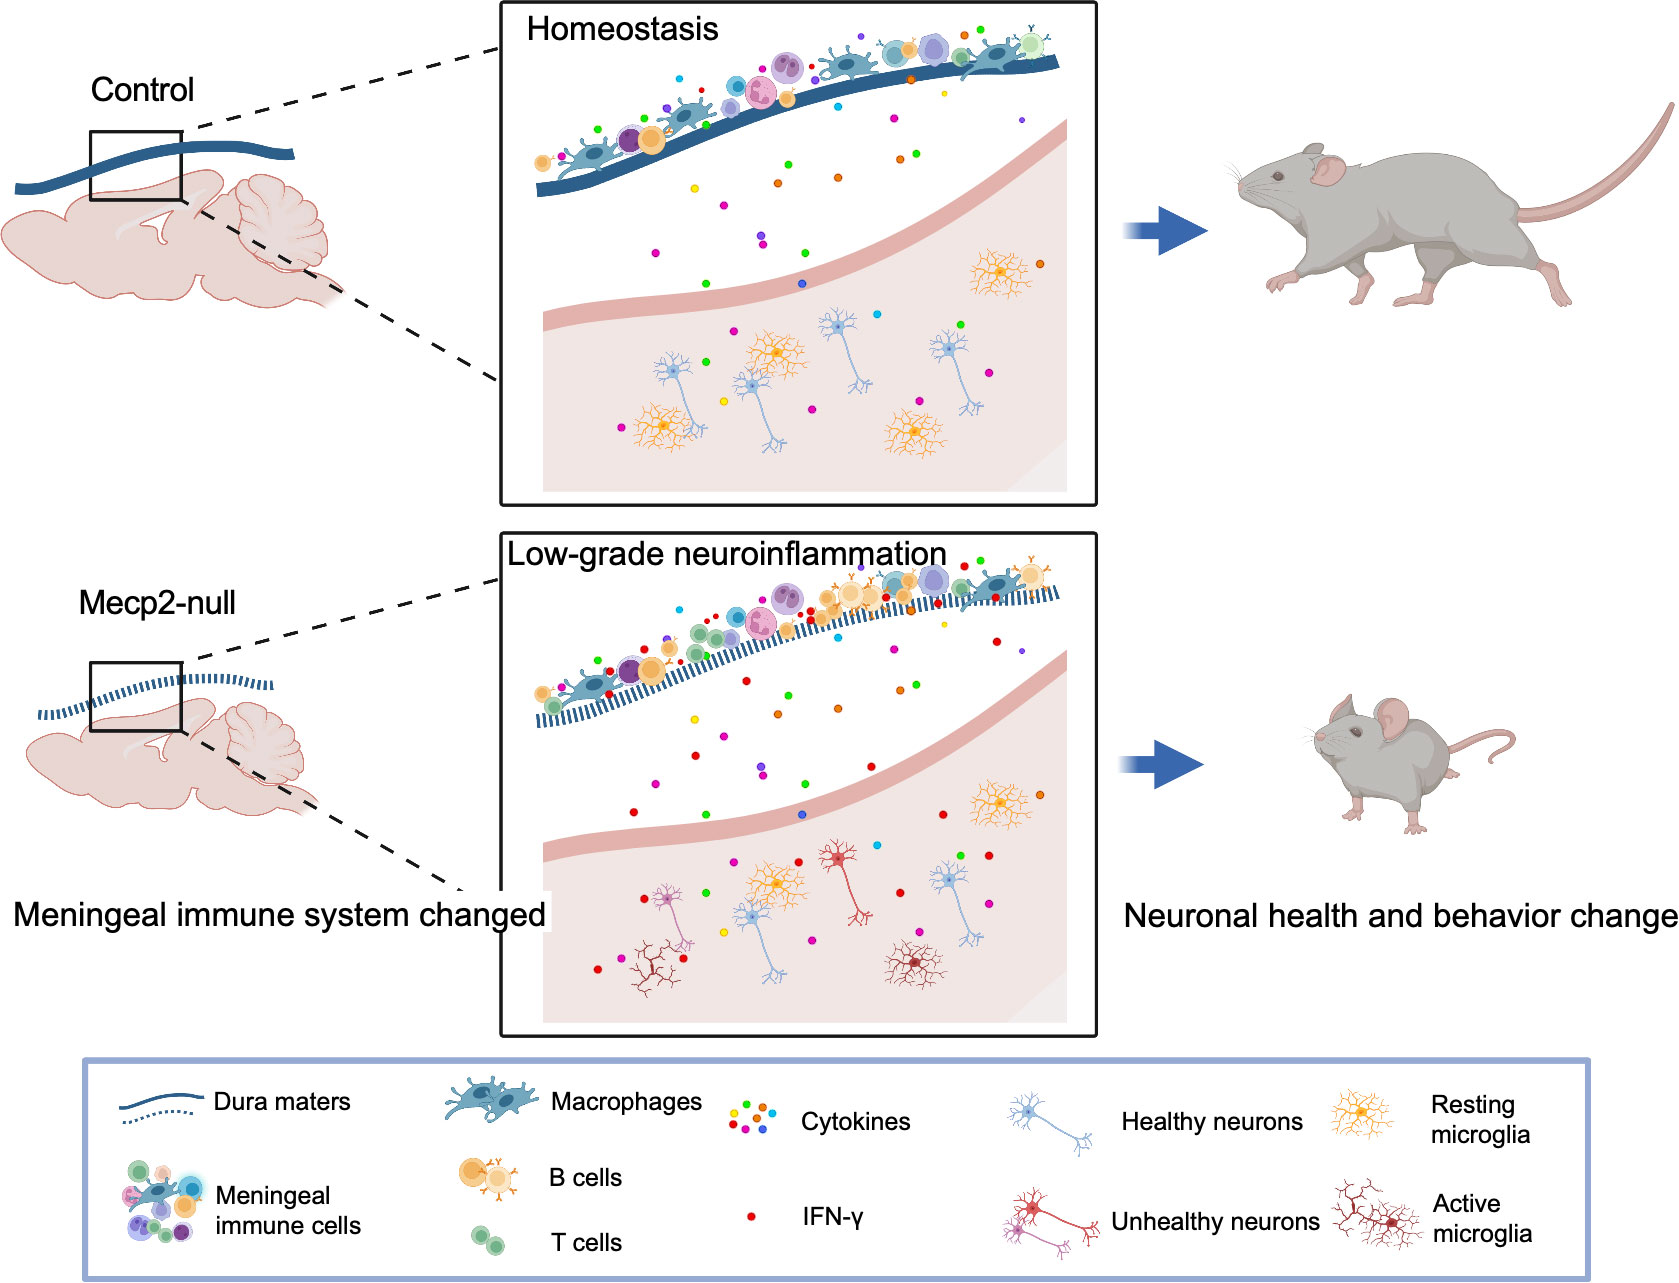
Figure 7 Model for the mechanisms of meningeal immunity in Mecp2-null mouse. Illustration of the hypothesis for the mechanisms of meningeal immunity with the progression of disease in Mecp2-null mice (created with Biorender.com). Meninges surrounding the brain have functional lymphatic system and abundant of immune cells which play important roles for maintaining the central nervous system in health. Mecp2-null mice show deficiency of meningeal lymphatics and activity status altered of immune cells in dura mater. The non-infectious inflammatory response can spread to the CNS parenchyma, causing low-grade neuroinflammation, and further impairing neuronal health and behavior change.
In summary, our study provides novel insights into the pathology of MeCP2-mutated diseases. The meninges, which contain a wide repertoire of immune cells and participate in immune surveillance in the CNS, showed decreased suppression and increased activity for both innate and adaptive immunocytes in MeCP2-deficienct mice. Furthermore, we found that the overexpression of meningeal IFN-γ might not only modulate the status of immune cells in the meninges, but also affect brain function and contribute towards RTT development and deterioration.
Data availability statement
The datasets presented in this study can be found in online repositories. The name of the repository and accession number can be found below: NCBI Gene Expression Omnibus; GSE221361.
Ethics statement
The animal study was reviewed and approved by Institutional Animal Care and Use Committee of Fudan University.
Author contributions
Conceptualization, HL. Mouse genotyping, MH, ZH, YX, MZ. Meningeal dissection and dissociation, HL, MH, YW, JD. Data analysis, HL, MH. Investigation, HL, WF, and XX. Data curation, MZ. Writing-original draft, HL. Writing-review and editing, WF, and XX. Supervision, WF, and XX. All authors contributed to the article and approved the submitted version.
Funding
This work was supported by The National Natural Science Foundation of China (Grant No. 82171540), Key Subject Construction Project of Shanghai Municipal Health Commission (Grant No. shslczdzk02903), The “Thousand Talents Program” to WF, and the Young Clinical Scientist Program of Children’s Hospital of Fudan University (Grant No. 2022LCKXJ03).
Acknowledgments
The authors would like to thank Yongbing Ba (Lu Ming Biotech Co., Ltd., Shanghai, China) for assistance with the bioinformatics analyses. We thank Prof. Ying Zhu and Shenbing Liu for editing the manuscript. We thank Prof. Wenhao Zhou for valuable exceptional support in this work.
Conflict of interest
The authors declare that the research was conducted in the absence of any commercial or financial relationships that could be construed as a potential conflict of interest.
Publisher’s note
All claims expressed in this article are solely those of the authors and do not necessarily represent those of their affiliated organizations, or those of the publisher, the editors and the reviewers. Any product that may be evaluated in this article, or claim that may be made by its manufacturer, is not guaranteed or endorsed by the publisher.
Supplementary material
The Supplementary Material for this article can be found online at: https://www.frontiersin.org/articles/10.3389/fimmu.2022.1056447/full#supplementary-material
Supplementary Figure 1 | Single-cell characterization of meningeal immune cells with typical signature marker genes. (A) Umap plot displays distributions of 18 major clusters of meningeal immune cells. (B) Log2 expression of Ptprc in individual cells on the Umap graph of (A). (C) Violin plots showing the expression of signature genes for different immune cell types.
Supplementary Figure 2 | Meningeal immune cells express Mecp2. (A) Representative confocal images of Mecp2 (red) and Lyve-1(green) staining in the dura mater of 1-month-old WT mice. Scale bars: 50μm. (B) Violin plots representing the Log2 expression of Mecp2 in different meningeal immune cells from WT mice.
References
1. Good KV, Vincent JB, Ausio J. MeCP2: The genetic driver of rett syndrome epigenetics. Front Genet (2021) 12:620859. doi: 10.3389/fgene.2021.620859
2. Chahrour M, Zoghbi HY. The story of rett syndrome: from clinic to neurobiology. Neuron (2007) 56(3):422–37. doi: 10.1016/j.neuron.2007.10.001
3. Pecorelli A, Cervellati C, Cordone V, Hayek J, Valacchi G. Compromised immune/inflammatory responses in rett syndrome. Free Radic Biol Med (2020) 152:100–6. doi: 10.1016/j.freeradbiomed.2020.02.023
4. Maezawa I, Jin LW. Rett syndrome microglia damage dendrites and synapses by the elevated release of glutamate. J Neurosci (2010) 30(15):5346–56. doi: 10.1523/JNEUROSCI.5966-09.2010
5. Derecki NC, Cronk JC, Lu Z, Xu E, Abbott SB, Guyenet PG, et al. Wild-type microglia arrest pathology in a mouse model of rett syndrome. Nature (2012) 484(7392):105–9. doi: 10.1038/nature10907
6. Li C, Jiang S, Liu SQ, Lykken E, Zhao LT, Sevilla J, et al. MeCP2 enforces Foxp3 expression to promote regulatory T cells' resilience to inflammation. Proc Natl Acad Sci U.S.A. (2014) 111(27):E2807–16. doi: 10.1073/pnas.1401505111
7. O'Driscoll CM, Lima MP, Kaufmann WE, Bressler JP. Methyl CpG binding protein 2 deficiency enhances expression of inflammatory cytokines by sustaining NF-kappaB signaling in myeloid derived cells. J Neuroimmunol (2015) 283:23–9. doi: 10.1016/j.jneuroim.2015.04.005
8. Gadani SP, Smirnov I, Wiltbank AT, Overall CC, Kipnis J. Characterization of meningeal type 2 innate lymphocytes and their response to CNS injury. J Exp Med (2017) 214(2):285–96. doi: 10.1084/jem.20161982
9. Alves de Lima K, Rustenhoven J, Da Mesquita S, Wall M, Salvador AF, Smirnov I, et al. Meningeal gammadelta T cells regulate anxiety-like behavior via IL-17a signaling in neurons. Nat Immunol (2020) 21(11):1421–9. doi: 10.1038/s41590-020-0776-4
10. Cronk JC, Derecki NC, Ji E, Xu Y, Lampano AE, Smirnov I, et al. Methyl-CpG binding protein 2 regulates microglia and macrophage gene expression in response to inflammatory stimuli. Immunity (2015) 42(4):679–91. doi: 10.1016/j.immuni.2015.03.013
11. Van Hove H, Martens L, Scheyltjens I, De Vlaminck K, Pombo Antunes AR, De Prijck S, et al. A single-cell atlas of mouse brain macrophages reveals unique transcriptional identities shaped by ontogeny and tissue environment. Nat Neurosci (2019) 22(6):1021–35. doi: 10.1038/s41593-019-0393-4
12. Alves de Lima K, Rustenhoven J, Kipnis J. Meningeal immunity and its function in maintenance of the central nervous system in health and disease. Annu Rev Immunol (2020) 38:597–620. doi: 10.1146/annurev-immunol-102319-103410
13. Di Marco Barros R, Fitzpatrick Z, Clatworthy MR. The gut-meningeal immune axis: Priming brain defense against the most likely invaders. J Exp Med (2022) 219(3):1-9. doi: 10.1084/jem.20211520
14. Butler A, Hoffman P, Smibert P, Papalexi E, Satija R. Integrating single-cell transcriptomic data across different conditions, technologies, and species. Nat Biotechnol (2018) 36(5):411–20. doi: 10.1038/nbt.4096
15. McGinnis CS, Murrow LM, Gartner ZJ. DoubletFinder: Doublet detection in single-cell RNA sequencing data using artificial nearest neighbors. Cell Syst (2019) 8(4):329–337 e4. doi: 10.1016/j.cels.2019.03.003
16. Hanzelmann S, Castelo R, Guinney J. GSVA: gene set variation analysis for microarray and RNA-seq data. BMC Bioinf (2013) 14:7. doi: 10.1186/1471-2105-14-7
17. Aibar S, Gonzalez-Blas CB, Moerman T, Huynh-Thu VA, Imrichova H, Hulselmans G, et al. SCENIC: single-cell regulatory network inference and clustering. Nat Methods (2017) 14(11):1083–6. doi: 10.1038/nmeth.4463
18. Suo S, Zhu Q, Saadatpour A, Fei L, Guo G, Yuan GC. Revealing the critical regulators of cell identity in the mouse cell atlas. Cell Rep (2018) 25(6):1436–1445 e3. doi: 10.1016/j.celrep.2018.10.045
19. Jin S, Guerrero-Juarez CF, Zhang L, Chang I, Ramos R, Kuan CH, et al. Inference and analysis of cell-cell communication using CellChat. Nat Commun (2021) 12(1):1088. doi: 10.1038/s41467-021-21246-9
20. Trapnell C, Cacchiarelli D, Grimsby J, Pokharel P, Li S, Morse M, et al. The dynamics and regulators of cell fate decisions are revealed by pseudotemporal ordering of single cells. Nat Biotechnol (2014) 32(4):381–6. doi: 10.1038/nbt.2859
21. Louveau A, Herz J, Alme MN, Salvador AF, Dong MQ, Viar KE, et al. CNS lymphatic drainage and neuroinflammation are regulated by meningeal lymphatic vasculature. Nat Neurosci (2018) 21(10):1380–91. doi: 10.1038/s41593-018-0227-9
22. Antila S, Karaman S, Nurmi H, Airavaara M, Voutilainen MH, Mathivet T, et al. Development and plasticity of meningeal lymphatic vessels. J Exp Med (2017) 214(12):3645–67. doi: 10.1084/jem.20170391
23. Guy J, Hendrich B, Holmes M, Martin JE, Bird A. A mouse Mecp2-null mutation causes neurological symptoms that mimic rett syndrome. Nat Genet (2001) 27(3):322–6. doi: 10.1038/85899
24. Rustenhoven J, Drieu A, Mamuladze T, de Lima KA, Dykstra T, Wall M, et al. Functional characterization of the dural sinuses as a neuroimmune interface. Cell (2021) 184:1–17. doi: 10.1016/j.cell.2020.12.040
25. Wang Y, Chen D, Xu D, Huang C, Xing R, He D, et al. Early developing b cells undergo negative selection by central nervous system-specific antigens in the meninges. Immunity (2021) 54(12):P2784–2794.E6. doi: 10.1016/j.immuni.2021.09.016
26. Brioschi S, Wang WL, Peng V, Wang M, Shchukina I, Greenberg ZJ, et al. Heterogeneity of meningeal b cells reveals a lymphopoietic niche at the CNS borders. Science (2021) 373(6553):1-14. doi: 10.1126/science.abf9277
27. Green DS, Young HA, Valencia JC. Current prospects of type II interferon gamma signaling and autoimmunity. J Biol Chem (2017) 292(34):13925–33. doi: 10.1074/jbc.R116.774745
28. Tianshu Yang MBR, Neul JL, Lu W, Roberts L, Knight J, Ward CS, et al. Overexpression of methyl-CpG binding protein 2 impairs TH1 responses. Sci Trans Med (2012) 4(163):163ra158. doi: 10.1126/scitranslmed.3004430
29. Wu C, Xue Y, Wang P, Lin L, Liu Q, Li N, et al. IFN-gamma primes macrophage activation by increasing phosphatase and tensin homolog via downregulation of miR-3473b. J Immunol (2014) 193(6):3036–44. doi: 10.4049/jimmunol.1302379
30. Junkins RD, MacNeil AJ, Wu Z, McCormick C, Lin TJ. Regulator of calcineurin 1 suppresses inflammation during respiratory tract infections. J Immunol (2013) 190(10):5178–86. doi: 10.4049/jimmunol.1203196
31. Ivashkiv LB. IFNgamma: signalling, epigenetics and roles in immunity, metabolism, disease and cancer immunotherapy. Nat Rev Immunol (2018) 18(9):545–58. doi: 10.1038/s41577-018-0029-z
32. Ma T, Wang F, Xu S, Huang JH. Meningeal immunity: Structure, function and a potential therapeutic target of neurodegenerative diseases. Brain Behav Immun (2021) 93:264–76. doi: 10.1016/j.bbi.2021.01.028
33. Zalosnik MI, Fabio MC, Bertoldi ML, Castanares CN, Degano AL. MeCP2 deficiency exacerbates the neuroinflammatory setting and autoreactive response during an autoimmune challenge. Sci Rep (2021) 11(1):10997. doi: 10.1038/s41598-021-90517-8
34. Papini AM, Nuti F, Real-Fernandez F, Rossi G, Tiberi C, Sabatino G, et al. Immune dysfunction in rett syndrome patients revealed by high levels of serum anti-N(Glc) IgM antibody fraction. J Immunol Res (2014) 2014:260973. doi: 10.1155/2014/260973
35. Leoncini S, De Felice C, Signorini C, Zollo G, Cortelazzo A, Durand T, et al. Cytokine dysregulation in MECP2- and CDKL5-related rett syndrome: Relationships with aberrant redox homeostasis, inflammation, and omega-3 PUFAs. Oxid Med Cell Longev (2015) 2015:421624. doi: 10.1155/2015/421624
36. Janach GMS, Reetz O, Dohne N, Stadler K, Grosser S, Byvaltcev E, et al. Interferon-gamma acutely augments inhibition of neocortical layer 5 pyramidal neurons. J Neuroinflamm (2020) 17(1):69. doi: 10.1186/s12974-020-1722-y
37. Rua R, McGavern DB. Advances in meningeal immunity. Trends Mol Med (2018) 24(6):542–59. doi: 10.1016/j.molmed.2018.04.003
38. Andres DA, Shi GX, Bruun D, Barnhart C, Lein PJ. Rit signaling contributes to interferon-gamma-induced dendritic retraction via p38 mitogen-activated protein kinase activation. J Neurochem (2008) 107(5):1436–47. doi: 10.1111/j.1471-4159.2008.05708.x
39. Filiano AJ, Xu Y, Tustison NJ, Marsh RL, Baker W, Smirnov I, et al. Unexpected role of interferon-gamma in regulating neuronal connectivity and social behaviour. Nature (2016) 535(7612):425–9. doi: 10.1038/nature18626
40. Chao HT, Chen H, Samaco RC, Xue M, Chahrour M, Yoo J, et al. Dysfunction in GABA signalling mediates autism-like stereotypies and rett syndrome phenotypes. Nature (2010) 468(7321):263–9. doi: 10.1038/nature09582
41. Wang IT, Reyes AR, Zhou Z. Neuronal morphology in MeCP2 mouse models is intrinsically variable and depends on age, cell type, and Mecp2 mutation. Neurobiol Dis (2013) 58:3–12. doi: 10.1016/j.nbd.2013.04.020
42. Chao HT, Zoghbi HY, Rosenmund C. MeCP2 controls excitatory synaptic strength by regulating glutamatergic synapse number. Neuron (2007) 56(1):58–65. doi: 10.1016/j.neuron.2007.08.018
43. Herz J, Fu Z, Kim K, Dykstra T, Wall M, Li H, et al. GABAergic neuronal IL-4R mediates T cell effect on memory. Neuron (2021) 109(22):3609–3618 e9. doi: 10.1016/j.neuron.2021.10.022
44. Magliozzi R, Howell OW, Durrenberger P, Arico E, James R, Cruciani C, et al. Meningeal inflammation changes the balance of TNF signalling in cortical grey matter in multiple sclerosis. J Neuroinflamm (2019) 16(1):259. doi: 10.1186/s12974-019-1650-x
45. Ehinger Y, Matagne V, Villard L, Roux JC. Rett syndrome from bench to bedside: recent advances. F1000Res (2018) 7:398. doi: 10.12688/f1000research.14056.1
Keywords: methyl CpG binding protein 2, Rett syndrome, meningeal immunity, mouse model, central nervous system, single-cell analysis
Citation: Li H, Hu M, Huang Z, Wang Y, Xu Y, Deng J, Zhu M, Feng W and Xu X (2023) A single-cell atlas reveals the heterogeneity of meningeal immunity in a mouse model of Methyl CpG binding protein 2 deficiency. Front. Immunol. 13:1056447. doi: 10.3389/fimmu.2022.1056447
Received: 28 September 2022; Accepted: 23 December 2022;
Published: 10 January 2023.
Edited by:
Bo Li, Department of Orthopedics, Sun Yat-sen University, ChinaReviewed by:
Yunzhong Cheng, Department of Orthopedic Surgery, Capital Medical University, ChinaJinming Han, Capital Medical University, China
Copyright © 2023 Li, Hu, Huang, Wang, Xu, Deng, Zhu, Feng and Xu. This is an open-access article distributed under the terms of the Creative Commons Attribution License (CC BY). The use, distribution or reproduction in other forums is permitted, provided the original author(s) and the copyright owner(s) are credited and that the original publication in this journal is cited, in accordance with accepted academic practice. No use, distribution or reproduction is permitted which does not comply with these terms.
*Correspondence: Huiping Li, bGlodWlwaW5nQGZ1ZGFuLmVkdS5jbg==; Weijun Feng, ZmVuZ3dlaWp1bkBmdWRhbi5lZHUuY24=; Xiu Xu, eHV4aXVAZnVkYW4uZWR1LmNu