 Apiwit Sae-fung
 Apiwat Mutirangura
 Siriporn Jitkaew
95% of researchers rate our articles as excellent or good
Learn more about the work of our research integrity team to safeguard the quality of each article we publish.
Find out more
ORIGINAL RESEARCH article
Front. Immunol. , 17 January 2023
Sec. Cancer Immunity and Immunotherapy
Volume 13 - 2022 | https://doi.org/10.3389/fimmu.2022.1051273
This article is part of the Research Topic Roles of Pan-cell Death of Tumor Cells in Regulating Tumor Immune Microenvironment View all 14 articles
Cholangiocarcinoma (CCA) is a highly heterogeneous and aggressive malignancy of the bile ducts with a poor prognosis and high mortality rate. Effective targeted therapy and accurate prognostic biomarkers are still lacking. Ferroptosis is a form of regulated cell death implicated in cancer progression and has emerged as a potential therapeutic target in various cancers. However, a comprehensive analysis of ferroptosis-related genes (FRGs) for predicting CCA prognosis and therapeutic targets and determining the role of ferroptosis in CCA remain to be performed. Here, we developed a prognostic FRG signature using a least absolute shrinkage and selection operator Cox regression analysis in a training cohort. We then validated it using four independent public datasets. The six-FRG signature was developed to predict CCA patient survival, stratifying them into low-risk and high-risk groups based on survival time. Significantly, the high-risk CCA patients had shorter overall survival. A receiver operating characteristic curve analysis further confirmed the prognostic FRG signature’s strong predictive ability, indicating that it was an independent prognostic indicator for CCA patients. Furthermore, the high-risk group was associated with fluke infection and high clinical stages. Cancer-associated fibroblast (CAF) score and CAF markers were significantly higher in the high-risk group than the low-risk group. Moreover, our FRG signature could predict immune checkpoint markers for immunotherapy and drug sensitivity. The mRNA expression levels of the six-FRG signature was validated in 10 CCA cell lines and dividing them into low-risk and high-risk groups using the FRG signature. We further showed that high-risk CCA cell lines were more resistant to ferroptosis inducers, including erastin and RSL3, than the low-risk CCA cell lines. Our study constructed a novel FRG signature model to predict CCA prognoses which might provide prognostic biomarkers and potential therapeutic targets for CCA patients. Ferroptosis sensitivity in high-risk and low-risk CCA cell lines suggests that ferroptosis resistance is associated with high-risk group CCA. Therefore, ferroptosis could be a promising therapeutic target for precision therapy in CCA patients.
Cholangiocarcinoma (CCA/CHOL) is a highly heterogeneous malignancy originating from epithelial bile ducts at any level of the bile duct tree. Its incidence rate has significantly increased worldwide, with higher prevalence in Asian countries over the past few years (1). Due to a lack of effective early diagnosis, most CCA patients are usually diagnosed at advanced stages where surgical resection cannot be performed (2, 3). While, therapeutic options for CCA patients are increasing, such as chemotherapy, targeted therapy, and immunotherapy, their overall prognosis remains unsatisfactory (4–6). Therefore, identifying novel predictive models, accurate prognostic biomarkers, and novel therapeutic targets are urgently required to improve overall survival of CCA patients.
Ferroptosis is a novel regulated form of cell death that relies on iron overload, accumulation of reactive oxygen species (ROS) and polyunsaturated fatty acids (PUFA), and phospholipid peroxidation (7–9). System and glutathione peroxidase 4 (GPX4) are key regulators in the glutathione pathway that control the ferroptosis mechanism. Erastin and RAS-selective lethal (RSL3) can induce ferroptosis by inhibiting system and GPX4 activity, respectively (9–11). Recent studies have shown that ferroptosis represents a novel target for efficient therapeutic strategies to overcome treatment resistance in several cancers (12). In addition, ferroptosis-related genes (FRGs) and ferroptosis signaling dysregulation might be associated with cancer patient prognosis. However, the role of ferroptosis in CCA progression and prognosis remain unknown. In addition, very few studies have explored the therapeutic applications of ferroptosis for CCA patients. Therefore, discovering key prognostic FRGs predicting CCA prognosis and clinical outcomes is urgently needed since they might act as novel biomarkers and therapeutic targets for CCA patients.
This study obtained RNA expression profiles and clinical data from two cohorts in the Gene Expression Omnibus (GEO) database and developed a six-FRG signature. We validated our six-FRG signature for CCA prognosis prediction in four independent cohorts in GEO, The Cancer Genome Atlas (TCGA), the European Bioinformatics Institute (EMBL-EBI) database, and the National Omics Data Encyclopedia (NODE) database. Our six-FRG signature was used to stratify CCA patients into two groups, confirming their prognosis prediction. In addition, these two patient groups differed in their functional and biological processes, immune cell infiltration, cancer-associated fibroblast (CAF) abundance, and drug sensitivity. Moreover, we confirmed the mRNA expression levels of these six-FRG signature in a panel of CCA cell lines, dividing them into two groups based on their mRNA expression levels for these six-FRG signature. We further investigated the sensitivity of these CCA cell lines to ferroptosis inducers, including erastin and RSL3.
A flow chart describing the data collection and analysis process is provided in Figure 1. Five public RNA expression and clinical information were downloaded from four platforms. The TCGA-CHOL dataset was downloaded from the University of California at Santa Cruz (UCSC) Xena platform (https://xena.ucsc.edu/). The E-MTAB-6389 dataset was downloaded from the European Bioinformatics Institute (EMBL-EBI) database (https://www.ebi.ac.uk/). The OEP001105 dataset reported by a previous study (13) was downloaded from The National Omics Data Encyclopedia (NODE) database (https://www.biosino.org/node/). The GSE76297, GSE89749, and GSE107943 datasets were downloaded from the Gene Expression Omnibus (GEO) database (https://www.ncbi.nlm.nih.gov/geo/). The GSE89749 dataset’s clinical information was obtained from previous study (14). In total, 267 FRGs were identified from published studies (15, 16) and the FerrDb database (http://www.zhounan.org/ferrdb/) (17). CCA patient characteristics in all datasets are summarized in Supplementary Table S1.
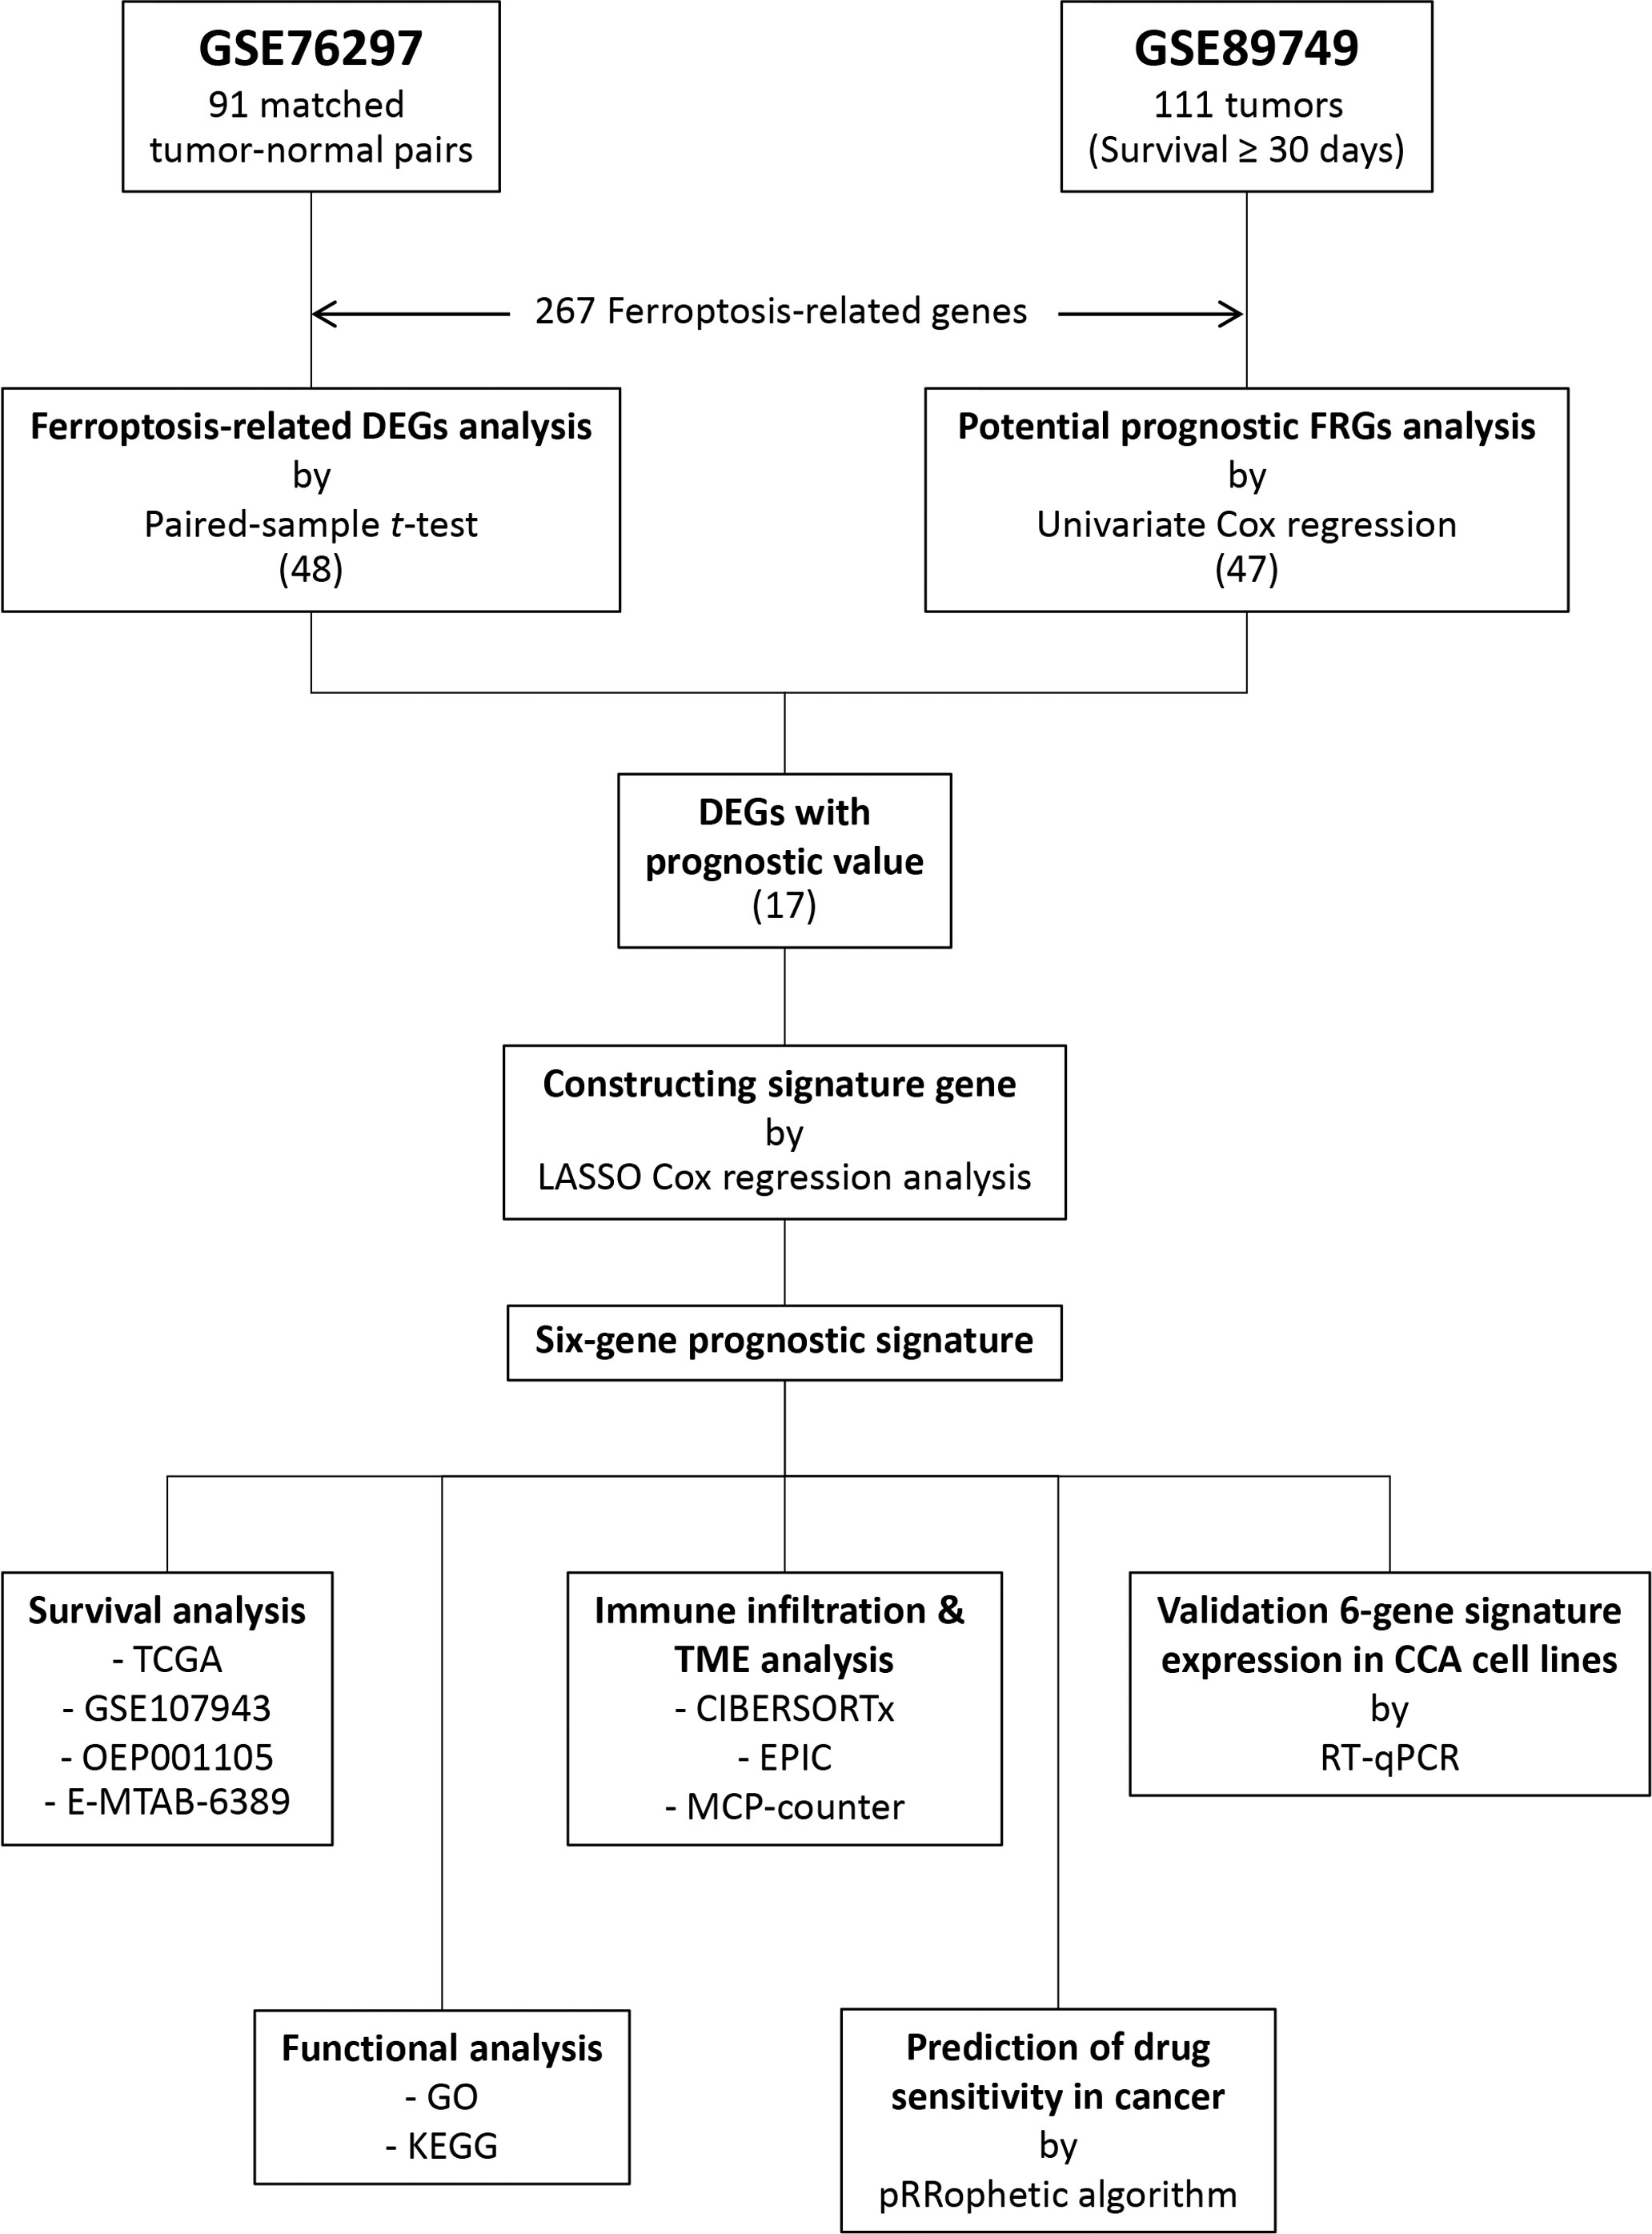
Figure 1 Flow chart of the study.
Differentially expressed genes (DEGs) were identified in the GSE76297 cohort, which includes 91 pairs of tumor and non-tumor tissues using a paired-sample t-test with a |log2(fold change)| > 1 and p-value < 0.0001. A univariate Cox regression analysis was performed to screen out prognostic genes associated with overall patient survival in the GSE89749 cohort. This cohort includes 111 patients of which only those with an overall survival ≥ 30 days were included to ensure this study’s reliability. Genes with a p-value < 0.05 were considered prognostic genes. Finally, overlapping DEGs and prognostic genes were identified as candidate genes using a Venn diagram. A protein-protein interaction (PPI) network analysis was performed on candidate genes by the STRING database (https://www.string-db.org/) (18).
The GSE89749 cohort was used as a training cohort to construct an FRG signature. A least absolute shrinkage and selection operator (LASSO) Cox regression analysis was used to develop the FRG signature from candidate genes using the R statistical software’s “glmnet” package. Then, the following formula was used to calculate a ferroptosis-related risk score for each patient: risk score = (Exp.Gene1 × Coef.Gene1) + (Exp.Gene2 × Coef.Gene2) + … + (Exp.Genen × Coef.Genen), where Exp.Gene is the expression of FRG signature genes and Coef.Gene is the regression coefficient obtained from the LASSO Cox regression analysis. The 111 patients in the GSE89749 cohort were stratified into low-risk and high-risk groups based on the median risk score. Kaplan-Meier and log-rank test were used to compare patient survival between risk groups using R’s “survminer” package. A time-dependent receiver operating characteristic (ROC) curve was used to predict the FRG signature’s specificity and sensitivity for predicting patient survival at 1, 3, and 5 years using R’s “survivalROC” package. The FRG signature’s prognostic potential was validated using the OEP001105, E-MTAB-6389, GSE107943, and TCGA-CHOL datasets.
A univariate Cox regression analysis was used to evaluate the prognostic value of the FRG signature and other clinical characteristics, including age, liver fluke infection, sex, and stage. A multivariate Cox regression analysis was performed to evaluate whether the FRG signature was an independent prognostic factor. Each variable’s hazard ratio (HR) and 95% confidence interval (CI) were calculated, with p-value < 0.05 considered statistically significant. Moreover, Fisher’s exact test was used to assess differences in clinical characteristics between low-risk and high-risk groups.
A GSEA was performed in the training cohort using GSEA software to identify functions and pathways enriched between low-risk and high-risk groups based on Gene Ontology (GO; c5.go.v7.5.1.symbols.gmt) and Kyoto Encyclopedia of Genes and Genomes (KEGG; c2.cp.kegg.v7.5.1.symbols.gmt). Gene sets with a | normalized enrichment score (NES)| > 1, p-value < 0.05, and false discovery rate (FDR) < 0.25 were considered statistically significant.
The CIBERSORTx algorithm (https://cibersortx.stanford.edu/) (19) was used to analyze the immune cell fractions of 22 immune cell types in the training cohort. Moreover, the MCP-counter (20) and EPIC (http://epic.gfellerlab.org/) (21) algorithms were used to estimate CAF abundance.
Differences in drugs sensitivity between the two patient groups were estimated by comparing half-maximal inhibitory concentration (IC50) using R’s “pRRophetic” package and the Genomics of Drug Sensitivity in Cancer (GDSC) database (https://www.cancerrxgene.org/) (22). Furthermore, the differential expression of common immune checkpoints in low-risk and high-risk groups was examined to predict potential immunotherapy targets.
The human immortalized non-tumor cholangiocyte cell line (MMNK-1) and CCA cell lines (CCLP-1, HuCCT-1, KKU-055, KKU-100, KKU-213, KKU-214, RBE, and TFK-1) were obtained from the Japanese Collection of Research Bioresources (JCRB) Cell Bank (Osaka, Japan). The HuCCA-1 and RMCCA-1 CCA cell lines were developed from Thai patients with CCA (23, 24). All cell lines were grown in Dulbecco’s modification of Eagle’s medium (DMEM; HyClone Laboratories, Logan, UT, USA) supplemented with 10% fetal bovine serum (Sigma-Aldrich, St Louis, MO, USA) and 1% Penicillin–Streptomycin (HyClone Laboratories) and were cultured in a humidified incubator at 37°C with 5% carbon dioxide. All cell lines were tested to be negative for mycoplasma contamination.
Total RNA was extracted from the cells using GENEzol Reagent (Geneaid Biotech, Taiwan). Then, 1 μg of RNA was reverse-transcribed using a Maxime RT PreMix Kit (iNtRON Biotechnology, Seongnam-si, Gyeonggi-do, Republic of Korea). RT-qPCR was performed using iTaq universal SYBR Green Supermix (Bio-Rad, Hercules, CA, USA) following the manufacturer’s instructions. All primers used in this study are listed in Supplementary Table S2. Relative expression in CCA cell lines was normalized to MMNK-1 cell line using the 2-ΔΔCt method with β-actin (ACTB) as an internal control. Moreover, average 2-ΔCt values were used as each gene’s values to classify CCA cell lines. Then, the expression values were transformed to z-score in each gene of all CCA cell lines. These z-score expression values were used to calculate risk scores in CCA cell lines which were then stratified into low-risk and high-risk FRG groups.
Erastin and RSL3 were obtained from ApexBio Technology (Boston, MA, USA). Two CCA cell lines groups based on the FRG risk groups, including CCLP-1, KKU-214, RBE, and RMCCA-1 were seeded in 96-well plates and incubated in a humidified incubator at 37°C with 5% carbon dioxide for 24 h. The cells were treated for 48 h using a two-fold serial dilution method with erastin concentrations of 0.3125, 0.625, 1.25, 2.5, 5, 10, 20, and 40 μM or RSL3 concentrations of 7.8125, 15.625, 31.25, 62.5, 125, 250, 500, and 1000 nM. Cell viability was determined using 3-(4,5-dimethylthiazol-2-yl)-2,5-diphenyl-2H-tetrazolium bromide (MTT) assay after 48 h of treatment. Briefly, 10 μl of MTT reagent was added to each well and incubated in a humidified incubator for 2 h. Next, the supernatant was removed, and 100 μl of dimethyl sulfoxide (DMSO) was added to each well. Then, cell viability was determined at 570 nm using a microplate reader and the percentage of viable cells was calculated and normalized to the DMSO vehicle control. The IC50 of erastin and RSL3 was calculated and compared between two CCA cell line groups. Three-independent experiments were performed with triplicate samples.
All data were analyzed using the R statistical software (version 4.1.0) or SPSS (version 22.0, IMM Corp; Armonk, NY, USA). Wilcoxon or Student’s t-tests were used to assess differences between groups. The log-rank test was used to assess differences in survival between low-risk and high-risk groups, and a Kaplan-Meier curve was used to visualize patient survival. Pearson’s correlation coefficient (r) was used in all correlation analyses. All results with p-value < 0.05 were considered statistically significant (*p < 0.05, **p< 0.01, ***p < 0.001, ****p < 0.0001).
This study included 267 FRGs which are listed in Supplementary Table S3. Forty-eight ferroptosis-related DEGs were identified between paired tumor and non-tumor tissues in the GSE76297. Heatmap and volcano plots visualized their expression and distribution among samples, with 21 upregulated and 27 downregulated (Figures 2A, B). One hundred eleven patients with overall survival ≥ 30 days from the GSE89749 dataset were used a univariate Cox regression analysis to identify prognostic genes. The 47 prognostic genes associated with survival are listed in Table 1. A Venn diagram identified 17 intersecting genes (candidate genes) among the 48 ferroptosis-related DEGs and 47 prognostic genes (Figure 2C). The univariate Cox regression results for these 17 candidate genes were visualized in a forest plot (Figure 2D). Four were protective factors (ACO1, PEBP1, GOT1, and CXCL12), and 13 genes were risk factors (FANCD2, MT1G, PTGS2, SQLE, NQO1, SLC1A5, TF, MUC1, HELLS, SLC7A5, HAMP, SLC2A1, and RRM2) in CCA patients. The PPI network indicated associations between 17 candidate genes (Figure 2E). Correlations among these genes are shown by a correlation network (Figure 2F).
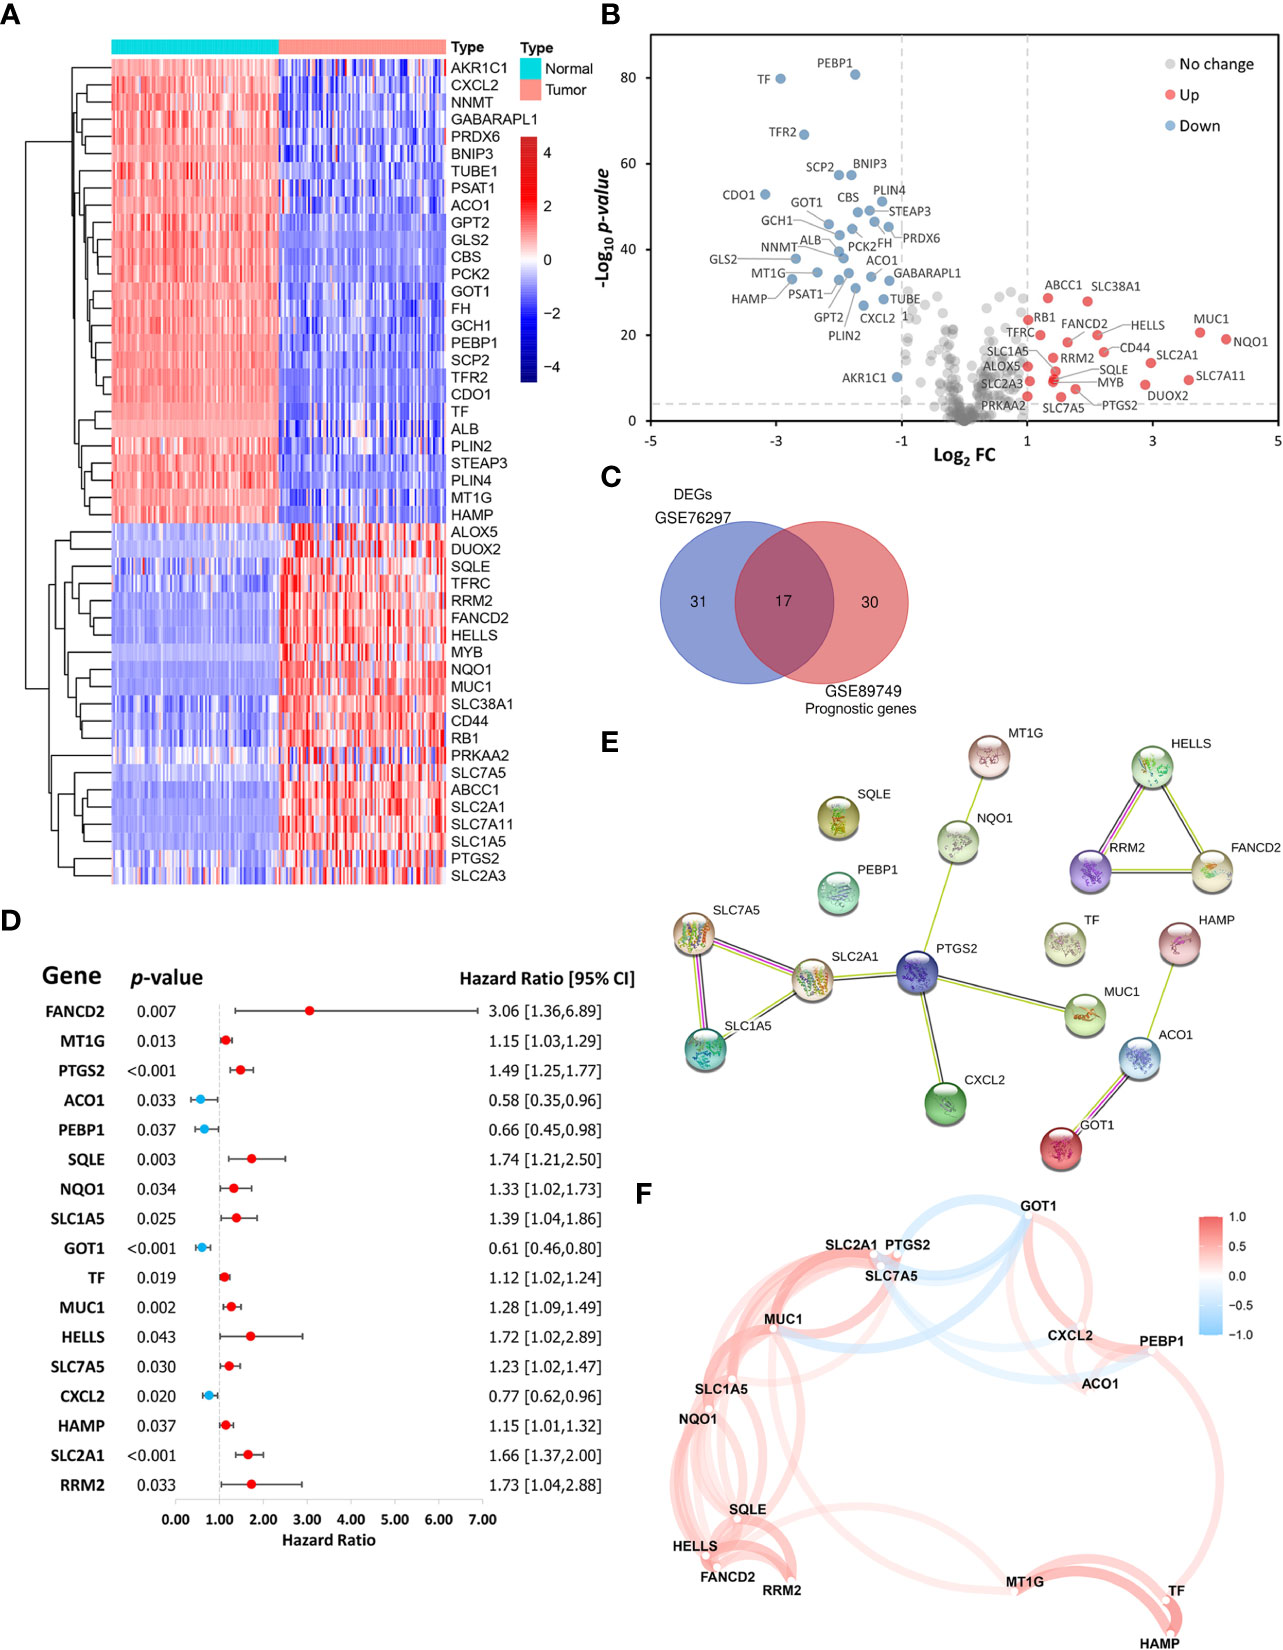
Figure 2 Identification of ferroptosis-related candidate genes. (A) Heatmap and (B) volcano plot showing the expression levels and distribution of differentially expressed genes (DEGs) in cholangiocarcinoma (CCA) tissues and normal tissues in the GSE76297 cohort. (C) A Venn diagram showing the intersection between DEGs and prognostic genes. (D) A forest plot showing the hazard ratios of candidate genes. (E) A protein-protein interaction (PPI) network of the candidate genes in the STRING database. (F) A correlation network of the candidate genes.
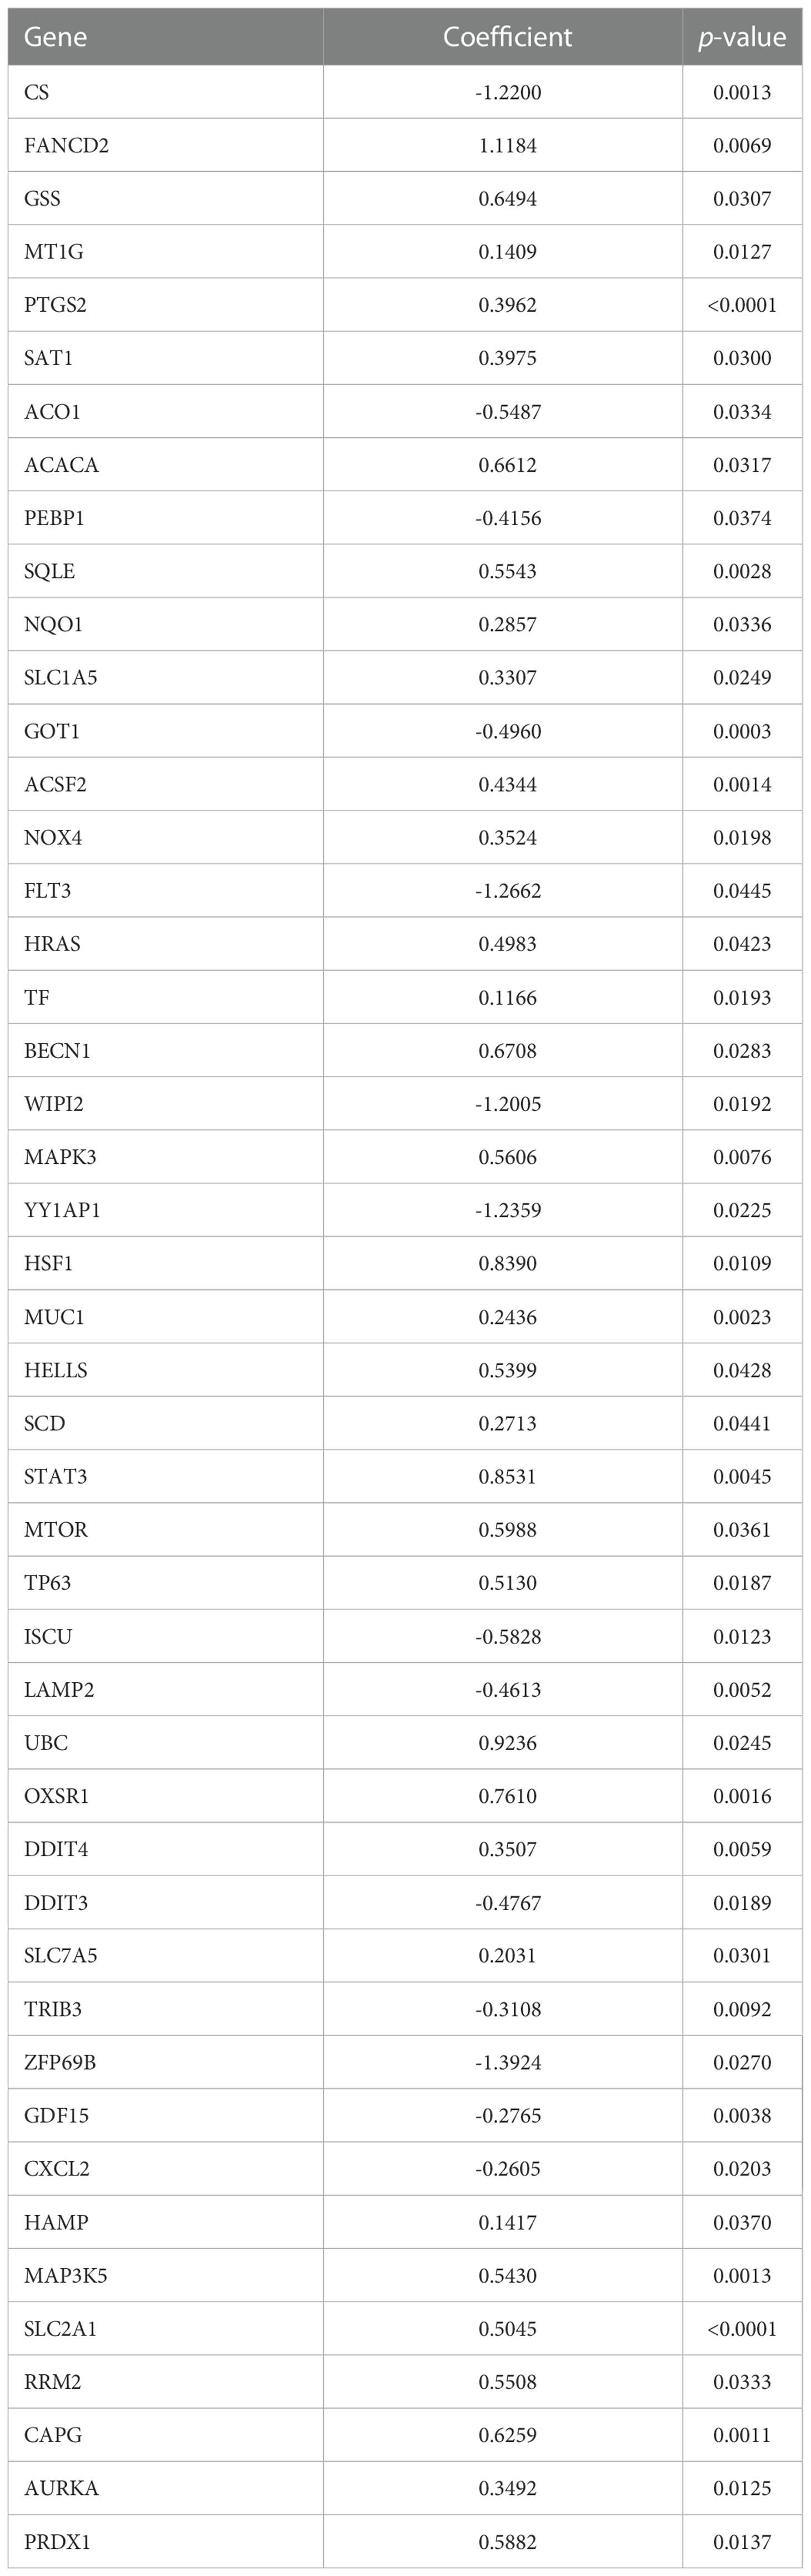
Table 1 Univariate Cox regression analysis of ferroptosis-related genes in GSE89749 cohort.
This study’s reliability was ensured by excluding three out of the 17 candidate genes (MTIG, TF, and HAMP) from gene signature construction. While these three genes were downregulated in tumor samples, their higher expression was associated with poorer prognosis. Therefore, the expression levels of the 14 remaining candidate genes and overall survival data from the GSE89749 cohort were used as a training cohort to construct the FRG signature via a LASSO Cox regression analysis. A six-FRG signature (ACO1, GOT1, PTGS2, SLC2A1, FANCD2, and SQLE) was identified based on the LASSO Cox regression with the minimum optimal lambda value using tenfold cross-validation (Figures 3A, B). Each patient’s risk score was calculated using the LASSO Cox regression analysis coefficient and patients were divided into low-risk and high-risk groups based on their median risk score. The six-FRG signature’s expression in the two risk groups was visualized as a heatmap (Figure 3C). Kaplan-Meier curves were used to compare survival in the two risk groups. They showed that survival was significantly longer in the low-risk group than in the high-risk group (p-value < 0.0001; Figure 3D). The six-FRG signature’s predictive efficacy was evaluated with a time-dependent ROC curve. The area under the ROC curves (AUCs) for the six-FRG signature at 1, 3 and 5 years of survival were 0.7540, 0.8389, and 0.8103, respectively, suggesting that it had high sensitivity and specificity (Figure 3E).
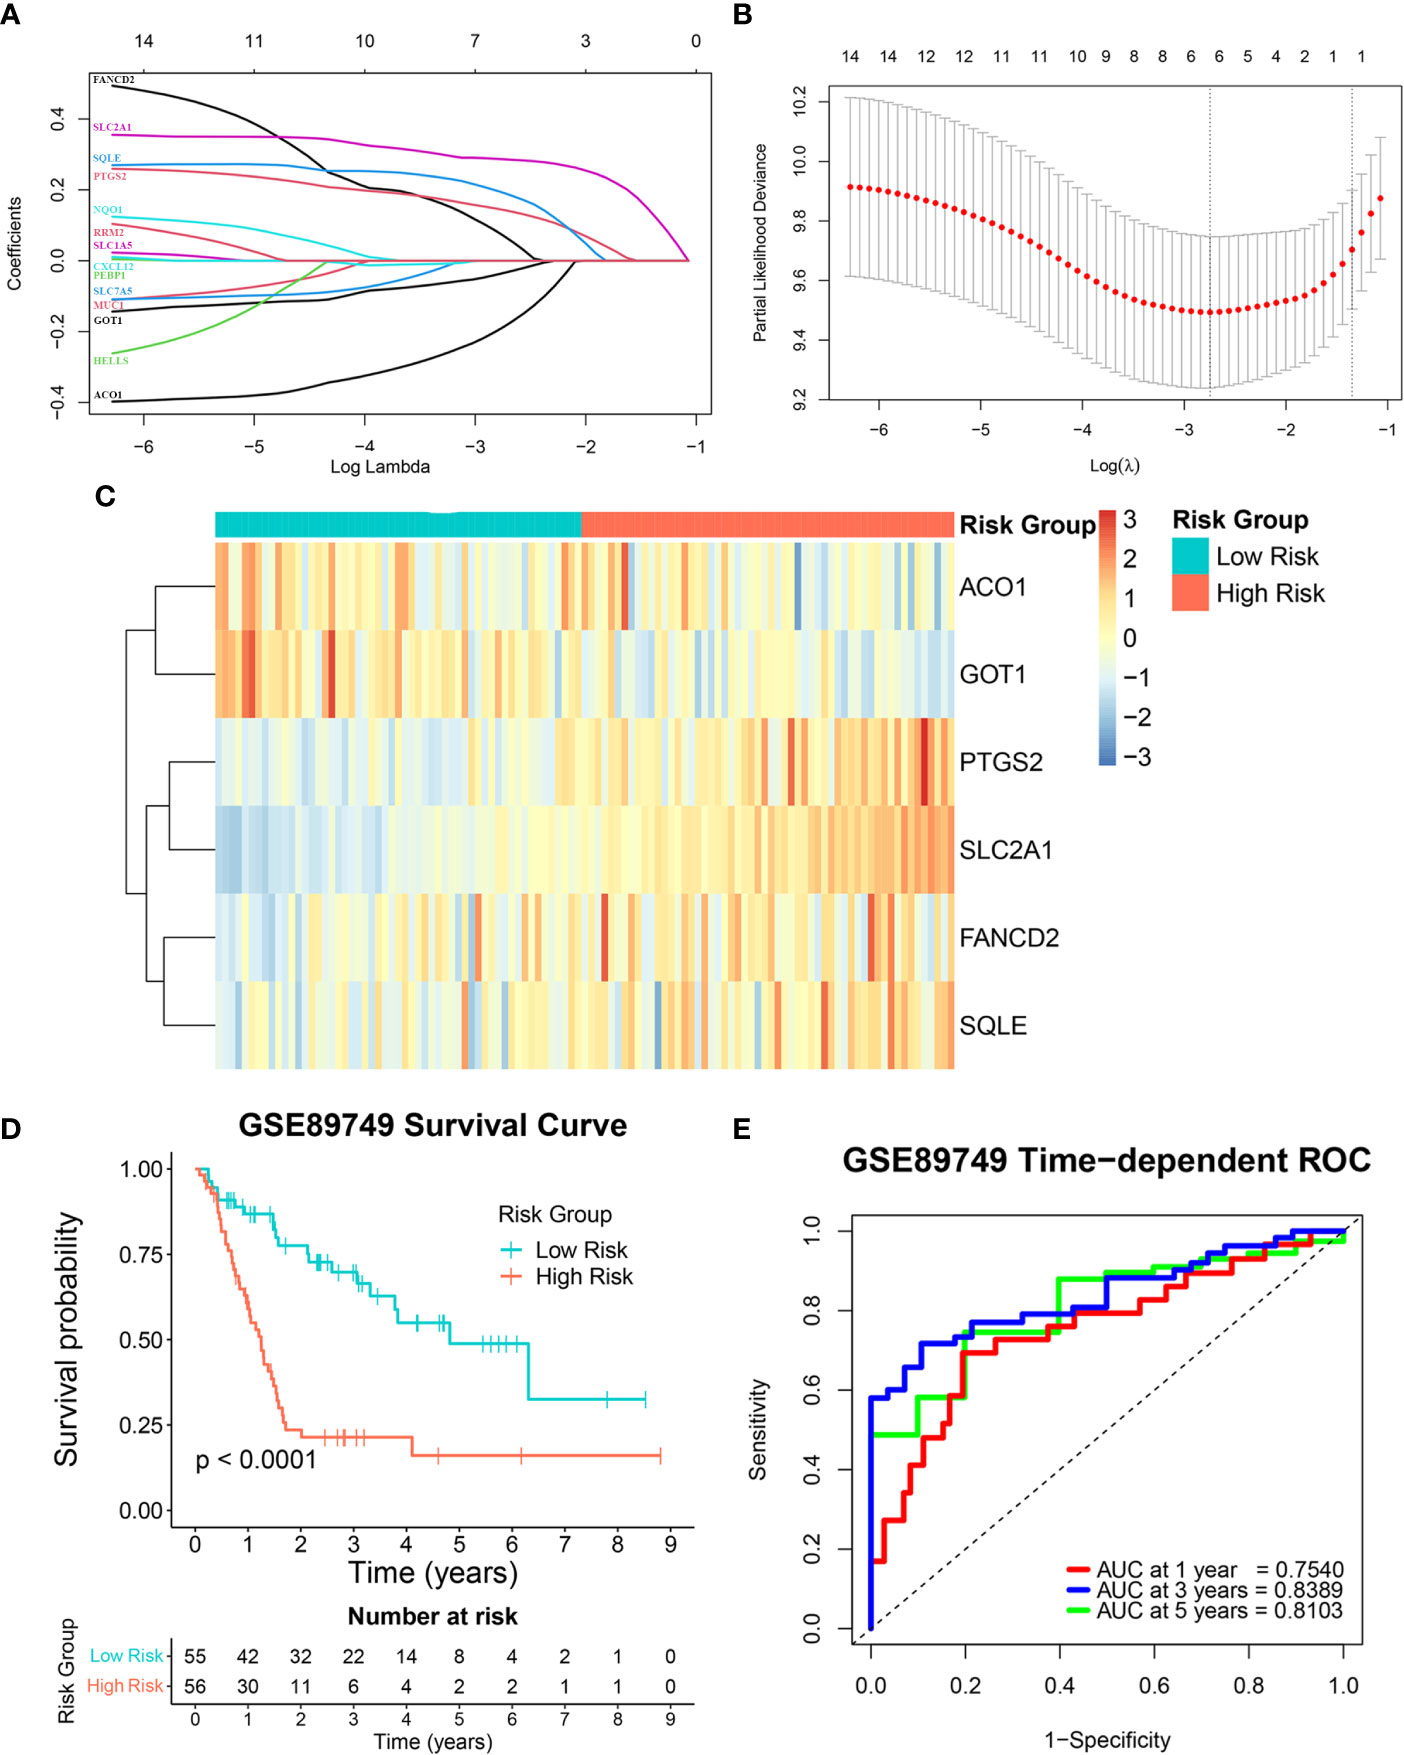
Figure 3 Construction of the ferroptosis-related gene (FRG) signature in a training cohort. (A, B) A least absolute shrinkage and selection operator (LASSO) Cox regression analysis of the candidate genes. (C) A heatmap showing the expression levels and distribution of the six-FRG signature. (D) A Kaplan-Meier curve showing the overall survival of CCA patients. (E) Area under the curve (AUC) of time-dependent receiver operating characteristic (ROC) curves showing the six-FRG signature’s predictive efficacy for survival time in CCA patients.
The six-FRG signature’s reproducibility was assessed using four independent cohorts. Patients with overall survival < 30 days were excluded from the validation cohorts. The model obtained with the training GSE89749 cohort was used to calculate each patient’s risk score in the validation cohorts. The OEP001105 (244 patients), E-MTAB-6389 (75 patients), GSE107943 (30 patients), and TCGA-CHOL (33 patients) cohorts were divided into low-risk and high-risk groups according to their median risk score, except for the TCGA-CHOL cohort, which was divided using best cut-off. Kaplan-Meier curves for the OEP001105, E-MTAB-6389, and GSE107943 cohorts indicated that survival was significantly shorter in the high-risk group than in the low-risk group (p-value < 0.0001, p-value = 0.0003, and p-value = 0.0267, respectively; Figures 4A, C, E). While the Kaplan-Meier curve for the TCGA-CHOL cohort was non-significant (p-value = 0.1638), this might reflect population variation due to small size. Nevertheless, the TCGA-CHOL cohort’s Kaplan-Meier curve indicated that the high-risk group tended to have shorter survival times than the low-risk group, which differed in their median survival (Figure 4G). ROC curves were used to assess the FRG signature’s accuracy in predicting patient survival. The AUCs at 1, 3, and 4 years were 0.7522, 0.7078, and 0.6712 in the OEP001105 cohort, respectively (Figure 4B). The AUCs at 1, 3, and 5 years were 0.7346, 0.7234, and 0.6433 in the E-MTAB-6389 cohort, respectively (Figure 4D). These results indicated that the FRG signature showed the greatest accuracy at one year, then gradually decreased with increasing years. However, the AUCs at 1, 3, and 5 years were 0.7694, 0.8575, and 0.7552 in the GSE107943 cohort, respectively, showing the greatest accuracy at three years (Figure 4F). Furthermore, the AUCs at 1, 3, and 5 years were 0.7105, 0.5829, and 0.6308, in the TCGA-CHOL cohort, respectively (Figure 4H). Altogether, these results suggested that our FRG signature could accurately predict CCA prognosis in patients.
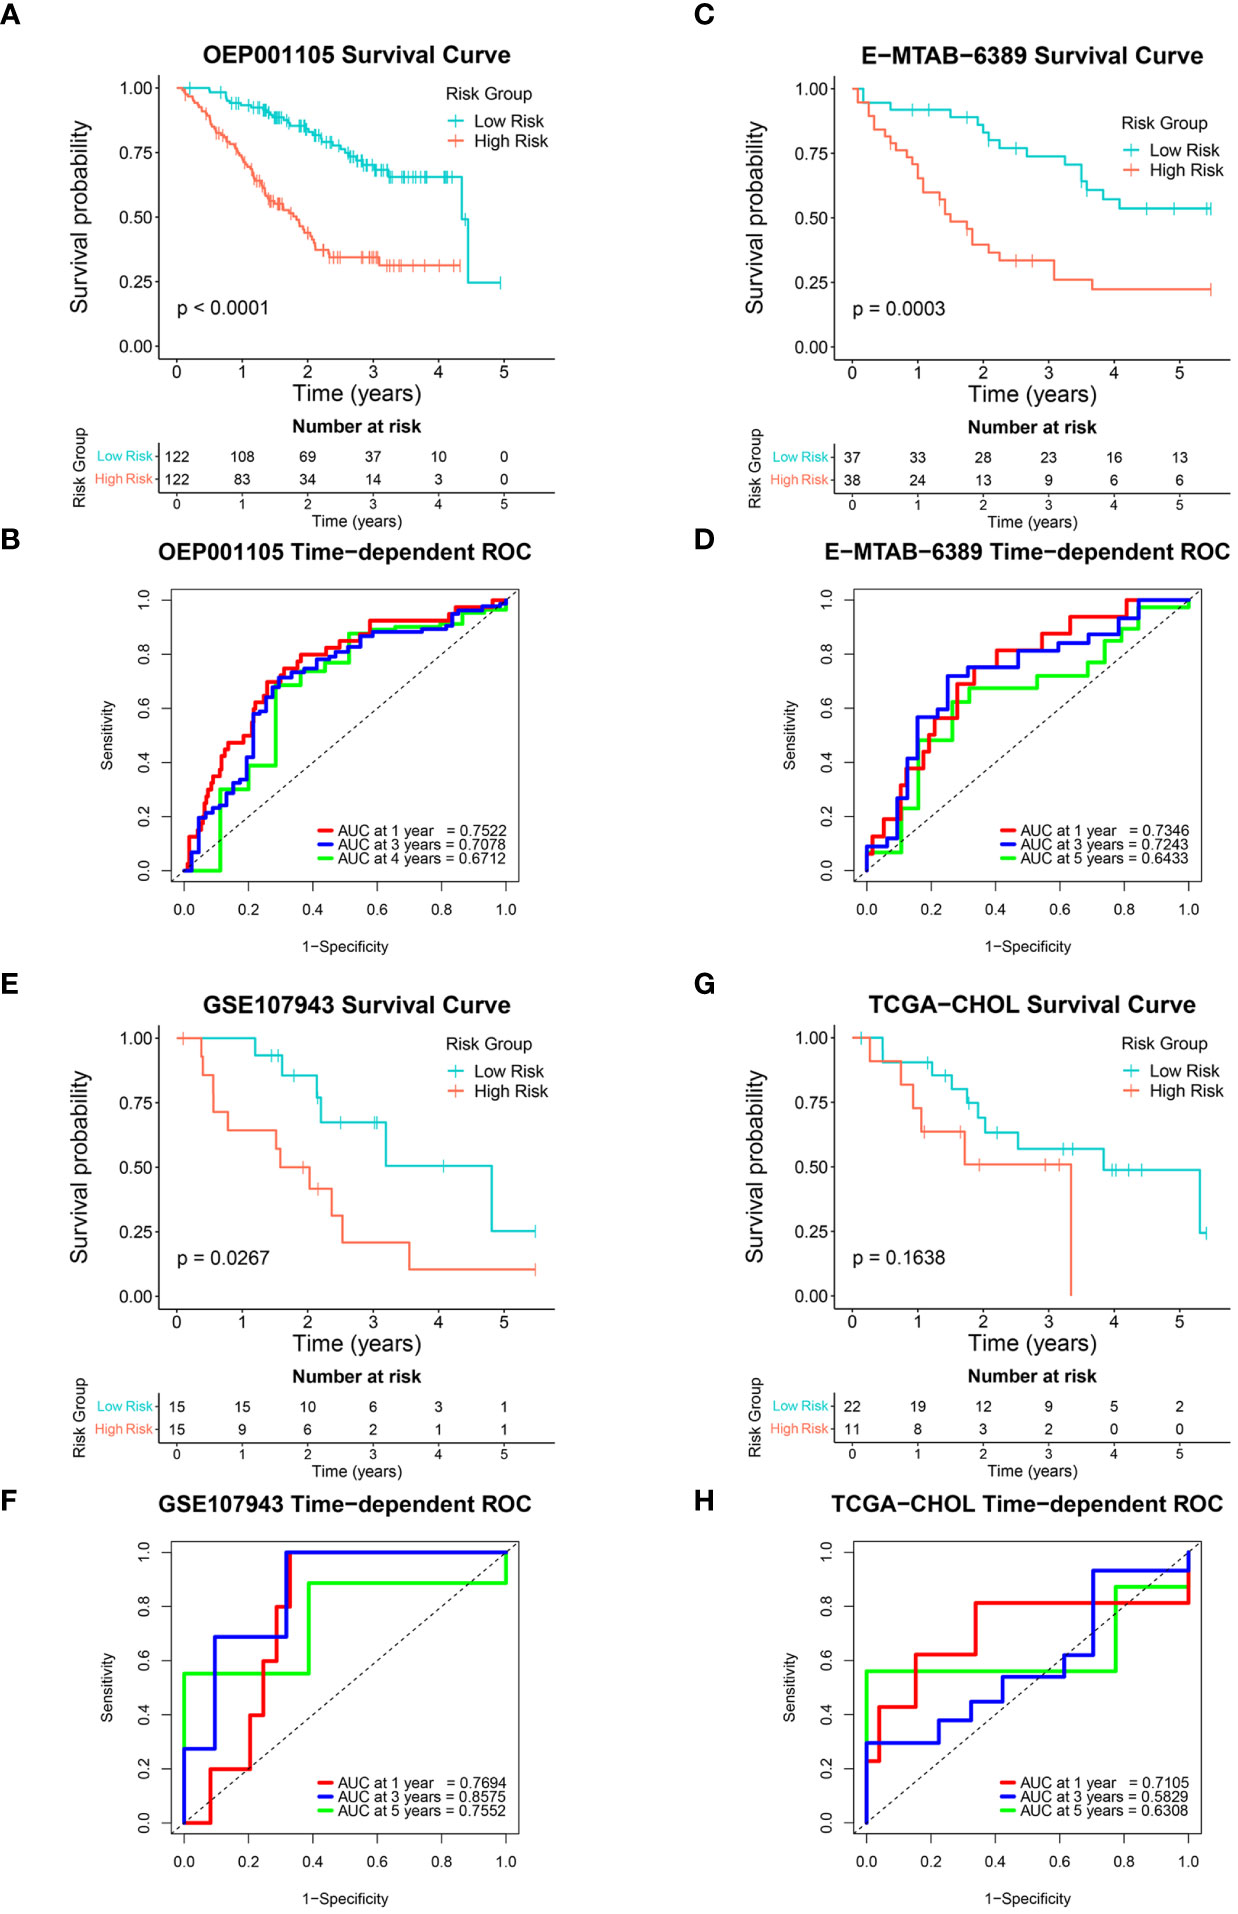
Figure 4 Validation of the six-FRG signature in four independent cohorts. (A, C, E, G) Kaplan-Meier curves and (B, D, F, H) time-dependent ROC curves for each independent cohort.
A univariate Cox regression analysis was used to investigate the association between risk score and clinical characteristics, including fluke infection, sex, age, and stage in the GSE89749 and OEP001105 cohorts. A forest plot of the univariate Cox regression showed that risk score (HR = 3.77), fluke infection (HR = 2.95), and stage (HR = 4.07) were significantly associated with patient survival in the GSE89749 cohort (Figure 5A). Similarly, risk score (HR = 2.08) and stage (HR = 2.24) were significantly associated with patient survival in the forest plot of OEP001105 cohort (Figure 5D). A multivariate Cox regression was performed to determine whether risk score was an independent prognostic factor. The forest plot for the multivariate Cox regression showed that risk scores were an independent prognostic factor in the GSE89749 and OEP001105 cohorts (p-value < 0.001; Figures 5B, E). Furthermore, the high-risk group was also associated with fluke infection and high clinical stages in the GSE89749 cohort, but only with high clinical stages in OEP001105 cohort (Figures 5C, F).
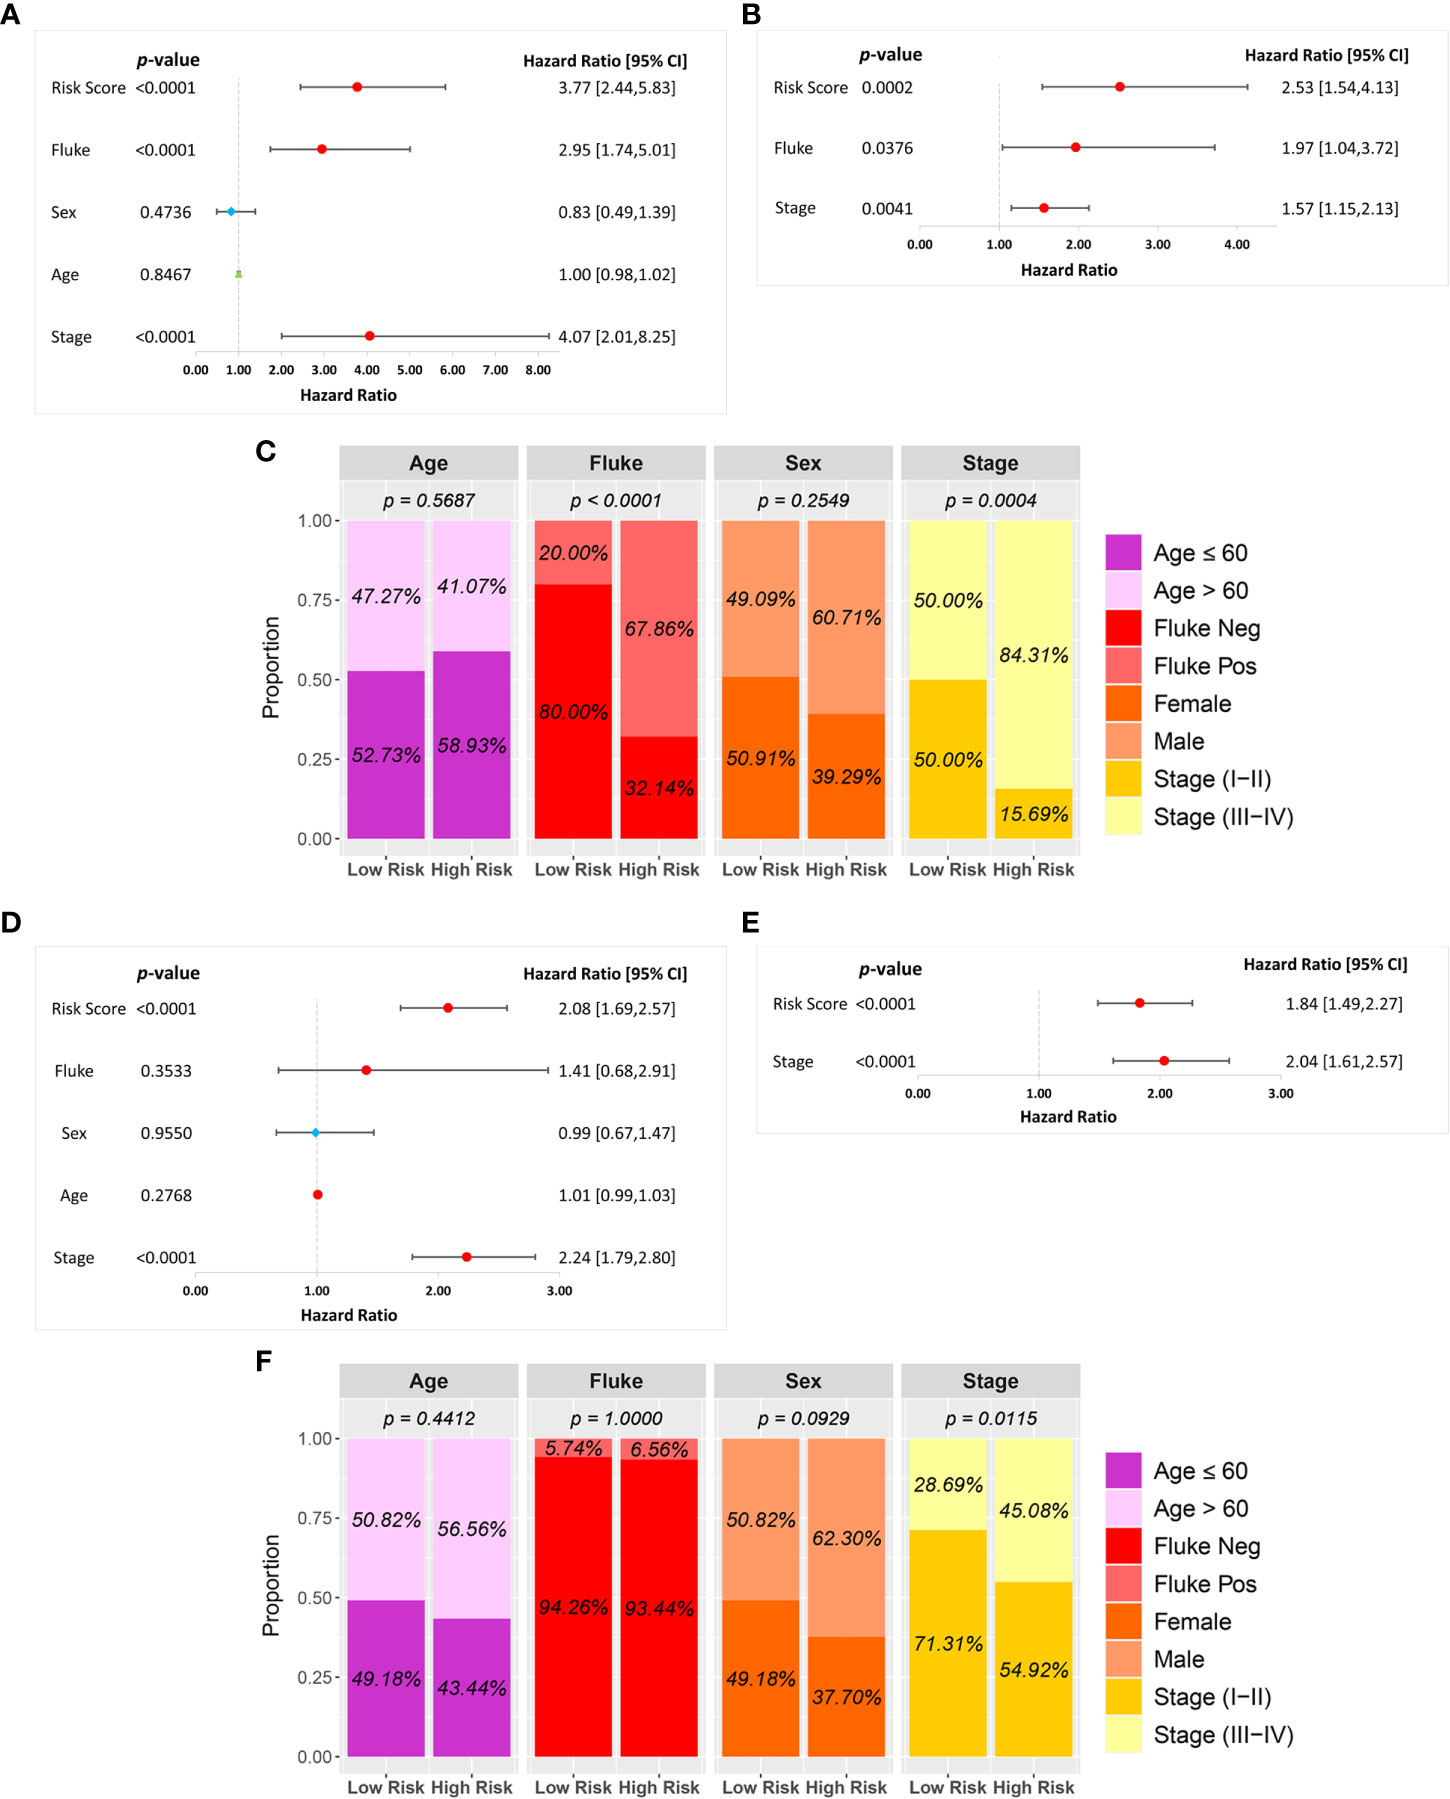
Figure 5 Univariate and multivariate Cox regression analyses of the six-FRG signature and other clinical characteristics in the (A–C) GSE89749 and (D–F) OEP00105 cohorts.
GSEA was performed to investigate the underlying differences in functions and biological processes between the low-risk and high-risk groups based on GO and KEGG pathways. The GO analysis identified biological process (BP), cellular component (CC), and molecular function (MF) enriched in the high-risk CCA patient groups (Figure 6A). KEGG pathway analysis identified differential pathway enrichment between the low-risk and high-risk CCA patient groups (Figure 6B).
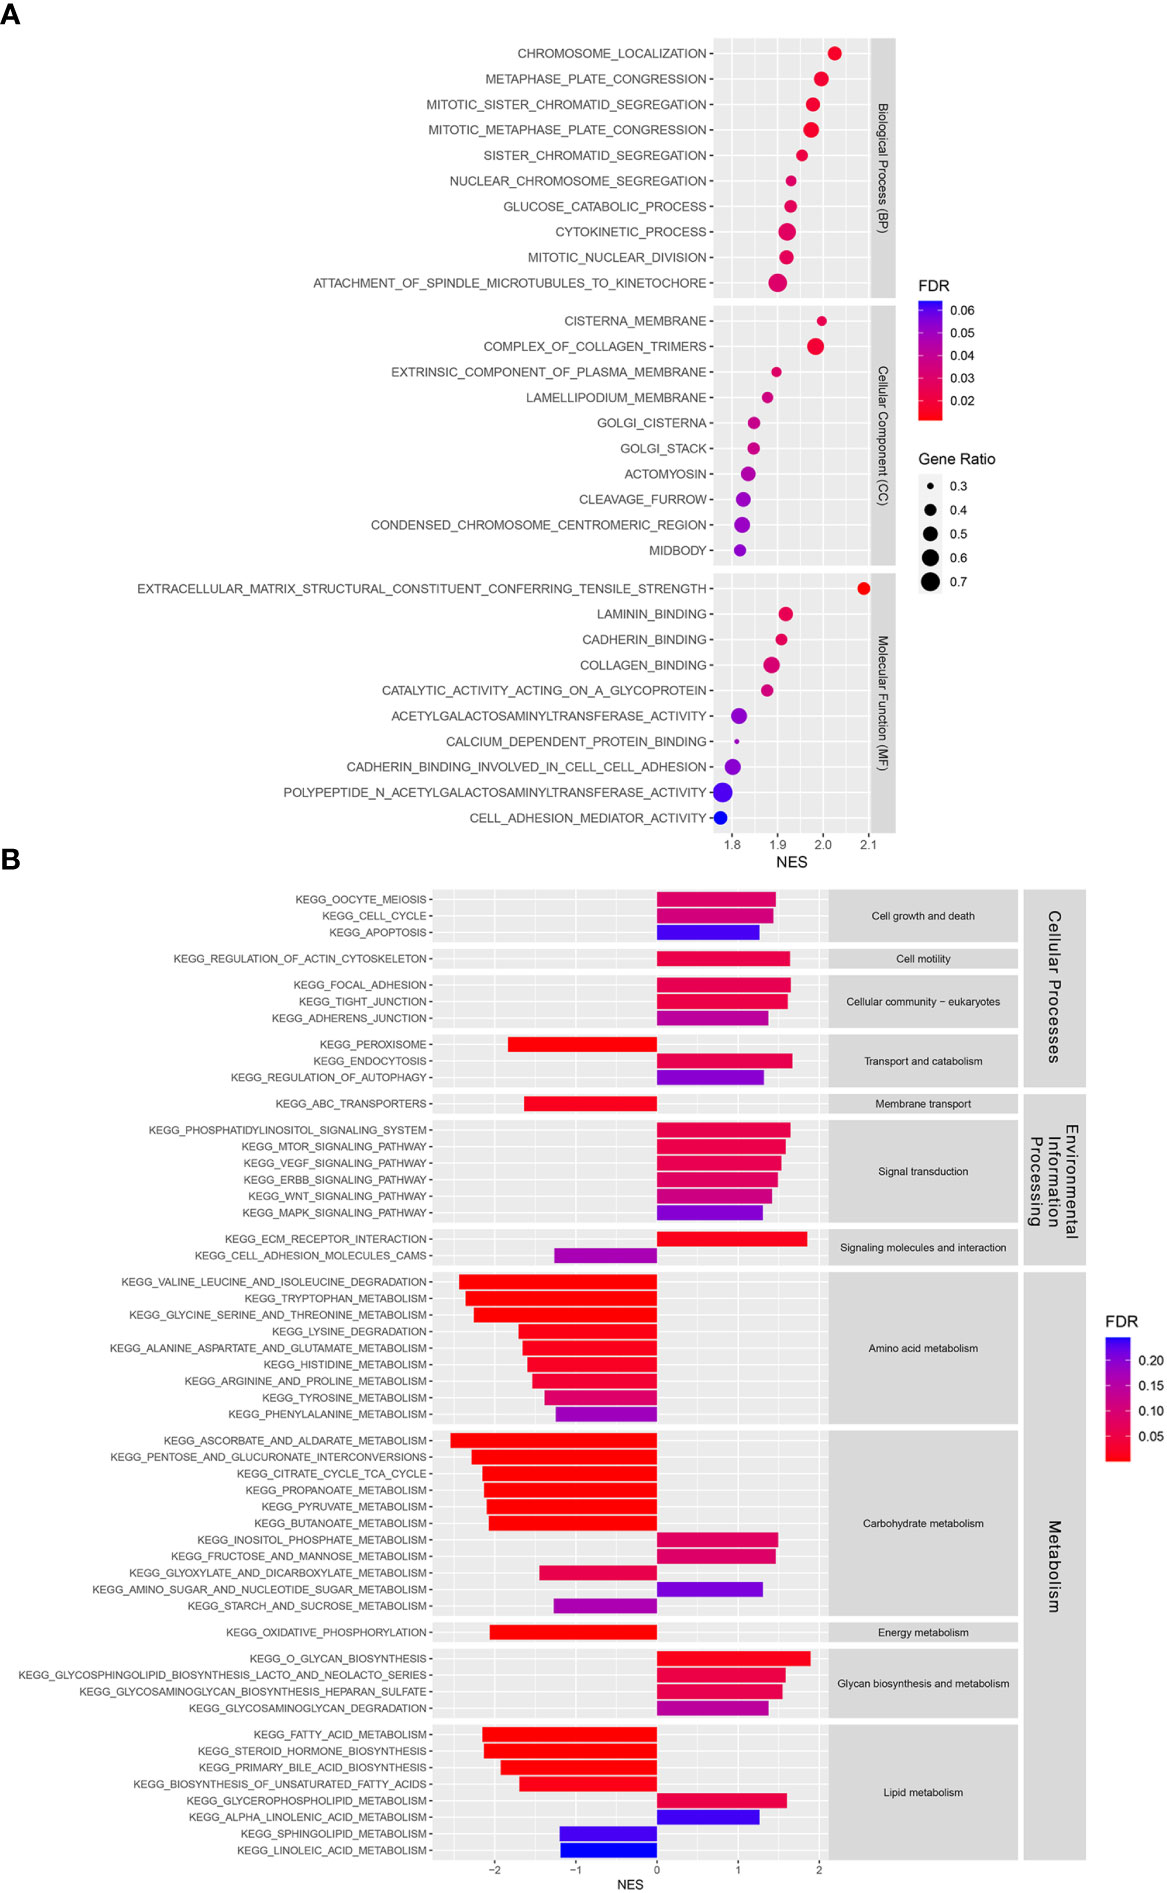
Figure 6 Functional and pathway enrichment analyses in a training cohort. (A) Gene Ontology (GO) analysis of differences between risk groups in three functional categories: Biological processes (BPs), cellular components (CCs), and molecular functions (MFs). (B) A Kyoto Encyclopedia of Genes and Genomes (KEGG) pathway enrichment analysis of differences between risk groups.
The 22 immune cell infiltration results estimated by the CIBERSORTx algorithm showed that plasma cells, regulatory T cells (Tregs), resting natural killer (NK) cells, and activated dendritic cells were significantly higher in the high-risk than in the low-risk groups. Gamma delta T cells and M1 and M2 macrophages were significantly lower in the high-risk group than in the low-risk group (Figure 7A). In addition, EPIC and MCP-counter algorithms were used to estimate CAF scores in the low-risk and high-risk groups. Both EPIC and MCP-counter algorithms showed that CAF scores were significantly higher in the high-risk group than in the low-risk group (Figures 7B, C). Furthermore, CAF specific marker expression was compared between the risk groups. FAP, ACTA2, MFAP5, COL11A1, PDPN, and ITGA11 expression levels were significantly higher in the high-risk group than in the low-risk group (Figure 7D). These results indicated that immune responses and CAF statuses differed in these two patient groups, which might be translated to target the TME in CCA.
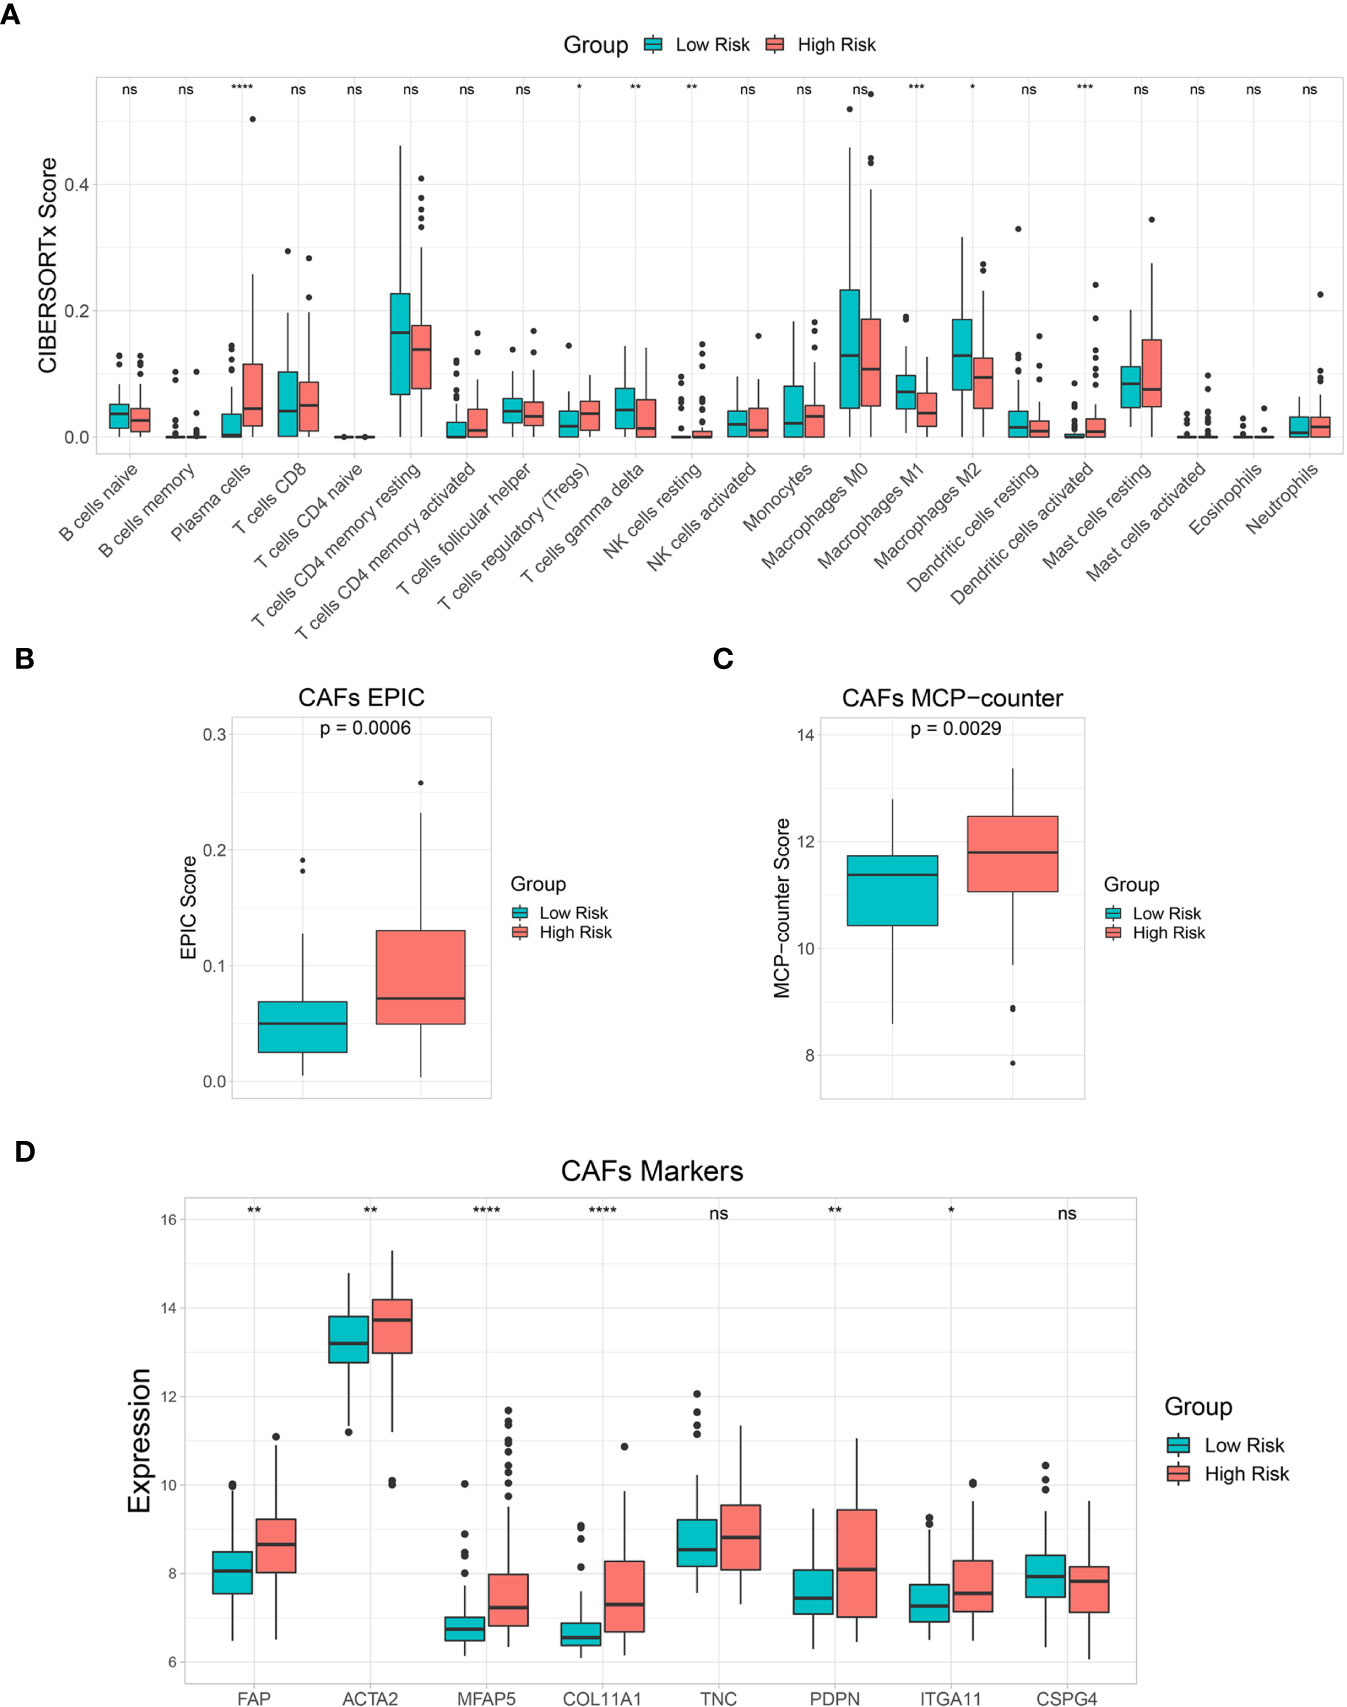
Figure 7 Immune cell infiltration and tumor microenvironment (TME) analysis. (A) A box plot showing the differences in multiple immune cells between low-risk and high-risk groups based on the CIBERSORTx algorithm. (B, C) A box plot showing differences in cancer-associated fibroblast (CAF) score based on EPIC and MCP-counter algorithms. (D) A box plot comparing CAF marker expression levels between risk groups. Key: ns, not significant; *p < 0.05; **p < 0.01; ***p < 0.001; ****p < 0.0001.
The GDSC database was used to estimate IC50 of various drugs via R’s “pRRophetic” package to predict drug sensitivity between the low-risk and high-risk groups. The estimated IC50 for 10 drugs (BI-2536, GW843682X, Afatinib, Paclitaxel, Imatinib, WZ-1-84, GW441756, PHA-665752, CHIR-99021, and SB-216763) out of 138 screened drugs were lower in the high-risk group than in the low-risk group, indicating that the high-risk group was more sensitive to these drugs than the low-risk group (Figure 8A). Moreover, an immune checkpoint analysis showed that CD47, HHLA2, and TNFRSF14 expression was significantly higher in the high-risk group than in the low-risk group (Figure 8B). Therefore, these immune checkpoints might be effective immunotherapy targets in the high-risk CCA patient group.
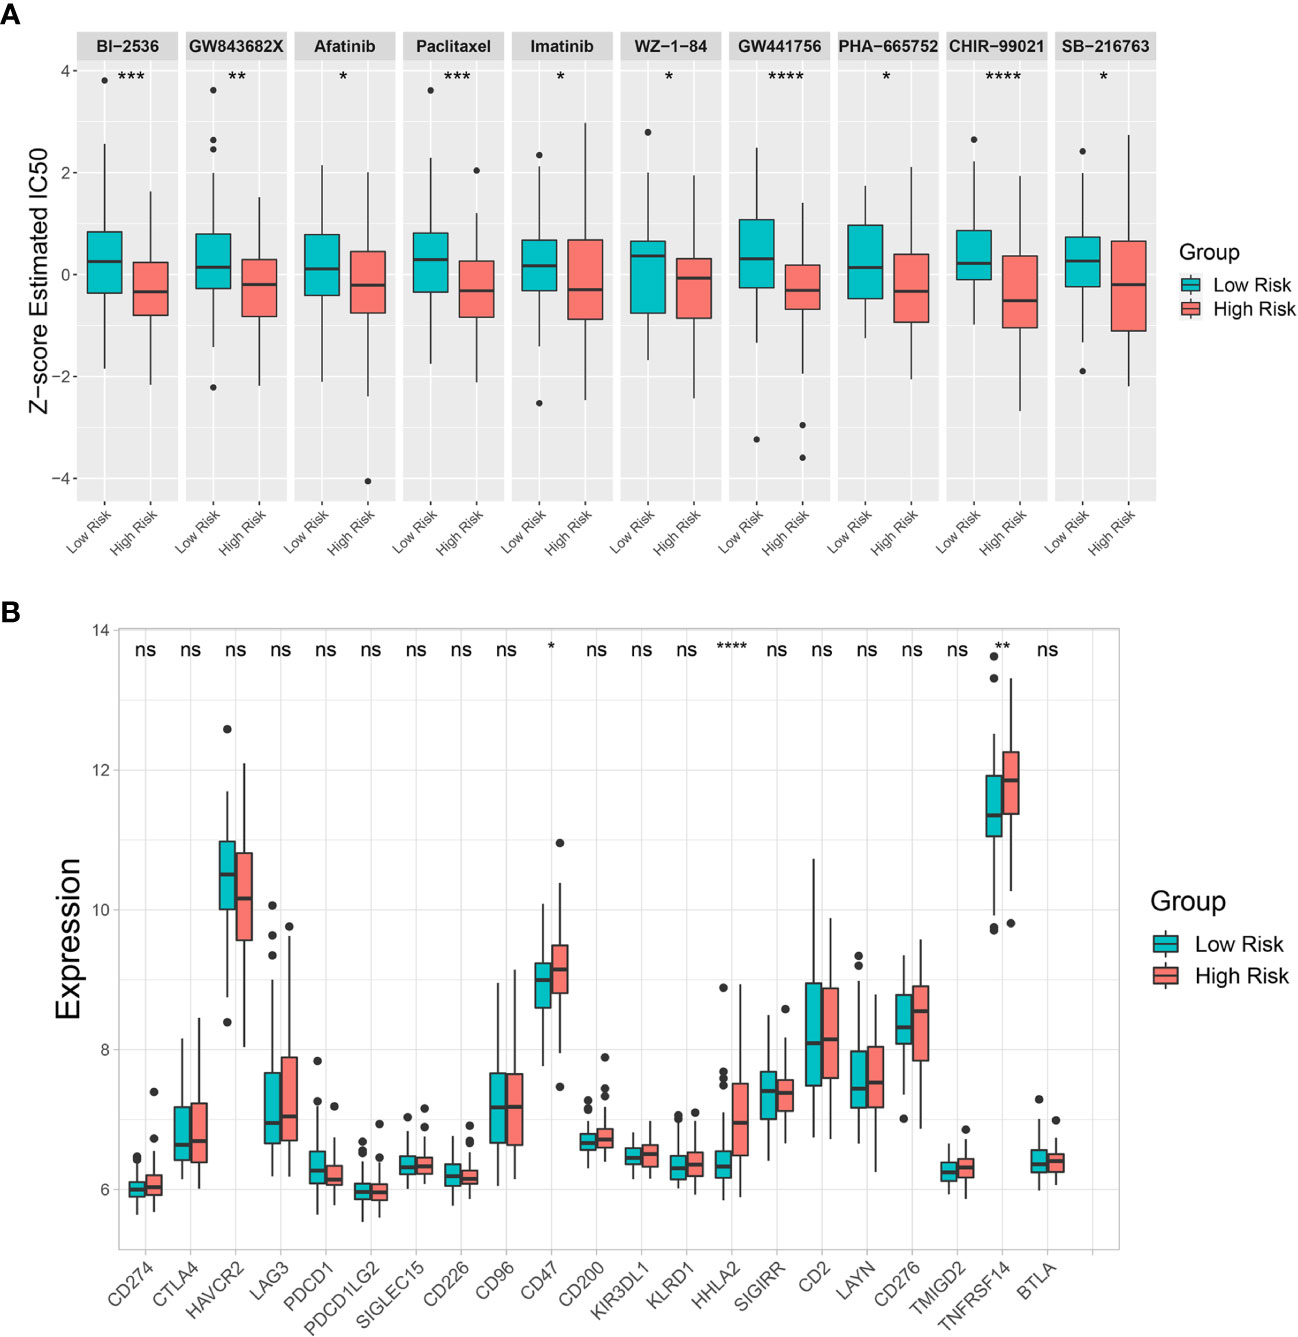
Figure 8 Drug sensitivity prediction and immune checkpoint analysis. (A) Differences in estimated half-maximal inhibitory concentration (IC50) between risk groups for 10 candidate drugs. (B) A box plot comparing immune checkpoint marker expression levels between risk groups. Key: ns, not significant; *p < 0.05; **p < 0.01; ***p < 0.001; ****p < 0.0001.
A total of 8,320 proteins were identified in the OEP001105 cohort. Four of six-FRG signature genes were present in this database (ACO1, GOT1, SLC2A1, and SQLE). Therefore, correlations between their mRNA and protein expression levels were analyzed in this cohort to confirm their protein expression. Protein and mRNA levels were significantly correlated for ACO1 (r = 0.78), GOT1 (r = 0.89), SLC2A1 (r = 0.83) and SQLE (r = 0.78; Figures 9A–D). In addition, the score formula obtained from the training cohort was used to evaluate patient survival in this cohort based on the protein levels of these four genes. Kaplan-Meier curves showed that survival time was significantly shorter in the high-risk group than in the low-risk group (Figure 9E). The AUCs at 1, 3, and 4 years of survival were 0.7200, 0.7013, and 0.7360, respectively (Figure 9F). These results suggested that these four genes could provide an accurate prognostic signature. In addition, The Human Protein Atlas (HPA) database (https://www.proteinatlas.org/) (25) was used to confirm the protein expression of the six-FRG signature in CCA. The immunohistochemistry images from The HPA database showed that ACO1 and GOT1 levels were lower in tumor compared to normal tissues. In contrast, FANCD2, PTGS2, SLC2A1, and SQLE were higher in tumor compared to normal tissues (Supplementary Figure S1).
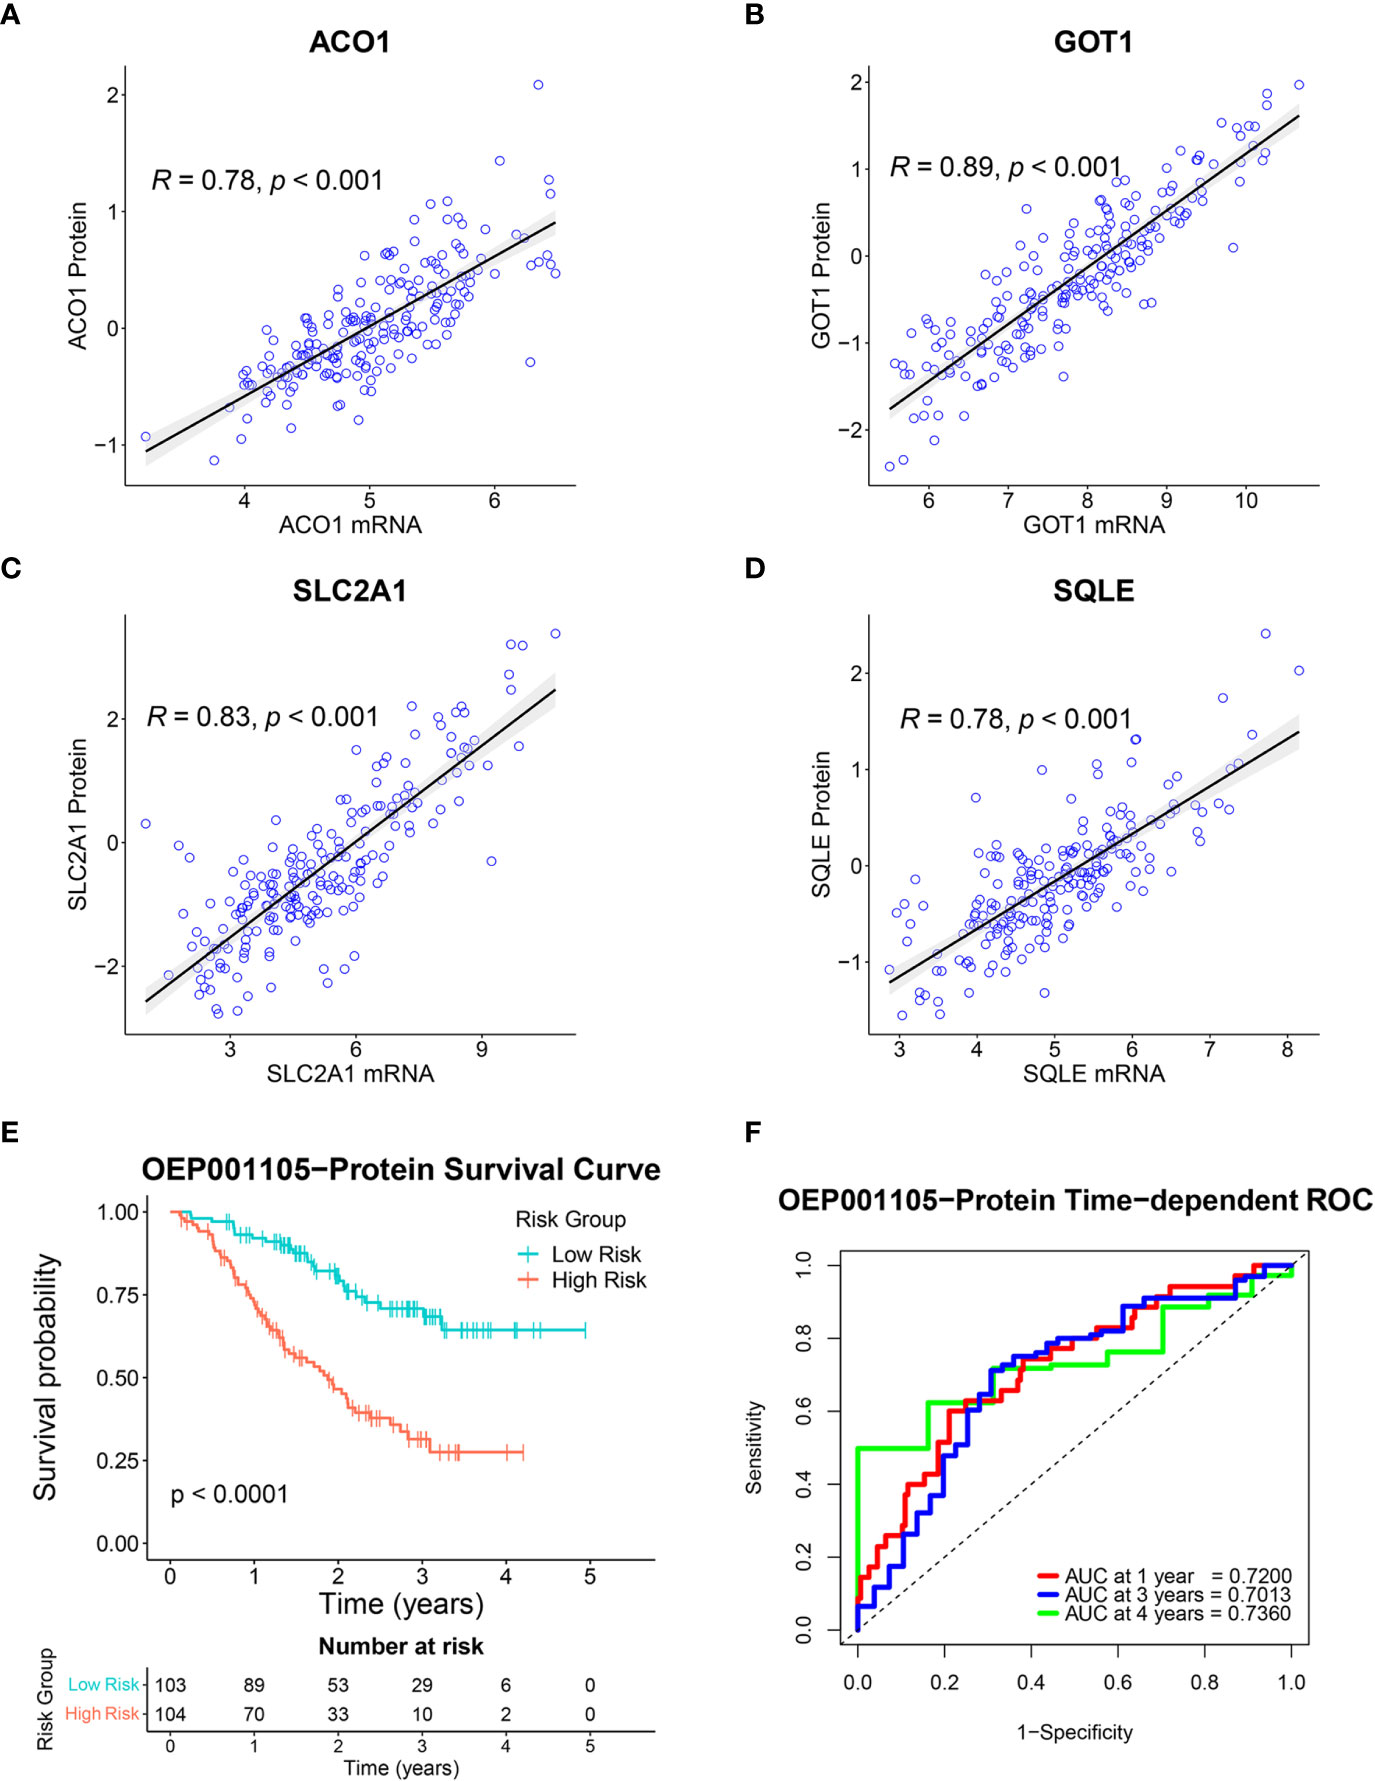
Figure 9 Validation of the six-FRG signature based on protein levels in the OEP001105 cohort. (A–D) Scatter plots showing the correlation between mRNA and protein expression levels of ACO1, GOT1, SLC2A1, and SQLE. (E) A Kaplan-Meier curve comparing survival time between patient groups defined on six-FRG signature protein levels. (F) Time-dependent ROC curves.
RT-qPCR was used to investigate the expression of six-FRG signature in 10 CCA cell lines relative to a non-tumor cholangiocyte cell line (MMNK-1). ACO1 and GOT1 expression was downregulated in most CCA cell lines compared to the MMNK-1 cell line. In contrast, FANCD2, PTGS2, SLC2A1, and SQLE expression was upregulated in CCA cell line compared to the MMNK-1 cell line (Figures 10A–F). Interestingly, the expression of the six-FRG signature in CCA cell lines showed a similar trend to their expression in CCA tissues. Moreover, the formula constructed from the training cohort was used to calculate risk score for each CCA cell line and divided them into high-risk and low-risk groups. The functional role of the six-FRG signature in ferroptosis was investigated by examining the sensitivity of the two CCA cell lines with the highest (KKU-214 and RMCCA-1) and lowest (CCLP-1 and RBE) risk scores to ferroptosis inducers (Figure 10G). Their sensitivity to ferroptosis inducers erastin and RSL3 was compared using IC50 values. Interestingly, the two CCA cell lines with the lowest-risk scores (CCLP-1 and RBE) were more sensitive to both ferroptosis inducers. The CCA cell lines with the highest-risk scores (KKU-214 and RMCCA-1) had higher IC50 values than the CCA cell lines with the lowest-risk scores following treatment with both ferroptosis inducers (Figures 10H–J). These results highlight the association between the risk score and ferroptosis sensitivity. CCA cell lines with higher-risk scores were more resistant to ferroptosis, indicating that protective mechanisms against ferroptosis might be enhanced in such CCA cell lines.
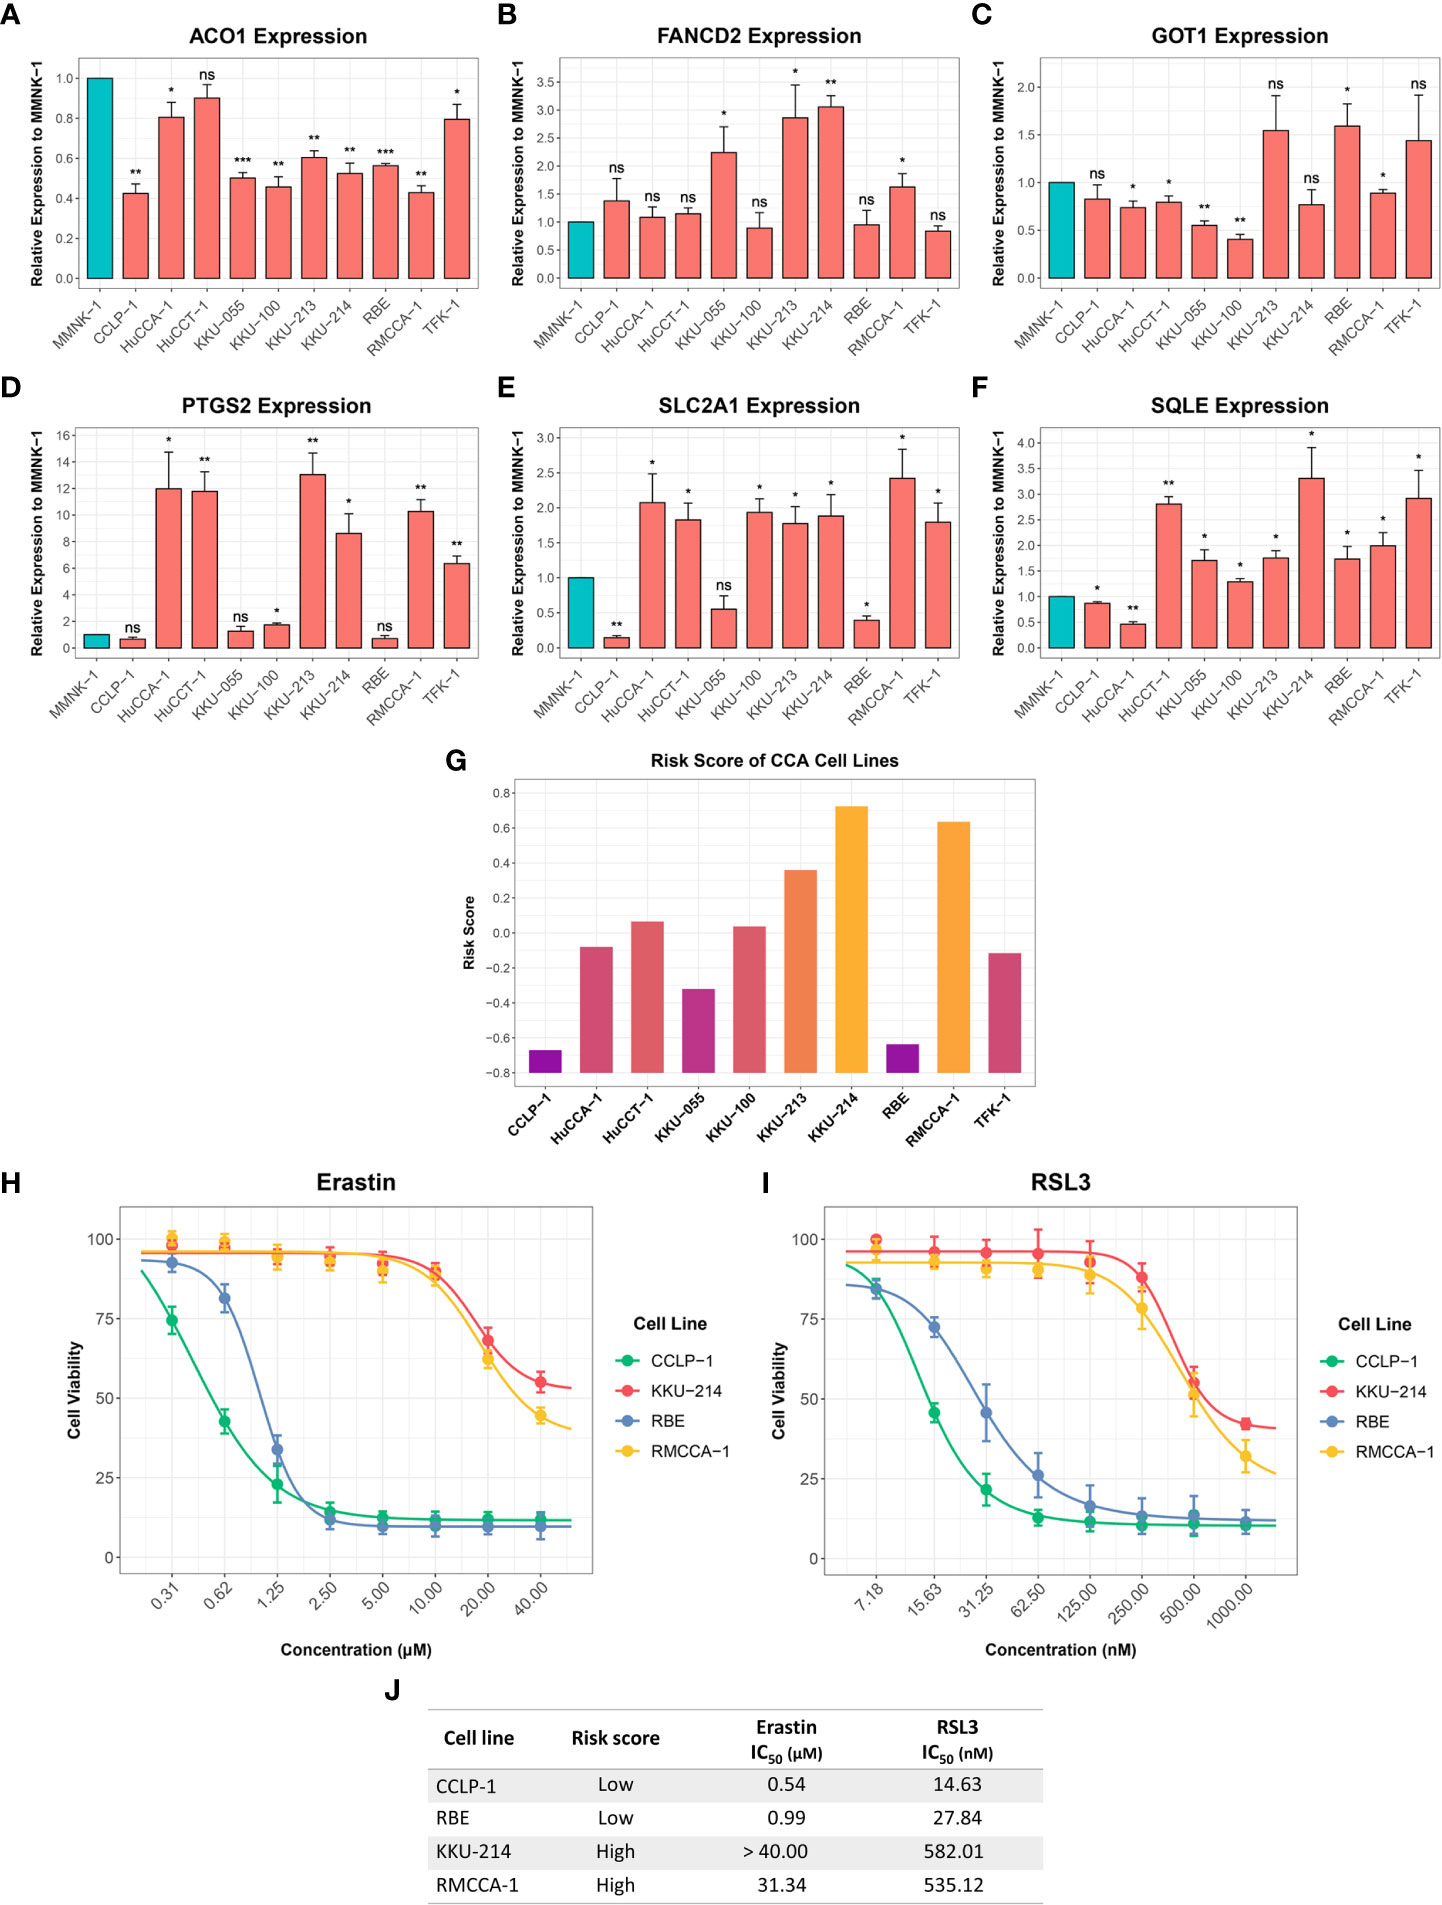
Figure 10 Expression of the six-FRG signature in CCA cell lines and their sensitivity to ferroptosis inducers. (A-F) The relative expression levels of the six-FRG signature in 10 CCA cell lines normalized to a non-tumor MMNK-1 cell line. (G) Risk scores calculated using six-FRG signature in 10 CCA cell lines. (H) Cell viability of CCLP-1, RBE, KKU-214, and RMCCA-1 treated with erastin. (I) Cell viability of CCLP-1, RBE, KKU-214, and RMCCA-1 treated with RSL3. (J) A table showing IC50 of erastin and RSL3 in CCLP-1, RBE, KKU-214, and RMCCA-1. Key: ns, not significant; *p < 0.05; **p < 0.01; ***p < 0.001.
CCA is the second most common cancer in the hepatobiliary system. Patients with CCA have poor prognoses and high mortality rate in which patients in advanced stages have a low 5-year survival rate of 5% to 10%. Due to tumor heterogeneity and no effective therapy, patients with CCA have the worst prognosis. Targeting programmed cell death is one of the most effective cancer treatments, and dysregulation of this pathway and its-related genes are directly associated with prognosis of patients. Accumulating evidence has demonstrated that ferroptosis, a recently identified regulated cell death pathway, is a promising cancer therapy in several cancers. In addition, several studies have shown the relationship between FRGs and patient prognosis. While few previous studies have explored the relationship between FRG signatures and prognosis in CCA patients, a comprehensive analysis and validation in more patients and cohorts have not been performed. Moreover, to our knowledge, studies focusing on the role of prognostic genes and their associations with ferroptosis are limited. Consequently, how ferroptosis contributes to CCA remains unclear. Therefore, discovering a novel FRG signature might aid in predicting prognosis and developing novel therapeutic targets that can help to improve the overall survival of CCA patients.
This study constructed an FRG signature to predict the prognosis of CCA patients. Seventeen DEGs with prognostic values were identified in a training cohort using paired-sample t-tests and univariate Cox regression analyses. We then obtained a six-FRG signature related to patient survival in a LASSO Cox regression analysis in a training cohort. Following Kaplan-Meier analyses, our FRG signature showed that CCA patients with high-risk scores had poor prognoses, and low-risk scores had a longer survival time, indicating that our new FRG signature had strong prognostic potential in CCA patients. Predictive ability was further confirmed via ROC curve analyses, where our FRG signature had adequate predictive power. Furthermore, univariate and multivariate Cox regression analyses indicated that the risk score based on this six-FRG signature was an independent prognostic factor. The risk scores were associated with fluke infection and clinical stages in patients in the GSE89749 cohort, but only with clinical stages in patients in the OEP001105 cohort, potentially reflecting the small number of fluke- infected patients in this cohort. Therefore, our novel six-FRG signature can accurately predict prognoses for CCA patients and divide them into low-risk and high-risk groups in which appropriate therapeutic strategies can be used for personalized therapy.
High expression of four genes in the six-FRG signature (FANCD2, PTGS2, SLC2A1, and SQLE) were associated with poor prognosis in CCA patients and low expression of the six-FRG other two genes (ACO1 and GOT1) were associated with poor prognosis in CCA patients. Previous studies have shown that most FRGs in the signature are involved in tumor progression in CCA and various other cancers. ACO1, also known as IRP1, is an RNA-binding protein that controls iron homeostasis by regulating TFRC and FTH1 expression in CCA and hepatocellular carcinoma (26, 27). ACO1 depletion decreased iron levels and suppressed erastin- and RSL3-induced ferroptosis in melanoma (28). Moreover, GOT1 downregulation suppressed ferroptosis in melanoma by reducing α-ketoglutarate which is a metabolic intermediate in ROS production (29). However, the role of GOT1 in CCA remains unknown. In contrast, FANCD2 was found to be a ferroptosis suppressor in bone marrow injury by regulating the expression of iron metabolism and lipid peroxidation-related genes (30). FANCD2 was identified as a prognostic gene associated with poor prognosis in colon cancer, lung adenocarcinoma, clear cell renal cell carcinoma, and glioma (31–34). PTGS2, also known as COX-2, was identified as an upregulated ferroptosis marker during ferroptosis (11). PTGS2 was upregulated in tumor tissues and promoted tumor progression and chemotherapy resistance in various cancers (35–37). PTGS2 has been shown to promote tumor development in CCA, while its inhibition potentiated conventional chemotherapy effects (38–41). SLC2A1, also known as GLUT1, is a glucose transporters family member. SLC2A1 was found to be upregulated and play a role in tumor progression in various cancers (42–45). A previous study identified SLC2A1 as a prognostic gene in CCA patients (46, 47). Overexpression of SQLE, a key enzyme in cholesterol biosynthesis, increased lipid peroxidation, leading to ferroptosis (48). Recent studies found that SQLE promoted tumor progression, and its expression was associated with poor prognosis in breast cancer, pancreatic adenocarcinoma, and bladder cancer (49–51). In summary, consistent with the previous studies, our study showed that ACO1 and GOT1 were downregulated and correlated with good prognosis in CCA patients. In contrast, FANCD2, PTGS2, SLC2A1, and SQLE were upregulated and correlated with poor prognosis in CCA patients. However, their functional roles in ferroptosis and CCA progression remain unknown, and mechanistic studies on each prognostic FRG in our signature are needed.
In addition, our GO analysis identified BP, CC, and MF enrichments in the high-risk group. Among the BPs, the nuclear division process was enriched in the high-risk group, indicating that they might have higher proliferation than the low-risk group. The CC results showed that Golgi apparatus components were enriched in the high-risk group. Previous studies have shown that the Golgi apparatus plays important roles in cellular redox control and prevents ferroptosis (52, 53). The MF results showed that cell adhesion molecules, such as laminin and cadherin binding, and cell adhesion mediator activity were enriched in the high-risk group. Recently, cell-cell interaction was found to regulate ferroptosis sensitivity (54). Moreover, a KEGG pathway analysis was used to identify the main signaling pathways contributing to CCA by comparing low-risk and high-risk groups. Many signal transduction pathways frequently dysregulated in cancers were enriched in the high-risk group, including the phosphatidylinositol, mammalian target of rapamycin (mTOR), vascular endothelial growth factor (VEGF), erb-be receptor tyrosine kinase (ERBB), Wnt, and mitogen-activated protein kinase (MAPK) signaling pathways. These signaling pathways have been shown to play important roles in CCA and various cancers (55–66). In contrast, amino acid, carbohydrate, and lipid metabolism were enriched in the low-risk group, while glycan biosynthesis and metabolism were found to be enriched in the high-risk group. In summary, our study has shown differences in signaling pathway enrichment between CCA risk groups, which could be targeted to develop treatment strategies and improve prognosis in each CCA risk group.
Accumulating evidence has shown the interplay between tumor cells and other cell types in the TME, including a subset of immune cells and CAFs that play important roles in tumor progression and developing therapeutic resistance (67). CCA is a dysmorphic tumor with abundance CAFs and immunosuppressive cells in the TME (68). Therefore, we further investigated immune cell and CAF enrichment by comparing low-risk and high-risk groups. Tregs are an immune system component that suppressed anticancer immunity and are associated with poor prognoses in various cancers (68–71). Recent studies showed that FOXP3+, a Treg marker associated with poor prognosis in CCA patients (72, 73). Plasma cells were found to be a source of immunosuppressive factor interleukin (IL)-10 (74, 75). Moreover, CAFs are major TME components with tumorigenic properties, especially, in immunosuppressive TME modulation (76). This study found that levels of these immunosuppressive components, including Tregs, plasma cells, and CAFs were significantly higher in the high-risk group. Therefore, immunosuppressive components might be promising therapeutic targets to improve the efficacy of CCA treatment and patient survival.
Drug sensitivity prediction analysis was performed to overcome treatment resistance and improve CCA patient prognosis, particularly in the high-risk group. Our analysis predicted 10 effectives potentially candidate drugs for the high-risk CCA patient group. Paclitaxel, Imatinib, and Afatinib are US Food and Drug Administration (FDA)-approved drugs used in clinics to treat various cancers. A recent study showed that Paclitaxel could be a drug candidate for CCA patients resistant to conventional therapies (77). Our analysis supported Paclitaxel potentially having a better effect in treating CCA patients within the high-risk group. The ABL, KIT, and PDGFR inhibitor Imatinib was effective in treating gastrointestinal stromal tumor with KIT or PDGFR overexpression or mutation (78). The epidermal growth factor receptor (EGFR) and ERBB tyrosine kinase inhibitor Afatinib has been used as a first-line drug for non-small cell lung cancer patients with an EGFR mutation (79). However, relatively few studies have investigated the efficacy of these kinase inhibitors in CCA patients (80–82). Moreover, PLK1 inhibitors BI-2536 and GW843682X were predicted to be effective drugs for the high-risk group. Consistent with our results, previous studies have shown that PLK1 was associated with poor prognosis in CCA patients, and its inhibition was effective against CCA cells (83–85). NTRK1 fusion has been found in CCA patients (86) resulting in constitutive TRKA activation, and its inhibition showed positive responses in specific CCA patient groups (87). In this study, a selective TRKA inhibitor GW441756 was shown more effective in the high-risk group. In addition, selective c-Met inhibitor PHA-665752 and GSK3B inhibitors CHIR-99021 and SB-216763 were shown to be more effective in the high-risk group. Both c-MET and GSK3B were associated with poor prognosis, and targeting c-MET or GSK3B has been reported to be potentially effective in treating CCA patients (88–93). Altogether, based on risk stratification groups, our study predicted effective candidate drugs for treating CCA patients, which could be used in precision therapy to improve their prognosis.
Immunotherapy has been proposed as a potential therapeutic option for CCA (94, 95). However, the outcomes of anti-PD-1/PD-L1 immune checkpoint inhibitors (ICIs) remain controversial in CCA. In this study, PD-1 (PDCD-1) and PD-L1 (CD274) expression levels did not differ between low-risk and high-risk groups. Interestingly, other immune checkpoint markers, including CD47, HHLA2, and TNFRSF14 showed significantly higher expression in the high-risk group. Therefore, these immune checkpoints might be potential targets for developing ICIs to reactivate antitumor immunity which might improve the survival of patients with poor prognoses.
Previous studies have analyzed FRG signatures in several cancers. However, most have analyzed FRG signatures and classified patients into low-risk and high-risk groups that did not reflect relative ferroptosis levels (96–98). Therefore, this study calculated risk scores based on the expression levels of a six-FRG signature in each CCA cell line and could divide them into low-risk and high-risk groups. Using two representative CCA cell lines of the low-risk and high-risk groups, our study showed that low-risk score CCA cell lines were significantly more sensitive to ferroptosis inducers than high-risk score CCA cell lines. This result suggests that ferroptosis resistance might explain the relationship between the high-risk group and poor prognosis. Consistent with our findings, a previous study showed that activating ferroptosis suppressor genes enabled CCA cells to evade ferroptosis (99). Therefore, inhibiting ferroptosis suppressor genes and targeting ferroptosis resistance mechanisms might be effective therapeutic strategies for improving prognosis, particularly in the high-risk group. Besides ferroptosis resistance mechanisms, other factors, such as CCA stage, might contribute to differences in ferroptosis inducer sensitivity in the two CCA cell line groups. Unfortunately, information on the stages of CCA cell lines is only available for the high-risk group (i.e., RMCCA-1: T2N0M0; KKU-214: stage IVB)
However, our study had some limitation. First, the data used in this study were collected from public databases. Consequently, they differed appreciably in their CCA patient numbers, patient heterogeneity, ethnicity, and etiology. Second, the FRGs were identified from FerrDb and previous studies. However, the role of ferroptosis in cancers is still in its infancy. Therefore, some unidentified FRGs might be missing from our analyses. Finally, further in vitro and in vivo studies are needed to investigate the roles of these prognostic genes in ferroptosis and their underlying mechanisms in CCA.
In summary, our study showed that a six-FRG signature scoring model could divide CCA patients into low-risk and high-risk groups. Our novel FRG signature model effective predicted the prognosis of CCA patients, potentially providing prognostic biomarkers and potential therapeutic targets for CCA patients. Moreover, oncogenic signaling pathways, immune cell and CAF infiltration, drug sensitivity, and immune checkpoint marker expression differed between two CCA risk groups, which might represent novel therapeutic targets for improving survival, particularly of patients with poor prognoses. In addition, we predicted drug candidates for CCA patients in the high-risk group. Based on ferroptosis sensitivity in low-risk and high-risk CCA cell lines, our results suggest that ferroptosis resistance is associated with the high-risk group and targeting ferroptosis resistance mechanisms in this group could be a promising therapeutic strategy for these CCA patients.
The datasets presented in this study can be found in online repositories. The names of the repository/repositories and accession number(s) can be found in the article/Supplementary Material.
AS-F collected data, performed all in vitro experiments, analyzed statistics and bioinformatics, organized the figures and drafted the manuscript under the supervision of SJ. AM served as the mentor of SJ for the Research Grant for New Scholars and participated in the editing of this manuscript. SJ conceived and designed the study; analyzed and interpreted the data; participated in the writing and editing of this manuscript. All authors contributed to the article and approved the submitted version.
This research is funded by Thailand Science Research and Innovation Fund Chulalongkorn University (HEA663700097) The “Research Grant for New Scholar CU Researcher’s Project” (RGN_2559_044_01_37), Ratchadaphiseksomphot Endowment Fund, Chulalongkorn University; National Research Council of Thailand (NRCT)
AS-F received the Royal Golden Jubilee Ph.D. Programme Scholarship from National Research Council of Thailand (NRCT) (NRCT5-RGJ63001-026)
The authors declare that the research was conducted in the absence of any commercial or financial relationships that could be construed as a potential conflict of interest.
All claims expressed in this article are solely those of the authors and do not necessarily represent those of their affiliated organizations, or those of the publisher, the editors and the reviewers. Any product that may be evaluated in this article, or claim that may be made by its manufacturer, is not guaranteed or endorsed by the publisher.
The Supplementary Material for this article can be found online at: https://www.frontiersin.org/articles/10.3389/fimmu.2022.1051273/full#supplementary-material
CCA, Cholangiocarcinoma; DEGs, Differentially expressed genes; FRGs, Ferroptosis-related genes; LASSO, Least absolute shrinkage and selection operator; ROC, Receiver operating characteristic; AUC, Area under the curve; GSEA, Gene Set Enrichment Analysis; GO, Gene Ontology; KEGG, Kyoto Encyclopedia of Genes and Genomes; NES, Normalized enrichment score; FDR, False discovery rate; BP, Biological process; CC, Cellular component; MF, Molecular function; TME, Tumor microenvironment; CAFs, Cancer-associated fibroblasts; Tregs, Regulatory T cells; HPA, Human Protein Atlas; IC50, Half-maximal inhibitory concentration.
1. Banales JM, Marin JJG, Lamarca A, Rodrigues PM, Khan SA, Roberts LR, et al. Cholangiocarcinoma 2020: The next horizon in mechanisms and management. Nat Rev Gastroenterol Hepatol (2020) 17(9):557–88. doi: 10.1038/s41575-020-0310-z
2. Parikh AA, Abdalla EK, Vauthey JN. Operative considerations in resection of hilar cholangiocarcinoma. HPB (Oxford) (2005) 7(4):254–8. doi: 10.1080/13651820500373093
3. Mazzaferro V, Gorgen A, Roayaie S, Droz Dit Busset M, Sapisochin G. Liver resection and transplantation for intrahepatic cholangiocarcinoma. J Hepatol (2020) 72(2):364–77. doi: 10.1016/j.jhep.2019.11.020
4. Okusaka T, Nakachi K, Fukutomi A, Mizuno N, Ohkawa S, Funakoshi A, et al. Gemcitabine alone or in combination with cisplatin in patients with biliary tract cancer: A comparative multicentre study in Japan. Br J Cancer (2010) 103(4):469–74. doi: 10.1038/sj.bjc.6605779
5. Valle J, Wasan H, Palmer DH, Cunningham D, Anthoney A, Maraveyas A, et al. Cisplatin plus gemcitabine versus gemcitabine for biliary tract cancer. N Engl J Med (2010) 362(14):1273–81. doi: 10.1056/NEJMoa0908721
6. Scott AJ, Sharman R, Shroff RT. Precision medicine in biliary tract cancer. J Clin Oncol (2022) 40(24):2716–34. doi: 10.1200/JCO.21.02576
7. Jiang X, Stockwell BR, Conrad M. Ferroptosis: Mechanisms, biology and role in disease. Nat Rev Mol Cell Biol (2021) 22(4):266–82. doi: 10.1038/s41580-020-00324-8
8. Stockwell BR. Ferroptosis turns 10: Emerging mechanisms, physiological functions, and therapeutic applications. Cell (2022) 185(14):2401–21. doi: 10.1016/j.cell.2022.06.003
9. Dixon Scott J, Lemberg Kathryn M, Lamprecht Michael R, Skouta R, Zaitsev Eleina M, Gleason Caroline E, et al. Ferroptosis: An iron-dependent form of nonapoptotic cell death. Cell (2012) 149(5):1060–72. doi: 10.1016/j.cell.2012.03.042
10. Dixon SJ, Patel DN, Welsch M, Skouta R, Lee ED, Hayano M, et al. Pharmacological inhibition of cystine–glutamate exchange induces endoplasmic reticulum stress and ferroptosis. eLife (2014) 3:e02523. doi: 10.7554/eLife.02523
11. Yang WS, SriRamaratnam R, Welsch ME, Shimada K, Skouta R, Viswanathan VS, et al. Regulation of ferroptotic cancer cell death by Gpx4. Cell (2014) 156(1-2):317–31. doi: 10.1016/j.cell.2013.12.010
12. Lu B, Chen XB, Ying MD, He QJ, Cao J, Yang B. The role of ferroptosis in cancer development and treatment response. Front Pharmacol (2017) 8:992. doi: 10.3389/fphar.2017.00992
13. Dong L, Lu D, Chen R, Lin Y, Zhu H, Zhang Z, et al. Proteogenomic characterization identifies clinically relevant subgroups of intrahepatic cholangiocarcinoma. Cancer Cell (2022) 40(1):70–87 e15. doi: 10.1016/j.ccell.2021.12.006
14. Jusakul A, Cutcutache I, Yong CH, Lim JQ, Huang MN, Padmanabhan N, et al. Whole-genome and epigenomic landscapes of etiologically distinct subtypes of cholangiocarcinoma. Cancer Discovery (2017) 7(10):1116–35. doi: 10.1158/2159-8290.CD-17-0368
15. Hassannia B, Vandenabeele P, Vanden Berghe T. Targeting ferroptosis to iron out cancer. Cancer Cell (2019) 35(6):830–49. doi: 10.1016/j.ccell.2019.04.002
16. Stockwell BR, Friedmann Angeli JP, Bayir H, Bush AI, Conrad M, Dixon SJ, et al. Ferroptosis: A regulated cell death nexus linking metabolism, redox biology, and disease. Cell (2017) 171(2):273–85. doi: 10.1016/j.cell.2017.09.021
17. Zhou N, Bao J. Ferrdb: A manually curated resource for regulators and markers of ferroptosis and ferroptosis-disease associations. Database (Oxford) (2020) 2020:baaa021. doi: 10.1093/database/baaa021
18. Szklarczyk D, Franceschini A, Kuhn M, Simonovic M, Roth A, Minguez P, et al. The string database in 2011: Functional interaction networks of proteins, globally integrated and scored. Nucleic Acids Res (2011) 39(Database issue):D561–8. doi: 10.1093/nar/gkq973
19. Newman AM, Steen CB, Liu CL, Gentles AJ, Chaudhuri AA, Scherer F, et al. Determining cell type abundance and expression from bulk tissues with digital cytometry. Nat Biotechnol (2019) 37(7):773–82. doi: 10.1038/s41587-019-0114-2
20. Becht E, Giraldo NA, Lacroix L, Buttard B, Elarouci N, Petitprez F, et al. Estimating the population abundance of tissue-infiltrating immune and stromal cell populations using gene expression. Genome Biol (2016) 17(1):218. doi: 10.1186/s13059-016-1070-5
21. Racle J, Gfeller D. Epic: A tool to estimate the proportions of different cell types from bulk gene expression data. In: Boegel S, editor. Bioinformatics for cancer immunotherapy. methods in molecular biology. New York, NY: Humana (2020). p. 233–48.
22. Geeleher P, Cox N, Huang RS. Prrophetic: An r package for prediction of clinical chemotherapeutic response from tumor gene expression levels. PloS One (2014) 9(9):e107468. doi: 10.1371/journal.pone.0107468
23. Sirisinha S, Tengchaisri T, Boonpucknavig S, Prempracha N, Ratanarapee S, Pausawasdi A. Establishment and characterization of a cholangiocarcinoma cell line from a Thai patient with intrahepatic bile duct cancer. Asian Pac J Allergy Immunol (1991) 9(2):153–7.
24. Rattanasinganchan P, Leelawat K, Treepongkaruna SA, Tocharoentanaphol C, Subwongcharoen S, Suthiphongchai T, et al. Establishment and characterization of a cholangiocarcinoma cell line (Rmcca-1) from a Thai patient. World J Gastroenterol (2006) 12(40):6500–6. doi: 10.3748/wjg.v12.i40.6500
25. Uhlen M, Fagerberg L, Hallstrom BM, Lindskog C, Oksvold P, Mardinoglu A, et al. Proteomics. tissue-based map of the human proteome. Science (2015) 347(6220):1260419. doi: 10.1126/science.1260419
26. Raggi C, Gammella E, Correnti M, Buratti P, Forti E, Andersen JB, et al. Dysregulation of iron metabolism in cholangiocarcinoma stem-like cells. Sci Rep (2017) 7(1):17667. doi: 10.1038/s41598-017-17804-1
27. Funauchi Y, Tanikawa C, Yi Lo PH, Mori J, Daigo Y, Takano A, et al. Regulation of iron homeostasis by the P53-iscu pathway. Sci Rep (2015) 5(1):16497. doi: 10.1038/srep16497
28. Yao F, Cui X, Zhang Y, Bei Z, Wang H, Zhao D, et al. Iron regulatory protein 1 promotes ferroptosis by sustaining cellular iron homeostasis in melanoma. Oncol Lett (2021) 22(3):657. doi: 10.3892/ol.2021.12918
29. Zhang K, Wu L, Zhang P, Luo M, Du J, Gao T, et al. Mir-9 regulates ferroptosis by targeting glutamic-oxaloacetic transaminase Got1 in melanoma. Mol Carcinog (2018) 57(11):1566–76. doi: 10.1002/mc.22878
30. Song X, Xie Y, Kang R, Hou W, Sun X, Epperly MW, et al. Fancd2 protects against bone marrow injury from ferroptosis. Biochem Biophys Res Commun (2016) 480(3):443–9. doi: 10.1016/j.bbrc.2016.10.068
31. Zhu J, Kong W, Xie Z. Expression and prognostic characteristics of ferroptosis-related genes in colon cancer. Int J Mol Sci (2021) 22(11):5625. doi: 10.3390/ijms22115652
32. Miao H, Ren Q, Li H, Zeng M, Chen D, Xu C, et al. Comprehensive analysis of the autophagy-dependent ferroptosis-related gene Fancd2 in lung adenocarcinoma. BMC Cancer (2022) 22(1):225. doi: 10.1186/s12885-022-09314-9
33. Wu G, Wang Q, Xu Y, Li Q, Cheng L. A new survival model based on ferroptosis-related genes for prognostic prediction in clear cell renal cell carcinoma. Aging (Albany N Y) (2020) 12(14):14933–48. doi: 10.18632/aging.103553
34. Liu HJ, Hu HM, Li GZ, Zhang Y, Wu F, Liu X, et al. Ferroptosis-related gene signature predicts glioma cell death and glioma patient progression. Front Cell Dev Biol (2020) 8:538. doi: 10.3389/fcell.2020.00538
35. Saindane M, Rallabandi HR, Park KS, Heil A, Nam SE, Yoo YB, et al. Prognostic significance of prostaglandin-endoperoxide synthase-2 expressions in human breast carcinoma: A multiomic approach. Cancer Inform (2020) 19:1176935120969696. doi: 10.1177/1176935120969696
36. Dannenberg AJ, Lippman SM, Mann JR, Subbaramaiah K, DuBois RN. Cyclooxygenase-2 and epidermal growth factor receptor: Pharmacologic targets for chemoprevention. J Clin Oncol (2005) 23(2):254–66. doi: 10.1200/JCO.2005.09.112
37. Hashemi Goradel N, Najafi M, Salehi E, Farhood B, Mortezaee K. Cyclooxygenase-2 in cancer: A review. J Cell Physiol (2019) 234(5):5683–99. doi: 10.1002/jcp.27411
38. Sirica AE. Cholangiocarcinoma: Molecular targeting strategies for chemoprevention and therapy. Hepatology (2005) 41(1):5–15. doi: 10.1002/hep.20537
39. Han C, Wu T. Cyclooxygenase-2-Derived prostaglandin E2 promotes human cholangiocarcinoma cell growth and invasion through Ep1 receptor-mediated activation of the epidermal growth factor receptor and akt. J Biol Chem (2015) 290(29):17806. doi: 10.1074/jbc.A115.500562
40. Aishima S, Mano Y, Tanaka Y, Kubo Y, Shirabe K, Maehara Y, et al. Different roles of inducible nitric oxide synthase and cyclooxygenase-2 in carcinogenesis and metastasis of intrahepatic cholangiocarcinoma. Hum Pathol (2013) 44(6):1031–7. doi: 10.1016/j.humpath.2012.09.004
41. Wu T. Cyclooxygenase-2 and prostaglandin signaling in cholangiocarcinoma. Biochim Biophys Acta (2005) 1755(2):135–50. doi: 10.1016/j.bbcan.2005.04.002
42. Chan DA, Sutphin PD, Nguyen P, Turcotte S, Lai EW, Banh A, et al. Targeting Glut1 and the warburg effect in renal cell carcinoma by chemical synthetic lethality. Sci Transl Med (2011) 3(94):94ra70. doi: 10.1126/scitranslmed.3002394
43. Min KW, Kim DH, Son BK, Moon KM, Kim SM, Intazur Rahaman M, et al. High Slc2a1 expression associated with suppressing Cd8 T cells and b cells promoted cancer survival in gastric cancer. PloS One (2021) 16(3):e0245075. doi: 10.1371/journal.pone.0245075
44. Wang X, He H, Rui W, Zhang N, Zhu Y, Xie X. Trim38 triggers the uniquitination and degradation of glucose transporter type 1 (Glut1) to restrict tumor progression in bladder cancer. J Transl Med (2021) 19(1):508. doi: 10.1186/s12967-021-03173-x
45. Ooi AT, Gower AC, Zhang KX, Vick JL, Hong L, Nagao B, et al. Molecular profiling of premalignant lesions in lung squamous cell carcinomas identifies mechanisms involved in stepwise carcinogenesis. Cancer Prev Res (Phila) (2014) 7(5):487–95. doi: 10.1158/1940-6207.CAPR-13-0372
46. Zhang ZJ, Huang YP, Li XX, Liu ZT, Liu K, Deng XF, et al. A novel ferroptosis-related 4-gene prognostic signature for cholangiocarcinoma and photodynamic therapy. Front Oncol (2021) 11:747445. doi: 10.3389/fonc.2021.747445
47. Tiemin P, Peng X, Qingfu L, Yan W, Junlin X, Zhefeng H, et al. Dysregulation of the mir-148a-Glut1 axis promotes the progression and chemoresistance of human intrahepatic cholangiocarcinoma. Oncogenesis (2020) 9(2):19. doi: 10.1038/s41389-020-0207-2
48. Garcia-Bermudez J, Baudrier L, Bayraktar EC, Shen Y, La K, Guarecuco R, et al. Squalene accumulation in cholesterol auxotrophic lymphomas prevents oxidative cell death. Nature (2019) 567(7746):118–22. doi: 10.1038/s41586-019-0945-5
49. Tang W, Xu F, Zhao M, Zhang S. Ferroptosis regulators, especially sqle, play an important role in prognosis, progression and immune environment of breast cancer. BMC Cancer (2021) 21(1):1160. doi: 10.1186/s12885-021-08892-4
50. Xu F, Zhang Z, Zhao Y, Zhou Y, Pei H, Bai L. Bioinformatic mining and validation of the effects of ferroptosis regulators on the prognosis and progression of pancreatic adenocarcinoma. Gene (2021) 795:145804. doi: 10.1016/j.gene.2021.145804
51. Yan Y, Cai J, Huang Z, Cao X, Tang P, Wang Z, et al. A novel ferroptosis-related prognostic signature reveals macrophage infiltration and emt status in bladder cancer. Front Cell Dev Biol (2021) 9:712230. doi: 10.3389/fcell.2021.712230
52. Alborzinia H, Ignashkova TI, Dejure FR, Gendarme M, Theobald J, Wölfl S, et al. Golgi stress mediates redox imbalance and ferroptosis in human cells. Commun Biol (2018) 1(1):210. doi: 10.1038/s42003-018-0212-6
53. Chen X, Kang R, Kroemer G, Tang D. Organelle-specific regulation of ferroptosis. Cell Death Differ (2021) 28(10):2843–56. doi: 10.1038/s41418-021-00859-z
54. Mbah NE, Lyssiotis CA. Metabolic regulation of ferroptosis in the tumor microenvironment. J Biol Chem (2022) 298(3):101617. doi: 10.1016/j.jbc.2022.101617
55. Yothaisong S, Dokduang H, Techasen A, Namwat N, Yongvanit P, Bhudhisawasdi V, et al. Increased activation of Pi3k/Akt signaling pathway is associated with cholangiocarcinoma metastasis and Pi3k/Mtor inhibition presents a possible therapeutic strategy. Tumour Biol (2013) 34(6):3637–48. doi: 10.1007/s13277-013-0945-2
56. Bunney TD, Katan M. Phosphoinositide signalling in cancer: Beyond Pi3k and pten. Nat Rev Cancer (2010) 10(5):342–52. doi: 10.1038/nrc2842
57. Populo H, Lopes JM, Soares P. The mtor signalling pathway in human cancer. Int J Mol Sci (2012) 13(2):1886–918. doi: 10.3390/ijms13021886
58. Corti F, Nichetti F, Raimondi A, Niger M, Prinzi N, Torchio M, et al. Targeting the Pi3k/Akt/Mtor pathway in biliary tract cancers: A review of current evidences and future perspectives. Cancer Treat Rev (2019) 72:45–55. doi: 10.1016/j.ctrv.2018.11.001
59. Peng H, Zhang Q, Li J, Zhang N, Hua Y, Xu L, et al. Apatinib inhibits vegf signaling and promotes apoptosis in intrahepatic cholangiocarcinoma. Oncotarget (2016) 7(13):17220–9. doi: 10.18632/oncotarget.7948
60. Apte RS, Chen DS, Ferrara N. Vegf in signaling and disease: Beyond discovery and development. Cell (2019) 176(6):1248–64. doi: 10.1016/j.cell.2019.01.021
61. Sirica AE. Role of erbb family receptor tyrosine kinases in intrahepatic cholangiocarcinoma. World J Gastroenterol (2008) 14(46):7033–58. doi: 10.3748/wjg.14.7033
62. Hynes NE, MacDonald G. Erbb receptors and signaling pathways in cancer. Curr Opin Cell Biol (2009) 21(2):177–84. doi: 10.1016/j.ceb.2008.12.010
63. Boulter L, Guest RV, Kendall TJ, Wilson DH, Wojtacha D, Robson AJ, et al. Wnt signaling drives cholangiocarcinoma growth and can be pharmacologically inhibited. J Clin Invest (2015) 125(3):1269–85. doi: 10.1172/JCI76452
64. Zhan T, Rindtorff N, Boutros M. Wnt signaling in cancer. Oncogene (2017) 36(11):1461–73. doi: 10.1038/onc.2016.304
65. Chen C, Nelson LJ, Avila MA, Cubero FJ. Mitogen-activated protein kinases (Mapks) and cholangiocarcinoma: The missing link. Cells (2019) 8(10):1172. doi: 10.3390/cells8101172
66. Dhillon AS, Hagan S, Rath O, Kolch W. Map kinase signalling pathways in cancer. Oncogene (2007) 26(22):3279–90. doi: 10.1038/sj.onc.1210421
67. Lakshmi Narendra B, Eshvendar Reddy K, Shantikumar S, Ramakrishna S. Immune system: A double-edged sword in cancer. Inflammation Res (2013) 62(9):823–34. doi: 10.1007/s00011-013-0645-9
68. Zhou G, Sprengers D, Mancham S, Erkens R, Boor PPC, van Beek AA, et al. Reduction of immunosuppressive tumor microenvironment in cholangiocarcinoma by ex vivo targeting immune checkpoint molecules. J Hepatol (2019) 71(4):753–62. doi: 10.1016/j.jhep.2019.05.026
69. Wang H, Franco F, Ho PC. Metabolic regulation of tregs in cancer: Opportunities for immunotherapy. Trends Cancer (2017) 3(8):583–92. doi: 10.1016/j.trecan.2017.06.005
70. Nishikawa H, Sakaguchi S. Regulatory T cells in cancer immunotherapy. Curr Opin Immunol (2014) 27:1–7. doi: 10.1016/j.coi.2013.12.005
71. Nishikawa H, Sakaguchi S. Regulatory T cells in tumor immunity. Int J Cancer (2010) 127(4):759–67. doi: 10.1002/ijc.25429
72. Konishi D, Umeda Y, Yoshida K, Shigeyasu K, Yano S, Toji T, et al. Regulatory T cells induce a suppressive immune milieu and promote lymph node metastasis in intrahepatic cholangiocarcinoma. Br J Cancer (2022) 127:757–65. doi: 10.1038/s41416-022-01838-y
73. Lomphithak T, Akara-Amornthum P, Murakami K, Hashimoto M, Usubuchi H, Iwabuchi E, et al. Tumor necroptosis is correlated with a favorable immune cell signature and programmed death-ligand 1 expression in cholangiocarcinoma. Sci Rep (2021) 11(1):11743. doi: 10.1038/s41598-021-89977-9
74. Dang VD, Hilgenberg E, Ries S, Shen P, Fillatreau S. From the regulatory functions of b cells to the identification of cytokine-producing plasma cell subsets. Curr Opin Immunol (2014) 28:77–83. doi: 10.1016/j.coi.2014.02.009
75. Shalapour S, Font-Burgada J, Di Caro G, Zhong Z, Sanchez-Lopez E, Dhar D, et al. Immunosuppressive plasma cells impede T-Cell-Dependent immunogenic chemotherapy. Nature (2015) 521(7550):94–8. doi: 10.1038/nature14395
76. Monteran L, Erez N. The dark side of fibroblasts: Cancer-associated fibroblasts as mediators of immunosuppression in the tumor microenvironment. Front Immunol (2019) 10:1835. doi: 10.3389/fimmu.2019.01835
77. Massa A, Peraldo-Neia C, Vita F, Varamo C, Basirico M, Raggi C, et al. Paclitaxel restores sensitivity to chemotherapy in preclinical models of multidrug-resistant intrahepatic cholangiocarcinoma. Front Oncol (2022) 12:771418. doi: 10.3389/fonc.2022.771418
78. Cohen P, Cross D, Janne PA. Kinase drug discovery 20 years after imatinib: Progress and future directions. Nat Rev Drug Discovery (2021) 20(7):551–69. doi: 10.1038/s41573-021-00195-4
79. Planchard D, Popat S, Kerr K, Novello S, Smit EF, Faivre-Finn C, et al. Metastatic non-small cell lung cancer: Esmo clinical practice guidelines for diagnosis, treatment and follow-up. Ann Oncol (2018) 29:iv192–237. doi: 10.1093/annonc/mdy275
80. Boonsri B, Yacqub-Usman K, Thintharua P, Myint KZ, Sae-Lao T, Collier P, et al. Effect of combining egfr tyrosine kinase inhibitors and cytotoxic agents on cholangiocarcinoma cells. Cancer Res Treat (2021) 53(2):457–70. doi: 10.4143/crt.2020.585
81. Fingas CD, Mertens JC, Razumilava N, Bronk SF, Sirica AE, Gores GJ. Targeting pdgfr-beta in cholangiocarcinoma. Liver Int (2012) 32(3):400–9. doi: 10.1111/j.1478-3231.2011.02687.x
82. Cadamuro M, Brivio S, Mertens J, Vismara M, Moncsek A, Milani C, et al. Platelet-derived growth factor-d enables liver myofibroblasts to promote tumor lymphangiogenesis in cholangiocarcinoma. J Hepatol (2019) 70(4):700–9. doi: 10.1016/j.jhep.2018.12.004
83. Wang K, Zhang Y, Yang X, Chen T, Han T. Analysis of differentially expressed mrnas and the prognosis of cholangiocarcinoma based on tcga database. Transl Cancer Res (2020) 9(8):4739–49. doi: 10.21037/tcr-20-812
84. Lin P, Zhong XZ, Wang XD, Li JJ, Zhao RQ, He Y, et al. Survival analysis of genome-wide profiles coupled with connectivity map database mining to identify potential therapeutic targets for cholangiocarcinoma. Oncol Rep (2018) 40(6):3189–98. doi: 10.3892/or.2018.6710
85. Thrum S, Lorenz J, MÖSsner J, Wiedmann M. Polo-like kinase 1 inhibition as a new therapeutic modality in therapy of cholangiocarcinoma. Anticancer Res (2011) 31(10):3289.
86. Ross JS, Wang K, Gay L, Al-Rohil R, Rand JV, Jones DM, et al. New routes to targeted therapy of intrahepatic cholangiocarcinomas revealed by next-generation sequencing. Oncologist (2014) 19(3):235–42. doi: 10.1634/theoncologist.2013-0352
87. Drilon A, Siena S, Ou SI, Patel M, Ahn MJ, Lee J, et al. Safety and antitumor activity of the multitargeted pan-trk, Ros1, and alk inhibitor entrectinib: Combined results from two phase I trials (Alka-372-001 and startrk-1). Cancer Discovery (2017) 7(4):400–9. doi: 10.1158/2159-8290.CD-16-1237
88. Miyamoto M, Ojima H, Iwasaki M, Shimizu H, Kokubu A, Hiraoka N, et al. Prognostic significance of overexpression of c-met oncoprotein in cholangiocarcinoma. Br J Cancer (2011) 105(1):131–8. doi: 10.1038/bjc.2011.199
89. Pu XH, Yue S, Wu HY, Yang J, Fan XS, Fu Y, et al. C-met in intrahepatic cholangiocarcinoma: High-frequency amplification predicts protein expression and a unique molecular subtype. Pathol Res Pract (2020) 216(4):152857. doi: 10.1016/j.prp.2020.152857
90. Barat S, Bozko P, Chen X, Scholta T, Hanert F, Gotze J, et al. Targeting c-met by Ly2801653 for treatment of cholangiocarcinoma. Mol Carcinog (2016) 55(12):2037–50. doi: 10.1002/mc.22449
91. Wei K, Li M, Zoller M, Wang M, Mehrabi A, Hoffmann K. Targeting c-met by tivantinib through synergistic activation of Jnk/C-jun pathway in cholangiocarcinoma. Cell Death Dis (2019) 10(3):231. doi: 10.1038/s41419-019-1460-1
92. Kong J, Shen S, Zhang Z, Wang W. Identification of hub genes and pathways in cholangiocarcinoma by coexpression analysis. Cancer biomark (2020) 27(4):505–17. doi: 10.3233/CBM-190038
93. Li L, Xiang Y, Zeng Y, Xiao B, Yu W, Duan C, et al. Gsk3beta inhibition promotes doxorubicin-induced apoptosis in human cholangiocarcinoma cells Via Fak/Akt inhibition. Mol Med Rep (2020) 22(5):4432–41. doi: 10.3892/mmr.2020.11502
94. Rizvi S, Khan SA, Hallemeier CL, Kelley RK, Gores GJ. Cholangiocarcinoma - evolving concepts and therapeutic strategies. Nat Rev Clin Oncol (2018) 15(2):95–111. doi: 10.1038/nrclinonc.2017.157
95. Chai Y. Immunotherapy of biliary tract cancer. Tumour Biol (2016) 37(3):2817–21. doi: 10.1007/s13277-015-4743-x
96. Li H, Zhang X, Yi C, He Y, Chen X, Zhao W, et al. Ferroptosis-related gene signature predicts the prognosis in oral squamous cell carcinoma patients. BMC Cancer (2021) 21(1):835. doi: 10.1186/s12885-021-08478-0
97. Liu H, Gao L, Xie T, Li J, Zhai T-S, Xu Y. Identification and validation of a prognostic signature for prostate cancer based on ferroptosis-related genes. Front Oncol (2021) 11. doi: 10.3389/fonc.2021.623313
98. Wang Y, Xia H-B, Chen Z-M, Meng L, Xu AM. Identification of a ferroptosis-related gene signature predictive model in colon cancer. World J Surg Oncol (2021) 19(1):135. doi: 10.1186/s12957-021-02244-z
Keywords: ferroptosis, cholangiocarcinoma, gene signature, prognosis, risk score
Citation: Sae-fung A, Mutirangura A and Jitkaew S (2023) Identification and validation of a novel ferroptosis-related gene signature for prognosis and potential therapeutic target prediction in cholangiocarcinoma. Front. Immunol. 13:1051273. doi: 10.3389/fimmu.2022.1051273
Received: 22 September 2022; Accepted: 30 December 2022;
Published: 17 January 2023.
Edited by:
Jianzhong Ai, Sichuan University, ChinaReviewed by:
Astrid Johansen, Herlev Hospital, DenmarkCopyright © 2023 Sae-fung, Mutirangura and Jitkaew. This is an open-access article distributed under the terms of the Creative Commons Attribution License (CC BY). The use, distribution or reproduction in other forums is permitted, provided the original author(s) and the copyright owner(s) are credited and that the original publication in this journal is cited, in accordance with accepted academic practice. No use, distribution or reproduction is permitted which does not comply with these terms.
*Correspondence: Siriporn Jitkaew, U2lyaXBvcm4uamlAY2h1bGEuYWMudGg=
Disclaimer: All claims expressed in this article are solely those of the authors and do not necessarily represent those of their affiliated organizations, or those of the publisher, the editors and the reviewers. Any product that may be evaluated in this article or claim that may be made by its manufacturer is not guaranteed or endorsed by the publisher.
Research integrity at Frontiers
Learn more about the work of our research integrity team to safeguard the quality of each article we publish.