 Ali Ali
 Mohamed Salem
- Department of Animal and Avian Sciences, University of Maryland, College Park, MD, United States
Eukaryotic genomes encode long noncoding natural antisense transcripts (lncNATs) that have been increasingly recognized as regulatory members of gene expression. Recently, we identified a few antisense transcripts correlating in expression with immune-related genes. However, a systematic genome-wide analysis of lncNATs in rainbow trout is lacking. This study used 134 RNA-Seq datasets from five different projects to identify antisense transcripts. A total of 13,503 lncNATs were identified genome-wide. About 75% of lncNATs showed multiple exons compared to 36.5% of the intergenic lncRNAs. RNA-Seq datasets from resistant, control, and susceptible rainbow trout genetic lines with significant differences in survival rate following Flavobacterium psychrophilum (Fp) infection were analyzed to investigate the potential role of the lncNATs during infection. Twenty-four pairwise comparisons between the different genetic lines, infectious status, and time points revealed 581 differentially expressed (DE) lncNATs and 179 differentially used exons (DUEs). Most of the DE lncNATs strongly and positively correlated in expression with their corresponding sense transcripts across 24 RNA-Seq datasets. LncNATs complementary to genes related to immunity, muscle contraction, proteolysis, and iron/heme metabolism were DE following infection. LncNATs complementary to hemolysis-related genes were DE in the resistant fish compared to susceptible fish on day 5 post-infection, suggesting enhanced clearance of free hemoglobin (Hb) and heme and increased erythropoiesis. LncNATs complementary to hepcidin, a master negative regulator of the plasma iron concentration, were the most downregulated lncNATs on day 5 of bacterial infection in the resistant fish. Ninety-four DE lncNAT, including five complementary to hepcidin, are located within 26 QTL regions previously identified in association with bacterial cold water disease (BCWD) in rainbow trout. Collectively, lncNATs are involved in the molecular architecture of fish immunity and should be further investigated for potential applications in genomic selection and genetic manipulation in aquaculture.
Introduction
Rainbow trout is one of the most important fish, but genome annotation is still incomplete compared to the model species such as zebrafish (1). For aquaculture breeding, a well-annotated reference genome sequence is essential for genomic-based animal selection (2). The human ENCODE project showed that the major category of the active genome transcription comprises noncoding RNAs (3). Noncoding RNAs can be distinguished into long and small noncoding RNAs based on their sizes. About 40% of long noncoding RNAs (lncRNAs) belong to the category of antisense transcripts, making them a substantial category of the noncoding RNA pool (4). Natural antisense transcripts (NATs) originate from the genomic regions opposite to coding or noncoding genes or introns of coding genes (5). Antisense transcription was previously identified in prokaryotes and eukaryotes (6–9). Previous studies identified a considerable antisense transcription from eukaryotic genomes of Arabidopsis (7.4%) (10, 11), fruit fly (16.8%) (12), zebrafish (49.3%) (13), mouse (72%) (14), and human (~61-72%) (14, 15).
Antisense transcripts regulate the function of the complementary protein-coding loci in cis-regulatory mechanisms (16, 17). Although antisense transcripts may also work in trans (4), cis-mechanisms are predominant because of NAT’s physical proximity to the overlapping loci (4, 18, 19). Antisense transcripts can either activate or repress the function of the sense protein-coding genes via a wide range of mechanisms (20). At the transcriptional level, antisense transcripts can induce promoter methylation (21, 22), interfere with the transcriptional machinery (23, 24), or recruit histone-modifying enzymes (25, 26). At the post-transcriptional level, antisense transcripts can regulate the splicing of sense protein-coding genes (27, 28) or interact with the sense mRNA and mask the miRNA binding sites to increase the mRNA stability (29). Furthermore, at the translational level, antisense transcripts can enhance mRNA translation by recruiting additional factors or degrade mRNA by creating endogenous siRNA (4, 30–32).
Recent evidence suggests that antisense transcripts have specific immune gene regulatory functions (33). For example, the expression of the C-C motif chemokine receptors 2, 3, and 5 and trafficking of Th2 cells to the lung are regulated by the antisense lincR-Ccr2-5’AS (34). Additionally, the antisense interleukin 1α (AS-IL1α) and its partially overlapping IL-1α protein-coding gene showed a correlation in expression. Loss of function short hairpin RNA (shRNA) approaches revealed that AS-IL1α facilitates IL-1α gene transcription (20). Conversely, the overexpression of the antisense transcript of interleukin 1β (AS-IL1β) decreases the histone modification (H3K4me3) located at the IL-1β promoter leading to decreased occupancy of RNA polymerase II and diminished IL-1β transcription, accordingly (35). Thus, identifying and characterizing immune-relevant antisense transcripts in the rainbow trout genome may help understand several diseases at the molecular level.
Flavobacterium psychrophilum, the causal agent of bacterial cold water disease (BCWD), causes worldwide economic losses to salmonid aquaculture (36). Rainbow trout mortality from BCWD varied worldwide with the highest mortality rate reaching 90% (37, 38). There is no effective commercial vaccine available for BCWD, in addition to limited chemotherapeutics and antibiotic resistance, making it difficult to prevent disease progression (39, 40). Selective breeding programs have potential to improve heritable phenotypes through existing genetic variation among individual animals and families (41). A family-based selection program was initiated in 2005 at the National Center for Cool and Cold Water Aquaculture (NCCCWA) by developing three rainbow trout genetic lines of variable BCWD resistance (42, 43). Studying the host-pathogen interactions will help developing new treatment and prevention strategies. Previous transcriptome profiling studies revealed transcriptional variation among the three fish genetic lines (control (ARS-Fp-C), resistant (ARS-Fp-R), and susceptible (ARS-Fp-S)) following in vivo F. psychrophilum (CSF259-93) infection (44, 45). A few lncNATs overlapping and exhibiting expression correlation with immune genes were differentially expressed (DE) among PBS- and Fp-injected fish of different genetic lines (45), perhaps because only 1,136 antisense transcripts were annotated in the reference (46). Thus, comprehensive genome-wide identification of lncNATs in rainbow trout is warranted. The objectives of this study were to 1) identify and characterize lncNATs in the rainbow trout genome, and 2) investigate the functional potential of lncNATs in the three genetic lines of rainbow trout in response to Fp infection and identify the potential biomarkers of BCWD infection and disease resistance. The current study provides a comprehensive genome-wide analysis of rainbow trout lncNATs and provides a resource for future genetic and genomic studies.
Materials and methods
Identification of lncNATs across the rainbow trout genome
A total of 134 public strand-specific RNA-Seq datasets were downloaded from Sequence Read Archive in GenBank. The data quality was checked as in our previous publications (1, 3). Trimmomatic v0.36 (47) was used, using default parameters, to remove the adaptor sequences and trim sequencing reads, followed by FastQC v0.11.8 (48) quality control checks. Trimmed reads used for downstream analyses had a quality score of Q30 or higher. Reads were mapped to the Oncorhynchus mykiss reference genome (GCF_002163495.1_Omyk_1.0) and then assembled into transcripts using HISAT2 2.1.0 (49) and StringTie v1.3.3 (50, 51), respectively, using default parameters. The assembled transcripts were inputted to Evolinc-I v1.5.1 (52) to identify trout’s long noncoding RNAs. In brief, transcripts less than 200 NT in length, those with an open reading frame (ORF) larger than 100 amino acids, and transcripts showing similarity to protein-coding genes with an E-value less than 10-5 were filtered out. Further, the remaining transcripts were categorized based on the transfrag class codes into long intergenic RNAs (lincRNAs) (class code U), sense overlapping transcripts (class code O), and lncNATs (class codes X and S). Transcripts were checked for predicted protein-coding potential (CPC (v1.0) score > -1 and CPAT (v1.2.3) score more than 0.35) (53, 54) or similarity to protein-coding domains in Pfam (55). In addition, BlastN (56) was used to filter out transcripts that have any match with other RNA families. LncNATs were located on the newly released Swanson (GCA_025558465.1) and Arlee (GCF_013265735.2) genome sequences by using minimap2-2.17 (r941) (57). SAM files were converted to gff files using a python script.
Conservation analysis of lncNATs and lncNAT promoters
Genome FASTA sequences and GTF files of eight species (Caenorhabditis elegans (WBcel235 “GCA_000002985.3”), Drosophila melanogaster (BDGP6.32 “GCA_000001215.4”), Danio rerio (GRCz11 “GCA_000002035.4”), Salmo salar (Ssal_v3.1 “GCA_905237065.2”), Anolis carolinensis (AnoCar2.0v2 “GCA_000090745.2”), Gallus gallus (bGalGal1.mat.broiler.GRCg7b “GCA_016699485.1”), Rattus norvegicus (mRatBN7.2 “GCA_015227675.2”), and Mus musculus (GRCm39 “GCA_000001635.9”)) were downloaded from the Ensembl genome browser while rainbow trout genome (GCF_002163495.1_Omyk_1.0) and annotation file were downloaded from GenBank. Trout lncNATs and 500 NT upstream promoter sequences were used as inquiry sequences provided to FASTA36 (58). The latter was used to perform a series of BLASTn against the target sequences extracted from the Ensembl genomes of interest (E-value cutoff of 1E-20). The top blast hit with the lowest E-value and highest query coverage was identified for each genome and used for the downstream analysis.
Fish population
To provide insights into the lncNAT biological roles, we downloaded RNA-Seq datasets generated by Marancik et al. (44) from three rainbow trout genetic lines ARS-Fp-R, ARS-Fp-C, and ARS-Fp-S experienced artificial selection based on BCWD post-infection survival. The challenge experiment was performed in the NCCCWA challenge facility with CSF-259-93 strain, as previously reported by Marancik et al. (44). In brief, fifty rainbow trout free of viral and bacterial pathogens were selected randomly from each genetic line and allocated to four tanks (4 tanks x 3 genetic lines x 50 fish/tank = 600 fish total). The mean body weights of the control, resistant, and susceptible fish were 1.12 ± 0.03 g, 1.11 ± 0.05 g, and 0.98 ± 0.04 g, respectively. For each genetic line, two tanks had Fp-injected fish (4.2 × 10⁶ CFU fish-1 Fp suspended in 10 μl of chilled PBS) and two tanks had PBS-injected fish (10 μl of chilled PBS alone). Injections were performed intraperitoneally using a repeater pipette fitted with a 27G × 1/2 inch needle. Five fish were collected from each tank on days 1 and 5 post-injection for RNA extraction. Fish survival was monitored for 21 days following injection. Whole body bacterial load in a subset of fish from the three genetic lines was measured by qPCR and expressed in terms of Fp genome equivalents (GE).
RNA extraction, library preparation, and sequencing
RNA-Seq reads were downloaded from the Sequence Read Archive (accession number SRP047070). RNA extraction, library preparation, and sequencing were carried out as previously described by Marancik and coworkers (44). In brief, total RNA was extracted using TRIzol (Invitrogen, Carlsbad, CA) from whole fish with equal amounts pooled from five fish/tank at the two-time points (i.e., a total of 24 pools, n = 120 fish). Illumina’s TruSeq Stranded mRNA Sample Prep kit was used to prepare cDNA libraries following the manufacturer’s instructions. Three groups of eight indexed and barcoded libraries were sequenced in three lanes of an Illumina HiSeq 2000 (single-end sequencing, 100 bp read) at the University of Illinois at Urbana-Champaign.
Identification of DE lncNATs and DUEs among fish genetic lines and co-expression analysis
Sequencing reads from 24 RNA-Seq datasets were mapped to the lncNATs using the CLC genomics workbench 9.5 (59). Raw counts were provided to DESeq2 v1.36.0 (60) and edgeR v3.14.0 (61) to identify DE lncNATs using default parameters. The output of DESeq2 and edgeR was further filtered based on log2 fold change and corrected p-values. The lncNAT was considered a significant DE if it had a log2 fold change larger than or equal to |1| at a Padj value less than 0.05. Expression correlation between lncNATs and complementary protein-coding genes was performed using the ExpressionCorrelation plugin (Version 1.1.0) in Cytoscape (62). DUEs (log2 fold change ≥ |1| and FDR < 0.05) were identified using DEXSeq Version 1.28.1 as previously described (1).
Functional annotation of protein-coding genes opposite to lncNATs
For functional annotation, Gene Ontology (GO) terms were retrieved by uploading the complementary protein-coding gene sequences to lncNATs of interest to the eggNOG-mapper v2 (63, 64). GO terms were then uploaded to the CateGOrizer server (version 3.218) (65) to classify them in terms of the GO classes they belong to. In addition, a basic alignment search against the KEGG database through the KAAS-KEGG server Ver. 2.1 (66) was performed as previously described (67).
Computational prediction of lncNAT targets
For RNA : RNA interactions, DE lncNATs, and their complementary protein-coding genes were used as an input to a locally installed LncTar program (Version 1.0) (68). The protein-coding genes used for this analysis encompassed the coding region and 3’UTR. The normalized deltaG (ndG) cutoff was set at -0.10. The 3’UTR interacting with lncNATs were screened for microRNA binding sites by using miRanda available in the sRNAtoolbox server (69) and RNA22 v2 (70) as previously described (3).
Red blood cell count
Blood samples used in this study were obtained from the USDA/NCCCWA (Dr. Gregory D. Wiens). Blood was collected from non-infected fish produced from the resistant and susceptible genetic lines. Red blood cells were counted manually using the Neubauer hemocytometer as previously described (71).
Results and discussion
Genome-wide identification and characterization of lncNATs in rainbow trout
To identify lncNATs in rainbow trout, we downloaded 134 public strand-specific RNA-Seq datasets from five projects with the following accession numbers; SRP047070, SRP098572, SRP102416, SRP108797, and SRP131630. The RNA-Seq datasets were generated from 12 different tissues, fertilized eggs, and whole-body transcriptomes. For read mapping, we prioritized the Swanson genome because it has been widely used to identify genetic markers associated with complex traits, including disease resistance targeted in this study. The newest assembly of the Swanson line was released in 2022 but is not yet annotated by NCBI. So, the most recent annotated genome assembly available for the Swanson line (Omyk_1.0) (72) was used in this study. In addition, Vallejo et al. (73) mapped the recent and previous QTLs identified in association with BCWD, targeted in this study, to the latest annotated genome version of the Swanson line (Omyk_1.0). Thus, using the same reference genome (Omyk_1.0) in our study facilitated the accurate identification of DE lncNATs that overlap with previously identified BCWD QTL as reported in a subsequent section.
To obtain a comprehensive lncNAT reference, mapped reads from each dataset were assembled into transcripts. A total of 469,678 transcripts from 208,940 genomic loci were assembled from all datasets. We used Evolinc-I (52) to identify trout lncNATs according to the bioinformatics workflow shown in Figure 1 and as previously described (74). A total of 394,523 assembled transcripts were filtered out by Evolinc-I, yielding 57,375 potential lincRNAs (class code U), 3,755 sense overlapping transcripts (class code O), and 14,025 lncNATs (class codes X & S). Transcripts were checked for predicted protein-coding potential (CPC score > -1 and CPAT score > 0.35) or similarity to protein-coding domains in Pfam 32.0. In addition, Blastn was used to filter out transcripts with sequence matches to other RNA families such as tRNAs, rRNAs, and microRNA precursors. A total of 13,503 putative lncNATs passed all filters and were used for downstream analyses. Similar to the lncNATs, lincRNAs were subjected to a series of filtrations which yielded 56,527 potential lincRNAs to be used for comparative purposes with the lncNATs and mRNAs. Genomic coordinates of all lncNATs and lincRNAs are provided in Supplementary File 1. To compare the various genome assemblies, we mapped all the lncNATs identified in this study to the Arlee (Omyk_1.1) (75) and recent non-annotated Swanson (Omyk_2.0) genome sequences. Out of 13,503 transcripts, only 13 (0.09%) were not mapped to the Arlee genome. Also, when the lncNATs were mapped to the newly assembled non-annotated Swanson genome (Omyk_2.0), only 0.7% of the transcripts were not mappable. To facilitate future research, the genomic coordinates of lncNATs on the two recent Swanson (Omyk_2.0) and Arlee (Omyk_1.1) genomes were also provided in Supplementary File 1, which allows further investigation of lncNATs in future studies using the recent Arlee and Swanson genomes.
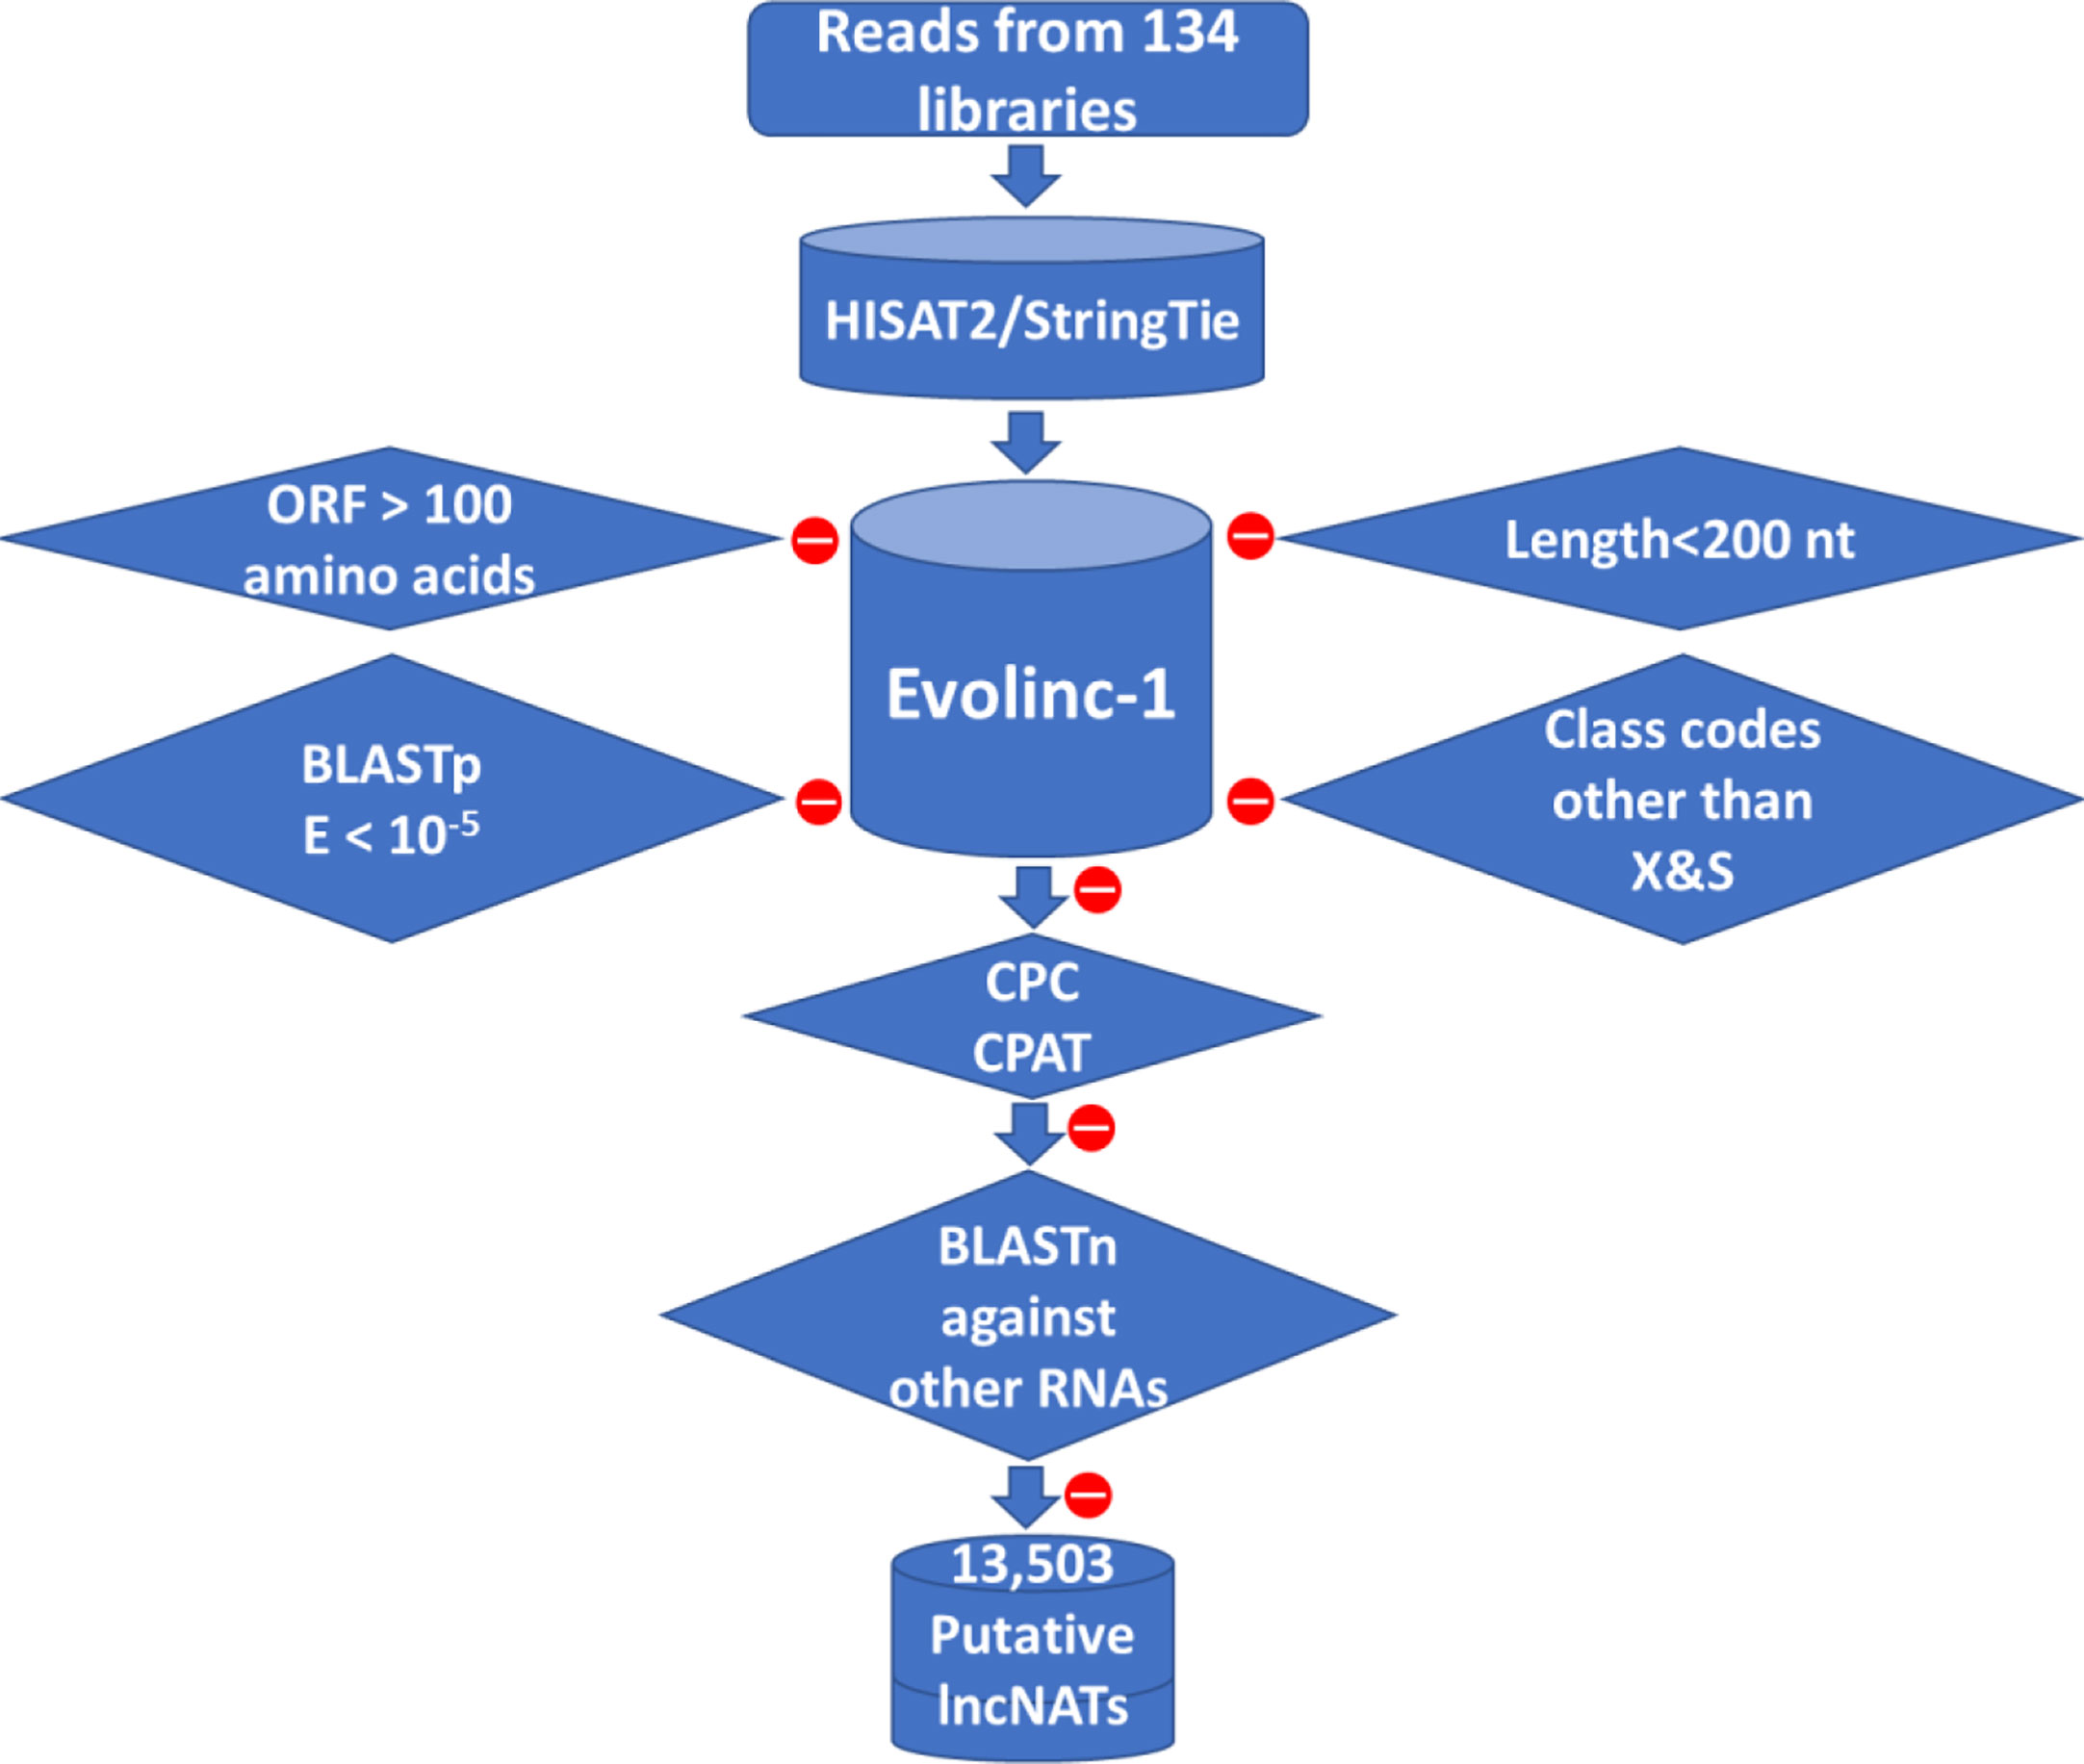
Figure 1 Bioinformatics pipeline used to predict lncNAT transcripts in rainbow trout. LncNATs were identified from 134 RNA-Seq datasets according to their length, coding potential, genomic location, and orientation relative to known genes. A total of 13,503 lncNAT transcripts were identified from all datasets. Filtration criteria applied to the assembled transcripts are represented in diamond shapes. Red circles mean transcripts were removed from the assembled pool of transcripts based on the shown filtration criterion.
To characterize the genomic features of lncNATs, the putative lncNATs were compared to lincRNAs and protein-coding genes. The average length of LncNATs (908.19 bp) was longer than that of lincRNAs transcripts (578.66 bp) but significantly shorter than protein-coding genes (3111.30 bp, Kolmogorov-Smirnov test (KS-test) p-value = 0) (Figure 2A). Previous studies showed that lincRNA transcripts are shorter than lncNATs and protein-coding transcripts (74, 76). However, the exon size of lncNATs showed a different pattern in this study. LncNATs and lincRNAs had almost the same exon size (median length 376.5 bp and 371.0 bp) longer than that of the protein-coding genes (median length 173.5 bp) (Figure 2B). Notably, 74.63% of lncNATs were multi-exonic compared to 36.53% and 74.71% of lincRNAs and protein-coding genes, respectively (Figure 2C). The average number of exons in lncNATs was 2.41 compared to 1.56 and 9.33 in lincRNAs and protein-coding mRNA transcripts, respectively. This may explain the long exon size of both lncNATs and lincRNAs relative to protein-coding genes. We speculate that the multiple short exons in the mRNA can facilitate the generation of multiple transcript isoforms from the same gene locus, maximizing the production of variant proteins. The GC content in trout lncNATs was lower than in coding sequences but higher than in lincRNAs (Figure 2D). The median size of the maximum ORF per lncNATs was 72 bp and 62 bp in lincRNAs, which was significantly shorter than that of mRNA (635 bp) (Figure 2E). CPAT Protein-coding potentials scores for lncNATs and lincRNAs averaged 0.02 compared to 0.97 in protein-coding genes (Figure 2F). The number of exons, GC content, the median size of ORF, and coding scores in all three types of transcripts showed a similar pattern to other species, suggesting evolutionarily conserved genome structures (13, 74, 76–80). A large fraction of the lncNATs (83.6%) had at least 50% of their sequence length overlapped with protein-coding genes. Of them, 36.6% were bi-exonic, and 25.4% were monoexonic. LncNAT genomic loci had a fewer number of transcript isoforms (1.4 per gene locus) than mRNA loci (1.7 per gene locus), suggesting less complexity of lncNATs compared to mRNAs as shown in other species (76) (Figure 2G). Trout lncNATs were unevenly distributed across the 29 chromosomes (Figure 2H). Chromosome 13 (NC_035089.1) had the largest number of lncNATs with the highest gene density (656 transcripts, 471 gene loci, 9.9 genes/Mb), whereas chromosome 23 (NC_035099.1) contained the least number and lowest density of lncNATs (135 transcripts, 119 gene loci, 2.8 genes/Mb). The chromosome size and lncNAT gene density were significantly correlated (R = 0.54, p-value = 0.003). About one-quarter of lncNATs (28.1%) showed a relatively high expression correlation with their cognate protein-coding genes across the 24 RNA-Seq datasets. Of note, 99.7% of the sense/antisense correlations were positive as consistently reported in other species (14, 81–85).
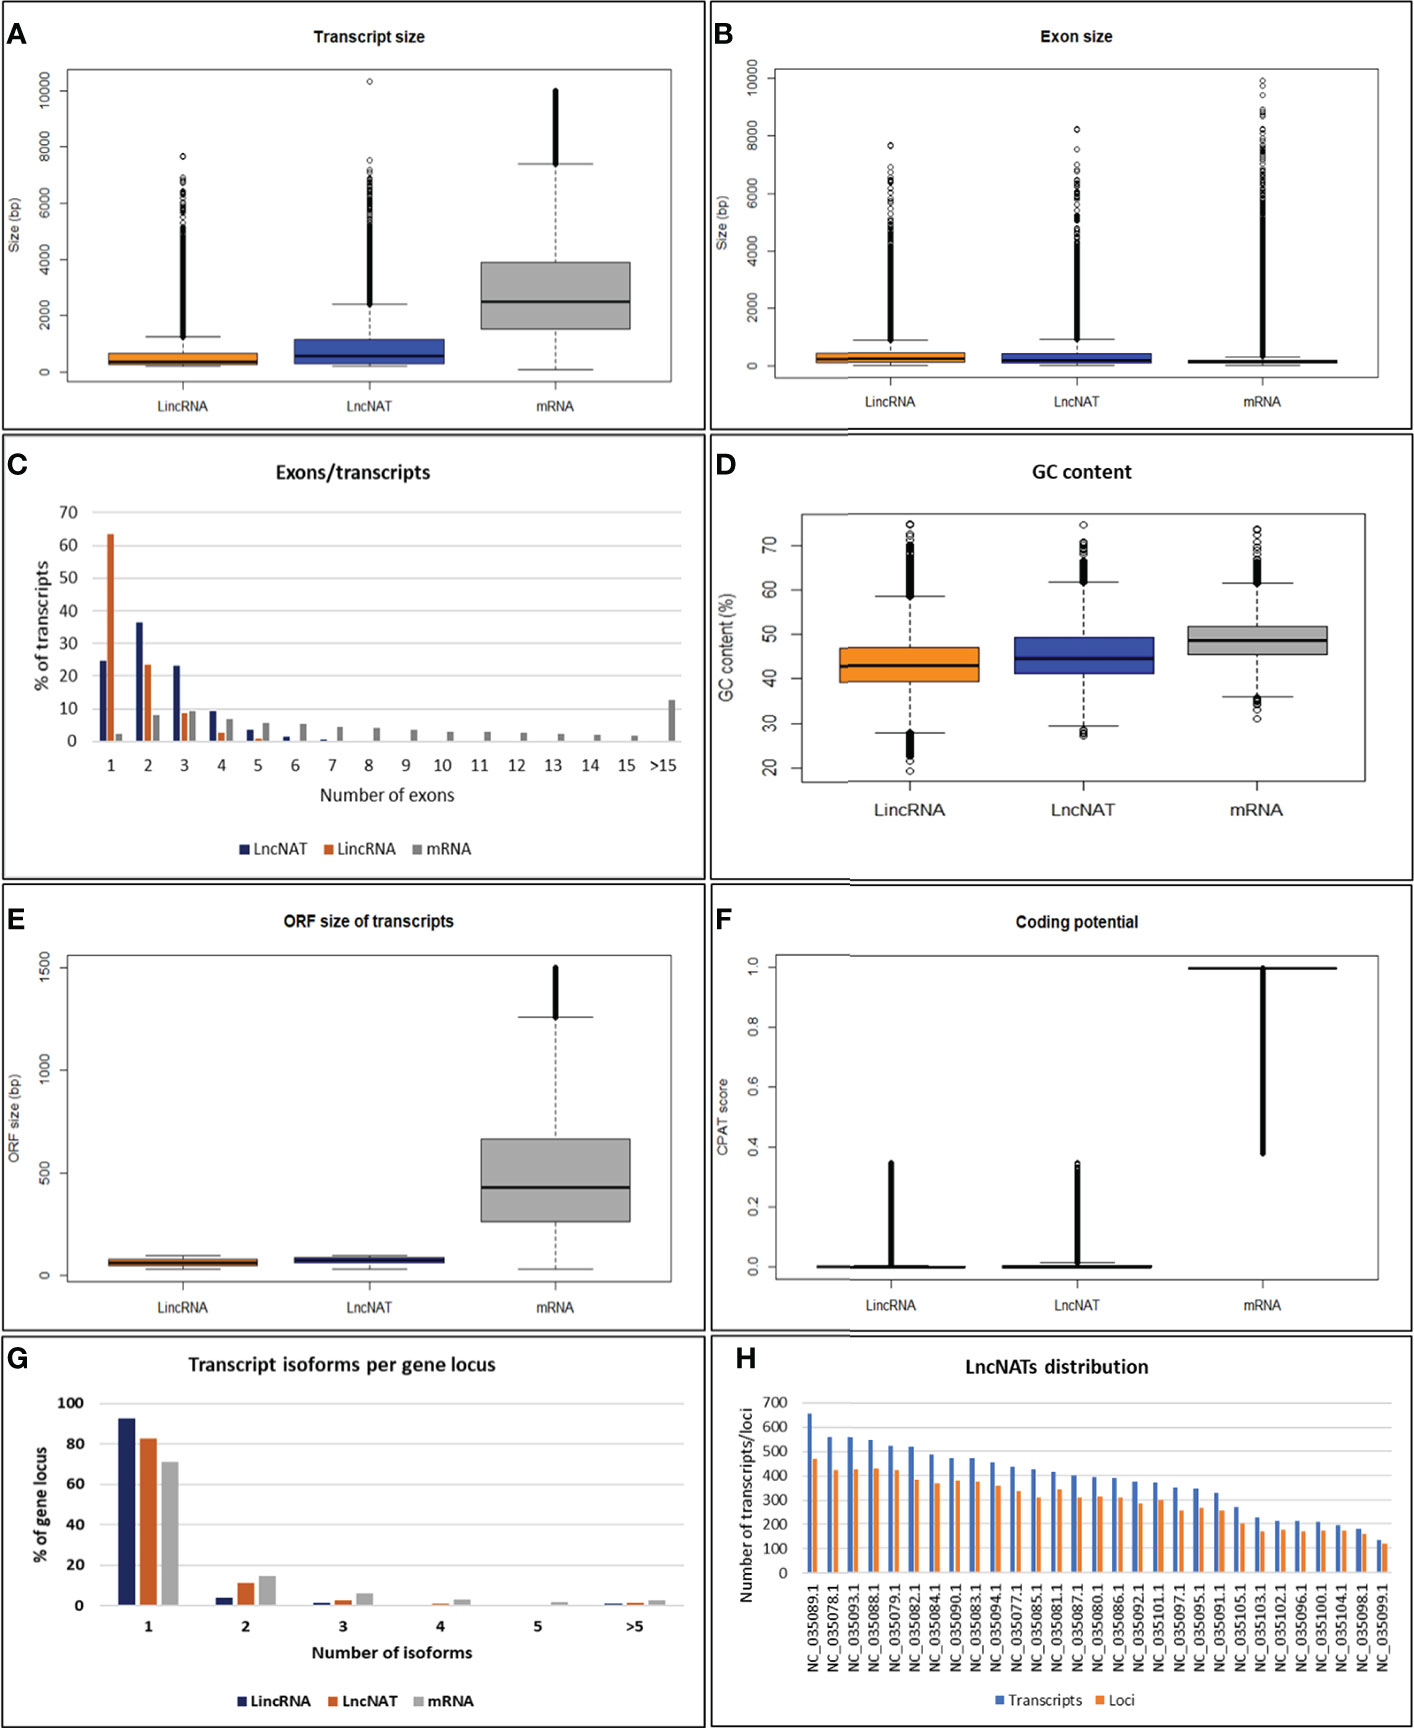
Figure 2 Genomic features of lncNATs compared to lincRNAs and mRNAs in rainbow trout. (A) The transcript size of lncNATs and lincRNAs is shorter than that of mRNAs. (B) The exon size of lncNATs and lincRNAs is longer than that of mRNAs. (C) LncNATs tend to have more exons than lincRNAs. (D) LncNATs have lower GC content than coding sequences but higher than lincRNAs. (E, F) LncNATs and lincRNAs have shorter ORF and lower coding scores than mRNAs. (G) LncNATs have fewer transcript isoforms per locus than coding sequences but more than lincRNAs. (H) Genomic distribution of lncNATs.
Since sequence conservation may imply functionality (86), we sought to identify the conserved lncNATs. For this purpose, we searched for conserved transcripts across eight species (Caenorhabditis elegans, Drosophila melanogaster, Danio rerio, Salmo salar, Anolis carolinensis, Gallus gallus, Rattus norvegicus, and Mus musculus). The lncNATs showed a low level of sequence conservation in seven species. Almost 81% of lncNATs were conserved in Salmo salar, explained by the phylogenetic relationship with rainbow trout, followed by about 31.4.8% in Danio rerio. LncNATs showed less conservation in Anolis carolinensis, Gallus gallus, Rattus norvegicus, and Mus musculus than fish species. LncNATs had the lowest level of conservation with the distantly-related species; Caenorhabditis elegans (3.1%) and Drosophila melanogaster (5.7%) (Figure 3A). We identified 301 ultraconserved elements across all eight species and 1,943 lncNATs among the six vertebrate species (Danio rerio, Salmo salar, Anolis carolinensis, Gallus gallus, Rattus norvegicus, and Mus musculus). Analysis of lncNAT promoters revealed a lower level of conservation than lncNATs (p-value = 0.006) across the eight species (Figure 3B). In agreement with our findings, about 14%, 3.56%, 0.5%, and 39% of antisense noncoding transcripts exhibited limited conservation among closely related bacteria, insects, plants, and mammals, respectively (74, 87–89). In bacteria, antisense transcript promoters did not show evidence of sequence conservation (87). Although sequence conservation implies functionality (86), a lack of conservation does not imply a loss of functionality (86). Therefore, more effort is needed to investigate the function of lncNATs, especially the conserved ones, under different biological conditions.
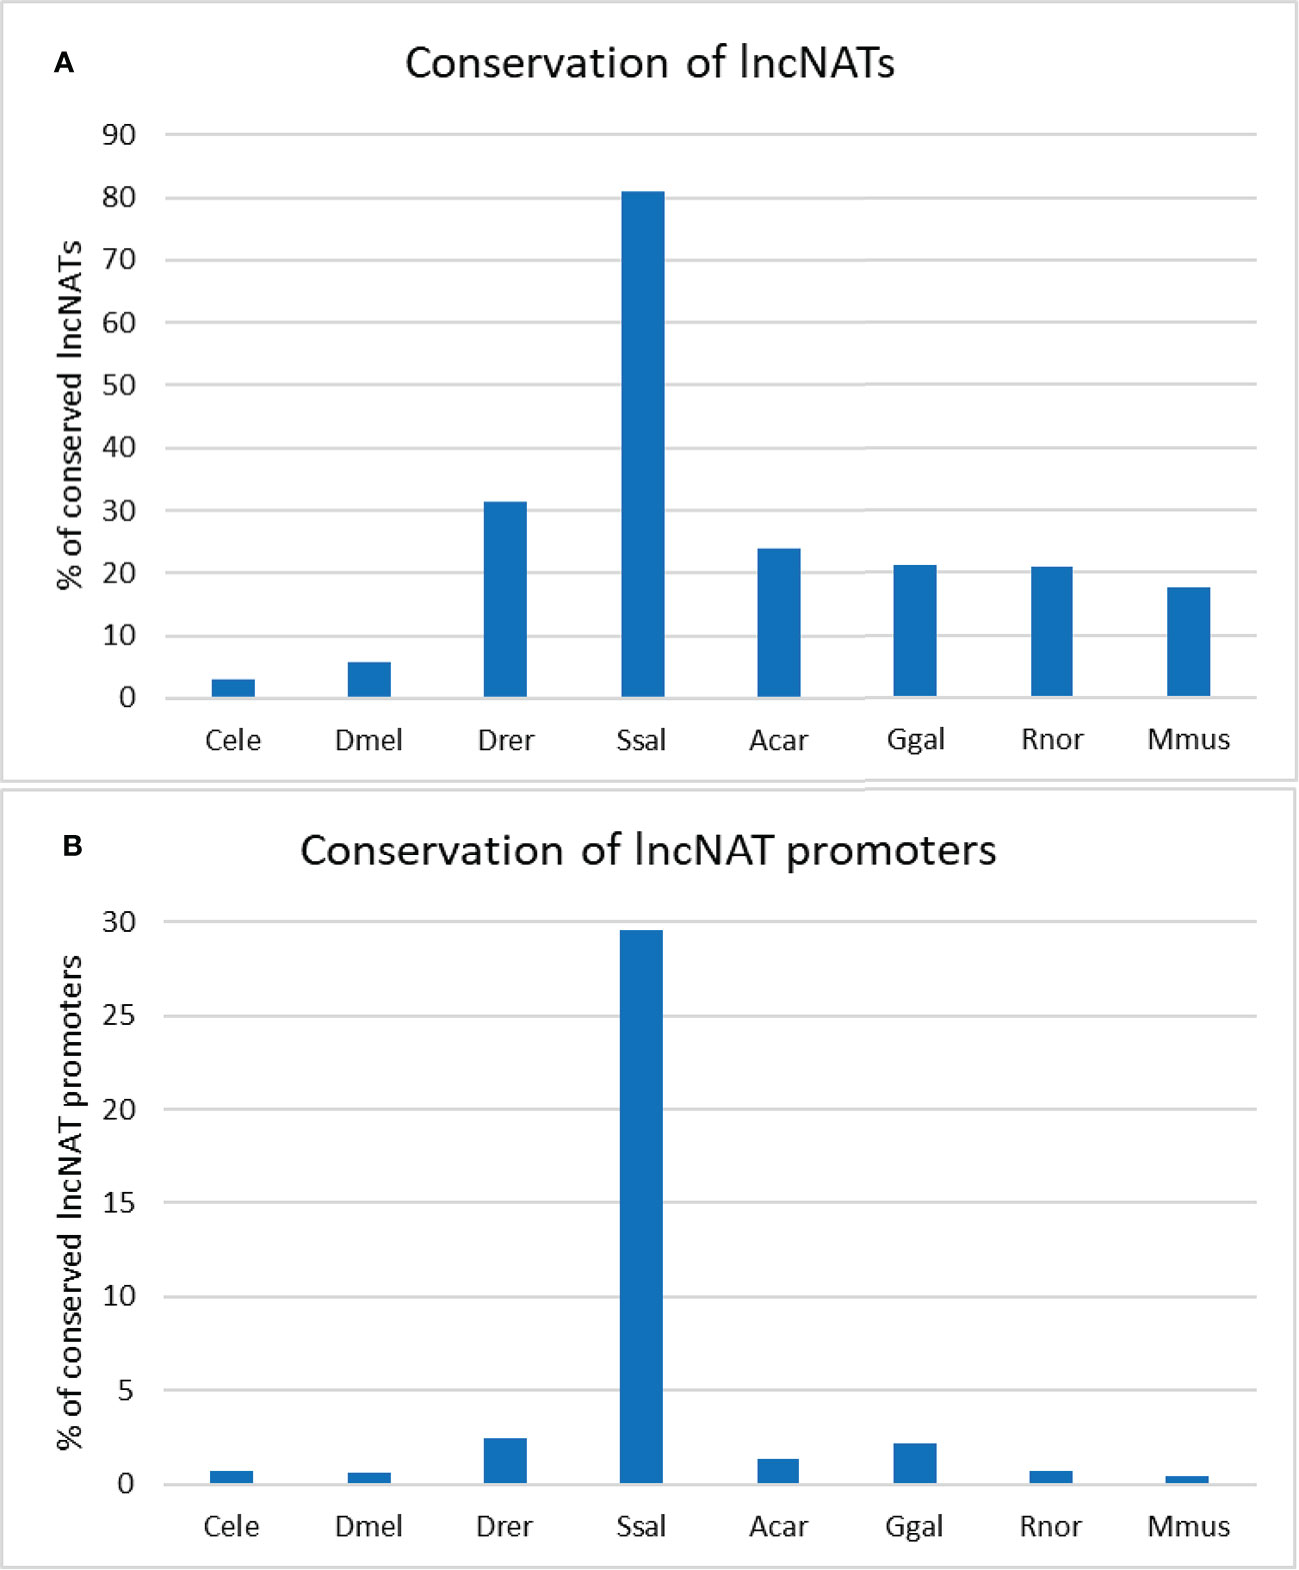
Figure 3 Percentage of conserved rainbow trout’s lncNATs and their promoters across closely- and distantly-related species. Trout’s lncNATs (A) and their promoters (B) are more conserved in Atlantic salmon and zebrafish. Each species is represented on the X-axis by the first letter of the genus name and the first three letters of the species name; (Caenorhabditis elegans “Cele”, Drosophila melanogaster “Dmel”, Danio rerio “Drer”, Salmo salar “Ssal”, Anolis carolinensis “Acar”, Gallus gallus “Ggal”, Rattus norvegicus “Rnor”, and Mus musculus “Mmus”).
Global lncNATs expression in BCWD-resistant, -susceptible, and -control genetic lines of rainbow trout
The second objective of this study was to identify lncNATs associated with genetic resistance against BCWD and identify immune-related genes associated with lncNATs expression. For this purpose, we utilized sequencing data generated from three genetic lines (resistant (ARS-Fp-R), susceptible (ARS-Fp-S), and control (ARS-Fp-C)), generated by the NCCCWA following F. psychrophilum (CSF259-93) infection. mRNA and lncRNA expressions were previously analyzed in the three genetic lines after 1 and 5 days of the Fp challenge (44, 45). In the previous studies, 51.8% and 8.2% of the total RNA-Seq reads (518,881,838) were mapped to the mRNA and lncRNA references, respectively (44, 45). In the current study, 70,863,638 (13.68%) of the total RNA-Seq reads were mapped to the lncNATs reference suggesting that lncNAT is a substantial category of the fish transcriptome. A considerable antisense transcription was previously reported from eukaryotic genomes of Arabidopsis (7.4%) (10, 11), fruit fly (16.8%) (12), zebrafish (49.3%) (13), mouse (72%) (14), and human (~61-72%) (14, 15). A total of 12,092 lncNATs (89.55%) were expressed in all genetic lines at TPM ≥ 0.5 compared to 87.2% of lncRNAs. Of the 71,232 protein-coding transcripts, 9,095 (12.7%) had antisense transcription on the opposite strand. In humans, more than 30% of the annotated transcripts have counterpart antisense transcripts (18). The antisense transcripts were, on average, 2.6-fold lower in abundance than their sense counterparts’ expression across 24 RNA-Seq datasets of fish from different genetic lines and infectious conditions (Figure 4A).
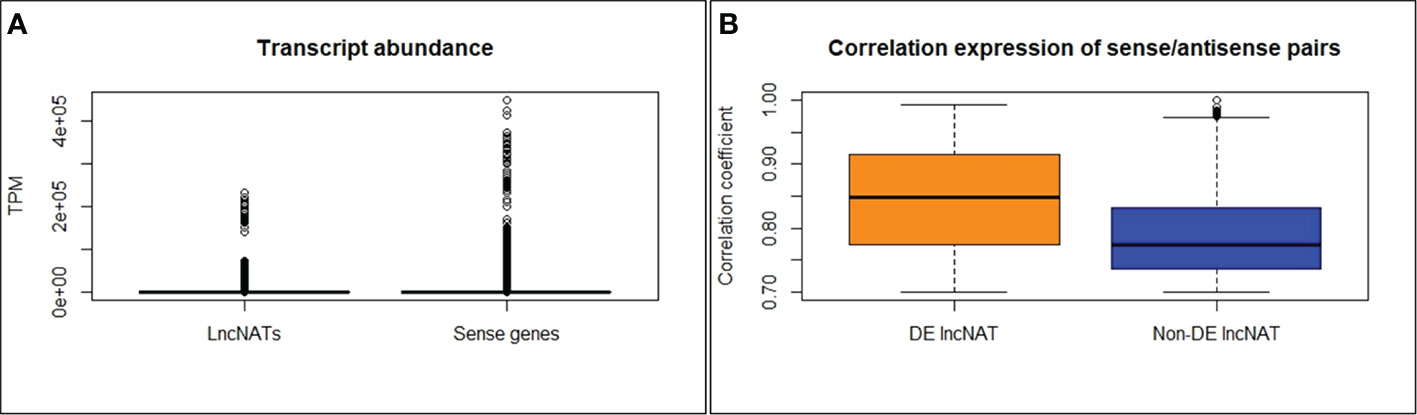
Figure 4 LncNATs are less abundant than their sense counterparts (A). DE lncNATs exhibited a higher expression correlation with their sense protein-coding genes than non-DE lncNATs (B).
Pairwise comparisons between the three genetic lines, infectious status, and time points of infection were performed using DESeq2 and identified 1,376 (581 non-redundant) DE lncNATs in all comparisons (Fold change ≥ |2|, FDR < 0.05). For confirmation, edgeR was also used for differential gene expression analysis and identified 4,802 (1,393 non-redundant) DE lncNATs in all comparisons. Remarkably, 554 of the non-redundant DE lncNATs (95.4%) identified by DESeq2 were also detected by the edgeR. Since DESeq2 was previously used to identify DE mRNAs (44), we used the DESeq2 output for all downstream analyses in the current study. A list of all DE lncNATs is provided in Supplementary File 2. DE lncNATs and DE protein-coding genes showed a higher correlation coefficient (R = 0.81, p-value = 1.72E-06; Table 1) than that of DE lncNATs and DE lincRNAs (R = 0. 6, p-value = 0.002). We previously reported a moderate correlation between DE protein-coding genes and DE lncRNAs (R = 0.63, p-value = 0.001) (45). For each pairwise comparison, there were fewer DE lncNATs than DE protein-coding genes except in the PBS-injected resistant and susceptible genetic lines relative to the control line on day 1 (Table 1). The number of DE lncNATs was greater than that of DE lncRNAs in 18 comparison groups. Challenging the fish with the pathogen increased the number of DE lncNATs in all different genetic lines from day 1 to day 5. We noticed an increase in the number of DE lncNATs in the infected ARS-Fp-S line on day 5 (138 lncNATs) compared to day 1 (71 lncNATs). On the other hand, the infected ARS-Fp-R line showed a slight increase in the numbers of DE lncNATs on day 5 (54 lncNATs) than on day 1 (50 lncNATs) (Table 1).
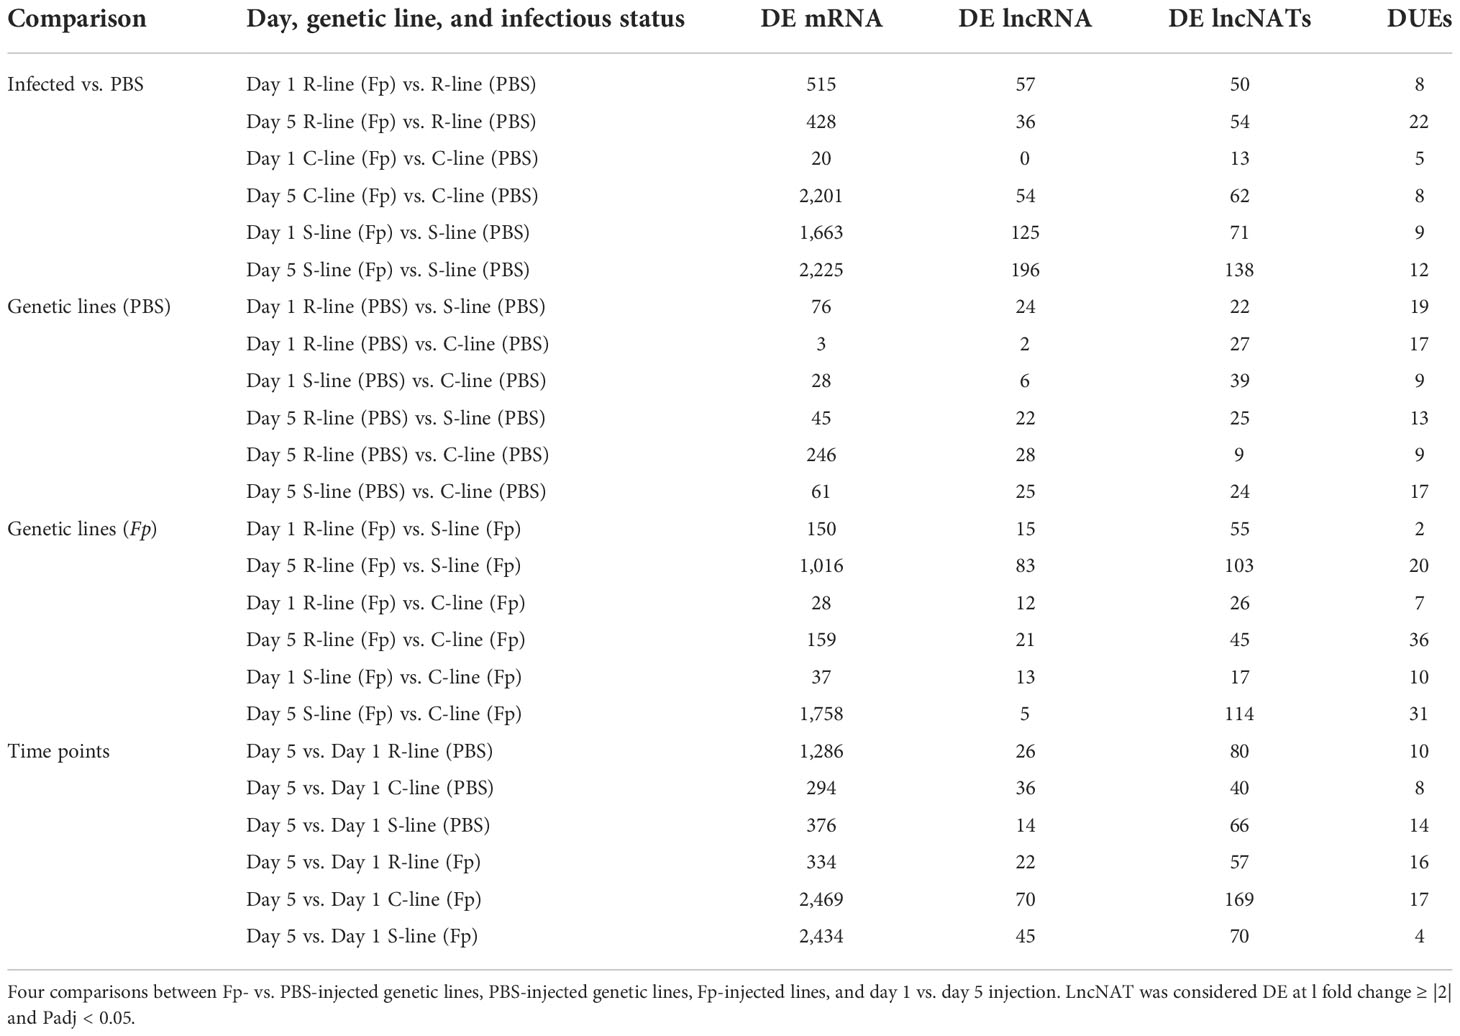
Table 1 Comparison of DE lncNATs, lncNAT DUEs, lncRNAs, and protein-coding genes in response to PBS/Fp injection..
Alternative splicing (AS) is an interesting aspect of the eukaryotic transcriptome to generate more transcript isoforms and increase the repertoire of proteins (90). Previous studies showed that AS plays a crucial role in immune response and diseases (1, 91). In particular, our previous study identified changes in the relative usage of protein-coding exons between BCWD-resistant and -susceptible fish. For instance, exon skipping was detected in a gene encoding interferon-induced very large GTPase 1 (GVIN1) in fish susceptible to BCWD (1). In this study, we sought to profile differential usage of NAT exons in the three genetic lines under different infectious statuses and time points of infection. Pairwise comparisons identified 323 (179 non-redundant) DUEs in all comparisons (Fold change ≥ |2|, FDR < 0.05) (Table 1). DUEs belong to 334 antisense transcripts encoded by 115 gene loci. Notably, DUEs-harboring lncNATs were not mainly DE at the transcript level. The complete list of all DUEs lncNATs is provided in Supplementary File 2.
Relationship between DE lncNATs and their sense immune-related loci
LncNATs were classified as exonic or intronic according to their genomic location relative to their sense coding loci. We reported the classification of all 581 DE lncNATs in Supplementary File 2. To gain insights into the implications and biological roles of DE lncNATs in fish immune defense against infection, we annotated their sense coding loci and defined involvement in the signaling and immune pathways. Functional annotation of all sense protein-coding genes revealed that 31.77%, 14.94%, 7.92%, and 6.02% were involved in metabolism, stress response, response to external stimulus, and immune response suggesting a potential role of DE lncNATs in the fish immune response. Of the 429 protein-coding sense genes linked to DE lncNATs, 205 were successfully mapped and had hits to various KEGG pathways. Of them, 31 transcripts were involved in immune pathways (such as complement component 4 and interleukin 1 beta), and 40 transcripts were involved in signaling pathways (such as MAPK signaling pathway, NF-kappa B signaling pathway, and TNF signaling pathway), whereas 22 transcripts were mapped to both immune and signaling pathways. Common transcripts included interleukin 1 beta, C-C motif chemokine 13, chemokine CK-1 precursor, mast/stem cell growth factor receptor kita, TGF-beta receptor type-2, and T-cell receptor alpha chain C region. In addition to genes mapped to the KEGG immune and signaling pathways, the list of sense genes includes transcripts with multi-faceted roles, including immune response/inflammation. These transcripts include E-selectin, hepcidin, haptoglobin, HMG box-containing protein 1, and periostin.
To investigate the potential relationship between lncNATs and their sense loci, we compared their expression levels across 24 RNA-Seq datasets representing different genetic lines and infectious status. We used normalized TPM values to cluster the expressed transcripts. Most of the sense-lncNAT pairs showed a positive correlation in expression. Only 10 lncNATs showed a negative expression correlation with their cognate protein-coding loci. However, none of the 10 lncNATs were DE. The correlated DE lncNATs and their sense genes are listed in Supplementary File 2. In total, 252 DE lncNATs (43.4%) showed strong correlations with their sense protein-coding genes (R ≥ 0.70). DE lncNATs exhibited a higher expression correlation with their sense protein-coding genes than non-DE lncNATs (Figure 4B). Previous studies showed that sense-antisense pairs usually exhibit positive expression correlations (14, 81–85). Lysozyme II was among the immune-relevant genes with a positively correlated DE lncNAT (R = 0.90). Lysozymes hydrolyze the peptidoglycan backbone of the gram-negative bacteria and initiate the innate immune system to clear the infection (92). Similarly, liver-expressed antimicrobial peptide 2B showed a positive correlation with its DE lncNAT (R = 0.80). Liver-expressed antimicrobial peptide 2 was induced in response to Salmonella enterica infection in chicken and is a part of the innate immune system (93). In addition, 47 uncharacterized protein-coding transcripts were correlated in genomic location and expression with the counterpart DE lncNATs. These transcripts may have immune-related functions.
LncNATs complementary to immune-related genes were regulated during the early and late response to infection
Early response profile on day 1
Herein, we investigated the pairwise comparisons between Fp-infected fish and PBS-injected fish from the same genetic line on day 1 (Supplementary File 2). For the ARS-Fp-S susceptible line, 72 lncNATs were DE in response to the Fp infection on day 1. Of them, 49 lncNATs were upregulated. The list included lncNATs overlapping with immune-related genes such as chemokine CK-1, Interleukin-8 (IL-8), E-selectin, mast/stem cell growth factor receptor kita, roquin-2, interferon-induced protein 44, and suppressor of cytokine signaling 3. Sense genes showed significant enrichment in GO terms linked to cellular homeostasis, positive regulation of leukocyte migration, response to external stimulus, leukocyte chemotaxis, and regulation of leukocyte migration. For instance, IL-8, also known as permeability factor 2, is a potent chemoattractant of neutrophils (PMN) and an activator of PMN transendothelial migration (94). On the other hand, 22 lncNATs were downregulated in susceptible fish following infection on day 1. Downregulated lncNATs overlapped with loci coding for immune-related genes such as C-C motif chemokine 13, small inducible cytokine A13, and engulfment and cell motility protein 2. Differential exon usage (DEU) analysis revealed that nine exonic regions were differentially used between Fp- and PBS-injected susceptible fish. Remarkably, five of them demonstrated exon skipping in antisense transcript isoforms overlapping with a gene encoding serum albumin 1 (Supplementary File 2). The latter has previously demonstrated a role in innate immunity by inhibiting the growth of pathogenic microorganisms (95).
On the other hand, the ARS-Fp-R resistant fish line displayed less response relative to the ARS-Fp-S susceptible line. We identified 50 DE lncNATs; 38 lncNATs were upregulated in the infected fish. Similar to the susceptible genetic line, sense genes showed significant enrichment in GO terms linked to positive regulation of leukocyte migration, response to external stimulus, leukocyte chemotaxis, and regulation of leukocyte migration. Seventeen lncNATs showed a similar expression pattern as in the ARS-Fp-S line (upregulated). These lncNATs were overlapping mainly with immune-related genes such as E-selectin, chemokine CK-1 precursor, interferon-induced protein 44, and suppressor of cytokine signaling 3. DEU analysis revealed differential usage of eight exons between Fp- and PBS-injected resistant fish. Interestingly, exon inclusion in two lncNATs complementary to a gene encoding ragulator complex protein LAMTOR5 (LTOR5) was observed in Fp-injected resistant fish (Figure 5A and Supplementary File 2). LTOR5 is an autophagy inhibitory protein that acts as an activator of the potent autophagy inhibitor mTORC1 (96). Autophagy plays a crucial role in the immune response and defense against many microbial pathogens. Some pathogens disrupt autophagy to form a replicative niche (97). The DE lncNATs and DUEs involved in the early response are listed in Supplementary File 2.
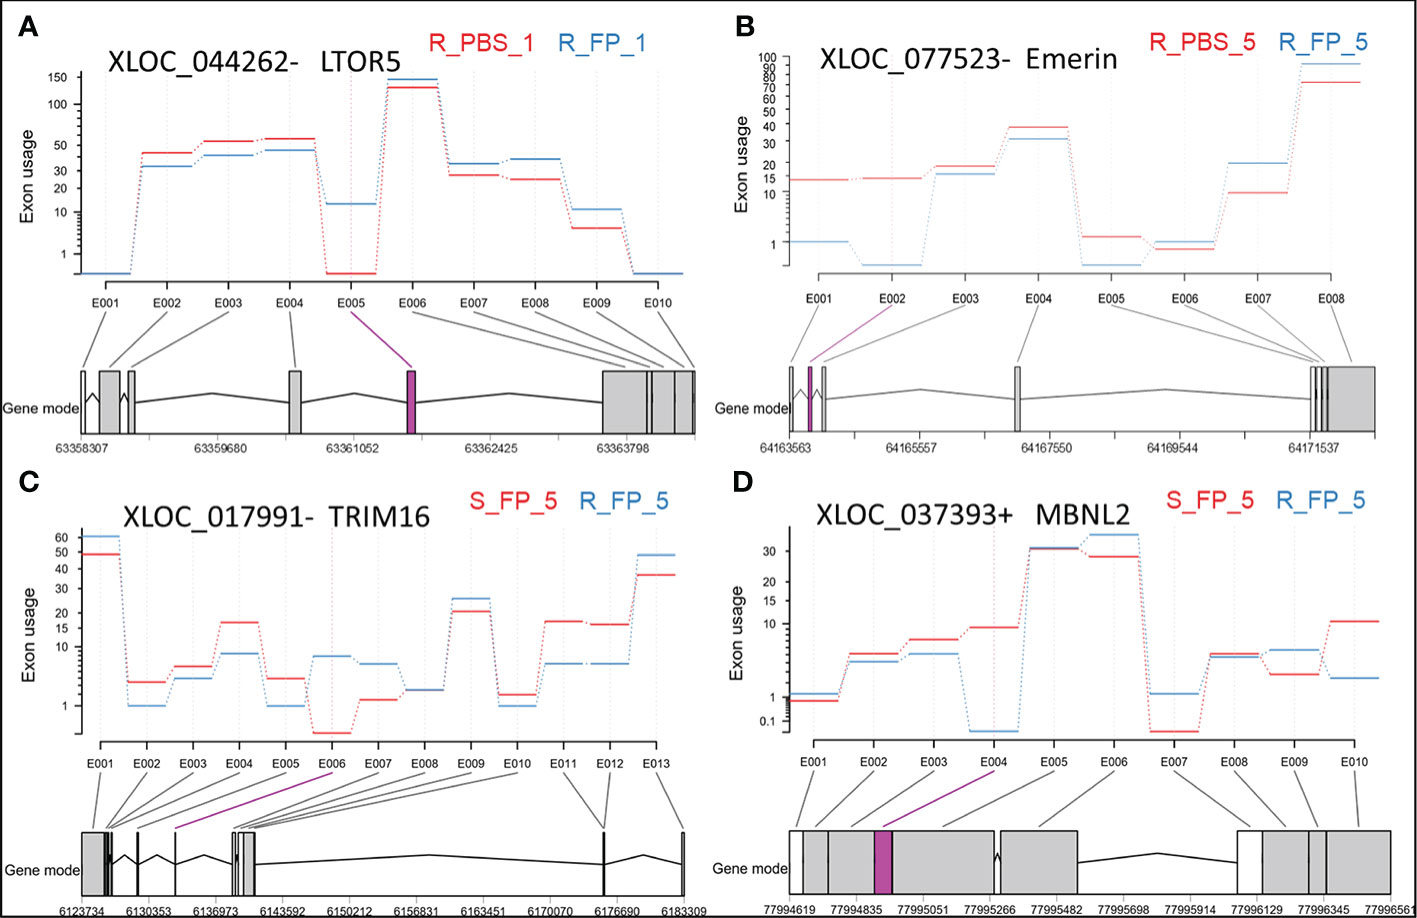
Figure 5 Exonic regions showing differential usage in antisense transcripts overlapping with LTOR5 (A), Emerin (B), TRIM16 (C), and MBNL2 (D). Significant differentially used exons (DUEs) are represented in pink at the bottom of each panel. Each biological condition is represented by the genetic line (R or S), type of injection (FP or PBS), and days post-injection (day 1 or day 5).
Late response profile on day 5
To estimate the late response to infection, we investigated pairwise comparisons between the Fp-infected and PBS-injected fish on day 5 (Supplementary File 2). The ARS-Fp-S susceptible genetic fish line exhibited a higher number of DE transcripts (n = 138 lncNATs) than the ARS-Fp-R resistant line (n = 54 lncNATs). Of the 54 DE lncNATs, 18 were shared between the two genetic lines. A NAT complementary to differentially regulated trout protein 1 was the most upregulated common NAT during the late response in ARS-Fp-S and ARS-Fp-R genetic lines. High levels of differentially regulated trout protein 1 transcript indicate that the acute phase response has been activated (98). LncNATs complementary to other immune-related genes, including complement factor H, lysozyme II, complement C4, and interferon-induced protein 44, were also shared between the two genetic lines during late response. In Fp-infected resistant and susceptible fish, DEU analysis revealed two common exon-skipping events in lncNATs complementary to myosin and an uncharacterized transcript (Supplementary File 2).
The ARS-Fp-R genetic line had 36 unique DE lncNATs during the late response compared to the ARS-Fp-S line. For example, the ARS-Fp-R line had eight downregulated lncNATs complementary to loci coding for proteolytic enzymes, including trypsin, chymotrypsin, cathepsin L2, and carboxypeptidase B. In humans, the proteolytic MEP1A gene is a susceptibility gene for inflammatory bowel disease (99). Also, the resistant fish line had eight downregulated lncNATs overlapping with uncharacterized proteins, which warrants further investigation. Fish from the resistant genetic line also had 20 unique DUEs during the late response compared to the susceptible fish (Supplementary File 2). LncNATs complementary to genes encoding myosin heavy chain and emerin (Figure 5B) were at the top of those demonstrating exon skipping in resistant fish on day 5 post-infection. Genes encoding emerin have previously shown an association with Emery-Dreifuss muscular dystrophy (100).
On the other hand, the ARS-Fp-S susceptible fish line had 120 unique DE lncNATs (73 upregulated) compared to the ARS-Fp-R line. Several of these lncNATs are complementary to loci coding for immune-related genes suggesting infection triggered inflammation/immune response due to the high bacterial load on day 5 (Figure 6A). Sense immune-related genes included permeability factor 2, chemokine CK-1 precursor (CXCR1), interleukin-1-beta (IL-1β), complement component 4, B-cell receptor CD22, mast/stem cell growth factor receptor kita, roquin-2, and C-C motif chemokine 19. By increasing vascular permeability, the permeability factor triggers the wound healing response (101). Also, the loss of human CXCR1 impaired the host defense against Pseudomonas (102). Functional enrichment analysis of the sense genes revealed GO terms linked to positive regulation of leukocyte migration, leukocyte chemotaxis, cellular homeostasis, positive regulation of immune system process, and response to external stimulus. IL-1β is a potent pro-inflammatory cytokine that protects against bacterial infections by activating several immune responses, such as the rapid recruitment of neutrophils to inflammatory sites (103). Fish from the susceptible genetic line had also 10 unique DUEs during the late response compared to the resistant fish (Supplementary File 2). A lncNAT complementary to a gene encoding myosin heavy chain was at the top of those demonstrating exon skipping in susceptible fish on day 5 post-infection. The list of DE lncNATs and DUEs during the late response and their expression correlations across 24 RNA-Seq datasets were provided in Supplementary File 2.
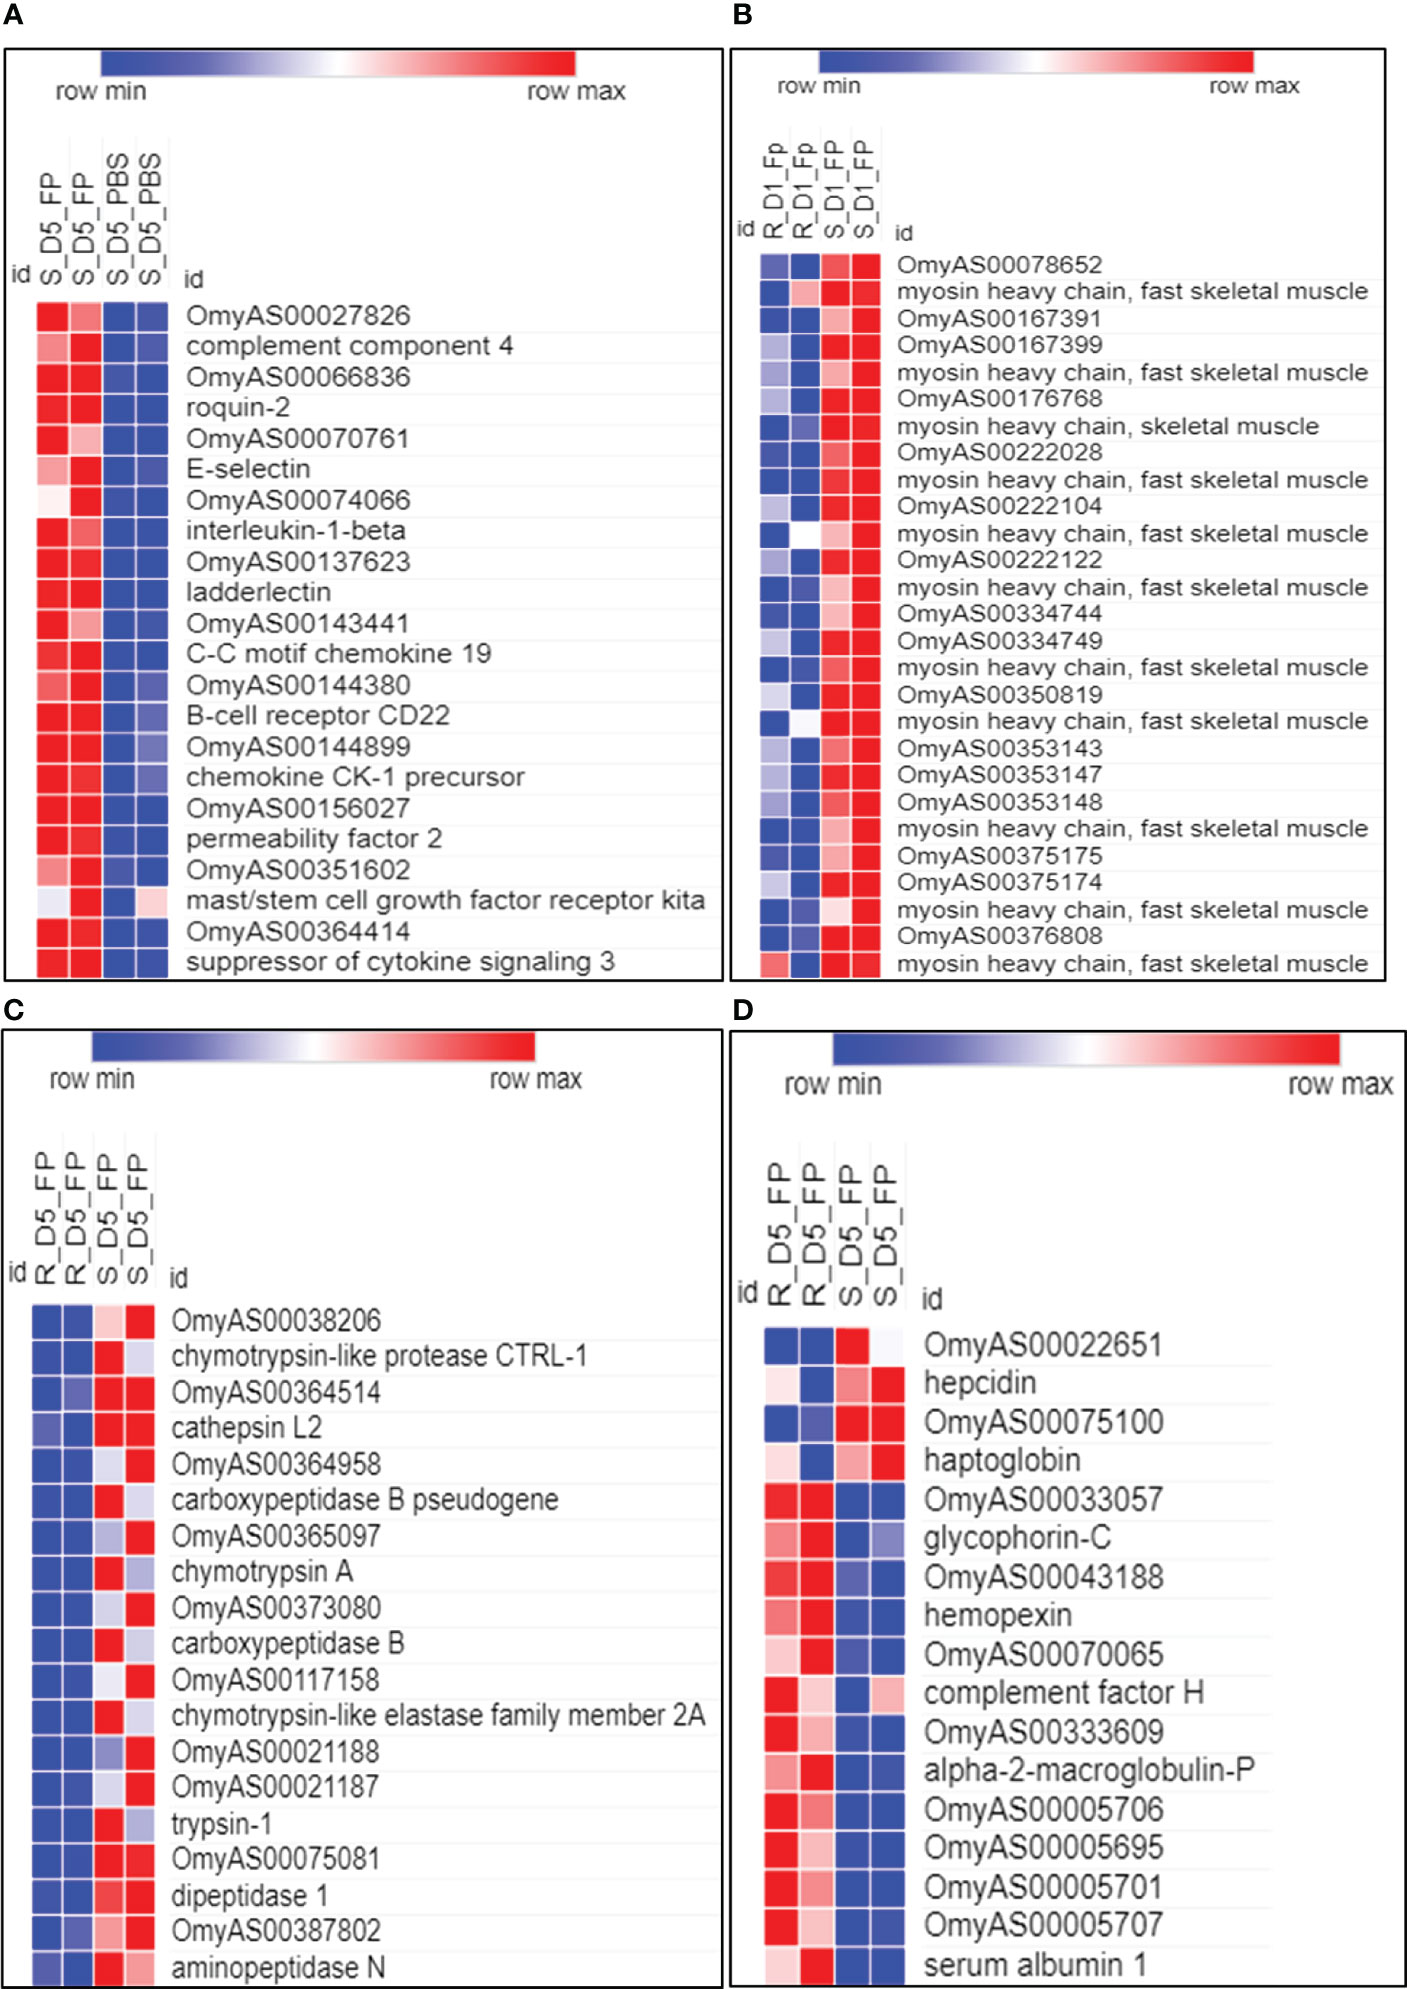
Figure 6 Comparison of transcriptome abundance of selected DE lncNATs and their sense genes. (A) Unique DE lncNATs, complementary to immune-related genes, in susceptible fish on day 5 post-infection. (B–D) DE lncNATs between resistant and susceptible genetic lines overlap with genes related to muscle contraction (B), proteolysis (C), and iron homeostasis (D). Normalized expression from sense genes is visualized on the heatmap below the corresponding lncNAT(s). D1 and D5 indicate day 1 and day 5 post-challenge, respectively. FP and PBS indicate Fp and PBS injection, respectively. R and S represent resistant and susceptible genetic lines of the fish.
LncNATs complementary to genes involved in muscle contraction, proteolysis, and heme/iron metabolism were regulated in the genetic lines following infection
We noticed a differential expression of lncNATs complementary to non-immune genes during the early and late response. For instance, we observed differential expression of lncNATs complementary to myosin heavy chain genes, proteolytic genes, and genes involved in cellular iron ion homeostasis (Figures 6B–D). To identify the contribution of these non-immune genes to disease resistance, we compared Fp-infected fish of ARS-Fp-S and ARS-Fp-R genetic lines at the same time points. Fifty-six lncNATs were DE between the susceptible and resistant genetic lines on day 1 following infection (Supplementary File 2). Seventeen lncNATs complementary to 12 myosin heavy chain loci were upregulated in susceptible fish compared to resistant on day 1 following Fp-infection (Figure 6B). All myosin transcripts and complementary lncNATs exhibited strong positive expression correlations across the 24 RNA-Seq datasets. Furthermore, exon usage analysis revealed differential usage of two exons (Supplementary File 2). A lncNAT overlapping with myosin was the top transcript showing exon skipping in resistant fish on day 1 post-infection. Inactivity or reduced swimming activity has been reported recently to be associated with disease resistance in salmon (104). In Salmo salar, myosin was upregulated in susceptible fish in response to sea lice infection (104), suggesting myosin loci and complementary lncNATs as potential markers for BCWD susceptibility.
On the other hand, we identified 103 DE lncNATs and 20 DUEs between ARS-Fp-R and ARS-Fp-S genetic lines on day 5 (Supplementary File 2). Most DUEs, which demonstrated exon inclusion in resistant fish, belong to antisense transcript isoforms overlapping with genes important for protein degradation and turnover, such as tripartite motif-containing protein 16 (TRIM16; Figure 5C) (105), cathepsin D (106), and ubiquitin-conjugating enzyme E2 L3 (107). Conversely, antisense transcripts overlapping with muscleblind-like protein 2 (MBNL2) were at the top of those showing exon skipping in Fp-infected resistant fish (Figure 5D and Supplementary File 2). MBNL2-deficient mice developed myotonia and skeletal myopathy, critical features of myotonic dystrophy (108). Our previous study showed that exon 3 in isoforms encoding dystrophin was completely absent in fish belonging to the resistant genetic line (1). Consistent with the hemolytic activity of Flavobacterium (109), the resistant fish had differentially expressed genes synchronized toward reducing hemolysis. For example, fish of the ARS-Fp-R genetic line had an upregulated NAT complementary to glycophorin-C, a red blood cell membrane protein that maintains the cell shape and regulates the membrane’s mechanical stability (110). In addition, the complement factor H and its complementary NAT were upregulated in the resistant fish. The deficiency of complement factor H leads to hemolytic diseases (111). Moreover, ten lncNATs and their complementary genes encoding proteinases/peptidases were upregulated in the susceptible fish (Figure 6C). The list of the proteinases/peptidases (n = 9) includes trypsin-1, chymotrypsin A, carboxypeptidase B, dipeptidase 1, and aminopeptidase N. Previous studies revealed that proteolytic enzymes, such as trypsin-1, can promote the hemolytic activity (112). We also identified four upregulated lncNATs complementary to the DE E-selectin in the susceptible fish line. Adhesion molecules, including E-selectin, expressed in the vascular endothelial cells, are induced by heme (113), suggesting a higher hemolysis rate in susceptible fish relative to the resistant.
Efficient clearance of Hb and hemin can disrupt bacterial iron uptake and growth. Herein, we hypothesized that the resistant fish had a more efficient mechanism allowing clearance of free Hb and hemin Figure 7. We observed DE lncNATs and their complementary genes encoding specialized scavenger proteins that sequester Hb and hemin and transit them to the compartment where hemin can be metabolized by heme-oxygenases (upregulated in resistant fish) into less toxic metabolites (Figure 6D and Supplementary File 2). The lncNAT (OmyAS600043188) and its cognate protein-coding gene (hemopexin; Hx) were upregulated in the resistant fish after infection. Hx mainly sequesters heme and transports it to the hepatic cells, via receptor-mediated endocytosis, for catabolism and excretion (114).
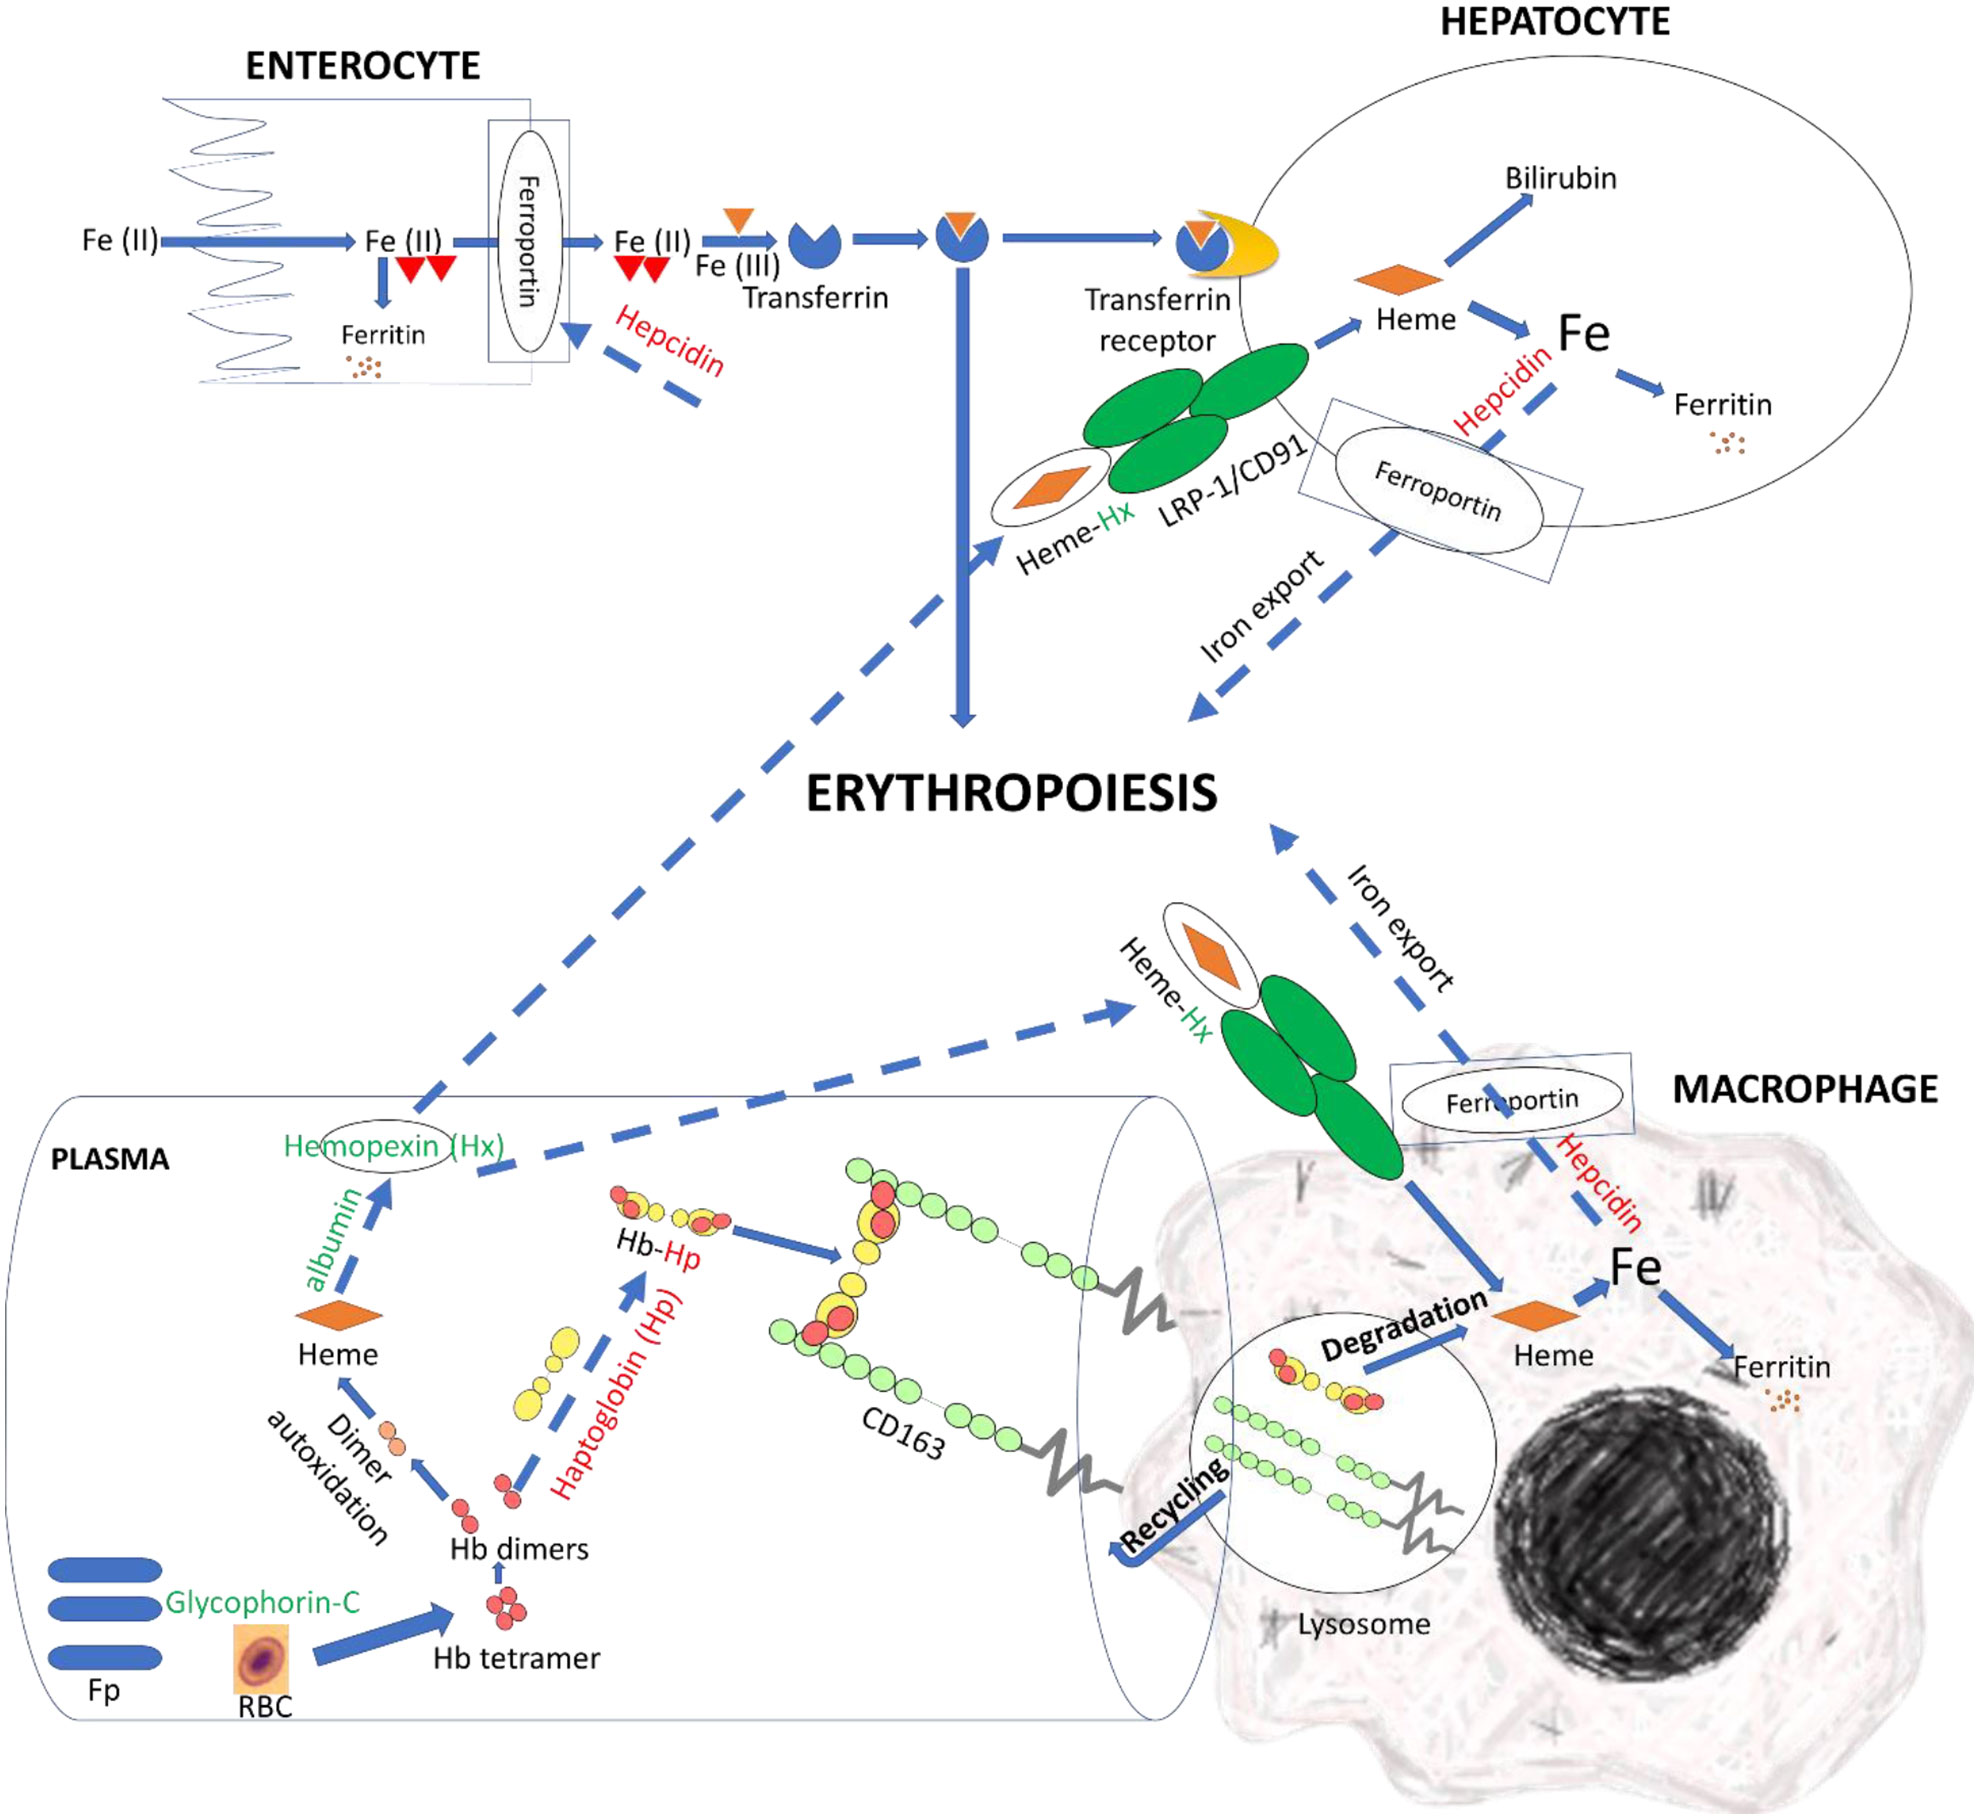
Figure 7 LncNATs complementary to hemolysis-related genes were DE in the resistant fish compared to susceptible fish on day 5 post-infection to promote clearance of free Hb and heme and enhance erythropoiesis. LncNATs of Hx, albumin, and glycophorin-C were upregulated in the resistant fish (green-coded), whereas lncNATs complementary to hepcidin and Hp were downregulated (red-coded). Glycophorin-C maintains the cell shape and membrane’s stability. Whereas Hp binds to Hb and transports it to the macrophages for catabolism. When Hp depletes, albumin transmits heme to Hx. The latter transports heme to the macrophage and hepatic cells, via receptor-mediated endocytosis, for catabolism. Low hepcidin expression allows iron export from macrophages and hepatocytes and iron import from enterocytes, promoting erythropoiesis. The proposed model suggests regulation of genes preventing pro-inflammatory effects of heme and reducing iron availability for bacterial growth in resistant fish. Dashed arrows indicate processes suggested in this study, whereas solid arrows refer to processes supported by information from the literature.
Conversely, haptoglobin (Hp) and its complementary NAT were downregulated in the resistant fish on day 5. Hp is the primary hemoglobin-binding plasma protein that attenuates hemolytic disease’s pathophysiologic effects (114). Depletion of Hp occurs before the decline in Hx (114). Further, resistant fish had six upregulated lncNATs complementary to serum albumin. When Hp is depleted, albumin binds to heme to transport it to Hx, thus preventing the pro-inflammatory effects of heme and bacterial growth (114).
Notably, the NAT (OmyAS600022651) complementary to hepcidin (LOC100653444) was the most downregulated NAT in the resistant fish (Table 2). The two transcripts exhibited a high positive expression correlation across 24 RNA-Seq datasets (R = 0.85). Our recent study revealed the downregulation of two loci coding for hepcidin in resistant fish on day 5 post-infection (Fold change of -10.6 and -5.3) (115). Hepcidin is the master regulator of iron homeostasis. As a defense mechanism, hepcidin is induced to deplete and withhold extracellular iron from invading pathogens (116). Hepcidin binds to ferroportin, blocks transmembrane iron export from hepatocytes and macrophages (117), and inhibits iron absorption. Since hepcidin expression is suppressed by hypoxia and erythropoiesis (116, 118, 119), increased expression of hepcidin in susceptible fish could be associated with lower levels of erythropoiesis and hypoxia. Hypoxia has profound effects on promoting erythropoiesis (120) and reducing the development of bacterial infection and disease progression (121). Upregulation of hemoglobin subunits alpha and beta-1 following infection was previously reported in resistant fish (44, 67). Also, as shown in Figure 8, we noticed significantly higher red blood cell counts in the non-infected resistant than susceptible fish, suggesting a role for the red blood cells in disease resistance. It is worth mentioning that resistant fish had upregulated lipocalin (LOC110534089) on day 5. Lipocalin, secreted by neutrophils following infection, binds the bacterial siderophore and sequesters the siderophore–iron complex to prevent bacterial uptake (122). Mice lacking lipocalin exhibited high bacterial sensitivity (123). Altogether, these findings indicate that it is not only immune-related genes but also non-immune genes related to muscle contraction, proteolysis, and heme/iron metabolism that are suitable targets for future functional studies to identify causative genes/variants of susceptibility to the BCWD.
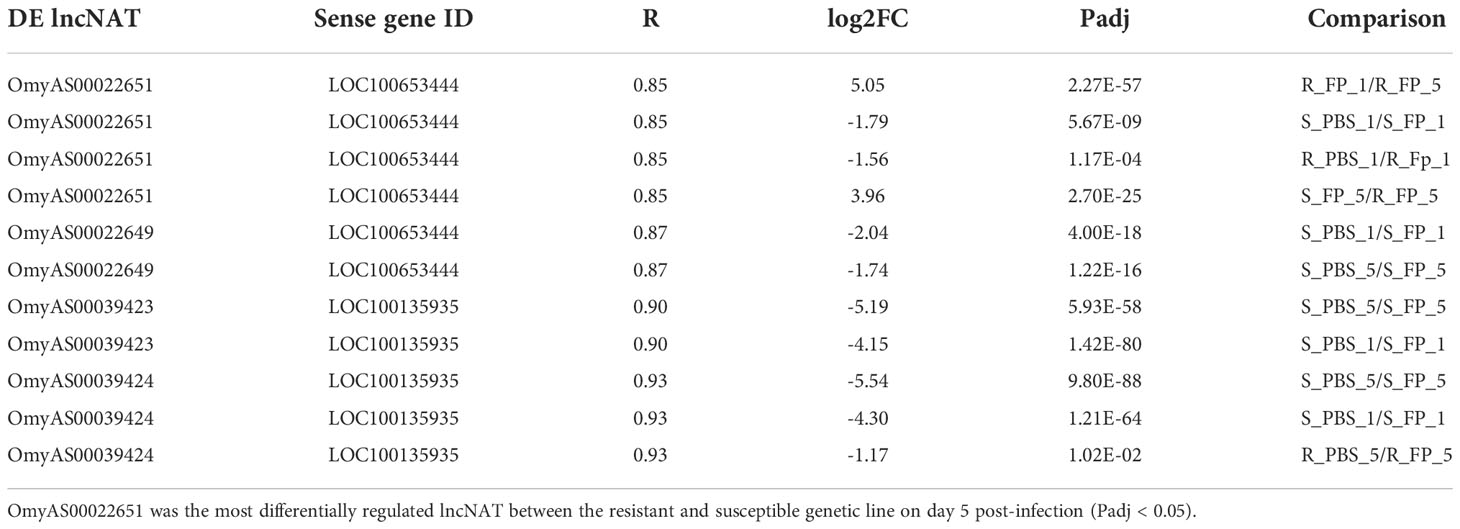
Table 2 Correlation between expression patterns of four DE lncNATs and their overlapping hepcidin genes across 24 RNA-Seq datasets.
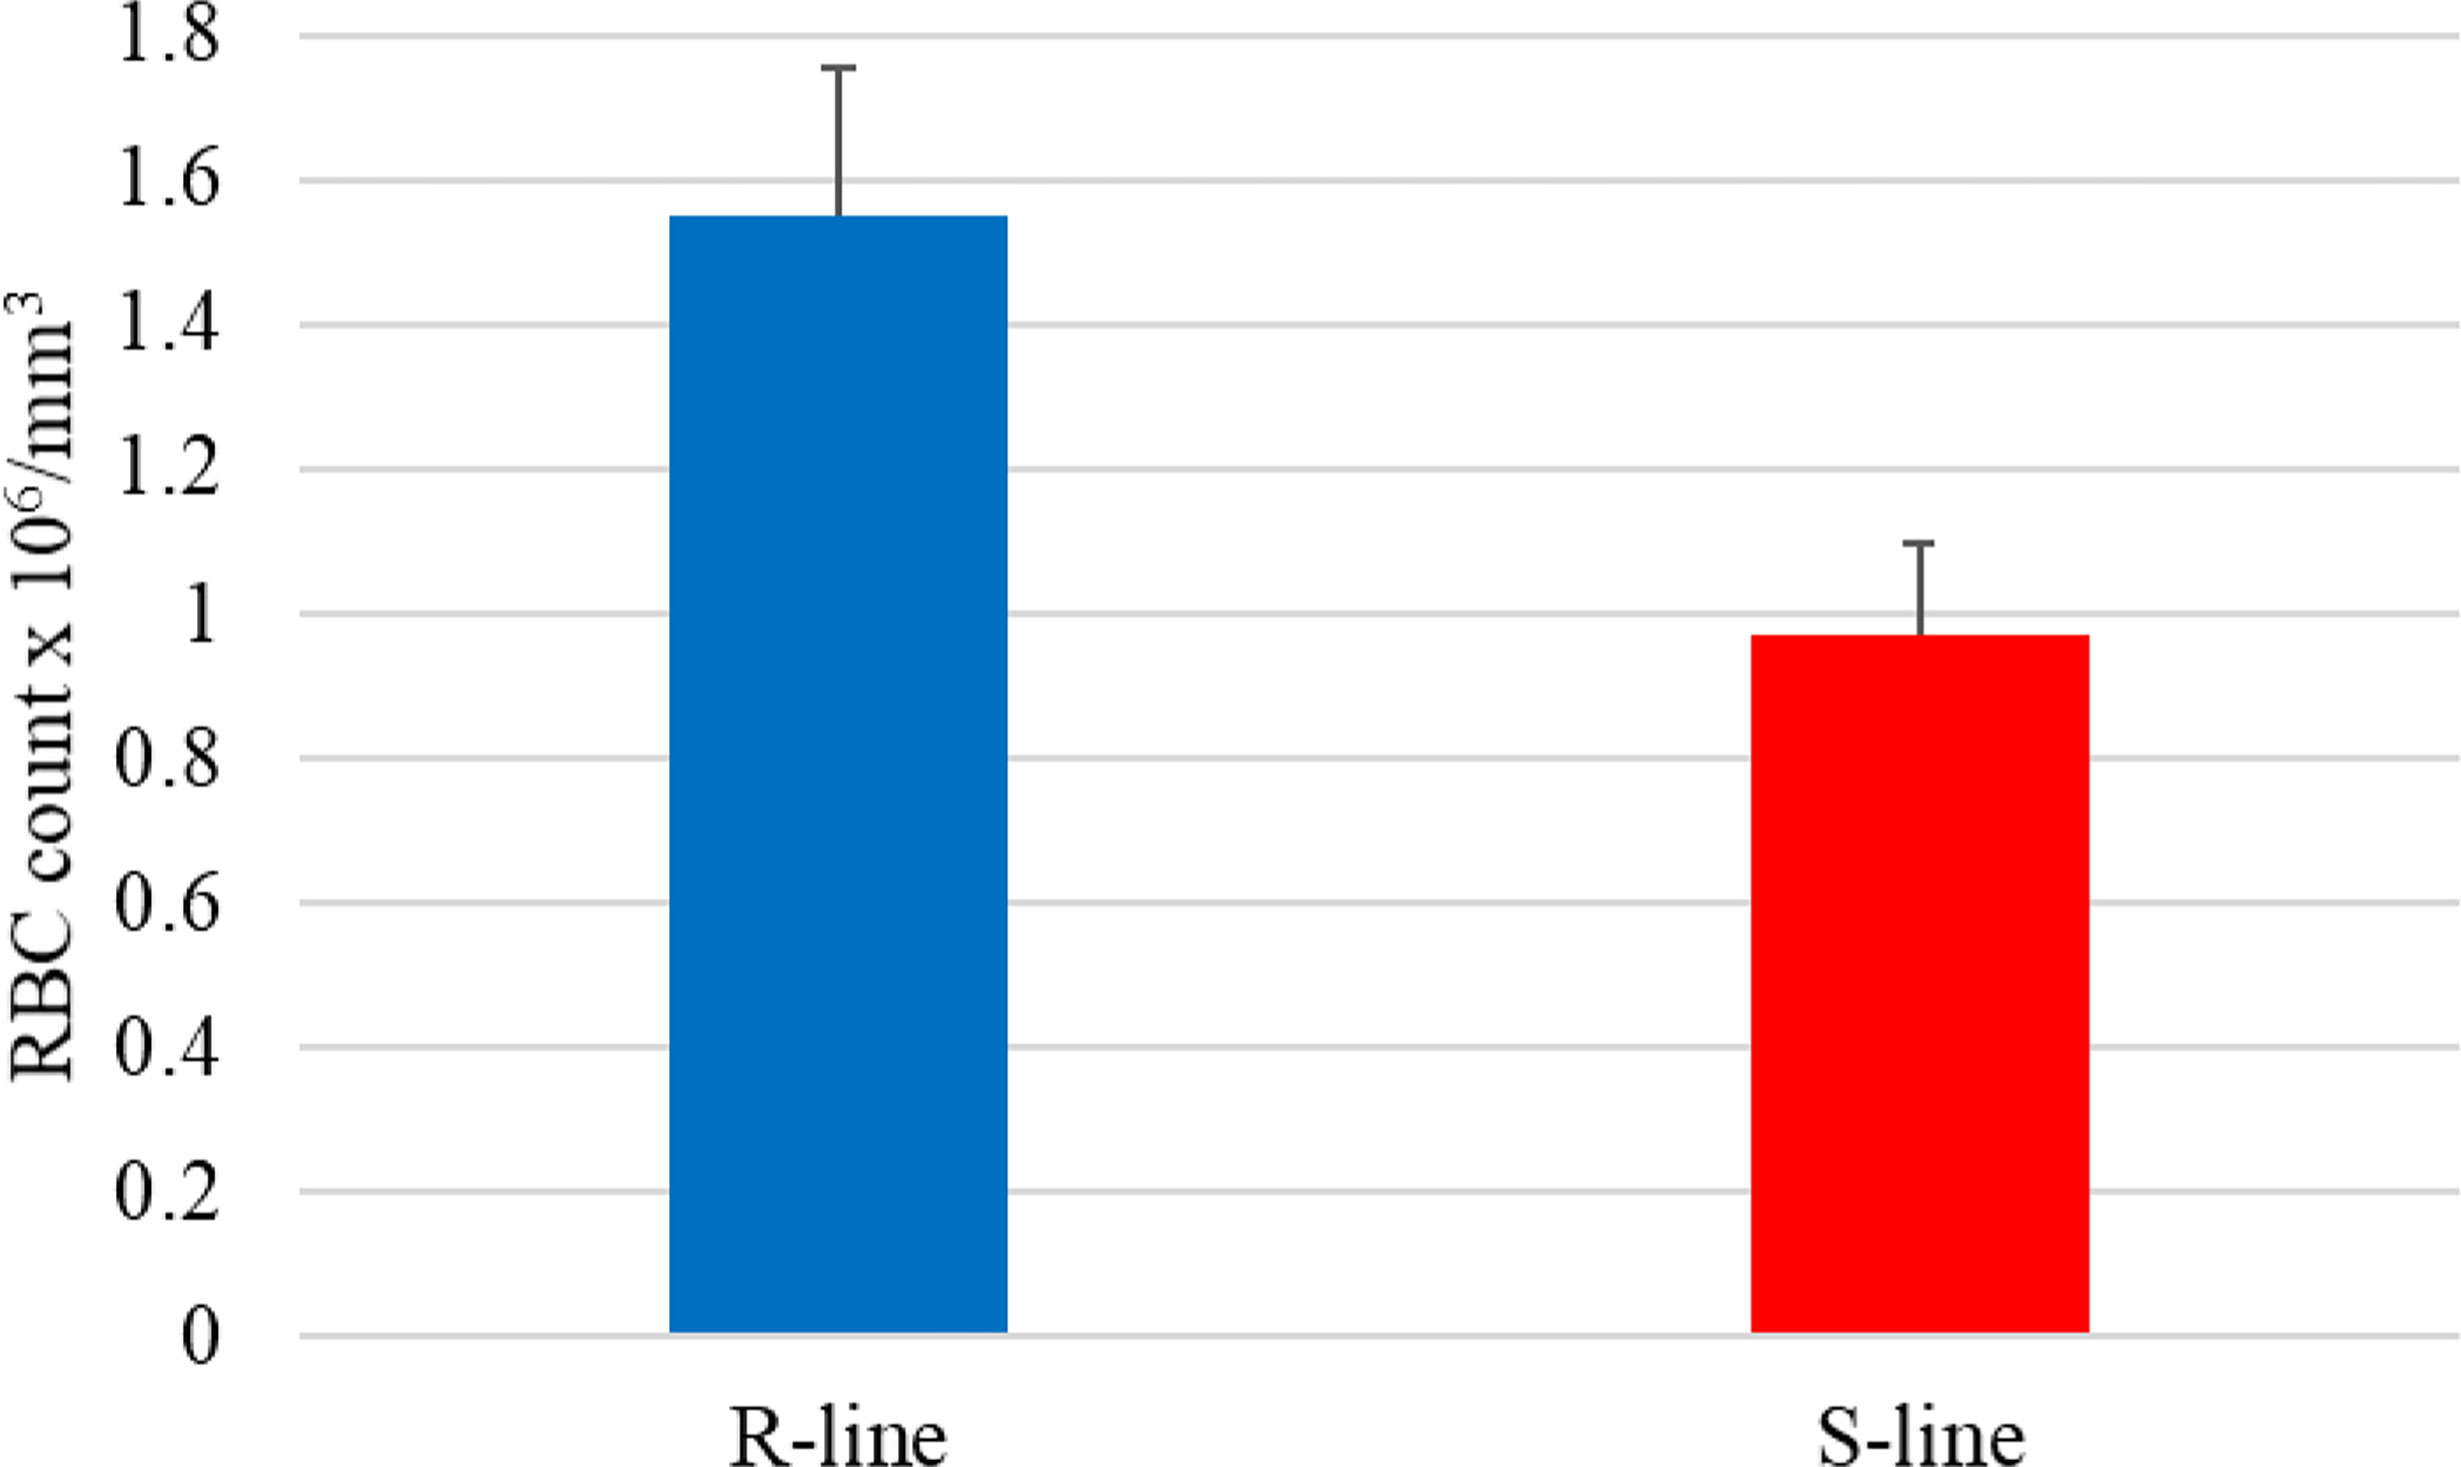
Figure 8 The average red blood cell count in the susceptible (S) genetic line was significantly lower than in fish from the resistant (R) genetic line (p-value < 0.02).
DE lncNATs overlap with BCWD QTL reported in previous mapping studies
Notably, 94 DE lncNAT were located within 26 QTL regions previously identified in association with BCWD in rainbow trout. The QTL size ranges from ~622 kb up to 57.5 Mb. Most lncNATs overlapped with QTL on Omy3 (23 lncNATs; 24.5%), followed by Omy8 (14 lncNATs; 14.9%). The identified lncNATs have 72 cognate protein-coding genes. LncNATs complementary to hepcidin and myosin heavy chain were the top represented in the BCWD-associated QTL (Table 3). Three hepcidin complementary lncNATs are located in Omy2 QTL, and the other two lncNATs exist in Omy3 QTL. Five myosin heavy chain complementary lncNATs were found on four QTLs on Omy6, 11, 12, and 28. Furthermore, lncNATs complementary to proteolytic genes (chymotrypsin-like protease CTRL-1) and other genes essential for maintaining the erythrocyte shape and stability, such as glycophorin-C and protein 4.1 were identified on Omy3 QTL. All DE lncNATs overlapping with the previously identified BCWD QTL are provided in Supplementary File 2. Our results shed light, perhaps for the first time, on the potential role of iron homeostasis-, contraction-, and proteolysis-related genes in the disease progression in rainbow trout.
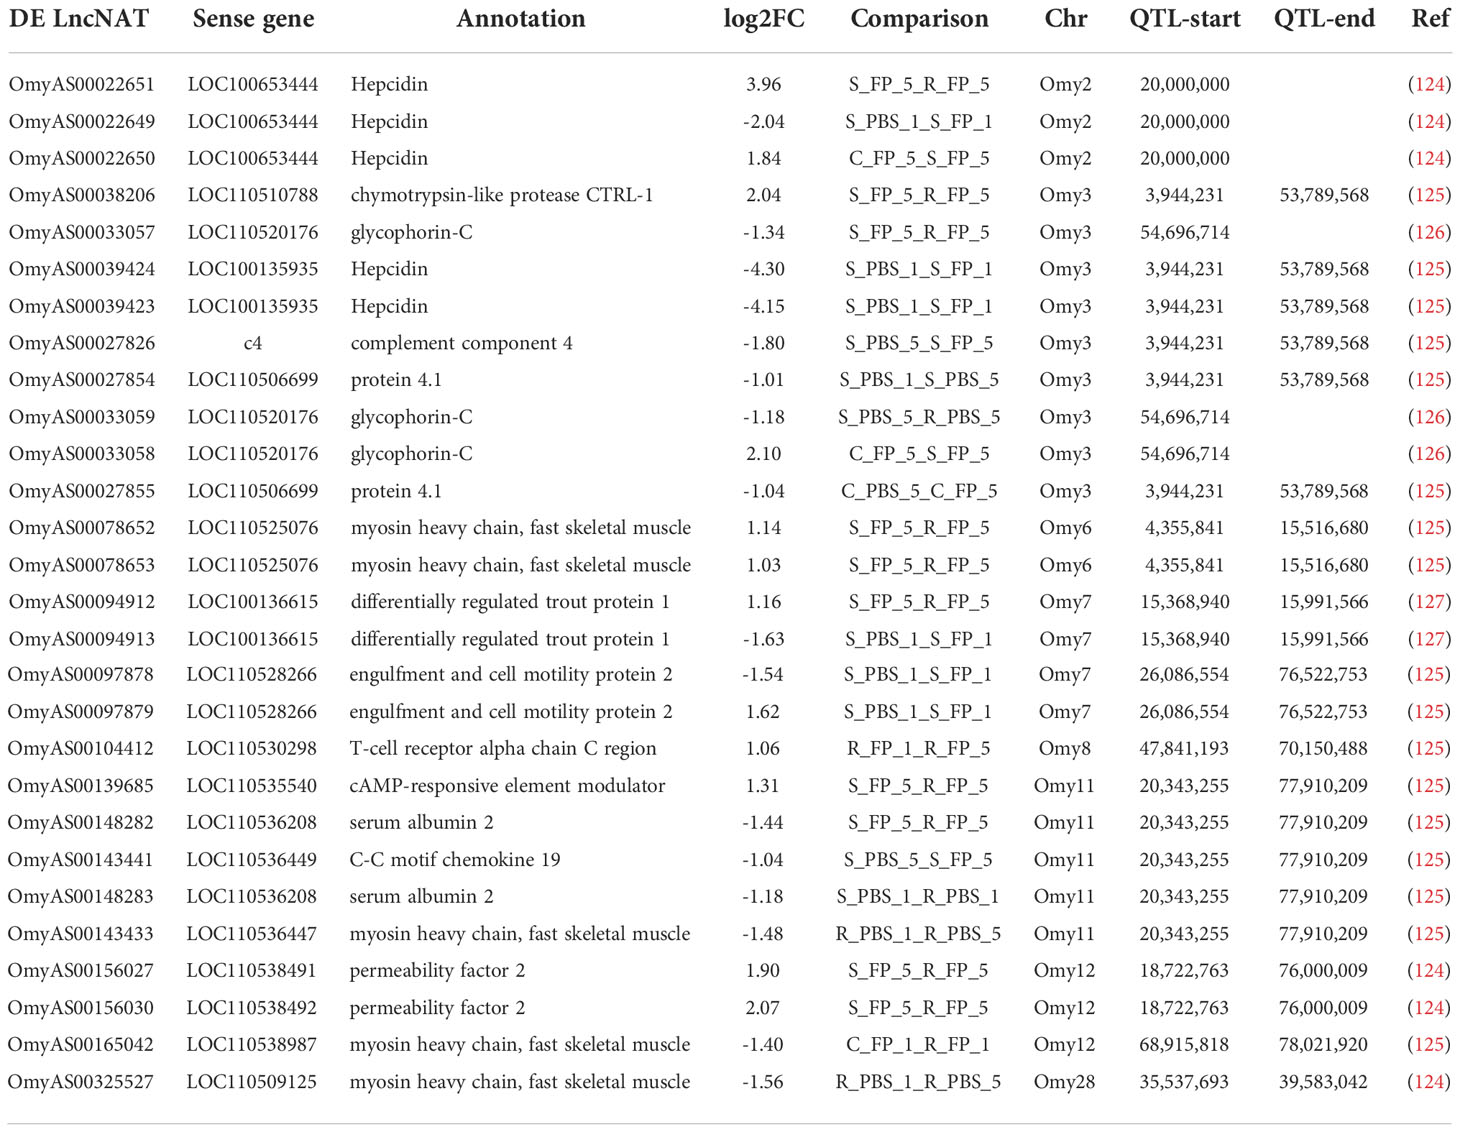
Table 3 DE lncNAT overlapping with previously published QTL for BCWD resistance in rainbow trout populations.
Post-transcriptional effect of lncNAT expression (RNA-RNA duplexes)
LncNATs can affect all stages of gene expression, including transcriptional initiation and co-transcriptional and post-transcriptional processes (18). Many factors, including orientation, stability, cellular localization, and inherent features, can influence the lncNAT mechanism of action. Herein, we studied one of the possible mechanisms of action that can facilitate lncNATs to regulate protein-coding gene expression.
We studied the potential post-transcriptional effect of the antisense transcription. LncNATs can increase the stability of their target mRNAs by masking microRNA target sites, thus protecting mRNA from degradation (29). We identified 279 lncNATs that potentially interacted with sense coding loci. Out of them, 164 transcripts targeted the 3’UTR of sense mRNAs. Analysis of the microRNA target sites over their 3’UTRs revealed 2,916 binding sites for 172 microRNAs in the lncNAT-mRNA (3’UTR) duplex area. Of the 164 lncNATs, 110 were predicted to mask 2,151 microRNA binding sites (Table 4 and Supplementary File 3). Most of these transcripts were DE in the infected ARS-Fp-S line on day 5 (n = 47).
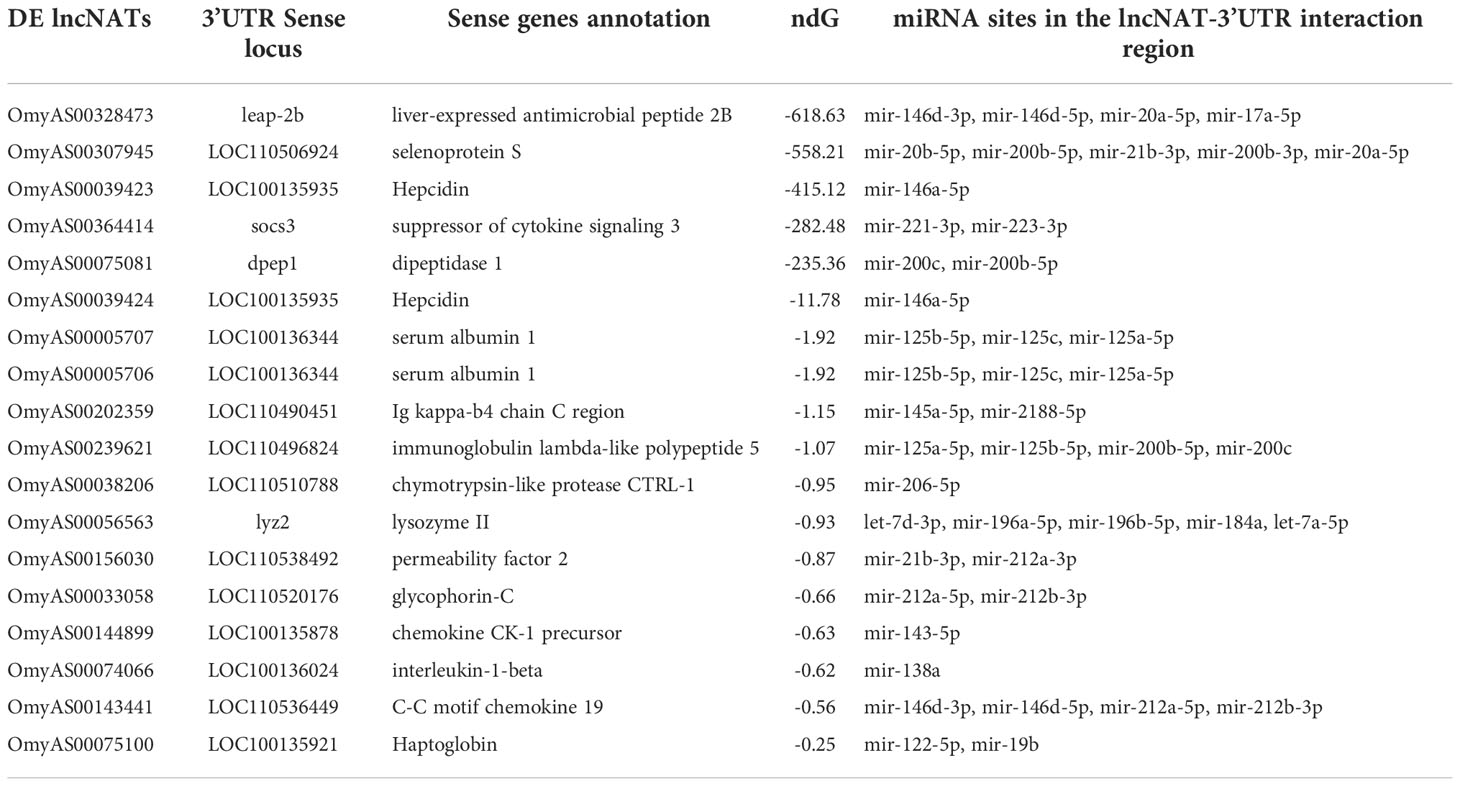
Table 4 DE lncNATs interacting with the 3’UTR of cognate genes and masking microRNA target sites. ndG is the normalized binding free energy.
There were binding sites to microRNAs known to have a role in bacterial infection. These miRNAs include mir-146, mir-125, mir-132, mir-20, mir-223, mir-21, mir-212, mir-200, and mir-17 (128). The presence of microRNA binding sites in the 3’UTR of immune-relevant genes suggests a role for lncNAT-mRNA duplex in regulating the immune response. For example, C-C motif chemokine 19 has binding sites to mir-146d-3p, mir-146d-5p, mir-212a-5p, and mir-212b-3p. IL-6R alpha precursor has a binding site to mir-146a-5p, whereas suppressor of cytokine signaling 3 (SOCS3) has binding sites to mir-223 and mir-221. MiR-146a has an important role in controlling the proliferation of immune cells and suppressing inflammatory responses (129), whereas miR-221 negatively regulates SOCS3 (130). Further, mannan-binding lectin serine peptidase 2, which plays a crucial role in the activation of complement system, has binding sites to mir-132a, mir-132b, mir-146a-5p, mir-200b-5p, mir-212a-5p, mir-212b-3p, and mir-21a-5p.
It is worth mentioning that most of the DE lncNATs complementary to genes involved in the cellular iron/heme homeostasis and proteolysis mask miRNA binding sites in the 3’UTR of mRNA transcribed from the opposite strand. These include lncNATs complementary to hepcidin, haptoglobin, serum albumin 1, selenoprotein S, aminopeptidase N, carboxypeptidase B, dipeptidase 1, and chymotrypsin-like protease CTRL-1. In humans, the β-site APP-cleaving enzyme 1 gene (BACE1) forms an RNA-RNA duplex with the antisense transcript. The duplex area masks the binding site of miR 485 5p and augments the translation of BACE1 (29). Also, antisense transcription modulates IFN-α1 mRNA stability by masking the miR-1270 binding site (131). Taken together, this study suggests that lncNATs are involved in regulating gene expression and driving disease progression. Detailed information about all possible lncNAT-mRNA duplex and miRNA binding sites is listed in Supplementary File 3.
Conclusions
We identified thousands of antisense transcriptions from the complementary strands to protein-coding genes in the rainbow trout reference genome. We investigated the potential role of these antisense transcripts in shaping host-pathogen interactions in selectively bred, resistant-, control-, and susceptible-line rainbow trout following a challenge with Fp. The study identified DE antisense transcripts overlapping and exhibiting expression correlation with genes coding for immune-, proteolysis-, and hemolysis-related proteins. The hemolysis-related genes included Hx, Hp, hepcidin, complement factor H, and albumin. LncNATs complementary to hepcidin, a master regulator of iron homeostasis, were exceptionally upregulated in susceptible fish on day 5 post-infection. About 16% of DE lncNATs were located in 26 QTL regions previously identified in association with BCWD in rainbow trout. Many antisense transcripts showed positive expression correlation with their sense counterpart genes. A possible mechanism that may explain the synchronized expression is the ability of antisense transcripts to form RNA-RNA duplexes with their cognate protein-coding genes, increasing their stability by masking miRNA binding sites. This study improves our understanding of fish resistance to Fp infection and provides suitable targets for future functional genomics studies.
Data availability statement
The original contributions presented in the study are included in the article/Supplementary Material. Further inquiries can be directed to the corresponding author.
Ethics statement
The animal study was reviewed and approved by The NCCCWA Institutional Animal Care and Use Committee Protocols #053 and #076. Blood samples used in this study were obtained from the USDA/NCCCWA (Dr. Gregory D. Wiens).
Author contributions
MS and AA conceived and designed the study; AA and MS analyzed the data and wrote the paper. All authors contributed to the article and approved the submitted version.
Funding
This study was supported by competitive grants (Nos. 2020-67015-30770 and 2021-67015-33388) from the United States Department of Agriculture, National Institute of Food and Agriculture (MS).
Acknowledgments
The authors acknowledge Dr. Gregory D. Wiens for providing blood samples for the red blood cell count.
Conflict of interest
The authors declare that the research was conducted in the absence of any commercial or financial relationships that could be construed as a potential conflict of interest.
Publisher’s note
All claims expressed in this article are solely those of the authors and do not necessarily represent those of their affiliated organizations, or those of the publisher, the editors and the reviewers. Any product that may be evaluated in this article, or claim that may be made by its manufacturer, is not guaranteed or endorsed by the publisher.
Supplementary material
The Supplementary Material for this article can be found online at: https://www.frontiersin.org/articles/10.3389/fimmu.2022.1050722/full#supplementary-material
References
1. Ali A, Thorgaard GH, Salem M. Pacbio iso-seq improves the rainbow trout genome annotation and identifies alternative splicing associated with economically important phenotypes. Front Genet (2021) 12:683408(1194). doi: 10.3389/fgene.2021.683408
2. Salem M, Al-Tobasei R, Ali A, Kenney B. Integrated analyses of DNA methylation and gene expression of rainbow trout muscle under variable ploidy and muscle atrophy conditions. Genes (2022) 13(7):1151. doi: 10.3390/genes13071151
3. Ali A, Al-Tobasei R, Kenney B, Leeds TD, Salem M. Integrated analysis of lnc RNA and m RNA expression in rainbow trout families showing variation in muscle growth and fillet quality traits. Sci Rep (2018) 8(1):12111. doi: 10.1038/s41598-018-30655-8
4. Goyal A, Fiškin E, Gutschner T, Polycarpou-Schwarz M, Groß M, Neugebauer J, et al. A cautionary tale of sense-antisense gene pairs: Independent regulation despite inverse correlation of expression. Nucleic Acids Res (2017) 45(21):12496–508. doi: 10.1093/nar/gkx952
5. Lavorgna G, Dahary D, Lehner B, Sorek R, Sanderson CM, Casari G. In search of antisense. Trends Biochem Sci (2004) 29(2):88–94. doi: 10.1016/j.tibs.2003.12.002
6. Spiegelman WG, Reichardt LF, Yaniv M, Heinemann SF, Kaiser AD, Eisen H. Bidirectional transcription and the regulation of phage lambda repressor synthesis. Proc Natl Acad Sci U.S.A. (1972) 69(11):3156–60. doi: 10.1073/pnas.69.11.3156
7. Wek RC, Hatfield GW. Nucleotide sequence and in vivo expression of the ilvy and ilvc genes in escherichia coli K12. transcription from divergent overlapping promoters. J Biol Chem (1986) 261(5):2441–50. doi: 10.1016/S0021-9258(17)35955-0
8. Wong F, Yuh ZT, Schaefer EL, Roop BC, Ally AH. Overlapping transcription units in the transient receptor potential locus of drosophila melanogaster. Somat Cell Mol Genet (1987) 13(6):661–9. doi: 10.1007/BF01534486
9. Shah JC, Clancy MJ. Ime4, a gene that mediates mat and nutritional control of meiosis in saccharomyces cerevisiae. Mol Cell Biol (1992) 12(3):1078–86. doi: 10.1128/mcb.12.3.1078
10. Wang XJ, Gaasterland T, Chua NH. Genome-wide prediction and identification of cis-natural antisense transcripts in arabidopsis thaliana. Genome Biol (2005) 6(4):R30. doi: 10.1186/gb-2005-6-4-r30
11. Henz SR, Cumbie JS, Kasschau KD, Lohmann JU, Carrington JC, Weigel D, et al. Distinct expression patterns of natural antisense transcripts in arabidopsis. Plant Physiol (2007) 144(3):1247–55. doi: 10.1104/pp.107.100396
12. Zhang Y, Liu XS, Liu QR, Wei L. Genome-wide in silico identification and analysis of cis natural antisense transcripts (Cis-nats) in ten species. Nucleic Acids Res (2006) 34(12):3465–75. doi: 10.1093/nar/gkl473
13. Pauli A, Valen E, Lin MF, Garber M, Vastenhouw NL, Levin JZ, et al. Systematic identification of long noncoding RNAs expressed during zebrafish embryogenesis. Genome Res (2012) 22(3):577–91. doi: 10.1101/gr.133009.111
14. Katayama S, Tomaru Y, Kasukawa T, Waki K, Nakanishi M, Nakamura M, et al. Antisense transcription in the mammalian transcriptome. Science (2005) 309(5740):1564–6. doi: 10.1126/science.1112009
15. Cheng J, Kapranov P, Drenkow J, Dike S, Brubaker S, Patel S, et al. Transcriptional maps of 10 human chromosomes at 5-nucleotide resolution. Science (2005) 308(5725):1149–54. doi: 10.1126/science.1108625
16. Wight M, Werner A. The functions of natural antisense transcripts. Essays Biochem (2013) 54:91–101. doi: 10.1042/bse0540091
17. Faghihi MA, Wahlestedt C. Regulatory roles of natural antisense transcripts. Nat Rev Mol Cell Biol (2009) 10(9):637–43. doi: 10.1038/nrm2738
18. Pelechano V, Steinmetz LM. Gene regulation by antisense transcription. Nat Rev Genet (2013) 14(12):880–93. doi: 10.1038/nrg3594
19. Guttman M, Rinn JL. Modular regulatory principles of Large non-coding RNAs. Nature (2012) 482(7385):339–46. doi: 10.1038/nature10887
20. Chan J, Atianand M, Jiang Z, Carpenter S, Aiello D, Elling R, et al. Cutting edge: A natural antisense transcript, as-Il1α, controls inducible transcription of the proinflammatory cytokine il-1α. J Immunol (2015) 195(4):1359–63. doi: 10.4049/jimmunol.1500264
21. Tufarelli C, Stanley JA, Garrick D, Sharpe JA, Ayyub H, Wood WG, et al. Transcription of antisense RNA leading to gene silencing and methylation as a novel cause of human genetic disease. Nat Genet (2003) 34(2):157–65. doi: 10.1038/ng1157
22. Latos PA, Pauler FM, Koerner MV, Senergin HB, Hudson QJ, Stocsits RR, et al. Airn transcriptional overlap, but not its lnc RNA products, induces imprinted Igf2r silencing. Science (2012) 338(6113):1469–72. doi: 10.1126/science.1228110
23. Hongay CF, Grisafi PL, Galitski T, Fink GR. Antisense transcription controls cell fate in saccharomyces cerevisiae. Cell (2006) 127(4):735–45. doi: 10.1016/j.cell.2006.09.038
24. Stojic L, Niemczyk M, Orjalo A, Ito Y, Ruijter AEM, Uribe-Lewis S, et al. Transcriptional silencing of long noncoding RNA Gng12-As1 uncouples its transcriptional and product-related functions. Nat Commun (2016) 7(1):10406. doi: 10.1038/ncomms10406
25. Pandey RR, Mondal T, Mohammad F, Enroth S, Redrup L, Komorowski J, et al. Kcnq1ot1 antisense noncoding RNA mediates lineage-specific transcriptional silencing through chromatin-level regulation. Mol Cell (2008) 32(2):232–46. doi: 10.1016/j.molcel.2008.08.022
26. Yap KL, Li S, Muñoz-Cabello AM, Raguz S, Zeng L, Mujtaba S, et al. Molecular interplay of the noncoding RNA anril and methylated histone H3 lysine 27 by polycomb Cbx7 in transcriptional silencing of Ink4a. Mol Cell (2010) 38(5):662–74. doi: 10.1016/j.molcel.2010.03.021
27. Munroe SH, Lazar MA. Inhibition of c-erba m RNA splicing by a naturally occurring antisense RNA. J Biol Chem (1991) 266(33):22083–6. doi: 10.1016/S0021-9258(18)54535-X
28. Beltran M, Puig I, Peña C, García JM, Alvarez AB, Peña R, et al. A natural antisense transcript regulates Zeb2/Sip1 gene expression during Snail1-induced epithelial-mesenchymal transition. Genes Dev (2008) 22(6):756–69. doi: 10.1101/gad.455708
29. Faghihi MA, Modarresi F, Khalil AM, Wood DE, Sahagan BG, Morgan TE, et al. Expression of a noncoding RNA is elevated in alzheimer's disease and drives rapid feed-forward regulation of beta-secretase. Nat Med (2008) 14(7):723–30. doi: 10.1038/nm1784
30. Carrieri C, Cimatti L, Biagioli M, Beugnet A, Zucchelli S, Fedele S, et al. Long non-coding antisense RNA controls Uchl1 translation through an embedded Sineb2 repeat. Nature (2012) 491(7424):454–7. doi: 10.1038/nature11508
31. Piatek MJ, Henderson V, Fearn A, Chaudhry B, Werner A. Ectopically expressed Slc34a2a sense-antisense transcripts cause a cerebellar phenotype in zebrafish embryos depending on RNA complementarity and dicer. PloS One (2017) 12(5):e0178219. doi: 10.1371/journal.pone.0178219
32. Tam OH, Aravin AA, Stein P, Girard A, Murchison EP, Cheloufi S, et al. Pseudogene-derived small interfering RNAs regulate gene expression in mouse oocytes. Nature (2008) 453(7194):534–8. doi: 10.1038/nature06904
33. Zinad HS, Natasya I, Werner A. Natural antisense transcripts at the interface between host genome and mobile genetic elements. Front Microbiol (2017) 8:2292. doi: 10.3389/fmicb.2017.02292
34. Hu G, Tang Q, Sharma S, Yu F, Escobar TM, Muljo SA, et al. Expression and regulation of intergenic long noncoding RNAs during T cell development and differentiation. Nat Immunol (2013) 14(11):1190–8. doi: 10.1038/ni.2712
35. Lu J, Wu X, Hong M, Tobias P, Han J. A potential suppressive effect of natural antisense il-1β RNA on lipopolysaccharide-induced il-1β expression. J Immunol (2013) 190(12):6570–8. doi: 10.4049/jimmunol.1102487
36. Vallejo RL, Silva RMO, Evenhuis JP, Gao G, Liu S, Parsons JE, et al. Accurate genomic predictions for bcwd resistance in rainbow trout are achieved using low-density snp panels: Evidence that long-range ld is a major contributing factor. J Anim Breed Genet (2018) 135:263–74. doi: 10.1111/jbg.12335
37. Nilsen H, Olsen AB, Vaagnes Ø, Hellberg H, Bottolfsen K, Skjelstad H, et al. Systemic flavobacterium psychrophilum infection in rainbow trout, oncorhynchus mykiss (Walbaum), farmed in fresh and brackish water in Norway. J Fish Dis (2011) 34(5):403–8. doi: 10.1111/j.1365-2761.2011.01249.x
38. Barnes ME, Brown ML. A review of flavobacterium psychrophilum biology, clinical signs, and bacterial cold water disease prevention and treatment. Open Fish Sci J (2011) 4:40–8. doi: 10.2174/1874401X01104010040
39. Nematollahi A, Decostere A, Pasmans F, Haesebrouck F. Flavobacterium psychrophilum infections in salmonid fish. J Fish Dis (2003) 26(10):563–74. doi: 10.1046/j.1365-2761.2003.00488.x
40. Marancik DP, Wiens GD. A real-time polymerase chain reaction assay for identification and quantification of flavobacterium psychrophilum and application to disease resistance studies in selectively bred rainbow trout oncorhynchus mykiss. FEMS Microbiol Lett (2013) 339(2):122–9. doi: 10.1111/1574-6968.12061
41. Ali A, Al-Tobasei R, Lourenco D, Leeds T, Kenney B, Salem M. Genome-wide identification of loci associated with growth in rainbow trout. BMC Genomics (2020) 21(1):209. doi: 10.1186/s12864-020-6617-x
42. Leeds TD, Silverstein JT, Weber GM, Vallejo RL, Palti Y, Rexroad CE, et al. Response to selection for bacterial cold water disease resistance in rainbow trout. J Anim Sci (2010) 88(6):1936–46. doi: 10.2527/jas.2009-2538
43. Silverstein JT, Vallejo RL, Palti Y, Leeds TD, Rexroad CE, Welch TJ, et al. Rainbow trout resistance to bacterial cold-water disease is moderately heritable and is not adversely correlated with growth. J Anim Sci (2009) 87(3):860–7. doi: 10.2527/jas.2008-1157
44. Marancik D, Gao G, Paneru B, Ma H, Hernandez AG, Salem M, et al. Whole-body transcriptome of selectively bred, resistant-, control-, and susceptible-line rainbow trout following experimental challenge with flavobacterium psychrophilum. Front Genet (2014) 5:453. doi: 10.3389/fgene.2014.00453
45. Paneru B, Al-Tobasei R, Palti Y, Wiens GD, Salem M. Differential expression of long non-coding RNAs in three genetic lines of rainbow trout in response to infection with flavobacterium psychrophilum. Sci Rep (2016) 6:36032. doi: 10.1038/srep36032
46. Al-Tobasei R, Paneru B, Salem M. Genome-wide discovery of long non-coding RNAs in rainbow trout. PloS One (2016) 11(2):e0148940–e. doi: 10.1371/journal.pone.0148940
47. Bolger AM, Lohse M, Usadel B. Trimmomatic: A flexible trimmer for illumina sequence data. Bioinformatics (2014) 30(15):2114–20. doi: 10.1093/bioinformatics/btu170
48. Andrews S. Fastqc: A quality control tool for high throughput sequence data (2010). Available at: http://wwwbioinformaticsbabrahamacuk/projects/fastqc/.
49. Kim D, Langmead B, Salzberg SL. Hisat: A fast spliced aligner with low memory requirements. Nat Methods (2015) 12(4):357–60. doi: 10.1038/nmeth.3317
50. Pertea M, Kim D, Pertea GM, Leek JT, Salzberg SL. Transcript-level expression analysis of RNA-seq experiments with hisat, stringtie and ballgown. Nat Protoc (2016) 11(9):1650–67. doi: 10.1038/nprot.2016.095
51. Pertea M, Pertea GM, Antonescu CM, Chang T-C, Mendell JT, Salzberg SL. Stringtie enables improved reconstruction of a transcriptome from RNA-seq reads. Nat Biotechnol (2015) 33(3):290–5. doi: 10.1038/nbt.3122
52. Nelson ADL, Devisetty UK, Palos K, Haug-Baltzell AK, Lyons E, Beilstein MA. Evolinc: A tool for the identification and evolutionary comparison of long intergenic non-coding RNAs. Front Genet (2017) 8:52. doi: 10.3389/fgene.2017.00052
53. Kong L, Zhang Y, Ye ZQ, Liu XQ, Zhao SQ, Wei L, et al. Cpc: Assess the protein-coding potential of transcripts using sequence features and support vector machine. Nucleic Acids Res (2007) 35(Web Server issue):W345–9. doi: 10.1093/nar/gkm391
54. Wang L, Park HJ, Dasari S, Wang S, Kocher JP, Li W. Cpat: Coding-potential assessment tool using an alignment-free logistic regression model. Nucleic Acids Res (2013) 41(6):e74. doi: 10.1093/nar/gkt006
55. Finn RD, Coggill P, Eberhardt RY, Eddy SR, Mistry J, Mitchell AL, et al. The pfam protein families database: Towards a more sustainable future. Nucleic Acids Res (2016) 44(D1):D279–85. doi: 10.1093/nar/gkv1344
56. Boratyn GM, Camacho C, Cooper PS, Coulouris G, Fong A, Ma N, et al. Blast: A more efficient report with usability improvements. Nucleic Acids Res (2013) 41(Web Server issue):W29–33. doi: 10.1093/nar/gkt282
57. Li H. Minimap2: Pairwise alignment for nucleotide sequences. Bioinformatics (2018) 34(18):3094–100. doi: 10.1093/bioinformatics/bty191
58. Pearson WR. Finding protein and nucleotide similarities with fasta. Curr Protoc Bioinf (2016) 53:3.9.1–3.9.25. doi: 10.1002/0471250953.bi0309s53
59. QIAGEN. Qiagen Clc Genomics Workbench. (2022). Available at: https://digitalinsights.qiagen.com/products-overview/discovery-insights-portfolio/analysis-and-visualization/qiagen-clc-genomics-workbench/.
60. Love MI, Huber W, Anders S. Moderated estimation of fold change and dispersion for RNA-seq data with Deseq2. Genome Biol (2014) 15(12):550. doi: 10.1186/s13059-014-0550-8
61. McCarthy DJ, Chen Y, Smyth GK. Differential expression analysis of multifactor RNA-seq experiments with respect to biological variation. Nucleic Acids Res (2012) 40(10):4288–97. doi: 10.1093/nar/gks042
62. Lopes CT, Franz M, Kazi F, Donaldson SL, Morris Q, Bader GD. Cytoscape web: An interactive web-based network browser. Bioinformatics (2010) 26(18):2347–8. doi: 10.1093/bioinformatics/btq430
63. Huerta-Cepas J, Forslund K, Coelho LP, Szklarczyk D, Jensen LJ, von Mering C, et al. Fast genome-wide functional annotation through orthology assignment by eggnog-mapper. Mol Biol Evol (2017) 34(8):2115–22. doi: 10.1093/molbev/msx148
64. Huerta-Cepas J, Szklarczyk D, Heller D, Hernández-Plaza A, Forslund SK, Cook H, et al. Eggnog 5.0: A hierarchical, functionally and phylogenetically annotated orthology resource based on 5090 organisms and 2502 viruses. Nucleic Acids Res (2019) 47(D1):D309–d14. doi: 10.1093/nar/gky1085
65. Hu Z-L, Bao J, Reecy JM. Categorizer: A web-based program to batch analyze gene ontology classification categories. Online J Bioinf (2008) 9(2):108–12.
66. Moriya Y, Itoh M, Okuda S, Yoshizawa AC, Kanehisa M. Kaas: An automatic genome annotation and pathway reconstruction server. Nucleic Acids Res (2007) 35(Web Server issue):W182–5. doi: 10.1093/nar/gkm321
67. Ali A, Rexroad CE, Thorgaard GH, Yao J, Salem M. Characterization of the rainbow trout spleen transcriptome and identification of immune-related genes. Front Genet (2014) 5:348. doi: 10.3389/fgene.2014.00348
68. Li J, Ma W, Zeng P, Wang J, Geng B, Yang J, et al. Lnctar: A tool for predicting the RNA targets of long noncoding RNAs. Brief Bioinform (2015) 16(5):806–12. doi: 10.1093/bib/bbu048
69. Rueda A, Barturen G, Lebrón R, Gómez-Martín C, Alganza Á, Oliver JL, et al. Srnatoolbox: An integrated collection of small RNA research tools. Nucleic Acids Res (2015) 43(W1):W467–73. doi: 10.1093/nar/gkv555
70. Miranda KC, Huynh T, Tay Y, Ang YS, Tam WL, Thomson AM, et al. A pattern-based method for the identification of micro RNA binding sites and their corresponding heteroduplexes. Cell (2006) 126(6):1203–17. doi: 10.1016/j.cell.2006.07.031
71. Witeska M, Kondera E, Ługowska K, Bojarski B. Hematological methods in fish – not only for beginners. Aquaculture (2022) 547:737498. doi: 10.1016/j.aquaculture.2021.737498
72. Pearse DE, Barson NJ, Nome T, Gao G, Campbell MA, Abadia-Cardoso A, et al. Publisher correction: Sex-dependent dominance maintains migration supergene in rainbow trout. Nat Ecol Evol (2020) 4(1):170. doi: 10.1038/s41559-019-1076-y
73. Vallejo RL, Evenhuis JP, Cheng H, Fragomeni BO, Gao G, Liu S, et al. Genome-wide mapping of quantitative trait loci that can be used in marker-assisted selection for resistance to bacterial cold water disease in two commercial rainbow trout breeding populations. Aquaculture (2022) 560:738574. doi: 10.1016/j.aquaculture.2022.738574
74. Ali A, Abd El Halim HM. Re-thinking adaptive immunity in the beetles: Evolutionary and functional trajectories of lnc RNAs. Genomics (2019) 112(2):1425–36. doi: 10.1016/j.ygeno.2019.08.012
75. Gao G, Magadan S, Waldbieser GC, Youngblood RC, Wheeler PA, Scheffler BE, et al. A long reads-based de-Novo assembly of the genome of the arlee homozygous line reveals chromosomal rearrangements in rainbow trout. G3 (Bethesda) (2021) 11(4):jkab052. doi: 10.1093/g3journal/jkab052
76. Wu Y, Cheng T, Liu C, Liu D, Zhang Q, Long R, et al. Systematic identification and characterization of long non-coding RNAs in the silkworm, bombyx mori. PloS One (2016) 11(1):e0147147. doi: 10.1371/journal.pone.0147147
77. Song F, Wang L, Zhu W, Dong Z. Long noncoding RNA and m RNA expression profiles following Igf3 knockdown in common carp, cyprinus carpio. Sci Data (2019) 6:190024. doi: 10.1038/sdata.2019.24
78. Palos K, Nelson Dittrich AC, La Yu, JR B, CE R, Wu H-YL, et al. Identification and functional annotation of long intergenic non-coding RNAs in brassicaceae. Plant Cell (2022) 34(9):3233–60. doi: 10.1093/plcell/koac166
79. Tan L, Chen Z, Teng M, Chen B, Xu H. Genome-wide analysis of m RNAs, lnc RNAs, and circ RNAs during intramuscular adipogenesis in Chinese guizhou congjiang pigs. PloS One (2022) 17(1):e0261293. doi: 10.1371/journal.pone.0261293
80. Li J, Zhao X, Wang Y, Wang J. Comprehensive analysis of differentially expressed m RNAs, lnc RNAs and circ RNAs related to intramuscular fat deposition in laiwu pigs. Genes (Basel) (2022) 13(8):1349–62. doi: 10.3390/genes13081349
81. Balbin OA, Malik R, Dhanasekaran SM, Prensner JR, Cao X, Wu YM, et al. The landscape of antisense gene expression in human cancers. Genome Res (2015) 25(7):1068–79. doi: 10.1101/gr.180596.114
82. Wenric S, ElGuendi S, Caberg JH, Bezzaou W, Fasquelle C, Charloteaux B, et al. Transcriptome-wide analysis of natural antisense transcripts shows their potential role in breast cancer. Sci Rep (2017) 7(1):17452. doi: 10.1038/s41598-017-17811-2
83. Maruyama R, Shipitsin M, Choudhury S, Wu Z, Protopopov A, Yao J, et al. Altered antisense-to-Sense transcript ratios in breast cancer. Proc Natl Acad Sci U.S.A. (2012) 109(8):2820–4. doi: 10.1073/pnas.1010559107
84. Choi HM, Lee SH, Lee MS, Park D, Choi SS. Investigation of the putative role of antisense transcripts as regulators of sense transcripts by correlation analysis of sense-antisense pairs in colorectal cancers. FASEB J (2021) 35(4):e21482. doi: 10.1096/fj.202002297RRR
85. Lasa I, Toledo-Arana A, Dobin A, Villanueva M, de los Mozos IR, Vergara-Irigaray M, et al. Genome-wide antisense transcription drives m RNA processing in bacteria. Proc Natl Acad Sci U.S.A. (2011) 108(50):20172–7. doi: 10.1073/pnas.1113521108
86. Johnsson P, Lipovich L, Grandér D, Morris KV. Evolutionary conservation of long non-coding RNAs; sequence, structure, function. Biochim Biophys Acta (2014) 1840(3):1063–71. doi: 10.1016/j.bbagen.2013.10.035
87. Raghavan R, Sloan DB, Ochman H. Antisense transcription is pervasive but rarely conserved in enteric bacteria. MBio (2012) 3(4):e00156-12. doi: 10.1128/mBio.00156-12
88. Jiang M, Chen H, Liu J, Du Q, Lu S, Liu C. Genome-wide identification and functional characterization of natural antisense transcripts in salvia miltiorrhiza. Sci Rep (2021) 11(1):4769. doi: 10.1038/s41598-021-83520-6
89. Kutter C, Watt S, Stefflova K, Wilson MD, Goncalves A, Ponting CP, et al. Rapid turnover of long noncoding RNAs and the evolution of gene expression. PloS Genet (2012) 8(7):e1002841. doi: 10.1371/journal.pgen.1002841
90. Kornblihtt AR, Schor IE, Alló M, Dujardin G, Petrillo E, Muñoz MJ. Alternative splicing: A pivotal step between eukaryotic transcription and translation. Nat Rev Mol Cell Biol (2013) 14(3):153–65. doi: 10.1038/nrm3525
91. Martinez NM, Lynch KW. Control of alternative splicing in immune responses: Many regulators, many predictions, much still to learn. Immunol Rev (2013) 253(1):216–36. doi: 10.1111/imr.12047
92. Davis KM, Weiser JN. Modifications to the peptidoglycan backbone help bacteria to establish infection. Infect Immun (2011) 79(2):562–70. doi: 10.1128/IAI.00651-10
93. Townes CL, Michailidis G, Nile CJ, Hall J. Induction of cationic chicken liver-expressed antimicrobial peptide 2 in response to salmonella enterica infection. Infect Immun (2004) 72(12):6987–93. doi: 10.1128/IAI.72.12.6987-6993.2004
94. Biffl WL, Moore EE, Moore FA, Carl VS, Franciose RJ, Banerjee A. Interleukin-8 increases endothelial permeability independent of neutrophils. J Trauma Acute Care Surg (1995) 39(1):98–102. doi: 10.1097/00005373-199507000-00013
95. Giles S, Czuprynski C. Novel role for albumin in innate immunity: Serum albumin inhibits the growth of blastomyces dermatitidis yeast form in vitro. Infect Immun (2003) 71(11):6648–52. doi: 10.1128/iai.71.11.6648-6652.2003
96. Al-Modawi RN, Brinchmann JE, Karlsen TA. Multi-pathway protective effects of micro RNAs on human chondrocytes in an in vitro model of osteoarthritis. Mol Ther Nucleic Acids (2019) 17:776–90. doi: 10.1016/j.omtn.2019.07.011
97. González-Rodríguez P, Klionsky DJ, Joseph B. Autophagy regulation by RNA alternative splicing and implications in human diseases. Nat Commun (2022) 13(1):2735. doi: 10.1038/s41467-022-30433-1
98. Talbot AT, Smith TJ, Cairns MT. Characterisation of the differentially regulated trout protein 1 (Drtp1) gene in rainbow trout (Oncorhynchus mykiss). Fish Shellfish Immunol (2009) 26(4):589–98. doi: 10.1016/j.fsi.2008.09.013
99. Bond JS. Proteases: History, discovery, and roles in health and disease. J Biol Chem (2019) 294(5):1643–51. doi: 10.1074/jbc.TM118.004156
100. Koch AJ, Holaska JM. Emerin in health and disease. Semin Cell Dev Biol (2014) 29:95–106. doi: 10.1016/j.semcdb.2013.12.008
101. Dvorak HF. Reconciling vegf with vpf: The importance of increased vascular permeability for stroma formation in tumors, healing wounds, and chronic inflammation. Front Cell Dev Biol (2021) 9:660609. doi: 10.3389/fcell.2021.660609
102. Carevic M, Öz H, Fuchs K, Laval J, Schroth C, Frey N, et al. Cxcr1 regulates pulmonary anti-pseudomonas host defense. J Innate Immun (2016) 8(4):362–73. doi: 10.1159/000444125
103. Sahoo M, Ceballos-Olvera I, del Barrio L, Re F. Role of the inflammasome, il-1β, and il-18 in bacterial infections. TheScientificWorldJournal (2011) 11:2037–50. doi: 10.1100/2011/212680
104. Robledo D, Gutiérrez A, Barría A, Yáñez J, Houston R. Gene expression response to Sea lice in Atlantic salmon skin: An RNA-seq comparison between resistant and susceptible animals. bioRxiv (2017) 9:287. doi: 10.1101/225094
105. Jena KK, Kolapalli SP, Mehto S, Nath P, Das B, Sahoo PK, et al. Trim16 controls assembly and degradation of protein aggregates by modulating the P62-Nrf2 axis and autophagy. EMBO J (2018) 37(18):e98358. doi: 10.15252/embj.201798358
106. Benes P, Vetvicka V, Fusek M. Cathepsin d–many functions of one aspartic protease. Crit Rev oncol/hematol (2008) 68(1):12–28. doi: 10.1016/j.critrevonc.2008.02.008
107. Consortium TU. Uniprot: The universal protein knowledgebase in 2021. Nucleic Acids Res (2020) 49(D1):D480–D9. doi: 10.1093/nar/gkaa1100
108. Hao M, Akrami K, Wei K, De Diego C, Che N, Ku J-H, et al. Muscleblind-like 2 (Mbnl2) -deficient mice as a model for myotonic dystrophy. Dev Dynam (2008) 237(2):403–10. doi: 10.1002/dvdy.21428
109. Högfors-Rönnholm E, Wiklund T. Hemolytic activity in flavobacterium psychrophilum is a contact-dependent, two-step mechanism and differently expressed in smooth and rough phenotypes. Microb Pathog (2010) 49(6):369–75. doi: 10.1016/j.micpath.2010.08.002
110. Winardi R, Reid M, Conboy J, Mohandas N. Molecular analysis of glycophorin c deficiency in human erythrocytes. Blood (1993) 81(10):2799–803. doi: 10.1182/blood.V81.10.2799.2799
111. Rougier N, Kazatchkine MD, Rougier JP, Fremeaux-Bacchi V, Blouin J, Deschenes G, et al. Human complement factor h deficiency associated with hemolytic uremic syndrome. J Am Soc Nephrol (1998) 9(12):2318–26. doi: 10.1681/ASN.V9122318
112. Tschopp J, Amiguet P, Schäfer S. Increased hemolytic activity of the trypsin-cleaved ninth component of complement. Mol Immunol (1986) 23(1):57–62. doi: 10.1016/0161-5890(86)90171-9
113. Wagener FA, Feldman E, de Witte T, Abraham NG. Heme induces the expression of adhesion molecules icam-1, vcam-1, and e selectin in vascular endothelial cells. Proc Soc Exp Biol Med (1997) 216(3):456–63. doi: 10.3181/00379727-216-44197
114. Schaer DJ, Vinchi F, Ingoglia G, Tolosano E, Buehler PW. Haptoglobin, hemopexin, and related defense pathways-basic science, clinical perspectives, and drug development. Front Physiol (2014) 5:415. doi: 10.3389/fphys.2014.00415
115. Chapagain P, Ali A, Kidane DT, Farone M, Salem M. sRNAs enriched in outer membrane vesicles of pathogenic ≪Em<Flavobacterium Psychrophilum≪/Em< interact with immune genes of rainbow trout. bioRxiv (2021). doi: 10.1101/2021.12.22.473952
116. Michels K, Nemeth E, Ganz T, Mehrad B. Hepcidin and host defense against infectious diseases. PloS Pathog (2015) 11(8):e1004998. doi: 10.1371/journal.ppat.1004998
117. Peslova G, Petrak J, Kuzelova K, Hrdy I, Halada P, Kuchel PW, et al. Hepcidin, the hormone of iron metabolism, is bound specifically to alpha-2-Macroglobulin in blood. Blood (2009) 113(24):6225–36. doi: 10.1182/blood-2009-01-201590
118. Nicolas G, Chauvet C, Viatte L, Danan JL, Bigard X, Devaux I, et al. The gene encoding the iron regulatory peptide hepcidin is regulated by anemia, hypoxia, and inflammation. J Clin Invest (2002) 110(7):1037–44. doi: 10.1172/jci15686
119. Kautz L, Jung G, Valore EV, Rivella S, Nemeth E, Ganz T. Identification of erythroferrone as an erythroid regulator of iron metabolism. Nat Genet (2014) 46(7):678–84. doi: 10.1038/ng.2996
120. Haase VH. Regulation of erythropoiesis by hypoxia-inducible factors. Blood Rev (2013) 27(1):41–53. doi: 10.1016/j.blre.2012.12.003
121. Schaffer K, Taylor CT. The impact of hypoxia on bacterial infection. FEBS J (2015) 282(12):2260–6. doi: 10.1111/febs.13270
122. Skaar EP. The battle for iron between bacterial pathogens and their vertebrate hosts. PloS Pathog (2010) 6(8):e1000949. doi: 10.1371/journal.ppat.1000949
123. Flo TH, Smith KD, Sato S, Rodriguez DJ, Holmes MA, Strong RK, et al. Lipocalin 2 mediates an innate immune response to bacterial infection by sequestrating iron. Nature (2004) 432(7019):917–21. doi: 10.1038/nature03104
124. Liu S, Vallejo RL, Palti Y, Gao G, Marancik DP, Hernandez AG, et al. Identification of single nucleotide polymorphism markers associated with bacterial cold water disease resistance and spleen size in rainbow trout. Front Genet (2015) 6:298. doi: 10.3389/fgene.2015.00298
125. Vallejo RL, Palti Y, Liu S, Evenhuis JP, Gao G, Rexroad CE 3rd, et al. Detection of qtl in rainbow trout affecting survival when challenged with flavobacterium psychrophilum. Mar Biotechnol (NY) (2014) 16(3):349–60. doi: 10.1007/s10126-013-9553-9
126. Kutyrev I, Cleveland B, Leeds T, Wiens GD. Proinflammatory cytokine and cytokine receptor gene expression kinetics following challenge with flavobacterium psychrophilum in resistant and susceptible lines of rainbow trout (Oncorhynchus mykiss). Fish Shellfish Immunol (2016) 58:542–53. doi: 10.1016/j.fsi.2016.09.053
127. Palti Y, Vallejo RL, Gao G, Liu S, Hernandez AG, Rexroad CE 3rd, et al. Detection and validation of qtl affecting bacterial cold water disease resistance in rainbow trout using restriction-site associated DNA sequencing. PloS One (2015) 10(9):e0138435. doi: 10.1371/journal.pone.0138435
128. Staedel C, Darfeuille F. Micro RNAs and bacterial infection. Cell Microbiol (2013) 15(9):1496–507. doi: 10.1111/cmi.12159
129. Lee HM, Kim TS, Jo EK. Mir-146 and mir-125 in the regulation of innate immunity and inflammation. BMB Rep (2016) 49(6):311–8. doi: 10.5483/bmbrep.2016.49.6.056
130. Navarro A, Pairet S, Álvarez-Larrán A, Pons A, Ferrer G, Longarón R, et al. Mir-203 and mir-221 regulate Socs1 and Socs3 in essential thrombocythemia. Blood Cancer J (2016) 6(3):e406–e. doi: 10.1038/bcj.2016.10
Keywords: rainbow trout, Flavobacterium psychrophilum, bacterial cold water disease, lncRNA, antisense transcripts, immune genes, iron
Citation: Ali A and Salem M (2022) Genome-wide identification of antisense lncRNAs and their association with susceptibility to Flavobacterium psychrophilum in rainbow trout. Front. Immunol. 13:1050722. doi: 10.3389/fimmu.2022.1050722
Received: 22 September 2022; Accepted: 17 November 2022;
Published: 06 December 2022.
Edited by:
Sixin Liu, National Center for Cool and Cold Water Aquaculture (USDA/ARS), United StatesReviewed by:
Shaowu Li, Heilongjiang River Fisheries Research Institute, Chinese Academy of Fishery Sciences, ChinaTheros Ng, Western University of Health Sciences, United States
Surendra Kumar, Public Health Agency of Canada (PHAC), Canada
Copyright © 2022 Ali and Salem. This is an open-access article distributed under the terms of the Creative Commons Attribution License (CC BY). The use, distribution or reproduction in other forums is permitted, provided the original author(s) and the copyright owner(s) are credited and that the original publication in this journal is cited, in accordance with accepted academic practice. No use, distribution or reproduction is permitted which does not comply with these terms.
*Correspondence: Mohamed Salem, bW9zYWxlbUB1bWQuZWR1